Attached files
| file | filename |
|---|---|
| EX-10.45 - EXHIBIT 10.45 - Wright Medical Group N.V. | wmgi-12312017x10kxex1045.htm |
| EX-23.1 - EXHIBIT 23.1 - Wright Medical Group N.V. | wmgi-12312017x10kxex231.htm |
| EX-32.1 - EXHIBIT 32.1 - Wright Medical Group N.V. | wmgi-12312017x10kxex321.htm |
| EX-31.2 - EXHIBIT 31.2 - Wright Medical Group N.V. | wmgi-12312017x10kxex312.htm |
| EX-31.1 - EXHIBIT 31.1 - Wright Medical Group N.V. | wmgi-12312017x10kxex311.htm |
| EX-21.1 - EXHIBIT 21.1 - Wright Medical Group N.V. | wmgi-12312017x10kxex211.htm |
| EX-12.1 - EXHIBIT 12.1 - Wright Medical Group N.V. | wmgi-12312017x10kxex121.htm |
| EX-10.90 - EXHIBIT 10.90 - Wright Medical Group N.V. | wmgi-12312017x10kxex1090.htm |
| EX-10.53 - EXHIBIT 10.53 - Wright Medical Group N.V. | wmgi-12312017x10kxex1053.htm |
| EX-10.46 - EXHIBIT 10.46 - Wright Medical Group N.V. | wmgi-12312017x10kxex1046.htm |
| EX-10.44 - EXHIBIT 10.44 - Wright Medical Group N.V. | wmgi-12312017x10kxex1044.htm |
UNITED STATES
SECURITIES AND EXCHANGE COMMISSION
WASHINGTON, D.C. 20549
FORM 10-K
(Mark One)
þ | ANNUAL REPORT PURSUANT TO SECTION 13 OR 15(d) OF THE SECURITIES EXCHANGE ACT OF 1934 | |
For the fiscal year ended December 31, 2017
OR
o | TRANSITION REPORT PURSUANT TO SECTION 13 OR 15(d) OF THE SECURITIES EXCHANGE ACT OF 1934 | |
For the transition period from to
Commission file number: 001-35065
WRIGHT MEDICAL GROUP N.V.
(Exact name of registrant as specified in its charter)
The Netherlands | 98-0509600 | |
(State or other jurisdiction of incorporation or organization) | (I.R.S. Employer Identification No.) | |
Prins Bernhardplein 200 1097 JB Amsterdam, The Netherlands | None (Zip code) | |
(Address of Principal Executive Offices) | ||
Registrant’s telephone number, including area code: (+31) 20 521 4777
Securities registered pursuant to Section 12(b) of the Act:
Title of each class | Name of each exchange on which registered | |
Ordinary shares, par value €0.03 per share | Nasdaq Global Select Market | |
Contingent Value Rights | Nasdaq Stock Market LLC | |
Securities registered pursuant to Section 12(g) of the Act: None
Indicate by check mark if the registrant is a well-known seasoned issuer, as defined in Rule 405 of the Securities Act. þ Yes o No
Indicate by check mark if the registrant is not required to file reports pursuant to Section 13 or Section 15(d) of the Act. o Yes þ No
Indicate by check mark whether the registrant (1) has filed all reports required to be filed by Section 13 or 15(d) of the Securities Exchange Act of 1934 during the preceding 12 months (or for such shorter period that the registrant was required to file such reports), and (2) has been subject to such filing requirements for the past 90 days. þ Yes o No
Indicate by check mark whether the registrant has submitted electronically and posted on its corporate Website, if any, every Interactive Data File required to be submitted and posted pursuant to Rule 405 of Regulation S-T (§232.405 of this chapter) during the preceding 12 months (or for such shorter period that the registrant was required to submit and post such files). þ Yes o No
Indicate by check mark if disclosure of delinquent filers pursuant to Item 405 of Regulation S-K (§229.405 of this chapter) is not contained herein, and will not be contained, to the best of registrant’s knowledge, in definitive proxy or information statements incorporated by reference in Part III of this Form 10-K or any amendment to this Form 10-K. þ
Indicate by check mark whether the registrant is a large accelerated filer, an accelerated filer, a non-accelerated filer, a smaller reporting company or an emerging growth company. See definitions of “large accelerated filer,” “accelerated filer,” “smaller reporting company” and “emerging growth company” in Rule 12b-2 of the Exchange Act. (Check one):
Large accelerated filer þ | Accelerated filer o | |
Non-accelerated filer o (Do not check if a smaller reporting company) | Smaller reporting company o Emerging growth company o | |
Indicate by check mark whether the registrant is a shell company (as defined in Rule 12b-2 of the Exchange Act). o Yes þ No
The aggregate market value of the ordinary shares held by non-affiliates of the registrant on June 25, 2017 was $2.8 billion based on the closing sale price of the ordinary shares on that date, as reported by the Nasdaq Global Select Market. For purposes of the foregoing calculation only, the registrant has assumed that all executive officers and directors of the registrant, and their affiliated entities, are affiliates.
As of February 23, 2018, there were 105,906,409 ordinary shares outstanding.
DOCUMENTS INCORPORATED BY REFERENCE
None.
WRIGHT MEDICAL GROUP N.V.
ANNUAL REPORT ON FORM 10-K
Table of Contents
Page | |
EX-10.44 | |
EX-10.45 | |
EX-10.46 | |
EX-10.53 | |
EX-10.90 | |
EX-12.1 | |
EX-21.1 | |
EX-23.1 | |
EX-31.1 | |
EX-31.2 | |
EX-32.1 | |
EX-101 INSTANCE DOCUMENT | |
EX-101 SCHEMA DOCUMENT | |
EX-101 CALCULATION LINKBASE DOCUMENT | |
EX-101 LABELS LINKBASE DOCUMENT | |
EX-101 PRESENTATION LINKBASE DOCUMENT | |
EX-101 DEFINITION LINKBASE DOCUMENT | |
SPECIAL NOTE REGARDING FORWARD-LOOKING STATEMENTS
This Annual Report on Form 10-K contains “forward-looking statements” within the meaning of Section 27A of the Securities Act of 1933, as amended (Securities Act), and Section 21E of the Securities Exchange Act of 1934, as amended (Exchange Act), and that are subject to the safe harbor created by those sections. These statements reflect management's current knowledge, assumptions, beliefs, estimates, and expectations and express management's current view of future performance, results, and trends. Forward looking statements may be identified by their use of terms such as anticipate, believe, could, estimate, expect, intend, may, plan, predict, project, will, and other similar terms. Forward-looking statements are subject to a number of risks and uncertainties that could cause actual results to materially differ from those described in the forward-looking statements. The reader should not place undue reliance on forward-looking statements. Such statements are made as of the date of this report, and we undertake no obligation to update such statements after this date. Risks and uncertainties that could cause our actual results to materially differ from those described in forward-looking statements are discussed in our filings with the U.S. Securities and Exchange Commission (SEC) (including those described in “Part I. Item 1A. Risk Factors” of this report). By way of example and without implied limitation, such risks and uncertainties include:
• | inability to achieve or sustain profitability; |
• | failure to realize the anticipated benefits from previous acquisitions and dispositions; |
• | failure to obtain anticipated commercial sales of our AUGMENT® Bone Graft products in the United States; |
• | failure to realize the anticipated benefits of the 2017 additions to our direct U.S. lower extremities and biologics sales force; |
• | liability for product liability claims on hip/knee (OrthoRecon) products sold by Wright Medical Technology, Inc. (WMT) prior to the divestiture of the OrthoRecon business; |
• | risks and uncertainties associated with the recent metal-on-metal master settlement agreement and the settlement agreement with the three insurance companies, including without limitation, the final settlement amount and the final number of claims settled under the master settlement agreement, the resolution of the remaining unresolved claims, the effect of the broad release of certain insurance coverage for present and future claims, and the resolution of WMT’s dispute with the remaining carriers; |
• | adverse outcomes in existing product liability litigation; |
• | copycat claims against our modular hip systems resulting from a competitor’s recall of its modular hip product; |
• | the ability of a creditor of any one particular entity within our corporate structure to reach the assets of the other entities within our corporate structure not liable for the underlying claims of the one particular entity, despite our corporate structure which is intended to ring-fence liabilities; |
• | new product liability claims; |
• | pending and future other litigation, which could have an adverse effect on our business, financial condition, or operating results; |
• | challenges to our intellectual property rights or inability to defend our products against the intellectual property rights of others; |
• | the possibility of private securities litigation or shareholder derivative suits; |
• | inadequate insurance coverage; |
• | inability to generate sufficient cash flow to satisfy our capital requirements, including future milestone payments, and existing debt, including the conversion features of our convertible senior notes, or refinance our existing debt as it matures; |
• | risks associated with our credit, security and guaranty agreement for our senior secured asset based line of credit; |
• | inability to raise additional financing when needed and on favorable terms; |
• | the loss of key suppliers, which may result in our inability to meet customer orders for our products in a timely manner or within our budget; |
• | the incurrence of significant expenditures of resources to maintain relatively high levels of inventory, which could reduce our cash flows and increase the risk of inventory obsolescence, which could harm our operating results; |
• | our inability to timely manufacture products or instrument sets to meet demand; |
• | our private label manufacturers failing to provide us with sufficient supply of their products, or failing to meet appropriate quality requirements; |
• | our plans to bring the manufacturing of certain of our products in-house and possible disruptions we may experience in connection with such transition; |
• | our plans to increase our gross margins by taking certain actions designed to do so; |
• | inventory reductions or fluctuations in buying patterns by wholesalers or distributors; |
• | not successfully competing against our existing or potential competitors and the effect of significant recent consolidations amongst our competitors; |
• | not successfully developing and marketing new products and technologies and implementing our business strategy; |
• | insufficient demand for and market acceptance of our new and existing products; |
• | the reliance of our business plan on certain market assumptions; |
• | lack of suitable business development opportunities; |
1
• | inability to capitalize on business development opportunities; |
• | future actions of the SEC, the United States Attorney’s office, the U.S. Food and Drug Administration (FDA), the Department of Health and Human Services, or other U.S. or foreign government authorities, including those resulting from increased scrutiny under the U.S. Foreign Corrupt Practices Act and similar laws, that could delay, limit, or suspend our development, manufacturing, commercialization, and sale of products, or result in seizures, injunctions, monetary sanctions, or criminal or civil liabilities; |
• | failure or delay in obtaining FDA or other regulatory approvals for our products; |
• | the compliance of our products and activities with the laws and regulations of the countries in which they are marketed, which compliance may be costly and time-consuming; |
• | the use, misuse or off-label use of our products that may harm our image in the marketplace or result in injuries that may lead to product liability suits, which could be costly to our business or result in governmental sanctions; |
• | recently enacted healthcare laws and changes in product reimbursements, which could generate downward pressure on our product pricing; |
• | the potentially negative effect of our ongoing compliance efforts on our relationships with customers and on our ability to deliver timely and effective medical education, clinical studies, and new products; |
• | failures of, interruptions to, or unauthorized tampering with, our information technology systems; |
• | our inability to maintain effective internal controls; |
• | product quality or patient safety issues; |
• | geographic and product mix impact on our sales; |
• | deriving a significant portion of our revenues from operations in certain geographic markets that are subject to political, economic, and social instability, including in particular France, and risks and uncertainties involved in launching our products in certain new geographic markets; |
• | the negative impact of the commercial and credit environment on us, our customers, and our suppliers; |
• | inability to retain key sales representatives, independent distributors, and other personnel or to attract new talent; |
• | consolidation in the healthcare industry that could lead to demands for price concessions or the exclusion of some suppliers from certain of our markets, which could have an adverse effect on our business, financial condition, or operating results; |
• | our clinical trials and their results and our reliance on third parties to conduct them; |
• | risks associated with the merger between Tornier N.V. (Tornier or legacy Tornier) and Wright Medical Group, Inc. (WMG or legacy Wright), including the failure to realize intended benefits and anticipated synergies and cost-savings from the transaction or delay in realization thereof; our businesses may not be combined successfully, or such combination may take longer, be more difficult, time-consuming or costly to accomplish than expected; and business disruption after the transaction, including adverse effects on employee retention, our sales and distribution channel, especially in light of territory transitions, and business relationships with third parties; |
• | risks associated with the divestiture of the U.S. rights to certain of legacy Tornier's ankle and silastic toe replacement products; |
• | adverse effects of diverting resources and attention to transition services provided to the purchaser of our Large Joints business; |
• | potentially burdensome tax measures; and |
• | fluctuations in foreign currency exchange rates. |
For more information regarding these and other uncertainties and factors that could cause our actual results to differ materially from what we have anticipated in our forward-looking statements or otherwise could materially adversely affect our business, financial condition, or operating results, see “Part I. Item 1A. Risk Factors” of this report. The risks and uncertainties described above and in “Part I. Item 1A. Risk Factors” of this report are not exclusive and further information concerning us and our business, including factors that potentially could materially affect our financial results or condition, may emerge from time to time. We assume no obligation to update, amend, or clarify forward-looking statements to reflect actual results or changes in factors or assumptions affecting such forward-looking statements. We advise you, however, to consult any further disclosures we make on related subjects in our future Annual Reports on Form 10-K, Quarterly Reports on Form 10-Q and Current Reports on Form 8-K we file with or furnish to the SEC.
2
PART I
Item 1. Business.
Overview
Wright Medical Group N.V. (Wright or we) is a global medical device company focused on extremities and biologics products. We are committed to delivering innovative, value-added solutions improving quality of life for patients worldwide and are a recognized leader of surgical solutions for the upper extremities (shoulder, elbow, wrist and hand), lower extremities (foot and ankle) and biologics markets, three of the fastest growing segments in orthopaedics. We market our products in approximately 50 countries worldwide. We believe we are differentiated in the marketplace by our strategic focus on extremities and biologics, our full portfolio of upper and lower extremities and biologics products, and our specialized and focused sales organization.
Our product portfolio consists of the following product categories:
• | Upper extremities, which include joint implants and bone fixation devices for the shoulder, elbow, wrist, and hand; |
• | Lower extremities, which include joint implants and bone fixation devices for the foot and ankle; |
• | Biologics, which include products used to support treatment of damaged or diseased bone, tendons, and soft tissues or to stimulate bone growth; and |
• | Sports medicine and other, which include products used across several anatomic sites to mechanically repair tissue-to-tissue or tissue-to-bone injuries and other ancillary products. |
Our global corporate headquarters are located in Amsterdam, the Netherlands. We also have significant operations located in Memphis, Tennessee (U.S. headquarters, research and development, sales and marketing administration, and administrative activities); Bloomington, Minnesota (upper extremities sales and marketing and warehousing operations); Arlington, Tennessee (manufacturing and warehousing operations); Franklin, Tennessee (manufacturing and warehousing operations); Montbonnot, France (manufacturing and warehousing operations); Plouzané, France (research and development); and Macroom, Ireland (manufacturing). In addition, we have local sales and distribution offices in Canada, Australia, Asia, Latin America, and throughout Europe. For purposes of this report, references to “international” or “foreign” relate to non-U.S. matters while references to “domestic” relate to U.S. matters.
On October 1, 2015, we became Wright Medical Group N.V. following the merger (the Wright/Tornier merger or the merger) of legacy Wright with legacy Tornier. Because of the structure of the merger and the governance of the combined company immediately post-merger, the merger was accounted for as a “reverse acquisition” under U.S. generally accepted accounting principles (US GAAP), and as such, legacy Wright was considered the acquiring entity for accounting purposes. Therefore, legacy Wright’s historical results of operations replaced legacy Tornier’s historical results of operations for all periods prior to the merger. References in this section and certain other sections of Part I of this report to “we,” “our” and “us” refer to Wright Medical Group N.V. and its subsidiaries after the Wright/Tornier merger and Wright Medical Group, Inc. and its subsidiaries before the merger.
On October 21, 2016, we sold legacy Tornier’s Large Joints business to Corin Orthopaedics Holdings Limited (Corin) allowing us to devote our full resources and attention on accelerating growth opportunities in the high-growth extremities and biologics markets. Legacy Wright sold its OrthoRecon business to MicroPort Scientific Corporation (MicroPort) on January 9, 2014. The financial results of legacy Tornier’s Large Joints business and the OrthoRecon business are reflected within discontinued operations for all periods presented.
On December 14, 2017, we completed the acquisition of IMASCAP SAS (IMASCAP), a leader in the development of software-based solutions for preoperative planning of shoulder replacement surgery. The intent of this transaction is to ensure exclusive access to breakthrough software enabling technology and patents to further differentiate our product portfolio and to further accelerate growth opportunities in our global extremities business. Under the terms of the agreement with IMASCAP, we acquired 100% of IMASCAP’s outstanding equity on a fully diluted basis for an initial payment of €52.9 million, or approximately $62.3 million, consisting of approximately €39.7 million, or approximately $46.7 million, in cash and approximately €13.2 million, or approximately $15.6 million, representing 661,753 Wright ordinary shares, payable at closing. Additionally the purchase price includes an estimated €15.1 million, or approximately $17.8 million, of contingent consideration related to the achievement of certain technical milestones and sales earnouts. The technical milestones involve the development and approval of a patient specific implant system and new software modules. The sales earnouts relate to patient specific guides and the future patient specific implant system.
For the fiscal year ended December 31, 2017, we had net sales of $745.0 million and a net loss from continuing operations of $64.9 million. As of December 31, 2017, we had total assets of $2.1 billion. Detailed information on our net sales by product category and operating business segment and our net sales and long-lived assets by segment and geographic region can be found in Note 20 to our consolidated financial statements contained in “Item 8. Financial Statements and Supplementary Data.”
3
Orthopaedic Industry
The total worldwide orthopaedic industry is estimated at approximately $48.1 billion in 2017. Five multinational companies currently dominate the orthopaedic industry, each with approximately $2 billion or more in annual sales. The size of these companies often allows them to concentrate their marketing and research and development efforts on products they believe will have a relatively high minimum threshold level of sales. As a result, there is an opportunity for a mid-sized orthopaedic company, such as us, to focus on less contested, higher-growth sectors of the orthopaedic market.
We have focused our efforts into growing our position in the high-growth extremities and biologics markets. We believe a more active and aging patient population with higher expectations regarding “quality of life,” an increasing global awareness of extremities and biologics solutions, improved clinical outcomes as a result of the use of such products, and technological advances resulting in specific designs for such products that simplify procedures and address unmet needs for early interventions, and the growing need for revisions and revision-related solutions will drive the market for extremities and biologics products.
The extremities market is one of the fastest growing market segments within orthopaedics, with annual growth rates of 7-10%. We believe the extremities market will continue to grow by approximately 7-10% annually. We currently estimate the market for all surgical products used by extremities-focused surgeons to be approximately $3 billion in the United States. We believe major trends in the extremities market include procedure-specific and anatomy-specific devices, locking plates, and an increase in total ankle replacement or arthroplasty procedures.
Upper extremities reconstruction involves implanting devices to replace, reconstruct, or fixate injured or diseased joints and bones in the shoulder, elbow, wrist, and hand. It is estimated that approximately 60% of the upper extremities market is in total shoulder replacement or arthroplasty implants. We believe major trends in the upper extremities market include next-generation joint arthroplasty systems, bone preserving solutions, virtual planning systems, and revision of failed previous shoulder replacements in older patients.
Lower extremities reconstruction involves implanting devices to replace, reconstruct, or fixate injured or diseased joints and bones in the foot and ankle. A large segment of the lower extremities market is comprised of plating and screw systems for reconstructing and fusing joints or repairing bones after traumatic injury. We believe major trends in the lower extremities market include the use of external fixation devices in diabetic patients, total ankle arthroplasty, advanced tissue fixation devices, virtual planning systems, and biologics. According to various customer and market surveys, we are a market leader in foot and ankle surgical products. New technologies have been introduced into the lower extremities market in recent years, including next-generation total ankle replacement systems. Many of these technologies currently have low levels of market penetration. We believe that market adoption of total ankle replacement, which currently represents approximately 8% of the U.S. foot and ankle device market, will result in significant future growth in the lower extremities market.
The field of biologics employs tissue engineering and regenerative medicine technologies focused on remodeling and regeneration of tendons, ligaments, bone, and cartilage. Biologic products use both biological tissue-based and synthetic materials to allow the body to regenerate damaged or diseased bone and to repair damaged or diseased soft tissue. These products aid the body’s natural regenerative capabilities to heal itself. Biologic products provide a lower morbidity solution to “autografting,” a procedure that involves harvesting a patient’s own bone or soft tissue and transplanting it to a different site. Following an autografting procedure, the patient typically has pain, and at times, complications result at the harvest site after surgery. Biologically or synthetically derived soft tissue grafts and scaffolds are used to treat soft tissue injuries and are complementary to many sports medicine applications, including rotator cuff tendon repair and Achilles tendon repair. Hard tissue biologics products are used in many bone fusion or trauma cases where healing potential may be compromised and additional biologic factors are desired to enhance healing, where the surgeon needs additional bone, or in cases where the surgeon wishes to use materials that are naturally incorporated by the body over time. We estimate that the worldwide orthobiologics market to be over $3.5 billion, and with annual growth rates of 3-5%. Three multinational companies currently dominate the orthobiologics industry.
The newest addition to our biologics product portfolio is AUGMENT® Bone Graft, which is based on recombinant human platelet-derived growth factor (rhPDGF-BB), a synthetic copy of one of the body’s principal healing agents. We obtained FDA approval of AUGMENT® Bone Graft in the United States for ankle and/or hindfoot fusion indications during the third quarter of 2015. We estimate the U.S. market opportunity for AUGMENT® Bone Graft for ankle and/or hindfoot fusion indications to be approximately $300 million. The main competitors for AUGMENT® Bone Graft are autologous bone grafts, allograft, and synthetic bone growth substitutes. Autologous bone grafts, which account for a significant portion of total graft volume, are taken directly from the patient. This generally necessitates an additional procedure to obtain the graft, which in turn creates added expense, and increased pain and recovery time. Allografts, which are currently the second most commonly used bone grafts, are taken from human cadavers and processed by either bone banks or commercial firms. Although an obvious advantage to allografts is the fact that a second-site harvesting operation is not required, they carry a slight risk of transmitting pathogens and can also cause immune system reactions. Synthetic grafts are derived from numerous materials, including polymers, calcium sulfate, calcium phosphate, bovine collagen, and coral. We are currently pursuing FDA approval of AUGMENT® Injectable Bone Graft with a Pre-Market Application (PMA) Panel Track Supplement.
4
Product Portfolio
We offer a broad product portfolio of approximately 150 extremities products and over 20 biologics products that are designed to provide solutions to our surgeon customers, with the goal of improving clinical outcomes and the “quality of life” for their patients. Our product portfolio consists of the following product categories:
• | Upper extremities, which include joint implants and bone fixation devices for the shoulder, elbow, wrist, and hand; |
• | Lower extremities, which include joint implants and bone fixation devices for the foot and ankle; |
• | Biologics, which include products used to support treatment of damaged or diseased bone, tendons, and soft tissues or to stimulate bone growth; and |
• | Sports medicine and other, which include products used across several anatomic sites to mechanically repair tissue-to-tissue or tissue-to-bone injuries and other ancillary products. |
Upper Extremities
The upper extremities product category includes joint implants and bone fixation devices for the shoulder, elbow, wrist, and hand. Our global net sales from this product category was $334.7 million, or 44.9% of total net sales, for the fiscal year ended December 31, 2017, as compared to $288.1 million, or 41.7% of total net sales, for the fiscal year ended December 25, 2016.
Our shoulder products are used to treat painful shoulder conditions due to arthritis, irreparable rotator cuff tendon tears, bone disease, fractured humeral heads, or failed previous shoulder replacement surgery. Our shoulder products include the following:
• | Total Shoulder Joint Replacement. Our total shoulder joint replacement products have two components-a humeral implant consisting of a metal stem or base attached to a metal head, and a plastic implant for the glenoid (shoulder socket). Together, these two components mimic the function of a natural shoulder joint. Our total shoulder joint replacement products include the AEQUALIS ASCEND®, AEQUALIS® PRIMARY™, AEQUALIS® PERFORM™ and SIMPLICITI® shoulder systems. Our BLUEPRINT™ 3D Planning Software can be used with our AEQUALIS® PERFORM™ Glenoid System to assist surgeons in accurately positioning the glenoid implant and replicating the pre-operative surgical plan. In addition, we received FDA 510(k) clearance in June 2016 of our AEQUALIS® PERFORM™+ Glenoid System, the first anatomic augmented glenoid. This system was designed to specifically address posterior glenoid deficiencies and deliver bone preservation. SIMPLICITI® is the first minimally invasive, ultra-short stem total shoulder available in the Unites States. |
• | Hemi Shoulder Joint Replacement. Our hemi shoulder joint replacement products replace only the humeral head and allow it to articulate against the native glenoid. These products include our PYC HUMERAL HEAD™ and INSPYRE™. PYC stands for pyrocarbon, which is a biocompatible material that has low joint surface friction and a high resistance to wear. The PYC HUMERAL HEAD™ is currently available in certain international markets. The product received FDA approval in 2015 for its investigational device exemption to conduct a clinical trial in the United States. We anticipate that this single arm study will enroll and implant 157 patients from up to 20 centers across the United States and will evaluate the safety and effectiveness of the device in patients with a primary diagnosis of partial shoulder replacement or hemi-arthroplasty. The study design uses a primary endpoint that is measured at two years. |
• | Reversed Shoulder Joint Replacement. Our reversed shoulder joint replacement products are used in arthritic patients lacking rotator cuff function. The components are different from a traditional “total” shoulder in that the humeral implant has the plastic socket and the glenoid has the metal head. This design has the biomechanical impact of shifting the pivot point of the joint away from the body centerline and recruiting the deltoid muscles to enable the patient to elevate the arm. Our reversed joint replacement products include the AEQUALIS® REVERSED II™ shoulder. We received FDA 510(k) clearance in December 2016 of our AEQUALIS® PERFORM™ REVERSED Glenoid System, our first reverse augmented glenoid, and we commercially launched it during first quarter of 2017. This system was designed to specifically address posterior glenoid deficiencies and deliver bone preservation. We continue to release new options for our BLUEPRINT™ 3D Planning Software, which can be used with our AEQUALIS® PERFORM™ REVERSED Glenoid System to assist surgeons in accurately positioning the glenoid implant and replicating the pre-operative surgical plan. |
• | Convertible Shoulder Joint Replacement. Our convertible shoulder joint replacement products are modular implants that can be converted from a total or hemi shoulder implant to a reversed implant at a later date if the patient requires it. Our convertible joint replacement products include the AEQUALIS ASCEND® FLEX™ convertible shoulder system, which provides anatomic and reversed options within a single system and is designed to offer precise intra-operative implant-to-patient fit and easy conversion to reversed if necessary. |
5
• | Shoulder Resurfacing Implants. An option for some patients is shoulder resurfacing where the damaged humeral head is sculpted to receive a metal “cap” that fits onto the bone, functioning as a new, smooth humeral head. This procedure can be less invasive than a total shoulder replacement. Our shoulder resurfacing implants are designed to preserve bone, which may benefit more active or younger patients with shoulder arthritis. Our resurfacing implants include the AEQUALIS® RESURFACING HEAD™. |
• | Shoulder Trauma Devices. Our shoulder trauma devices, such as plates, pins, screws, and nails, are non-articulating implants used to help stabilize fractures of the humerus. Our shoulder trauma products include the AEQUALIS® IM NAIL™, AEQUALIS® PROXMILA HUMERAL PLATE™, AEQUALIS® FRACTURE™ shoulder and AEQUALIS® REVERSED FRACTURE™ shoulder. |
In addition to our shoulder products, our upper extremities product portfolio consist of implants, plates, pins, screws, and nails that are used to treat the elbow, wrist, and hand, and include the following:
• | Total Elbow and Radial Head Replacement. Our total elbow and radial head replacement products address the need for modularity in the anatomically highly-variable joint of the elbow and give surgeons the ability to reproduce the natural flexion/extension axis and restore natural kinematics of the elbow. Our total elbow replacement products include our LATITUDE® EV™ total elbow prosthesis. Our radial head replacement products include our EVOLVE® modular radial head device, which is a market leading radial head prosthesis that provides different combinations of heads and stems allowing the surgeon to choose implant heads and stems to accommodate the unpredictable anatomy of each patient. |
• | Elbow Fracture Repair. We have several plating and screw products designed to repair a fractured elbow. Our radial head plating systems and screws are for surgeons who wish to repair rather than replace a damaged radial head and include our EVOLVE® TRIAD™ fixation system. Our EVOLVE® Elbow Plating System addresses fractures of the distal humerus and proximal ulna. Composed of polished stainless steel, this system was designed to accurately match the patient anatomy to reduce the need for intra-operative bending while providing a low profile design to minimize post-operative irritation. Both of these products and several of our other products incorporate our ORTHOLOC® 3Di Polyaxial Locking Technology to enable optimal screw placement and stability. |
• | Wrist Fracture Repair. We have several plating and screw products designed to repair a fractured wrist. Our MICRONAIL® II Intramedullary Distal Radius System is a next-generation minimally invasive treatment for distal radius fractures that is designed to provide immediate fracture stabilization with minimal soft tissue disruption. Also, as the nail is implanted within the bone, it has no external profile on top of the bone, thereby reducing the potential for tendon irritation or rupture, which is an appreciable problem with conventional plates designed to lie on top of the bone. In addition, our RAYHACK® system is comprised of a series of precision cutting guides and procedure-specific plates for ulnar and radial shortening procedures and the surgical treatment of radial malunions and Keinbock’s Disease. |
• | Hand Fixation. Our hand fixation products include our FUSEFORCE® Hand Fixation System, which is a shape-memory compression-ready fixation system that can be used in fixation for fractures, fusions, or osteotomies of the bones in the hand. |
• | Thumb and Finger Joint Replacement. Our Swanson finger joints are used in finger joint replacement for patients suffering from rheumatoid arthritis of the hand. With nearly 45 years of clinical success, Swanson digit implants are a foundation in our upper extremities business and are used by a loyal base of hand surgeons worldwide. Our ORTHOSPHERE® implants are used in thumb joint replacement procedures. |
Lower Extremities
The lower extremities product category includes joint implants and bone fusion and fixation devices, including plates, pins, screws, and nails, for the foot and ankle. Our global net sales from this product category for the fiscal year ended December 31, 2017 was $286.5 million, or 38.5% of total net sales, as compared to $285.6 million, or 41.4% of total net sales, for the fiscal year ended December 25, 2016.
We are a recognized leader in the United States for foot and ankle surgical products. Our lower extremities product portfolio includes:
• | Total Ankle Joint Replacement. Total ankle joint replacement, also known as total ankle arthroplasty, is a surgical procedure that orthopaedic surgeons use to treat ankle arthritis. Our total ankle joint replacement products include implants for the ankle that involve replacing the joint with an articulating multi-component implant. These joint implants may be mobile bearing, in which the plastic component is free to slide relative to the metal bearing surfaces, or fixed bearing, in which this component is constrained. Our INBONE® Total Ankle Systems, including our third-generation INBONE® II Total Ankle System, are modular prostheses that are designed to allow the surgeon to tailor |
6
the fixation stems for the tibial and talar components in order to maximize stability of the implant. The INBONE® II Total Ankle System is the only ankle replacement that offers surgeons multiple implant options with different articular geometry. Our INFINITY® Total Ankle System features a distinctive talar resurfacing option for preservation of talar bone. The combination and interchangeability of both the INBONE® and INFINITY® systems provide the surgeon with an implant continuum of care concept, allowing the surgeon to address a more bone conserving implant option with INFINITY® all the way to addressing a more complex ankle deformity with INBONE®. Our INBONE® and INFINITY® Total Ankle Systems can be used with our PROPHECY® Preoperative Navigation Guides, which combine computer imaging with a patient’s CT scan, and are designed to provide alignment accuracy while reducing surgical steps. The most recent addition to our Total Ankle System, INVISIONTM Total Ankle Revision System is the first and only system developed specifically for total ankle revision arthroplasty. The INVISION Total Ankle Revision System provides a unique solution for even the most difficult revision procedures. Whether leveraged as a standalone construct or in conjunction with INFINITY® and INBONE® components, the INVISIONTM Total Ankle Revision System is an important addition to the continuum of care from total ankle replacement through any necessary revisions. The INVISIONTM Total Ankle Revision System is designed to help surgeons re-build bone lost through previous surgeries and provide modularity to help restore natural joint height.
• | Ankle Fusion. We have several products used in ankle fusion procedures, which fuse together the tibia, fibula, and talus bones into one bone, and are intended to treat painful, end-stage arthritis in the ankle joint. These products include our ORTHOLOC® 3Di Ankle Fusion System, VALOR® TTC fusion nail, and the legacy Tornier Maxlock ExtremeTM Plate and Screws System. |
• | Ankle Fixation and Fracture Repair. We sell a broad range of anatomically designed plates, screws, and nails used to stabilize and heal fractured ankle bones, including our ORTHOLOCTM 3Di Ankle Fracture Low Profile System features a complete range of ankle fracture plates designed specifically for the foot and ankle surgeon. The system features low-profile, anatomic plate designs and ORTHOLOC 3Di polyaxial locking screw technology, providing an innovative fracture solution that is intended to address a primary need for one of the foot and ankle’s largest market segments. |
• | Foot Fusion. We have several products used in foot fusion procedures, which fuse together three bones in the back of the foot into one bone and are used to treat a wide range of conditions, including arthritis, flat feet, rheumatoid arthritis, and previous injuries, such as fractures caused by wear and tear to bones and cartilage. Our foot fusion products include our ORTHOLOC® 3Di Midfoot Plating System, VALOR® TTC fusion nail and the legacy Tornier Maxlock ExtremeTM Plate and Screws System. |
• | Foot Fixation and Fracture Repair. Our foot fixation and fracture repair products include plates, screws, and nails used to stabilize and heal foot deformities and fractures. Our CHARLOTTE® CLAW® Compression Plate is the first ever locking compression plate designed for corrective foot surgeries. Our next-generation CLAW® II Compression Plating System expands our plate and screw offering by introducing anatomic plates specifically designed for fusions of the midfoot, and the CLAW® II Polyaxial Compression Plating System incorporates variable-angle locking screw technology and our ORTHOLOC® 3Di Reconstruction Plating System utilizes our 3Di polyaxial locking technology. In April 2016, we further expanded the ORTHOLOC® 3Di portfolio with the launch of the ORTHOLOC® 3Di CROSSCHECK® Plating System. This modular addition is comprised of five uniquely designed plates which offer an inter-fragmentary solution. Our SALVATION™ limb salvage portfolio, which is designed to address the unique demands of advanced midfoot reconstruction, was commercially launched in the first half of 2016 and in the third quarter of 2017, we launched line extensions to the system. We will roll out additional sets throughout the first half of 2018. Other foot products include the MAXLOCK®, MINIMAX LOCK™ and MINIMAX LOCK EXTREME™ plate and screw systems, BIOFOAM® Wedge System, BIOARCH® Subtalar Arthroereisis Implant, MDI Metatarsal Resurfacing Implant, and TENFUSE® Nail Allograft. |
• | Hammertoe Correction. Hammertoe is a contracture (bending) of one or both joints of the second, third, fourth, or fifth (little) toes. Our hammertoe correction products include the PRO-TOE® VO Hammertoe Fixation System, PRO-TOE® C2 Hammertoe Implant, PHALINX® Hammertoe Fixation System, Cannulink Intraosseous Fixation System (IFS), and TENFUSE® PIP Hammertoe Allograft. |
• | Toe Joint Replacement. We also sell our Swanson line of toe joint replacement products. |
• | Minimally-Invasive Foot and Ankle Surgery. The MICA™ Minimally-Invasive Foot and Ankle system was launched to limited users in the third quarter of 2017. It is designed on the premise that all “current” procedures can be performed through a smaller, minimally invasive, incision, with a focus on preserving the soft tissues. We have MICA™ Screws, MICA™ Machine and MICA™ instruments to perform minimal invasive procedures such as MICA™ Chevron, Akin, Calcaneal Osteotomies, Hammer toe/Claw toe, Cheilectomy, Bunionectomy, Bunionette & DMMO. Full commercial launch of MICA™ is planned for the second half of 2018. |
7
Biologics
The biologics product category includes a broad line of biologic products that are used to support treatment of damaged or diseased bone, tendons, and soft tissues and other biological solutions for surgeons and their patients or to stimulate bone growth. These products focus on supporting biological musculoskeletal repair by utilizing synthetic and human tissue-based materials. Our biologic products are primarily used in extremities-related procedures as well as in trauma-induced voids of the long bones and some spine procedures. Internationally, we offer a bone graft product incorporating antibiotic delivery. Our global net sales from this product category for the fiscal year ended December 31, 2017 was $100.6 million, or 13.5% of total net sales, compared to $93.5 million, or 13.5% of total net sales, for the fiscal year ended December 25, 2016.
Our biologics products include the following:
• | AUGMENT® Bone Graft. The newest addition to our biologics product portfolio is AUGMENT® Bone Graft. Our AUGMENT® Bone Graft product line is based on recombinant human platelet-derived growth factor (rhPDGF-BB), a synthetic copy of one of the body’s principal healing agents. We obtained FDA approval of AUGMENT® Bone Graft for ankle and/or hindfoot fusion indications in the United States during third quarter of 2015. Prior to FDA approval, this product was available for sale in Canada for foot and ankle fusion indications and in Australia and New Zealand for hindfoot and ankle fusion indications. We acquired the AUGMENT® Bone Graft product line from BioMimetic Therapeutics, Inc. (BioMimetic) in March 2013. We are currently pursuing FDA approval of AUGMENT® Injectable Bone Graft with a PMA Panel Track Supplement. |
• | Hard Tissue Repair. Our other bone or hard tissue repair products include our PRO-DENSE® Injectable Regenerative Graft. PRO-DENSE® is a composite graft composed of surgical grade calcium sulfate and calcium phosphate, and in animal studies, has demonstrated excellent bone regenerative characteristics, forming new bone that is over three times stronger than the natural surrounding bone at the 13-week time point. Beyond 13 weeks, the regenerated bone gradually remodels to natural bone strength. Our PRO-STIM® Injectable Inductive Graft is built on the PRO-DENSE® material platform, but adds demineralized bone matrix (DBM), and has demonstrated accelerated healing compared to autograft in pre-clinical testing. Our other hard tissue repair products, including our IGNITE® Power Mix Injectable Stimulus, FUSIONFLEX™ Demineralized Moldable Scaffold, ALLOMATRIX® Injectable Putty, OSTEOSET® Resorbable Bead Kit, MIIG® Injectable Graft, CANCELLO-PURE® bone wedge line, and ALLOPURE® Allograft Bone Wedges. |
• | Soft Tissue Repair. Our soft tissue repair products include our GRAFTJACKET® Regenerative Tissue Matrix, which is a human-derived soft tissue graft designed for augmentation of tendon and ligament repairs, such as those of the rotator cuff in the shoulder and Achilles tendon in the foot and ankle. GRAFTJACKET® Maxforce Extreme is our thickest GRAFTJACKET® matrix, which provides excellent suture holding power for augmenting challenging tendon and ligament repairs. We procure our GRAFTJACKET® product through an exclusive distribution agreement that expires December 31, 2018. Other soft tissue repair products include our CONEXA™ Reconstructive Tissue Matrix, ACTISHIELD™ and ACTISHIELD™ CF Amniotic Barrier Membranes, VIAFLOW™ and VIAFLOW™ C Flowable Placental Tissue Matrices, BIOFIBER® biologic absorbable scaffold products, and PHANTOM FIBER™ high strength, resorbable suture products. |
Sports Medicine and Other
The sports medicine and other product category includes products used across several anatomic sites to mechanically repair tissue-to-tissue or tissue-to-bone injuries and other ancillary products. Because of its close relationship to extremities joint replacement and bone fixation, our sports medicine portfolio is comprised of products used to complement our upper and lower extremities product portfolios, providing surgeons a variety of products that may be used in upper and lower extremities surgical procedures. Our global net sales from this product category for the fiscal year ended December 31, 2017 was $23.2 million, or 3.1% of total net sales, compared to $23.2 million, or 3.4% of total net sales, for the fiscal year ended December 25, 2016.
Sales, Marketing, and Medical Education
Our sales and marketing efforts are focused primarily on orthopaedic, trauma, and podiatric surgeons. Orthopaedic surgeons focused on the extremities in many instances have completed upper or lower extremities fellowship programs. We offer surgeon-to-surgeon education on our products using surgeon advisors in an instructional capacity. We have contractual relationships with these surgeon advisors, who help us train other surgeons in the safe and effective use of our products and help other surgeons perfect new surgical techniques. Together with these surgeon advisors, we provide surgeons extensive “hands on” orthopaedic training and education, including upper and lower extremities fellowships and masters courses that are not easily accessible through traditional medical training programs. We also offer clinical symposia and seminars, and publish advertisements and the results of clinical studies in industry publications. We believe that our history of innovation and focus on quality and improving clinical outcomes and “quality of life” for patients, along with our training programs, allow us to reach surgeons early in their careers and provide on-going value, which includes experiencing the clinical benefits of our products.
8
Due to the nature of specialized training surrounding podiatric and orthopaedic surgeons focused on extremities and biologics, our target market is well defined. Historically, surgeons are the primary decision-makers in orthopaedic device purchases. While we market our broad portfolio of products to surgeons, our revenue is generated from sales of our products to healthcare institutions and stocking distributors.
United States
As of December 31, 2017, our sales and distribution system in the United States consisted of 82 geographic sales territories that are staffed by over 500 direct sales representatives and 27 independent sales agencies or distributors. These sales representatives and independent sales agencies and distributors are generally aligned to selling either our upper extremities products or lower extremities products, but, in some cases, certain agencies or direct sales representatives sell products from both our upper and lower extremities product portfolios in their territories. Our direct sales representatives and independent sales agencies and distributors are provided opportunities for product training throughout the year. We also have working relationships with healthcare dealers, including group purchasing organizations, healthcare organizations, and integrated distribution networks. We believe our success in every market sector is dependent upon having a robust and compelling product offering, and equally as important, a dedicated, highly trained, focused sales organization to service our customers. We plan to continue to strategically focus on and invest in building a competitively superior U.S. sales organization by training and certifying our sales representatives on our innovative product portfolio, continuing to develop and implement strong performance management practices, and enhancing sales productivity.
International
Internationally, we utilize several distribution approaches that are tailored to the needs and requirements of each individual market. Our international sales and distribution system currently consists of 15 direct sales offices and approximately 90 distributors that sell our products in approximately 50 countries. We have subsidiaries with direct sales offices in the United Kingdom, France, Germany, Italy, Denmark, Netherlands, Canada, Japan, Australia, Switzerland, and Norway that employ direct sales employees, and in some cases, use independent sales representatives to sell our products in their respective markets. Our products are sold in other countries in Europe, Asia, Africa, and Latin America using stocking distribution partners. Stocking distributors purchase products directly from us for resale to their local customers, with product ownership generally passing to the distributor upon shipment.
Manufacturing, Facilities, and Quality
We utilize a combination of internal manufacturing and a network of qualified outsourced manufacturing partners to produce our products and surgical instrumentation. We manufacture our internally-sourced products in six locations: Arlington, Tennessee; Franklin, Tennessee; Montbonnot, France; Grenoble, France; Nogent, France; and Macroom, Ireland. We lease the manufacturing facility in Arlington, Tennessee from the Industrial Development Board of the Town of Arlington. Our internal manufacturing operations are focused on product quality, continuous improvement, and efficient production. Our internal manufacturing operations have been practicing lean manufacturing concepts for many years with a philosophy focused on high productivity, flexibility, and capacity optimization. Our operations in France have a long history and deep experience with orthopaedic manufacturing and process innovation. Additionally, we believe we are the only company to have vertically integrated operations for the manufacturing of pyrocarbon orthopaedic products. We believe that this capability gives us a competitive advantage in design for manufacturing and prototyping of this innovative material.
We outsource products to our manufacturing partners when it provides us with cost efficiency, expertise, flexibility, and instances where we need additional capacity. A significant portion of our lower extremities products and surgical instrumentation is produced to our specifications by qualified subcontractors who serve medical device companies. We continuously look for opportunities to optimize our internal manufacturing capacity and insource manufacturing where we believe it makes sense to do so.
We maintain a comprehensive quality system that is certified to the European standards ISO 9001 and ISO 13485 and to the Canadian Medical Devices Conformity Assessment System (CMDCAS). We are accredited by the American Association of Tissue Banks (AATB) and have registrations with the FDA as a medical device establishment and as a tissue establishment. These certifications and registrations require periodic audits and inspections by various global regulatory entities to determine if we have systems in place to ensure our products are safe and effective for their intended use and that we are compliant with applicable regulatory requirements. Our quality system exists so that management has the proper oversight, designs are evaluated and tested, production processes are established and maintained, and monitoring activities are in place to ensure products are safe, effective, and manufactured according to our specifications. Consequently, our quality system provides the way for us to ensure we design and build quality into our products while meeting global requirements. We are committed to meet or exceed customer needs as we strive to improve patient outcomes.
Supply
We use a diverse and broad range of raw materials in the manufacturing of our products. We purchase all of our raw materials and select components used in the manufacturing of our products from external suppliers. In addition, we purchase some supplies
9
from single or limited number of sources for reasons of proprietary know-how, quality assurance, sole source, cost-effectiveness, or constraints resulting from regulatory requirements. We work closely with our suppliers to ensure continuity of supply while maintaining high quality and reliability.
We rely on one supplier for the silicone elastomer used in certain number of our extremities products. We are aware of only two suppliers of silicone elastomer to the medical device industry for permanent implant usage. For certain biologic products, we depend on one supplier of demineralized bone matrix and cancellous bone matrix. We rely on one supplier for our GRAFTJACKET® family of soft tissue repair and graft containment products. We believe we maintain adequate stock from these suppliers to meet market demand. We rely on one supplier for a key component of our AUGMENT® Bone Graft. In December 2013, our supplier notified us of its intent to terminate the supply agreement in December 2015. This supplier was contractually required to meet our supply requirements until the termination date, and to use commercially reasonable efforts to assist us in identifying a new supplier and support the transfer of technology and supporting documentation to produce this component. In April 2016, we entered into a commercial supply agreement with FUJIFILM Diosynth Biotechnologies U.S.A., Inc. pursuant to which Fujifilm agreed to manufacture and sell to us and we agreed to purchase the key component of our AUGMENT® Bone Graft. Pursuant to our supply agreement with Fujifilm, commercial production of the key component is expected to begin in 2019. Although we believe that our current supply of the key component from our former supplier should be sufficient to last until after the component becomes available under the new agreement, no assurance can be provided that it will be sufficient.
Some of our products are provided by suppliers under private-label distribution agreements. Under these agreements, the supplier generally retains the intellectual property and exclusive manufacturing rights. The supplier private labels the products under our brands for sale in certain fields of use and geographic territories. These agreements may be subject to minimum purchase or sales obligations and are terminable by either party upon notice. Our private-label distribution agreements do not, individually or in the aggregate, represent a material portion of our business and we are not substantially dependent on them.
Our business, and the orthopaedic industry in general, is capital intensive, particularly as it relates to inventory levels and surgical instrumentation. Our business requires a significant level of inventory driven by our global footprint, the requirement to provide products within a short period of time, and the number of different sizes of many of our products. In addition, we must maintain a significant investment in surgical instrumentation as we provide these instruments to healthcare facilities and surgeons for their use to facilitate the implantation of our products.
Competition
Competition in the orthopaedic device industry is intense and is characterized by extensive research efforts and rapid technological progress. Competitors include major and mid-sized companies in the orthopaedic and biologics industries, as well as academic institutions and other public and private research organizations that continue to conduct research, seek patent protection, and establish arrangements for commercializing products that will compete with our products.
The primary competitive factors facing us include price, quality, innovative design and technical capability, clinical results, breadth of product line, scale of operations, distribution capabilities, brand reputation, and strong customer service. Our ability to compete is affected by our ability to accomplish the following:
• | Develop new products and innovative technologies; |
• | Obtain and maintain regulatory clearances or approvals and reimbursement for our products; |
• | Manufacture and sell our products cost-effectively; |
• | Meet all relevant quality standards for our products and their markets; |
• | Respond to competitive pressures specific to each of our geographic markets, including our ability to enforce non-compete agreements; |
• | Protect the proprietary technology of our products and manufacturing processes; |
• | Market and promote our products; |
• | Continue to maintain a high level of medical education for our surgeons on our products; |
• | Attract and retain qualified scientific, management and sales employees and focused sales representatives; and |
• | Support our technology with clinically relevant studies. |
Research and Development
Realizing that new product offerings are a key to our future success, we are committed to a strong research and development program. The intent of our program is to develop new extremities and biologics products and expand our current product offerings and the markets in which they are offered. Our research and development teams are organized and aligned with our product marketing teams and are focused on improving clinical outcomes by designing innovative, clinically differentiated products with
10
improved ease-of-use and by developing new product features and enhanced surgical techniques that can be leveraged across a broader base of surgeon customers. Our internal research and development teams work closely with external research and development consultants and a global network of physicians and medical personnel in hospitals and universities to ensure we have broad access to best-in-class ideas and technologies to drive our product development pipeline. We also have an active business development team that actively evaluates novel technologies and development stage products. In addition, our clinical and regulatory departments are devoted to verifying the safety and efficacy of our products according to regulatory standards enforced by the FDA and other international regulatory bodies. Our research and development expenses totaled $50.1 million, $50.5 million and $39.3 million in 2017, 2016, and 2015, respectively. Our research and development activities are principally located in Memphis, Tennessee; Montbonnot, France; Plouzané, France; and Warsaw, Indiana, with additional staff in Grenoble, France; and Bloomington, Minnesota.
In the extremities area, our research and development activities focus on building upon our already comprehensive portfolio of surgical solutions for extremities focused surgeons, including procedure and anatomy specific products. With the ultimate goal of addressing unmet clinical needs, we often pursue multiple product solutions for a particular application in order to offer surgeons the ability either to use their preferred procedural technique or to provide options and flexibility in the surgical setting with the understanding that one solution does not work for every case. Additionally, with the acquisition of IMASCAP, whose Glenosys technology is the preoperative planning software behind our BLUEPRINT™ 3D planning software, we have a rich pipeline of potential breakthrough technologies under development. We believe the future of orthopaedic implant surgery will include advanced elements of artificial intelligence and augmented reality.
In the biologics area, we have research and development projects underway that are designed to provide differentiation of our advanced materials in the marketplace. We are particularly focused on the integration of our biologic product platforms into extremities procedures and potential new applications for our AUGMENT® Bone Graft.
Intellectual Property
Patents, trade secrets, know-how, and other proprietary rights are important to the continued success of our business. We currently own more than 1,500 patents and pending patents throughout the world. We currently have licenses to use approximately 800 patents. We seek to aggressively protect technology, inventions, and improvements that we consider important through the use of patents and trade secrets in the United States and significant foreign markets. We manufacture and market products under both patents and license agreements with other parties. These patents and license agreements have a defined life and expire from time to time. We are not materially dependent on any one or more of our patents. In addition to patents, our knowledge and experience, creative product development, marketing staff and trade secret information, with respect to manufacturing processes, materials and product design, are as important as our patents in maintaining our proprietary product lines.
Although we believe that, in the aggregate, our patents are valuable, and patent protection is beneficial to our business and competitive positioning, our patent protection will not necessarily deter or prevent competitors from attempting to develop similar products. There can be no assurances that our patents will provide competitive advantages for our products or that competitors will not challenge or circumvent these rights. In addition, there can be no assurances that the United States Patent and Trademark Office (USPTO) or foreign patent offices will issue any of our pending patent applications. The USPTO and foreign patent offices may deny or require a significant narrowing of the claims in our pending patent applications and the patents issuing from such applications. Any patents issuing from the pending patent applications may not provide us with significant commercial protection. We could incur substantial costs in proceedings before the USPTO or foreign patent offices, including opposition and other post-grant proceedings. These proceedings could result in adverse decisions as to the patentability, priority of our inventions, and the narrowing or invalidation of claims in issued patents. Additionally, the laws of some of the countries in which our products are or may be sold may not protect our intellectual property to the same extent as the laws in the United States or at all.
While we do not believe that any of our products infringe any valid claims of patents or other proprietary rights held by others, we are currently subject to patent infringement litigation and there can be no assurances that we do not infringe any patents or other proprietary rights. If our products were found to infringe any proprietary right of another party, we could be required to pay significant damages or license fees to such party and/or cease production, marketing, and distribution of those products. Litigation also may be necessary to defend infringement claims of third parties or to enforce patent rights we hold or to protect trade secrets or techniques we own.
We rely on trade secrets and other unpatented proprietary technology. There can be no assurances that we can meaningfully protect our rights in our unpatented proprietary technology or that others will not independently develop substantially equivalent proprietary products or processes or otherwise gain access to our proprietary technology.
We protect our proprietary rights through a variety of methods. As a condition of employment, we generally require employees to execute an agreement relating to the confidential nature of and company ownership of proprietary information and assigning intellectual property rights to us. We generally require confidentiality agreements with vendors, consultants, and others who may have access to proprietary information. We generally limit access to our facilities and review the release of company information in advance of public disclosure. There can be no assurances, however, that confidentiality agreements with employees, vendors,
11
and consultants will not be breached, adequate remedies for any breach would be available, or competitors will not discover or independently develop our trade secrets. Litigation also may be necessary to protect trade secrets or techniques we own.
Government Regulation
We are subject to varying degrees of government regulation in the countries in which we conduct business. In some countries, such as the United States, Europe, Canada, and Japan, government regulation is significant and, we believe there is a general trend toward increased and more stringent regulation throughout the world. As a manufacturer and marketer of medical devices, we are subject to extensive regulation by the U.S. Food and Drug Administration, other federal governmental agencies, and state agencies in the United States and similar foreign governmental authorities in countries located outside the United States. These regulations generally govern the introduction of new medical devices; the observance of certain standards with respect to the design, manufacture, testing, labeling, promotion, and sales of the devices; the maintenance of certain records; the ability to track devices; the reporting of potential product defects; the import and export of devices; as well as other matters. In addition, as a participant in the healthcare industry, we are also subject to various other U.S. federal, state, and foreign laws.
On September 29, 2010, WMT entered into a five-year Corporate Integrity Agreement (CIA) with the Office of the Inspector General of the United States Department of Health and Human Services (OIG-HHS). The CIA expired on September 29, 2015 and on January 27, 2016, we received notification from the OIG-HHS that the term of the CIA has concluded. While the term of the CIA has concluded, our failure to continue to maintain compliance with U.S. healthcare laws, regulations and other requirements in the future could expose us to significant liability, including, but not limited to, exclusion from federal healthcare program participation, including Medicaid and Medicare, potential prosecution, civil and criminal fines or penalties, as well as additional litigation cost and expense.
We strive to comply with regulatory requirements governing our products and operations and to conduct our affairs in an ethical manner. This practice is reflected in our Code of Business Conduct, various other compliance policies and through the responsibility of the nominating, corporate governance and compliance committee of our board of directors, which oversees our corporate compliance program and compliance with legal and regulatory requirements as well as our ethical standards and policies. We devote significant time, effort, and expense to addressing the extensive government and regulatory requirements applicable to our business. Such regulatory requirements are subject to change and we cannot predict the effect, if any, that these changes might have on our business, financial condition, and results of operations. Governmental regulatory actions against us could result in warning letters, delays in approving or refusal to approve a product, the recall or seizure of our products, suspension or revocation of the authority necessary for the production or sale of our products, litigation expense, and civil and criminal penalties against us and our officers and employees. If we fail to comply with these regulatory requirements, our business, financial condition, and results of operations could be harmed.
United States
In the United States, our products are strictly regulated by the FDA under the U.S. Food, Drug and Cosmetic Act (FDC Act). Some of our products are also regulated by state agencies. FDA regulations and the requirements of the FDC Act affect the pre-clinical and clinical testing, design, manufacture, safety, efficacy, labeling, storage, recordkeeping, advertising, and promotion of our medical device products. Our tissue-based products are subject to FDA regulations, the National Organ Transplant Act (NOTA), and various state agency regulations. We are an accredited member of the American Association of Tissue Banks and an FDA-registered tissue establishment, which includes the packaging, processing, storage, labeling, and distribution of tissue products regulated as medical devices and the storage and distribution of tissue products regulated solely as human cell and tissue products. In addition, we maintain the appropriate tissue bank licenses based on state requirements.
Generally, before we can market a new medical device, marketing clearance from the FDA must be obtained through either a premarket notification under Section 510(k) of the FDC Act or the approval of a de novo or PMA application. Most of our products are FDA cleared through the 510(k) premarket notification process. The FDA typically grants a 510(k) clearance if the applicant can establish that the device is substantially equivalent to a predicate device. It usually takes about three months from the date of a 510(k) submission to obtain clearance, but it may take longer, particularly if a clinical trial is required. The FDA may find that a 510(k) is not appropriate or that substantial equivalence has not been shown and, as a result, require a de novo or PMA application.
PMA applications must be supported by valid scientific evidence to demonstrate the safety and effectiveness of the device, typically including the results of human clinical trials, bench tests, and laboratory and animal studies. The PMA application must also contain a complete description of the device and its components, and a detailed description of the methods, facilities, and controls used to manufacture the device. In addition, the submission must include the proposed labeling and any training materials. The PMA application process is expensive and generally takes significantly longer than the 510(k) process. Additionally, the FDA may never approve the PMA application. As part of the PMA application review process, the FDA generally will conduct an inspection of the manufacturer’s facilities to ensure compliance with applicable quality system regulatory requirements, which include quality control testing, documentation control, and other quality assurance procedures. A PMA can include post-approval conditions including, among other things, restrictions on labeling, promotion, sale and distribution, data reporting (surveillance), or requirements to do additional clinical studies post-approval. Even after approval of a PMA, the FDA must grant subsequent
12
approvals for a new PMA or a PMA supplement to authorize certain modifications to the device, its labeling, or its manufacturing process.
One or more clinical trials may be required to support a 510(k) application or a de novo submission and almost always are required to support a PMA application. Clinical trials of unapproved or uncleared medical devices or devices being studied for uses for which they are not approved or cleared (investigational devices) must be conducted in compliance with FDA requirements. If human clinical trials of a medical device are required and the device presents a significant risk, the sponsor of the trial must file an investigational device exemption (IDE) application prior to commencing human clinical trials. The IDE application must be supported by data, typically including the results of animal and/or laboratory testing. If the IDE application is approved by the FDA and one or more institutional review boards (IRBs), human clinical trials may begin at a specific number of institutional investigational sites with the specific number of patients approved by the FDA. If the device presents a non-significant risk to the patient, a sponsor may begin the clinical trial after obtaining approval for the trial by one or more IRBs without separate approval from the FDA. Submission of an IDE does not give assurance that the FDA will approve the IDE. If an IDE is approved, there can be no assurance the FDA will determine that the data derived from the trials support the safety and effectiveness of the device or warrant the continuation of clinical trials. An IDE supplement must be submitted to and approved by the FDA before a sponsor or investigator may make a change to the investigational plan in such a way that may affect its scientific soundness, study indication, or the rights, safety or welfare of human subjects. During the trial, the sponsor must comply with the FDA’s IDE requirements including, for example, investigator selection, trial monitoring, adverse event reporting, and recordkeeping. The investigators must obtain patient informed consent, rigorously follow the investigational plan and trial protocol, control the disposition of investigational devices, and comply with reporting and recordkeeping requirements. We, the FDA and the IRB at each institution at which a clinical trial is being conducted may suspend a clinical trial at any time for various reasons, including a belief that the subjects are being exposed to an unacceptable risk. We are currently conducting a few clinical trials.
After a device is cleared or approved for marketing, numerous and pervasive regulatory requirements continue to apply and we continue to be subject to inspection by the FDA to determine our compliance with these requirements, as do our suppliers, contract manufacturers, and contract testing laboratories. These requirements include, among others, the following:
• | Quality System regulations, which govern, among other things, how manufacturers design, test, manufacture, modify, label, exercise quality control over and document manufacturing of their products; |
• | labeling and claims regulations, which require that promotion is truthful, not misleading, fairly balanced and provide adequate directions for use and that all claims are substantiated, and also prohibit the promotion of products for unapproved or “off-label” uses and impose other restrictions on labeling; |
• | FDA guidance of off-label dissemination of information and responding to unsolicited requests for information; |
• | Medical Device Reporting (MDR) regulation, which requires reporting to the FDA certain adverse experiences associated with use of our products; |
• | complaint handling regulations designed to track, monitor, and resolve complaints related to our products; |
• | Part 806 reporting of certain corrections, removals, enhancements, and recalls of products; |
• | complying with federal law and regulations requiring Unique Device Identifiers (UDI) on devices and also requiring the submission of certain information about each device to FDA’s Global Unique Device Identification Database (GUDID); and |
• | in some cases, ongoing monitoring and tracking of our products’ performance and periodic reporting to the FDA of such performance results. |
The FDA has statutory authority to regulate allograft-based products, processing, and materials. The FDA and other international regulatory agencies have been working to establish more comprehensive regulatory frameworks for allograft-based tissue-containing products, which are principally derived from human cadaveric tissue. The framework developed by the FDA establishes risk-based criteria for determining whether a particular human tissue-based product will be classified as human tissue, a medical device, or a biologic drug requiring premarket clearance or approval. All tissue-based products are subject to extensive FDA regulation, including establishment registration requirements, product listing requirements, good tissue practice requirements for manufacturing, and screening requirements that ensure that diseases are not transmitted to tissue recipients. The FDA has also proposed extensive additional requirements that address sub-contracted tissue services, tracking to the recipient/patient, and donor records review. If a tissue-based product is considered human tissue, the FDA requirements focus on preventing the introduction, transmission, and spread of communicable diseases to recipients. Neither clinical data nor review of safety and efficacy is required before the tissue can be marketed. However, if the tissue is considered a medical device or a biologic drug, then FDA clearance or approval is required.
The FDA and international regulatory authorities periodically inspect us and our third-party manufacturers for compliance with applicable regulatory requirements. These requirements include labeling regulations, manufacturing regulations, quality system
13
regulations, regulations governing unapproved or off-label uses, and medical device regulations. Medical device regulations require a manufacturer to report to the FDA serious adverse events or certain types of malfunctions involving its products.
We are subject to various U.S. federal and state laws concerning healthcare fraud and abuse, including anti-kickback and false claims laws, and other matters. The U.S. federal Anti-Kickback Statute (and similar state laws) prohibits certain illegal remuneration to physicians and other health care providers that may financially bias prescription decisions and result in an over-utilization of goods and services reimbursed by the federal government. The U.S. federal False Claims Act (and similar state laws) prohibits conduct on the part of a manufacturer which may cause or induce an inappropriate reimbursement for devices reimbursed by the federal government. We are also subject to the U.S. federal Physician Payments Sunshine Act and various state laws on reporting remunerative relationships with healthcare providers. These laws impact the kinds of financial arrangements we may have with hospitals, surgeons or other potential purchasers of our products. They particularly impact how we structure our sales offerings, including discount practices, customer support, education and training programs, physician consulting, research grants and other arrangements. These laws are administered by, among others, the U.S. Department of Justice, the Office of Inspector General of the Department of Health and Human Services and state attorneys general. Many of these agencies have increased their enforcement activities with respect to medical device manufacturers in recent years. If our operations are found to be in violation of these laws, we may be subject to penalties, including potentially significant criminal, civil and/or administrative penalties, damages, fines, disgorgement, exclusion from participation in government healthcare programs, contractual damages, reputational harm, administrative burdens, diminished profits and future earnings, and the curtailment or restructuring of our operations.
We are also subject to data privacy and security regulation by both the U.S. federal government and the states in which we conduct our business. Health Insurance Portability and Accountability Act of 1996 (HIPAA), as amended by the Health Information Technology for Economic and Clinical Health Act (HITECH), and their respective implementing regulations, imposes specified requirements relating to the privacy, security and transmission of individually identifiable health information. Among other things, HITECH makes HIPAA’s security standards directly applicable to business associates, defined as service providers of covered entities that create, receive, maintain, or transmit protected health information in connection with providing a service for or on behalf of a covered entity. HITECH also created four new tiers of civil monetary penalties and gave state attorneys general new authority to file civil actions for damages or injunctions in federal courts to enforce the federal HIPAA laws and seek attorneys’ fees and costs associated with pursuing federal civil actions. In addition, many state laws govern the privacy and security of health information in certain circumstances, many of which differ from HIPAA and each other in significant ways and may not have the same effect.
The FDA, in cooperation with U.S. Customs and Border Protection, administers controls over the import of medical devices into the United States. The U.S. Customs and Border Protection imposes its own regulatory requirements on the import of our products, including inspection and possible sanctions for noncompliance. We are also subject to foreign trade controls administered by certain U.S. government agencies, including the Bureau of Industry and Security within the Commerce Department and the Office of Foreign Assets Control within the Treasury Department.
International
Outside the United States, we are subject to government regulation in the countries in which we operate and sell our products. We must comply with extensive regulations governing product approvals, product safety, quality, manufacturing, and reimbursement processes in order to market our products in all major foreign markets. Although many of the regulations applicable to our products in these countries are similar to those of the FDA, these regulations vary significantly from country to country and with respect to the nature of the particular medical device. The time required to obtain foreign approvals to market our products may be longer or shorter than the time required in the United States, and requirements for such approvals may differ from FDA requirements.
To market our product devices in the member countries of the European Union, we are required to comply with the European Medical Device Directives and to obtain CE mark certification. CE mark certification is the European symbol of adherence to quality assurance standards and compliance with applicable European Medical Device Directives. Under the European Medical Device Directives, all medical devices must qualify for CE marking. To obtain authorization to affix the CE mark to one of our products, a recognized European Notified Body must assess our quality systems and the product’s conformity to the requirements of the European Medical Device Directives. We are subject to inspection by the Notified Bodies for compliance with these requirements. We also are required to comply with regulations of other countries in which our products are sold, such as obtaining Ministry of Health Labor and Welfare approval in Japan, Health Protection Branch approval in Canada and Therapeutic Goods Administration approval in Australia. The new European MDR intended to replace the current Medical Device Directives came into force May 2017. Manufacturers of approved medical devices will have until May 2020 to transition their devices to meet the requirements of the MDR. After May 2020, manufacturers are offered a grace period which further extends the transition time for some medical devices. We are currently reviewing our product portfolios, quality system and processes in an effort to meet the new regulations within the timeframes we are afforded.
14
Our manufacturing facilities are subject to environmental health and safety laws and regulations, including those relating to the use, registration, handling, storage, disposal, recycling and human exposure to hazardous materials and discharges of substances in the air, water and land. For example, in France, requirements known as the Installations Classées pour la Protection de l’Environnement regime provide for specific environmental standards related to industrial operations such as noise, water treatment, air quality, and energy consumption. In Ireland, our manufacturing facilities are likewise subject to local environmental regulations, such as related to water pollution and water quality, which are administered by the Environmental Protection Agency.
Our operations in countries outside the United States are subject to various other laws such as those regarding recordkeeping and privacy; laws regarding sanctioned countries, entities and persons; customs and import-export, and laws regarding transactions in foreign countries. We are also subject to the U.S. Foreign Corrupt Practices Act, which generally prohibits covered entities and their intermediaries from engaging in bribery or making other prohibited payments to foreign officials for the purpose of obtaining or retaining business or other benefits, as well as similar anti-corruption laws of other countries, such as the UK Bribery Act.
Third-Party Reimbursement
Sales of our products depend in part on the availability of coverage and reimbursement from insurers/third-party payors. Third-party payors may include governmental programs such as the U.S. Medicare and Medicaid programs, private insurance plans, and workers’ compensation plans. These third-party payors may deny coverage or reimbursement for a product or procedure if they determine that the product or procedure is investigational or is not medically necessary. Third-party payors also may place limitations on coverage of products or procedures, such as the types of conditions for which a procedure will be covered, the types of physicians who can perform specific types of procedures, or the care setting in which the procedure may be performed, e.g., outpatient or in a hospital. Also, third-party payors are increasingly auditing and challenging the charges submitted for medical products and services and are raising concerns related to upcoding, miscoding, and using inappropriate modifiers. Some third-party payors may require prior-authorization, pre-determination, and/or prior approval to determine coverage for innovative devices or procedures before they will reimburse healthcare providers for associated claims. Even though a new product may have been approved or cleared for commercial sale by the FDA, demand may be limited if any reimbursement barriers are imposed by governmental and/or private third-party payors. In the United States, there is no uniform coverage and payment policy across all third-party payors; instead, coverage and payment can be quite different from payor to payor, and from one region of the country to another. Outside of the US, coverage and payment also varies from country to country. Coverage also depends on our ability to demonstrate the short-term and long-term clinical effectiveness, and in some cases the cost-effectiveness, of our products. These supportive data are obtained from clinical trials and published literature. We conduct research and present results at major scientific and medical meetings, and publish them in respected, peer-reviewed medical journals because we believe data and evidence that can support coverage and payment are important to the successful commercialization of and market access for our products.
The Centers for Medicare & Medicaid Services (CMS), the U.S. agency responsible for administering the Medicare program, sets coverage and reimbursement policies for the Medicare program. CMS may adopt changes to Medicare coverage and payment policies related to our products in the future through national coverage determinations and through annual regulations updating Medicare payment policies. Local coverage determinations also can be adopted by CMS contractors. Congress also periodically adopts legislation that impacts reimbursement under federal health programs.
Medicaid programs are funded by both U.S. federal and state governments. Specific reimbursement policies vary from state to state and are subject to change from year to year. Medicaid enrollment and spending has increased in under the Affordable Care Act.
Payment to physicians for procedures using our products also can be impacted by changes to Current Procedural Terminology (CPT) codes, which are used to submit claims to payers for medical services. CPT codes are assigned, maintained and annually updated by the American Medical Association and its CPT Editorial Board. The relative values assigned to CPT codes, which represent resources used to perform a procedure, also can be revised. If the CPT codes that apply to procedures performed using our products are changed, or the relative values are decreased, reimbursement for performances of these procedures may be adversely affected.
We believe that the overall escalating cost of medical products and services for governments and private health insurers has led to, and will continue to lead to, increased pressures on the healthcare and medical device industry to reduce the costs of products and services. Third-party payors are developing increasingly-sophisticated methods of controlling healthcare costs through measures including, but not limited to, bundled payments, episode- of-care risk-sharing methodologies, health technology assessments, coverage with evidence development requirements, payment linked to quality, pay-for-performance, comparative effectiveness reviews, prospective reimbursement, capitation programs, group purchasing, redesign of benefit offerings, pre-approvals and second opinion requirements, careful review of bills, encouragement of healthier lifestyles and other preventative services, and exploration of more cost-effective methods of delivering healthcare. Adoption of these or other types of cost control measures could potentially impact market access and pricing structures for our products, which in turn could impact our future sales. There can be no assurance that third-party reimbursement will be available or adequate, or that current and future legislation, regulation or reimbursement policies of third-party payors will not adversely affect the demand for our products or our ability to
15
sell our products on a profitable basis. If third-party payor reimbursement is unavailable or inadequate, it could have a material adverse effect on our business, operating results, and financial condition.
Outside the United States, reimbursement and healthcare payment systems vary significantly by country, and many countries have instituted price ceilings on specific product lines and procedures. We have received increased requests for clinical data to support registration and reimbursement outside the United States. We have increasingly experienced local, product-specific reimbursement law being applied as an overlay to medical device regulation, which has provided an additional level of clearance requirement. Specifically, Australia requires that clinical data for clearance and reimbursement be in the form of prospective, multi-center studies, a high bar not previously applied. In addition, in France, certain innovative devices (such as some of our products made from pyrolytic carbon) have been identified as needing to provide clinical evidence to support a “mark-specific” reimbursement. There can be no assurances that procedures using our products will be considered medically reasonable and necessary for a specific indication, that our products will be considered cost-effective by third-party payors, that an adequate level of reimbursement will be available, or that the third-party payors’ reimbursement policies will not adversely affect our ability to sell our products profitably.
Environmental
Our operations and properties are subject to extensive U.S. federal, state, local, and foreign environmental protection and health and safety laws and regulations. These laws and regulations govern, among other things, the generation, storage, handling, use, and transportation of hazardous materials and the handling and disposal of hazardous waste generated at our facilities. Under such laws and regulations, we are required to obtain permits from governmental authorities for some of our operations. If we violate or fail to comply with these laws, regulations or permits, we could be fined or otherwise sanctioned by regulators. Under some environmental laws and regulations, we could also be held responsible for all of the costs relating to any contamination at our past or present facilities and at third-party waste disposal sites. We believe our costs of complying with current and future environmental laws, regulations and permits and our liabilities arising from past or future releases of, or exposure to, hazardous substances will not materially adversely affect our business, results of operations, or financial condition, although there can be no assurances of this.
Seasonality
We traditionally experience lower sales volumes in the third quarter than throughout the rest of the year as many of our products are used in elective procedures, which generally decline during June, July, and August. This typically results in our selling, general and administrative expenses and research and development expenses as a percentage of our net sales that are higher during third quarter than throughout the rest of the year. In addition, our first quarter selling, general and administrative expenses include additional expenses that we incur in connection with the annual meeting held by the American College of Foot and Ankle Surgeons (ACFAS) and the American Academy of Orthopaedic Surgeons (AAOS). During these three-day events, we display our most recent and innovative products.
Backlog
The time period between the placement of an order for our products and shipment is generally short. As such, we do not consider our backlog of firm orders to be material to an understanding of our business.
Employees
As of December 31, 2017, we had 2,675 employees. We believe that we have a good relationship with our employees.
Available Information
We are a public company with limited liability (naamloze vennootschap) organized under the laws of the Netherlands. We were initially formed as a private company with limited liability (besloten vennootschap) in June 2006. Our principal executive offices are located at Prins Bernhardplein 200, 1097 JB Amsterdam, the Netherlands. Our telephone number at this address is (+31) 20 521 4777. Our corporate website is located at www.wright.com. The information contained on our website or connected to our website is not incorporated by reference into and should not be considered part of this report.
We make available, free of charge and through our Internet corporate website, our Annual Reports on Form 10-K, Quarterly Reports on Form 10-Q, Current Reports on Form 8-K, and any amendments to any such reports filed or furnished pursuant to Section 13(a) or 15(d) of the Securities Exchange Act of 1934, as amended, as soon as reasonably practicable after they are electronically filed with or furnished to the Securities and Exchange Commission.
16
Item 1A. Risk Factors.
We are affected by risks specific to us as well as factors that affect all businesses operating in a global market. In addition to the other information set forth in this report, careful consideration should be taken of the factors described below, which could materially adversely affect our business, financial condition or operating results. The risk factors described below may relate solely to one or more of the legal entities contained in our corporate structure and may not necessarily apply to Wright Medical Group N.V. or one or more of the other legal entities contained in our corporate structure.
Risks Related to Our Business
We have a history of operating losses and may never achieve or sustain profitability.
We have a history of operating losses and at December 31, 2017, we had an accumulated deficit of $1.4 billion. Our ability to achieve profitability will be influenced by many factors, including, among others, the success of the Wright/Tornier merger; the level and timing of future net sales and expenditures; development, commercialization and market acceptance of new products; the results and scope of ongoing research and development projects; competing technologies and market developments; regulatory requirements and delays; and pending litigation. As a result, we may continue to incur operating losses for the foreseeable future. These losses will continue to have an adverse impact on our shareholders’ equity, and we may never achieve or sustain profitability.
We may never realize the expected benefits from the Wright/Tornier merger, the divestiture of the OrthoRecon business, and our strategy to become a profitable, high-growth, pure-play medical technology company, and command the market valuation typically accorded such companies.
The Wright/Tornier merger and the divestiture of the OrthoRecon business are part of our strategy to transform ourselves into a profitable, high-growth, pure-play medical technology company, and command the market valuation typically accorded such companies. If we are unable to achieve our growth and profitability objectives due to competition, lack of acceptance of our products, failure to gain regulatory approvals, or other risks as described in this section or other sections of this report, or due to other events, we will not be successful in transforming our business and will not be accorded the market valuation we seek. Moreover, the OrthoRecon business generated substantial revenue and cash flow, which we have not replaced. While over time we expect to replace the OrthoRecon revenue and cash flow by accelerating higher margin revenue streams from extremities and biologic products, especially in light of the Wright/Tornier merger, there is still a risk we will be unable to replace the revenue and cash flow that the OrthoRecon business generated, or that the cost of such will be higher than expected. If we are unable to achieve our profit and growth objectives, such failure will be exacerbated by the loss of revenue and cash flow generated by the OrthoRecon business, and could result in a decline in our stock price.
We may never realize the expected benefits of our strategic business combinations or acquisition transactions.
In addition to developing new products and growing our business internally, we have sought to grow through business combinations and acquisitions of complementary businesses, technologies and products. Examples include, our recent acquisition of IMASCAP in December 2017, the Wright/Tornier merger in October 2015, legacy Wright’s acquisition of BioMimetic in early 2013, as well as its acquisitions of Biotech International in November 2013, Solana Surgical, LLC (Solana) in January 2014, and OrthoPro, L.L.C. (OrthoPro) in February 2014, and legacy Tornier’s acquisition of OrthoHelix Surgical Designs, Inc. in 2012. Future acquisitions may require equity or debt financing, the dilutive or other effects of which could negatively impact the anticipated benefits of the transaction. Business combinations and acquiring new businesses involve a myriad of risks. Whenever new businesses are combined or acquired, there is a risk we may fail to realize some or all of the anticipated benefits of the transaction. This can occur if integration of the businesses proves to be more complicated than planned, resulting in failure to realize operational synergies and/or failure to mitigate operational dis-synergies, diversion of management attention, and loss of key personnel. It can also occur if the combined or acquired business fails to meet our net sales projections, exposes us to unexpected liabilities, or if our pre-acquisition due diligence fails to uncover issues that negatively affect the value or cost structure of the acquired enterprise. Although we carefully plan our business combinations and acquisitions, there can be no assurances that these and other risks will not prevent us from realizing the expected benefits of these transactions. If we do not achieve the anticipated benefits of an acquisition as rapidly as expected, or at all, investors or analysts may not perceive the same benefits of the acquisition as we do. If these risks materialize, our ordinary share price could be materially adversely affected. Any difficulties in the integration of acquired businesses or unexpected penalties or liabilities in connection with such businesses could have a material adverse effect on our business, operating results and financial condition.
We anticipate significant future sales from our AUGMENT® Bone Graft products. If we are wrong, our future operating results, cash flows, and prospects could be adversely affected.
We obtained FDA approval of AUGMENT® Bone Graft in the United States for ankle and/or hindfoot fusion indications during the third quarter of 2015 and expect significant future sales from this product. AUGMENT® Bone Graft, which is based on recombinant human platelet-derived growth factor (rhPDGF-BB), a synthetic copy of one of the body’s principal healing agents, is currently available for sale as an alternative to autograft in the United States for ankle and/or hindfoot fusion indications, in Canada for foot and ankle fusion indications and in Australia and New Zealand for hindfoot and ankle fusion indications. We
17
anticipate significant sales of AUGMENT® Bone Graft. If these sales expectations are not met, our future operating results, cash flows and prospects could be adversely affected. We are currently pursuing FDA approval of AUGMENT® Injectable Bone Graft (AUGMENT® Injectable), which combines rhPDGF-BB with an injectable bone matrix. We expect FDA approval of AUGMENT® Injectable in 2018 and, if and when approved, anticipate significant sales of AUGMENT® Injectable. However, there can be no assurance that AUGMENT® Injectable will receive FDA approval in 2018, if ever. Failure to obtain FDA approval of AUGMENT® Injectable could adversely affect our future operating results, cash flows and prospects.
We acquired the AUGMENT® Bone Graft product line from BioMimetic in March 2013 and are subject to future milestone payments to the holders of the contingent value rights issued in connection with that transaction. If, prior to March 1, 2019, sales of AUGMENT® Bone Graft reach $40 million over 12 consecutive months, a cash payment would be required at $1.50 per share, or $42 million. Further, if, prior to March 1, 2019, sales of AUGMENT® Bone Graft reach $70 million over 12 consecutive months, an additional cash payment would be required at $1.50 per share, or $42 million. Therefore, even if we achieve significant sales of AUGMENT® Bone Graft, cash proceeds from these sales will be offset in part by these milestone payment obligations.
We may not realize the anticipated benefits of the 2017 additions to our direct U.S. lower extremities and biologics sales force within the time frame we expect, or ever, which could harm our business and operating results.
During the first half of 2017, we added new U.S. lower extremities and biologics sales representatives to our core U.S. lower extremities and core biologics businesses. Recruiting and training qualified personnel requires significant time, expense and attention. While we continue to believe these additions will help grow our U.S. lower extremities and biologics sales, there are no assurances that this initiative will ultimately yield favorable results for us in the near future or at all. Our business may be adversely affected if our new U.S. lower extremities and biologics sales representatives are unable to achieve desired productivity levels in a reasonable period.
We may not achieve our financial guidance or projected goals and objectives in the time periods that we anticipate or announce publicly, which could have an adverse effect on our business and could cause the market price of our ordinary shares to decline.
We typically provide projected financial information, such as our anticipated annual net sales, adjusted earnings and adjusted earnings before interest, taxes, depreciation, and amortization. These financial projections are based on management’s then current expectations and typically do not contain any significant margin of error or cushion for any specific uncertainties or for the uncertainties inherent in all financial forecasting. The failure to achieve our financial projections or the projections of analysts and investors could have an adverse effect on our business, disappoint analysts and investors, and cause the market price of our ordinary shares to decline. Our net sales performance has been outside of our guidance range in certain quarters, which negatively impacted the market price of our ordinary shares, and could do so in the future should our results fall below our guidance range and the expectations of analysts and investors.
We also set goals and objectives for, and make public statements regarding, the timing of certain accomplishments and milestones regarding our business or operating results, such as the timing of financial objectives, new products, regulatory actions, pending litigation, and anticipated distributor and sales representative transitions. The actual timing of these events can vary dramatically due to a number of factors, including the risk factors described in this report. As a result, there can be no assurance that we will succeed in achieving our projected goals and objectives in the time periods that we anticipate or announce publicly. The failure to achieve such projected goals and objectives in the time periods that we anticipate or announce publicly could have an adverse effect on our business, disappoint investors and analysts, and cause the market price of our ordinary shares to decline.
Our quarterly operating results are subject to substantial fluctuations, and you should not rely on them as an indication of our future results.
Our quarterly operating results may vary significantly due to a combination of factors, many of which are beyond our control. These factors include:
• | demand for products, which historically has been lowest in the third quarter; |
• | our ability to meet the demand for our products; |
• | the level of competition; |
• | the number, timing, and significance of new products and product introductions and enhancements by us and our competitors; |
• | our ability to develop, introduce, and market new and enhanced versions of our products on a timely basis; |
• | the timing of or failure to obtain regulatory clearances or approvals for products; |
• | changes in pricing policies by us and our competitors; |
• | changes in the treatment practices of orthopaedic surgeons; |
• | changes in distributor relationships and sales force size and composition; |
• | the timing of material expense- or income-generating events and the related recognition of their associated financial impact; |
• | the number and mix of products sold in the quarter and the geographies in which they are sold; |
18
• | the number of selling days; |
• | the availability and cost of components and materials; |
• | prevailing interest rates on our excess cash investments; |
• | fluctuations in foreign currency exchange rates; |
• | the timing of significant orders and shipments; |
• | ability to obtain reimbursement for our products and the timing of patients’ use of their calendar year medical insurance deductibles; |
• | work stoppages or strikes in the healthcare industry; |
• | changes in FDA and foreign governmental regulatory policies, requirements, and enforcement practices; |
• | changes in accounting standards, policies, estimates, and treatments; |
• | restructuring, impairment, and other special charges, costs associated with our pending litigation and U.S. governmental inquiries, and other charges; |
• | variations in cost of sales due to the amount and timing of excess and obsolete inventory charges, commodity prices, and manufacturing variances; |
• | income tax fluctuations and changes in tax rules; |
• | general economic factors; and |
• | increases of interest rates, which can increase the cost of borrowings under our ABL Credit Agreement, and generally affect the level of economic activity. |
We believe our quarterly sales and operating results may vary significantly in the future and period-to-period comparisons of our results of operations are not necessarily meaningful and should not be relied upon as indications of future performance. We cannot assure you that our sales will increase or be sustained in future periods or that we will be profitable in any future period. Any shortfalls in sales or earnings from levels expected by securities or orthopaedic industry analysts could have an immediate and significant adverse effect on the trading price of our ordinary shares in any given period.
Although legacy Wright divested the OrthoRecon business, legacy Wright remains responsible, as between it and MicroPort, for liability claims on OrthoRecon products sold prior to closing, and might still be sued on products sold after closing.
Although OrthoRecon product liability expenses are accounted for under our discontinued operations, the agreement between WMG and MicroPort requires that legacy Wright, as between it and MicroPort, retain responsibility for product liability claims on OrthoRecon products sold prior to closing, and for any resulting settlements, judgments, or other costs. Moreover, even though MicroPort, as between it and legacy Wright, is responsible for liability claims on post-closing sales, there can be no assurance we will not be named as a defendant in a lawsuit relating to such post-closing sales, or that MicroPort will have adequate resources to exonerate legacy Wright from any resulting expenses or liabilities.
Product liability lawsuits could harm our business and adversely affect our operating results or results from discontinued operations and financial condition if adverse outcomes exceed our product liability insurance coverage.
The manufacture and sale of medical devices expose us to significant risk of product liability claims. We are currently defendants in a number of product liability matters, including those relating to the OrthoRecon business, which legacy Wright divested to MicroPort in 2014. Legacy Wright remains responsible, as between it and MicroPort, for claims associated with products sold before divesting the OrthoRecon business to MicroPort.
We have been named as a defendant, in some cases with multiple other defendants, in lawsuits in which it is alleged that as yet unspecified defects in the design, manufacture, or labeling of certain metal-on-metal hip replacement products rendered the products defective. The pre-trial management of certain of these claims has been consolidated in the federal court system, in the United States District Court for the Northern District of Georgia under multi-district litigation and certain other claims by the Judicial Counsel Coordinated Proceedings in state court in Los Angeles County, California. As of December 31, 2017, there were approximately 800 lawsuits pending in the multi-district federal court proceeding and consolidated California state court proceeding, and an additional 50 cases pending in various state courts. As of that date, we have also entered into approximately 700 so called “tolling agreements” with potential claimants who have not yet filed suit. As of December 31, 2017, there were also approximately 50 non-U.S. lawsuits presently pending. We believe we have data that supports the efficacy and safety of the metal-on-metal hip replacement systems, and have been vigorously defending these cases.
While continuing to dispute liability, on November 1, 2016, WMT entered into a Master Settlement Agreement (MSA) with Court-appointed attorneys representing plaintiffs in the MDL and JCCP. Under the terms of the MSA, the parties agreed to settle 1,292 specifically identified claims associated with CONSERVE®, DYNASTY® and LINEAGE® products that meet the eligibility requirements of the MSA and are either pending in the MDL or JCCP, or subject to court-approved tolling agreements in the MDL or JCCP, for a settlement amount of $240 million. Due to apparent demand from additional claimants excluded from settlement because of the 1,292 claim ceiling, but otherwise eligible for participation, on May 15, 2017, WMT agreed to settle an additional 53 such claims, on terms substantially identical to the MSA settlement terms, for a maximum additional settlement amount of $9.4 million.
19
On October 3, 2017, WMT entered into two settlement agreements (collectively, the Second Settlement Agreements) with the Court-appointed attorneys representing plaintiffs in the MDL and JCCP. Under the terms of the Second Settlement Agreements, the parties agreed to settle 629 specifically identified CONSERVE®, DYNASTY® and LINEAGE® claims that meet the eligibility requirements of the Second Settlement Agreements and are either pending in the MDL or JCCP, or subject to court-approved tolling agreements in the MDL or JCCP, for a maximum settlement amount of $89.75 million. The comprehensive settlement amount is contingent on WMT’s recovery of new insurance proceeds totaling at least $35 million from applicable insurance carriers by March 30, 2018. To date, certain of the insurance carriers have contributed or agreed to contribute $20 million of funds applicable against the contingency.
Claims for personal injury have also been made against us associated with fractures of legacy Wright's PROFEMUR® long titanium modular neck product. We believe that the overall fracture rate for the product is low and the fractures appear, at least in part, to relate to patient demographics, and have been vigorously defending these matters. While continuing to dispute liability, we have been open to settling these claims in circumstances where we believe the settlement amount is reasonable relative to the risk and expense of litigation.
Our material product liability litigation is discussed in Note 16 to our consolidated financial statements. These matters are subject to many uncertainties and outcomes are not predictable. Regardless of the outcome of these matters, legal defenses are costly. We have incurred and expect to continue to incur substantial legal expenses in connection with the defense of these matters. We could incur significant liabilities associated with adverse outcomes that exceed our products liability insurance coverage, which could adversely affect our operating results or results from discontinued operations and financial condition. The ultimate cost to us with respect to product liability claims could be materially different than the amount of the current estimates and accruals and could have a material adverse effect on our financial position, operating results or results from discontinued operations, and cash flows.
In the future, we may be subject to additional product liability claims. We also could experience a material design or manufacturing failure in our products, a quality system failure, other safety issues, or heightened regulatory scrutiny that would warrant a recall of some of our products. Product liability lawsuits and claims, safety alerts and product recalls, regardless of their ultimate outcome, could result in decreased demand for our products, injury to our reputation, significant litigation and other costs, substantial monetary awards to or costly settlements with patients, product recalls, loss of revenue, and the inability to commercialize new products or product candidates, and otherwise have a material adverse effect on our business and reputation and on our ability to attract and retain customers.
Our obligation to settle substantially all the remaining outstanding metal-on-metal hip claims may be cancelled if an insufficient number of eligible claimants choose to participate, which would leave a substantial number of metal-on-metal hip claims unresolved.
Each of the Second Settlement Agreements contains a 95% opt-in requirement meaning WMT may terminate either Settlement Agreement prior to any settlement disbursement if claimants holding greater than 5% of eligible claims in Tranches 1 and 2, collectively, or claimants holding greater than 5% of eligible claims in Tranche 3, elect to “opt-out” of the settlement. We believe a participation rate of at least 95% is necessary in order to realize the benefits of the Second Settlement Agreements. On January 2, 2018, we received notification that 100% of the claimants in Tranches 1 and 2 opted in. We are currently reviewing proof of claim documentation for these claimants and have until March 2, 2018 to confirm that the 95% opt-in requirement has been met. Claimants in Tranche 3 have until April 2, 2018 to opt into the Second Settlement Agreements. If a 95% participation rate is not achieved with respect to both Settlement Agreements there is a significant risk the Second Settlement Agreements will be cancelled. If the Second Settlement Agreements are cancelled we will be required to continue defending the 629 claims that would otherwise be settled, and the previously disclosed risks, uncertainties and contingencies associated with these claims will remain unresolved.
Our obligation to settle substantially all the remaining outstanding metal-on-metal hip claims may be cancelled if the insurance recovery contingency contained in the Second Settlement Agreements is not satisfied, which would leave a substantial number of metal-on-metal hip claims unresolved.
Under the terms of the Second Settlement Agreements, the parties agreed to settle 629 specifically identified CONSERVE®, DYNASTY® and LINEAGE® claims that meet the eligibility requirements of the Second Settlement Agreements and are either pending in the MDL or JCCP, or subject to court-approved tolling agreements in the MDL or JCCP, for a maximum settlement amount of $89.75 million. The comprehensive settlement amount is contingent on WMT’s receiving new insurance proceeds totaling at least $35 million from applicable insurance carriers by March 30, 2018 and may be cancelled by us if this does not occur. To date, certain of the insurance carriers have contributed or agreed to contribute $20 million of funds applicable against the contingency. WMT may cancel its obligation to settle 541 claims included in Tranche 3 of the Second Settlement Agreements if the foregoing insurance recovery contingency is not satisfied in its entirety. If the obligation to settle these Tranche 3 claims is cancelled, we will be required to continue defending the Tranche 3 claims that would otherwise be settled in which case the previously disclosed risks, uncertainties and contingencies associated with these claims will remain unresolved.
Our agreement with the first three insurance carriers to settle pending coverage litigation includes broad releases of coverage for present and future claims of personal injury alleged to be caused by metal-on-metal hip components or the release of metal
20
ions, which could result in inadequate insurance coverage to defend and resolve these claims. In addition, our settlement with the three carriers does not resolve previously disclosed disputes with the remaining carriers concerning the extent of coverage available for metal-on-metal hip claims.
On October 28, 2016, our WMT and WMG subsidiaries entered into a Settlement Agreement with a subgroup of three insurance carriers, Columbia Casualty Company (Columbia), St. Paul Surplus Lines Insurance Company and AXIS Surplus Lines Insurance Company (Three Settling Insurers), pursuant to which the Three Settling Insurers paid $60 million (in addition to $10 million previously paid) in full settlement of all potential liability of the Three Settling Insurers for metal ion and metal-on-metal hip claims, including but not limited to all claims in the MDL and the JCCP. As part of the settlement, the Three Settling Insurers repurchased their policies in the five policy years beginning with the 2007-2008 policy year. Consequently, we have no further coverage from the Three Settling Insurers for present or future metal-on-metal or metal ion claims falling in these five policy periods, or any other period in which a specifically released claim is asserted.
Our existing product liability insurance coverage may be inadequate to protect us from any liabilities we might incur.
If the product liability claims brought against us involve uninsured liabilities or result in liabilities that exceed our insurance coverage, our business, financial condition, and operating results could be materially and adversely affected. Further, such product liability matters may negatively impact our ability to obtain insurance coverage or cost-effective insurance coverage in future periods. We remain in litigation with certain insurance carriers other than the Three Settling Insurers, concerning the amount of coverage available to satisfy potential liabilities associated with the metal-on-metal hip claims against us. An unfavorable outcome in this litigation could have an adverse effect on our financial condition and results from discontinued operations if we ultimately are subject to liabilities associated with these claims that exceed coverage amounts not in dispute.
In addition, on September 29, 2015, we received notice that the third insurance carrier in the tower for product liability insurance coverage relating to personal injury claims associated with fractures of legacy Wright’s PROFEMUR® long titanium modular neck product (Modular Neck Claims) has asserted that the terms and conditions identified in its reservation of rights will preclude coverage for the Modular Neck Claims. We strongly dispute the carrier’s position and, in accordance with the dispute resolution provisions of the policy, have initiated an arbitration proceeding in London, England seeking payment of these funds. We continue to believe our contracts with our insurance carriers are enforceable for these claims; however, we would be responsible for any amounts that our insurance carriers do not cover or for the amount by which ultimate losses exceed the amount of our third-party insurance coverage. An unfavorable outcome in this matter could have an adverse effect on our financial condition and results from discontinued operations if we ultimately are subject to liabilities associated with these claims that exceed coverage amounts not in dispute.
MicroPort’s recall of certain sizes of its cobalt chrome modular neck devices due to alleged fractures could result in additional product liability claims against us. Although we have contested these claims, adverse outcomes could harm our business and adversely affect our results from discontinued operations and financial condition.
In August 2015, MicroPort announced the voluntary recall of certain sizes of its PROFEMUR® Long Cobalt Chrome Modular Neck devices manufactured from June 15, 2009 to July 22, 2015. Because MicroPort did not acquire the OrthoRecon business until January 2014, many of the recalled devices were sold by legacy Wright prior to the acquisition by MicroPort. Under the asset purchase agreement with MicroPort, legacy Wright retained responsibility, as between it and MicroPort, for claims for personal injury relating to sales of these products prior to the acquisition. We were not consulted by MicroPort in connection with its recall, and we were aware of only twelve lawsuits alleging personal injury related to cobalt chrome neck fractures (four in the United States and eight outside the United States) as of December 31, 2017. However, if the number of product liability claims alleging personal injury from fractures of cobalt chrome modular necks we sold prior to the MicroPort transaction were to become significant, this could have an adverse effect on our results from discontinued operations and financial condition.
A competitor’s recall of its modular hip systems, and the liability claims and adverse publicity which ensued, could generate copycat claims against modular hip systems legacy Wright sold.
On July 6, 2012, Stryker Corporation announced the voluntary recall of its Rejuvenate Modular and ABG II modular neck hip stems citing risks including the potential for fretting and/or corrosion at or about the modular neck junction. Although Stryker’s recalled modular neck hip stems differ in design and material from the PROFEMUR® modular neck systems legacy Wright sold before divestiture of the OrthoRecon business, we have previously noted the risk that Stryker’s recall and the resultant publicity could negatively impact sales of modular neck systems of other manufacturers, including the PROFEMUR® system, and that Stryker’s action has increased industry focus on the safety of cobalt chrome modular neck products. We have carefully monitored the clinical performance of the PROFEMUR® modular neck hip system, which combine a cobalt chrome modular neck and a titanium stem. With over 33,000 units sold since this version was introduced in 2009, and an extremely low complaint rate, we remain confident in the safety and efficacy of this product. Nevertheless, in light of Stryker’s recall, the resulting product liability claims to which it has been subject, and the general negative publicity surrounding “metal-on-metal” articulating surfaces (which do not involve modular hip stems), there remains a risk that, even in the absence of clinical evidence, claims for personal injury relating to sales of these products before divestiture of the OrthoRecon business could increase, which could have an adverse
21
effect on our financial condition and results from discontinued operations since legacy Wright retained responsibility, as between it and MicroPort, for these claims.
Although we believe the use of corporate entities in our corporate structure will preclude creditors of any one particular entity within our corporate structure from reaching the assets of the other entities within our corporate structure not liable for the underlying claims of the one particular entity, there is a risk that, despite our corporate structure, creditors could be successful in piercing the corporate veil and reaching the assets of such other entities, which could have an adverse effect on us and our operating results, results from discontinued operations, and financial condition.
We maintain separate legal entities within our overall corporate structure. We believe our ring-fenced structure with separate legal entities should preclude any corporate veil-piercing, alter ego, control person, or other similar claims by creditors of any one particular entity within our corporate structure from reaching the assets of the other entities within our corporate structure to satisfy claims of the one particular entity. However, if a court were to disagree and allow a creditor to pierce the corporate veil and reach the assets of such other entities within our corporate structure, despite such entities not being liable for the underlying claims, it could have a material adverse effect on us and our operating results, results from discontinued operations, and financial condition.
If we lose any existing or future intellectual property lawsuits, a court could require us to pay significant damages or prevent us from selling our products.
The medical device industry is litigious with respect to patents and other intellectual property rights. Companies in the medical device industry have used intellectual property litigation to gain a competitive advantage.
We are party to claims and lawsuits involving patents or other intellectual property. Legal proceedings, regardless of the outcome, could drain our financial resources and divert the time and effort of our management. If we lose one of these proceedings, a court, or a similar foreign governing body, could require us to pay significant damages to third parties, indemnify third parties from loss, require us to seek licenses from third parties, pay ongoing royalties, redesign our products, or prevent us from manufacturing, using or selling our products. In addition to being costly, protracted litigation to defend or prosecute our intellectual property rights could result in our customers or potential customers deferring or limiting their purchase or use of the affected products until resolution of the litigation.
If our patents and other intellectual property rights do not adequately protect our products, we may lose market share to our competitors and be unable to operate our business profitably.
We rely on patents, trade secrets, copyrights, know-how, trademarks, license agreements, and contractual provisions to establish our intellectual property rights and protect our products. These legal means, however, afford only limited protection and may not completely protect our rights. In addition, we cannot be assured that any of our pending patent applications will issue. The U.S. Patent and Trademark Office may deny or require a significant narrowing of the claims in its pending patent applications and the patents issuing from such applications. Any patents issuing from the pending patent applications may not provide us with significant commercial protection. We could incur substantial costs in proceedings before the U.S. Patent and Trademark Office. These proceedings could result in adverse decisions as to the priority of our inventions and the narrowing or invalidation of claims in issued patents. In addition, the laws of some of the countries in which our products are or may be sold may not protect our intellectual property to the same extent as U.S. laws or at all. We also may be unable to protect our rights in trade secrets and unpatented proprietary technology in these countries.
In addition, we hold licenses from third parties that are necessary to utilize certain technologies used in the design and manufacturing of some of our products. The loss of such licenses would prevent us from manufacturing, marketing, and selling these products, which could harm our business. If we, or the other parties from whom we would license intellectual property, fail to obtain and maintain adequate patent or other intellectual property protection for intellectual property used in our products, or if any protection is reduced or eliminated, others could use the intellectual property used in our products, resulting in harm to our competitive business position.
We seek to protect our trade secrets, know-how, and other unpatented proprietary technology, in part, with confidentiality agreements with our employees, independent distributors, and consultants. We cannot be assured, however, that the agreements will not be breached, adequate remedies for any breach would be available, or our trade secrets, know-how, and other unpatented proprietary technology will not otherwise become known to or independently developed by our competitors.
We have a significant amount of indebtedness. We may not be able to generate enough cash flow from our operations to service our indebtedness, and we may incur additional indebtedness in the future, which could adversely affect our business, financial condition, and operating results.
We have a significant amount of indebtedness, including $395.0 million in aggregate principal with additional accrued interest under our 2.25% cash convertible senior notes due 2021 (2021 Notes) and $587.5 million in aggregate principal with additional accrued interest under WMG’s 2.00% cash convertible senior notes due 2020, which Wright Medical Group N.V. has guaranteed (2020 Notes, together with the 2021 Notes, the Notes) as of December 31, 2017. In addition, in December 2016, we entered into
22
a credit, security and guaranty agreement (ABL Credit Agreement) with Midcap Financial Trust and the additional lenders from time to time party thereto (ABL Lenders) which provides WMG and certain of our other wholly-owned U.S. subsidiaries with a $150.0 million senior secured asset based line of credit, subject to the satisfaction of a borrowing base requirement, and which may be increased by up to $100.0 million upon our request, subject to the consent of the ABL Lenders (ABL Facility). As of December 31, 2017, $53.6 million in aggregate principal plus additional accrued interest was outstanding under the ABL Facility.
Our ability to make payments on, and to refinance, our indebtedness, including the Notes and amounts borrowed under the ABL Facility, and our ability to fund planned capital expenditures, contractual cash obligations, research and development efforts, working capital, acquisitions, and other general corporate purposes depends on our ability to generate cash in the future. This, to a certain extent, is subject to general economic, financial, competitive, legislative, regulatory, and other factors, some of which are beyond our control. If we do not generate sufficient cash flow from operations or if future borrowings are not available to us in an amount sufficient to pay our indebtedness, including payments of principal upon conversion of outstanding Notes or on their respective maturity dates or in connection with a transaction involving us that constitutes a fundamental change under the respective indenture governing the Notes, or to fund our liquidity needs, we may be forced to refinance all or a portion of our indebtedness on or before the maturity dates thereof, sell assets, reduce or delay capital expenditures, seek to raise additional capital, or take other similar actions. We may not be able to execute any of these actions on commercially reasonable terms or at all. Our ability to refinance our indebtedness will depend on our financial condition at the time, the restrictions in the instruments governing our indebtedness, and other factors, including market conditions. In addition, in the event of a default under the Notes or under the ABL Facility, the holders and/or the trustee under the indentures governing the Notes or the lenders under the ABL Facility may accelerate payment obligations under the Notes and/or the amounts borrowed under the ABL Facility, respectfully, which could have a material adverse effect on our business, financial condition, and operating results. In addition, the Notes and ABL Facility contain cross default provisions. Our inability to generate sufficient cash flow to satisfy our debt service obligations, or to refinance or restructure our obligations on commercially reasonable terms or at all, would likely have an adverse effect, which could be material, on our business, financial condition, and operating results.
In addition, our significant indebtedness, combined with our other financial obligations and contractual commitments, could have other important consequences. For example, it could:
• | make us more vulnerable to adverse changes in general U.S. and worldwide economic, industry, and competitive conditions and adverse changes in government regulation; |
• | limit our flexibility in planning for, or reacting to, changes in our business and our industry; |
• | restrict our ability to make strategic acquisitions or dispositions or to exploit business opportunities; |
• | place us at a competitive disadvantage compared to our competitors who have less debt; and |
• | limit our ability to borrow additional amounts for working capital, capital expenditures, contractual obligations, research and development efforts, acquisitions, debt service requirements, execution of our business strategy, or other purposes. |
Any of these factors could materially and adversely affect our business, financial condition, and operating results. In addition, we may incur additional indebtedness, and if we do, the risks related to our business and our ability to service our indebtedness would increase.
In addition, under our Notes, we are required to offer to repurchase the Notes upon the occurrence of a fundamental change, which could include, among other things, any acquisition of ours for consideration other than publicly traded securities. The repurchase price must be paid in cash, and this obligation may have the effect of discouraging, delaying, or preventing an acquisition of ours that would otherwise be beneficial to our security holders.
With respect to the 2021 Notes which have been issued by Wright Medical Group N.V., we are dependent on the cash flow of, and dividends and distributions to us from, our subsidiaries in order to service our indebtedness under these Notes. Our subsidiaries are separate and distinct legal entities and have no obligation, contingent or otherwise, to pay any amounts due pursuant to any indebtedness of ours or to make any funds available therefor, except for those subsidiaries that have guaranteed our obligations under our outstanding indebtedness. The ability of our subsidiaries to pay any dividends and distributions will be subject to, among other things, the terms of any debt instruments of our subsidiaries then in effect as well as among other things, the availability of profits or funds and requirements of applicable laws, including surplus, solvency and other limits imposed on the ability of companies to pay dividends. There can be no assurance that our subsidiaries will generate cash flow sufficient to pay dividends or distributions to us that enable us to pay interest or principal on our existing indebtedness.
A failure to comply with the covenants and other provisions of the indentures governing the Notes or the ABL Credit Agreement could result in events of default under such indentures or ABL Credit Agreement, especially in light of the cross default provisions, which could require the immediate repayment of our outstanding indebtedness. If we are at any time unable to generate sufficient cash flows from operations to service our indebtedness when payment is due, we may be required to attempt to renegotiate the terms of the indentures, the ABL Credit Agreement and other agreements relating to the indebtedness, seek to refinance all or a portion of the indebtedness, or obtain additional financing. There can be no assurance that we will be able to successfully renegotiate
23
such terms, that any such refinancing would be possible, or that any additional financing could be obtained on terms that are favorable or acceptable to us.
The terms of the ABL Credit Agreement could limit our ability to conduct our business, take advantage of business opportunities and respond to changing business, market, and economic conditions.
Our ABL Credit Agreement includes a number of significant financial and operating restrictions. For example, the ABL Credit Agreement contains financial covenants that, among other things, require us to maintain minimum liquidity and achieve certain revenue thresholds and contains provisions that restrict our ability, subject to specified exceptions, to, among other things:
• | make loans and investments, including acquisitions and transactions with affiliates; |
• | create liens or other encumbrances on our assets; |
• | dispose of assets; |
• | enter into contingent obligations; |
• | engage in mergers or consolidations; and |
• | pay dividends. |
Due to the terms of the ABL Credit Agreement, we may be unable to comply with these covenants, which could result in a default under the ABL Facility. In addition, these provisions may limit our ability to conduct our business, take advantage of business opportunities, and respond to changing business, market, and economic conditions. In addition, they may place us at a competitive disadvantage relative to other companies that may be subject to fewer, if any, restrictions or may otherwise adversely affect our business. Transactions that we may view as important opportunities, such as significant acquisitions, may be subject to the consent of the ABL Lenders, which consent may be withheld or granted subject to conditions specified at the time that may affect the attractiveness or viability of the transaction.
The ABL Facility involves additional risks that may adversely affect our liquidity, results of operations, and financial condition.
Availability under the ABL Credit Agreement is based on the amount of certain eligible receivables, eligible equipment, eligible inventory and eligible surgical instrumentation less specified reserves as described in Note 9 to our consolidated financial statements. As a result, our access to credit under the ABL Facility is potentially subject to fluctuations depending on the value of the eligible assets in the borrowing base as of any valuation date. Our inability to borrow additional amounts under the ABL Facility may adversely affect our liquidity, results of operations, and financial condition. In addition, all payments on our accounts receivable are required under the ABL Credit Agreement to be directed to deposit accounts under the control of the ABL Facility lenders for application to amounts outstanding under the ABL Facility. The lenders may exercise control over such amounts when they are entitled to exercise default remedies, which may adversely affect our ability to fund our operations.
Our outstanding indebtedness under the ABL Facility bears interest at variable rates, which subjects us to interest rate risk and could increase the cost of servicing our indebtedness. The impact of increases in interest rates could be more significant for us than it would be for some other companies because of our indebtedness, thereby affecting our profitability. In the event of a default under any of our debt instruments, the lenders under the ABL Facility may terminate their commitments to lend additional money and declare all amounts outstanding thereunder to be immediately due and payable. Additionally, a default under the ABL Facility could result in a cross-default under the Notes. While an event of default is continuing under the ABL Credit Agreement the lenders thereunder may elect to increase the rates at which interest accrues. Subject to certain exceptions, amounts outstanding under the ABL Facility are secured by a senior first priority security interest in substantially all existing and after-acquired assets of our company and each borrower. Accordingly, under certain circumstances, the lenders under the ABL Facility could seek to enforce security interests in our assets securing our indebtedness under the ABL Facility, including restricting our access to collections on our accounts receivable. Any acceleration of amounts due under our ABL Credit Agreement or the exercise by the lenders thereto of their rights under the security documents, would have a material adverse effect on us. In addition, the ABL Facility is subject to market deterioration or other factors that could jeopardize the counterparty obligations of one or more of the ABL Lenders, which could have an adverse effect on our business if we are not able to replace such ABL Facility or find other sources of liquidity on acceptable terms.
Hedge and warrant transactions entered into in connection with the issuance of our Notes may affect the value of our ordinary shares.
In connection with the issuance of the Notes, we entered into hedge transactions with various financial institutions with the objective of reducing the potential dilutive effect of issuing our ordinary shares upon conversion of the Notes and the potential cash outlay from the cash conversion of the Notes. We also entered into separate warrant transactions with the same financial institutions.
In connection with the hedge and warrant transactions associated with the Notes, these financial institutions purchased our ordinary shares in secondary market transactions and entered into various over-the-counter derivative transactions with respect to our ordinary shares. These entities or their affiliates are likely to modify their hedge positions from time to time prior to conversion or maturity of the Notes by purchasing and selling our ordinary shares, other of our securities, or other instruments they may wish to use in connection with such hedging. Any of these transactions and activities could adversely affect the value of our ordinary
24
shares and, as a result, the number and value of the ordinary shares holders will receive upon conversion of the Notes. In addition, subject to movement in the price of our ordinary shares, if the hedge transactions settle in our favor, we could be exposed to credit risk related to the other party with respect to the payment we are owed from such other party. If any of the participants in the hedge transactions is unwilling or unable to perform its obligations for any reason, we would not be able to receive the benefit of such transaction. We cannot provide any assurances as to the financial stability or viability of any of the participants in the hedge transactions.
Rating agencies may provide unsolicited ratings on the Notes or the ABL Credit Agreement that could reduce the market value or liquidity of our ordinary shares.
We have not requested a rating of the Notes or the ABL Credit Agreement from any rating agency and we do not anticipate that the Notes or the ABL Credit Agreement will be rated. However, if one or more rating agencies independently elects to rate the Notes or the ABL Credit Agreement and assigns the Notes or the ABL Credit Agreement a rating lower than the rating expected by investors, or reduces such rating in the future, the market price or liquidity of the Notes or the ABL Credit Agreement and our ordinary shares could be harmed. Should a decline in the market price of the Notes, as compared to the price of our ordinary shares occur, this may trigger the right of the holders of the Notes to convert such notes into cash and our ordinary shares, as applicable.
We likely will need additional financing to satisfy our anticipated future liquidity requirements or to make opportunistic acquisitions, which financing may not be available on favorable terms at the time it is needed and which could reduce our operational and strategic flexibility.
Although it is difficult for us to predict our future liquidity requirements, we believe that our cash and cash equivalents balance of approximately $167.7 million, together with $96.4 million in availability under our ABL Facility as of December 31, 2017, will be sufficient for the next 12 months to fund our working capital requirements and operations, permit anticipated capital expenditures in 2018 of approximately $55 million, pay retained metal-on-metal product and other liabilities of the OrthoRecon business, including without limitation amounts under the MSA and Second Settlement Agreements, net of insurance recoveries, fund contingent consideration including without limitation the up to $42 million CVR milestone payment, and meet our other anticipated contractual cash obligations in 2018. We may face liquidity challenges during the next few years in light of anticipated significant contingent liabilities and financial obligations and commitments, including among others, acquisition-related contingent consideration payments, payments related to our outstanding indebtedness, and costs and payments related to pending litigation.
In the event that we would require additional working capital to fund future operations, we could seek to acquire that through borrowings under the additional $100.0 million that may be available under the ABL Facility or additional equity or debt financing arrangements which may or may not be available on favorable terms at such time. If we raise additional funds by issuing equity securities, our shareholders may experience dilution. Additional debt financing, if available, may involve additional covenants restricting our operations or our ability to incur additional debt, in addition to those under our existing indentures and the ABL Credit Agreement. Any additional debt financing or additional equity that we raise may contain terms that are not favorable to us or our shareholders. If we do not have, or are not able to obtain, sufficient funds, we may not be able to develop or enhance our products, execute our business plan, take advantage of future opportunities, or respond to competitive pressures or unanticipated customer requirements or we may have to delay development or commercialization of our products or scale back our operations.
If we lose one of our key suppliers, we may be unable to meet customer orders for our products in a timely manner or within our budget, which could adversely affect our sales and operating results.
We rely on a limited number of suppliers for certain of the components and materials used in our products. Our reconstructive joint devices are produced from various surgical grades of titanium, cobalt chrome, stainless steel, various grades of high-density polyethylenes and ceramics. We rely on one source to supply us with a certain grade of cobalt chrome alloy, one supplier for the silicone elastomer used in some of our extremities products, and one supplier for our pyrocarbon products, and one supplier to provide a key ingredient of AUGMENT® Bone Graft. The manufacture of our products is highly exacting and complex, and our business could suffer if a sole source supply arrangement is unexpectedly terminated or interrupted, and we are unable to obtain an acceptable new source of supply in a timely fashion.
In April 2016, we entered into a commercial supply agreement with FUJIFILM Diosynth Biotechnologies U.S.A., Inc. pursuant to which Fujifilm agreed to manufacture and sell to us and we agreed to purchase recombinant human platelet-derived growth factor (rhPDGF-BB) for use in AUGMENT® Bone Graft. The agreement reflects the culmination of a technology transfer from our former supplier to Fujifilm which began in December 2013 when we were notified that our former supplier was exiting the rhPDGF-BB business. Pursuant to our supply agreement with Fujifilm, commercial production of rhPDGF-BB is expected to begin in 2019. Although we believe that our current supply of rhPDGF-BB from our former supplier should be sufficient to last until after rhPDGF-BB becomes available under the new agreement, no assurance can be provided that it will be sufficient. In addition, since Fujifilm has not previously manufactured rhPDGF-BB, its ability to do so and perform its obligations under the agreement are not yet fully proven.
25
Our biologic product line includes a single sourced supplier for our GRAFTJACKET® family of soft tissue repair and graft containment products. In addition, certain biologic products depend upon a single supplier as our source for DBM and cancellous bone matrix (CBM), and any failure to obtain DBM and CBM from this source in a timely manner will deplete levels of on-hand raw materials inventory and could interfere with our ability to process and distribute allograft products. We rely on a single not-for-profit tissue bank to meet all of our DBM and CBM order requirements, a key component in the allograft products we currently produce, market, and distribute. In addition, we rely on a single supplier of soft tissue graft for BIOTAPE® XM.
We cannot be sure that our supply of DBM, CBM and soft tissue graft for BIOTAPE® XM will continue to be available at current levels or will be sufficient to meet our needs, or that future suppliers of DBM, CBM, and soft tissue graft for BIOTAPE® XM will be free from FDA regulatory action impacting their sale of DBM, CBM and soft tissue graft for BIOTAPE® XM. As there are a small number of suppliers, if we cannot continue to obtain DBM, CBM, and soft tissue graft for BIOTAPE® XM from our current sources in volumes sufficient to meet our needs, we may not be able to locate replacement sources of DBM, CBM, and soft tissue graft for BIOTAPE® XM on commercially reasonable terms, if at all. This could interrupt our business, which could adversely affect our sales.
Suppliers of raw materials and components may decide, or be required, for reasons beyond our control to cease supplying raw materials and components to us. FDA regulations may require additional testing of any raw materials or components from new suppliers prior to our use of these materials or components, and in the case of a device with a PMA application, we may be required to obtain prior FDA permission, either of which could delay or prevent our access to or use of such raw materials or components.
We incur significant expenditures of resources to maintain relatively high levels of instruments and we historically have had a high level of inventory, which can adversely affect our operating results and reduce our cash flows.
The nature of our business requires us to maintain a certain level of instruments since in order to market effectively we often must maintain and bring our customers instrument kits. In addition, we historically have maintained extra inventory in the form of back-up products and products of different size in order to ensure that our customers have the right products when they need them. This practice has resulted in us maintaining a relatively high level of inventory, which can adversely affect our operating results and reduce our cash flows. In addition, to the extent that a substantial portion of our inventory becomes obsolete, it could have a material adverse effect on our earnings and cash flows due to the resulting costs associated with inventory impairment charges and costs required to replace such inventory.
From time to time, we may experience inventory shortages of some of our higher demand products, which could adversely affect our net sales and operating results.
From time to time, internal or external supply constraints may create temporary shortages of certain of our higher demand products. While these shortages are likely to be temporary and are usually resolved, no assurance can be provided that such inventory shortages will not occur in the future, and if they occur, would not adversely affect our future net sales and operating results.
If we fail to compete successfully in the future against our existing or potential competitors, our sales and operating results may be negatively affected, and we may not achieve future growth.
The markets for our products are highly competitive and subject to rapid and profound technological change. Our success depends, in part, on our ability to maintain a competitive position in the development of technologies and products for use by our customers. Many of the companies developing or marketing competitive products enjoy several competitive advantages over us, including greater financial and human resources for product development and sales and marketing; greater name recognition; established relationships with surgeons, hospitals and third-party payors; broader product lines and the ability to offer rebates or bundle products to offer greater discounts or incentives to gain a competitive advantage; and established sales and marketing and distribution networks. Some of our competitors have indicated an increased focus on the extremities and biologics markets, which are our primary strategic focus. Our competitors may develop and patent processes or products earlier than us, obtain regulatory clearances or approvals for competing products more rapidly than us, develop more effective or less expensive products or technologies that render our technology or products obsolete or non-competitive or acquire technologies and technology licenses complementary to our products or advantageous to our business, which could adversely affect our business and operating results. Not all of our sales and other personnel have non-compete agreements. We also compete with other organizations in recruiting and retaining qualified scientific, sales, and management personnel. If our competitors are more successful than us in these matters, we may be unable to compete successfully against our existing or future competitors. In addition, the orthopaedic industry has been subject to increasing consolidation recently and over the last few years. Consolidation in our industry not involving our company could result in existing competitors increasing their market share through business combinations and result in stronger competitors, which could have a material adverse effect on our business, financial condition, and operating results. We may be unable to compete successfully in an increasingly consolidated industry and cannot predict with certainty how industry consolidation will affect our competitors or us.
If we are unable to continue to develop and market new products and technologies, we may experience a decrease in demand for our products, or our products could become obsolete, and our business would suffer.
26
We are continually engaged in product development and improvement programs, and new products represent a significant component of our sales growth rate. We may be unable to compete effectively with our competitors unless we can keep up with existing or new products and technologies in the orthopaedic market. If we do not continue to introduce new products and technologies, or if those products and technologies are not accepted, we may not be successful. Moreover, research and development efforts may require a substantial investment of time and resources before we are adequately able to determine the commercial viability of a new product, technology, material, or innovation. Demand for our products also could change in ways we may not anticipate due to evolving customer needs, changing demographics, slow industry growth rates, declines in the extremities and biologics market, the introduction of new products and technologies, evolving surgical philosophies, and evolving industry standards, among others. Additionally, our competitors’ new products and technologies may beat our products to market, may be more effective or less expensive than our products, or may render our products obsolete. Our new products and technologies also could render our existing products obsolete and thus adversely affect sales of our existing products and lead to increased expense for excess and obsolete inventory.
Our business plan relies on certain assumptions about the markets for our products, which, if incorrect, may adversely affect our business and operating results.
We believe that the aging of the general population and increasingly active lifestyles will continue and that these trends will increase the need for our extremities and biologics products. The projected demand for our products could materially differ from actual demand if our assumptions regarding these trends and acceptance of our products by the medical community prove to be incorrect or do not materialize, or if non-surgical treatments gain more widespread acceptance as a viable alternative to orthopaedic implants.
We are subject to substantial government regulation that could have a material adverse effect on our business.
The production and marketing of our products and our ongoing research and development, pre-clinical testing, and clinical trial activities are subject to extensive regulation and review by numerous governmental authorities both in the United States and abroad. U.S. and foreign regulations govern the testing, marketing, registration and sale of medical devices, in addition to regulating manufacturing practices, reporting, labeling, relationships with healthcare professionals, and recordkeeping procedures. The regulatory process requires significant time, effort, and expense to bring our products to market, and we cannot be assured that any of our products will be approved. Our failure to comply with applicable regulatory requirements could result in governmental authorities:
• | imposing fines and penalties on us; |
• | preventing us from manufacturing or selling our products; |
• | bringing civil or criminal charges against us and our officers and employees; |
• | delaying the introduction of our new products into the market; |
• | recalling or seizing our products; or |
• | withdrawing or denying approvals or clearances for our products. |
Even if regulatory approval or clearance of a product is granted, this could result in limitations on the uses for which the product may be labeled and promoted. Further, for a marketed product, its manufacturer, such manufacturer’s suppliers, and manufacturing facilities are subject to periodic review and inspection. Subsequent discovery of problems with a product, manufacturer, or facility may result in restrictions on the product, manufacturer or facility, including withdrawal of the product from the market or other enforcement actions. Our products can only be marketed in accordance with their approved labeling. If we were to promote the use of our products in an “off-label” manner, we and our directors, officers and employees, would be subject to civil and criminal sanctions.
We are subject to various U.S. federal and state and foreign laws concerning healthcare fraud and abuse, including false claims laws, anti-kickback laws and physician self-referral laws. Violations of these laws can result in criminal and/or civil punishment, including fines, imprisonment and, in the United States, exclusion from participation in government healthcare programs. Greater scrutiny of marketing practices in our industry has resulted in numerous government investigations by various government authorities and this industry-wide enforcement activity is expected to continue. If a governmental authority were to determine that we do not comply with these laws and regulations, then we and our directors, officers and employees could be subject to criminal and civil penalties, including exclusion from participation in U.S. federal healthcare reimbursement programs.
In order to market our devices in the member countries of the European Union, we are required to comply with the European Medical Devices Directive and obtain CE mark certification. CE mark certification is the European symbol of adherence to quality assurance standards and compliance with applicable European Medical Device Directives. Under the European Medical Devices Directive, all medical devices including active implants must qualify for CE marking. Our failure to comply with the European Medical Devices Directive could result in our loss of CE mark certification which would harm our business. In 2017, the European Commission adopted the Medical Devices Regulation, which will replace the European Medical Devices Directive and will be implemented starting in 2020. The Medical Devices Regulation will impose additional and/or more stringent approval requirements on medical device manufacturers. These new rules and procedures may result in increased regulatory oversight of any future
27
devices that we may develop and may increase the costs, time and requirements that need to be met in order to maintain or place devices in the member countries of the European Union. In addition, we anticipate having to expend significant time, costs and resources to comply with the new European Medical Devices Directive.
Failure to comply with the U.S. Foreign Corrupt Practices Act or other anticorruption laws could subject us to, among other things, penalties and legal expenses that could harm our reputation and have a material adverse effect on our business, operating results and financial condition.
Our international operations expose us to legal and regulatory risks. These risks include the risk that our international distributors could engage in conduct violative of U.S. or local laws, including the U.S. Foreign Corrupt Practices Act (FCPA). Our U.S. operations, including those of our U.S. operating subsidiaries, are subject to the FCPA, which generally prohibits covered entities and their intermediaries from engaging in bribery or making other prohibited payments to foreign officials for the purpose of obtaining or retaining business or other benefits. In addition, the FCPA imposes accounting standards and requirements on publicly-traded U.S. corporations and their foreign affiliates, which are intended to prevent the diversion of corporate funds to the payment of bribes and other improper payments, and to prevent the establishment of “off books” slush funds from which such improper payments can be made. We also are subject to similar anti-corruption legislation implemented in Europe under the Organization for Economic Co-operation and Development’s Convention on Combating Bribery of Foreign Public Officials in International Business Transactions. We either operate or plan to operate in a number of jurisdictions that pose a high risk of potential violations of the FCPA and other anti-corruption laws, and we utilize a number of third-party sales representatives for whose actions we could be held liable under the FCPA. We inform our personnel and third-party sales representatives of the requirements of the FCPA and other anti-corruption laws, including, but not limited to their reporting requirements. We also have developed and will continue to develop and implement systems for formalizing contracting processes, performing due diligence on agents, and improving our recordkeeping and auditing practices regarding these regulations. However, there is no guarantee that our employees, third-party sales representatives, or other agents have not or will not engage in conduct undetected by our processes and for which we might be held responsible under the FCPA or other anti-corruption laws. Failure to comply with the FCPA or other anti-corruption laws could subject us to, among other things, penalties and legal expenses that could harm our reputation and have a material adverse effect on our business, financial condition, and operating results.
If our employees, third-party sales representatives, or other agents are found to have engaged in such practices, we could suffer severe penalties, including criminal and civil penalties, disgorgement, and other remedial measures, including further changes or enhancements to our procedures, policies and controls, as well as potential personnel changes and disciplinary actions. Recent investigations of companies in our industry by the SEC and the U.S. Department of Justice have focused on potential FCPA violations in connection with the sale of medical devices in foreign countries. We believe we have compliance systems, which enable us to prevent these behaviors. However, if despite our efforts we are not successful in mitigating these risks, we could become the target of enforcement actions by U.S. or local authorities. Any investigation of any potential violations of the FCPA or other anti-corruption laws by U.S. or foreign authorities could have a material adverse effect on our business, operating results, and financial condition.
Certain foreign companies, including some of our competitors, are not subject to prohibitions as strict as those under the FCPA or, even if subjected to strict prohibitions, such prohibitions may be laxly enforced in practice. If our competitors engage in corruption, extortion, bribery, pay-offs, theft, or other fraudulent practices, they may receive preferential treatment from personnel of some companies, giving our competitors an advantage in securing business, or from government officials, who might give them priority in obtaining new licenses, which would put us at a disadvantage.
Although our Corporate Integrity Agreement expired, if we were found to have breached it, we may be subject to criminal prosecution and/or exclusion from U.S. federal healthcare programs.
On September 29, 2010, Wright Medical Technology, Inc. entered into a 12-month Deferred Prosecution Agreement with the United States Attorney’s Office for the District of New Jersey (USAO). On September 15, 2011, WMT reached an agreement with the USAO and the OIG-HHS under which WMT voluntarily agreed to extend the term of its the Deferred Prosecution Agreement for 12 months. On October 4, 2012, the USAO issued a press release announcing that the amended Deferred Prosecution Agreement expired on September 29, 2012, that the USAO had moved to dismiss the criminal complaint against WMT because WMT had fully complied with the terms of the Deferred Prosecution Agreement, and that the court had ordered dismissal of the complaint on October 4, 2012. On September 29, 2010, WMT also entered into a five-year Corporate Integrity Agreement with the Office of the Inspector General of the United States Department of Health and Human Services. The CIA was filed as Exhibit 10.2 to legacy Wright’s Current Report on Form 8-K filed on September 30, 2010. The CIA expired on September 29, 2015 and on January 27, 2016, we received notification from the OIG-HHS that the term of the CIA has concluded. While the term of the CIA has concluded, our failure to continue to maintain compliance with U.S. healthcare laws, regulations and other requirements in the future could expose us to significant liability, including, but not limited to, exclusion from federal healthcare program participation, including Medicaid and Medicare, potential prosecution, civil and criminal fines or penalties, as well as additional litigation cost and expense, which would have a material adverse effect on our financial condition, operating results and cash flows.
28
Allegations of wrongdoing by the United States Department of Justice and Office of the Inspector General of the United States Department of Health and Human Services and related publicity could lead to further governmental investigations or actions by other third parties.
As a result of the allegations of wrongdoing made by the United States Attorney’s Office for the District of New Jersey and the publicity surrounding legacy Wright’s settlement with the United States Department of Justice and OIG-HHS, and amendments to the Deferred Prosecution Agreement and Corporate Integrity Agreement, other governmental agencies, including state authorities, could conduct investigations or institute proceedings that are not precluded by the terms of settlements reflected in the Deferred Prosecution Agreement and the CIA. In August 2012, legacy Wright received a subpoena from the United States Attorney’s Office for the Western District of Tennessee requesting records and documentation relating to the PROFEMUR® series of hip replacement devices for the period from January 1, 2000 to August 2, 2012. These interactions with the authorities could increase our exposure to lawsuits by potential whistleblowers, including under the U.S. Federal False Claims Act, based on new theories or allegations arising from the allegations made by the United States Attorney’s Office for the District of New Jersey. The costs of defending or resolving any such investigations or proceedings could have a material adverse effect on our financial condition, operating results and cash flows.
Modifications to our marketed devices may require FDA regulatory clearances or approvals or require us to cease marketing or recall the modified devices until such additional clearances or approvals are obtained.
The FDA requires device manufacturers to make a determination of whether or not a modification to a cleared and commercialized medical device requires a new approval or clearance. However, the FDA can review a manufacturer’s decision not to submit for additional approvals or clearances. Any modification to an FDA approved or cleared device that would significantly affect its safety or efficacy or that would constitute a major change in its intended use would require a new PMA or 510(k) clearance and could be considered misbranded if the modified device is commercialized and such additional approval or clearance was not obtained. We cannot assure you that the FDA will agree with our decisions not to seek approvals or clearances for particular device modifications or that we will be successful in obtaining additional approvals or 510(k) clearances for modifications.
We obtained 510(k) premarket clearance for certain devices we market or marketed in the United States. We have subsequently modified some of those devices or device labeling since obtaining 510(k) clearance under the view that these modifications did not significantly affect the safety or efficacy of the device, and did not require new approvals or clearances. If the FDA disagrees with our decisions and requires us to obtain additional premarket approvals or 510(k) clearances for any modifications to our products and we fail to obtain such approvals or clearances or fail to secure approvals or clearances in a timely manner, we may be required to cease manufacturing and marketing the modified device or to recall such modified device until we obtain FDA approval or clearance and we may be subject to significant regulatory fines or penalties.
The European Union and many of its world markets rely on the CE Mark as the path to market our products. Our loss of the CE Mark would adversely affect our business and operating results.
In order to market our devices in the member countries of the European Union (EU), we are required to comply with the European Medical Devices Directive, which requires our devices to meet specific quality program criteria and technical documentation standards, before obtaining the CE Mark certification that is required to market our products in the EU. Additionally, the European Medical Device Directive requires that many of our products that bear the CE-Mark be supported by post-market clinical data. We are in the process of implementing systems and procedures to control this activity in order to comply with these requirements, including establishing contractual relationships with the healthcare provider clinical study sites in accordance with our internal compliance requirements. We intend to obtain the needed clinical data to support our marketed products, but there can be no assurance that European regulators will accept the results. Our failure to comply with the European Medical Devices Directive could result in our failure to obtain CE Mark certification for new devices or our loss of existing device CE mark certification, either of which could have a material adverse effect on us and our business.
In March 2017, the European Commission adopted the Medical Devices Regulation, which will replace the European Medical Devices Directive and will be implemented starting in 2020. The Medical Devices Regulation will impose additional and/or more stringent approval requirements on medical device manufacturers. These new rules and procedures may result in increased regulatory oversight of any future devices that we may develop and may increase the costs, time and requirements that need to be met in order to maintain or place devices in the member countries of the European Union. Additionally, we anticipate having to expend significant time, costs and resources to comply with the Medical Devices Regulation.
Our biologics business is subject to emerging governmental regulations that can significantly impact our business.
The FDA has statutory authority to regulate allograft-based products, processing, and materials. The FDA, European Union and Health Canada have been working to establish more comprehensive regulatory frameworks for allograft-based, tissue-containing products, which are principally derived from cadaveric tissue. The framework developed by the FDA establishes risk-based criteria for determining whether a particular human tissue-based product will be classified as human tissue, a medical device, or biologic drug requiring 510(k) clearance or PMA approval. All tissue-based products are subject to extensive FDA regulation, including
29
establishment of registration requirements, product listing requirements, good tissue practice requirements for manufacturing, and screening requirements that ensure that diseases are not transmitted to tissue recipients. The FDA has also proposed extensive additional requirements addressing sub-contracted tissue services, traceability to the recipient/patient, and donor records review. If a tissue-based product is considered human tissue, FDA requirements focus on preventing the introduction, transmission, and spread of communicable diseases to recipients. Clinical data or review of safety and efficacy is not required before the tissue can be marketed. However, if tissue is considered a medical device or biologic drug, then FDA clearance or approval is required.
Additionally, our biologics business involves the procurement and transplantation of allograft tissue, which is subject to federal regulation under the NOTA. NOTA prohibits the sale of human organs, including bone and other human tissue, for valuable consideration within the meaning of NOTA. NOTA permits the payment of reasonable expenses associated with the transportation, processing, preservation, quality control, and storage of human tissue. We currently charge our customers for these expenses. In the future, if NOTA is amended or reinterpreted, we may not be able to charge these expenses to our customers, and, as a result, our business could be adversely affected.
Our principal allograft-based biologics offerings include ALLOMATRIX®, GRAFTJACKET® and IGNITE® products.
Our business could suffer if the medical community does not continue to accept allograft technology.
New allograft products, technologies, and enhancements may never achieve broad market acceptance due to numerous factors, including:
• | lack of clinical acceptance of allograft products and related technologies; |
• | the introduction of competitive tissue repair treatment options that render allograft products and technologies too expensive and obsolete; |
• | lack of available third-party reimbursement; |
• | the inability to train surgeons in the use of allograft products and technologies; |
• | the risk of disease transmission; and |
• | ethical concerns about the commercial aspects of harvesting cadaveric tissue. |
Market acceptance also will depend on the ability to demonstrate that existing and new allograft products and technologies are attractive alternatives to existing tissue repair treatment options. To demonstrate this, we rely upon surgeon evaluations of the clinical safety, efficacy, ease of use, reliability, and cost effectiveness of our tissue repair options and technologies. Recommendations and endorsements by influential surgeons are important to the commercial success of allograft products and technologies. In addition, several countries, notably Japan, prohibit the use of allografts. If allograft products and technologies are not broadly accepted in the marketplace, we may not achieve a competitive position in the market.
We are dependent on various information technology systems, and failures of, interruptions to, or unauthorized tampering of those systems could have a material adverse effect on our business.
We rely extensively on information technology systems to conduct business. These systems include, but are not limited to, ordering and managing materials from suppliers, converting materials to finished products, shipping products to customers, processing transactions, summarizing and reporting results of operations, complying with regulatory, legal or tax requirements, and providing data security and other processes necessary to manage our business. Since the Wright/Tornier merger and through the end of 2016, we have consolidated into one enterprise resource planning (ERP) system in three of our top five international markets, and we plan to continue our ERP system roll-outs in the future. We may experience difficulties in our business operations, or difficulties in operating our business under the ERP, either of which could disrupt our operations, including our ability to timely ship and track product orders, project inventory requirements, manage our supply chain, and otherwise adequately service our customers, and lead to increased costs and other difficulties. In the event we experience significant disruptions as a result of the ERP implementation or otherwise, we may not be able to fix our systems in an efficient and timely manner. Accordingly, such events may disrupt or reduce the efficiency of our entire operations and have a material adverse effect on our operating results and cash flows.
In addition, if our systems are damaged or cease to function properly due to any number of causes, ranging from catastrophic events to power outages to security breaches, and our business continuity plans do not effectively compensate timely, we may suffer interruptions in our ability to manage operations. Increased global cybersecurity vulnerabilities, threats and more sophisticated and targeted cybersecurity attacks pose a risk to the security of our systems and networks and those of our customers, suppliers and third-party service providers, and the confidentiality, availability and integrity of any underlying information and data. There can be no assurance that our protective measures will prevent or detect security breaches that could have a significant impact on our business, reputation, operating results and financial condition. The failure of these systems to operate or integrate effectively with other internal, customer, supplier or third-party service provider systems and to protect the underlying information technology system and data integrity, including from cyber-attacks, intrusions or other breaches or unauthorized access of these systems, or any failure by us to remediate any such attacks or breaches, may also result in damage to our reputation or competitiveness, delays in product fulfillment and reduced efficiency of our operations, and could require significant capital
30
investments to remediate any such failure, problem or breach, all of which could adversely affect our business, operating results and financial condition.
Our inability to maintain effective internal controls could cause investors to lose confidence in our reported financial information.
Effective internal controls are necessary for us to provide reliable and accurate financial reports and to effectively prevent fraud. The integration of combined or acquired businesses is likely to result in our systems and controls becoming increasingly complex and more difficult to manage. We devote significant resources and time to comply with the internal control over financial reporting requirements of the Sarbanes-Oxley Act of 2002. However, we cannot be certain that these measures will ensure that we design, implement, and maintain adequate control over our financial processes and reporting in the future, especially in light of anticipated changes in accounting standards and in the context of acquisitions of other businesses.
In the fourth quarter of 2016, we identified a material weakness in our internal control over financial reporting related to information technology general controls. Although we remediated this material weakness during the third quarter of 2017 and concluded that our internal control over financial reporting is effective and have taken additional measures to improve our control environment, we cannot be certain that these measures will ensure that we continue to maintain adequate control over our financial processes and reporting in the future. If we fail to maintain the adequacy of our internal control over financial reporting or our disclosure controls and procedures, we could be subjected to regulatory scrutiny, civil or criminal penalties or shareholder litigation, the defense of any of which could cause the diversion of management’s attention and resources, we could incur significant legal and other expenses, and we could be required to pay damages to settle such actions if any such actions were not resolved in our favor. Continued or future failure to maintain adequate internal control over financial reporting could also result in financial statements that do not accurately reflect our financial condition or results of operations. There can be no assurance that we will not identify any significant deficiencies or material weaknesses that will impair our ability to report our financial condition and results of operations accurately or on a timely basis. Inferior internal controls could also cause investors to lose confidence in our reported financial information, which could have a negative effect on the trading price of our ordinary shares and our access to capital.
We operate in markets outside the United States that are subject to political, economic, and social instability and expose us to additional risks.
Operations in countries outside of the United States accounted for approximately 26% of our net sales for our fiscal year ended December 31, 2017. Our operations outside of the United States are accompanied by certain financial and other risks. We intend to continue to pursue growth opportunities in sales outside the United States, especially in emerging markets, which could expose us to greater risks associated with international sales operations. Our international sales operations expose us and our representatives, agents, and distributors to risks inherent in operating in foreign jurisdictions. These risks include:
• | the imposition of additional U.S. and foreign governmental controls or regulations on orthopaedic implants and biologic products; |
• | withdrawal from or revision to international trade agreements and the imposition or increases in import and export licensing and other compliance requirements, customs duties and tariffs, import and export quotas and other trade restrictions, license obligations, and other non-tariff barriers to trade; |
• | unexpected changes in tariffs, trade barriers and regulatory requirements; |
• | the imposition of U.S. or international sanctions against a country, company, person, or entity with whom we do business that would restrict or prohibit continued business with that country, company, person, or entity; |
• | economic instability, including currency risk between the U.S. dollar and foreign currencies, in our target markets; |
• | economic weakness, including inflation, or political instability in particular foreign economies and markets; |
• | the imposition of restrictions on the activities of foreign agents, representatives, and distributors; |
• | scrutiny of foreign tax authorities, which could result in significant fines, penalties, and additional taxes being imposed upon us; |
• | a shortage of high-quality international salespeople and distributors; |
• | loss of any key personnel who possess proprietary knowledge or are otherwise important to our success in international markets; |
• | changes in third-party reimbursement policy that may require some of the patients who receive our products to directly absorb medical costs or that may necessitate our reducing selling prices for our products; |
• | unexpected changes in foreign regulatory requirements; |
• | differing local product preferences and product requirements; |
• | changes in tariffs and other trade restrictions, particularly related to the exportation of our biologic products; |
• | work stoppages or strikes in the healthcare industry, such as those that have affected our operations in France, Canada, South Korea, and Finland in the past; |
• | difficulties in enforcing and defending intellectual property rights; |
• | foreign currency exchange controls that might prevent us from repatriating cash earned in countries outside the Netherlands; |
• | complex data privacy requirements and labor relations laws; and |
31
• | exposure to different legal and political standards due to our conducting business in approximately 50 countries. |
In addition, on June 23, 2016, the United Kingdom held a referendum in which voters approved an exit from the European Union, commonly referred to as “Brexit.” As a result of the referendum, negotiations will determine the future terms of the United Kingdom’s relationship with the European Union, including the terms of trade between the United Kingdom and the European Union. Although it is unknown what those terms will be, it is possible that there will be greater restrictions on the movement of goods and people between the United Kingdom and European Union countries and increased regulatory complexities, which could affect our ability to sell our products in certain European Union countries. Brexit could adversely affect European and worldwide economic and market conditions and could contribute to instability in global financial and foreign exchange markets, including volatility in the value of the British pound and Euro. In addition, other European countries may seek to conduct referenda with respect to continuing membership with the European Union. We do not know to what extent these changes will impact our business. Any of these effects of Brexit, and others that we cannot anticipate, could adversely affect our business, operations and financial results.
Since we conduct operations through U.S. operating subsidiaries, not only are we subject to the laws of non-U.S. jurisdictions, but we also are subject to U.S. laws governing our activities in foreign countries, such as the FCPA, as well as various import-export laws, regulations, and embargoes. If our business activities were determined to violate these laws, regulations, or rules, we could suffer serious consequences.
Healthcare regulation and reimbursement for medical devices vary significantly from country to country. This changing environment could adversely affect our ability to sell our products in some jurisdictions.
The costs of complying with the requirements of the new EU-wide General Data Protection Regulation and the potential liability associated with failure to do so could materially adversely affect our business and results of operations.
In May 2018, the new EU-wide General Data Protection Regulation (GDPR) will become effective, replacing the current data protection laws of each EU member state. The GDPR will implement more stringent operational requirements for personal data, including, for example, expanded disclosures about how personal information is to be used, limitations on retention of information, increased requirements pertaining to health data and pseudonymised (i.e., key-coded) data, mandatory data breach notification requirements and higher standards for data controllers to demonstrate that they have obtained valid consent for certain data processing activities. Any failure or perceived failure by us to comply with privacy or security laws, policies, legal obligations or industry standards or any security incident that results in the unauthorized release or transfer of personally identifiable information may result in governmental enforcement actions and investigations including by European Data Protection Authorities, fines and penalties, litigation and/or adverse publicity, and could cause our customers to lose trust in us, which could have an adverse effect on our reputation and business. Such failures could have a material adverse effect on our operating results and financial condition. If the third parties we work with violate applicable laws, contractual obligations or suffer a security breach, such violations may also put us in breach of our obligations under privacy laws and regulations and/or could in turn have a material adverse effect on our business. In addition, we anticipate having to expend significant time, costs and resources to comply with the GDPR.
Worldwide economic instability could adversely affect our net sales, financial condition, or results of operations.
The health of the global economy, and the credit markets and the financial services industry in particular, affects our business and operating results. While the health of the credit markets and the financial services industry appears to have stabilized, there is no assurance that it will remain stable and there can be no assurance that there will not be deterioration in the global economy. If the credit markets are not favorable, we may be unable to raise additional financing when needed or on favorable terms. Our customers may experience financial difficulties or be unable to borrow money to fund their operations which may adversely impact their ability to purchase our products or to pay for our products on a timely basis, if at all. In addition, any economic crisis could also adversely impact our suppliers’ ability to provide us with materials and components, either of which may negatively impact our business. As with our customers and vendors, these economic conditions make it more difficult for us to accurately forecast and plan our future business activities. Further, there are concerns for the overall stability and suitability of the Euro as a single currency, given the economic and political challenges facing individual Eurozone countries and Brexit. Continuing deterioration in the creditworthiness of the Eurozone countries, the withdrawal of one or more member countries from the European Union, or the failure of the Euro as a common European currency could adversely affect our sales, financial condition, or operating results.
The collectability of our accounts receivable may be affected by general economic conditions.
Our liquidity is dependent on, among other things, the collection of our accounts receivable. Collections of our receivables may be affected by general economic conditions. Although current economic conditions have not had a material adverse effect on our ability to collect such receivables, we can make no assurances regarding future economic conditions or their effect on our ability to collect our receivables, particularly from our international stocking distributors. In addition, some of our trade receivables are with national health care systems in many countries (including, but not limited to, Greece, Ireland, Portugal, and Spain). Repayment of these receivables is dependent upon the financial stability of the economies of those countries. In light of these global economic
32
fluctuations, we continue to monitor the creditworthiness of customers located outside of the United States. Failure to receive payment of all or a significant portion of these receivables could adversely affect our operating results.
A significant portion of our product sales are made through independent distributors and sales agents who we do not control.
A significant portion of our product sales are made through independent sales representatives and distributors. Because the independent distributor often controls the customer relationships within its territory (and, in certain countries outside the United States, the regulatory relationship), there is a risk that if our relationship with the distributor ends, our relationship with the customer will be lost (and, in certain countries outside the United States, that we could experience delays in amending or transferring our product registrations). Also, because we do not control a distributor’s field sales agents, there is a risk we will be unable to ensure that our sales processes, compliance, and other priorities will be consistently communicated and executed by the distributor. If we fail to maintain relationships with our key distributors, or fail to ensure that our distributors adhere to our sales processes, compliance, and other priorities, this could have an adverse effect on our operations. In the past, we have experienced turnover within our independent distributor organization. This adversely affected our short-term financial results as we transitioned to direct sales employees or new independent representatives. In addition, prior to the merger, legacy Tornier transitioned to direct selling models in certain geographies and transitioned its U.S. sales channel towards focusing separately on upper and lower extremities products. While we believe these transitions were managed effectively and position us to leverage our sales force and broad product portfolio, there is a risk that these or future transitions could have a greater adverse effect on our operations than we have previously experienced or anticipate. Further, the legacy independent distributors and sales agents of Wright and Tornier may decide not to renew or may decide to seek to terminate, change and/or renegotiate their relationships with us. A loss of a significant number of our distributors or agents could have a material adverse effect on our business and results of operations.
In addition, our success is partially dependent upon our ability to retain and motivate our distributors, independent sales agencies, and their representatives to sell our products in certain territories. They may not be successful in implementing our marketing plans. Some of our distributors and independent sales agencies do not sell our products exclusively and may offer similar products from other orthopaedic companies. Our distributors and independent sales agencies may terminate their contracts with us, may devote insufficient sales efforts to our products, or may focus their sales efforts on other products that produce greater commissions for them, which could have an adverse effect on our operations and operating results.
The results of our clinical trials may not support our product claims or may result in the discovery of adverse side effects.
Our ongoing research and development, pre-clinical testing, and clinical trial activities are subject to extensive regulation and review by numerous governmental authorities both in the United States and abroad. We are currently conducting post-market clinical studies of some of our products to gather additional information about these products’ safety, efficacy, or optimal use. In the future we may conduct additional clinical trials to support approval of new products. Clinical studies must be conducted in compliance with FDA regulations or the FDA may take enforcement action. The data collected from these clinical trials may ultimately be used to support market approval or clearance for these products or gather additional information about approved or cleared products. Even if our clinical trials are completed as planned, we cannot be certain that their results will support our product claims or that the FDA or foreign authorities will agree with our conclusions regarding them. Success in pre-clinical testing and early clinical trials does not always ensure that later clinical trials will be successful, and we cannot be sure that the later trials will replicate the results of prior trials and studies. The clinical trial process may fail to demonstrate that our products are safe and effective for the proposed indicated uses, which could cause us to abandon a product and may delay development of others. Any delay or termination of our clinical trials will delay the filing of our product submissions and, ultimately, our ability to commercialize our products and generate revenue. It is also possible that patients enrolled in clinical trials will experience adverse side effects that are not currently part of the product’s profile.
If the third parties on which we rely to conduct our clinical trials and to assist us with clinical development do not perform as contractually required or expected, we may not be able to obtain, or in some cases, maintain regulatory clearance or approval for or commercialize our products.
We often must rely on third parties, such as contract research organizations, medical institutions, clinical investigators, and contract laboratories to conduct our clinical trials. If these third parties do not successfully carry out their contractual duties or regulatory obligations or meet expected deadlines, if these third parties need to be replaced, or if the quality or accuracy of the data they obtain is compromised due to their failure to adhere to our clinical protocols or regulatory requirements, or for other reasons, our pre-clinical and clinical development activities or clinical trials may be extended, delayed, suspended, or terminated, and we may not be able to obtain or, in some cases maintain, regulatory clearance or approval for, or successfully commercialize, our products on a timely basis, if at all, and our business, operating results, and prospects may be adversely affected. Furthermore, our third-party clinical trial investigators may be delayed in conducting our clinical trials for reasons outside of their control.
Fluctuations in insurance cost and availability could adversely affect our profitability or our risk management profile.
We hold a number of insurance policies, including product liability insurance, directors’ and officers’ liability insurance, property insurance, and workers’ compensation insurance. If the costs of maintaining adequate insurance coverage should increase
33
significantly in the future, our operating results could be materially adversely impacted. Likewise, if any of our current insurance coverage should become unavailable to us or become economically impractical, we would be required to operate our business without indemnity from commercial insurance providers.
Our inability to maintain contractual relationships with healthcare professionals could have a negative impact on our research and development and medical education programs.
We maintain contractual relationships with respected surgeons and medical personnel in hospitals and universities who assist in product research and development and in the training of surgeons on the safe and effective use of our products. We continue to place emphasis on the development of proprietary products and product improvements to complement and expand our existing product lines as well as providing high quality training on those products. If we are unable to maintain these relationships, our ability to develop and market new and improved products and train on the use of those products could decrease, and our future operating results could be unfavorably affected. In addition, it is possible that U.S. federal and state and international laws requiring us to disclose payments or other transfers of value, such as free gifts or meals, to surgeons and other healthcare providers could have a chilling effect on these relationships with individuals or entities that may, among other things, want to avoid public scrutiny of their financial relationships with us.
If adequate levels of reimbursement from third-party payors for our products are not obtained, surgeons and patients may be reluctant to use our products and our sales may decline.
In the United States, healthcare providers who purchase our products generally rely on third-party payors, principally U.S. federally-funded Medicare, state-funded Medicaid, and private health insurance plans, to pay for all or a portion of the cost of joint reconstructive procedures and products utilized in those procedures. We may be unable to sell our products on a profitable basis if third-party payors deny coverage or reduce their current levels of reimbursement. Our sales depend largely on governmental healthcare programs and private health insurers reimbursing patients’ medical expenses. Surgeons, hospitals, and other healthcare providers may not purchase our products if they do not receive appropriate reimbursement from third-party payors for procedures using our products. In light of healthcare reform measures, payors continue to review their coverage policies for existing and new therapies and may deny coverage for treatments that include the use of our products.
In addition, some healthcare providers in the United States have adopted or are considering bundled payment methodologies and/or managed care systems in which the providers contract to provide comprehensive healthcare for a fixed cost per person. Healthcare providers may attempt to control costs by authorizing fewer elective surgical procedures, including joint reconstructive surgeries, or by requiring the use of the least expensive implant available. Changes in reimbursement policies or healthcare cost containment initiatives that limit or restrict reimbursement for our products may cause our sales to decline.
If adequate levels of reimbursement from third-party payors outside of the United States are not obtained, international sales of our products may decline. Outside of the United States, reimbursement systems vary significantly by country. Many foreign markets have government-managed healthcare systems that govern reimbursement for medical devices and procedures. Canada, and some European and Asian countries, in particular France, Japan, Taiwan, and South Korea, have tightened reimbursement rates. Additionally, Brazil, China, Russia, and the United Kingdom have recently begun landmark reforms that will significantly alter their healthcare systems. Finally, some foreign reimbursement systems provide for limited payments in a given period and therefore result in extended payment periods.
Our business could be significantly and adversely impacted by healthcare reform legislation.
Comprehensive healthcare reform legislation has significantly and adversely impacted our business. For example, the Affordable Care Act imposed a 2.3% excise tax on U.S. sales of medical devices. Although the medical device excise tax is currently suspended until December 31, 2019, it is possible that the suspension may be lifted or expire. The Affordable Care Act also includes numerous provisions to limit Medicare spending through reductions in various fee schedule payments and by instituting more sweeping payment reforms, such as bundled payments for episodes of care and the establishment of “accountable care organizations” under which hospitals and physicians will be able to share savings that result from cost control efforts. Many of these provisions will be implemented through the regulatory process, and policy details have not yet been finalized. In addition, efforts to repeal and replace and/or modify all or parts of the Affordable Care Act continue. Any such repeal, replacement or material modification of the Affordable Care Act could cause significant uncertainty in the U.S. healthcare market, could increase our costs, decrease our sales or inhibit our ability to sell our products. Various healthcare reform proposals have also emerged at the state level. We cannot predict with certainty the impact that these U.S. federal and state health reforms will have on us. However, an expansion in government’s role in the U.S. healthcare industry may lower reimbursements for products, reduce medical procedure volumes, and adversely affect our business and operating results, possibly materially.
There is an increasing trend for more criminal prosecutions and compliance enforcement activities for noncompliance with the HIPAA as well as for data breaches involving protected health information (PHI). In the ordinary course of our business, we may receive PHI. If we are unable to comply with HIPAA or experiences a data breach involving PHI, we could be subject to criminal and civil sanctions.
34
If we cannot retain our key personnel, we may be unable to manage and operate our business successfully and meet our strategic objectives.
Our future success depends, in part, upon our ability to retain and motivate key managerial, scientific, sales, and technical personnel, as well as our ability to continue to attract and retain additional highly qualified personnel. We compete for such personnel with other companies, academic institutions, governmental entities, and other organizations. There can be no assurance that we will be successful in retaining our current personnel or in hiring or retaining qualified personnel in the future. Key personnel may depart because of difficulties with change or a desire not to remain with our company, especially in light of the Wright/Tornier merger. Any unanticipated loss or interruption of services of our management team and our key personnel could significantly reduce our ability to meet our strategic objectives because it may not be possible for us to find appropriate replacement personnel should the need arise. Loss of key personnel or the inability to hire or retain qualified personnel in the future could have a material adverse effect on our ability to operate successfully. Further, any inability on our part to enforce non-compete or non-solicitation arrangements related to key personnel who have left the business could have a material adverse effect on our business.
If a natural or man-made disaster adversely affects our manufacturing facilities or distribution channels, we could be unable to manufacture or distribute our products for a substantial amount of time, and our sales could be disrupted.
We principally rely on four manufacturing facilities, two of which are in France, one of which is in Ireland and one of which is in Arlington, Tennessee. The facilities and the manufacturing equipment we use to produce our products would be difficult to replace and could require substantial lead-time to repair or replace. For example, the machinery associated with our manufacturing of pyrocarbon in one of our French facilities is highly specialized and would take substantial lead-time and resources to replace. We also maintain a facility in Bloomington, Minnesota, a facility in Arlington, Tennessee, and a warehouse in Montbonnot, France, which contain large amounts of our inventory. Our facilities, warehouses, or distribution channels may be affected by natural or man-made disasters. For example, in the event of a natural or man-made disaster at one of our warehouses, we may lose substantial amounts of inventory that would be difficult to replace. Our manufacturing facility in Arlington, Tennessee is located near the New Madrid fault line. In the event our facilities, warehouses, or distribution channels are affected by a disaster, we would be forced to rely on, among others, third-party manufacturers and alternative warehouse space and distribution channels, which may or may not be available, and our sales could decline. Although we believe we have adequate disaster recovery plans in place and possess adequate insurance for damage to our property and the disruption of our business from casualties, such plans and insurance may not cover such disasters or be sufficient to cover all of our potential losses and may not continue to be available to us on acceptable terms or at all.
To the extent transition activities related to the sale of our Large Joints business divert management attention or manufacturing resources from our ongoing operations, or add additional costs to these operations, this could have an adverse effect on our business.
On October 21, 2016, we sold our Large Joints business to Corin. In connection with the transaction, we entered into a transitional services agreement pursuant to which we agreed to provide Corin certain support services and a supply agreement pursuant to which we agreed to manufacture certain of the large joints products for Corin, in each case for a transitional period of time. Our post-closing obligations under the transitional services agreement and supply agreement require us to dedicate substantial resources, personnel and manufacturing capacity that may add costs to our ongoing business, cause us to incur unanticipated costs and liabilities or result in manufacturing delays with respect to the production and delivery of our own products.
Fluctuations in foreign currency exchange rates could result in declines in our reported net sales and earnings.
Because a majority of our international sales are denominated in local currencies and not in U.S. dollars, our reported net sales and earnings are subject to fluctuations in foreign currency exchange rates. Foreign currency exchange rate fluctuations favorably impacted our net sales by $0.9 million during 2017. Operating costs related to these sales are largely denominated in the same respective currencies, thereby partially limiting our transaction risk exposure. However, cost of sales related to these sales are primarily denominated in U.S. dollars; therefore, as the U.S. dollar strengthens, the gross margin associated with our sales denominated in foreign currencies experience declines.
We have employed a derivative program using foreign currency forward contracts to mitigate the risk of currency fluctuations on our intercompany receivable and payable balances that are denominated in foreign currencies. These forward contracts are expected to offset the transactional gains and losses on the related intercompany balances. These forward contracts are not designated as hedging instruments under Financial Accounting Standards Board (FASB) Accounting Standard Codification (ASC) Section 815, Derivatives and Hedging Activities. Accordingly, the changes in the fair value and the settlement of the contracts are recognized in the period incurred. Although we address currency risk management through regular operating and financing activities, and more recently through hedging activities, these actions may not prove to be fully effective, and hedging activities involve additional risks. We plan to discontinue our foreign currency forward contracts derivative program in 2018.
We may be unable to maintain competitive global cash management and a competitive effective corporate tax rate.
35
We cannot give any assurance as to our future effective tax rate because of, among other things, uncertainty regarding the tax policies of the jurisdictions where we operate and uncertainty regarding the level of net income that we will earn in those jurisdictions in the future. Our actual effective tax rate may vary from this expectation and that variance may be material. Additionally, the tax laws of the Netherlands and other jurisdictions in which we operate could change in the future, and such changes could cause a material change in our effective tax rate.
Our provision for income taxes will be based on certain estimates and assumptions made by management in consultation with our tax and other advisors. Our group income tax rate will be affected by, among other factors, the amount of net income earned in our various operating jurisdictions, the availability of benefits under tax treaties, the rates of taxes payable in respect of that income, and withholding taxes on dividends paid from one jurisdiction to the next. We will enter into many transactions and arrangements in the ordinary course of business in respect of which the tax treatment is not entirely certain. We will, therefore, make estimates and judgments based on our knowledge and understanding of applicable tax laws and tax treaties, and the application of those tax laws and tax treaties to our business, in determining our consolidated tax provision. For example, certain countries could seek to tax a greater share of income than will be provided for by us. The final outcome of any audits by taxation authorities may differ from the estimates and assumptions we may use in determining our consolidated tax provisions and accruals. This could result in a material adverse effect on our consolidated income tax provision, financial condition, and the net income for the period in which such determinations are made.
In particular, dividends, distributions, and other intra-group payments from our U.S. affiliates to certain of our non-U.S. subsidiaries may be subject to U.S. withholding tax at a rate of 30% unless the entity receiving such payments can demonstrate that it qualifies for reduction or elimination of the U.S. withholding tax under the income tax treaty (if any) between the United States and the jurisdiction in which the entity is organized or is a tax resident. In certain cases, treaty qualification may depend on whether at least 50% of our ultimate beneficial owners are qualified residents of the United States or the treaty jurisdiction within the meaning of the applicable treaty. There can be no assurance that we will satisfy this beneficial ownership requirement at the time when such dividends, distributions, or other payments are made. Moreover, the U.S. Internal Revenue Service (IRS) may challenge our determination that the beneficial ownership requirement is satisfied. If we do not satisfy the beneficial ownership requirement, such dividends, distributions, or other payments may be subject to 30% U.S. withholding tax.
We may face potential limitations on the utilization of our U.S. tax attributes.
Following the acquisition of a U.S. corporation by a non-U.S. corporation, Section 7874 of the Internal Revenue Code of 1986, as amended (Code) can limit the ability of the acquired U.S. corporation and its U.S. affiliates to utilize U.S. tax attributes such as net operating losses and certain tax credits to offset U.S. taxable income resulting from certain transactions. Based on the limited guidance available, we currently expect that this limitation likely will not apply to us and as a result, our U.S. affiliates likely will not be limited by Section 7874 of the Code in their ability to utilize their U.S. tax attributes to offset their U.S. taxable income, if any, resulting from certain specified taxable transactions. However, no assurances can be given in this regard. If, however, Section 7874 of the Code were to apply to the Wright/Tornier merger and if our U.S. affiliates engage in transactions that would generate U.S. taxable income subject to this limitation in the future, it could take us longer to use our net operating losses and tax credits and, thus, we could pay U.S. federal income tax sooner than we otherwise would have. Additionally, if the limitation were to apply and if we do not generate taxable income consistent with our expectations, it is possible that the limitation under Section 7874 on the utilization of U.S. tax attributes could prevent our U.S. affiliates from fully utilizing their U.S. tax attributes prior to their expiration.
Future changes to U.S. tax laws could materially affect us, including our status as a non-U.S. corporation.
Under current U.S. federal income tax law, a corporation generally will be considered to be resident for U.S. federal income tax purposes in its place of organization or incorporation. Accordingly, under the generally applicable U.S. federal income tax rules, we, as a Netherlands incorporated entity, would be classified as a non-U.S. corporation (and, therefore, not a U.S. tax resident). Section 7874 of Code, however, contains specific rules (more fully discussed below) that can cause a non-U.S. corporation to be treated as a U.S. corporation for U.S. federal income tax purposes. These rules are complex and there is little or no guidance as to their application.
We currently expect we should continue to be treated as a foreign corporation for U.S. federal tax purposes, however, it is possible that the IRS could disagree with that position and assert that Section 7874 applies to treat us as a U.S. corporation. In addition, new statutory or regulatory provisions under Section 7874 or otherwise could be enacted or promulgated that adversely affect our status as a foreign corporation for U.S. federal tax purposes, and any such provisions could have retroactive application. If we were to be treated as a U.S. corporation for federal tax purposes, we would be subject to U.S. corporate income tax on our worldwide income, and the income of our foreign subsidiaries would be subject to U.S. tax when repatriated or when deemed recognized under the U.S. tax rules for controlled foreign subsidiaries. In such a case, we would be subject to substantially greater U.S. tax liability than currently contemplated. Moreover, in such a case, a non-U.S. shareholder of our company would be subject to U.S. withholding tax on the gross amount of any dividends paid by us to such shareholder.
36
Any such U.S. corporate income or withholding tax could be imposed in addition to, rather than in lieu of, any Dutch corporate income tax or withholding tax that may apply.
Our tax position may be adversely affected by changes in tax law relating to multinational corporations, or by increased scrutiny by tax authorities.
Recent legislative proposals have aimed to expand the scope of U.S. corporate tax residence, limit the ability of foreign-owned corporations to deduct interest expense, and make other changes in the taxation of multinational corporations.
On December 22, 2017, the United States enacted the statute commonly called the “Tax Cuts and Jobs Act” (the 2017 Tax Act) which enacts a broad range of changes to the Code. The 2017 Tax Act, among other things, includes changes to U.S. federal tax rates, imposes significant additional limitations on the deductibility of U.S. interest and U.S. net operating losses, allows for the expensing of certain U.S. capital expenditures, and puts into effect a number of changes impacting applicable operations outside of the United States including, but not limited to, the imposition of a onetime tax on accumulated post-1986 deferred foreign income that has not previously been subject to tax, and modifications to the treatment of certain intercompany transactions. Our net deferred tax assets and liabilities were revalued to the extent applicable at the newly enacted U.S. corporate rate, and the impact was recognized as a tax benefit in 2017, the year of enactment. We are continuing to evaluate the overall impact of this tax legislation on our U.S. and non-U.S. operations. There can be no assurance that changes in tax laws or regulations, both within the U.S. and the other jurisdictions in which we operate, will not materially and adversely affect our effective tax rate, tax payments, financial condition and results of operations. Similarly, changes in tax laws and regulations that impact our customers and counterparties or the economy generally may also impact our financial condition and results of operations.
Additionally, the U.S. Congress, government agencies in jurisdictions where we and our affiliates do business, and the Organization for Economic Co-operation and Development have focused on issues related to the taxation of multinational corporations. One example is in the area of “base erosion and profit shifting,” where payments are made between affiliates from a jurisdiction with high tax rates to a jurisdiction with lower tax rates. As a result, the tax laws in the United States, the Netherlands and other countries in which we and our affiliates do business could change on a prospective or retroactive basis, and any such changes could impact the expected tax treatment for us and adversely affect our financial results.
Moreover, U.S. and non-U.S. tax authorities may carefully scrutinize companies involved or recently involved in cross-border business combinations, such as us, which may lead such authorities to assert that we owe additional taxes.
Our exposure to several tax jurisdictions may have an adverse effect on us and this may increase the aggregate tax burden on us and our shareholders.
We are subject to a large number of different tax laws and regulations in the various jurisdictions in which we operate. These laws and regulations are often complex and are subject to varying interpretations. The combined effect of the application of tax laws, including the application or disapplication of tax treaties of one or more of these jurisdictions and their interpretation by the relevant tax authorities could, under certain circumstances, produce contradictory results. We often rely on generally available interpretations of tax laws and regulations to determine the existence, scope, and level of our liability to tax in the jurisdictions in which we operate. In addition, we take positions in the course of our business with respect to various tax matters, including the compliance with the arm’s length principles in respect of transactions with related parties, the tax deductibility of interest and other costs, and the amount of depreciation or write-down of our assets that we can recognize for tax purposes. There is no assurance that the tax authorities in the relevant jurisdictions will agree with such interpretation of these laws and regulations or with the positions taken by us. If such tax positions are challenged by relevant tax authorities, the imposition of additional taxes could increase our effective tax rate and cost of operations.
Furthermore, because we are incorporated under Dutch law, we are treated for Dutch corporate income tax purposes as a resident of the Netherlands. Based on our management structure and the current tax laws of the United States and the Netherlands, as well as applicable income tax treaties and current interpretations thereof, we expect to remain a tax resident solely of the Netherlands. If we were to be treated as a tax resident of a jurisdiction other than or in addition to the Netherlands, we could be subject to corporate income tax in that other jurisdiction, and could be required to withhold tax on any dividends paid by us to our shareholders under the applicable laws of that jurisdiction.
Risks Related to the Wright/Tornier Merger
We may be unable to continue to successfully integrate our operations or realize the anticipated cost savings, net sales and other potential benefits of the Wright/Tornier merger in a timely manner or at all. As a result, the value of our ordinary shares may be adversely affected.
The ultimate future success of the merger will depend, in part, on our ability to achieve the anticipated cost savings, net sales, and other potential benefits of the merger. Achieving the anticipated potential benefits of the merger will depend in part upon whether we are able to complete the integration of our operations in an efficient and effective manner and whether we are able to effectively coordinate sales and marketing efforts to communicate our capabilities and coordinate our sales organizations to sell our combined
37
products. While we have successfully completed a substantial number of integration activities since the merger, the remainder of our integration activities may not be completed smoothly or successfully. The necessity of coordinating geographically separated organizations, systems, and facilities and addressing possible differences in business backgrounds, corporate cultures, and management philosophies may increase the difficulties of integration. We operate numerous systems, including those involving management information, purchasing, accounting and finance, sales, billing, payroll, employee benefits, and regulatory compliance. We still have numerous systems which remain to be integrated, including those involving management information, purchasing, accounting and finance, sales, billing, payroll, employee benefits, and regulatory compliance. We may still have inconsistencies in standards, controls, procedures or policies that could affect our ability to maintain relationships with customers and employees or to achieve the anticipated benefits of the merger. We may also have difficulty in completing the integration of our commercial organizations, including in particular distribution and sales representative arrangements. The integration of certain operations requires the dedication of significant management resources, which may temporarily distract management’s attention from our day-to-day business. Employee uncertainty and lack of focus during the integration process may also disrupt our business. Any inability of our management to integrate successfully our operations or to do so within a longer time frame than expected could have a material adverse effect on our business and operating results. The integration also may result in material unanticipated problems, expenses, liabilities, competitive responses, and loss of customer relationships. Even if the operations of our businesses are integrated successfully, we may not be able to realize the full benefits of the merger, including the anticipated operating and cost synergies, sales and growth opportunities or long-term strategic benefits of the merger, within the expected timeframe or at all. In addition, we expect to continue to incur significant integration and restructuring expenses to realize synergies. However, many of the expenses that remain to be incurred are, by their nature, difficult to estimate accurately. These expenses could, particularly in the near term, exceed the savings that we expect to achieve from elimination of duplicative expenses and the realization of economies of scale and cost savings. Although we expect that the realization of efficiencies related to the integration of the businesses may offset incremental transaction, merger-related, and restructuring costs over time, we cannot give any assurance that this net benefit will be achieved in the near term, or at all. An inability to realize the full extent of, or any of, the anticipated benefits of the merger, as well as any delays encountered in the integration process, could have an adverse effect on our business and operating results, which may affect the value of our ordinary shares.
Our future success also will depend in part upon our ability to retain key employees. Competition for qualified personnel can be very intense. In addition, key employees may depart because of issues relating to the uncertainty or difficulty of integration or a desire not to remain with our company. Accordingly, no assurances can be given that we will retain key employees.
Our future results will suffer if we do not effectively manage our expanded operations as a result of the merger.
As a result of the merger, the size of our business has increased significantly. Our future success depends, in part, upon our ability to manage this expanded business, which may pose substantial challenges for our management, including challenges related to the management and monitoring of new operations and associated increased costs and complexity. There can be no assurances that we will be successful or that we will realize the expected operating efficiencies, cost savings, and other benefits currently anticipated from the merger.
Our Corporate Compliance Program requires the cooperation of many individuals, involves substantial investment and diverts a significant amount of time and resources from our other business activities. Our failure to maintain an effective Corporate Compliance Program could adversely affect our business, reputation and financial results.
We are committed to a robust Corporate Compliance Program. Accordingly, we have devoted and continue to devote a significant amount of time and resources from our financial, human resources, and compliance personnel, as well as all of our employees in furtherance of this strategic objective. Since the completion of the Wright/Tornier merger, we have spent considerable resources integrating the Corporate Compliance Programs of legacy Wright and legacy Tornier and believe we have substantially completed this integration. No assurance can be provided, however, that we have successfully completed this process. Our failure to maintain an effective Corporate Compliance Program could result in significant legal and regulatory problems and could adversely affect our business, reputation and financial results.
We have a significant amount of goodwill and other intangible assets on our consolidated balance sheet as a result of the Wright/Tornier merger and our other acquisitions, which if these acquired businesses do not perform as anticipated, may be subject to future impairment, which would harm our operating results.
In connection with the accounting for the merger, we recorded a significant amount of goodwill and other intangible assets within each of our reporting units. As of December 31, 2017, we had $933.7 million in goodwill and $231.0 million in intangible assets. Under US GAAP, we must assess, at least annually and potentially more frequently, whether the value of our goodwill and other indefinite-lived intangible assets have been impaired. Amortizing intangible assets will be assessed for impairment in the event of an impairment indicator. A decrease in the long-term economic outlook and future cash flows of the legacy Tornier business, our recently acquired IMASCAP business or other businesses and technologies that we have acquired could significantly impact asset values and potentially result in the impairment of intangible assets, including goodwill. If the operating performance of the legacy Tornier business, IMASCAP business or other businesses and technologies that we have acquired significantly decreases,
38
competing or alternative technologies emerge, or if market conditions or future cash flow estimates decline, we could be required, under current US GAAP, to record a non-cash charge to operating earnings for the amount of the impairment. Any write-off of a material portion of our unamortized intangible assets would negatively affect our results of operations.
Risks Relating to Our Ordinary Shares and Jurisdiction of Incorporation
The trading volume and prices of our ordinary shares have been and may continue to be volatile, which could result in substantial losses to our shareholders.
The trading volume and prices of our ordinary shares have been and may continue to be volatile and could fluctuate widely due to factors beyond our control. During 2017, the sale price of our ordinary shares ranged from $22.14 to $31.53. Such volatility may be the result of broad market and industry factors. In addition to market and industry factors, the price and trading volume for our ordinary shares may be highly volatile for factors specific to our own operations, including the following:
• | variations in our net sales, earnings, and cash flow, and in particular variations that deviate from our projected financial information; |
• | announcements of new investments, acquisitions, strategic partnerships, or joint ventures; |
• | announcements of new products by us or our competitors; |
• | announcements of divestitures or discontinuance of products or assets; |
• | changes in financial estimates by securities analysts; |
• | additions or departures of key personnel; |
• | sales of our equity securities by our significant shareholders or management or sales of additional equity securities by our company; |
• | pending and potential litigation or regulatory investigations; and |
• | fluctuations in market prices for our products. |
Any of these factors may result in large and sudden changes in the volume and price at which our ordinary shares trade. Shareholders of a public company sometimes bring securities class action suits against the company following periods of instability in the market price of that company’s securities. If we were involved in a class action suit, it could divert a significant amount of our management’s attention and other resources from our business and operations, which could harm our operating results and require us to incur significant expenses to defend the suit. Any such class action suit, whether or not successful, could harm our reputation and restrict our ability to raise capital in the future. In addition, if a claim is successfully made against us, we may be required to pay significant damages, which could have a material adverse effect on our financial condition and operating results.
If securities or industry analysts do not publish research or reports about our business, or if they adversely change their recommendations regarding our ordinary shares, the market price for our ordinary shares and trading volume could decline.
The trading market for our ordinary shares is influenced by research or reports that industry or securities analysts publish about us or our business. If one or more analysts who cover us downgrade our ordinary shares, the market price for our ordinary shares likely would decline. If one or more of these analysts cease coverage of us or fail to regularly publish reports on us, we could lose visibility in the financial markets, which, in turn, could cause the market price or trading volume for our ordinary shares to decline.
The sale or availability for sale of substantial amounts of our ordinary shares could adversely affect their market price.
Sales of substantial amounts of our ordinary shares in the public market, or the perception that these sales could occur, could adversely affect the market price of our ordinary shares and could materially impair our ability to raise capital through equity offerings in the future. We cannot predict what effect, if any, market sales of securities held by our significant shareholders or any other shareholder or the availability of these securities for future sale will have on the market price of our ordinary shares.
Rights of a holder of ordinary shares are governed by Dutch law and differ from the rights of shareholders under U.S. law.
We are a Dutch public company with limited liability (naamloze vennootschap). Our corporate affairs and the rights of holders of our ordinary shares are governed by Dutch law and our articles of association. The rights of our shareholders and the responsibilities of members of our board of directors may be different from those in companies governed by the laws of U.S. jurisdictions. For example, Dutch law does not provide for a shareholder derivative action. In addition, in the performance of its duties, our board of directors is required by Dutch law to act in the interest of our company and our affiliated business, and to consider the interests of our company, our shareholders, our employees, and other stakeholders, in all cases with reasonableness and fairness. It is possible that some of these parties will have interests that are different from, or in addition to, interests of our shareholders.
39
As a result of different shareholder voting requirements in the Netherlands relative to laws in effect in certain states in the United States, we may have less flexibility with respect to the issuance of our ordinary shares than companies organized in the United States.
Currently, our articles of association provide for an authorized share capital consisting of one class of shares, being 320,000,000 ordinary shares, each with a nominal value of €0.03. Under Dutch law, our authorized share capital can be increased by an amendment to our articles of association. Our articles of association can be amended upon a proposal of our board of directors by the general meeting of shareholders, which resolution can be adopted with a simple majority in a meeting where at least one-third of the outstanding shares are represented. New ordinary shares may be issued pursuant to a resolution of shareholders, or pursuant to such resolution of the board of directors if designated thereto by shareholders. Additionally, subject to specified exceptions, Dutch law grants statutory preemption rights to existing shareholders where shares are being issued for cash consideration. The right of our shareholders to subscribe for ordinary shares pursuant to preemptive rights may be limited or restricted by our shareholders and our shareholders may delegate such authority to the board of directors. Such designations of authority to our board of directors may remain in effect for up to five years and may be renewed for additional periods of up to five years.
Currently our board of directors is authorized to issue shares up to a maximum amount equal to the authorized but unissued share capital and to limit or exclude pre-emptive rights in respect of such issue of shares until June 18, 2020, without further shareholder approval. We intend to submit these authorizations to a vote of our shareholders at the annual general meeting that will take place in June 2018. We cannot provide any assurance that these authorizations will always be approved on a timely basis, especially since our shareholders did not approve these two authorizations the last time we submitted them to a vote of our shareholders at our annual general meeting in June 2016. The failure to renew these authorizations on a timely basis could limit our ability to issue equity and thereby adversely affect our ability to run our business and the holders of our securities.
U.S. investors may not be able to enforce judgments obtained in U.S. courts in civil and commercial matters against us or members of our board of directors or officers.
We are organized under the laws of the Netherlands, and, as such, the rights of holders of our ordinary shares and the civil liability of our directors are governed by the laws of the Netherlands and our articles of association. The rights of shareholders under the laws of the Netherlands may differ from the rights of shareholders of companies incorporated in other jurisdictions. A substantial portion of our assets are located outside of the United States. As a result, it may be difficult for investors to effect service of process within the United States on us, or to enforce outside the United States any judgments obtained against us in U.S. courts in any action, including actions predicated upon the civil liability provisions of the U.S. federal securities laws. In addition, it may be difficult for investors to enforce rights predicated upon the U.S. federal securities laws in original actions brought in courts in jurisdictions located outside the United States (including the Netherlands) or enforce claims for punitive damages.
The United States and the Netherlands currently do not have a treaty providing for the reciprocal recognition and enforcement of judgments in civil and commercial matters (other than arbitral awards). A final judgment for the payment of money rendered by any federal or state court in the United States which is enforceable in the United States, whether or not predicated solely upon U.S. federal securities laws, would not automatically be recognized or enforceable in the Netherlands. In order to obtain a judgment which is enforceable in the Netherlands, the party in whose favor a final and conclusive judgment of the U.S. court has been rendered will be required to file its claim with a court of competent jurisdiction in the Netherlands. Such party may submit to a Dutch court the final judgment rendered by the U.S. court. If and to the extent that the Dutch court finds that the jurisdiction of the U.S. court has been based on grounds which are internationally acceptable and that proper legal procedures have been observed, the Dutch court will generally tend to give binding effect to the judgment of the court of the United States without substantive re-examination or re-litigation on the merits of the subject matter, unless the judgment contravenes principles of public policy of the Netherlands.
There can be no assurance that U.S. investors will be able to enforce against us or members of our board of directors or officers who are residents of the Netherlands or countries other than the United States any judgments obtained in U.S. courts in civil and commercial matters, including judgments under the U.S. federal securities laws.
We do not anticipate paying dividends on our ordinary shares.
Our articles of association prescribe that profits or reserves appearing from our annual accounts adopted by the general meeting shall be at the disposal of the general meeting. We have power to make distributions to shareholders and other persons entitled to distributable profits only to the extent that our equity exceeds the sum of the paid and called-up portion of the ordinary share capital and the reserves that must be maintained in accordance with provisions of Dutch law or our articles of association. The profits must first be used to set up and maintain reserves required by law and must then be set off against certain financial losses. We may not make any distribution of profits on ordinary shares that we hold. The general meeting, whether or not upon the proposal of our board of directors, determines whether and how much of the remaining profit they will reserve and the manner and date of such distribution. All calculations to determine the amounts available for dividends will be based on our Dutch annual accounts, which may be different from our consolidated financial statements prepared in accordance with US GAAP. Beginning
40
with our fiscal year 2015, our statutory accounts have been prepared and we expect will continue to be prepared under International Financial Reporting Standards and are deposited with the Trade Register in Amsterdam, the Netherlands. We have not previously declared or paid cash dividends and we have no plan to declare or pay any dividends in the near future on our ordinary shares. We currently intend to retain most, if not all, of our available funds and any future earnings to operate and expand our business.
41
Item 1B. Unresolved Staff Comments.
None.
Item 2. Properties.
Our global corporate headquarters are located in Amsterdam, the Netherlands.
Our U.S. headquarters are located in Memphis, Tennessee, where we conduct our principal executive, research and development, sales and marketing, and administrative activities. We lease 121,000 square feet of office space with research and development facilities under a lease agreement that is renewable through 2034. Our upper extremities sales and marketing, U.S. distribution and customer service operations are located in a 54,000 square foot facility in Bloomington, Minnesota that we lease through 2022. Our U.S. manufacturing operations consist of a 100,000 square foot state of the art manufacturing facility in Arlington, Tennessee. We lease the manufacturing facility from the Industrial Development Board of the Town of Arlington. At this facility, we produce primarily orthopaedic implants and some related surgical instrumentation while utilizing lean manufacturing philosophies. We also lease a 31,000 square foot manufacturing and warehousing facility in Franklin, Tennessee and conduct research and development operations in an 11,000 square foot leased facility in Warsaw, Indiana.
Outside the United States, our primary manufacturing facilities are located in Montbonnot and Grenoble, France; and Macroom, Ireland. In the 92,000 square foot Montbonnot campus, we conduct manufacturing and manufacturing support activities, sales and marketing, research and development, quality and regulatory assurance, distribution and administrative functions. In our 73,000 square foot Macroom facility, we conduct manufacturing operations and manufacturing support, such as purchasing, engineering, and quality assurance functions. Our pyrocarbon manufacturing is performed at our 9,900 square foot facility in Grenoble, France. In addition, we maintain subsidiary sales offices and distribution warehouses in various countries, including France, Germany, Italy, the Netherlands, Denmark, Switzerland, United Kingdom, Belgium, Japan, Canada, and Australia. We have international research and development facilities in Costa Rica and Plouzané, France.
We believe that our facilities are adequate and suitable for their use.
Below is a summary of our material facilities. All of our reportable segments use the facilities described below except as otherwise indicated:
City | State/Country | Owned or Leased | Occupancy | |||
Memphis | Tennessee, United States | Leased | Offices/R&D | |||
Arlington | Tennessee, United States | Leased | U.S. Lower Extremities & Biologics Manufacturing/Warehouse/Distribution | |||
Bloomington | Minnesota, United States | Leased | U.S. Upper Extremities Offices/Warehouse/Distribution | |||
Warsaw | Indiana, United States | Leased | Offices/R&D | |||
Franklin | Tennessee, United States | Leased | U.S. Lower Extremities & Biologics Offices/Manufacturing/Warehouse | |||
Montbonnot | France | Leased | International Extremities & Biologics; U.S. Upper Extremities Warehouse/Distribution/Offices/R&D | |||
Montbonnot | France | Owned 51% | International Extremities & Biologics; U.S. Upper Extremities Manufacturing/Offices | |||
Grenoble | France | Leased | International Extremities & Biologics Manufacturing/Offices/R&D | |||
Plouzané | France | Leased | Upper Extremities R&D | |||
Macroom | Ireland | Leased | International Extremities & Biologics Manufacturing/Offices | |||
ITEM 3. LEGAL PROCEEDINGS.
From time to time, we or our subsidiaries are subject to various pending or threatened legal actions and proceedings, including those that arise in the ordinary course of our business and some of which involve claims for damages that are substantial in amount.
42
These actions and proceedings may relate to, among other things, product liability, intellectual property, distributor, commercial, and other matters. These actions and proceedings could result in losses, including damages, fines, or penalties, any of which could be substantial, as well as criminal charges. Although such matters are inherently unpredictable, and negative outcomes or verdicts can occur, we believe we have significant defenses in all of them, are vigorously defending all of them, and do not believe any of them will have a material adverse effect on our financial position. However, we could incur judgments, pay settlements, or revise our expectations regarding the outcome of any matter. Such developments, if any, could have a material adverse effect on our results of operations in the period in which applicable amounts are accrued, or on our cash flows in the period in which amounts are paid.
The actions and proceedings described in this section relate primarily to WMT, an indirect subsidiary of Wright Medical Group N.V., and are not necessarily applicable to Wright Medical Group N.V. or other affiliated entities. Maintaining separate legal entities within our corporate structure is intended to ring-fence liabilities. We believe our ring-fenced structure should preclude corporate veil-piercing efforts against entities whose assets are not associated with particular claims.
Governmental Inquiries
On August 3, 2012, we received a subpoena from the United States Attorney's Office for the Western District of Tennessee requesting records and documentation relating to our PROFEMUR® series of hip replacement devices. The subpoena covers the period from January 1, 2000 to August 2, 2012. We will continue to cooperate as required.
Patent Litigation
On September 23, 2014, Spineology filed a patent infringement lawsuit, Case No. 0:14-cv-03767, in the U.S. District Court in Minnesota, alleging that our X-REAM® bone reamer infringes U.S. Patent No. RE42,757 entitled “EXPANDABLE REAMER.” In January 2015, on the deadline for service of its complaint, Spineology dismissed its complaint without prejudice and filed a new, identical complaint. We filed an answer to the new complaint with the Court on April 27, 2015. The Court conducted a Markman hearing on March 23, 2016. Mediation was held on August 11, 2016, but no agreement could be reached. The Court issued a Markman decision on August 30, 2016, in which it found all asserted product claims invalid as indefinite under applicable patent laws and construed several additional claim terms. The parties completed fact and expert discovery with respect to the remaining asserted method claims. We filed a motion for summary judgment of non-infringement of the remaining asserted patent claims and motions to exclude testimony from Spineology’s technical and damages experts. Spineology filed a motion for summary judgment of infringement. On July 25, 2017, the Court granted our motion for summary judgment of non-infringement; denied Spineology’s motion for summary judgment of infringement; and denied all remaining motions as moot. The Court also entered judgment in our favor and against Spineology on all issues. Spineology has appealed the judgment to the U.S. Court of Appeals for the Federal Circuit and we are awaiting oral argument.
On September 13, 2016, we filed a civil action, Case No. 2:16-cv-02737-JPM, against Spineology in the U.S. District Court for the Western District of Tennessee alleging breach of contract, breach of implied warranty against infringement, and seeking a judicial declaration of indemnification from Spineology for patent infringement claims brought against us stemming from our sale and/or use of certain expandable reamers purchased from Spineology. Spineology filed a motion to dismiss on October 17, 2016, but withdrew the motion on November 28, 2016. On December 7, 2016, Spineology filed an answer to our complaint and counterclaims, including counterclaims relating to a 2004 non-disclosure agreement between Spineology and WMT. On December 28, 2016, we filed a motion to dismiss the counterclaims relating to that 2004 agreement. On January 4, 2017, Spineology filed a motion for summary judgment on certain claims set forth in our complaint. We opposed that motion. On January 27, 2017, we filed a motion for summary judgment on certain issues pertaining to our indemnification claims. Spineology opposed that motion. On July 7, 2017, the Court extended the deadlines for completing discovery until after it ruled on those pending motions. On August 29, 2017, the Court ruled on the motions to dismiss and for summary judgment. In view of that decision, on September 22, 2017, the parties stipulated, and the Court entered, a judgment that effectively ended the case in a draw. We have appealed the judgment as to our claims against Spineology to the U.S. Court of Appeals for the Sixth Circuit. Spineology did not appeal the District Court’s dismissal of its contract counterclaim.
In August 2016, we received a letter from KFx Medical Corporation (KFx) alleging that a legacy Tornier product (the Piton Suture Anchor) infringes one of KFx’s patents when used in knotless double row tissue fixation techniques. On April 6, 2017, we filed a declaratory judgment action in the United States District Court for the District of Delaware, Case No. 1:17-cv-00384, seeking declaratory judgment of non-infringement and invalidity of United States Patent Nos. 7,585,311; 8,100,942; and 8,109,969. On April 20, 2017, KFx filed an answer and counterclaim alleging we indirectly infringe, and induce infringement of, these patents. In February 2018, the parties reached a settlement in principle intended to fully resolve the matter and end the litigation. Under the settlement in principle, we will pay KFx a one-time lump sum license fee in an immaterial amount in exchange for a fully paid global license to the relevant KFx patents. The settlement is presently being documented.
43
Product Liability
We have been named as a defendant, in some cases with multiple other defendants, in lawsuits in which it is alleged that as yet unspecified defects in the design, manufacture, or labeling of certain metal-on-metal hip replacement products rendered the products defective. The lawsuits generally employ similar allegations that use of the products resulted in excessive metal ions and particulate in the patients into whom the devices were implanted, in most cases resulting in revision surgery (collectively, the CONSERVE® Claims) and generally seek monetary damages. We anticipate that additional lawsuits relating to metal-on-metal hip replacement products may be brought.
Because of the similar nature of the allegations made by several plaintiffs whose cases were pending in federal courts, upon motion of one plaintiff, Danny L. James, Sr., the United States Judicial Panel on Multidistrict Litigation on February 8, 2012 transferred certain actions pending in the federal court system related to metal-on-metal hip replacement products to the United States District Court for the Northern District of Georgia, for consolidated pre-trial management of the cases before a single United States District Court Judge (the MDL). The consolidated matter is known as In re: Wright Medical Technology, Inc. Conserve Hip Implant Products Liability Litigation.
Certain plaintiffs have elected to file their lawsuits in state courts in California. In doing so, most of those plaintiffs have named a surgeon involved in the design of the allegedly defective products as a defendant in the actions, along with his personal corporation. Pursuant to contractual obligations, we have agreed to indemnify and defend the surgeon in those actions. Similar to the MDL proceeding in federal court, because the lawsuits generally employ similar allegations, certain of those pending lawsuits in California were consolidated for pre-trial handling on May 14, 2012 pursuant to procedures of California State Judicial Counsel Coordinated Proceedings (the JCCP). The consolidated matter is known as In re: Wright Hip Systems Cases, Judicial Counsel Coordination Proceeding No. 4710.
Every metal-on-metal hip case involves fundamental issues of law, science and medicine that often are uncertain, that continue to evolve, and which present contested facts and issues that can differ significantly from case to case. Such contested facts and issues include medical causation, individual patient characteristics, surgery specific factors, statutes of limitation, and the existence of actual, provable injury.
The first bellwether trial in the MDL commenced on November 9, 2015 in Atlanta, Georgia. On November 24, 2015, the jury returned a verdict in favor of the plaintiff and awarded the plaintiff $1 million in compensatory damages and $10 million in punitive damages. We believe there were significant trial irregularities and vigorously contested the trial result. On December 28, 2015, we filed a post-trial motion for judgment as a matter of law or, in the alternative, for a new trial or a reduction of damages awarded. On April 5, 2016, the trial judge issued an order reducing the punitive damage award from $10 million to $1.1 million, but otherwise denied our motion. On May 4, 2016, we filed a notice of appeal with the United States Court of Appeals for the Eleventh Circuit. The United States Court of Appeals for the Eleventh Circuit heard oral arguments on January 26, 2017 and on March 20, 2017, the Eleventh Circuit Court of Appeals upheld the lower court’s verdict. On April 10, 2017, we filed a petition for rehearing en banc or for panel rehearing, which was denied. In light of this denial, we elected to forego a further appeal and paid the judgment in July 2017.
The first bellwether trial in the JCCP, which was scheduled to commence on October 31, 2016, and subsequently rescheduled to January 9, 2017, was settled for an immaterial amount.
The first state court metal-on-metal hip trial not part of the MDL or JCCP, Donald Deline v. Wright Medical Technology, Inc., et al, commenced on October 24, 2016 in the Circuit Court of St. Louis County, Missouri. On November 3, 2016, the jury returned a verdict in our favor. The plaintiff has appealed and the appellate court heard oral argument on November 8, 2017. On February 20, 2018, the Missouri Court of Appeals, Eastern District, denied the plaintiff’s appeal and upheld the verdict of the trial court.
As of December 31, 2017, there were approximately 800 lawsuits pending in the MDL and JCCP, and an additional 50 cases pending in various U.S. state courts. As of that date, we have also entered into approximately 700 so called “tolling agreements” with potential claimants who have not yet filed suit. The number of lawsuits pending in the MDL and JCCP and tolling agreements disclosed above includes the claims that have been resolved pursuant to the Master Settlement Agreement and Second Settlement Agreements discussed below. Based on presently available information, we believe approximately 300 of these matters allege claims involving bilateral implants. As of December 31, 2017, there were also approximately 50 non-U.S. lawsuits pending. We believe we have data that supports the efficacy and safety of our metal-on-metal hip products. While continuing to dispute liability, the parties continue to mediate unresolved claims.
On November 1, 2016, WMT entered into the MSA with Court-appointed attorneys representing plaintiffs in the MDL and JCCP. Under the terms of the MSA, the parties agreed to settle 1,292 specifically identified CONSERVE®, DYNASTY® and LINEAGE® claims that meet the eligibility requirements of the MSA and are either pending in the MDL or JCCP, or subject to court-approved tolling agreements in the MDL or JCCP, for a settlement amount of $240 million. Due to apparent demand from additional claimants excluded from settlement because of the 1,292 claims ceiling, but otherwise eligible for participation, on May 15, 2017,
44
WMT agreed to settle an additional 53 such claims, on terms substantially identical to the MSA settlement terms, for a maximum additional settlement amount of $9.4 million.
On October 3, 2017, WMT entered into the Second Settlement Agreements with the Court-appointed attorneys representing plaintiffs in the MDL and JCCP. Under the terms of the Second Settlement Agreements, the parties agreed to settle 629 specifically identified CONSERVE®, DYNASTY® and LINEAGE® claims that meet the eligibility requirements of the Second Settlement Agreements and are either pending in the MDL or JCCP, or subject to court-approved tolling agreements in the MDL or JCCP, for a maximum settlement amount of $89.75 million. The comprehensive settlement amount was contingent on WMT’s recovery of new insurance proceeds totaling at least $35 million from applicable insurance carriers by December 31, 2017. On December 29, 2017, WMT entered into a First Amendment to the Third Settlement Agreement pursuant to which the deadline for the recovery of new insurance proceeds totaling at least $35 million from applicable insurance carriers was extended through February 28, 2018 and, on February 23, 2018, WMT entered into a Second Amendment to the Third Settlement Agreement pursuant to which the deadline was extended through March 30, 2018.
We have received claims for personal injury against us associated with fractures of our PROFEMUR® long titanium modular neck product (Titanium Modular Neck Claims). As of December 31, 2017, there were approximately 30 pending U.S. lawsuits and approximately 60 pending non-U.S. lawsuits alleging such claims. These lawsuits generally seek monetary damages.
We are aware that MicroPort has recalled certain sizes of its cobalt chrome modular neck products as a result of alleged fractures. As of December 31, 2017, there were four pending U.S. lawsuits and eight pending non-U.S. lawsuits against us alleging personal injury resulting from the fracture of a cobalt chrome modular neck. These lawsuits generally seek monetary damages. On October 27, 2017, our primary insurance carrier agreed to defend us in connection with these lawsuits under a reservation of rights.
In June 2015, a jury returned a $4.4 million verdict against us in a case involving a fractured hip implant stem sold prior to the MicroPort closing. This was a one-of-a-kind case unrelated to the modular neck fracture cases we have previously reported. There are no other cases pending related to this component, nor are we aware of other instances where this component has fractured. The case, Alan Warner et al. vs. Wright Medical Technology, Inc. et al., case no. BC 475958, which was filed on December 27, 2011, was tried in the Superior Court of the State of California for the County of Los Angeles, Central District. In September 2015, the trial judge reduced the jury verdict to $1.025 million and indicated that if the plaintiff did not accept the reduced award he would schedule a new trial solely on the issue of damages. The plaintiff elected not to accept the reduced damage award, and both parties have appealed. The Court has not set a date for a new trial on the issue of damages and we do not expect it will do so until the appeals are adjudicated. On November 14, 2017, our primary insurance carrier agreed to defend and indemnify us in connection with this lawsuit under a reservation of rights. On January 9, 2018, the California appellate court heard oral argument on the parties’ cross-appeals.
Insurance Litigation
On June 10, 2014, St. Paul Surplus Lines Insurance Company (Travelers), which was an excess carrier in our coverage towers across multiple policy years, filed a declaratory judgment action in the Chancery Court of Shelby County, Tennessee naming us and certain of our other insurance carriers as defendants and asking the Court to rule on the rights and responsibilities of the parties with regard to the CONSERVE® Claims. This case is known as St. Paul Surplus Lines Insurance Company v. Wright Medical Group, Inc., et al. Among other things, Travelers appeared to dispute our contention that the CONSERVE® Claims arise out of more than a single occurrence thereby triggering multiple policy periods of coverage. Travelers further sought a determination as to the applicable policy period triggered by the alleged single occurrence. On June 17, 2014, we filed a separate lawsuit in the Superior Court of the State of California, County of San Francisco for declaratory judgment against certain carriers and breach of contract against the primary carrier, and moved to dismiss or stay the Tennessee action on a number of grounds, including that California is the most appropriate jurisdiction. This case is known as Wright Medical Group, Inc. et al. v. Federal Insurance Company, et al. On September 9, 2014, the California Court granted Travelers' motion to stay our California action. On April 29, 2016, we filed a dispositive motion seeking partial judgment in our favor in the Tennessee action, which motion is pending and has been referred to a Special Master to consider the parties’ arguments. On June 10, 2016, Travelers withdrew its motion for summary judgment in the Tennessee action. One of the other insurance companies in the Tennessee action has stated that it will re-file a similar motion in the future.
In March 2017, Lexington Insurance Company (Lexington), which had been dismissed from the Tennessee action, requested arbitration under five Lexington insurance policies in connection with the CONSERVE® Claims. We subsequently engaged in discussions and correspondence with Lexington about the scope of the requested arbitration(s). On or about October 27, 2017, Lexington filed an Application for Order to Compel Arbitration in the Commonwealth of Massachusetts, Suffolk County Superior Court, naming WMT, Wright Medical Group, Inc., and Wright Medical Group N.V. We opposed the Application, which remains pending.
On October 28, 2016, WMT and WMG entered into a Settlement Agreement, Indemnity and Hold Harmless Agreement and Policy Buyback Agreement (Insurance Settlement Agreement) with a subgroup of three insurance carriers, namely Columbia, Travelers and AXIS Surplus Lines Insurance Company (collectively, the Three Settling Insurers), pursuant to which the Three Settling
45
Insurers paid WMT an aggregate of $60 million (in addition to $10 million previously paid by Columbia) in a lump sum. This amount is in full satisfaction of all potential liability of the Three Settling Insurers relating to metal-on-metal hip and similar metal ion release claims, including but not limited to all claims in the MDL and the JCCP, and all claims asserted by WMT against the Three Settling Insurers in the Tennessee action described above. The amount due under the Insurance Settlement Agreement was paid in the fourth quarter of 2016 and the Three Settling Insurers have been dismissed from the Tennessee action.
On December 13, 2016, we filed a motion in the Tennessee action described above to include allegations of bad faith against the primary insurance carrier. The motion was subsequently amended on February 8, 2017 to add similar bad faith claims against the remaining excess carriers. On April 13, 2017, the Court denied our motion, without prejudice to our right to re-assert the motion at a later time. On August 29, 2017, we refiled the motion to add a bad faith claim against the primary and excess insurance carriers. The Court granted our motion on October 19, 2017 and, on October 23, 2017, we filed amended cross-claims alleging bad faith against all of the insurance carriers. On November 9, 2017, our primary insurance carrier brought a motion to dismiss and strike our bad faith claim. The remaining excess carriers either joined the primary insurer’s motion or brought their own separate motions. On December 22, 2017 and December 29, 2017, we opposed the insurers’ motions to dismiss and strike our claim for bad faith. The motions remain pending. Two of the remaining insurers in the Tennessee action take the position that certain prior payments made by them totaling $10 million were purportedly made under reservations of rights and they claim the right to seek recoupment of those prior payments.
On February 22, 2018, we and certain of our subsidiaries entered into a Settlement and Release Agreement (Second Insurance Settlement Agreement) with Federal Insurance Company (a subsidiary of Chubb Insurance) (Federal), pursuant to which Federal agreed to pay us an aggregate of $15 million (in addition to $5 million previously paid by Federal) in a lump sum on or before the 10th business day after execution of the Second Insurance Settlement Agreement. This amount will be in full satisfaction of all potential liability of Federal relating to designated metal-on-metal hip claims, including but not limited to all claims asserted by our subsidiary WMT against Federal in the previously disclosed insurance coverage litigation. On February 9, 2018, the Tennessee action was stayed for 60 days to allow Wright and Federal to finalize and document their settlement and for the remaining parties to negotiate potential settlement of all remaining claims.
On September 29, 2015, Markel International Insurance Company Ltd., as successor to Max Insurance Europe Ltd. (Max Insurance), which is the third insurance carrier in our coverage towers across multiple policy years, asserted that the terms and conditions identified in its reservation of rights will preclude coverage for the Titanium Modular Neck Claims. We strongly dispute the carrier's position, and in accordance with the dispute resolution provisions of the policy, on January 18, 2016, we filed a Notice of Arbitration against Max Insurance in London, England pursuant to the provisions of the Arbitration Act of 1996. We are seeking reimbursement, up to the policy limits of $25 million, of costs incurred in the defense and settlement of the Titanium Modular Neck Claims. The parties have conducted two rounds of arbitration with the most recent round concluding on February 15, 2018. The parties await the decision of the arbitration tribunal.
Wright/Tornier Merger Related Litigation
On November 26, 2014, a class action complaint was filed in the Circuit Court of Tennessee, for the Thirtieth Judicial District, at Memphis (Tennessee Circuit Court), by a purported shareholder of WMG under the caption City of Warwick Retirement System v. Gary D. Blackford et al., CT-005015-14. An amended complaint in the action was filed on January 5, 2015. The amended complaint names as defendants WMG, Tornier, Trooper Holdings Inc. (Holdco), Trooper Merger Sub Inc. (Merger Sub), and the members of the WMG board of directors. The amended complaint asserts various causes of action, including, among other things, that the members of the WMG board of directors breached their fiduciary duties owed to the WMG shareholders in connection with entering into the merger agreement, approving the merger, and causing WMG to issue a preliminary Form S-4 that allegedly fails to disclose material information about the merger. The amended complaint further alleges that Tornier, Holdco, and Merger Sub aided and abetted the alleged breaches of fiduciary duties by the WMG board of directors. The plaintiff is seeking, among other things, injunctive relief enjoining or rescinding the merger and an award of attorneys’ fees and costs.
On December 2, 2014, a separate class action complaint was filed in the Tennessee Chancery Court by a purported shareholder of WMG under the caption Paulette Jacques v. Wright Medical Group, Inc., et al., CH-14-1736-1. An amended complaint in the action was filed on January 27, 2015. The amended complaint names as defendants WMG, Tornier, Holdco, Merger Sub, Warburg Pincus LLC and the members of the WMG board of directors. The amended complaint asserts various causes of action, including, among other things, that the members of the WMG board of directors breached their fiduciary duties owed to the WMG shareholders in connection with entering into the merger agreement, approving the merger, and causing WMG to issue a preliminary Form S-4 that allegedly fails to disclose material information about the merger. The amended complaint further alleges that WMG, Tornier, Warburg Pincus LLC, Holdco and Merger Sub aided and abetted the alleged breaches of fiduciary duties by the WMG board of directors. The plaintiff is seeking, among other things, injunctive relief enjoining or rescinding the merger and an award of attorneys’ fees and costs.
In an order dated March 31, 2015, the Tennessee Circuit Court transferred City of Warwick Retirement System v. Gary D. Blackford et al., CT-005015-14 to the Tennessee Chancery Court for consolidation with Paulette Jacques v. Wright Medical Group, Inc., et
46
al., CH-14-1736-1 (Consolidated Tennessee Action). In an order dated April 9, 2015, the Tennessee Chancery Court stayed the Consolidated Tennessee Action; that stay expired upon completion of the Wright/Tornier merger. On September 19, 2016, the Tennessee Chancery Court entered an agreed order, dismissing the Jacques case without prejudice.
Other
In addition to those noted above, we are subject to various other legal proceedings, product liability claims, corporate governance, and other matters which arise in the ordinary course of business.
Item 4. Mine Safety Disclosures.
Not applicable.
47
PART II
Item 5. Market for Registrant’s Common Equity, Related Shareholder Matters and Issuer Purchases of Equity Securities.
Market Information
Our ordinary shares are traded on the Nasdaq Global Select Market under the symbol “WMGI.” Prior to the completion of the Wright/Tornier merger on October 1, 2015, legacy Tornier ordinary shares traded under the symbol “TRNX” while legacy Wright ordinary shares traded under the symbol “WMGI.” Due to the “reverse acquisition” nature of the Wright/Tornier merger, historical information below reflects the high and low sales prices of legacy Tornier.
The following table sets forth, for the periods indicated, the high and low per share sales prices for our ordinary shares as reported by the Nasdaq Global Select Market.
High | Low | ||||||
Fiscal Year 2017 | |||||||
First Quarter | $ | 31.31 | $ | 22.14 | |||
Second Quarter | $ | 31.53 | $ | 25.49 | |||
Third Quarter | $ | 29.89 | $ | 24.30 | |||
Fourth Quarter | $ | 27.62 | $ | 22.18 | |||
Fiscal Year 2016 | |||||||
First Quarter | $ | 24.43 | $ | 15.02 | |||
Second Quarter | $ | 20.75 | $ | 15.52 | |||
Third Quarter | $ | 25.50 | $ | 15.85 | |||
Fourth Quarter | $ | 25.15 | $ | 20.50 | |||
Holders
As of February 23, 2018, there were 347 holders of record of our ordinary shares.
Dividends
We have not previously declared or paid cash dividends on our ordinary shares. We currently intend to retain all future earnings for the operation and expansion of our business. We do not anticipate declaring or paying cash dividends on our ordinary shares in the foreseeable future. Any payment of cash dividends on our ordinary shares will be at the discretion of our board of directors and will depend upon our results of operations, earnings, capital requirements, contractual restrictions, and other factors deemed relevant by our board of directors. Additionally, our ABL Credit Agreement restricts our ability to pay dividends.
Purchases of Equity Securities by the Company
We did not purchase any ordinary shares or other equity securities of our company during the fourth fiscal quarter ended December 31, 2017.
Recent Sales of Unregistered Securities
We did not issue any ordinary shares or other equity securities of our company that were not registered under the Securities Act of 1933, as amended, during the fourth fiscal quarter ended December 31, 2017, other than the issuance of 661,753 ordinary shares in connection with our acquisition of IMASCAP as described in Note 3 to our consolidated financial statements contained in “Item 8. Financial Statements and Supplementary Data.”
48
Comparison of Total Shareholder Returns
The graph below compares the cumulative total shareholder returns for legacy Tornier ordinary shares from the period from December 31, 2012 to October 1, 2015, the date of the Wright/Tornier merger, and our combined company ordinary shares from October 1, 2015 to December 31, 2017 (our fiscal year-end). The graph also reflects cumulative total shareholder returns from an index composed of U.S. companies whose stock is listed on the Nasdaq Global Select Market (Nasdaq U.S. Composite Index) and an index consisting of Nasdaq-listed companies in the surgical, medical and dental instruments and supplies industry (Nasdaq Medical Equipment Subsector), as well as an index of companies with the SIC Code 384 - Surgical, Medical, and Dental Instruments Supplies (Surgical, Medical, and Dental Instruments Index). Total returns for the indices are weighted based on the market capitalization of the companies included therein. In addition, due to the “reverse acquisition” nature of the Wright/Tornier merger and the fact that the historical financial statements of legacy Wright have replaced the historical financial statements of legacy Tornier, the graph below also includes the cumulative total shareholder returns for WMG common stock from December 31, 2012 to October 1, 2015, the date of the Wright/Tornier merger.
The graph assumes that $100.00 was invested on December 31, 2012, in legacy Tornier/Wright Medical Group N.V. ordinary shares, legacy Wright common stock, the Nasdaq U.S. Composite Index, the Nasdaq Medical Equipment Subsector, and the Surgical, Medical, and Dental Instruments Supplies Index, and that all dividends were reinvested. Total returns for the Nasdaq indices are weighted based on the market capitalization of the companies included therein.
Historical price performance of our ordinary shares is not indicative of future share price performance. We do not make or endorse any prediction as to future share price performance.
2012 | 2013 | 2014 | 2015 | 2016 | 2017 | |||||||||||||
Legacy Tornier / Wright Medical Group N.V. | $ | 100.00 | $ | 112.28 | $ | 156.29 | $ | 144.63 | $ | 143.09 | $ | 136.28 | ||||||
Legacy Wright | 100.00 | 148.74 | 131.21 | 103.80 | — | — | ||||||||||||
Nasdaq Stock Market (US Companies) | 100.00 | 141.46 | 166.31 | 177.88 | 196.62 | 207.11 | ||||||||||||
Nasdaq Medical Equipment Index | 100.00 | 118.85 | 139.53 | 163.77 | 180.90 | 257.33 | ||||||||||||
SIC Code 384 - Surgical, Medical, and Dental Instruments and Supplies | 100.00 | 134.79 | 166.25 | 177.22 | 194.79 | 250.79 | ||||||||||||
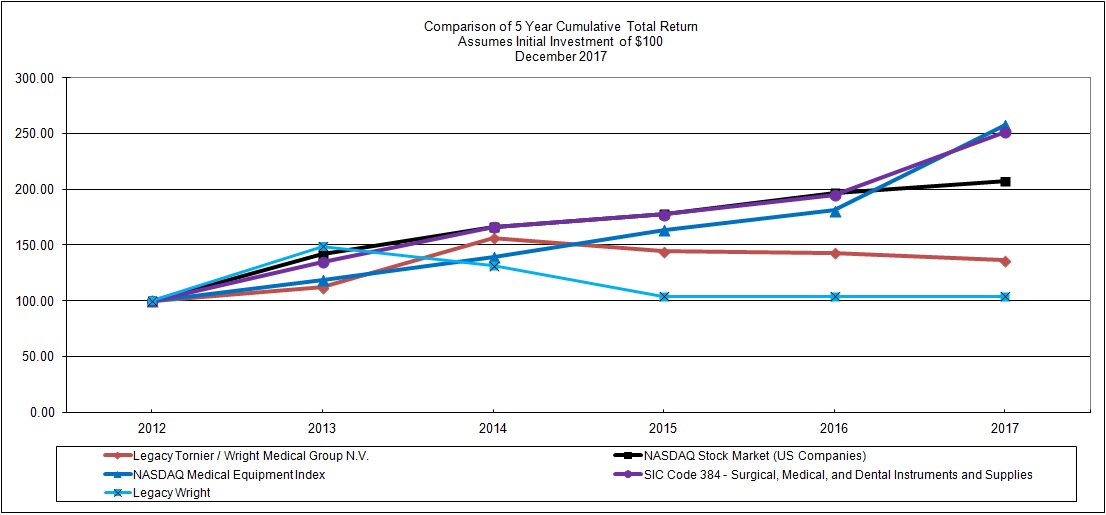
Prepared by Zacks Investment Research, Inc. Used with permission. All rights reserved. Copyright 1980-2018
49
Item 6. Selected Financial Data.
The following tables set forth certain of our selected consolidated financial data as of the dates and for the years indicated. Due to the “reverse acquisition” nature of the Wright/Tornier merger, the historical financial statements of legacy Wright replaced the historical financial statements of legacy Tornier. Historical results are not necessarily indicative of the results to be expected for any future period. These tables are presented in thousands, except per share data.
Fiscal year ended | |||||||||||||||||||
December 31, 2017 | December 25, 2016 | December 27, 2015 1 | December 31, 2014 | December 31, 2013 | |||||||||||||||
Consolidated Statement of Operations: | |||||||||||||||||||
Net sales | $ | 744,989 | $ | 690,362 | $ | 405,326 | $ | 298,027 | $ | 242,330 | |||||||||
Cost of sales 2 | 160,947 | 192,407 | 113,622 | 73,223 | 59,721 | ||||||||||||||
Gross profit | 584,042 | 497,955 | 291,704 | 224,804 | 182,609 | ||||||||||||||
Operating expenses: | |||||||||||||||||||
Selling, general and administrative 2 | 525,222 | 541,558 | 424,377 | 289,620 | 230,785 | ||||||||||||||
Research and development 2 | 50,115 | 50,514 | 39,339 | 24,963 | 20,305 | ||||||||||||||
Amortization of intangible assets | 28,396 | 28,841 | 16,754 | 10,027 | 7,476 | ||||||||||||||
BioMimetic impairment charges | — | — | — | — | 206,249 | ||||||||||||||
Total operating expenses | 603,733 | 620,913 | 480,470 | 324,610 | 464,815 | ||||||||||||||
Operating loss 3 | (19,691 | ) | (122,958 | ) | (188,766 | ) | (99,806 | ) | (282,206 | ) | |||||||||
Interest expense, net 4 | 74,644 | 58,530 | 41,358 | 17,398 | 16,040 | ||||||||||||||
Other expense (income), net 5 | 5,570 | (3,148 | ) | 10,884 | 129,626 | (67,843 | ) | ||||||||||||
Loss before income taxes | (99,905 | ) | (178,340 | ) | (241,008 | ) | (246,830 | ) | (230,403 | ) | |||||||||
(Benefit) provision for income taxes 6 | (34,968 | ) | (13,406 | ) | (3,652 | ) | (6,334 | ) | 49,765 | ||||||||||
Net loss from continuing operations | (64,937 | ) | (164,934 | ) | (237,356 | ) | (240,496 | ) | (280,168 | ) | |||||||||
(Loss) income from discontinued operations, net of tax 2 | (137,661 | ) | (267,439 | ) | (61,345 | ) | (19,187 | ) | 6,223 | ||||||||||
Net loss | $ | (202,598 | ) | $ | (432,373 | ) | $ | (298,701 | ) | $ | (259,683 | ) | $ | (273,945 | ) | ||||
Net loss from continuing operations per share — basic and diluted: | $ | (0.62 | ) | $ | (1.60 | ) | $ | (3.66 | ) | $ | (4.69 | ) | $ | (5.82 | ) | ||||
Weighted-average number of ordinary shares outstanding — basic and diluted | 104,531 | 102,968 | 64,808 | 51,293 | 48,103 | ||||||||||||||
December 31, 2017 | December 25, 2016 | December 27, 2015 | December 31, 2014 | December 31, 2013 | |||||||||||||||
Consolidated Balance Sheet Data: | |||||||||||||||||||
Cash and cash equivalents | $ | 167,740 | $ | 262,265 | $ | 139,804 | $ | 227,326 | $ | 168,534 | |||||||||
Restricted cash | — | 150,000 | — | — | — | ||||||||||||||
Marketable securities | — | — | — | 2,575 | 14,548 | ||||||||||||||
Working capital | 151,599 | 285,107 | 352,946 | 249,958 | 375,901 | ||||||||||||||
Total assets | 2,128,724 | 2,290,586 | 2,073,494 | 885,068 | 990,090 | ||||||||||||||
Long-term liabilities | 1,124,733 | 1,129,204 | 811,530 | 419,204 | 411,711 | ||||||||||||||
Shareholders’ equity | 588,696 | 686,864 | 1,055,026 | 278,803 | 459,714 | ||||||||||||||
50
Fiscal year ended | |||||||||||||||||||
December 31, 2017 | December 25, 2016 | December 27, 2015 | December 31, 2014 | December 31, 2013 | |||||||||||||||
Other Data: | |||||||||||||||||||
Cash flow (used in) provided by operating activities | $ | (184,810 | ) | $ | 37,824 | $ | (195,870 | ) | $ | (116,002 | ) | $ | (36,601 | ) | |||||
Cash flow (used in) provided by investing activities | (109,421 | ) | (34,241 | ) | (15,970 | ) | 145,630 | (121,317 | ) | ||||||||||
Cash flow provided by financing activities | 46,816 | 270,417 | 126,862 | 33,051 | 6,257 | ||||||||||||||
Depreciation 1 | 56,832 | 55,830 | 28,390 | 18,582 | 26,296 | ||||||||||||||
Share-based compensation expense | 19,393 | 14,416 | 24,964 | 11,487 | 15,368 | ||||||||||||||
Capital expenditures | 63,474 | 50,099 | 43,666 | 48,603 | 37,530 | ||||||||||||||
______________________________________
1 | The 2015 results were restated for the divestiture of our Large Joints business. (See Note 4). |
2 | These line items include the following amounts of non-cash, share-based compensation expense for the periods indicated: |
Fiscal year ended | |||||||||||||||||||
December 31, 2017 | December 25, 2016 | December 27, 2015 | December 31, 2014 | December 31, 2013 | |||||||||||||||
Cost of sales | $ | 565 | $ | 414 | $ | 287 | $ | 254 | $ | 503 | |||||||||
Selling, general and administrative | 17,705 | 13,216 | 22,777 | 10,149 | 10,675 | ||||||||||||||
Research and development | 1,123 | 786 | 1,900 | 1,084 | 780 | ||||||||||||||
Discontinued operations | — | — | — | — | 3,410 | ||||||||||||||
3 | During the fiscal year ended December 31, 2017, we recognized: (a) $12.4 million of transaction and transition costs related to the Wright/Tornier merger and (b) a benefit of $9.0 million from incentive and indirect tax projects. During the fiscal year ended December 25, 2016, we recognized: (a) $37.7 million of inventory step-up amortization; (b) $36.4 million of transaction and transition costs related to the Wright/Tornier merger; (c) $1.8 million of costs related to a legal settlement; (d) $1.3 million of costs associated with executive management changes; and (e) $0.2 million of costs associated with debt refinancing. During the fiscal year ended December 27, 2015, we recognized: (a) $82.2 million of due diligence, transaction, and transition costs related to the Wright/Tornier merger; (b) $14.2 million of share-based compensation acceleration; and (c) $10.3 million of inventory step-up amortization. During the fiscal year ended December 31, 2014, we recognized: (a) $14.1 million of due diligence, transaction, and transition costs related to the Biotech, Solana, and OrthoPro acquisitions; (b) $11.9 million of charges related to the Wright/Tornier merger; (c) $5.9 million of transition costs related to the OrthoRecon divestiture; (d) $2.1 million of costs associated with distributor conversions and non-competes; (e) $1.2 million of costs associated with management changes; and (f) $0.9 million of costs associated with a patent dispute settlement. During the fiscal year ended December 31, 2013, we recognized: (a) $206.2 million of BioMimetic impairment charges; (b) $21.6 million in transaction costs for the OrthoRecon divestiture; (c) $12.9 million of due diligence and transaction costs related to the BioMimetic and Biotech acquisitions; and (d) $3.7 million of costs associated with distributor conversions and non-competes. |
4 | During the fiscal year ended December 31, 2017, we recognized: (a) $45.5 million of non-cash interest expense related to the amortization of the debt discount on our 2017, 2020 and 2021 convertible notes and (b) $0.2 million of interest income from incentive and indirect tax projects. During the fiscal year ended December 25, 2016, we recognized: (a) $36.6 million of non-cash interest expense related to the amortization of the debt discount on our 2017, 2020 and 2021 convertible notes and (b) a $0.8 million of interest income related to the settlement of an IRS audit. |
5 | During the fiscal year ended December 31, 2017, we recognized: (a) a $5.3 million loss from mark-to-market adjustments on the CVRs issued in connection with the BioMimetic acquisition; (b) $4.8 million gain for the mark-to-market adjustment of our derivative instruments; (c) a benefit of $0.6 million from incentive and indirect tax projects; and (d) $0.1 million of charges due to the fair value adjustment to contingent consideration. During the fiscal year ended December 25, 2016, we recognized: (a) $28.3 million gain for the mark-to-market adjustment of our derivative instruments; (b) a $12.3 million non-cash loss on extinguishment of debt to write-off unamortized debt discount and deferred financing fees associated with the partial settlement of 2017 and 2020 convertible notes; (c) a $8.7 million loss from mark-to-market adjustments on the Contingent Value Rights (CVRs) issued in connection with the BioMimetic acquisition; and (d) $0.5 million of charges due to the fair value adjustment to contingent consideration. During the fiscal year ended December 27, 2015, we recognized: (a) $9.8 million gain for the mark-to-market adjustment of our derivative instruments and (b) a $7.6 million gain from mark-to-market adjustments on the CVRs issued in connection with the BioMimetic acquisition. During the fiscal year ended December 31, 2014, we recognized: (a) approximately $125 million from mark-to-market adjustments on the CVRs issued in connection with the BioMimetic acquisition; (b) $2.0 million of charges for the mark-to-market adjustment of our derivative instruments; and (c) $1.8 million of charges due to the fair value adjustment to contingent consideration associated with our acquisition of WG Healthcare. |
51
During the fiscal year ended December 31, 2013, we recognized a $7.8 million gain related to the previously held investment in BioMimetic.
6 | During the fiscal year ended December 31, 2017, we recognized: (a) a $25.0 million tax benefit related to the realizability of net operating losses and (b) tax law reform changes in the U.S. and France resulting in an $8.3 million tax benefit. During the fiscal year ended December 25, 2016, we recognized a $2.3 million income tax benefit related to the settlement of an IRS audit. During the fiscal year ended December 31, 2013, we recognized a $119.6 million tax valuation allowance recorded against deferred tax assets in our U.S. jurisdiction due to recent operating losses. |
52
Item 7. Management’s Discussion and Analysis of Financial Condition and Results of Operations.
The following management's discussion and analysis of financial condition and results of operations describes the principal factors affecting the results of our operations, financial condition, and changes in financial condition, as well as our critical accounting estimates.
On October 1, 2015, we became Wright Medical Group N.V. following the merger of Wright Medical Group, Inc. with Tornier N.V. Because of the structure of the merger and the governance of the combined company immediately post-merger, the merger was accounted for as a “reverse acquisition” under US GAAP, and as such, legacy Wright was considered the acquiring entity for accounting purposes. Therefore, legacy Wright’s historical results of operations replaced legacy Tornier’s historical results of operations for all periods prior to the merger. More specifically, the accompanying consolidated financial statements for periods prior to the merger are those of legacy Wright and its subsidiaries, and for periods subsequent to the merger also include legacy Tornier and its subsidiaries.
On October 21, 2016, pursuant to a binding offer letter dated as of July 8, 2016, we, Corin, and certain other entities related to us entered into a business sale agreement and simultaneously completed and closed the sale of our Large Joints business. The financial results of our Large Joints business, including costs associated with corporate employees and infrastructure transferred as a part of the sale and services we are providing Corin under a transitional services agreement and supply agreement, are reflected within discontinued operations for all periods presented, unless otherwise noted. Further, all assets and associated liabilities transferred to Corin were classified as assets and liabilities held for sale in our consolidated balance sheet as of December 27, 2015.
On January 9, 2014, legacy Wright completed the sale of its OrthoRecon business to MicroPort. The financial results of the OrthoRecon business are reflected within discontinued operations for all periods presented, unless otherwise noted.
All current and historical operating results for the Large Joints and OrthoRecon businesses are reflected within discontinued operations in the consolidated financial statements.
Other than the discontinued operations discussed in Note 4 to our consolidated financial statements contained in “Item 8. Financial Statements and Supplementary Data”, unless otherwise stated, all discussion of assets and liabilities in the notes to the consolidated financial statements and in this section reflects the assets and liabilities held and used in our continuing operations, and all discussion of revenues and expenses reflects those associated with our continuing operations.
References in this section to “we,” “our” and “us” refer to Wright Medical Group N.V. and its subsidiaries after the Wright/Tornier merger and Wright Medical Group, Inc. and its subsidiaries before the merger. Our fiscal year-end is generally determined on a 52-week basis and runs from the Monday nearest to the 31st of December of a year, and ends on the Sunday nearest to the 31st of December of the following year. Every few years, it is necessary to add an extra week to the year making it a 53-week period. The fiscal year ended December 31, 2017 was a 53-week period. References in this report to a particular year generally refer to the applicable fiscal year. Accordingly, references to “2017” or “the year ended December 31, 2017” mean the fiscal year ended December 31, 2017.
Executive Overview
Company Description. We are a global medical device company focused on extremities and biologics products. We are committed to delivering innovative, value-added solutions improving quality of life for patients worldwide and are a recognized leader of surgical solutions for the upper extremities (shoulder, elbow, wrist and hand), lower extremities (foot and ankle) and biologics markets, three of the fastest growing segments in orthopaedics.
Our global corporate headquarters are located in Amsterdam, the Netherlands. We also have significant operations located in Memphis, Tennessee (U.S. headquarters, research and development, sales and marketing administration, and administrative activities); Bloomington, Minnesota (upper extremities sales and marketing and warehousing operations); Arlington, Tennessee (manufacturing and warehousing operations); Franklin, Tennessee (manufacturing and warehousing operations); Montbonnot, France (manufacturing and warehousing operations); Plouzané, France (research and development); and Macroom, Ireland (manufacturing). In addition, we have local sales and distribution offices in Canada, Australia, Asia, Latin America, and throughout Europe.
We offer a broad product portfolio of approximately 150 extremities products and over 20 biologics products that are designed to provide solutions to our surgeon customers, with the goal of improving clinical outcomes and the “quality of life” for their patients. Our product portfolio consists of the following product categories:
• | Upper extremities, which include joint implants and bone fixation devices for the shoulder, elbow, wrist, and hand; |
• | Lower extremities, which include joint implants and bone fixation devices for the foot and ankle; |
• | Biologics, which include products used to support treatment of damaged or diseased bone, tendons, and soft tissues or to stimulate bone growth; and |
53
• | Sports medicine and other, which include products used across several anatomic sites to mechanically repair tissue-to-tissue or tissue-to-bone injuries and other ancillary products. |
Our sales and distribution system in the United States currently consists of 82 geographic sales territories that are staffed by over 500 direct sales representatives and 27 independent sales agencies or distributors. These sales representatives and independent sales agencies and distributors are generally aligned to selling either our upper extremities products or lower extremities products, but, in some cases, certain agencies or direct sales representatives sell products from both our upper and lower extremities product portfolios in their territories. Internationally, we utilize several distribution approaches that are tailored to the needs and requirements of each individual market. Our international sales and distribution system currently consists of 15 direct sales offices and approximately 90 distributors that sell our products in approximately 50 countries, with principal markets outside the United States in Europe, Asia, Canada, Australia, and Latin America. Our U.S. sales accounted for 74.4% of total net sales in 2017.
Principal Products. We have focused our efforts into growing our position in the high-growth extremities and biologics markets. We believe a more active and aging patient population with higher expectations regarding “quality of life,” an increasing global awareness of extremities and biologics solutions, improved clinical outcomes as a result of the use of such products, and technological advances resulting in specific designs for such products that simplify procedures and address unmet needs for early interventions, and the growing need for revisions and revision-related solutions will drive the market for extremities and biologics products.
The extremities market is one of the fastest growing market segments within orthopaedics, with annual growth rates of 7-10%. We believe major trends in the extremities market include procedure-specific and anatomy-specific devices, locking plates, and an increase in total ankle replacement or arthroplasty procedures. Upper extremities reconstruction involves implanting devices to replace, reconstruct, or fixate injured or diseased joints and bones in the shoulder, elbow, wrist, and hand. It is estimated that approximately 60% of the upper extremities market is in total shoulder replacement or arthroplasty implants. We believe major trends in the upper extremities market include next-generation joint arthroplasty systems, bone preserving solutions, virtual planning systems, and revision of failed previous shoulder replacements in older patients. Lower extremities reconstruction involves implanting devices to replace, reconstruct, or fixate injured or diseased joints and bones in the foot and ankle. A large segment of the lower extremities market is comprised of plating and screw systems for reconstructing and fusing joints or repairing bones after traumatic injury. We believe major trends in the lower extremities market include the use of external fixation devices in diabetic patients, total ankle arthroplasty, advanced tissue fixation devices, virtual planning systems, and biologics. New technologies have been introduced into the lower extremities market in recent years, including next-generation total ankle replacement systems.
Our principal upper extremities products include the AEQUALIS ASCEND® and SIMPLICITI® total shoulder replacement systems, the AEQUALIS® REVERSED II™ reversed shoulder system, and the AEQUALIS ASCEND® FLEX™ convertible shoulder system. SIMPLICITI® is the first minimally invasive, ultra-short stem total shoulder available in the United States. We believe SIMPLICITI® allows us to expand the market to include younger patients that historically have deferred these procedures. In December 2016, we received FDA 510(k) clearance of our AEQUALIS® PERFORM™ REVERSED Glenoid System, our first reverse augmented glenoid, and we commercially launched it during the first quarter of 2017. Other principal upper extremities products include the EVOLVE® radial head prosthesis for elbow fractures, the EVOLVE® Elbow Plating System, RAYHACK® osteotomy system, and the MICRONAIL® intramedullary wrist fracture repair system.
Our principal lower extremities products include the INBONE® and INFINITY® Total Ankle Replacement Systems, both of which can be used with our PROPHECY® Preoperative Navigation Guides, which combine computer imaging with a patient’s CT scan, and are designed to provide alignment accuracy while reducing surgical steps. Our lower extremities products also include the CLAW® II Polyaxial Compression Plating System, the ORTHOLOC® 3Di Reconstruction Plating System, the PhaLinx® System used for hammertoe indications, PRO-TOE® VO Hammertoe System, the DARCO® family of locked plating systems, the VALOR® ankle fusion nail system, and the Swanson line of toe joint replacement products. Physician testing of our most recent total ankle replacement product, the INVISIONTM Total Ankle Revision System, began in 2016 and reached full commercial launch in the third quarter of 2017. The MICA™ Minimally-Invasive Foot and Ankle system was launched to limited users in the third quarter of 2017. Full commercial launch of MICA™ is planned for the second half of 2018. We also launched and plan to continue to launch during 2018 a number of line extensions to the SALVATION™ limb salvage portfolio. We expect demand for these new products during 2018.
Our biologic products use both biological tissue-based and synthetic materials to allow the body to regenerate damaged or diseased bone and to repair damaged or diseased soft tissue. The newest addition to our biologics product portfolio is AUGMENT® Bone Graft, which is based on recombinant human platelet-derived growth factor (rhPDGF-BB), a synthetic copy of one of the body’s principal healing agents. FDA approval of AUGMENT® Bone Graft in the United States for ankle and/or hindfoot fusion indications occurred during the third quarter of 2015. Prior to FDA approval, this product was available for sale in Canada for foot and ankle fusion indications and in Australia and New Zealand for hindfoot and ankle fusion indications. The AUGMENT® Bone Graft product line was acquired from BioMimetic in March 2013. We are currently pursuing FDA approval of AUGMENT® Injectable Bone Graft with a PMA Panel Track Supplement as described within the In-process research and development section below. Our
54
other principal biologics products include the GRAFTJACKET® line of soft tissue repair and containment membranes, the ALLOMATRIX® line of injectable tissue-based bone graft substitutes, the PRO-DENSE® Injectable Graft, the OSTEOSET® synthetic bone graft substitute, and the PRO-STIM® Injectable Inductive Graft.
Significant Business Developments. On December 14, 2017, we completed the acquisition of IMASCAP, a leader in the development of software-based solutions for preoperative planning of shoulder replacement surgery. The intent of this transaction is to ensure exclusive access to breakthrough software enabling technology and patents to further differentiate our product portfolio and to further accelerate growth opportunities in our global extremities business. Under the terms of the agreement with IMASCAP, we acquired 100% of IMASCAP’s outstanding equity on a fully diluted basis for an initial payment of €52.9 million, or approximately $62.3 million, consisting of approximately €39.7 million, or approximately $46.7 million, in cash and approximately €13.2 million, or approximately $15.6 million, representing 661,753 Wright ordinary shares, payable at closing. Additionally the purchase price includes an estimated €15.1 million, or approximately $17.8 million, of contingent consideration related to the achievement of certain technical milestones and sales earnouts. The technical milestones involve the development and approval of a patient specific implant system and new software modules. The sales earnouts relate to patient specific guides and the future patient specific implant system.
On October 3, 2017, WMT and the Court-appointed attorneys representing plaintiffs in the metal-on-metal hip replacement product liability litigation pending before the MDL and the JCCP agreed on a comprehensive settlement intended to resolve substantially all remaining metal-on-metal hip claims pending or tolled in the MDL and JCCP that were not settled in the previously disclosed MSA dated November 1, 2016. The comprehensive settlement is evidenced by the Second Settlement Agreements. The comprehensive settlement was contingent on availability of new insurance proceeds totaling at least $35 million from applicable insurance carriers by December 31, 2017. On December 29, 2017, WMT entered into a First Amendment to the Third Settlement Agreement pursuant to which the deadline for the recovery of new insurance proceeds totaling at least $35 million from applicable insurance carriers was extended through February 28, 2018 and, on February 23, 2018, WMT entered into a Second Amendment to the Third Settlement Agreement pursuant to which the deadline was extended through March 30, 2018. To date, certain of the insurance carriers have contributed or agreed to contribute $20 million of funds applicable against the contingency.
During the third quarter of 2017, we completed a key initiative by transferring our U.S. upper extremities inventory into a hub network, similar to how we operate our U.S. lower extremities inventory. We believe this will enable us to have more control and visibility over the performance of our field inventory and instrument sets, resulting in an increase in our set turns and a reduction in our field inventory days on hand and improve sales representative productivity.
During the fourth quarter of 2017, we finalized our key initiative to improve case planning with our surgeons in order reduce the amount of inventory delivered for surgery in the fourth quarter of 2017. This initiative has enabled us to be more efficient while providing superior service to our surgeons.
During the first half of 2017, we selectively expanded our U.S. sales force by adding additional direct quota-carrying representatives, primarily weighted towards the lower extremities business. Of these new direct quota-carrying representatives, most of them were current associate sales representatives that moved up to be quota-carrying representatives. Full year growth in the core U.S. lower extremities and core biologics portfolio was significantly lower than our more technologically advanced products due to slower than anticipated benefit from the sales representative additions that we made earlier in the year.
Financial Highlights. Net sales increased 7.9% totaling $745.0 million in 2017, compared to $690.4 million in 2016, driven primarily by 9.3% growth in our U.S. net sales.
Our U.S. net sales increased by $47.0 million, or 9.3%, in 2017 as compared to 2016, driven primarily by sales of our AEQUALIS® PERFORMTM REVERSED Glenoid System that was launched in 2017, as well as continued success of our SIMPLICITI® shoulder system, our AUGMENT® Bone Graft product, and our INFINITY® total ankle replacement system.
Our international net sales increased $7.7 million, or 4.2%, in 2017 as compared to 2016, driven primarily by a 7.6% increase in sales in our direct markets in Europe and Canada and a $0.9 million favorable impact from foreign currency exchange rates. This growth was partially offset by a volume decrease in sales to stocking distributors, primarily due to stocking orders in 2016.
In 2017, our net loss from continuing operations totaled $64.9 million, compared to a net loss from continuing operations of $164.9 million in 2016. This decrease in net loss from continuing operations was primarily driven by the following:
• | improved profitability due to increase in sales and reduced costs due to manufacturing efficiencies and leverage of fixed corporate spending; |
• | $37.7 million, net of tax, decrease in non-cash amortization of inventory step-up fair value adjustment associated with the Wright/Tornier merger; |
• | $25.0 million tax benefit related to a change in the realizability of certain U.S. net operating losses following the completion of a tax project; |
55
• | $24.0 million decrease in transition expenses associated with the Wright/Tornier integration; |
• | $10.0 million benefit from incentive and indirect tax projects; |
• | $8.3 million tax benefit related to tax law reform in the U.S. and France; and |
• | $28.3 million unrealized gain for the mark-to-market adjustment on our derivatives. |
These favorable changes in net loss from continuing operations were partially offset by a $12.3 million write-off of unamortized debt discount and deferred financing fees; and an unrealized loss of $8.7 million for the mark-to-market adjustment on the CVRs issued in connection with the BioMimetic acquisition.
Opportunities and Challenges. We intend to continue to leverage the global strengths of our product brands as a pure-play extremities and biologics business. Additionally, we believe the highly complementary nature of our businesses gives us significant diversity and scale across a range of geographies and product categories. We believe our recent acquisition of IMASCAP, a leader in the development of software-based solutions for preoperative planning of shoulder replacement surgery, ensures exclusive access to breakthrough software enabling technology and patents, including BLUEPRINT™, to further differentiate our product portfolio and to further accelerate growth opportunities in our global extremities business. We are also currently pursuing FDA approval of AUGMENT® Injectable Bone Graft with a PMA Panel Track Supplement as described within the In-process research and development section below.
Since the Wright/Tornier merger and through the end of 2017, we have completed the integration of our global sales force, co-located and consolidated into one ERP system in three of our top five international markets, transferred our U.S. upper extremities inventory into a hub network, and completed a substantial number of other integration activities, while incurring more cost synergies earlier and less sales dis-synergies than we originally anticipated. We believe we have excellent opportunities to improve efficiency and leverage our fixed costs going forward and capture cost synergies. We also believe we have significant opportunity with the recent and anticipated launch of new products and through driving BLUEPRINT™ adoption, strategic service at ambulatory surgery centers, and excellent and efficient service to our customers.
While our ultimate financial goal is to achieve sustained profitability, we anticipate continuing operating losses until we are able to grow our sales to a sufficient level to support our cost structure, including the inherent infrastructure costs of our industry. In the short term, we remain keenly focused on our revenue and cash initiatives.
Significant Industry Factors. Our industry is affected by numerous competitive, regulatory, and other significant factors. The growth of our business relies on our ability to continue to develop new products and innovative technologies, obtain regulatory clearance and maintain compliance for our products, protect the proprietary technology of our products and our manufacturing processes, manufacture our products cost-effectively, respond to competitive pressures specific to each of our geographic markets, including our ability to enforce non-compete agreements, and successfully market and distribute our products in a profitable manner. We, and the entire industry, are subject to extensive governmental regulation, primarily by the FDA. Failure to comply with regulatory requirements could have a material adverse effect on our business, operating results, and financial condition. We, as well as other participants in our industry, are subject to product liability claims, which could have a material adverse effect on our business, operating results, and financial condition.
56
Results of Operations
The discussion below is on a continuing operations basis, unless otherwise noted.
Comparison of the fiscal year ended December 31, 2017 to the fiscal year ended December 25, 2016
The following table sets forth, for the periods indicated, our results of operations expressed as dollar amounts (in thousands) and as percentages of net sales:
Fiscal year ended | |||||||||||
December 31, 2017 | December 25, 2016 | ||||||||||
Amount | % of net sales | Amount | % of net sales | ||||||||
Net sales | $ | 744,989 | 100.0 | % | $ | 690,362 | 100.0 | % | |||
Cost of sales 1, 2 | 160,947 | 21.6 | % | 192,407 | 27.9 | % | |||||
Gross profit | 584,042 | 78.4 | % | 497,955 | 72.1 | % | |||||
Operating expenses: | |||||||||||
Selling, general and administrative 1 | 525,222 | 70.5 | % | 541,558 | 78.4 | % | |||||
Research and development 1 | 50,115 | 6.7 | % | 50,514 | 7.3 | % | |||||
Amortization of intangible assets | 28,396 | 3.8 | % | 28,841 | 4.2 | % | |||||
Total operating expenses | 603,733 | 81.0 | % | 620,913 | 89.9 | % | |||||
Operating loss | (19,691 | ) | (2.6 | )% | (122,958 | ) | (17.8 | )% | |||
Interest expense, net | 74,644 | 10.0 | % | 58,530 | 8.5 | % | |||||
Other expense (income), net | 5,570 | 0.7 | % | (3,148 | ) | (0.5 | )% | ||||
Loss from continuing operations before income taxes | (99,905 | ) | (13.4 | )% | (178,340 | ) | (25.8 | )% | |||
Benefit for income taxes | (34,968 | ) | (4.7 | )% | (13,406 | ) | (1.9 | )% | |||
Net loss from continuing operations | (64,937 | ) | (8.7 | )% | (164,934 | ) | (23.9 | )% | |||
Loss from discontinued operations, net of tax | (137,661 | ) | (267,439 | ) | |||||||
Net loss | $ | (202,598 | ) | $ | (432,373 | ) | |||||
___________________________
1 | These line items include the following amounts of non-cash, share-based compensation expense for the periods indicated: |
Fiscal year ended | |||||||||||
December 31, 2017 | % of net sales | December 25, 2016 | % of net sales | ||||||||
Cost of sales | $ | 565 | 0.1 | % | $ | 414 | 0.1 | % | |||
Selling, general and administrative | 17,705 | 2.4 | % | 13,216 | 1.9 | % | |||||
Research and development | 1,123 | 0.2 | % | 786 | 0.1 | % | |||||
2 | Cost of sales includes amortization of inventory step-up adjustment of $37.7 million for the fiscal year ended December 25, 2016. |
57
The following table sets forth our net sales by product line for our U.S. and International businesses for the periods indicated (in thousands) and the percentage of year-over-year change:
Fiscal year ended | |||||||||||
U.S. | December 31, 2017 | December 25, 2016 | % change | ||||||||
Lower extremities | $ | 228,044 | $ | 222,936 | 2.3 | % | |||||
Upper extremities | 239,965 | 201,579 | 19.0 | % | |||||||
Biologics | 78,361 | 74,603 | 5.0 | % | |||||||
Sports med & other | 8,141 | 8,429 | (3.4 | )% | |||||||
Total U.S. | $ | 554,511 | $ | 507,547 | 9.3 | % | |||||
International | |||||||||||
Lower extremities | $ | 58,473 | $ | 62,701 | (6.7 | )% | |||||
Upper extremities | 94,699 | 86,502 | 9.5 | % | |||||||
Biologics | 22,276 | 18,883 | 18.0 | % | |||||||
Sports med & other | 15,030 | 14,729 | 2.0 | % | |||||||
Total International | $ | 190,478 | $ | 182,815 | 4.2 | % | |||||
Total net sales | $ | 744,989 | $ | 690,362 | 7.9 | % | |||||
Net sales
U.S. net sales. U.S. net sales totaled $554.5 million in 2017, a 9.3% increase from $507.5 million in 2016, primarily due to continued growth in our U.S. upper extremities business. U.S. sales represented approximately 74.4% of total net sales in 2017, compared to 73.5% of total net sales in 2016.
Our U.S. lower extremities net sales increased to $228.0 million in 2017 from $222.9 million, representing growth of 2.3%, as 16.9% growth in our total ankle replacement products was partially offset by declines in foot and ankle fixation products driven primarily by slower developing benefits from the hiring and training of approximately 100 new direct quota-carrying sales representatives in the first quarter of 2017.
Our U.S. upper extremities net sales increased to $240.0 million in 2017 from $201.6 million, representing growth of 19.0%. This growth was driven primarily by our innovative shoulder product portfolio, including the recent launch of our PERFORMTM Reversed Glenoid System and continued success from our SIMPLICITI® shoulder system.
Our U.S. biologics net sales totaled $78.4 million in 2017, representing a 5.0% increase over 2016, driven primarily by continued sales volume growth of AUGMENT® Bone Graft, partially offset by declines in our other biologics products.
International net sales. Net sales in our international regions totaled $190.5 million in 2017, compared to $182.8 million in 2016. This 4.2% increase was due to a 7.6% increase in sales in our direct markets in Europe and Canada and a $0.9 million favorable impact from foreign currency exchange rates. This growth was partially offset by lower levels of sales to stocking distributors.
Our international lower extremities net sales decreased 6.7% to $58.5 million in 2017 from $62.7 million in 2016 primarily due to lower sales volumes to stocking distributors.
Our international upper extremities net sales increased 9.5% to $94.7 million in 2017 from $86.5 million in 2016, driven primarily by a 16.7% increase in sales in our direct markets in Europe and Canada, and a $0.9 million favorable impact from foreign currency exchange rates (a 1 percentage point favorable impact to international upper extremities sales growth rate). This growth was partially offset by lower levels of sales to stocking distributors due to stocking orders in 2016.
Our international biologics net sales increased 18.0% to $22.3 million in 2017 from $18.9 million in 2016. This increase was primarily attributable to new stocking distributors and accounts in China, as well as a $0.1 million favorable impact from foreign currency exchange rates (a 1 percentage point favorable impact to international biologics sales growth rate).
Cost of sales
Our cost of sales totaled $160.9 million, or 21.6% of net sales, in 2017, compared to $192.4 million, or 27.9% of net sales, in 2016, representing a decrease of 6.3 percentage points as a percentage of net sales. This decrease was primarily driven by $37.7 million (5.5% of net sales) of inventory step-up amortization in 2016 associated with inventory acquired from the Wright/Tornier merger.
58
The remaining decrease in cost of sales as a percentage of net sales was driven by manufacturing efficiencies as compared to the prior year period.
Our cost of sales and corresponding gross profit percentages can be expected to fluctuate in future periods depending upon, among other factors, changes in our product sales mix and prices, distribution channels and geographies, manufacturing yields, period expenses, levels of production volume, and currency exchange rates.
Selling, general and administrative
Our selling, general and administrative expenses totaled $525.2 million, or 70.5% of net sales, in 2017, compared to $541.6 million, or 78.4% of net sales, in 2016. These decreases were driven primarily by a decrease in spending on transition and transaction costs which totaled $9.0 million (1.2% of net sales) and $31.9 million (4.6% of net sales) for 2017 and 2016, respectively, as well as a benefit recognized in 2017 related to incentive and indirect tax projects completed during the fourth quarter of 2017 totaling $9.0 million (1.2% of net sales). The remaining decrease as a percentage of net sales was primarily driven by leverage of relatively flat general and administrative expenses over increased net sales and lower levels of cash incentive compensation expense.
Our selling, general and administrative expenses are expected to decrease as a percentage of net sales in 2018, through a combination of continued cost synergies and expense leverage as we expect net sales to continue to increase at a higher rate than expenses.
Research and development
Our investment in research and development expense totaled $50.1 million in 2017 compared to $50.5 million in 2016. Research and development costs remained constant at approximately 7% of net sales.
Our research and development expenses are estimated to range from 7% to 8% as a percentage of net sales in 2018.
Amortization of intangible assets
Charges associated with amortization of intangible assets totaled $28.4 million in 2017 compared to $28.8 million in 2016. Based on intangible assets held at December 31, 2017, we expect to incur charges associated with amortization of intangible assets of approximately $25.0 million in 2018, $23.0 million in 2019, $22.3 million in 2020, $22.1 million in 2021, and $22.1 million in 2022.
Interest expense, net
Interest expense, net, totaled $74.6 million in 2017 and $58.5 million in 2016. Increased interest expense was driven by the increase in debt outstanding following the issuance of the 2021 Notes in the second quarter of 2016 and borrowings under our ABL Facility established in the fourth quarter of 2016 (see Note 9 to our consolidated financial statements contained in “Item 8. Financial Statements and Supplementary Data” for further discussion of changes in our outstanding debt). Our interest expense in 2017 related primarily to non-cash interest expense associated with the amortization of the discount on the 2021 Notes and 2020 Notes of $18.1 million and $27.3 million, respectively; amortization of deferred financing charges on the 2021 Notes, 2020 Notes, 2017 Notes, and our ABL Facility totaling $4.9 million; and cash interest expense primarily associated with the coupon on the 2021 Notes, 2020 Notes, 2017 Notes and our ABL Facility totaling $23.5 million. Our interest expense in 2016 related primarily to non-cash interest expense associated with the amortization of the discount on the 2021 Notes and 2020 Notes of $9.8 million and $25.9 million, respectively; amortization of deferred financing charges on the 2021 Notes, 2020 Notes, and 2017 Notes totaling $3.9 million; and cash interest expense on the 2021 Notes, 2020 Notes, and 2017 Notes totaling $17.8 million. An insignificant amount of interest income was recorded during 2017 and 2016.
Other expense (income), net
Other expense, net was $5.6 million of expense in 2017, compared to $3.1 million of income in 2016.
In 2017, other expense, net, primarily consisted of:
• | a $4.5 million loss on currency translation, including hedging activities; |
• | an unrealized loss of $5.3 million for the mark-to-market adjustment on CVRs issued in connection with the BioMimetic acquisition; partially offset by |
• | an unrealized gain of $4.8 million for the net mark-to-market adjustments on our derivative assets and liabilities; and |
• | a benefit of $0.6 million related to incentive and indirect tax projects. |
In 2016, other income, net, primarily consisted of:
• | an unrealized gain of $28.3 million for the mark-to-market adjustment on our derivatives; partially offset by |
• | a $12.3 million write-off of unamortized debt discount and deferred financing fees; and |
59
• | an unrealized loss of $8.7 million for the mark-to-market adjustment on the CVRs issued in connection with the BioMimetic acquisition. |
Benefit for income taxes
We recorded a tax benefit of $35.0 million in 2017 and $13.4 million in 2016. During 2017, our effective tax rate was approximately 35.0%, as compared to 7.5% in 2016. Our 2017 tax benefit included approximately $25.0 million recorded due to a change in our valuation allowance with respect to certain deferred tax assets that we had previously determined were not more likely than not to be realized. In addition, our 2017 tax benefit included approximately $8.3 million resulting primarily from the effects of lower statutory tax rates and provisions regarding certain tax attributes resulting from recently enacted tax reform legislation in the United States and France. The remaining tax benefit in 2017 was primarily related to losses, including amortization of intangible assets, in jurisdictions where we do not have a valuation allowance. Our 2016 tax benefit included a $5.6 million benefit representing the deferred tax effects associated with the acquired Tornier operations, as well as a $2.3 million benefit related to the resolution of an IRS tax audit. The remaining tax benefit in 2016 was primarily related to losses, including amortization of inventory fair value step-up and intangible assets, in jurisdictions where we do not have a valuation allowance.
Loss from discontinued operations, net of tax
Loss from discontinued operations, net of tax, consists primarily of costs associated with legal defense, income/loss associated with product liability insurance recoveries/denials, and changes to any contingent liabilities associated with the OrthoRecon business that was sold to MicroPort and, to a lesser degree, costs associated with the Large Joints business that was sold to Corin. During 2017 and 2016, we recognized charges, net of insurance proceeds, of $94.0 million and $196.6 million, respectively, for certain retained metal-on-metal product liability claims associated with the OrthoRecon business. See Note 4 and Note 16 to our consolidated financial statements contained in “Item 8. Financial Statements and Supplementary Data” for further discussion regarding our discontinued operations and our retained contingent liabilities associated with the OrthoRecon business.
Reportable segments
The following tables set forth, for the periods indicated, net sales and operating income of our reportable segments expressed as dollar amounts (in thousands) and as a percentage of net sales:
Fiscal year ended December 31, 2017 | |||||||||||
U.S. Lower Extremities & Biologics | U.S. Upper Extremities | International Extremities & Biologics | |||||||||
Net sales | $ | 309,713 | $ | 244,798 | $ | 190,478 | |||||
Operating income | 79,889 | 78,866 | 3,631 | ||||||||
Operating income as a percent of net sales | 25.8 | % | 32.2 | % | 1.9 | % | |||||
Fiscal year ended December 25, 2016 | |||||||||||
U.S. Lower Extremities & Biologics | U.S. Upper Extremities | International Extremities & Biologics | |||||||||
Net sales | $ | 300,847 | $ | 206,700 | $ | 182,815 | |||||
Operating income | 85,645 | 65,231 | 5,872 | ||||||||
Operating income as a percent of net sales | 28.5 | % | 31.6 | % | 3.2 | % | |||||
Net sales of our U.S. lower extremities and biologics segment increased $8.9 million in 2017 over the prior year. This increase was driven by continued growth in our total ankle replacement products and continued sales volume growth of AUGMENT® Bone Graft and was offset by declines in foot and ankle fixation products driven primarily by slower developing benefits from the hiring and training of approximately 100 new direct quota-carrying sales representatives in the first quarter of 2017. Operating income of our U.S. lower extremities and biologics segment decreased $5.8 million in 2017 over the prior year. This decrease was primarily due to investments in research and development for product development and clinical studies, as well as higher levels of selling, general and administrative expenses to support the initiative to hire and train approximately 100 new direct quota-carrying sales representatives.
Net sales of our U.S. upper extremities segment increased $38.1 million in 2017 over the prior year. Operating income of our U.S. upper extremities segment increased $13.6 million in 2017 over the prior year. These increases to both net sales and operating income were primarily driven by our innovative shoulder product portfolio, including the launch of our PERFORMTM Reversed glenoid system and continued contribution from our SIMPLICITI® shoulder system.
60
Net sales of our International extremities and biologics segment increased $7.7 million in 2017 over the prior year. This increase was primarily due to increased sales in our total direct markets, with continued growth in our international upper extremities business. Operating income of our International extremities and biologics segment decreased $2.2 million in 2017 over the prior year, primarily due to higher levels of sales and marketing expenses.
Comparison of the fiscal year ended December 25, 2016 to the fiscal year ended December 27, 2015
The following table sets forth, for the periods indicated, our results of operations expressed as dollar amounts (in thousands) and as percentages of net sales:
Fiscal year ended | |||||||||||
December 25, 2016 | December 27, 2015 | ||||||||||
Amount | % of net sales | Amount | % of net sales | ||||||||
Net sales | $ | 690,362 | 100.0 | % | $ | 405,326 | 100.0 | % | |||
Cost of sales 1,2 | 192,407 | 27.9 | % | 113,622 | 28.0 | % | |||||
Gross profit | 497,955 | 72.1 | % | 291,704 | 72.0 | % | |||||
Operating expenses: | |||||||||||
Selling, general and administrative 2 | 541,558 | 78.4 | % | 424,377 | 104.7 | % | |||||
Research and development 2 | 50,514 | 7.3 | % | 39,339 | 9.7 | % | |||||
Amortization of intangible assets | 28,841 | 4.2 | % | 16,754 | 4.1 | % | |||||
Total operating expenses | 620,913 | 89.9 | % | 480,470 | 118.5 | % | |||||
Operating loss | (122,958 | ) | (17.8 | )% | (188,766 | ) | (46.6 | )% | |||
Interest expense, net | 58,530 | 8.5 | % | 41,358 | 10.2 | % | |||||
Other (income) expense, net | (3,148 | ) | (0.5 | )% | 10,884 | 2.7 | % | ||||
Loss from continuing operations before income taxes | (178,340 | ) | (25.8 | )% | (241,008 | ) | (59.5 | )% | |||
Benefit for income taxes | (13,406 | ) | (1.9 | )% | (3,652 | ) | (0.9 | )% | |||
Net loss from continuing operations | (164,934 | ) | (23.9 | )% | (237,356 | ) | (58.6 | )% | |||
Loss from discontinued operations, net of tax | (267,439 | ) | (61,345 | ) | |||||||
Net loss | $ | (432,373 | ) | $ | (298,701 | ) | |||||
___________________________
1 | Cost of sales includes amortization of inventory step-up adjustment of $37.7 million and $10.3 million for the fiscal years ended December 25, 2016 and December 27, 2015, respectively. |
2 | These line items include the following amounts of non-cash, share-based compensation expense for the periods indicated: |
Fiscal year ended | |||||||||||
December 25, 2016 | % of net sales | December 27, 2015 | % of net sales | ||||||||
Cost of sales | $ | 414 | 0.1 | % | $ | 287 | 0.1 | % | |||
Selling, general and administrative | 13,216 | 1.9 | % | 22,777 | 5.6 | % | |||||
Research and development | 786 | 0.1 | % | 1,900 | 0.5 | % | |||||
61
The following table sets forth our net sales by product line for our U.S. and International businesses for the periods indicated (in thousands) and the percentage of year-over-year change:
Fiscal year ended | |||||||||||
U.S. | December 25, 2016 | December 27, 2015 | % change | ||||||||
Lower extremities | $ | 222,936 | $ | 187,096 | 19.2 | % | |||||
Upper extremities | 201,579 | 58,756 | 243.1 | % | |||||||
Biologics | 74,603 | 50,583 | 47.5 | % | |||||||
Sports med & other | 8,429 | 3,388 | 148.8 | % | |||||||
Total U.S. | $ | 507,547 | $ | 299,823 | 69.3 | % | |||||
International | |||||||||||
Lower extremities | $ | 62,701 | $ | 51,200 | 22.5 | % | |||||
Upper extremities | 86,502 | 24,789 | 249.0 | % | |||||||
Biologics | 18,883 | 19,652 | (3.9 | )% | |||||||
Sports med & other | 14,729 | 9,862 | 49.4 | % | |||||||
Total International | $ | 182,815 | $ | 105,503 | 73.3 | % | |||||
Total net sales | $ | 690,362 | $ | 405,326 | 70.3 | % | |||||
Supplemental Non-GAAP Pro Forma Information. Due to the significance of the legacy Tornier business that is not included in our results of operations for the majority of the fiscal year ended December 27, 2015 and to supplement our consolidated financial statements above prepared in accordance with US GAAP, we use certain non-GAAP financial measures, including combined pro forma net sales. Our non-GAAP financial measures are not in accordance with, or an alternative for, GAAP measures and may be different from non-GAAP financial measures used by other companies. In addition, our non-GAAP financial measures are not based on any comprehensive or standard set of accounting rules or principles. Accordingly, the calculation of our non-GAAP financial measures may differ from the definitions of other companies using the same or similar names limiting, to some extent, the usefulness of such measures for comparison purposes. We believe that non-GAAP financial measures have limitations in that they do not reflect all of the amounts associated with our results of operations as determined in accordance with GAAP and that these measures should only be used to evaluate our results of operations in conjunction with the corresponding GAAP measures. See table below for a reconciliation of our non-GAAP combined pro forma net sales for the fiscal year ended December 27, 2015 to our net sales for such period as calculated in accordance with US GAAP.
The results of operations discussion that appears below has been presented utilizing a combination of historical unaudited and, where relevant, non-GAAP combined pro forma unaudited information to include the effects on our consolidated financial statements of our acquisition of Tornier, as if we had acquired Tornier as of January 1, 2014. The combined pro forma net sales have been adjusted to reflect a combination of the historical results of operations of Tornier, as adjusted to reflect the effect on our combined net sales of incremental revenues that would have been recognized had Tornier been acquired on January 1, 2014. The combined pro forma net sales have been developed based on available information and upon assumptions that our management believes are reasonable in order to reflect, on a pro forma basis, the impact of the Wright/Tornier merger.
The pro forma financial data is not necessarily indicative of results of operations that would have occurred had the Wright/Tornier merger been consummated at the beginning of the period presented or which might be attained in the future.
62
The following table reconciles our non-GAAP combined pro forma net sales by product line for the fiscal year ended December 27, 2015 (in thousands):
Fiscal year ended December 27, 2015 | |||||||||||||||||||
Net sales as reported 1 | Legacy Tornier N.V. standalone nine months ended September 27, 2015 2 | Legacy Tornier Stub Period (September 28, 2015 - September 30, 2015) 3 | Legacy Tornier net sales divested 4 | Non-GAAP combined pro forma net sales | |||||||||||||||
U.S. | |||||||||||||||||||
Lower extremities | $ | 187,096 | $ | 29,637 | $ | 279 | $ | (9,733 | ) | $ | 207,279 | ||||||||
Upper extremities | 58,756 | 115,846 | 1,773 | — | 176,375 | ||||||||||||||
Biologics | 50,583 | 1,290 | 66 | — | 51,939 | ||||||||||||||
Sports med & other | 3,388 | 5,021 | 4 | — | 8,413 | ||||||||||||||
Total extremities & biologics | 299,823 | 151,794 | 2,122 | (9,733 | ) | 444,006 | |||||||||||||
Large joint | — | 119 | — | (119 | ) | — | |||||||||||||
Total U.S. | $ | 299,823 | $ | 151,913 | $ | 2,122 | $ | (9,852 | ) | $ | 444,006 | ||||||||
International | |||||||||||||||||||
Lower extremities | $ | 51,200 | $ | 7,402 | $ | 152 | $ | — | $ | 58,754 | |||||||||
Upper extremities | 24,789 | 51,293 | 1,260 | — | 77,342 | ||||||||||||||
Biologics | 19,652 | 357 | 13 | — | 20,022 | ||||||||||||||
Sports med & other | 9,862 | 5,372 | 132 | — | 15,366 | ||||||||||||||
Total extremities & biologics | 105,503 | 64,424 | 1,557 | — | 171,484 | ||||||||||||||
Large joint | — | 29,921 | 753 | (30,674 | ) | — | |||||||||||||
Total International | $ | 105,503 | $ | 94,345 | $ | 2,310 | $ | (30,674 | ) | $ | 171,484 | ||||||||
Global | |||||||||||||||||||
Lower extremities | $ | 238,296 | $ | 37,039 | $ | 431 | $ | (9,733 | ) | $ | 266,033 | ||||||||
Upper extremities | 83,545 | 167,139 | 3,033 | — | 253,717 | ||||||||||||||
Biologics | 70,235 | 1,647 | 79 | — | 71,961 | ||||||||||||||
Sports med & other | 13,250 | 10,393 | 136 | — | 23,779 | ||||||||||||||
Total extremities & biologics | 405,326 | 216,218 | 3,679 | (9,733 | ) | 615,490 | |||||||||||||
Large joint | — | 30,040 | 753 | (30,793 | ) | — | |||||||||||||
Total net sales | $ | 405,326 | $ | 246,258 | $ | 4,432 | $ | (40,526 | ) | $ | 615,490 | ||||||||
___________________________
1 | The 2015 results were restated for the divestiture of our Large Joints business. |
2 | Legacy Tornier product line sales have been recast to reflect the reclassification of cement, instruments and freight from the historical Tornier product line “Large Joints and Other” to the product line associated with those revenues that will be utilized for future revenue reporting. |
3 | To add revenues from Legacy Tornier's fourth quarter of 2015 for the period prior to the merger closing date when operations became consolidated. |
4 | To reduce from Tornier’s historical sales the U.S. sales associated with Tornier’s Salto Talaris and Salto XT ankle replacement products and silastic toe replacement products that were divested prior to the merger and the global sales associated with Tornier's Large Joints business that have been reflected in discontinued operations. |
63
The following table sets forth our 2016 net sales growth rates by product line as compared to our 2015 non-GAAP combined pro forma net sales for the periods indicated (in thousands) and the percentage of year-over-year change:
Net sales | Non-GAAP combined pro forma net sales | % change | ||||||||
Fiscal year ended December 25, 2016 | Fiscal year ended December 27, 2015 | |||||||||
U.S. | ||||||||||
Lower extremities | $ | 222,936 | $ | 207,279 | 7.6 | % | ||||
Upper extremities | 201,579 | 176,375 | 14.3 | % | ||||||
Biologics | 74,603 | 51,939 | 43.6 | % | ||||||
Sports med & other | 8,429 | 8,413 | 0.2 | % | ||||||
Total U.S. | $ | 507,547 | $ | 444,006 | 14.3 | % | ||||
International | ||||||||||
Lower extremities | $ | 62,701 | $ | 58,754 | 6.7 | % | ||||
Upper extremities | 86,502 | 77,342 | 11.8 | % | ||||||
Biologics | 18,883 | 20,022 | (5.7 | )% | ||||||
Sports med & other | 14,729 | 15,366 | (4.1 | )% | ||||||
Total International | $ | 182,815 | $ | 171,484 | 6.6 | % | ||||
Global | ||||||||||
Lower extremities | $ | 285,637 | $ | 266,033 | 7.4 | % | ||||
Upper extremities | 288,081 | 253,717 | 13.5 | % | ||||||
Biologics | 93,486 | 71,961 | 29.9 | % | ||||||
Sports med & other | 23,158 | 23,779 | (2.6 | )% | ||||||
Total net sales | $ | 690,362 | $ | 615,490 | 12.2 | % | ||||
Net sales
U.S. net sales. U.S. net sales totaled $507.5 million in 2016, a 69.3% increase from $299.8 million in 2015, primarily due to the impact of the Wright/Tornier merger. U.S. net sales in 2016 increased 14.3% as compared to 2015 pro forma net sales. U.S. sales represented approximately 73.5% of total net sales in 2016, compared to 74.0% of total net sales in 2015.
Our U.S. lower extremities net sales increased to $222.9 million in 2016 from $187.1 million, representing growth of 19.2%, driven by growth in legacy Wright's lower extremities business, as well as the impact of the Wright/Tornier merger. Our U.S. lower extremities net sales grew 7.6% in 2016 as compared to 2015 pro forma net sales. This pro forma net sales growth was driven by 27.2% net sales growth in our total ankle replacement products, as well as sales from the launch of our SALVATION® limb salvage system for treating Charcot foot and limb salvage cases, partially offset by declines in sales of legacy Tornier foot and ankle products due to merger-related sales dis-synergies.
Our U.S. upper extremities net sales increased to $201.6 million in 2016 from $58.8 million, representing growth of 243.1%. This growth was driven almost entirely by the impact of the Wright/Tornier merger. Our U.S. upper extremities net sales grew 14.3% in 2016 as compared to 2015 pro forma net sales. This pro forma growth was driven by success of our AEQUALIS ASCEND® shoulder products, including the AEQUALIS ASCEND® FLEXTM convertible shoulder system, as well as sales from our SIMPLICITI® shoulder system that was launched late in the third quarter of 2015.
Our U.S. biologics net sales totaled $74.6 million in 2016, representing a 47.5% increase over 2015, driven primarily by sales of AUGMENT® Bone Graft, which was commercially launched in the fourth quarter 2015. Our U.S. biologics net sales grew 43.6% in 2016 as compared to 2015 pro forma net sales, primarily driven by sales of AUGMENT® Bone Graft.
International net sales. Net sales of our extremities products in our international regions totaled $182.8 million in 2016, a 73.3% increase from $105.5 million in 2015, primarily due to the impact of the Wright/Tornier merger. Our international net sales in 2016 increased 6.6% as compared to 2015 pro forma international net sales, and included a $4.7 million unfavorable impact from foreign currency exchange rates (a 3 percentage point unfavorable impact to pro forma international net sales growth rate).
64
Our international lower extremities net sales increased 22.5% to $62.7 million in 2016 from $51.2 million in 2015. Our international lower extremities sales grew 6.7% in 2016 as compared to 2015 pro forma international lower extremities net sales, primarily driven by a 16.7% increase in sales to stocking distributors and lower than normal sales in Latin America in the prior year period. This increase was partially offset by merger-related sales dis-synergies and a $2.1 million unfavorable impact from foreign currency exchange rates (a 4 percentage point unfavorable impact to pro forma international lower extremities sales growth rate).
Our international upper extremities net sales increased 249.0% to $86.5 million in 2016 from $24.8 million in 2015, driven entirely by the impact of the Wright/Tornier merger. Our international upper extremities net sales grew 11.8% in 2016 as compared to 2015 pro forma international upper extremities net sales, driven primarily by a 7.3% increase in sales in our direct markets in Europe and a 37.9% increase in sales in Australia as a result of a stocking sale to a distributor, partially offset by a $1.4 million unfavorable impact from foreign currency exchange rates (a 2 percentage point unfavorable impact to pro forma international upper extremities sales growth rate).
Our international biologics net sales decreased 3.9% to $18.9 million in 2016 from $19.7 million in 2015. On a pro forma basis, our international biologics net sales decreased 5.7% in 2016 as compared to 2015 pro forma international biologics net sales. This decrease was primarily attributable to lower levels of sales to stocking distributors, as well as a $0.6 million unfavorable impact from foreign currency exchange rates (a 3 percentage point unfavorable impact to pro forma international biologics sales growth rate).
Cost of sales
Our cost of sales totaled $192.4 million, or 27.9% of net sales, in 2016, compared to $113.6 million, or 28.0% of net sales, in 2015, representing a decrease of 0.1 percentage points as a percentage of net sales. Cost of sales included $37.7 million (5.5% of net sales) and $10.3 million (2.5% of net sales) of inventory step-up amortization in 2016 and 2015, respectively, associated with inventory acquired from the Wright/Tornier merger. The remaining decrease in cost of sales as a percentage of net sales was primarily driven by favorable geographic and product mix, as increased provisions for excess and obsolete inventory were relatively flat as a percentage of sales due to the additional sales following the Wright/Tornier merger.
Selling, general and administrative
Our selling, general and administrative expenses totaled $541.6 million, or 78.4% of net sales, in 2016, compared to $424.4 million, or 104.7% of net sales, in 2015. Selling, general and administrative expense for 2016 and 2015 included $31.9 million (4.6% of net sales) and $75.9 million (18.7% of net sales), respectively, of transition and transaction costs associated with the Wright/Tornier merger. The remaining decrease in selling, general and administrative expenses as a percentage of net sales was driven primarily by leveraged spending in our U.S. lower extremities and biologics segment as expense grew at a significantly lower rate than net sales, the addition of the legacy Tornier U.S. upper extremities business with a lower percentage of selling, general and administrative expenses as a percentage of net sales than legacy Wright, and lower levels of corporate spending as a percentage of net sales following the Wright/Tornier merger.
Research and development
Our investment in research and development expense totaled $50.5 million in 2016 compared to $39.3 million in 2015. This increase was almost entirely due to $15.1 million of additional research and development expenses associated with the acquired Tornier business.
Amortization of intangible assets
Charges associated with amortization of intangible assets totaled $28.8 million in 2016, compared to $16.8 million in 2015. This increase was driven by amortization of intangible assets acquired as part of the Wright/Tornier merger.
Interest expense, net
Interest expense, net, totaled $58.5 million in 2016 and $41.4 million in 2015. Increased interest expense was driven by the increase in debt outstanding following the issuance of the 2021 Notes in the second quarter of 2016 (see Note 9 to our consolidated financial statements contained in “Item 8. Financial Statements and Supplementary Data” for further discussion of changes in our outstanding debt). Our interest expense in 2016 related primarily to non-cash interest expense associated with the amortization of the discount on the 2021 Notes and 2020 Notes of $9.8 million and $25.9 million, respectively; amortization of deferred financing charges on the 2021 Notes, 2020 Notes, and 2017 Notes totaling $3.9 million; and cash interest expense primarily associated with the coupon on the 2021 Notes, 2020 Notes, and 2017 Notes totaling $17.8 million. Our interest expense in 2015 related primarily to non-cash interest expense associated with the amortization of the discount on the 2020 Notes and 2017 Notes of $21.8 million and $2.9 million, respectively, amortization of deferred financing charges on the 2020 Notes and 2017 Notes totaling $2.7 million and $0.5 million, respectively; and cash interest expense on the 2020 Notes and 2017 Notes totaling $12.8 million. An insignificant amount of interest income was recorded during 2016 and 2015.
65
Other (income) expense, net
Other (income) expense, net was $3.1 million of income in 2016, compared to $10.9 million of expense in 2015. For 2016, other income, net included a gain of $28.3 million for the net mark-to-market adjustments on our derivative assets and liabilities. This gain was partially offset by a $12.3 million charge for write-off of pro rata unamortized deferred financing fees and debt discount which resulted from the exchanges and repurchases of the 2017 Notes for the 2021 Notes, and an unrealized loss of $8.7 million for the mark-to-market adjustment on CVRs issued in connection with the BioMimetic acquisition. In 2015, other expense, net included a gain of $7.6 million for the mark-to-market adjustment on the CVRs issued in connection with the BioMimetic acquisition, as well as an unrealized gain of $9.8 million for the mark-to-market adjustment on our derivatives, offset by a $25.1 million charge for write-off of pro rata unamortized deferred financing fees and debt discount with repayment of $240 million of the 2017 Notes.
Benefit for income taxes
We recorded a tax benefit of $13.4 million in 2016 and $3.7 million in 2015. During 2016, our effective tax rate was approximately 7.5%, as compared to 1.7% in 2015. Our 2016 tax benefit included a $5.6 million benefit representing the deferred tax effects associated with the acquired Tornier operations, as well as a $2.3 million benefit related to the resolution of an IRS tax audit. The remaining tax benefit in 2016 was primarily related to losses, including amortization of inventory fair value step-up and intangible assets, in jurisdictions where we do not have a valuation allowance. Our 2015 tax benefit was primarily attributable to losses benefited in jurisdictions where we did not have a valuation allowance. Our relatively low effective tax rate in both periods was primarily related to the valuation allowance on our U.S. net deferred tax assets, resulting in the inability to recognize a tax benefit for pre-tax losses in the United States except to the extent to which we recognize a gain in discontinued operations.
Loss from discontinued operations, net of tax
Loss from discontinued operations, net of tax, consists primarily of costs associated with legal defense, income/loss associated with product liability insurance recoveries/denials, and changes to any contingent liabilities associated with the OrthoRecon business that was sold to MicroPort and, to a lesser degree, costs associated with the Large Joints business that was sold to Corin. During 2016, we recognized a $196.6 million charge, net of insurance proceeds, for certain retained metal-on-metal product liability claims associated with the OrthoRecon business primarily as a result of the Master Settlement Agreement we entered into in November 2016 (see Note 16 to our consolidated financial statements contained in “Item 8. Financial Statements and Supplementary Data” for further discussion). See Note 4 to our consolidated financial statements contained in “Item 8. Financial Statements and Supplementary Data” for further discussion of our discontinued operations.
Reportable segments
The following tables set forth, for the periods indicated, net sales and operating income (loss) of our reportable segments expressed as dollar amounts (in thousands) and as a percentage of net sales:
Fiscal year ended December 25, 2016 | |||||||||||
U.S. Lower Extremities & Biologics | U.S. Upper Extremities | International Extremities & Biologics | |||||||||
Net sales | $ | 300,847 | $ | 206,700 | $ | 182,815 | |||||
Operating income | 85,645 | 65,231 | 5,872 | ||||||||
Operating income as a percent of net sales | 28.5 | % | 31.6 | % | 3.2 | % | |||||
Fiscal year ended December 27, 2015 | |||||||||||
U.S. Lower Extremities & Biologics | U.S. Upper Extremities | International Extremities & Biologics | |||||||||
Net sales | $ | 239,748 | $ | 60,075 | $ | 105,503 | |||||
Operating income (loss) | 39,008 | 21,394 | (5,567 | ) | |||||||
Operating income (loss) as a percent of net sales | 16.3 | % | 35.6 | % | (5.3 | )% | |||||
Net sales of our U.S. lower extremities and biologics segment increased $61.1 million in 2016 over 2015. This increase was driven by growth in legacy Wright's lower extremities business, sales of AUGMENT® Bone Graft, which was commercially launched in the fourth quarter 2015, as well as the impact of the Wright/Tornier merger. Operating income of our U.S. lower extremities and biologics segment increased $46.6 million in 2016 over 2015. This increase was driven by leveraging expenses, as net sales increased at a higher rate than operating expenses.
66
Net sales of our U.S. upper extremities segment increased $146.6 million in 2016 over 2015. This increase was driven almost entirely by the impact of the Wright/Tornier merger. Operating income of our U.S. upper extremities segment increased $43.8 million in 2016 over 2015. This increase was driven almost entirely by the acquired Tornier business.
Net sales of our International extremities and biologics segment increased $77.3 million in 2016 over 2015. This increase was primarily due to the impact of the Wright/Tornier merger. Operating income of our International extremities and biologics segment increased $11.4 million in 2016 over 2015. This increase was primarily driven by the acquired Tornier business.
Seasonality and Quarterly Fluctuations
We traditionally experience lower sales volumes in the third quarter than throughout the rest of the year as many of our products are used in elective procedures, which generally decline during the summer months. This typically results in selling, general and administrative expenses and research and development expenses as a percentage of net sales that are higher during this period than throughout the rest of the year. In addition, our first quarter selling, general and administrative expenses include additional expenses that we incur in connection with the annual meetings held by the American College of Foot and Ankle Surgeons and the American Academy of Orthopaedic Surgeons. During these three-day events, we display our most recent and innovative products in the lower extremities market.
We have experienced and expect to continue to experience meaningful variability in our net sales and cost of sales as a percentage of net sales among quarters, as well as within each quarter, as a result of a number of factors including, among other things, the number and mix of products sold in the quarter and the geographies in which they are sold; the demand for, and pricing of our products and the products of our competitors; the timing of or failure to obtain regulatory clearances or approvals for products; costs, benefits, and timing of new product introductions; the level of competition; the timing and extent of promotional pricing or volume discounts; changes in average selling prices; the availability and cost of components and materials; number of selling days; fluctuations in foreign currency exchange rates; the timing of patients’ use of their calendar year medical insurance deductibles; and impairment and other special charges.
Liquidity and Capital Resources
The following table sets forth, for the periods indicated, certain liquidity measures (in thousands):
December 31, 2017 | December 25, 2016 | ||||||
Cash and cash equivalents | $ | 167,740 | $ | 262,265 | |||
Restricted cash | — | 150,000 | |||||
Working capital | 151,599 | 285,107 | |||||
Operating activities. Cash (used in) provided by operating activities totaled $(184.8) million, $37.8 million, and $(195.9) million in 2017, 2016, and 2015, respectively. The increase in cash used in operating activities in 2017 as compared to the cash provided by operating activities in 2016 was driven by cash payments for previously agreed upon product liability settlements related to the former OrthoRecon business and the 2016 receipt of $60 million insurance proceeds associated with metal-on-metal product liabilities (see Note 16 to our consolidated financial statements contained in “Item 8. Financial Statements and Supplementary Data” for further discussion of these liabilities). Other working capital changes were more than offset by an increase in cash profitability.
The increase in cash provided by operating activities in 2016 as compared to the cash used in operating activities in 2015 was driven by higher cash profitability due to decreased spending on transition and transaction expenses and leveraged expenses following the Wright/Tornier merger, the receipt of $60 million insurance proceeds associated with metal-on-metal product liabilities (see Note 16 to our consolidated financial statements contained in “Item 8. Financial Statements and Supplementary Data” for further discussion), and a 2015 milestone payment associated with the BioMimetic acquisition upon the FDA approval of AUGMENT® Bone Graft totaling $98 million, of which $28 million represented the excess over the value originally assigned as part of the purchase price allocation and was included as a cash outflow within operating activities.
Investing activities. The majority of our cash used in financing activities is the result of capital spending. Our capital expenditures totaled $63.5 million in 2017, $50.1 million in 2016, and $43.7 million in 2015. The majority of our capital spending primarily relates to surgical instrumentation; however, we also incurred capital expenditures in 2017, 2016 and 2015 associated with integration activities of the Wright/Tornier merger, including spending on computer systems and facilities as we integrated operations in certain international markets.
In addition to capital expenditures, during 2017, we paid $44.1 million in conjunction with the IMASCAP acquisition, net of cash acquired. See Note 3 to our consolidated financial statements contained in “Item 8. Financial Statements and Supplementary Data” for additional information regarding this acquisition.
67
During 2016, we received proceeds of $20.7 million related to the sale of the Large Joints business. See Note 4 to our consolidated financial statements contained in “Item 8. Financial Statements and Supplementary Data” for additional information regarding this sale.
During 2015, we acquired $30.1 million of cash, primarily as a result of the Wright/Tornier merger since the merger was an all-stock transaction, and we paid for the acquisition of the Surgical Specialties sales and distribution business.
Financing activities. Cash provided by financing activities totaled $46.8 million, $270.4 million, $126.9 million in 2017, 2016 and 2015, respectively. Cash provided by financing activities in 2017 was primarily attributable to $34.9 million of debt proceeds largely from additional borrowings from the ABL Facility, partially offset by $11.5 million of debt payments including a $2.0 million payment of the 2017 Notes and net payments due to the weekly lockbox repayment/re-borrowing arrangement underlying the ABL Facility. During 2016, cash provided by financing was primarily attributable to the $30 million proceeds received from the ABL Facility and proceeds received from the issuance of convertible notes, partially offset by the partial settlement of previously outstanding convertible notes. See Note 6 and Note 9 of our consolidated financial statements contained in “Item 8. Financial Statements and Supplementary Data” for additional information regarding our derivative and debt activity, respectively. During 2017, we also received $27.6 million of cash in connection with the issuance of shares under our share-based compensation plan, as compared to $8.5 million and $3.5 million in 2016 and 2015, respectively.
As of October 1, 2015, legacy Tornier had approximately $75 million in outstanding term debt and $7 million in a line of credit under a pre-existing credit agreement. Upon completion of the Wright/Tornier merger, we terminated all commitments under this credit agreement and repaid approximately $81 million in outstanding indebtedness. We did not incur any early termination penalties in connection with such repayment and termination.
During 2015, we paid a milestone payment associated with the BioMimetic acquisition upon FDA approval of AUGMENT® Bone Graft totaling $98 million, of which $70 million represented the value originally assigned as part of the purchase price allocation and was included as a cash outflow from financing activities.
Repatriation. As of December 31, 2017, approximately $5.6 million of our cash and cash equivalents was held by certain U.S.-controlled non-U.S. subsidiaries which may not represent available liquidity for general corporate purposes. Recent legislative changes under the 2017 U.S. Tax Cuts and Jobs Act required us to include our cumulative undistributed earnings of our U.S. controlled non-U.S. subsidiaries in our current year U.S. taxable income. Additionally, this legislation provides us an opportunity to repatriate cash to the U.S. without additional U.S. income tax consequences. However, our current plans do not foresee a need to repatriate funds that are designated as permanently reinvested in order to fund our operations or meet currently anticipated liquidity and capital investment needs.
Discontinued operations. Cash flows from discontinued operations are combined with cash flows from continuing operations in the consolidated statements of cash flows. Cash flows from discontinued operations include those related to both the Large Joints and OrthoRecon businesses.
During the fiscal year ended December 31, 2017, cash used in operating activities by the Large Joints business totaled $6.5 million, and cash used in operating activities by the OrthoRecon business totaled $221.6 million.
During the fiscal year ended December 25, 2016, cash provided by operating and investing activities from the Large Joints business totaled $5.2 million and $20.7 million, respectively. Cash provided by operating activities from the OrthoRecon business totaled $16.7 million, primarily due to the receipt of the $60 million insurance settlement offset by legal defense costs and settlement of product liabilities.
During the fiscal year ended December 27, 2015, cash provided by operating activities from the Large Joints business totaled $2.9 million. Cash used by operating activities from the OrthoRecon business was approximately $28 million associated with legal defense costs and settlement of product liabilities, net of insurance proceeds received.
We expect significant cash outflows resulting from product liabilities during 2018 and 2019, associated with the metal-on-metal settlements described in Note 16 to our consolidated financial statements contained in “Item 8. Financial Statements and Supplementary Data.” We do not expect that the future cash outflows from discontinued operations, including the payment of these retained liabilities of the OrthoRecon business, will have an impact on our ability to meet contractual cash obligations and fund our working capital requirements, operations, and anticipated capital expenditures.
68
Contractual cash obligations. At December 31, 2017, we had contractual cash obligations and commercial commitments as follows (in thousands):
Payments due by periods | |||||||||||||||||||
Contractual obligations | Total | Less than 1 year | 1-3 years | 3-5 years | More than 5 years | ||||||||||||||
Amounts reflected in consolidated balance sheet: | |||||||||||||||||||
Capital lease obligations 1 | $ | 23,690 | $ | 4,371 | $ | 7,946 | $ | 4,830 | $ | 6,543 | |||||||||
Notes payable 2 | 990,503 | 1,737 | 589,776 | 396,031 | 2,959 | ||||||||||||||
Amounts not reflected in consolidated balance sheet: | |||||||||||||||||||
Operating leases | 34,884 | 8,076 | 12,909 | 8,125 | 5,774 | ||||||||||||||
Interest on notes payable 3 | 59,559 | 20,715 | 31,050 | 7,794 | — | ||||||||||||||
Total contractual cash obligations | $ | 1,108,636 | $ | 34,899 | $ | 641,681 | $ | 416,780 | $ | 15,276 | |||||||||
_______________________________
1 | Payments include amounts representing interest. |
2 | Our notes payable include 2020 Notes, 2021 Notes, shareholder debt, mortgages, and other debt. See further discussion in Note 9 to our consolidated financial statements contained in “Item 8. Financial Statements and Supplementary Data.” |
3 | Represents interest on 2020 Notes, 2021 Notes, shareholder debt, and mortgages, and other debt. See further discussion in Note 9 to our consolidated financial statements contained in “Item 8. Financial Statements and Supplementary Data.” |
The amounts reflected in the table above exclude product liabilities, including the settlement of certain metal-on-metal hip replacement product liability litigation, described in Note 16 to our consolidated financial statements contained in “Item 8. Financial Statements and Supplementary Data.”
The table above also does not include debt outstanding under the ABL Credit Agreement. We have reflected this debt as a current liability on our consolidated balance sheets as of December 31, 2017 as required by US GAAP due to the weekly lockbox repayment/re-borrowing arrangement underlying the agreement, as well as the ability for the lenders to accelerate the repayment of the debt under certain circumstances as described in Note 9 to our consolidated financial statements contained in “Item 8. Financial Statements and Supplementary Data.”
Portions of these payments are denominated in foreign currencies and were translated in the table above based on their respective U.S. dollar exchange rates at December 31, 2017. These future payments are subject to foreign currency exchange rate risk.
The amounts reflected in the table above for capital lease obligations represent future minimum lease payments under our capital lease agreements, which are primarily for certain property and equipment. The present value of the minimum lease payments are recorded in our consolidated balance sheet at December 31, 2017. The minimum lease payments related to these leases are discussed further in Note 9 to our consolidated financial statements contained in “Item 8. Financial Statements and Supplementary Data.”
The amounts reflected in the table above for operating leases represent future minimum lease payments under non-cancelable operating leases primarily for certain equipment and office space. In accordance with US GAAP, our operating leases are not recognized on our consolidated balance sheets; however, the minimum lease payments related to these agreements are disclosed in Note 16 to our consolidated financial statements contained in “Item 8. Financial Statements and Supplementary Data.”
The table above does not include the 2021 and 2020 Notes Conversion Derivative (see “Item 7A. Quantitative and Qualitative Disclosures About Market Risk” for quantitative analysis on possible cash obligations upon maturity at various assumed stock prices).
The table above also does not include certain contingent consideration:
• | Contingent consideration of up to $84 million may be paid upon reaching certain revenue milestones related to the BioMimetic acquisition. If, prior to March 1, 2019, sales of AUGMENT® Bone Graft reach $40 million over 12 consecutive months, a cash payment would be required at $1.50 per share, or $42 million. Further, if, prior to March 1, 2019, sales of AUGMENT® Bone Graft reach $70 million over 12 consecutive months, an additional cash payment would be required at $1.50 per share, or $42 million. |
69
• | As part of the IMASCAP acquisition, contingent consideration of approximately €15.1 million or $17.8 million will be required in potential sales earnouts and milestone payments for new software modules and a potential future implant system. |
• | Contingent consideration of up to $0.9 million may be paid upon achieving revenue milestones related to the acquisition of Surgical Specialties Australia Pty. |
The estimated fair value of the contingent consideration has been recorded on our consolidated balance sheets within “Accrued expenses and other current liabilities” and “Other long-term liabilities” as described in Note 6 and Note 12.
In addition to the contractual cash obligations discussed above, all of our U.S. net sales and a portion of our international net sales are subject to commissions based on net sales. A substantial portion of our global net sales are subject to royalties earned based on product sales.
Additionally, as of December 31, 2017, we had approximately $6 million of unrecognized tax benefits recorded on our consolidated balance sheet. This represents the tax benefits associated with various tax positions taken, or expected to be taken, on U.S. and international tax returns that have not been recognized in our financial statements due to uncertainty regarding their resolution. We are unable to make a reliable estimate of the eventual cash flows by period that may be required to settle these matters. Certain of these matters may not require cash settlement due to the existence of net operating loss carryforwards. Therefore, our unrecognized tax benefits are not included in the table above. See Note 11 to our consolidated financial statements contained in “Item 8. Financial Statements and Supplementary Data.”
Other liquidity information. We have historically funded our cash needs through various equity and debt issuances, more recently borrowings under our ABL Facility, and through cash flow from operations.
On December 23, 2016, we, together with WMG and certain of our other wholly-owned U.S. subsidiaries, entered into a ABL Credit Agreement with Midcap Financial Trust, as administrative agent (Agent) and a lender and the additional lenders from time to time party thereto. The ABL Credit Agreement provides for a $150 million senior secured asset based line of credit, subject to the satisfaction of a borrowing base requirement (ABL Facility). The ABL Facility may be increased by up to $100 million upon our request, subject to the consent of the Agent and each of the other lenders providing such increase and the satisfaction of customary conditions. We are required to maintain net revenue at or above specified minimum levels, to maintain liquidity in the United States above a specified level and to comply with other covenants under the ABL Credit Agreement. We are in compliance with all covenants as of December 31, 2017. As of December 31, 2017, we had $53.6 million in borrowings outstanding under the ABL Facility and $96.4 million in unused availability under the ABL Facility. As of December 25, 2016, we had $30.0 million in borrowings outstanding under the ABL Facility and $120.0 million in unused availability under the ABL Facility.
On November 1, 2016, WMT entered into the MSA with Court-appointed attorneys representing plaintiffs in the metal-on-metal hip replacement product liability litigation pending before the United States District Court for the MDL and the JCCP. Under the terms of the MSA, the parties agreed to settle 1,292 specifically identified claims associated with CONSERVE®, DYNASTY® and LINEAGE® products that meet the eligibility requirements of the MSA and were either pending in the MDL or JCCP, or subject to court-approved tolling agreements in the MDL or JCCP, for a settlement amount of $240 million.
On October 3, 2017, WMT and the Court-appointed attorneys representing plaintiffs in the metal-on-metal hip replacement product liability litigation pending before the MDL and the JCCP agreed on a comprehensive settlement intended to resolve substantially all remaining metal-on-metal hip claims pending or tolled in the MDL and JCCP that were not settled in the previously disclosed MSA dated November 1, 2016. The comprehensive settlement is evidenced by the Second Settlement Agreements. The comprehensive settlement was contingent on availability of new insurance proceeds totaling at least $35 million from applicable insurance carriers by December 31, 2017. On December 29, 2017, WMT entered into a First Amendment to the Third Settlement Agreement pursuant to which the deadline for the recovery of new insurance proceeds totaling at least $35 million from applicable insurance carriers was extended through February 28, 2018 and, on February 23, 2018, WMT entered into a Second Amendment to the Third Settlement Agreement pursuant to which the deadline was extended through March 30, 2018. To date, certain of the insurance carriers have contributed or agreed to contribute $20 million of funds applicable against the contingency.
As of December 31, 2017, our accrual for metal-on-metal claims totaled $177.5 million, of which $127.4 million is included in our consolidated balance sheet within “Accrued expenses and other current liabilities” and $50.1 million is included within “Other liabilities.” As of December 25, 2016, our accrual for metal-on-metal claims totaled $256.7 million, of which $242.8 million is included in our consolidated balance sheet within “Accrued expenses and other current liabilities” and $13.9 million is included within “Other liabilities.” See Note 16 to our consolidated financial statements for additional discussion regarding the MSA and Second Settlement Agreements and our accrual methodologies for the metal-on-metal hip replacement product liability claims.
In May 2016, we issued $395 million aggregate principal amount of the 2021 Notes, which, after consideration of the exchange of approximately $54 million principal amount of the 2017 Notes and $45 million principal amount of the 2020 Notes, generated net proceeds of approximately $237.5 million. In connection with the offering of the 2021 Notes, we entered into convertible note hedging transactions with two counterparties. We also entered into warrant transactions in which we sold stock warrants for an
70
aggregate of 18.5 million ordinary shares to these two counterparties. We used approximately $45 million of the net proceeds from the offering to pay the cost of the convertible note hedging transactions (after such cost was partially offset by the proceeds we received from the sale of the warrants).
In February 2015, WMG issued $632.5 million of the 2020 Notes, which generated net proceeds of approximately $613 million. In connection with the offering of the 2020 Notes, WMG entered into convertible note hedging transactions with three counterparties. WMG also entered into warrant transactions in which WMG sold warrants for an aggregate of 20,489,142 shares of WMG common stock to these three counterparties. WMG used approximately $58 million of the net proceeds from the offering to pay the cost of the convertible note hedging transactions (after such cost was partially offset by the proceeds we received from the sale of the warrants). WMG also used approximately $292 million of the net proceeds from the offering to repurchase approximately $240 million aggregate principal amount of outstanding 2017 Notes in privately negotiated transactions. On November 24, 2015, we entered into a supplemental indenture to the indenture governing the 2020 Notes which provided for, among other things, our full and unconditional guarantee, on a senior unsecured basis, of all of WMG's obligations relating to the 2020 Notes and to make certain other adjustments to the terms of the indenture to give effect to the Wright/Tornier merger. Also on November 24, 2015, we assumed the warrants initially issued by WMG in connection with the 2020 Notes offering.
Although it is difficult for us to predict our future liquidity requirements, we believe that our cash and cash equivalents balance of approximately $167.7 million, together with $96.4 million in availability under our ABL Facility as of December 31, 2017, will be sufficient for the next 12 months to fund our working capital requirements and operations, permit anticipated capital expenditures in 2018 of approximately $55 million, pay retained metal-on-metal product and other liabilities of the OrthoRecon business, including without limitation amounts under the MSA and Second Settlement Agreements, net of insurance recoveries, fund contingent consideration including without limitation the up to $42 million CVR milestone payment, and meet our other anticipated contractual cash obligations in 2018. We may face liquidity challenges during the next few years in light of anticipated significant contingent liabilities and financial obligations and commitments, including among others, acquisition-related contingent consideration payments, payments related to our outstanding indebtedness, and costs and payments related to pending litigation.
In the event that we would require additional working capital to fund future operations, we could seek to acquire that through borrowings under the additional $100.0 million that may be available under the ABL Facility or additional equity or debt financing arrangements which may or may not be available on favorable terms at such time. If we raise additional funds by issuing equity securities, our shareholders may experience dilution. Additional debt financing, if available, may involve additional covenants restricting our operations or our ability to incur additional debt, in addition to those under our existing indentures and the ABL Credit Agreement. Any additional debt financing or additional equity that we raise may contain terms that are not favorable to us or our shareholders. If we do not have, or are not able to obtain, sufficient funds, we may not be able to develop or enhance our products, execute our business plan, take advantage of future opportunities, or respond to competitive pressures or unanticipated customer requirements or we may have to delay development or commercialization of our products or scale back our operations.
In-process research and development. In connection with the BioMimetic acquisition, we acquired in-process research and development (IPRD) technology related to projects that had not yet reached technological feasibility as of the acquisition date, which included AUGMENT® Injectable Bone Graft. The acquisition-date fair value of the IPRD technology was $27.1 million for AUGMENT® Injectable Bone Graft. The fair value of the IPRD technology was reduced to $0 as of December 31, 2014, which reflects the impairment charges recognized in 2013 after receipt of the not approvable letter from the FDA in response to a PMA application for AUGMENT® Bone Graft for use as an alternative to autograft in hindfoot and ankle fusion procedures.
In connection with the Wright/Tornier merger, we acquired IPRD technology related to three projects that had not yet reached technological feasibility as of the merger date. These projects included PerFORM Rev/Rev+, AEQUALIS® Adjustable Reversed Ext (AARE) (re-branded in 2016 to AEQUALIS® Flex Revive), and PerFORM+ that were assigned fair values of $14.5 million, $2.1 million, and $0.4 million, respectively, on the acquisition date. During 2016, we received FDA clearance of PerFORM Rev/Rev+ and PerFORM+.
In connection with the IMASCAP acquisition, we acquired IPRD technology related to a patient specific implant system that had not yet reached technological feasibility as of the acquisition date. This project was assigned a fair value of $5.3 million on the acquisition date.
The current IPRD projects we acquired in our IMASCAP acquisition, BioMimetic acquisition, and the Wright/Tornier merger are as follows:
• | The patient specific implant is a reverse shoulder replacement implant having glenoid or glenoid and humeral implant components. We have an anticipated first clinical use in 2020 and launch in the first half of 2021. Project cost to complete is estimated to be less than $2 million. However, the risks and uncertainties associated with completion are dependent upon testing validations and FDA and CE mark clearance. |
• | Augment Injectable combines rhPDGF-BB with an injectable osteoconductive matrix. Augment Injectable can be injected into a fusion site during a surgical procedure, delivering rhPDGF-BB to promote fusion as a bone graft substitute. Our |
71
initial clinical development program for Augment Injectable has focused on securing regulatory approval for ankle and hindfoot fusion indications in the United States. Augment Injectable is already approved in several markets outside the United States. We currently estimate it could take one to three years to complete this project. We have incurred expenses of approximately $5.9 million for Augment Injectable since the date of acquisition and $1.0 million in the fiscal year ended December 31, 2017. We are currently pursuing FDA approval with a PMA Panel Track Supplement. This does not necessarily result in a panel meeting, but it affords the FDA additional time to review the submission beyond 180 days.
• | AARE will ultimately be our second-generation revision product, with an improved implant that is convertible and addresses more indications, and a more comprehensive instrument set that includes universal extraction instrumentation to address the entire revision procedure, not just the final implant. The instruments and implants for the new revision system are currently in design phase. We have an anticipated first clinical use in 2018 and launch in the first half of 2019. Project cost to complete is estimated to be less than $1 million. However, the risks and uncertainties associated with completion are dependent upon testing validations and FDA clearance. |
Critical Accounting Estimates
All of our significant accounting policies and estimates are described in Note 2 to our consolidated financial statements contained in “Item 8. Financial Statements and Supplementary Data.” Certain of our more critical accounting estimates require the application of significant judgment by management in selecting the appropriate assumptions in determining the estimate. By their nature, these judgments are subject to an inherent degree of uncertainty. We develop these judgments based on our historical experience, terms of existing contracts, our observance of trends in the industry, information provided by our customers, and information available from other outside sources, as appropriate. Different, reasonable estimates could have been used in the current period. Additionally, changes in accounting estimates are reasonably likely to occur from period to period. Both of these factors could have a material impact on the presentation of our financial condition, changes in financial condition, or results of operations.
We believe that the following financial estimates are both important to the portrayal of our financial condition and results of operations and require subjective or complex judgments. Further, we believe that the items discussed below are properly recorded in our financial statements for all periods presented. Our management has discussed the development, selection, and disclosure of our most critical financial estimates with the audit committee of our board of directors and with our independent auditors. The judgments about those financial estimates are based on information available as of the date of our financial statements. Those financial estimates include:
Discontinued operations. On October 21, 2016, pursuant to the binding offer letter dated as of July 8, 2016, we, Corin, and certain other entities related to us entered into a business sale agreement and simultaneously completed and closed the sale of our business operations formerly operating under the Large Joints segment. Pursuant to the terms of the agreement, we sold substantially all of our assets related to our hip and knee, or large joints, business to Corin for approximately €29.7 million in cash, less approximately €11.1 million for net working capital adjustments.
We determined that the Large Joints business meets the criteria for classification as discontinued operations. All historical operating results for the Large Joints business, including costs associated with corporate employees and infrastructure to be transferred as a part of the sale, are reflected within discontinued operations in our consolidated statements of operations. Further, all assets and associated liabilities transferred to Corin were classified as assets and liabilities held for sale in our consolidated balance sheets for all periods presented. We recognized an impairment loss on held for sale classification of $21.3 million before the effect of income taxes, during 2016 based on the difference between the net carrying value of the assets and liabilities held for sale and the purchase price, less estimated adjustments and costs to sell. This loss was recorded within “Net loss from discontinued operations” in our consolidated statements of operations. All current operating results for the Large Joints business are reflected within discontinued operations in our consolidated financial statements.
On January 9, 2014, legacy Wright completed the sale of the OrthoRecon business, which consists of legacy Wright's hip and knee product implants, to MicroPort. We determined that this transaction meets the criteria for classification as discontinued operations under the provisions of FASB ASC 205-20. As such, all historical operating results for the OrthoRecon business are reflected within discontinued operations in our consolidated statements of operations. As this sale occurred in early 2014, costs for 2014, 2015 and 2016 primarily relate to product liability claims, including legal defense, settlements and judgments, and changes in contingent liabilities net of product liability insurance recoveries. Further, all assets and associated liabilities transferred to MicroPort were classified as assets and liabilities held for sale on our consolidated balance sheet, in accordance with FASB ASC 360.
Revenue recognition. Our revenues are primarily generated through two types of customers, hospitals and surgery centers and stocking distributors, with the majority of our revenue derived from sales to hospitals and surgery centers. Our products are sold through a network of employee and independent sales representatives in the United States and by a combination of employee sales representatives, independent sales representatives, and stocking distributors outside the United States. We record revenues from
72
sales to hospitals and surgery centers when they take title to the product, which is generally when the product is surgically implanted in a patient.
During the fiscal quarter ended December 27, 2015, following the Wright/Tornier merger, we changed our estimate of uninvoiced revenue. While we have generally recognized revenue at the time that the product was surgically implanted, from a timing perspective, we now recognize revenue at the time the surgery and associated products used are reported, as opposed to previously when we received clerical documentation from the hospital. We accounted for this as a change in estimate and recorded additional revenue of approximately $3 million in the fiscal quarter ended December 27, 2015.
We record revenues from sales to our stocking distributors at the time the product is shipped to the distributor. Our stocking distributors, who sell the products to their customers, take title to the products and assume all risks of ownership. Our stocking distributors are obligated to pay us within specified terms regardless of when, if ever, they sell the products. In general, our stocking distributors do not have any rights of return or exchange; however, in limited situations, we have repurchase agreements with certain stocking distributors. Those certain agreements require us to repurchase a specified percentage of the inventory purchased by the distributor within a specified period of time prior to the expiration of the contract. During those specified periods, we defer the applicable percentage of the sales. An insignificant amount of sales related to these types of agreements were deferred and not yet recognized as revenue as of December 31, 2017 and December 25, 2016.
We must make estimates of potential future product returns related to current period product sales. We base our estimate for sales returns on historical sales and product return information, including historical experience and trend information. Our reserve for sales returns has historically been immaterial. We charge our customers for shipping and handling and recognize these amounts as part of revenue.
In May 2014, the FASB issued Accounting Standards Update (ASU) 2014-09, Revenue from Contracts with Customers, and has subsequently issued several supplemental and/or clarifying ASUs (collectively ASC 606). Accounting Standards Codification (ASC) 606 prescribes a single common revenue standard that replaces most existing US GAAP revenue recognition guidance. ASC 606 outlines a five-step model, under which we will recognize revenue as performance obligations within a customer contract are satisfied. ASC 606 is intended to provide more consistent interpretation and application of the principles outlined in the standard across filers in multiple industries and within the same industries compared to current practices, which should improve comparability. Adoption of ASC 606 is required for annual reporting periods beginning after December 15, 2017 (fiscal year 2018 for Wright), including interim periods within the reporting period. Based on our review of our current portfolio of customer contracts, including a review of historical accounting policies and practices, we expect that revenue will continue to be recognized at a point in time, generally upon surgical implantation or shipment of products to distributors, consistent with our current revenue recognition model. Therefore, adoption of ASC 606 is not expected to have a material effect on our consolidated financial statements.
In 2011, we entered into a trademark license agreement with KCI Medical Resources, a subsidiary of Kinetic Concepts, Inc. (KCI). In exchange for $8.5 million, of which $5.5 million was received immediately and $3 million was received in January 2012, this license agreement provides KCI with a non-transferable license to use our trademarks associated with our GRAFTJACKET® line of products in connection with the marketing and distribution of KCI's soft tissue graft containment products used in the wound care field, subject to certain exceptions. License revenue under this agreement is being recognized over 12 years on a straight-line basis.
Allowances for doubtful accounts. We experience credit losses on our accounts receivable; and accordingly, we must make estimates related to the ultimate collection of our accounts receivable. Specifically, we analyze our accounts receivable, historical bad debt experience, customer concentrations, customer creditworthiness, and current economic trends when evaluating the adequacy of our allowance for doubtful accounts.
The majority of our accounts receivable are from hospitals and surgery centers. Our collection history has been favorable with minimal bad debts from these customers. We write off accounts receivable when we determine that the accounts receivable are uncollectible, typically upon customer bankruptcy or the customer’s non-response to repeated collection efforts.
We believe that the amount included in our allowance for doubtful accounts has been a historically appropriate estimate of the amount of accounts receivable that are ultimately not collected. While we believe that our allowance for doubtful accounts is adequate, the financial condition of our customers and the geo-political factors that impact reimbursement under individual countries’ healthcare systems can change rapidly, which would necessitate additional allowances in future periods. Our allowances for doubtful accounts were $4.3 million and $4.5 million at December 31, 2017 and December 25, 2016, respectively.
Excess and obsolete inventories. We value our inventory at the lower of the actual cost to purchase and/or manufacture the inventory on a first-in, first-out (FIFO) basis or its net realizable value. We regularly review inventory quantities on hand for excess and obsolete inventory and, when circumstances indicate, we incur charges to write down inventories to their net realizable value. We estimate excess and obsolete inventory based on both the current age of kit inventory as compared to its estimated life cycle and our forecasted product demand and production requirements for other inventory items for the next 36 months. A significant decrease in demand could result in an increase in the amount of excess inventory quantities on hand. Additionally, our industry is
73
characterized by regular new product development that could result in an increase in the amount of obsolete inventory quantities on hand due to cannibalization of existing products. Also, our estimates of future product demand may prove to be inaccurate in which case we may be required to incur charges for excess and obsolete inventory.
Total charges incurred to write down excess and obsolete inventory to net realizable value included in “Cost of sales” were approximately $19.2 million, $21.5 million, and $14.2 million for the fiscal years ended December 31, 2017, December 25, 2016, and December 27, 2015, respectively. During the fiscal years ended December 31, 2017 and December 25, 2016, our excess and obsolete charges included product rationalization initiative adjustments of $3.1 million and $4.1 million, respectively. During the year ended December 27, 2015, our excess and obsolete inventory charges included $4.1 million related to a change in estimate.
In the future, if additional inventory write-downs are required, we would recognize additional cost of goods sold at the time of such determination. Regardless of changes in our estimates of future product demand, we do not increase the value of our inventory above its adjusted cost basis. Therefore, although we make every effort to ensure the accuracy of our forecasts of future product demand, significant unanticipated decreases in demand or technological developments could have a significant impact on the value of our inventory and our reported operating results.
Business combinations, goodwill and long-lived assets. We account for acquired businesses using the purchase method of accounting. Under the purchase method, our consolidated financial statements include the financial results of an acquired business starting from the date the acquisition is completed. In addition, the assets acquired, liabilities assumed, and any contingent consideration must be recorded at the date of acquisition at their respective estimated fair values, with any excess of the purchase price over the estimated fair values of the net assets acquired recorded as goodwill. Significant judgment is required in estimating the fair value of contingent consideration and intangible assets and in assigning their respective useful lives. Accordingly, we typically obtain the assistance of third-party valuation specialists for significant acquisitions. The fair value estimates are based on available historical information and on future expectations and assumptions deemed reasonable by management, but are inherently uncertain.
We use a discounted cash flow analysis given probability and estimated timing of payout to determine the fair value of contingent consideration on the date of acquisition. Significant changes in the discount rate used could affect the accuracy of the fair value calculation. Contingent consideration is adjusted based on experience in subsequent periods and the impact of changes related to assumptions are recorded in operating expenses as incurred.
We typically use an income method to estimate the fair value of intangible assets, which is based on forecasts of the expected future cash flows attributable to the respective assets. Significant estimates and assumptions inherent in the valuations reflect a consideration of other marketplace participants and include the amount and timing of future cash flows (including expected growth rates and profitability), the underlying product or technology life cycles, the economic barriers to entry, and the discount rate applied to the cash flows. Unanticipated market or macroeconomic events and circumstances may result in a triggering event for which we would test for impairment.
Determining the useful life of an intangible asset also requires judgment. Our assessment as to trademarks and brands that have a finite life is based on a number of factors including competitive environment, market share, trademark and/or brand history, underlying product life cycles, operating plans, and the macroeconomic environment of the countries in which the trademarks or brands are sold. All of our acquired technology and customer-related intangibles are expected to have finite useful lives.
As of December 31, 2017, we had approximately $933.7 million of goodwill recorded as a result of our acquisition of businesses, including the IMASCAP acquisition and the Wright/Tornier merger. Goodwill is tested for impairment annually, or more frequently if changes in circumstances or the occurrence of events suggest that impairment exists. The annual evaluation of goodwill impairment may require the use of estimates and assumptions to determine the fair value of our reporting units using projections of future cash flows. Unless circumstances otherwise dictate, the annual impairment test is performed on October 1 each year.
During the first quarter of 2016, we had a change in segment reporting that required an interim review of potential goodwill impairment which we performed as of February 2016. Upon completion of this analysis, we determined that the fair value of our reporting units, determined primarily by an income approach using projected cash flows, exceeded their carrying values; and therefore, no goodwill was impaired.
We also performed a quantitative analysis of goodwill for impairment as of October 1, 2017 for our reporting units and determined that it is not more likely than not that the respective carrying values of our reporting units exceeded their fair value, indicating that goodwill was not impaired.
Our business is capital intensive, particularly as it relates to surgical instrumentation. We depreciate our property, plant and equipment and amortize our intangible assets based upon our estimate of the respective asset’s useful life. Our estimate of the useful life of an asset requires us to make judgments about future events, such as product life cycles, new product development, product cannibalization, and technological obsolescence, as well as other competitive factors beyond our control. We account for the impairment of finite, long-lived assets in accordance with the FASB ASC Section 360, Property, Plant and Equipment. Accordingly, we evaluate impairments of our property, plant and equipment based upon an analysis of estimated undiscounted
74
future cash flows. If we determine that a change is required in the useful life of an asset, future depreciation and amortization is adjusted accordingly. Alternatively, if we determine that an asset has been impaired, an adjustment would be charged to income based on the asset’s fair market value, or discounted cash flows if the fair market value is not readily determinable, reducing income in that period.
Valuation of in-process research and development. The estimated fair value attributed to IPRD represents an estimate of the fair value of purchased in-process technology for research programs that have not reached technological feasibility and have no alternative future use. Only those research programs that had advanced to a stage of development where management believed reasonable net future cash flow forecasts could be prepared and a reasonable possibility of technical success existed were included in the estimated fair value.
IPRD is recorded as an indefinite-lived intangible asset until completion or abandonment of the associated research and development projects. Accordingly, no amortization expense is reflected in the results of operations. If a project is completed, the carrying value of the related intangible asset will be amortized over the remaining estimated life of the asset beginning with the period in which the project is completed. If a project becomes impaired or is abandoned, the carrying value of the related intangible asset will be written down to its fair value and an impairment charge will be taken in the period the impairment occurs. These intangible assets are tested for impairment on an annual basis, or earlier if impairment indicators are present.
Product liability claims and related insurance recoveries and other litigation. Periodically, claims arise involving the use of our products. We make provisions for claims specifically identified for which we believe the likelihood of an unfavorable outcome is probable and an estimate of the amount of loss has been developed. As additional information becomes available, we reassess the estimated liability related to our pending claims and make revisions as necessary.
The product liability claims described in this section relate primarily to Wright Medical Technology, Inc., an indirect subsidiary of Wright Medical Group N.V., and are not necessarily applicable to Wright Medical Group N.V. or other affiliated entities. Maintaining separate legal entities within our corporate structure is intended to ring-fence liabilities. We believe our ring-fenced structure should preclude corporate veil-piercing efforts against entities whose assets are not associated with particular claims.
We have received claims for personal injury against us associated with fractures of our PROFEMUR® long titanium modular neck product (PROFEMUR® Claims). As of December 31, 2017 there were approximately 30 pending U.S. lawsuits and approximately 60 pending non-U.S. lawsuits alleging such claims. The overall fracture rate for the product is low and the fractures appear, at least in part, to relate to patient demographics. Beginning in 2009, we began offering a cobalt-chrome version of our PROFEMUR® modular neck, which has greater strength characteristics than the alternative titanium version. Historically, we have reflected our liability for these claims as part of our standard product liability accruals on a case-by-case basis. However, during the fiscal quarter ended September 30, 2011, as a result of an increase in the number and monetary amount of these claims, management estimated our liability to patients in the United States and Canada who have previously required a revision following a fracture of a PROFEMUR® long titanium modular neck, or who may require a revision in the future. Management has estimated that this aggregate liability is $21.5 million. We have classified $12.0 million of this liability as current in “Accrued expenses and other current liabilities,” as we expect to pay such claims within the next twelve months, and $9.5 million as non-current in “Other liabilities” on our consolidated balance sheet. We expect to pay the majority of these claims within the next three years. Any claims associated with this product outside of the United States and Canada, or for any other products, will be managed as part of our standard product liability accrual methodology on a case-by-case basis.
We are aware that MicroPort has recalled certain sizes of its cobalt chrome modular neck products as a result of alleged fractures. As of December 31, 2017, there were four pending U.S. lawsuits and eight pending non-U.S. lawsuits against us alleging personal injury resulting from the fracture of a cobalt chrome modular neck. These claims will be managed as part of our standard product liability accrual methodology on a case-by-case basis. On October 27, 2017, our primary insurance carrier agreed to defend us in connection with these lawsuits under a reservation of rights.
We have maintained product liability insurance coverage on a claims-made basis. During the fiscal quarter ended March 31, 2013, we received a customary reservation of rights from our primary product liability insurance carrier asserting that present and future claims related to fractures of our PROFEMUR® titanium modular neck hip products and which allege certain types of injury (Titanium Modular Neck Claims) would be covered as a single occurrence under the policy year the first such claim was asserted. The effect of this coverage position would be to place Titanium Modular Neck Claims into a single prior policy year in which applicable claims-made coverage was available, subject to the overall policy limits then in effect. Management agrees with the assertion that the Titanium Modular Neck Claims should be treated as a single occurrence, but notified the carrier that it disputed the carrier's selection of available policy years. During the second quarter of 2013, we received confirmation from the primary carrier confirming their agreement with our policy year determination. Based on our insurer's treatment of Titanium Modular Neck Claims as a single occurrence, we increased our estimate of the total probable insurance recovery related to Titanium Modular Neck Claims by $19.4 million, and recognized such additional recovery as a reduction to our selling, general and administrative expenses for the fiscal quarter ended March 31, 2013, within results of discontinued operations. In the fiscal quarter ended June 30, 2013, we received payment from the primary insurance carrier of $5 million. In the fiscal quarter ended September 30, 2013,
75
we received payment of $10 million from the next insurance carrier in the tower. We have requested, but not yet received, payment of the remaining $25 million from the third insurance carrier in the tower for that policy period. The policies with the second and third carrier in this tower are “follow form” policies and management believes the third carrier should follow the coverage position taken by the primary and secondary carriers. On September 29, 2015, that third carrier asserted that the terms and conditions identified in its reservation of rights will preclude coverage for the Titanium Modular Neck Claims. We strongly dispute the carrier's position and, in accordance with the dispute resolution provisions of the policy, have initiated an arbitration proceeding in London, England seeking payment of these funds. Pursuant to applicable accounting standards, we reduced our insurance receivable balance for this claim to $0, and recorded a $25 million charge within “Net loss from discontinued operations” during the fiscal year ended December 27, 2015. The arbitration proceeding was completed on February 15, 2018 and the parties await the decision of the arbitration tribunal.
Claims for personal injury have also been made against us associated with our metal-on-metal hip products (primarily our CONSERVE® product line). The pre-trial management of certain of these claims has been consolidated in the federal court system, in the United States District Court for the Northern District of Georgia under the MDL and certain other claims by the JCCP in state court in Los Angeles County, California (collectively the Consolidated Metal-on-Metal Claims).
As of December 31, 2017, there were approximately 800 lawsuits pending in the MDL and JCCP, and an additional 50 cases pending in various U.S. state courts. As of that date, we have also entered into approximately 700 so called “tolling agreements” with potential claimants who have not yet filed suit. The number of lawsuits pending in the MDL and JCCP and tolling agreements disclosed above includes the claims that have been resolved pursuant to the MSA and Second Settlement Agreements discussed below. Based on presently available information, we believe approximately 300 of these matters allege claims involving bilateral implants. As of December 31, 2017, there were also approximately 50 non-U.S. lawsuits pending. We believe we have data that supports the efficacy and safety of our metal-on-metal hip products.
Every metal-on-metal hip case involves fundamental issues of law, science and medicine that often are uncertain, that continue to evolve, and which present contested facts and issues that can differ significantly from case to case. Such contested facts and issues include medical causation, individual patient characteristics, surgery specific factors, statutes of limitation, and the existence of actual, provable injury.
The first bellwether trial in the MDL commenced on November 9, 2015 in Atlanta, Georgia. On November 24, 2015, the jury returned a verdict in favor of the plaintiff and awarded the plaintiff $1 million in compensatory damages and $10 million in punitive damages. We believe there were significant trial irregularities and vigorously contested the trial result. On December 28, 2015, we filed a post-trial motion for judgment as a matter of law or, in the alternative, for a new trial or a reduction of damages awarded. On April 5, 2016, the trial judge issued an order reducing the punitive damage award from $10 million to $1.1 million, but otherwise denied our motion. On May 4, 2016, we filed a notice of appeal with the United States Court of Appeals for the Eleventh Circuit. The United States Court of Appeals for the Eleventh Circuit heard oral arguments on January 26, 2017 and on March 20, 2017, the Eleventh Circuit Court of Appeals upheld the lower court’s verdict. On April 10, 2017, we filed a petition for rehearing en banc or for panel rehearing, which was denied. In light of this denial, we elected to forego a further appeal and paid the judgment in July 2017.
The first bellwether trial in the JCCP, which was scheduled to commence on October 31, 2016, and subsequently rescheduled to January 9, 2017, was settled for an immaterial amount.
The first state court metal-on-metal hip trial not part of the MDL or JCCP commenced on October 24, 2016, in St. Louis, Missouri. On November 3, 2016, the jury returned a verdict in our favor. The plaintiff appealed and the appellate court heard oral argument on November 8, 2017. On February 20, 2018, the Missouri Court of Appeals, Eastern District, denied the plaintiff’s appeal and upheld the verdict of the trial court.
On November 1, 2016, WMT entered into the MSA with Court-appointed attorneys representing plaintiffs in the MDL and JCCP. Under the terms of the MSA, the parties agreed to settle 1,292 specifically identified claims associated with CONSERVE®, DYNASTY® and LINEAGE® products that meet the eligibility requirements of the MSA and are either pending in the MDL or JCCP, or subject to court-approved tolling agreements in the MDL or JCCP, for a settlement amount of $240 million.
The $240 million settlement amount is a maximum settlement based on the pool of 1,292 specific, existing claims comprised of an identified mix of CONSERVE®, DYNASTY® and LINEAGE® products (Initial Settlement Pool), with a value assigned to each product type, resulting in a total settlement of $240 million for the 1,292 claims in the Initial Settlement Pool.
Actual settlements paid to individual claimants are determined under the claims administration procedures contained in the MSA and may be more or less than the amounts used to calculate the $240 million settlement for the 1,292 claims in the Initial Settlement Pool. However in no event will variations in actual settlement amounts payable to individual claimants affect WMT’s maximum settlement obligation of $240 million or the manner in which it may be reduced due to opt outs, final product mix, or elimination of ineligible claims.
76
If it is determined a claim in the Initial Settlement Pool is ineligible due to failure to meet the eligibility criteria of the MSA, such claim will be removed and, where possible, replaced with a new eligible claim involving the same product, with the goal of having the number and mix of claims in the final settlement pool (before opt-outs) (Final Settlement Pool) equal, as nearly as possible, the number and mix of claims in the Initial Settlement Pool. Additionally, if any DYNASTY® or LINEAGE® claims in the Final Settlement Pool are determined to have been misidentified as CONSERVE® claims, or vice versa, the total settlement amount will be adjusted based on the value for each product type (not to exceed $240 million).
The MSA contains specific eligibility requirements and establishes procedures for proof and administration of claims, negotiation and execution of individual settlement agreements, determination of the final total settlement amount, and funding of individual settlement amounts by WMT. Eligibility requirements include, without limitation, that the claimant has a claim pending or tolled in the MDL or JCCP, that the claimant has undergone a revision surgery within eight years of the original implantation surgery, and that the claim has not been identified by WMT as having possible statute of limitation issues. Claimants who have had bilateral revision surgeries will be counted as two claims but only to the extent both claims separately satisfy all eligibility criteria.
The MSA includes a 95% opt-in requirement, meaning the MSA could have been terminated by WMT prior to any settlement disbursement if claimants holding greater than 5% of eligible claims in the Final Settlement Pool elected to “opt-out” of the settlement. WMT has confirmed that of the 1,292 eligible claims, 1,279 opted to participate in the settlement and 13 opted out, resulting in a final opt-in percentage of approximately 99%, well in excess of the required 95% threshold. On March 2, 2017, WMT agreed to replace the 13 opt-out claims with 13 additional claims that would have been eligible to participate in the MSA but for the 1,292 claim limit, bringing the total MSA settlement to the maximum limit of $240 million to settle 1,292 claims. Due to apparent demand from additional claimants excluded from settlement because of the 1,292 claims ceiling, but otherwise eligible for participation, on May 15, 2017 WMT agreed to settle an additional 53 such claims, on terms substantially identical to the MSA settlement terms, for a maximum additional settlement amount of $9.4 million.
During 2016 WMT escrowed $150 million to secure its obligations under the MSA, all of which had been paid as of December 31, 2017. As additional security, Wright Medical Group N.V., the indirect parent company of WMT, agreed to guarantee WMT’s obligations under the MSA.
On October 3, 2017, WMT entered into the Second Settlement Agreements with the Court-appointed attorneys representing plaintiffs in the MDL and JCCP. Under the terms of the Second Settlement Agreements, the parties agreed to settle 629 specifically identified CONSERVE®, DYNASTY® and LINEAGE® claims that meet the eligibility requirements of the Second Settlement Agreements and are either pending in the MDL or JCCP, or subject to court-approved tolling agreements in the MDL or JCCP, for a maximum settlement amount of $89.75 million. The comprehensive settlement amount was contingent on WMT’s recovery of new insurance proceeds totaling at least $35 million from applicable insurance carriers by December 31, 2017. On December 29, 2017, WMT entered into a First Amendment to the Third Settlement Agreement pursuant to which the deadline for the recovery of new insurance proceeds totaling at least $35 million from applicable insurance carriers was extended through February 28, 2018 and, on February 23, 2018, WMT entered into a Second Amendment to the Third Settlement Agreement pursuant to which the deadline was extended through March 30, 2018. To date, certain of the insurance carriers have contributed or agreed to contribute $20 million of funds applicable against the contingency.
The $89.75 million settlement amount is a maximum settlement based on the pool of 629 specific, existing claims comprised of an identified mix of CONSERVE®, DYNASTY® and LINEAGE® products (Second Settlement Initial Settlement Pool), with a value assigned to each product type. The actual settlement may be less, but not more, depending on several factors including the mix of products and claimants in the final settlement pool (Second Settlement Final Settlement Pool) and the number of claimants electing to “opt-out” of the settlement.
The total maximum settlement amount of $89.75 million is allocated among the following three tranches: (1) Tranche 1: $7.9 million to settle 49 additional claims that would have been eligible to participate in the MSA but for the claim limit contained therein, which amount will be funded as such claims are settled; (2) Tranche 2: $5.1 million to settle 39 eligible claims of the oldest claimants (by age), which amount will be funded as such claims are settled; and (3) Tranche 3: $76.75 million to settle 511 eligible claims pending or tolled in the MDL and JCCP existing as of June 30, 2017, and 30 new eligible claims which were presented between July 1, 2017 and October 1, 2017, which amount will be funded as follows: $45 million by June 30, 2018 and $31.75 million by September 30, 2019. Actual funding may extend beyond these dates pending completion of claims administration processes. The Tranche 3 settlement is contingent upon WMT receiving at least $35 million of new insurance proceeds from applicable carriers by March 30, 2018. There is no contingency with respect to Tranches 1 and 2.
Actual settlements paid to individual claimants will be determined under the claims administration procedures contained in the Second Settlement Agreements and may be more or less than the amounts used to calculate the $89.75 million settlement for the 629 claims in the Second Settlement Initial Settlement Pool. However in no event will variations in actual settlement amounts payable to individual claimants affect WMT’s maximum settlement obligation of $89.75 million or the manner in which it may be reduced due to opt outs, final product mix, or elimination of ineligible claims.
77
If it is determined that a claim in the Second Settlement Initial Settlement Pool is ineligible due to failure to meet the eligibility criteria of the Second Settlement Agreements, such claim will be removed and, where possible, replaced with a new eligible claim involving the same products as the removed claim.
The Second Settlement Agreements contain specific eligibility requirements and establish procedures for proof and administration of claims, negotiation and execution of individual settlement agreements, determination of the final total settlement amount, and funding of individual settlement amounts by WMT. Eligibility requirements include, without limitation, that the claimant has a claim pending or tolled in the MDL or JCCP and that, with limited exceptions, the claimant has undergone a revision surgery. Claimants who have had bilateral revision surgeries will be counted as two claims but only to the extent both claims separately satisfy all eligibility criteria.
Each of the Second Settlement Agreements includes a 95% opt-in requirement, meaning WMT may terminate either Settlement Agreement prior to any settlement disbursement if claimants holding greater than 5% of eligible claims in Tranches 1 and 2, collectively, or claimants holding greater than 5% of eligible claims in Tranche 3 in the Second Settlement Final Settlement Pool, elect to “opt-out” of the settlement. On January 2, 2018, WMT received notification that 100% of the claimants in Tranches 1 and 2 opted-in. WMT is currently reviewing proof of claim documentation for these claimants and has until March 2, 2018 to confirm that the 95% opt-in requirement has been met. Claimants in Tranche 3 have until April 2, 2018 to opt into the Second Settlement Agreements.
While the Second Settlement Agreements did not require WMT to escrow any amount to secure its obligations thereunder, as additional security, Wright Medical Group N.V., the indirect parent company of WMT, agreed to guarantee WMT’s obligations under the Second Settlement Agreements.
The MSA (which reference includes the supplemental settlements described above) and the Second Settlement Agreements were entered into solely as a compromise of the disputed claims being settled and are not evidence that any claim has merit nor are they an admission of wrongdoing or liability by WMT. WMT will continue to vigorously defend metal-on-metal hip claims not settled pursuant to the above agreements. The Second Settlement Agreements are contingent upon the dismissal without prejudice of pending and tolled claims in the MDL and JCCP that do not meet the inclusion criteria of the MDL or JCCP. Additionally, the Second Settlement Agreements are contingent upon the dismissal without prejudice of all remaining non-revision claims in the MDL and JCCP, pursuant to a tolling agreement that tolls applicable statutes of limitation and repose for three months from a revision of the products or determination that a revision of the products is necessary. The MDL and JCCP courts have both entered orders closing these proceedings to new claims.
As of December 31, 2017, we estimate there were approximately 50 outstanding metal-on-metal hip revision claims that were not included in the MSA or Second Settlement Agreements, approximately 50 claims pending in U.S courts other than the MDL and JCCP, and approximately 50 claims pending in non-U.S. courts. We also estimate that there were approximately 600 outstanding metal-on-metal hip non-revision claims as of December 31, 2017. These non-revision cases were excluded from the MSA and Second Settlement Agreements. As a result of entering into the Second Settlement Agreements during the third quarter of 2017, we recorded an additional accrual of $82.7 million for the 629 matters included within the settlement and for matters that have the same eligibility criteria.
As of December 31, 2017, our accrual for metal-on-metal claims totaled $177.5 million, of which $127.4 million is included in our consolidated balance sheet within “Accrued expenses and other current liabilities” and $50.1 million is included within “Other liabilities.” Our accrual is based on (i) case by case accruals for specific cases where facts and circumstances warrant, and (ii) the implied settlement values for eligible claims under the MSA or Second Settlement Agreements. We are unable to reasonably estimate the high-end of a possible range of loss for claims which elected or will elect to opt-out of the MSA or Second Settlement Agreements. Claims we can confirm would meet MSA or Second Settlement Agreements eligibility criteria but are excluded from the settlements due to the maximum settlement cap, or because they are state cases not part of the MDL or JCCP, have been accrued as of the respective settlement rates. Due to the general uncertainties surrounding all metal-on metal claims as noted above, as well as insufficient information about individual claims, we are presently unable to reasonably estimate a range of loss for future claims; hence we have not accrued for these claims at the present time.
We are unable to predict whether we will be successful in recovering the necessary insurance proceeds required to complete the comprehensive settlement pursuant to the Second Settlement Agreements within the requisite timeframe. We continue to believe the high-end of a possible range of loss for existing revision claims that do not meet eligibility criteria of the MSA or Second Settlement Agreements will not, on an average per case basis, exceed the average per case accrual we take for revision claims we can confirm do meet eligibility criteria of the MSA or Second Settlement Agreements, as applicable. Future claims will be evaluated for accrual on a case by case basis using the accrual methodologies described above (which could change if future facts and circumstances warrant).
We have maintained product liability insurance coverage on a claims-made basis. During the fiscal quarter ended September 30, 2012, we received a customary reservation of rights from our primary product liability insurance carrier asserting that certain present and future claims which allege certain types of injury related to our CONSERVE® metal-on-metal hip products
78
(CONSERVE® Claims) would be covered as a single occurrence under the policy year the first such claim was asserted. The effect of this coverage position would be to place CONSERVE® Claims into a single prior policy year in which applicable claims-made coverage was available, subject to the overall policy limits then in effect. Management agrees that there is insurance coverage for the CONSERVE® Claims, but has notified the carrier that it disputes the carrier's characterization of the CONSERVE® Claims as a single occurrence
In June 2014, Travelers, which was an excess carrier in our coverage towers across multiple policy years, filed a declaratory judgment action in Tennessee state court naming us and certain of our other insurance carriers as defendants and asking the court to rule on the rights and responsibilities of the parties with regard to the CONSERVE® Claims. Among other things, Travelers appeared to dispute our contention that the CONSERVE® Claims arise out of more than a single occurrence thereby triggering multiple policy periods of coverage. Travelers further sought a determination as to the applicable policy period triggered by the alleged single occurrence. We filed a separate lawsuit in state court in California for declaratory judgment against certain carriers and breach of contract against the primary carrier, and moved to dismiss or stay the Tennessee action on a number of grounds, including that California is the most appropriate jurisdiction. During the third quarter of 2014, the California Court granted Travelers' motion to stay our California action. On April 29, 2016, we filed a dispositive motion seeking partial judgment in our favor in the Tennessee action, which motion is pending and has been referred to a Special Master to consider the parties’ arguments. On June 10, 2016, Travelers withdrew its motion for summary judgment in the Tennessee action. One of the other insurance companies in the Tennessee action has stated that it will re-file a similar motion in the future.
In March 2017, Lexington, which had been dismissed from the Tennessee action, requested arbitration under five Lexington insurance policies in connection with the CONSERVE® Claims. We subsequently engaged in discussions and correspondence with Lexington about the scope of the requested arbitration(s). On or about October 27, 2017, Lexington filed an Application for Order to Compel Arbitration in the Commonwealth of Massachusetts, Suffolk County Superior Court, naming WMT, Wright Medical Group, Inc., and Wright Medical Group N.V. We opposed the Application, which remains pending.
On October 28, 2016, WMT and Wright Medical Group, Inc. (Wright Entities), entered into a Settlement Agreement, Indemnity and Hold Harmless Agreement and Policy Buyback Agreement (Insurance Settlement Agreement) with a subgroup of three insurance carriers, namely Columbia Casualty Company, Travelers and AXIS Surplus Lines Insurance Company (collectively, the Three Settling Insurers), pursuant to which the Three Settling Insurers paid WMT an aggregate of $60 million (in addition to $10 million previously paid by Columbia) in a lump sum. This amount is in full satisfaction of all potential liability of the Three Settling Insurers relating to metal-on-metal hip and similar metal ion release claims, including but not limited to all claims in the MDL and the JCCP, and all claims asserted by WMT against the Three Settling Insurers in the Tennessee action described above.
On December 13, 2016, we filed a motion in the Tennessee action described above to include allegations of bad faith against the primary insurance carrier. The motion was subsequently amended on February 8, 2017 to add similar bad faith claims against the remaining excess carriers. On April 13, 2017, the Court denied our motion, without prejudice to our right to re-assert the motion at a later time. On August 29, 2017, we refiled the motion to add a bad faith claim against the primary and excess insurance carriers. The Court granted our motion on October 19, 2017 and, on October 23, 2017, we filed amended cross-claims alleging bad faith against all of the insurance carriers. On November 9, 2017, our primary insurance carrier brought a motion to dismiss and strike our bad faith claim. The remaining excess carriers either joined the primary insurer’s motion or brought their own separate motions. On December 22, 2017 and December 29, 2017, we opposed the insurers’ motions to dismiss and strike our claim for bad faith. The motions remain pending.
As part of the settlement with the Three Settling Insurers, the Three Settling Insurers bought back from WMT their policies in the five policy years beginning with the August 15, 2007- August 15, 2008 policy year (Repurchased Policy Years). Consequently, the Wright Entities have no further coverage from the Three Settling Insurers for any present or future claims falling in the Repurchased Policy Years, or any other period in which a released claim is asserted. Additionally, the Insurance Settlement Agreement contains a so-called most favored nation provision which could require us to refund a pro rata portion of the settlement amount if we voluntarily enter into a settlement with the remaining carriers in the Repurchased Policy Years on certain terms more favorable than analogous terms in the Insurance Settlement Agreement. The Tennessee action will continue as to the remaining defendant insurers other than the Three Settling Insurers. The amount due to the Wright Entities under the Insurance Settlement Agreement was paid in the fourth quarter of 2016 and the Three Settling Insurers have been dismissed from the Tennessee action.
On February 22, 2018, we and certain of our subsidiaries entered into the Second Insurance Settlement Agreement with Federal, pursuant to which Federal agreed to pay us an aggregate of $15 million (in addition to $5 million previously paid by Federal) in a lump sum on or before the 10th business day after execution of the Second Insurance Settlement Agreement. This amount will be in full satisfaction of all potential liability of Federal relating to designated metal-on-metal hip claims, including but not limited to all claims asserted by our subsidiary WMT against Federal in the previously disclosed insurance coverage litigation. We have recorded a $15 million receivable as a result of this agreement within “Other current assets” as of December 31, 2017. On February 9, 2018, the Tennessee action was stayed for 60 days to allow Wright and Federal to finalize and document their settlement and for the remaining parties to negotiate potential settlement of all remaining claims.
79
As of December 31, 2017, we have received $78.4 million of insurance proceeds, including the above amount from the Three Settling Insurers, and our insurance carriers have paid a total of $6.7 million directly to claimants in connection with various settlements, which represents amounts undisputed by the carriers. Except as provided in the Insurance Settlement Agreement and the Second Insurance Settlement Agreement, our acceptance of the insurance proceeds was not a waiver of any other claim we may have against the insurance carriers. However, the amount we ultimately receive will depend on the outcome of our dispute with the remaining carriers (other than the Three Settling Carriers and Federal) concerning the number of policy years available. We believe our contracts with the insurance carriers are enforceable for these claims; and, therefore, we believe it is probable we will receive additional recoveries from the remaining carriers. Settlement discussions with the remaining insurance carriers continue.
Given the substantial or indeterminate amounts sought in these matters, and the inherent unpredictability of such matters, an adverse outcome in these matters in excess of the amounts included in our accrual for contingencies could have a material adverse effect on our financial condition, results of operations and cash flow. Future revisions to our estimates of these provisions could materially impact our results of operations and financial position. We use the best information available to determine the level of accrued product liabilities, and believe our accruals are adequate.
In June 2015, a jury returned a $4.4 million verdict against us in a case involving a fractured hip implant stem sold prior to the MicroPort closing. This was a one-of-a-kind case unrelated to the modular neck fracture cases we have been reporting. There are no other cases pending related to this component, nor are we aware of other instances where this component has fractured. In September 2015, the trial judge reduced the jury verdict to $1.025 million and indicated that if the plaintiff did not accept the reduced award he would schedule a new trial solely on the issue of damages. The plaintiff elected not to accept the reduced damage award, and both parties have appealed. The Court has not set a date for a new trial on the issue of damages and we do not expect it will do so until the appeals are adjudicated. We will maintain our current $4.4 million accrual as a probable liability until the matter is resolved. The $4.4 million probable liability associated with this matter is reflected within “Accrued expenses and other current liabilities,” and a $4 million receivable associated with the probable recovery from product liability insurance is reflected within “Other current assets.” On November 14, 2017, our primary insurance carrier agreed to defend and indemnify us in connection with this lawsuit under a reservation of rights. On January 9, 2018, the California appellate court heard oral argument on the parties’ cross-appeals.
Accounting for income taxes. We account for income taxes in accordance with provisions which set forth an asset and liability approach that requires the recognition of deferred tax assets and deferred tax liabilities for the expected future tax consequences of temporary differences between the carrying amounts and the tax bases of assets and liabilities. Realization of deferred tax assets in each taxable jurisdiction is dependent on our ability to generate future taxable income sufficient to realize the benefits. Management evaluates deferred tax assets on an ongoing basis and provides valuation allowances to reduce net deferred tax assets to the amount that is more likely than not to be realized.
In December 2017, the United States enacted new legislation under the 2017 Tax Act which included significant provision changes in the U.S. including, but not limited to, lowering the federal statutory rate to 21% beginning in January 2018, changing the net operating loss carryforward period and introducing a limitation on usage of these attributes, repealing the alternative minimum tax (AMT) system, and imposing a one-time toll charge on a U.S. shareholder’s cumulative undistributed post-1986 earnings of foreign subsidiaries. We are required to recognize the effect of any tax law changes during the period of enactment including re-measuring any deferred tax assets and liabilities based on when these attributes are expected to be realized in the future and re-analyzing positive and negative evidence regarding the realizability of deferred tax assets. Also in December 2017, the SEC issued Staff Accounting Bulletin No. 118, Income Tax Accounting Implications of the Tax Cuts and Jobs Act (SAB 118), which allows us to record provisional amounts under a one-year measurement period to consider upcoming guidance and interpretations and to complete further analysis that may affect our current estimates in our consolidated financial statements within the next year.
Our valuation allowance balances totaled $366.8 million and $479.4 million as of December 31, 2017 and December 25, 2016, respectively, due to uncertainties related to our ability to realize, before expiration, certain of our deferred tax assets for both U.S. and foreign income tax purposes.
As a multinational corporation, we are subject to taxation in many jurisdictions and the calculation of our tax liabilities involves dealing with uncertainties in the application of complex tax laws and regulations in various taxing jurisdictions. In accordance with ASC 740 Income Taxes, we recognize the tax effects of an income tax position only if they are “more-likely-than-not” to be sustained based solely on the technical merits as of the reporting date. If we ultimately determine that the payment of these liabilities will be unnecessary, we will reverse the liability and recognize a tax benefit in the period in which we determine the liability no longer applies. Conversely, we record additional tax charges in a period in which we determine that a recorded tax liability is less than we expect the ultimate assessment to be. Our unrecognized tax benefits totaled $6.0 million and $8.1 million as of December 31, 2017 and December 25, 2016, respectively.
Share-based compensation. We calculate the grant date fair value of restricted stock units and performance share units as the closing sale price of our ordinary shares on the grant date, as reported by the Nasdaq Global Select Market. Share-based
80
compensation expense associated with outstanding performance share units is measured using the grant date fair value and is based on the estimated achievement of the established performance criteria at the end of each reporting period until the performance period ends, recognized on a straight-line basis over the performance period. Share-based compensation expense is only recognized for performance share units that we expect to vest, which we estimate based upon an assessment of the probability that the performance criteria will be achieved. The performance share units granted during the fiscal year ended December 31, 2017 have a three-year performance-based metric measured over a performance period from June 26, 2017 to June 28, 2020. Share-based compensation expense associated with outstanding performance share units is updated for actual forfeitures.
We use the Black-Scholes option pricing model to determine the fair value of stock options and employee stock purchase plan shares. The determination of the fair value of these share-based payment awards on the date of grant using an option-pricing model is affected by our stock price as well as assumptions regarding a number of complex and subjective variables, which include the expected life of the award, the expected stock price volatility over the expected life of the awards, expected dividend yield, and risk-free interest rate.
We estimate the expected life of options evaluating the historical activity as required by FASB ASC Topic 718, Compensation — Stock Compensation. Prior to the Wright/Tornier merger, the expected life of options was estimated based on historical option exercise and employee termination data. Post merger, the expected life of options was estimated based on the simplified method due to a lack of comparable, historical option exercise, and employee termination data for the combined company. The expected stock price volatility assumption was estimated based upon historical volatility of our ordinary shares for both legacy Wright and legacy Tornier prior to October 1, 2015 for and the total combined company after the Wright/Tornier merger. The risk-free interest rate is determined using U.S. Treasury rates where the term is consistent with the expected life of the stock options. Expected dividend yield is not considered as we have never paid dividends and have no plans of doing so in the future.
The Black-Scholes option-pricing model was developed for use in estimating the fair value of traded options that have no vesting restrictions and are fully transferable, characteristics not present in our option grants and employee stock purchase plan shares. Existing valuation models, including the Black-Scholes and lattice binomial models, may not provide reliable measures of the fair values of our share-based compensation. Consequently, there is a risk that our estimates of the fair values of our share-based compensation awards on the grant dates may bear little resemblance to the actual values realized upon the exercise, expiration, early termination, or forfeiture of those share-based payments in the future. Certain share-based payments, such as employee stock options, may expire worthless or otherwise result in zero intrinsic value as compared to the fair values originally estimated on the grant date and reported in our financial statements. Alternatively, value may be realized from these instruments that is significantly higher than the fair values originally estimated on the grant date and reported in our financial statements. There is not currently a market-based mechanism or other practical application to verify the reliability and accuracy of the estimates stemming from these valuation models.
We estimate forfeitures at the time of grant and revise those estimates in subsequent periods if actual forfeitures differ from those estimates. We use historical data to estimate pre-vesting forfeitures and record share-based compensation expense only for those awards that are expected to vest. All share-based awards are amortized on a straight-line basis over their respective requisite service periods, which are generally the vesting periods.
If factors change and we employ different assumptions for estimating share-based compensation expense in future periods, such share-based compensation expense in future periods may differ significantly from what we have recorded in the current period and could materially affect our operating income, net income, and net income per share. A change in assumptions may also result in a lack of comparability with other companies that use different models, methods, and assumptions.
See Note 14 to our consolidated financial statements contained in “Item 8. Financial Statements and Supplementary Data” for further information regarding our share-based compensation.
Recent Accounting Pronouncements
Information regarding recent accounting pronouncements is included in Note 2 to the consolidated financial statements in “Item 8. Financial Statements and Supplementary Data”.
81
Item 7A. Quantitative and Qualitative Disclosures About Market Risk.
Interest Rate Risk
Our exposure to interest rate risk arises principally from variable interest rates applicable to borrowings under our ABL Facility and the interest rates associated with our invested cash balances.
Borrowings under our ABL Facility bear interest at variable rates. The interest rate margin applicable to borrowings under the ABL Facility is, at the option of the Borrowers, equal to either (a) 3.25% for base rate loans or (b) 4.25% for LIBOR rate loans, subject to a 0.75% LIBOR floor. As of December 31, 2017, we had $53.6 million of borrowings under our ABL Facility. Based upon this debt level, and the LIBOR floor on our interest rate, a 100 basis point increase in the annual interest rate on such borrowings would have an immaterial impact on our interest expense on an annual basis.
Our exposure to interest rate risk arises principally from the interest rates associated with our invested cash balances. On December 31, 2017, we had invested cash and cash equivalents of approximately $167.7 million. We believe that a 10 basis point change in interest rates is reasonably possible in the near term. Based on our current level of investment, an increase or decrease of 10 basis points in interest rates would have an annual impact of approximately $0.2 million to our interest income.
As of December 31, 2017, we had outstanding $587.5 million and $395.0 million principal amount of our 2020 and 2021 Notes, respectively. We carry these instruments at face value less unamortized discount on our consolidated balance sheets. Since these instruments bear interest at a fixed rate, we have no financial statement risk associated with changes in interest rates. However, the fair value of these instruments fluctuates when interest rates change, and when the market price of our ordinary shares fluctuates. We do not carry the 2020 and 2021 Notes at fair value, but present the fair value of the principal amount of our 2020 and 2021 Notes for disclosure purposes.
Equity Price Risk
On February 13, 2015, WMG issued $632.5 million of the 2020 Notes, which generated net proceeds of approximately $613 million. The holders of the 2020 Notes may convert their 2020 Notes into cash upon the satisfaction of certain circumstances as described in Note 9. The conversion and settlement provisions of the 2020 Notes are based on the price of our ordinary shares at conversion or at maturity of the notes. In addition, the hedges and warrants associated with these convertible notes also include settlement provisions that are based on the price of our ordinary shares. The amount of cash we may be required to pay, or the number of shares we may be required to provide to note holders at conversion or maturity of these notes, is determined by the price of our ordinary shares. The amount of cash that we may receive from hedge counterparties in connection with the related hedges and the number of shares that we may be required to provide warrant counterparties in connection with the related warrants are also determined by the price of our ordinary shares.
Upon the expiration of our warrants issued in connection with the 2020 Notes, we will issue ordinary shares to the purchasers of the warrants to the extent the price of our ordinary shares exceeds the warrant strike price at that time. On November 24, 2015, Wright Medical Group N.V. assumed WMG's obligations pursuant to the warrants, and the strike price of the warrants was adjusted from $40.00 to $38.8010 per ordinary share. The following table shows the number of shares that we would issue to warrant counterparties at expiration of the warrants assuming various closing prices of our ordinary shares on the date of warrant expiration:
Share price | Shares (in thousands) | ||
$42.68 | (10% greater than strike price) | 1,784 | |
$46.56 | (20% greater than strike price) | 3,270 | |
$50.44 | (30% greater than strike price) | 4,528 | |
$54.32 | (40% greater than strike price) | 5,606 | |
$58.20 | (50% greater than strike price) | 6,540 | |
82
The fair value of the 2020 Notes Conversion Derivative and the 2020 Notes Hedge is directly impacted by the price of our ordinary shares. We entered into the 2020 Notes Hedges in connection with the issuance of the 2020 Notes with the option counterparties. The 2020 Notes Hedges, which are cash-settled, are intended to reduce our exposure to potential cash payments that we are required to make upon conversion of the 2020 Notes in excess of the principal amount of converted notes if our ordinary share price exceeds the conversion price. The following table presents the fair values of the 2020 Notes Conversion Derivative and 2020 Notes Hedge as a result of a hypothetical 10% increase and decrease in the price of our ordinary shares. We believe that a 10% change in our share price is reasonably possible in the near term:
(in thousands) | |||
Fair value of security given a 10% decrease in share price | Fair value of security as of December 31, 2017 | Fair value of security given a 10% increase in share price | |
2020 Notes Hedges (Asset) | $29,871 | $45,033 | $63,590 |
2020 Notes Conversion Derivative (Liability) | $28,619 | $44,132 | $63,350 |
On May 20, 2016, we issued $395.0 million aggregate principal amount of the 2021 Notes. The holders of the 2021 Notes may convert their 2021 Notes into cash upon the satisfaction of certain circumstances as described in Note 9. The conversion and settlement provisions of the 2021 Notes are based on the price of our ordinary shares at conversion or at maturity of the notes. In addition, the hedges and warrants associated with these convertible notes also include settlement provisions that are based on the price of our ordinary shares. The amount of cash we may be required to pay, or the number of shares we may be required to provide to note holders at conversion or maturity of these notes, is determined by the price of our ordinary shares. The amount of cash that we may receive from hedge counterparties in connection with the related hedges and the number of shares that we may be required to provide warrant counterparties in connection with the related warrants are also determined by the price of our ordinary shares.
Upon the expiration of our warrants issued in connection with the 2021 Notes, we will issue ordinary shares to the purchasers of the warrants to the extent the price of our ordinary shares exceeds the warrant strike price of $30.00 at that time. The following table shows the number of shares that we would issue to warrant counterparties at expiration of the warrants assuming various closing prices of our ordinary shares on the date of warrant expiration:
Share price | Shares (in thousands) | ||
$33.00 | (10% greater than strike price) | 1,681 | |
$36.00 | (20% greater than strike price) | 3,082 | |
$39.00 | (30% greater than strike price) | 4,268 | |
$42.00 | (40% greater than strike price) | 5,284 | |
$45.00 | (50% greater than strike price) | 6,164 | |
The fair value of the 2021 Notes Conversion Derivative and the 2021 Notes Hedge is directly impacted by the price of our ordinary shares. We entered into the 2021 Notes Hedges in connection with the issuance of the 2021 Notes with the option counterparties. The 2021 Notes Hedges, which are cash-settled, are intended to reduce our exposure to potential cash payments that we are required to make upon conversion of the 2021 Notes in excess of the principal amount of converted notes if our ordinary share price exceeds the conversion price. The following table presents the fair values of the 2021 Notes Conversion Derivative and 2021 Notes Hedge as a result of a hypothetical 10% increase and decrease in the price of our ordinary shares. We believe that a 10% change in our share price is reasonably possible in the near term:
(in thousands) | |||
Fair value of security given a 10% decrease in share price | Fair value of security as of December 31, 2017 | Fair value of security given a 10% increase in share price | |
2021 Notes Hedges (Asset) | $99,791 | $127,063 | $156,415 |
2021 Notes Conversion Derivative (Liability) | $96,539 | $126,148 | $158,159 |
Foreign Currency Exchange Rate Fluctuations
Fluctuations in the rate of exchange between the U.S. dollar and foreign currencies could adversely affect our financial results. Approximately 23% of our net sales from continuing operations were denominated in foreign currencies during the fiscal year ended December 31, 2017 and we expect that foreign currencies will continue to represent a similarly significant percentage of our net sales in the future. The cost of sales related to these sales is primarily denominated in U.S. dollars; however, operating costs related to these sales are largely denominated in the same respective currencies, thereby partially limiting our transaction risk exposure. For sales not denominated in U.S. dollars, an increase in the rate at which a foreign currency is exchanged for U.S.
83
dollars will require more of the foreign currency to equal a specified amount of U.S. dollars than before the rate increase. In such cases, if we price our products in the foreign currency, we will receive less in U.S. dollars than we did before the rate increase went into effect. If we price our products in U.S. dollars and our competitors price their products in local currency, an increase in the relative strength of the U.S. dollar could result in our prices not being competitive in a market where business is transacted in the local currency.
In 2017, approximately 90% of our net sales denominated in foreign currencies were derived from European Union countries, which are denominated in the Euro; from the United Kingdom, which are denominated in the British pound; from Australia which are denominated in Australian dollar; and from Canada, which are denominated in the Canadian dollar. Additionally, we have significant intercompany receivables, payables, and debt from our foreign subsidiaries that are denominated in foreign currencies, principally the Euro, the Japanese yen, the British pound, the Australian dollar, and the Canadian dollar. Our principal exchange rate risk, therefore, exists between the U.S. dollar and the Euro, British pound, Australian dollar, and the Canadian dollar. Fluctuations from the beginning to the end of any given reporting period result in the revaluation of our foreign currency-denominated intercompany receivables, payables, and debt generating currency translation gains or losses that impact our non-operating income and expense levels in the respective period.
As discussed in Note 6 to the consolidated financial statements contained in “Item 8. Financial Statements and Supplementary Data,” during 2017 we entered into certain short-term derivative financial instruments in the form of foreign currency forward contracts. These forward contracts are designed to mitigate our exposure to currency fluctuations in our intercompany balances denominated currently in Euros, British pounds, and Canadian dollars. Any change in the fair value of these forward contracts as a result of a fluctuation in a currency exchange rate is expected to be offset by a change in the value of the intercompany balance. These contracts are effectively closed at the end of each reporting period.
A uniform 10% strengthening in the value of the U.S. dollar relative to the currencies in which our transactions are denominated would have resulted in an increase in operating income of approximately $2.4 million for the fiscal year ended December 31, 2017. This hypothetical calculation assumes that each exchange rate would change in the same direction relative to the U.S. dollar. This sensitivity analysis of the effects of changes in foreign currency exchange rates does not factor in a potential change in sales levels or local currency prices, which can also be affected by the change in exchange rates. We plan to discontinue our foreign currency forward contracts derivative program in 2018.
84
Item 8. Financial Statements and Supplementary Data.
Wright Medical Group N.V. Consolidated Financial Statements for the Fiscal Years Ended December 31, 2017, December 25, 2016, and December 27, 2015 Index to Financial Statements | |
Page | |
Consolidated Financial Statements: | |
85
Report of Independent Registered Public Accounting Firm
The Shareholders and Board of Directors
Wright Medical Group N.V.:
Opinion on the Consolidated Financial Statements
We have audited the accompanying consolidated balance sheets of Wright Medical Group N.V. and subsidiaries (the Company) as of December 31, 2017 and December 25, 2016, and the related consolidated statements of operations, comprehensive loss, cash flows and shareholders’ equity for the years ended December 31, 2017, December 25, 2016, and December 27, 2015, and the related notes and the financial statement schedule (collectively, the “consolidated financial statements”). In our opinion, the consolidated financial statements referred to above present fairly, in all material respects, the financial position of the Company as of December 31, 2017 and December 25, 2016, and the results of their operations and their cash flows for the years ended December 31, 2017, December 25, 2016, and December 27, 2015, in conformity with U.S. generally accepted accounting principles.
We also have audited, in accordance with the standards of the Public Company Accounting Oversight Board (United States) (PCAOB), the Company’s internal control over financial reporting as of December 31, 2017, based on the criteria established in Internal Control - Integrated Framework (2013) issued by the Committee of Sponsoring Organizations of the Treadway Commission, and our report dated February 27, 2018 expressed an unqualified opinion on the effectiveness of the Company’s internal control over financial reporting.
Basis for Opinion
These consolidated financial statement are the responsibility of the Company’s management. Our responsibility is to express an opinion on these consolidated financial statements based on our audits. We are a public accounting firm registered with the PCAOB and are required to be independent with respect to the Company in accordance with the U.S. federal securities laws and the applicable rules and regulations of the Securities and Exchange Commission and the PCAOB.
We conducted our audits in accordance with the standards of the PCAOB. Those standards require that we plan and perform the audits to obtain reasonable assurance about whether the consolidated financial statements are free of material misstatement, whether due to error or fraud. Our audits of the consolidated financial statements included performing procedures to assess the risks of material misstatement of the consolidated financial statements, whether due to error or fraud, and performing procedures that respond to those risks. Such procedures included examining, on a test basis, evidence supporting the amounts and disclosures in the consolidated financial statements. Our audits also included evaluating the accounting principles used and significant estimates made by management, as well as evaluating the overall presentation of the consolidated financial statements. We believe that our audits provide a reasonable basis for our opinion.
/s/ KPMG LLP
We have served as the Company’s auditor since 2002.
Memphis, Tennessee
February 27, 2018
86
Report of Independent Registered Public Accounting Firm
The Shareholders and Board of Directors
Wright Medical Group N.V.:
Opinion on Internal Control Over Financial Reporting
We have audited Wright Medical Group N.V. and subsidiaries’ (the Company) internal control over financial reporting as of December 31, 2017, based on criteria established in Internal Control - Integrated Framework (2013) issued by the Committee of Sponsoring Organizations of the Treadway Commission. In our opinion, the Company maintained, in all material respects, effective internal control over financial reporting as of December 31, 2017, based on criteria established in Internal Control - Integrated Framework (2013) issued by the Committee of Sponsoring Organizations of the Treadway Commission.
We also have audited, in accordance with the standards of the Public Company Accounting Oversight Board (United States) (PCAOB), the consolidated balance sheets of the Company as of December 31, 2017 and December 25, 2016, and the related consolidated statements of operations, comprehensive loss, cash flows and shareholders’ equity for the years ended December 31, 2017, December 25, 2016, and December 27, 2015, and the related notes and the financial statement schedule (collectively, the “consolidated financial statements”), and our report dated February 27, 2018 expressed an unqualified opinion on those consolidated financial statements.
Basis for Opinion
The Company’s management is responsible for maintaining effective internal control over financial reporting and for its assessment of the effectiveness of internal control over financial reporting, included in the accompanying Item 9A of the Company’s Annual Report on Form 10-K as of December 31, 2017. Our responsibility is to express an opinion on the Company’s internal control over financial reporting based on our audit. We are a public accounting firm registered with the PCAOB and are required to be independent with respect to the Company in accordance with the U.S. federal securities laws and the applicable rules and regulations of the Securities and Exchange Commission and the PCAOB.
We conducted our audit in accordance with the standards of the PCAOB. Those standards require that we plan and perform the audit to obtain reasonable assurance about whether effective internal control over financial reporting was maintained in all material respects. Our audit of internal control over financial reporting included obtaining an understanding of internal control over financial reporting, assessing the risk that a material weakness exists, and testing and evaluating the design and operating effectiveness of internal control based on the assessed risk. Our audit also included performing such other procedures as we considered necessary in the circumstances. We believe that our audit provides a reasonable basis for our opinion.
Definition and Limitations of Internal Control Over Financial Reporting
A company’s internal control over financial reporting is a process designed to provide reasonable assurance regarding the reliability of financial reporting and the preparation of financial statements for external purposes in accordance with generally accepted accounting principles. A company’s internal control over financial reporting includes those policies and procedures that (1) pertain to the maintenance of records that, in reasonable detail, accurately and fairly reflect the transactions and dispositions of the assets of the company; (2) provide reasonable assurance that transactions are recorded as necessary to permit preparation of financial statements in accordance with generally accepted accounting principles, and that receipts and expenditures of the company are being made only in accordance with authorizations of management and directors of the company; and (3) provide reasonable assurance regarding prevention or timely detection of unauthorized acquisition, use, or disposition of the company’s assets that could have a material effect on the financial statements.
Because of its inherent limitations, internal control over financial reporting may not prevent or detect misstatements. Also, projections of any evaluation of effectiveness to future periods are subject to the risk that controls may become inadequate because of changes in conditions, or that the degree of compliance with the policies or procedures may deteriorate.
/s/ KPMG LLP
Memphis, Tennessee
February 27, 2018
87
Wright Medical Group N.V. Consolidated Balance Sheets (In thousands, except share data) | |||||||
December 31, 2017 | December 25, 2016 | ||||||
Assets: | |||||||
Current assets: | |||||||
Cash and cash equivalents | $ | 167,740 | $ | 262,265 | |||
Restricted cash (Note 17) | — | 150,000 | |||||
Accounts receivable, net | 130,610 | 130,602 | |||||
Inventories (Note 5) | 168,144 | 150,849 | |||||
Prepaid expenses | 13,555 | 11,678 | |||||
Other current assets | 86,845 | 54,231 | |||||
Total current assets | 566,894 | 759,625 | |||||
Property, plant and equipment, net (Note 7) | 212,379 | 201,732 | |||||
Goodwill (Note 8) | 933,662 | 851,042 | |||||
Intangible assets, net (Note 8) | 231,001 | 231,797 | |||||
Deferred income taxes (Note 11) | 937 | 1,498 | |||||
Other assets | 183,851 | 244,892 | |||||
Total assets | $ | 2,128,724 | $ | 2,290,586 | |||
Liabilities and Shareholders’ Equity: | |||||||
Current liabilities: | |||||||
Accounts payable | $ | 41,831 | $ | 32,866 | |||
Accrued expenses and other current liabilities (Note 12) | 314,558 | 407,704 | |||||
Current portion of long-term obligations (Note 9) | 58,906 | 33,948 | |||||
Total current liabilities | 415,295 | 474,518 | |||||
Long-term debt and capital lease obligations (Note 9) | 836,208 | 780,407 | |||||
Deferred income taxes (Note 11) | 15,780 | 27,550 | |||||
Other liabilities (Note 12) | 272,745 | 321,247 | |||||
Total liabilities | 1,540,028 | 1,603,722 | |||||
Commitments and contingencies (Note 16) | |||||||
Shareholders’ equity: | |||||||
Ordinary shares, €0.03 par value, authorized: 320,000,000 shares; issued and outstanding: 105,807,424 shares at December 31, 2017 and 103,400,995 shares at December 25, 2016 | 3,896 | 3,815 | |||||
Additional paid-in capital | 1,971,347 | 1,908,749 | |||||
Accumulated other comprehensive income (loss) | 22,290 | (19,461 | ) | ||||
Accumulated deficit | (1,408,837 | ) | (1,206,239 | ) | |||
Total shareholders’ equity | 588,696 | 686,864 | |||||
Total liabilities and shareholders’ equity | $ | 2,128,724 | $ | 2,290,586 | |||
The accompanying notes are an integral part of these consolidated financial statements.
88
Wright Medical Group N.V. Consolidated Statements of Operations (In thousands, except per share data) | |||||||||||
Fiscal year ended | |||||||||||
December 31, 2017 | December 25, 2016 | December 27, 2015 | |||||||||
Net sales | $ | 744,989 | $ | 690,362 | $ | 405,326 | |||||
Cost of sales 1, 2 | 160,947 | 192,407 | 113,622 | ||||||||
Gross profit | 584,042 | 497,955 | 291,704 | ||||||||
Operating expenses: | |||||||||||
Selling, general and administrative 2 | 525,222 | 541,558 | 424,377 | ||||||||
Research and development 2 | 50,115 | 50,514 | 39,339 | ||||||||
Amortization of intangible assets | 28,396 | 28,841 | 16,754 | ||||||||
Total operating expenses | 603,733 | 620,913 | 480,470 | ||||||||
Operating loss | (19,691 | ) | (122,958 | ) | (188,766 | ) | |||||
Interest expense, net | 74,644 | 58,530 | 41,358 | ||||||||
Other expense (income), net | 5,570 | (3,148 | ) | 10,884 | |||||||
Loss from continuing operations before income taxes | (99,905 | ) | (178,340 | ) | (241,008 | ) | |||||
Benefit for income taxes (Note 11) | (34,968 | ) | (13,406 | ) | (3,652 | ) | |||||
Net loss from continuing operations | (64,937 | ) | (164,934 | ) | (237,356 | ) | |||||
Loss from discontinued operations, net of tax (Note 4) | (137,661 | ) | (267,439 | ) | (61,345 | ) | |||||
Net loss | $ | (202,598 | ) | $ | (432,373 | ) | $ | (298,701 | ) | ||
Net loss from continuing operations per share-basic and diluted (Note 13): 3 | $ | (0.62 | ) | $ | (1.60 | ) | $ | (3.66 | ) | ||
Net loss from discontinued operations per share-basic and diluted (Note 13): 3 | $ | (1.32 | ) | $ | (2.60 | ) | $ | (0.95 | ) | ||
Net loss per share-basic and diluted (Note 13): 3 | $ | (1.94 | ) | $ | (4.20 | ) | $ | (4.61 | ) | ||
Weighted-average number of ordinary shares outstanding-basic and diluted 3 | 104,531 | 102,968 | 64,808 | ||||||||
___________________________
1 | Cost of sales includes amortization of inventory step-up adjustment of $37.7 million and $10.3 million for the fiscal year ended December 25, 2016 and December 27, 2015, respectively. |
2 | These line items include the following amounts of non-cash, share-based compensation expense for the periods indicated: |
Fiscal year ended | |||||||||||
December 31, 2017 | December 25, 2016 | December 27, 2015 | |||||||||
Cost of sales | $ | 565 | $ | 414 | $ | 287 | |||||
Selling, general and administrative | 17,705 | 13,216 | 22,777 | ||||||||
Research and development | 1,123 | 786 | 1,900 | ||||||||
3 | The 2015 weighted-average shares outstanding includes additional shares issued on October 1, 2015 as part of the Wright/Tornier merger as described in Note 13. |
The accompanying notes are an integral part of these consolidated financial statements.
89
Wright Medical Group N.V.
Consolidated Statements of Comprehensive Loss
(In thousands)
Fiscal year ended | ||||||||||||
December 31, 2017 | December 25, 2016 | December 27, 2015 | ||||||||||
Net loss | $ | (202,598 | ) | $ | (432,373 | ) | $ | (298,701 | ) | |||
Other comprehensive income (loss), net of tax: | ||||||||||||
Changes in foreign currency translation | 41,751 | (8,977 | ) | (12,882 | ) | |||||||
Other comprehensive income (loss) | 41,751 | (8,977 | ) | (12,882 | ) | |||||||
Comprehensive loss | $ | (160,847 | ) | $ | (441,350 | ) | $ | (311,583 | ) | |||
The accompanying notes are an integral part of these consolidated financial statements.
90
Wright Medical Group N.V. Consolidated Statements of Cash Flows (In thousands) | |||||||||||
Fiscal year ended | |||||||||||
December 31, 2017 | December 25, 2016 | December 27, 2015 | |||||||||
Operating activities: | |||||||||||
Net loss | $ | (202,598 | ) | $ | (432,373 | ) | $ | (298,701 | ) | ||
Adjustments to reconcile net loss to net cash (used in) provided by operating activities: | |||||||||||
Depreciation | 56,832 | 56,782 | 29,481 | ||||||||
Share-based compensation expense (Note 14) | 19,393 | 14,416 | 24,964 | ||||||||
Amortization of intangible assets | 28,396 | 29,180 | 16,922 | ||||||||
Amortization of deferred financing costs and debt discount | 50,379 | 40,487 | 27,600 | ||||||||
Deferred income taxes (Note 11) | (13,791 | ) | (20,583 | ) | (3,087 | ) | |||||
Provision for excess and obsolete inventory | 19,171 | 22,046 | 14,218 | ||||||||
Write-off of deferred financing costs | — | 12,343 | 25,101 | ||||||||
Amortization of inventory step-up adjustment | — | 41,503 | 11,356 | ||||||||
Non-cash adjustment to derivative fair value | (4,797 | ) | (28,273 | ) | (10,045 | ) | |||||
Loss on sale of business (Note 4) | — | 21,342 | — | ||||||||
Mark-to-market adjustment for CVRs (Note 2) | 5,320 | 8,688 | (7,571 | ) | |||||||
Reduction of insurance receivable | — | — | 25,000 | ||||||||
Other | 1,385 | 4,425 | 4,780 | ||||||||
Changes in assets and liabilities (net of acquisitions): | |||||||||||
Accounts receivable | 2,483 | (1,118 | ) | (13,078 | ) | ||||||
Inventories | (29,526 | ) | (187 | ) | (24,695 | ) | |||||
Prepaid expenses and other current assets | (22,744 | ) | 22,441 | (10,471 | ) | ||||||
Accounts payable | 6,260 | 1,495 | (2,919 | ) | |||||||
Accrued expenses and other liabilities | (21,834 | ) | (11,251 | ) | 23,258 | ||||||
CVR payment in excess of value assigned as part of PPA | — | — | (27,983 | ) | |||||||
Metal on metal product liabilities (Note 16) | (79,139 | ) | 256,461 | — | |||||||
Net cash (used in) provided by operating activities | (184,810 | ) | 37,824 | (195,870 | ) | ||||||
Investing activities: | |||||||||||
Capital expenditures | (63,474 | ) | (50,099 | ) | (43,666 | ) | |||||
Acquisition of businesses, net of cash acquired | (44,128 | ) | — | (4,905 | ) | ||||||
Purchase of intangible assets | (2,099 | ) | (4,845 | ) | (82 | ) | |||||
Cash acquired from merger with Tornier | — | — | 30,117 | ||||||||
Sales and maturities of available-for-sale marketable securities | — | — | 2,566 | ||||||||
Proceeds from sale of assets | 280 | — | — | ||||||||
Proceeds from sale of businesses | — | 20,703 | — | ||||||||
Net cash used in investing activities | (109,421 | ) | (34,241 | ) | (15,970 | ) | |||||
Financing activities: | |||||||||||
Issuance of ordinary shares | 27,551 | 8,460 | 3,513 | ||||||||
Proceeds from stock warrants | — | 54,629 | 87,072 | ||||||||
Payment of note hedge options | — | (99,816 | ) | (144,843 | ) | ||||||
Repurchase of stock warrants | — | (3,319 | ) | (59,803 | ) | ||||||
Payment of notes premium | — | (1,619 | ) | (49,152 | ) | ||||||
Proceeds from notes hedge options | — | 3,892 | 69,764 | ||||||||
Payment of debt acquired from merger with Tornier | — | — | (81,367 | ) | |||||||
Proceeds from other debt | 34,901 | 425,821 | 632,500 | ||||||||
Payments of debt | (11,517 | ) | — | — | |||||||
Redemption of convertible notes | — | (102,974 | ) | (240,000 | ) | ||||||
Payments of deferred financing costs and equity issuance costs | — | (11,108 | ) | (20,081 | ) | ||||||
Payment of contingent consideration | (1,429 | ) | (1,035 | ) | (70,120 | ) | |||||
Payments of capital leases | (2,690 | ) | (2,514 | ) | (621 | ) | |||||
Net cash provided by financing activities | 46,816 | 270,417 | 126,862 | ||||||||
91
Wright Medical Group N.V. Consolidated Statements of Cash Flows (Continued) (In thousands) | |||||||||||
Fiscal year ended | |||||||||||
December 31, 2017 | December 25, 2016 | December 27, 2015 | |||||||||
Effect of exchange rates on cash, cash equivalents and restricted cash | $ | 2,890 | $ | (1,539 | ) | $ | (2,544 | ) | |||
Net (decrease) increase in cash, cash equivalents and restricted cash | (244,525 | ) | 272,461 | (87,522 | ) | ||||||
Cash, cash equivalents and restricted cash, beginning of year | 412,265 | 139,804 | 227,326 | ||||||||
Cash, cash equivalents and restricted cash, end of year (Note 17) | $ | 167,740 | $ | 412,265 | $ | 139,804 | |||||
The accompanying notes are an integral part of these consolidated financial statements.
92
Wright Medical Group N.V. Consolidated Statements of Changes in Shareholders’ Equity For the fiscal years ended December 27, 2015, December 25, 2016, and December 31, 2017 (In thousands, except share data) | ||||||||||||||||||||||
Ordinary shares | Additional paid-in capital | Accumulated deficit | Accumulated other comprehensive income (loss) | Total shareholders' equity | ||||||||||||||||||
Number of shares | Amount | |||||||||||||||||||||
Balance at December 31, 2014 1 | 52,913,093 | $ | 2,101 | $ | 749,469 | $ | (475,165 | ) | $ | 2,398 | $ | 278,803 | ||||||||||
2015 Activity: | ||||||||||||||||||||||
Net loss | — | — | — | (298,701 | ) | — | (298,701 | ) | ||||||||||||||
Foreign currency translation | — | — | — | — | (12,882 | ) | (12,882 | ) | ||||||||||||||
Issuances of ordinary shares | 160,306 | 6 | 3,514 | — | — | 3,520 | ||||||||||||||||
Ordinary shares issued in connection with Tornier merger | 49,569,007 | 1,666 | 1,032,570 | — | — | 1,034,236 | ||||||||||||||||
Grant of restricted stock awards | 5,246 | — | — | — | — | — | ||||||||||||||||
Forfeitures of restricted stock awards | (5,869 | ) | — | — | — | — | — | |||||||||||||||
Vesting of restricted stock units | 30,895 | 17 | (17 | ) | — | — | — | |||||||||||||||
Share-based compensation | — | — | 24,803 | — | — | 24,803 | ||||||||||||||||
Issuance of stock warrants, net of equity issuance costs | — | — | 25,247 | — | — | 25,247 | ||||||||||||||||
Balance at December 27, 2015 | 102,672,678 | $ | 3,790 | $ | 1,835,586 | $ | (773,866 | ) | $ | (10,484 | ) | $ | 1,055,026 | |||||||||
2016 Activity: | ||||||||||||||||||||||
Net loss | — | — | — | (432,373 | ) | — | (432,373 | ) | ||||||||||||||
Foreign currency translation | — | — | — | — | (8,977 | ) | (8,977 | ) | ||||||||||||||
Issuances of ordinary shares | 440,355 | 15 | 8,455 | — | — | 8,470 | ||||||||||||||||
Vesting of restricted stock units | 287,962 | 10 | (10 | ) | — | — | — | |||||||||||||||
Share-based compensation | — | — | 14,406 | — | — | 14,406 | ||||||||||||||||
Issuance of stock warrants, net of repurchases and equity issuance costs | — | — | 50,312 | — | — | 50,312 | ||||||||||||||||
Balance at December 25, 2016 | 103,400,995 | $ | 3,815 | $ | 1,908,749 | $ | (1,206,239 | ) | $ | (19,461 | ) | $ | 686,864 | |||||||||
2017 Activity: | ||||||||||||||||||||||
Net loss | — | — | — | (202,598 | ) | — | (202,598 | ) | ||||||||||||||
Foreign currency translation | — | — | — | — | 41,751 | 41,751 | ||||||||||||||||
Issuances of ordinary shares | 1,352,549 | 45 | 27,506 | — | — | 27,551 | ||||||||||||||||
Shares issued in connection with IMASCAP acquisition | 661,753 | 23 | 15,620 | — | — | 15,643 | ||||||||||||||||
Vesting of restricted stock units | 392,127 | 13 | (13 | ) | — | — | — | |||||||||||||||
Share-based compensation | — | — | 19,485 | — | — | 19,485 | ||||||||||||||||
Balance at December 31, 2017 | 105,807,424 | $ | 3,896 | $ | 1,971,347 | $ | (1,408,837 | ) | $ | 22,290 | $ | 588,696 | ||||||||||
1 | During 2015, the 2014 balances of ordinary shares and additional paid in capital were restated to meet post-merger conversion values as further described within Note 13. |
The accompanying notes are an integral part of these consolidated financial statements.
93
1. Organization and Description of Business
Wright Medical Group N.V. is a global medical device company focused on extremities and biologics products. We are committed to delivering innovative, value-added solutions improving quality of life for patients worldwide and are a recognized leader of surgical solutions for the upper extremities (shoulder, elbow, wrist and hand), lower extremities (foot and ankle) and biologics markets, three of the fastest growing segments in orthopaedics. We market our products in approximately 50 countries worldwide.
Our global corporate headquarters are located in Amsterdam, the Netherlands. We also have significant operations located in Memphis, Tennessee (U.S. headquarters, research and development, sales and marketing administration, and administrative activities); Bloomington, Minnesota (upper extremities sales and marketing and warehousing operations); Arlington, Tennessee (manufacturing and warehousing operations); Franklin, Tennessee (manufacturing and warehousing operations); Montbonnot, France (manufacturing and warehousing operations); Plouzané, France (research and development); and Macroom, Ireland (manufacturing). In addition, we have local sales and distribution offices in Canada, Australia, Asia, Latin America, and throughout Europe. For purposes of this report, references to “international” or “foreign” relate to non-U.S. matters while references to “domestic” relate to U.S. matters.
Upon completion of the Wright/Tornier merger effective October 1, 2015, Robert J. Palmisano, former President and Chief Executive Officer (CEO) of legacy Wright, became President and CEO of the combined company, and Lance A. Berry, former Senior Vice President (SVP) and Chief Financial Officer (CFO) of legacy Wright, became SVP and CFO. Immediately upon completion of the merger, legacy Wright shareholders owned approximately 52% of the combined company and legacy Tornier shareholders owned approximately 48% of the combined company, and our board of directors was comprised of five representatives from legacy Wright's board of directors and five representatives from legacy Tornier's board of directors. In connection with the merger, the trading symbol for our ordinary shares changed from “TRNX” to “WMGI.” Because of these and other facts and circumstances, the merger was accounted for as a “reverse acquisition” under US GAAP, and as such, legacy Wright was considered the acquiring entity for accounting purposes. Therefore, legacy Wright’s historical results of operations replaced legacy Tornier’s historical results of operations for all periods prior to the merger. More specifically, the accompanying consolidated financial statements for periods prior to the merger are those of legacy Wright and its subsidiaries, and for periods subsequent to the merger also include legacy Tornier and its subsidiaries.
Our fiscal year-end is generally determined on a 52-week basis and runs from the Monday nearest to the 31st of December of a year, and ends on the Sunday nearest to the 31st of December of the following year. Every few years, it is necessary to add an extra week to the year making it a 53-week period. The fiscal year ended December 31, 2017 was a 53-week period. References in this report to a particular year generally refer to the applicable fiscal year. Accordingly, references to “2017” or “the year ended December 31, 2017” mean the fiscal year ended December 31, 2017.
The consolidated financial statements and accompanying notes present our consolidated results for each of the fiscal years in the three-year period ended December 31, 2017, December 25, 2016, and December 27, 2015.
All amounts are presented in U.S. dollars ($), except where expressly stated as being in other currencies, e.g., Euros (€).
References in these notes to consolidated financial statements to “we,” “our” and “us” refer to Wright Medical Group N.V. and its subsidiaries after the Wright/Tornier merger and Wright Medical Group, Inc. and its subsidiaries before the merger.
2. Summary of Significant Accounting Policies
Principles of consolidation. The accompanying consolidated financial statements include our accounts and those of our controlled subsidiaries. Intercompany accounts and transactions have been eliminated in consolidation.
Use of estimates. The preparation of financial statements in conformity with US GAAP requires management to make estimates and assumptions that affect the amounts reported in the financial statements and accompanying notes. Actual results could differ from those estimates. The most significant areas requiring the use of management estimates relate to revenue recognition, the determination of allowances for doubtful accounts and excess and obsolete inventories, accounting for business combinations and the evaluation of goodwill and long-lived assets, valuation of in-process research and development, product liability claims, product liability insurance recoveries and other litigation, income taxes, and share-based compensation.
Discontinued operations. On October 21, 2016, pursuant to a binding offer letter dated as of July 8, 2016, Tornier France SAS and certain other entities related to us and Corin entered into a business sale agreement and simultaneously completed and closed the sale of our Large Joints business. Pursuant to the terms of the agreement, we sold substantially all of our assets related to our Large Joints business to Corin for approximately €29.7 million in cash, less approximately €11.1 million for net working capital adjustments. Upon closing, the parties also executed a transitional services agreement and supply agreement, among other ancillary
94
agreements required to implement the transaction. These agreements were on arm’s length terms and were not material to our financial statements.
On January 9, 2014, pursuant to an Asset Purchase Agreement, dated as of June 18, 2013 (the MicroPort Agreement), by and among us and MicroPort, we completed the divesture and sale of our business operations operating under our prior OrthoRecon operating segment (the OrthoRecon Business) to MicroPort. Pursuant to the terms of the MicroPort Agreement, the purchase price (as defined in the agreement) for the OrthoRecon Business was approximately $283 million (including a working capital adjustment), which MicroPort paid in cash.
All historical operating results for the Large Joints and OrthoRecon businesses, including costs associated with corporate employees and infrastructure transferred as a part of the sales, are reflected within discontinued operations in the consolidated statements of operations. See Note 4 for further discussion of discontinued operations. Other than Note 4, unless otherwise stated, all discussion of assets and liabilities in these Notes to the Consolidated Financial Statements reflect the assets and liabilities held and used in our continuing operations, and all discussion of revenues and expenses reflect those associated with our continuing operations.
Cash and cash equivalents. Cash and cash equivalents include all cash balances and short-term investments with original maturities of three months or less. Any such investments are readily convertible into known amounts of cash, and are so near their maturity that they present insignificant risk of changes in value because of interest rate variation.
Restricted cash. Amounts included in restricted cash at December 25, 2016 represent those that were required to be held in a restricted escrow account by a contractual agreement to secure the obligations of WMT under the MSA as described in Note 16. For additional information regarding restricted cash, see Note 17.
Inventories. Our inventories are valued at the lower of cost or market on a FIFO basis. Inventory costs include material, labor costs, and manufacturing overhead. Our excess and obsolete inventory reserve is based on both the current age of kit inventory as compared to its estimated life cycle and our forecasted product demand and production requirements for other inventory items for the next 36 months.
Total charges incurred to write down excess and obsolete inventory to net realizable value included in “Cost of sales” were approximately $19.2 million, $21.5 million, and $14.2 million for the fiscal years ended December 31, 2017, December 25, 2016, and December 27, 2015, respectively. During the fiscal years ended December 31, 2017 and December 25, 2016, our excess and obsolete charges included product rationalization initiative adjustments of $3.1 million and $4.1 million, respectively. During the year ended December 27, 2015, our excess and obsolete inventory charges included $4.1 million related to a change in estimate.
Product liability claims and related insurance recoveries and other litigation. We are involved in legal proceedings involving product liability claims as well as contract, patent protection, and other matters. See Note 16 for additional information regarding product liability claims, product liability insurance recoveries, and other litigation.
We make provisions for claims specifically identified for which we believe the likelihood of an unfavorable outcome is probable and the amount of loss can be estimated. For unresolved contingencies with potentially material exposure that are deemed reasonably possible, we evaluate whether a potential loss or range of loss can be reasonably estimated. Our evaluation of these matters is the result of a comprehensive process designed to ensure that recognition of a loss or disclosure of these contingencies is made in a timely manner. In determining whether a loss should be accrued or a loss contingency disclosed, we evaluate a number of factors including: the procedural status of each lawsuit; any opportunities for dismissal of the lawsuit before trial; the amount of time remaining before trial date; the status of discovery; the status of settlement; arbitration or mediation proceedings; and management’s estimate of the likelihood of success prior to or at trial. The estimates used to establish a range of loss and the amounts to accrue are based on previous settlement experience, consultation with legal counsel, and management’s settlement strategies. If the estimate of a probable loss is in a range and no amount within the range is more likely, we accrue the minimum amount of the range. We recognize legal fees as an expense in the period incurred. These expenses are reflected in either continuing or discontinued operations depending on the product associated with the claim.
We record insurance recoveries from product liability insurance that is in force when they are realized or realizable, normally when we believe it is probable that the insurance carrier will settle the claim.
95
Property, plant and equipment. Our property, plant and equipment is stated at cost. Depreciation, which includes amortization of assets under capital lease, is generally provided on a straight-line basis over the estimated useful lives generally based on the following categories:
Land improvements | 15 | to | 25 | years | |
Buildings and building improvements | 10 | to | 40 | years | |
Machinery and equipment | 3 | to | 14 | years | |
Furniture, fixtures and office equipment | 3 | to | 14 | years | |
Surgical instruments | 6 | years | |||
Expenditures for major renewals and betterments, including leasehold improvements, that extend the useful life of the assets are capitalized and depreciated over the remaining life of the asset or lease term, if shorter. Maintenance and repair costs are charged to expense as incurred. Upon sale or retirement, the asset cost and related accumulated depreciation are eliminated from the respective accounts and any resulting gain or loss is included in income.
Valuation of long-lived assets. Management periodically evaluates carrying values of long-lived assets, including property, plant and equipment and finite-lived intangible assets, when events and circumstances indicate that these assets may have been impaired. We account for the impairment of long-lived assets in accordance with FASB ASC 360. Accordingly, we evaluate impairment of our long-lived assets based upon an analysis of estimated undiscounted future cash flows. If it is determined that a change is required in the useful life of an asset, future depreciation and amortization is adjusted accordingly. Alternatively, should we determine that an asset is impaired, an adjustment would be charged to income based on the difference between the asset’s fair market value and the asset's carrying value.
Intangible assets and goodwill. Goodwill is recognized for the excess of the purchase price over the fair value of net assets of businesses acquired. FASB ASC 350-30-35-18 requires companies to evaluate for impairment intangible assets not subject to amortization, such as our IPRD assets, if events or changes in circumstances indicate than an asset might be impaired. Further, FASB ASC 350-20-35-30 requires companies to evaluate goodwill and intangibles not subject to amortization for impairment between annual impairment tests if an event occurs or circumstances change that would more likely than not reduce the fair value of a reporting unit below its carrying amount. Unless circumstances otherwise dictate, the annual impairment test is performed on October 1 each year. See Note 8 for discussion of our 2017 goodwill impairment analysis.
Our intangible assets with estimable useful lives are amortized on a straight-line basis over their respective estimated useful lives to their estimated residual values. This method of amortization approximates the expected future cash flow generated from their use. Finite-lived intangibles are reviewed for impairment in accordance with FASB ASC Section 360, Property, Plant and Equipment (FASB ASC 360). The weighted average amortization periods for our intangible assets are as follows:
Completed technology | 10 | years |
Distribution channels | 5 | years |
Trademarks | 4 | years |
Licenses | 11 | years |
Customer relationships | 18 | years |
Non-compete agreements | 4 | years |
Other intangible assets | 3 | years |
Allowances for doubtful accounts. We experience credit losses on our accounts receivable; and accordingly, we must make estimates related to the ultimate collection of our accounts receivable. Specifically, we analyze our accounts receivable, historical bad debt experience, customer concentrations, customer creditworthiness, and current economic trends when evaluating the adequacy of our allowance for doubtful accounts.
The majority of our accounts receivable are from hospitals and surgery centers. Our collection history has been favorable with minimal bad debts from these customers. We write-off accounts receivable when we determine that the accounts receivable are uncollectible, typically upon customer bankruptcy or the customer’s non-response to repeated collection efforts. Our allowance for doubtful accounts totaled $4.3 million and $4.5 million at December 31, 2017 and December 27, 2016, respectively.
Concentration of credit risk. Financial instruments that potentially subject us to concentrations of credit risk consist principally of accounts receivable. Management attempts to minimize credit risk by reviewing customers’ credit history before extending credit and by monitoring credit exposure on a regular basis. Collateral or other security is generally not required for accounts receivable.
96
Concentrations of supply of raw material. We rely on a limited number of suppliers for the components used in our products. For certain human biologic products, such as Allomatrix®, we depend on one supplier of demineralized bone matrix and cancellous bone matrix. We rely on one supplier for our GRAFTJACKET® family of soft tissue repair and graft containment products. We maintain adequate stock from these suppliers in order to meet market demand. Additionally, we have other soft tissue repair products which include our CONEXA™ Reconstructive Tissue Matrix, ACTISHIELD™ and ACTISHIELD™ CF Amniotic Barrier Membranes, VIAFLOW™ and VIAFLOW™ C Flowable Placental Tissue Matrices, BIOFIBER® biologic absorbable scaffold products, and PHANTOM FIBER™ high strength, resorbable suture products.
We rely on one supplier for a key component of our AUGMENT® Bone Graft. In December 2013, our supplier notified us of its intent to terminate the supply agreement in December 2015. This supplier was contractually required to meet our supply requirements until the termination date, and to use commercially reasonable efforts to assist us in identifying a new supplier and support the transfer of technology and supporting documentation to produce this component. In April 2016, we entered into a commercial supply agreement with FUJIFILM Diosynth Biotechnologies U.S.A., Inc. pursuant to which Fujifilm agreed to manufacture and sell to us and we agreed to purchase the key component of our AUGMENT® Bone Graft. Pursuant to our supply agreement with Fujifilm, commercial production of the key component is expected to begin in 2019. Although we believe that our current supply of the key component from our former supplier should be sufficient to last until after the component becomes available under the new agreement, no assurance can be provided that it will be sufficient.
Income taxes. Income taxes are accounted for pursuant to the provisions of FASB ASC Section 740, Income Taxes (FASB ASC 740). Our effective tax rate is based on income by tax jurisdiction, statutory rates, and tax saving initiatives available to us in the various jurisdictions in which we operate. Significant judgment is required in determining our effective tax rate and evaluating our tax positions. This process includes assessing temporary differences resulting from differing recognition of items for income tax and financial accounting purposes. These differences result in deferred tax assets and liabilities, which are included within our consolidated balance sheet. The measurement of deferred tax assets is reduced by a valuation allowance if, based upon available evidence, it is more likely than not that some or all of the deferred tax assets will not be realized. See Note 11 for further discussion of our consolidated deferred tax assets and liabilities, and the associated valuation allowance.
We provide for unrecognized tax benefits based upon our assessment of whether a tax position is “more-likely-than-not” to be sustained upon examination by the tax authorities. If a tax position meets the more-likely-than-not standard, then the related tax benefit is measured based on a cumulative probability analysis of the amount that is more-likely-than-not to be realized upon ultimate settlement or disposition of the underlying tax position.
In December 2017, the United States enacted new legislation under the 2017 Tax Act which included significant provision changes in the U.S. including, but not limited to, lowering the federal statutory rate to 21% beginning in January 2018, changing the net operating loss carryforward period and introducing a limitation on usage of these attributes, repealing the AMT system, and imposing a one-time toll charge on a U.S. shareholder’s cumulative undistributed post-1986 earnings of foreign subsidiaries. We are required to recognize the effect of any tax law changes during the period of enactment including re-measuring any deferred tax assets and liabilities based on when these attributes are expected to be realized in the future and re-analyzing positive and negative evidence regarding the realizability of deferred tax assets. Also in December 2017, the SEC issued Staff Accounting Bulletin No. 118, Income Tax Accounting Implications of the Tax Cuts and Jobs Act (SAB 118), which allows us to record provisional amounts under a one-year measurement period to consider upcoming guidance and interpretations and to complete further analysis that may affect our current estimates in our consolidated financial statements within the next year.
Other taxes. Taxes assessed by a governmental authority that are imposed concurrent with our revenue transactions with customers are presented on a net basis in our consolidated statements of operations.
Revenue recognition. Our revenues are primarily generated through two types of customers, hospitals and surgery centers, and stocking distributors, with the majority of our revenue derived from sales to hospitals. Our products are primarily sold through a network of employee sales representatives and independent sales representatives in the United States and by a combination of employee sales representatives, independent sales representatives, and stocking distributors outside the United States. Revenues from sales to hospitals are recorded when the hospital takes title to the product, which is generally when the product is surgically implanted in a patient.
During the fiscal quarter ended December 27, 2015, following the Wright/Tornier merger, we changed our estimate of uninvoiced revenue. While we have generally recognized revenue at the time that the product was surgically implanted, from a timing perspective, we now recognize revenue at the time the surgery and associated products used are reported, as opposed to previously when we received clerical documentation from the hospital. We have accounted for this as a change in estimate and recorded additional revenue of approximately $3 million in the fiscal quarter ended December 27, 2015.
97
We record revenues from sales to our stocking distributors outside the United States at the time the product is shipped to the distributor. Stocking distributors, who sell the products to their customers, take title to the products and assume all risks of ownership. Our distributors are obligated to pay within specified terms regardless of when, if ever, they sell the products. In general, the distributors do not have any rights of return or exchange; however, in limited situations, we have repurchase agreements with certain stocking distributors. These repurchase agreements require us to repurchase a specified percentage of the inventory purchased by the distributor within a specified period of time prior to the expiration of the contract. We establish an allowance for sales returns in the accounting period when the return becomes probable. Our reserve for sales returns was immaterial as of December 31, 2017 and December 25, 2016.
Shipping and handling costs. We incur shipping and handling costs associated with the shipment of goods to customers, independent distributors, and our subsidiaries. Amounts billed to customers for shipping and handling of products are included in net sales. Costs incurred related to shipping and handling of products to customers are included in selling, general and administrative expenses. Shipping and handling costs within selling, general and administrative expenses include instrument depreciation of $27.1 million, $26.1 million, and $13.8 million for the fiscal years ended December 31, 2017, December 25, 2016, and December 27, 2015, respectively. All other shipping and handling costs are included in cost of sales. These amounts totaled $22.3 million, $17.9 million, and $9.8 million for the fiscal years ended December 31, 2017, December 25, 2016, and December 27, 2015, respectively.
Research and development costs. Research and development costs are charged to expense as incurred.
Foreign currency translation. The financial statements of our subsidiaries whose functional currency is the local currency are translated into U.S. dollars using the exchange rate at the balance sheet date for assets and liabilities and the weighted average exchange rate for the applicable period for revenues, expenses, gains, and losses. Translation adjustments are recorded as a separate component of comprehensive loss in shareholders’ equity. Gains and losses resulting from transactions denominated in a currency other than the local functional currency are included in “Other expense (income), net” in our consolidated statements of operations.
Comprehensive income. Comprehensive income is defined as the change in equity during a period related to transactions and other events and circumstances from non-owner sources. It includes all changes in equity during a period except those resulting from investments by owners and distributions to owners. The difference between our net loss and our comprehensive loss is attributable to foreign currency translation.
Share-based compensation. We account for share-based compensation in accordance with FASB ASC Section 718, Compensation — Stock Compensation (FASB ASC 718). Under the fair value recognition provisions of FASB ASC 718, share-based compensation cost is measured at the grant date based on the fair value of the award and is recognized as expense on a straight-line basis over the requisite service period, which is the vesting period. The determination of the fair value of share-based payment awards, such as options, on the date of grant using an option-pricing model is affected by our stock price, as well as assumptions regarding a number of complex and subjective variables, which include the expected life of the award, the expected stock price volatility over the expected life of the awards, expected dividend yield, and risk-free interest rate. The determination of the fair value of performance-based share-based payment awards, such as performance share units, is based on the estimated achievement of the established performance criteria on the date of grant and updated at the end of each reporting period until the performance period ends. Share-based compensation expense is only recognized for performance share units that we expect to vest, which we estimate based upon an assessment of the probability that the performance criteria will be achieved.
We recorded share-based compensation expense of $19.4 million, $14.4 million, and $25.0 million during the fiscal years ended December 31, 2017, December 25, 2016, and December 27, 2015, respectively, within our results of continuing operations. A significant portion of the expense in 2015 related to accelerated vesting of all unvested awards upon the closing of the Wright/Tornier merger. See Note 14 for further information regarding our share-based compensation assumptions and expenses.
Derivative instruments. We account for derivative instruments and hedging activities under FASB ASC Section 815, Derivatives and Hedging (FASB ASC 815). Accordingly, all of our derivative instruments are recorded in the accompanying consolidated balance sheets as either an asset or liability and measured at fair value. The changes in the derivative’s fair value are recognized currently in earnings unless specific hedge accounting criteria are met.
We employ a derivative program using foreign currency forward contracts to mitigate the risk of currency fluctuations on our intercompany receivable and payable balances that are denominated in foreign currencies. These forward contracts are expected to offset the transactional gains and losses on the related intercompany balances. These forward contracts are not designated as hedging instruments under FASB ASC 815. Accordingly, the changes in the fair value and the settlement of the contracts are recognized in the period incurred in the accompanying consolidated statements of operations. We plan to discontinue our foreign currency forward contracts derivative program in 2018.
98
We recorded a net loss of approximately $4.6 million, $0.8 million, and $0.3 million on our foreign currency contracts for the fiscal years ended December 31, 2017, December 25, 2016, December 27, 2015, respectively. These gains and losses substantially offset translation losses and gains recorded on our intercompany receivable and payable balances, and are also included in “Other (income) expense, net.” At December 31, 2017, we had no foreign currency contracts outstanding. At December 25, 2016, we had $0.4 million in foreign currency contracts outstanding.
On August 31, 2012, February 13, 2015, and May 20, 2016, we issued the 2017 Notes, 2020 Notes, and 2021 Notes, respectively, as defined and described in Note 9. The 2017 Notes Conversion Derivatives, 2020 Notes Conversion Derivatives, and 2021 Notes Conversion Derivatives, each as defined and described in Note 6, requires bifurcation from the 2017 Notes, 2020 Notes, and 2021 Notes in accordance with ASC Topic 815, and are accounted for as derivative liabilities. We also entered into 2017, 2020, and 2021 Notes Hedges, as defined and described in Note 6, in connection with the issuance of the 2017, 2020, and 2021 Notes. As of December 31, 2017, the 2020 and 2021 Notes Hedges were outstanding. The 2020 and 2021 Notes Hedges, which are cash-settled, are intended to reduce our exposure to potential cash payments that we are required to make upon conversion of the 2020 and 2021 Notes in excess of the principal amount of converted notes if our ordinary share price exceeds the conversion price. The 2020 and 2021 Notes Hedges are accounted for as derivative assets in accordance with ASC Topic 815. The 2017 Notes Hedges, as defined and described in Note 6, were fully settled in February 2015 when the 2020 Notes were issued.
Supplemental cash flow information. Cash paid for interest and income taxes was as follows (in thousands):
Fiscal year ended | |||||||||||
December 31, 2017 | December 25, 2016 | December 27, 2015 | |||||||||
Interest | $ | 24,641 | $ | 18,678 | $ | 11,198 | |||||
Income taxes | $ | 7,359 | $ | 4,334 | $ | 1,051 | |||||
Recent Accounting Pronouncements. In May 2014, the FASB issued ASU 2014-09, Revenue from Contracts with Customers, and has subsequently issued several supplemental and/or clarifying ASUs (collectively ASC 606). ASC 606 prescribes a single common revenue standard that replaces most existing US GAAP revenue recognition guidance. ASC 606 outlines a five-step model, under which we will recognize revenue as performance obligations within a customer contract are satisfied. ASC 606 is intended to provide more consistent interpretation and application of the principles outlined in the standard across filers in multiple industries and within the same industries compared to current practices, which should improve comparability. Adoption of ASC 606 is required for annual reporting periods beginning after December 15, 2017 (fiscal year 2018 for Wright), including interim periods within the reporting period. Based on our review of our current portfolio of customer contracts, including a review of historical accounting policies and practices, we expect that revenue will continue to be recognized at a point in time, generally upon surgical implantation or shipment of products to distributors, consistent with our current revenue recognition model. Therefore, adoption of ASC 606 is not expected to have a material effect on our consolidated financial statements. We expect to adopt ASC 606 using the modified retrospective method, which recognizes the cumulative effect at the date of initial application.
FASB ASU 2015-11 Simplifying the Measurement of Inventory was issued in July 2015. This required entities to measure most inventory “at the lower of cost and net realizable value,” thereby simplifying the current guidance under which an entity must measure inventory at the lower of cost or market. We adopted this ASU during 2017. The adoption of this ASU did not have a material impact on our consolidated financial statements.
On September 25, 2015, the FASB issued ASU 2015-16, Simplifying the Accounting for Measurement-Period Adjustments to simplify the accounting for measurement-period adjustments. The ASU, which is part of the FASB’s simplification initiative, was issued in response to stakeholder feedback that restatements of prior periods to reflect adjustments made to provisional amounts recognized in a business combination increase the cost and complexity of financial reporting but do not significantly improve the usefulness of the information. We adopted this ASU during fiscal year 2016. Under this ASU, an acquirer must recognize adjustments to provisional amounts that are identified during the measurement period in the reporting period in which the adjustment amounts are determined and must present these amounts separately on the face of the income statement or disclose in the notes, the portion of the amount recorded in current-period earnings by line item that would have been recorded in previous reporting periods if the adjustment to the provisional amounts had been recognized as of the acquisition date.
On February 25, 2016, the FASB issued ASU 2016-02, Leases, which introduces a lessee model that brings most leases on the balance sheet. The new standard also aligns many of the underlying principles of the new lessor model with those in FASB ASC 606, the FASB’s new revenue recognition standard (e.g., those related to evaluating when profit can be recognized). Furthermore, the ASU addresses other concerns related to the current leases model. The ASU will be effective for us beginning in fiscal year
99
2019. We are in the initial phases of our adoption plans and; accordingly, we are unable to estimate any effect this may have on our consolidated financial statements.
On March 30, 2016, the FASB issued ASU 2016-09, Compensation-Stock Compensation (Topic 718): Improvements to Employee Share-Based Payment Accounting, which is to simplify accounting for income taxes, forfeitures, and withholding taxes, and reduce ambiguity in cash flow reporting. We adopted this ASU during 2017 and noted that this change did not significantly impact our consolidated financial statements. There were no income tax effects of this adoption due to the valuation allowance in the U.S.
3. Acquisitions and Disposition
IMASCAP
On December 14, 2017, we completed the acquisition of IMASCAP, a leader in the development of software-based solutions for preoperative planning of shoulder replacement surgery. The intent of this transaction is to ensure exclusive access to breakthrough software enabling technology and patents to further differentiate our product portfolio and to further accelerate growth opportunities in our global extremities business. Under the terms of the agreement with IMASCAP, we acquired 100% of IMASCAP’s outstanding equity on a fully diluted basis for an initial payment of €52.9 million, or approximately $62.3 million, consisting of approximately €39.7 million, or approximately $46.7 million, in cash and approximately €13.2 million, or approximately $15.6 million, representing 661,753 Wright ordinary shares, payable at closing. Additionally the purchase price includes an estimated €15.1 million, or approximately $17.8 million, of contingent consideration related to the achievement of certain technical milestones and sales earnouts. The technical milestones involve the development and approval of a patient specific implant system and new software modules. The sales earnouts relate to patient specific guides and the future patient specific implant system.
Purchase Consideration and Net Assets Acquired
The following presents the preliminary allocation of the purchase consideration to the assets acquired and liabilities assumed on December 14, 2017 (in thousands):
Cash and cash equivalents | $ | 2,569 | |
Accounts receivable | 522 | ||
Other current assets | 181 | ||
Property, plant and equipment | 15 | ||
Intangible assets | 10,865 | ||
Total assets acquired | 14,152 | ||
Current liabilities | (2,065 | ) | |
Long-term debt | (902 | ) | |
Deferred income taxes | (3,033 | ) | |
Total liabilities assumed | (6,000 | ) | |
Net assets acquired | $ | 8,152 | |
Goodwill | 71,981 | ||
Total preliminary purchase consideration | $ | 80,133 | |
The purchase consideration was allocated to the net assets acquired based on their estimated fair values at the acquisition date. The fair values were based on management’s analysis, including work performed by third-party valuation specialists.
Operating assets and liabilities were valued at their existing carrying values as they represented the fair value of those items at the acquisition date, based on management’s judgments and estimates.
In determining the fair value of intangibles, we used an income method which is based on forecasts of the expected future cash flows attributable to the respective assets. Significant estimates and assumptions inherent in the valuations reflect a consideration of other marketplace participants and include the amount and timing of future cash flows (including expected growth rates and profitability), technology life cycles, and the discount rate applied to the cash flows.
Of the $10.9 million of acquired intangible assets, $5.6 million was assigned to developed technology (6 year life) and $5.3 million was assigned to in-process research and development.
100
The excess of the cost of the acquisition over the fair value of the net assets acquired is recorded as goodwill. The goodwill is primarily attributable to strategic opportunities that arose from the acquisition of IMASCAP. The goodwill is not expected to be deductible for tax purposes.
Wright/Tornier merger
On October 1, 2015, we completed the Wright/Tornier merger. Immediately upon completion of the merger, legacy Wright shareholders owned approximately 52% of the combined company and legacy Tornier shareholders owned approximately 48% of the combined company. Effective upon completion of the merger, we have operated under the leadership of the legacy Wright management team and our board of directors was comprised of five representatives from legacy Wright’s board of directors and five representatives from legacy Tornier’s board of directors. Because of these and other facts and circumstances, the merger was accounted for as a “reverse acquisition” under US GAAP. As such, legacy Wright was considered the acquiring entity for accounting purposes; and therefore, legacy Wright’s historical results of operations replaced legacy Tornier’s historical results of operations for all periods prior to the merger. As part of the merger, each legacy Wright share was converted into the right to receive 1.0309 ordinary shares of the combined company. The Wright/Tornier merger added legacy Tornier’s complementary extremities product portfolio to further accelerate growth opportunities in our global extremities business. The results of operations of both companies are included in our consolidated financial statements for all periods after completion of the merger.
The acquired business contributed net sales of $73.3 million and operating loss of $13.4 million to our consolidated results of operations from the date of acquisition through December 27, 2015, which included $10.3 million of inventory step-up amortization and $4.0 million of intangible asset amortization. This operating loss does not include the merger-related transaction costs discussed below.
Merger-Related Transaction Costs
In conjunction with the merger, we incurred approximately $20.1 million of merger-related transaction costs during the fiscal year ended December 27, 2015, which was recognized as selling, general and administrative expense in our consolidated statements of operations. These expenses primarily related to advisory fees, legal fees, and accounting and tax professional fees.
Purchase Consideration and Net Assets Acquired
The purchase consideration in a reverse acquisition is determined with reference to the value of equity that the accounting acquirer, legacy Wright, would have had to issue to the owners of the accounting acquiree, legacy Tornier, to give them the same percentage interest in the combined entity. The fair value of WMG common stock used in determining the purchase price was $21.02 per share, the closing price on September 30, 2015, which resulted in a total purchase consideration of $1.034 billion.
The calculation of the purchase consideration is as follows (in thousands):
Fair value of ordinary shares effectively transferred to Tornier shareholders | $ | 1,005,468 | |
Fair value of ordinary shares effectively transferred to Tornier share award holders | 8,091 | ||
Fair value of ordinary shares effectively issued to Tornier stock option holders | 20,676 | ||
Fair value of total consideration | $ | 1,034,235 | |
The acquisition was recorded by allocating the costs of the assets acquired based on their estimated fair values at the acquisition date. The excess of the cost of the acquisition over the fair value of the assets acquired is recorded as goodwill. The fair values were based on management’s analysis, including work performed by third-party valuation specialists.
101
The following presents the allocation of the purchase consideration to the assets acquired and liabilities assumed on October 1, 2015 (in thousands):
Cash and cash equivalents | $ | 30,117 | |
Accounts receivable | 63,797 | ||
Inventories | 138,659 | ||
Other current assets | 9,256 | ||
Property, plant and equipment | 122,927 | ||
Intangible assets | 213,600 | ||
Deferred income taxes | 1,399 | ||
Other assets | 8,658 | ||
Total assets acquired | 588,413 | ||
Current liabilities | (101,623 | ) | |
Long-term debt | (79,554 | ) | |
Deferred income taxes | (31,878 | ) | |
Other non-current liabilities | (8,434 | ) | |
Total liabilities assumed | (221,489 | ) | |
Net assets acquired | $ | 366,924 | |
Goodwill | 667,311 | ||
Total preliminary purchase consideration | $ | 1,034,235 | |
We made various changes to the purchase allocation during the measurement period. These changes were recorded in the reporting period in which the adjustment amounts were determined in accordance with ASU 2015-16.
During the fiscal quarter ended March 27, 2016, we revised the opening balances of current liabilities and goodwill acquired as part of the Wright/Tornier merger by $0.6 million.
During the fiscal quarter ended June 26, 2016, we revised the opening balances of intangible assets, accounts receivable, inventories, current liabilities, and goodwill acquired as part of the Wright/Tornier merger based on new information that existed as of the acquisition date. As a result of the completion of the valuation of acquired intangible assets by our third-party valuation firm, we increased the opening balance of acquired intangible assets by $9.4 million, with a corresponding decrease to goodwill. This allocation adjustment resulted in an increase to amortization expense of $0.3 million for the six months ended June 26, 2016, of which $0.1 million related to each of the previous two quarters. We also revised the opening balance of acquired working capital accounts by a net decrease of $0.5 million, with a corresponding increase to goodwill.
During the fiscal quarter ended September 25, 2016, as a result of the finalization of the valuation of acquired intangible assets by tax jurisdiction, we reduced the opening balance of deferred income taxes by $4.7 million, with a corresponding decrease to goodwill. This allocation adjustment resulted in a $0.4 million decrease to our income tax benefit for the nine months ended September 25, 2016. We revised the opening balance of property, plant, and equipment by $0.2 million with a corresponding increase to goodwill. The decrease in property, plant, and equipment resulted in an immaterial impact to depreciation expense. We also revised the opening balance of acquired working capital accounts by a net increase of $2.1 million, with a corresponding decrease to goodwill, primarily due to the completion of our assessment on inventory and current liabilities. The purchase price allocation was considered final as of September 25, 2016.
The acquisition was recorded by allocating the costs of the net assets acquired based on their estimated fair values at the acquisition date. Trade receivables and payables, as well as certain other current and non-current assets and liabilities, were valued at the existing carrying values as they represented the fair value of those items at the acquisition date, based on management’s judgments and estimates. Trade receivables included gross contractual amounts of $73.9 million and our best estimate of $10.1 million which represented contractual cash flows not expected to be collected at the acquisition date.
Inventory was recorded at estimated selling price less costs of disposal and a reasonable selling profit. The resulting inventory step-up adjustment is being recognized in cost of sales as the related inventory is sold. The fair value of property, plant and equipment utilized a combination of the cost and market approaches, depending on the characteristics of the asset classification.
102
In determining the fair value of intangibles, we used an income method which is based on forecasts of the expected future cash flows attributable to the respective assets. Significant estimates and assumptions inherent in the valuations reflected a consideration of other marketplace participants and included the amount and timing of future cash flows (including expected growth rates and profitability), the underlying product or technology life cycles, the economic barriers to entry, and the discount rate applied to the cash flows.
Of the $213.6 million of acquired intangible assets, $99.9 million was assigned to customer relationships (20 year life), $89.5 million was assigned to developed technology (10 year life), $15.9 million was assigned to in-process research and development, and $8.3 million was assigned to trade names (2.6 year life).
The excess of the cost of the acquisition over the fair value of the net assets acquired is recorded as goodwill. The goodwill is primarily attributable to strategic opportunities that arose from the acquisition of Tornier. The goodwill is not expected to be deductible for tax purposes.
The assets acquired in connection with the acquisition of Tornier and included in the above allocation of the purchase consideration include, among other assets, assets associated with legacy Tornier's Large Joints business. As described in more detail in Note 4, on October 21, 2016, pursuant to a binding offer letter dated as of July 8, 2016, Tornier France SAS and certain other entities related to us and Corin entered into a business sale agreement and simultaneously completed and closed the sale of our Large Joints business. Pursuant to the terms of the agreement, we sold substantially all of our assets related to our Large Joints business to Corin for approximately €29.7 million in cash, less approximately €11.1 million for net working capital adjustments.
Pro Forma Combined Financial Information (Unaudited)
The following unaudited pro forma combined financial information (in thousands) summarizes the results of operations for the periods indicated as if the Wright/Tornier merger had been completed as of January 1, 2014.
Fiscal year ended | |||
December 27, 2015 | |||
Net sales | $ | 615,490 | |
Net loss from continuing operations | $ | (293,055 | ) |
The pro forma net loss for the fiscal year ended December 27, 2015 includes the following non-recurring items: $32.1 million of merger-related transaction expenses, $30.1 million of non-cash share-based compensation charges, and $5.5 million of contractual change-in-control severance charges.
Pro forma information reflects adjustments that are expected to have a continuing impact on our results of operations and are directly attributable to the merger. The pro forma results include adjustments to reflect, among other things, the amortization of the inventory step-up, the incremental intangible asset amortization to be incurred based on the fair values of each identifiable intangible asset, and to eliminate interest expense related to legacy Tornier's former bank term debt and line of credit, which were repaid upon completion of the Wright/Tornier merger. The pro forma amounts do not purport to be indicative of the results that would have actually been obtained if the merger had occurred as of January 1, 2014 or that may be obtained in the future, and do not reflect future synergies, integration costs, or other such costs or savings.
Divestiture of Certain Legacy Tornier Ankle Replacement and Toe Assets
On October 1, 2015, simultaneous with the completion of the Wright/Tornier merger, we completed the divestiture of the U.S. rights to legacy Tornier's SALTO TALARIS® and SALTO TALARIS® XT™ line of ankle replacement products and line of silastic toe replacement products, among other assets, for cash. We retained the right to sell these products outside the United States for up to 20 years unless the purchaser exercises an option to purchase the ex-United States rights to the products. The completion of the asset divestiture was subject to and contingent upon the completion of the Wright/Tornier merger and we believe was necessary in order to obtain U.S. Federal Trade Commission approval of the Wright/Tornier merger. As these assets were not part of Wright/Tornier merger, they were not part of the purchase allocation. Additionally, the pro forma results exclude the divested operations as if the divestiture were to have occurred on January 1, 2014.
4. Discontinued Operations
For the fiscal years ended December 31, 2017, December 25, 2016, and December 27, 2015, our loss from discontinued operations, net of tax, totaled $137.7 million, $267.4 million, and $61.3 million, respectively, and was attributable primarily to expenses associated with legacy Wright's former OrthoRecon business and, to a lesser degree, the former Large Joints business.
103
Large Joints Business
On October 21, 2016, pursuant to a binding offer letter dated as of July 8, 2016, Tornier France, Corin, and certain other entities related to us and Corin entered into a business sale agreement and simultaneously completed and closed the sale of our Large Joints business. Pursuant to the terms of the agreement, we sold substantially all of the assets related to our Large Joints business to Corin for approximately €29.7 million in cash, less approximately €11.1 million for net working capital adjustments. Upon closing, the parties also executed a transitional services agreement and supply agreement, among other ancillary agreements required to implement the transaction. These agreements are on arm’s length terms and are not expected to be material to our consolidated financial statements.
All historical operating results for the Large Joints business as well as continued involvement in accordance with the transitional service agreement and supply agreement are reflected within discontinued operations in the consolidated statements of operations. We recognized an impairment loss on assets held for sale of $21.3 million, before the effect of income taxes during 2016, based on the difference between the net carrying value of the assets and liabilities held for sale and the purchase price, less estimated adjustments and costs to sell. This loss was recorded within “Net loss from discontinued operations” in our consolidated statements of operations for the fiscal year ended December 25, 2016.
For the fiscal year ended December 31, 2017, our loss from discontinued operations for the Large Joints business, net of tax, totaled $4.1 million and was primarily attributable to professional fees and internal costs to support transition activities, costs associated with transition services and working capital adjustments. The basic and diluted weighted-average number of ordinary shares outstanding was 104.5 million for the fiscal year ended December 31, 2017. The basic and diluted net loss from discontinued operations per share for the Large Joints business was $0.04 for the fiscal year ended December 31, 2017.
The following table summarizes the results of discontinued operations for the Large Joints business (in thousands, except per share data) for the fiscal years ended December 25, 2016 and December 27, 2015:
Fiscal year ended | |||||||
December 25, 2016 | December 27, 2015 | ||||||
Net sales | $ | 35,318 | $ | 10,135 | |||
Cost of sales | 20,244 | 5,633 | |||||
Selling, general and administrative | 18,808 | 5,021 | |||||
Other | — | 684 | |||||
Loss from discontinued operations before income taxes | (3,734 | ) | (1,203 | ) | |||
Impairment loss on assets held for sale, before income taxes | 21,342 | — | |||||
Total loss from discontinued operations before income taxes | (25,076 | ) | (1,203 | ) | |||
Benefit for income taxes | (5,615 | ) | (199 | ) | |||
Total loss from discontinued operations, net of tax | $ | (19,461 | ) | $ | (1,004 | ) | |
Net loss from discontinued operations per share-basic and diluted (Note 13) 1 | $ | (0.19 | ) | $ | (0.02 | ) | |
Weighted-average number of ordinary shares outstanding-basic and diluted (Note 13) 1 | 102,968 | 64,808 | |||||
1 | The 2015 weighted-average shares outstanding and net loss per share amounts were converted to meet post-merger valuations as described within Note 13. |
Cash used in operating activities by the Large Joints business totaled $6.5 million for the fiscal year ended December 31, 2017. Cash provided by operating activities and investing activities from the Large Joints business totaled $5.2 million and $20.7 million, respectively, for the fiscal year ended December 25, 2016.
OrthoRecon Business
On January 9, 2014, legacy Wright completed the divestiture and sale of its OrthoRecon business to MicroPort. Pursuant to the terms of the agreement, the purchase price (as defined in the agreement) was approximately $283 million (including a working
104
capital adjustment), which MicroPort paid in cash. As a result of the transaction, we recognized approximately $24.3 million as the gain on disposal of the OrthoRecon business, before the effect of income taxes.
Certain liabilities associated with the OrthoRecon business, including product liability claims associated with hip and knee products sold by legacy Wright prior to the closing, were not assumed by MicroPort. Charges associated with these product liability claims, including legal defense, settlements and judgments, income associated with product liability insurance recoveries, and changes to any contingent liabilities associated with the OrthoRecon business have been reflected within results of discontinued operations, and we will continue to reflect these within results of discontinued operations in future periods.
All current and historical operating results for the OrthoRecon business are reflected within discontinued operations in the consolidated financial statements. The following table summarizes the results of discontinued operations for the OrthoRecon business (in thousands, except per share data):
Fiscal year ended | |||||||||||
December 31, 2017 | December 25, 2016 | December 27, 2015 | |||||||||
Net sales | $ | — | $ | — | $ | — | |||||
Selling, general and administrative | 135,235 | 247,978 | 60,341 | ||||||||
Loss from discontinued operations before income taxes | (135,235 | ) | (247,978 | ) | (60,341 | ) | |||||
Benefit for income taxes | (1,707 | ) | — | — | |||||||
Total loss from discontinued operations, net of tax | $ | (133,528 | ) | $ | (247,978 | ) | $ | (60,341 | ) | ||
Net loss from discontinued operations per share-basic and diluted (Note 13) 1 | $ | (1.28 | ) | $ | (2.41 | ) | $ | (0.93 | ) | ||
Weighted-average number of ordinary shares outstanding-basic and diluted (Note 13) 1 | 104,531 | 102,968 | 64,808 | ||||||||
1 | The 2015 weighted-average shares outstanding and net loss per share amounts were converted to meet post-merger valuations as described within Note 13. |
During the fiscal years ended December 31, 2017 and December 25, 2016, we recognized charges, net of insurance proceeds, of $94.0 million and $196.6 million, respectively, within discontinued operations related to the retained metal-on-metal product liability claims associated with the OrthoRecon business (see Note 16 for additional discussion). We will incur continuing cash outflows associated with legal defense costs and the ultimate resolution of these contingent liabilities until these liabilities are resolved.
During the fiscal year ended December 27, 2015, we recognized a $25 million charge to write down an insurance receivable associated with product liability claims. Additionally, during 2015, we increased our estimated product liability by approximately $4 million for claims that had been incurred in prior periods. We have analyzed the impact of this adjustment and determined that this out-of-period charge did not have a material impact to the prior period financial statements. See Note 16 for additional information regarding our product liabilities and the associated insurance.
We will incur continuing cash outflows associated with legal defense costs and the ultimate resolution of these contingent liabilities, net of insurance proceeds, until these liabilities are resolved. Cash used in operating activities by the OrthoRecon business totaled $221.6 million for the fiscal year ended December 31, 2017. Cash provided by operating activities from the OrthoRecon business totaled $16.7 million for the fiscal year ended December 25, 2016, primarily due to the receipt of the $60 million insurance settlement, offset by legal defense costs and settlement of product liabilities. See further discussion in Note 16.
105
5. Inventories
Inventories consist of the following (in thousands):
December 31, 2017 | December 25, 2016 | ||||||
Raw materials | $ | 10,816 | $ | 15,319 | |||
Work-in-process | 28,581 | 22,422 | |||||
Finished goods | 128,747 | 113,108 | |||||
$ | 168,144 | $ | 150,849 | ||||
6. Fair Value of Financial Instruments and Derivatives
We account for derivatives in accordance with FASB ASC 815, which establishes accounting and reporting standards requiring that derivative instruments be recorded on the balance sheet as either an asset or liability measured at fair value. Additionally, changes in the derivatives' fair value shall be recognized currently in earnings unless specific hedge accounting criteria are met.
FASB ASC Section 820, Fair Value Measurements and Disclosures requires fair value measurements be classified and disclosed in one of the following three categories:
Level 1: | Financial instruments with unadjusted, quoted prices listed on active market exchanges. |
Level 2: | Financial instruments determined using prices for recently traded financial instruments with similar underlying terms as well as directly or indirectly observable inputs, such as interest rates and yield curves that are observable at commonly quoted intervals. |
Level 3: | Financial instruments that are not actively traded on a market exchange. This category includes situations where there is little, if any, market activity for the financial instrument. The prices are determined using significant unobservable inputs or valuation techniques. |
2021 Notes Conversion Derivative and Notes Hedges
On May 20, 2016, we issued $395 million aggregate principal amount of 2.25% 2021 Notes. See Note 9 of the consolidated financial statements for additional information regarding the 2021 Notes. The 2021 Notes have a conversion derivative feature (2021 Notes Conversion Derivative) that requires bifurcation from the 2021 Notes in accordance with ASC Topic 815, and is accounted for as a derivative liability. The fair value of the 2021 Notes Conversion Derivative at the time of issuance of the 2021 Notes was $117.2 million.
In connection with the issuance of the 2021 Notes, we entered into hedges (2021 Notes Hedges) with two option counterparties. The 2021 Notes Hedges, which are cash-settled, are generally intended to reduce our exposure to potential cash payments that we are required to make upon conversion of the 2021 Notes in excess of the principal amount of converted notes if our ordinary share price exceeds the conversion price. The aggregate cost of the 2021 Notes Hedges was $99.8 million and is accounted for as a derivative asset in accordance with ASC Topic 815. However, in connection with certain events, these option counterparties have the discretion to make certain adjustments to the 2021 Note Hedges, which may reduce the effectiveness of the 2021 Note Hedges.
The following table summarizes the fair value and the presentation in our consolidated balance sheets (in thousands) of the 2021 Notes Hedges and 2021 Notes Conversion Derivative:
Location on consolidated balance sheet | December 31, 2017 | December 25, 2016 | |||||
2021 Notes Hedges | Other assets | $ | 127,063 | $ | 159,095 | ||
2021 Notes Conversion Derivative | Other liabilities | $ | 126,148 | $ | 161,601 | ||
In the first fiscal quarter of 2017, the closing price of our ordinary shares was greater than 130% of the 2021 Notes conversion price for 20 or more of the 30 consecutive trading days preceding the quarter-end; and, therefore, the holders of the 2021 Notes had the ability to convert the notes during the succeeding quarterly period. Due to the ability of the holders of the 2021 Notes to convert the notes during this period, the carrying value of the 2021 Notes and the fair value of the 2021 Notes Conversion Derivative were classified as current liabilities, and the fair value of the 2021 Notes Hedges were classified as current assets as of March 26, 2017. There were no conversions during the second quarter of 2017. The closing price of our ordinary shares was less than 130% of the 2021 Notes conversion price for more than 20 of the 30 consecutive trading days preceding the calendar fiscal quarters ended June 30, 2017, September 30, 2017, and December 31, 2017, which resulted in the 2021 Notes no longer being convertible.
106
As such, the 2021 Notes, 2021 Notes Conversion Derivative and 2021 Notes Hedges were classified as long-term as of December 31, 2017.
The 2021 Notes Hedges and the 2021 Notes Conversion Derivative are measured at fair value using Level 3 inputs. These instruments are not actively traded and are valued using an option pricing model that uses observable and unobservable market data for inputs.
Neither the 2021 Notes Conversion Derivative nor the 2021 Notes Hedges qualify for hedge accounting; thus, any change in the fair value of the derivatives is recognized immediately in the consolidated statements of operations.
The following table summarizes the net gain (loss) on changes in fair value (in thousands) related to the 2021 Notes Hedges and 2021 Notes Conversion Derivative:
Fiscal year ended December 31, 2017 | Fiscal year ended December 25, 2016 | |||||
2021 Notes Hedges | $ | (32,032 | ) | $ | 59,278 | |
2021 Notes Conversion Derivative | 35,453 | (44,377 | ) | |||
Net gain on changes in fair value | $ | 3,421 | $ | 14,901 | ||
2020 Notes Conversion Derivative and Notes Hedges
On February 13, 2015, WMG issued $632.5 million aggregate principal amount of 2.00% cash convertible senior notes due 2020 (2020 Notes). See Note 9 of the consolidated financial statements for additional information regarding the 2020 Notes. The 2020 Notes have a conversion derivative feature (2020 Notes Conversion Derivative) that requires bifurcation from the 2020 Notes in accordance with ASC Topic 815, and is accounted for as a derivative liability. The fair value of the 2020 Notes Conversion Derivative at the time of issuance of the 2020 Notes was $149.8 million.
In connection with the issuance of the 2020 Notes, WMG entered into hedges (2020 Notes Hedges) with three option counterparties. The 2020 Notes Hedges, which are cash-settled, are generally intended to reduce WMG's exposure to potential cash payments that WMG is required to make upon conversion of the 2020 Notes in excess of the principal amount of converted notes if our ordinary share price exceeds the conversion price. The aggregate cost of the 2020 Notes Hedges was $144.8 million and is accounted for as a derivative asset in accordance with ASC Topic 815. However, in connection with certain events, these option counterparties have the discretion to make certain adjustments to the 2020 Note Hedges, which may reduce the effectiveness of the 2020 Note Hedges.
Concurrently with the issuance and sale of the 2021 Notes, certain holders of the 2020 Notes exchanged approximately $45 million aggregate principal amount of 2020 Notes (including the 2020 Notes Conversion Derivative) for the 2021 Notes. For each $1,000 principal amount of 2020 Notes validly submitted for exchange, we delivered $990.00 principal amount of the 2021 Notes (subject, in each case, to rounding down to the nearest $1,000 principal amount of the 2021 Notes, the difference being referred as the rounded amount) to the investor plus an amount of cash equal to the unpaid interest on the 2020 Notes and the rounded amount at an aggregate cost of approximately $44.6 million. We settled the associated portion of the 2020 Notes Conversion Derivative at a benefit of approximately $0.4 million and satisfied the accrued interest, which was not material.
In addition, during the second quarter of 2016, we settled a portion of the 2020 Notes Hedges (receiving $3.9 million) and repurchased a portion of the warrants associated with the 2020 Notes (paying $3.3 million), generating net proceeds of approximately $0.6 million.
The following table summarizes the fair value and the presentation in our consolidated balance sheets (in thousands) of the 2020 Notes Hedges and 2020 Notes Conversion Derivative:
Location on consolidated balance sheet | December 31, 2017 | December 25, 2016 | |||||
2020 Notes Hedges | Other assets | $ | 45,033 | $ | 77,232 | ||
2020 Notes Conversion Derivative | Other liabilities | $ | 44,132 | $ | 77,758 | ||
The 2020 Notes Hedges and the 2020 Notes Conversion Derivative are measured at fair value using Level 3 inputs. These instruments are not actively traded and are valued using an option pricing model that uses observable and unobservable market
107
data for inputs.
Neither the 2020 Notes Conversion Derivative nor the 2020 Notes Hedges qualify for hedge accounting; thus, any change in the fair value of the derivatives is recognized immediately in the consolidated statements of operations.
The following table summarizes the net gain (loss) on changes in fair value (in thousands) related to the 2020 Notes Hedges and 2020 Notes Conversion Derivative:
Fiscal year ended | ||||||
December 31, 2017 | December 25, 2016 | |||||
2020 Notes Hedges | $ | (32,199 | ) | $ | (46,634 | ) |
2020 Notes Conversion Derivative | 33,626 | 51,799 | ||||
Net gain on changes in fair value | $ | 1,427 | $ | 5,165 | ||
2017 Notes Conversion Derivative and Notes Hedges
On August 31, 2012, WMG issued $300 million aggregate principal amount of 2.00% cash convertible senior notes due 2017 (the 2017 Notes). The 2017 Notes matured and the remaining $2.0 million principal amount was repaid on August 15, 2017. See Note 9 of the consolidated financial statements for additional information regarding the 2017 Notes. The 2017 Notes had a conversion derivative feature (2017 Notes Conversion Derivative) that required bifurcation from the 2017 Notes in accordance with ASC Topic 815, and was accounted for as a derivative liability. The fair value of the 2017 Notes Conversion Derivative at the time of issuance of the 2017 Notes was $48.1 million.
In connection with the issuance of the 2017 Notes, WMG entered into hedges (2017 Notes Hedges) with three option counterparties. The aggregate cost of the 2017 Notes Hedges was $56.2 million and was accounted for as a derivative asset in accordance with ASC Topic 815.
In connection with the issuance of the 2020 Notes, WMG used approximately $292 million of the 2020 Notes' net proceeds to repurchase and extinguish approximately $240 million aggregate principal amount of the 2017 Notes, settle the associated portion of the 2017 Notes Conversion Derivative at a cost of approximately $49 million, and satisfy the accrued interest of $2.4 million. WMG also settled all of the 2017 Notes Hedges (receiving $70 million) and repurchased all of the warrants associated with the 2017 Notes (paying $60 million), generating net proceeds of approximately $10 million.
Concurrently with the issuance and sale of the 2021 Notes, certain holders of the 2017 Notes exchanged approximately $54.4 million aggregate principal amount of 2017 Notes (including the 2017 Notes Conversion Derivative) for the 2021 Notes. For each $1,000 principal amount of 2017 Notes validly submitted for exchange, we delivered $1,035.40 principal amount of the 2021 Notes (subject, in each case, to rounding down to the nearest $1,000 principal amount of the 2021 Notes, the difference being referred as the rounded amount) to the investor plus an amount of cash equal to the unpaid interest on the 2017 Notes and the rounded amount at a cost of approximately $56.3 million. We settled the associated portion of the 2017 Notes Conversion Derivative at a cost of approximately $1.9 million and satisfied the accrued interest, which was not material.
In addition, during the second quarter of 2016, we repurchased and extinguished an additional $3.6 million aggregate principal amount of the 2017 Notes in privately negotiated transactions and settled the associated portion of the 2017 Notes Conversion Derivative at a cost of approximately $0.1 million, and satisfied the accrued interest, which was not material. The remainder of the 2017 Notes Conversion Derivative was settled at a cost of approximately $0.2 million in conjunction with the maturity of the 2017 Notes on August 15, 2017.
The following table summarizes the fair value and the presentation in our consolidated balance sheets (in thousands) of the 2017 Notes Conversion Derivative:
Location on consolidated balance sheet | December 31, 2017 | December 25, 2016 | |||||
2017 Notes Conversion Derivative | Other liabilities | $ | — | $ | 164 | ||
The 2017 Notes Conversion Derivative was measured at fair value using Level 3 inputs. This instrument was not actively traded and was valued using an option pricing model that used observable and unobservable market data for inputs.
Neither the 2017 Notes Conversion Derivative nor the 2017 Notes Hedges qualified for hedge accounting; thus, any change in the fair value of the derivatives was recognized immediately in our consolidated statements of operations.
108
The following table summarizes the net (loss) gain on changes in fair value (in thousands) related to the 2017 Notes Conversion Derivative:
Fiscal year ended | ||||
December 31, 2017 | December 25, 2016 | |||
2017 Notes Conversion Derivative | (51 | ) | 8,207 | |
To determine the fair value of the embedded conversion option in the 2017, 2020, and 2021 Notes Conversion Derivatives, a trinomial lattice model was used. A trinomial stock price lattice model generates three possible outcomes of stock price - one up, one down, and one stable. This lattice generates a distribution of stock prices at the maturity date and throughout the life of the 2017, 2020, and 2021 Notes. Using this stock price lattice, a convertible note lattice was created where the value of the embedded conversion option was estimated by comparing the value produced in a convertible note lattice with the option to convert against the value without the ability to convert. In each case, the convertible note lattice first calculates the possible convertible note values at the maturity date, using the distribution of stock prices, which equals to the maximum of (x) the remaining bond cash flows and (y) stock price times the conversion price. The values of the 2017, 2020, and 2021 Notes Conversion Derivatives at the valuation date were estimated using the values at the maturity date and moving back in time on the lattices (both for the lattice with the conversion option and without the conversion option). Specifically, at each node, if the 2017, 2020, or 2021 Notes are eligible for early conversion, the value at this node is the maximum of (i) converting to stock, which is the stock price times the conversion price, and (ii) holding onto the 2017, 2020, and 2021 Notes, which is the discounted and probability-weighted value from the three possible outcomes at the future nodes plus any accrued but unpaid coupons that are not considered at the future nodes. If the 2017, 2020, or 2021 Notes are not eligible for early conversion, the value of the conversion option at this node equals to (ii). In the lattice, a credit adjustment was applied to the discount for each cash flow in the model as the embedded conversion option, as well as the coupon and notional payments, is settled with cash instead of shares.
To estimate the fair value of the 2020 and 2021 Notes Hedges, we used the Black-Scholes formula combined with credit adjustments, as the option counterparties have credit risk and the call options are cash settled. We assumed that the call options will be exercised at the maturity since our ordinary shares do not pay any dividends and management does not expect to declare dividends in the near term.
The following assumptions were used in the fair market valuations of the 2020 Notes Conversion Derivative, 2020 Notes Hedge, 2021 Notes Conversion Derivative, and 2021 Notes Hedge as of December 31, 2017:
2020 Notes Conversion Derivative | 2020 Notes Hedge | 2021 Notes Conversion Derivative | 2021 Notes Hedge | |
Stock Price Volatility 1 | 33.41% | 33.41% | 34.58% | 34.58% |
Credit Spread for Wright 2 | 2.24% | N/A | 2.90% | N/A |
Credit Spread for Deutsche Bank AG 3 | N/A | 0.38% | N/A | N/A |
Credit Spread for Wells Fargo Securities, LLC 3 | N/A | 0.22% | N/A | N/A |
Credit Spread for JPMorgan Chase Bank 3 | N/A | 0.21% | N/A | 0.32% |
Credit Spread for Bank of America 3 | N/A | N/A | N/A | 0.31% |
1 | Volatility selected based on historical and implied volatility of ordinary shares of Wright Medical Group N.V. |
2 | Credit spread implied from traded price. |
3 | Credit spread of each bank is estimated using CDS curves. Source: Bloomberg. |
The fair value of our notes conversion derivatives is determined using a trinomial lattice model and is classified in Level 3. We used a stock price volatility, which is one of the most significant assumptions, of 33.41%, and 34.58% in calculating the fair value of our 2020 and 2021 Notes Conversion Derivatives, respectively, as of December 31, 2017. The change in the fair value resulting from a change in the stock price volatility would have a direct impact on net profit, with an increase in volatility resulting in an increase in the net loss and a decrease in volatility resulting in a decrease in the net loss for the period.
109
The following table depicts the impact that a 10% change in the stock price volatility would have on the fair value of the 2020 and 2021 Notes Conversion Derivatives (in thousands except for percentages):
Stock price volatility | Fair value at December 31, 2017 | Fair value with 10% decrease in stock price volatility | Fair value with 10% increase in stock price volatility | |||||||
2020 Notes Conversion Derivative | 33.41% | $ | 44,132 | $ | 21,104 | $ | 69,045 | |||
2021 Notes Conversion Derivative | 34.58% | $ | 126,148 | $ | 97,047 | $ | 154,271 | |||
The fair value of our notes hedges is determined using the Black-Scholes formula combined with credit adjustments and is classified in Level 3. A significant change in the stock price volatility price would result in a significant change in the fair value. We used a stock price volatility, which is one of the most significant assumptions, of 33.41% and 34.58% in calculating the fair value of the 2020 and 2021 Notes Hedges, respectively, as of December 31, 2017. The change in the fair value resulting from a change in the stock price volatility would have a direct impact on net profit, with an increase in volatility resulting in a decrease in the net loss and a decrease in volatility resulting in an increase in the net loss for the period. The impact on profit would be offset due to volatility of notes hedges by a similar change in volatility of the notes conversion derivatives.
The following table depicts the impact that a 10% change in the stock price volatility would have on the fair value of the 2020 and 2021 Notes Hedges (in thousands except for percentages):
Stock price volatility | Fair value at December 31, 2017 | Fair value with 10% decrease in stock price volatility | Fair value with 10% increase in stock price volatility | |||||||
2020 Notes Hedges | 33.41% | $ | 45,033 | $ | 21,984 | $ | 69,790 | |||
2021 Notes Hedges | 34.58% | $ | 127,063 | $ | 99,010 | $ | 154,476 | |||
Derivatives not Designated as Hedging Instruments
We employ a derivative program using foreign currency forward contracts to mitigate the risk of currency fluctuations on our intercompany receivable and payable balances that are denominated in foreign currencies. These forward contracts are expected to offset the transactional gains and losses on the related intercompany balances. These forward contracts are not designated as hedging instruments under FASB ASC Topic 815. Accordingly, the changes in the fair value and the settlement of the contracts are recognized in the period incurred in the accompanying consolidated statements of operations. As of December 25, 2016, we had $0.4 million in “Accrued expenses and other current liabilities” on our consolidated balance sheet related to foreign currency contracts outstanding. As of December 31, 2017, there were no unsettled foreign currency contracts recorded within our consolidated balance sheet. We plan to discontinue our foreign currency forward contracts derivative program in 2018.
As part of our acquisition of WG Healthcare on January 7, 2013, we were obligated to pay contingent consideration upon the achievement of certain revenue milestones. As of December 25, 2016, we had recorded an estimated fair value of future consideration of $0.4 million which was paid during 2017.
As a result of the acquired sales and distribution business of Surgical Specialties Australia Pty. Ltd in 2015, we have recorded the estimated fair value of future contingent consideration of approximately $0.9 million and $1.7 million as of December 31, 2017 and December 25, 2016, respectively. We paid $1.0 million and $0.3 million in revenue earnout payments related to this contingent consideration in the fiscal years ended December 31, 2017 and December 25, 2016, respectively.
As a result of the acquired business of IMASCAP in 2017, we have recorded the estimated fair value of future contingent consideration of approximately €15.1 million, or approximately $17.8 million, related to the achievement of certain technical milestones and sales earnouts. The estimated fair value of contingent consideration related to technical milestones totaled $11.9 million and is contingent upon the development and approval of a patient specific implant system and new software modules. The estimated fair value of contingent consideration related to sales earnouts totaled $5.9 million and is contingent upon the sale of patient specific guides and the future patient specific implant system.
The fair values of the sales earn out contingent consideration as of December 31, 2017 and December 25, 2016 were determined using a discounted cash flow model and probability adjusted estimates of the future earnings and is classified in Level 3. The discount rate is 12% for IMASCAP and 14% for Surgical Specialties Australia Pty. Ltd.
In addition to the sales earn out contingent consideration, we also have contingent consideration from the IMASCAP acquisition related to meeting certain developmental milestones for new software modules and for the FDA and CE approval for the future patient specific implant system. The fair value of this contingent consideration as of December 31, 2017 was determined using
110
probability adjusted estimates of the future payments and is classified in Level 3. The discount rate is approximately 6% for IMASCAP.
A change in the discount rate would have limited impact on our profits or the fair value of this contingent consideration. Changes in the fair value of contingent consideration are recorded in “Other expense (income), net” in our consolidated statements of operations.
On March 1, 2013, as part of our acquisition of BioMimetic, we issued Contingent Value Rights (CVRs) as part of the merger consideration. Each CVR entitles its holder to receive additional cash payments of up to $6.50 per share, which are payable upon receipt of FDA approval of AUGMENT® Bone Graft and upon achieving certain revenue milestones. On September 1, 2015, AUGMENT® Bone Graft received FDA approval and the first of the milestone payments associated with the CVRs was paid out at $3.50 per share, which totaled $98.1 million. The fair value of the CVRs outstanding at December 31, 2017 and December 25, 2016 was $42.3 million and $37.0 million, respectively, and was determined using the closing price of the security in the active market (Level 1). For the fiscal years ended December 31, 2017 and December 25, 2016, the change in the fair value of the CVRs resulted in expense of $5.3 million and $8.7 million, respectively. The income or expense related to the change in the fair value of the CVRs is recorded in “Other expense (income), net” in our consolidated statements of operations. If, prior to March 1, 2019, sales of AUGMENT® Bone Graft reach $40 million over 12 consecutive months, cash payment would be required at $1.50 per share, or $42 million. Further, if, prior to March 1, 2019, sales of AUGMENT® Bone Graft reach $70 million over 12 consecutive months, an additional cash payment would be required at $1.50 per share, or $42 million. As of December 31, 2017, we have reflected the $42.0 million balance related to CVR liability within “Accrued expenses and other current liabilities.”
The carrying value of cash and cash equivalents, accounts receivable, and accounts payable approximates the fair value of these financial instruments at December 31, 2017 and December 25, 2016 due to their short maturities and variable rates.
The following tables summarize the valuation of our financial instruments (in thousands):
Total | Quoted prices in active markets (Level 1) | Prices with other observable inputs (Level 2) | Prices with unobservable inputs (Level 3) | |||||||||
At December 31, 2017 | ||||||||||||
Assets | ||||||||||||
Cash and cash equivalents | $ | 167,740 | $ | 167,740 | $ | — | $ | — | ||||
Restricted cash | — | — | — | — | ||||||||
2020 Notes Hedges | 45,033 | — | — | 45,033 | ||||||||
2021 Notes Hedges | 127,063 | — | — | 127,063 | ||||||||
Total | $ | 339,836 | $ | 167,740 | $ | — | $ | 172,096 | ||||
Liabilities | ||||||||||||
2020 Notes Conversion Derivative | $ | 44,132 | $ | — | $ | — | $ | 44,132 | ||||
2021 Notes Conversion Derivative | 126,148 | — | — | 126,148 | ||||||||
Contingent consideration | 19,188 | — | — | 19,188 | ||||||||
Contingent consideration (CVRs) | 42,325 | 42,325 | — | — | ||||||||
Total | $ | 231,793 | $ | 42,325 | $ | — | $ | 189,468 | ||||
111
Total | Quoted prices in active markets (Level 1) | Prices with other observable inputs (Level 2) | Prices with unobservable inputs (Level 3) | |||||||||
At December 25, 2016 | ||||||||||||
Assets | ||||||||||||
Cash and cash equivalents | $ | 262,265 | $ | 262,265 | $ | — | $ | — | ||||
Restricted Cash | 150,000 | 150,000 | — | — | ||||||||
2020 Notes Hedges | 77,232 | — | — | 77,232 | ||||||||
2021 Notes Hedges | 159,095 | — | — | 159,095 | ||||||||
Total | $ | 648,592 | $ | 412,265 | $ | — | $ | 236,327 | ||||
Liabilities | ||||||||||||
2017 Notes Conversion Derivative | $ | 164 | $ | — | $ | — | $ | 164 | ||||
2020 Notes Conversion Derivative | 77,758 | — | — | 77,758 | ||||||||
2021 Notes Conversion Derivative | 161,601 | — | — | 161,601 | ||||||||
Contingent consideration | 2,249 | — | — | 2,249 | ||||||||
Contingent consideration (CVRs) | 36,999 | 36,999 | — | — | ||||||||
Total | $ | 278,771 | $ | 36,999 | $ | — | $ | 241,772 | ||||
The following is a roll forward of our assets and liabilities measured at fair value (in thousands) on a recurring basis using unobservable inputs (Level 3) (in thousands):
Balance at December 25, 2016 | Additions | Transfers into Level 3 | Gain/(loss) included in earnings | Settlements | Currency | Balance at December 31, 2017 | ||||||||||||||||
2017 Notes Conversion Derivative | $ | (164 | ) | $ | — | $ | — | $ | (51 | ) | $ | 215 | $ | — | $ | — | ||||||
2020 Notes Hedges | 77,232 | — | — | (32,199 | ) | — | — | 45,033 | ||||||||||||||
2020 Notes Conversion Derivative | (77,758 | ) | — | — | 33,626 | — | — | (44,132 | ) | |||||||||||||
2021 Notes Hedges | 159,095 | — | — | (32,032 | ) | — | — | 127,063 | ||||||||||||||
2021 Notes Conversion Derivative | (161,601 | ) | — | — | 35,453 | — | — | (126,148 | ) | |||||||||||||
Contingent consideration | (2,249 | ) | (17,820 | ) | — | (72 | ) | 1,429 | (476 | ) | (19,188 | ) | ||||||||||
7. Property, Plant and Equipment
Property, plant and equipment, net consists of the following (in thousands):
December 31, 2017 | December 25, 2016 | ||||||
Land and land improvements | $ | 2,163 | $ | 1,952 | |||
Buildings | 41,537 | 40,570 | |||||
Machinery and equipment | 60,859 | 45,141 | |||||
Furniture, fixtures and office equipment | 142,299 | 125,844 | |||||
Construction in progress | 14,403 | 7,058 | |||||
Surgical instruments | 187,660 | 147,713 | |||||
448,921 | 368,278 | ||||||
Less: Accumulated depreciation | (236,542 | ) | (166,546 | ) | |||
$ | 212,379 | $ | 201,732 | ||||
112
The components of property, plant and equipment recorded under capital leases consist of the following (in thousands):
December 31, 2017 | December 25, 2016 | ||||||
Buildings | $ | 15,530 | $ | 15,529 | |||
Machinery and equipment | 12,478 | 5,356 | |||||
Furniture, fixtures and office equipment | 960 | — | |||||
28,968 | 20,885 | ||||||
Less: Accumulated depreciation | (7,749 | ) | (4,482 | ) | |||
$ | 21,219 | $ | 16,403 | ||||
Depreciation expense recognized within results of continuing operations approximated $56.8 million, $55.8 million, and $28.4 million for the fiscal years ended December 31, 2017, December 25, 2016, and December 27, 2015, respectively, and included depreciation of assets under capital leases.
8. Goodwill and Intangibles
Changes in the carrying amount of goodwill occurring during the fiscal year ended December 31, 2017, are as follows (in thousands):
U.S. Lower Extremities & Biologics | U.S. Upper Extremities | International Extremities & Biologics | Total | |||||||||
Goodwill at December 25, 2016 | $ | 218,525 | $ | 558,669 | $ | 73,848 | $ | 851,042 | ||||
Goodwill associated with IMASCAP acquisition | — | 71,981 | — | 71,981 | ||||||||
Foreign currency translation | — | — | 10,639 | 10,639 | ||||||||
Goodwill at December 31, 2017 | $ | 218,525 | $ | 630,650 | $ | 84,487 | $ | 933,662 | ||||
On December 14, 2017, we completed the acquisition of IMASCAP. As part of the preliminary purchase price allocation, we acquired $10.9 million of intangible assets related to completed technology and in-process research and development and $72.0 million of goodwill. Of the $10.9 million of acquired intangible assets, $5.6 million was assigned to developed technology (6 year life) and $5.3 million was assigned to in-process research and development.
Goodwill is recognized for the excess of the purchase price over the fair value of net assets of businesses acquired.
Goodwill is required to be tested for impairment at least annually. As of October 1, 2017, we performed a quantitative analysis to test for goodwill impairment and determined that it is not more likely than not that the carrying value of our U.S. Lower Extremities & Biologics, U.S. Upper Extremities, and International Extremities & Biologics reporting units exceeded their respective fair values, indicating that goodwill was not impaired.
113
The components of our identifiable intangible assets, net are as follows (in thousands):
December 31, 2017 | December 25, 2016 | ||||||||||||||
Cost | Accumulated amortization | Cost | Accumulated amortization | ||||||||||||
Indefinite life intangibles: | |||||||||||||||
IPRD technology | $ | 6,422 | $ | 938 | |||||||||||
Finite life intangibles: | |||||||||||||||
Distribution channels | 900 | $ | 640 | 900 | $ | 374 | |||||||||
Completed technology | 149,645 | 40,810 | 133,966 | 26,550 | |||||||||||
Licenses | 5,268 | 1,530 | 4,868 | 1,115 | |||||||||||
Customer relationships | 129,693 | 23,268 | 122,974 | 15,133 | |||||||||||
Trademarks | 14,368 | 10,487 | 13,950 | 6,881 | |||||||||||
Non-compete agreements | 3,964 | 2,603 | 11,810 | 7,833 | |||||||||||
Other | 569 | 490 | 524 | 247 | |||||||||||
Total finite life intangibles | 304,407 | $ | 79,828 | 288,992 | $ | 58,133 | |||||||||
Total intangibles | 310,829 | 289,930 | |||||||||||||
Less: Accumulated amortization | (79,828 | ) | (58,133 | ) | |||||||||||
Intangible assets, net | $ | 231,001 | $ | 231,797 | |||||||||||
Based on the total finite life intangible assets held at December 31, 2017, we expect to amortize approximately $25.0 million in 2018, $23.0 million in 2019, $22.3 million in 2020, $22.1 million in 2021, and $22.1 million in 2022.
9. Debt and Capital Lease Obligations
Debt and capital lease obligations consist of the following (in thousands):
December 31, 2017 | December 25, 2016 | ||||||
Capital lease obligations | $ | 20,401 | $ | 14,892 | |||
2021 Notes | 300,051 | 280,811 | |||||
2020 Notes | 513,014 | 482,364 | |||||
2017 Notes | — | 1,971 | |||||
Asset-based line of credit | 53,645 | 30,000 | |||||
Other debt | 8,003 | 4,317 | |||||
895,114 | 814,355 | ||||||
Less: current portion | (58,906 | ) | (33,948 | ) | |||
$ | 836,208 | $ | 780,407 | ||||
2021 Notes
On May 20, 2016, we issued $395 million aggregate principal amount of the 2021 Notes pursuant to an indenture (2021 Notes) dated as of May 20, 2016 between us and The Bank of New York Mellon Trust Company, N.A., as trustee. The 2021 Notes require interest to be paid at an annual rate of 2.25% semi-annually in arrears on each May 15 and November 15, and will mature on November 15, 2021 unless earlier converted or repurchased. The 2021 Notes are convertible, subject to certain conditions, solely into cash. The initial conversion rate for the 2021 Notes will be 46.8165 ordinary shares (subject to adjustment as provided in the 2021 Notes Indenture) per $1,000 principal amount of the 2021 Notes (subject to, and in accordance with, the settlement provisions of the 2021 Notes Indenture), which is equal to an initial conversion price of approximately $21.36 per ordinary share. We may not redeem the 2021 Notes prior to the maturity date, and no “sinking fund” is available for the 2021 Notes, which means that we are not required to redeem or retire the 2021 Notes periodically.
The holders of the 2021 Notes may convert their 2021 Notes at any time prior to May 15, 2021 solely into cash, in multiples of $1,000 principal amount, upon satisfaction of one or more of the following circumstances: (1) during any calendar quarter
114
commencing after the calendar quarter ending on June 30, 2016 (and only during such calendar quarter), if the last reported sale price of our ordinary shares for at least 20 trading days (whether or not consecutive) during a period of 30 consecutive trading days ending on the last trading day of the immediately preceding calendar quarter is greater than or equal to 130% of the conversion price on each applicable trading day; (2) during the five business day period after any five consecutive trading day period in which the trading price per $1,000 principal amount of 2021 Notes for each trading day of the measurement period was less than 98% of the product of the last reported sale price of our ordinary shares and the conversion rate on each such trading day; or (3) upon the occurrence of specified corporate events. On or after May 15, 2021 until the close of business on the second scheduled trading day immediately preceding the maturity date, holders may convert their 2021 Notes solely into cash, regardless of the foregoing circumstances. Upon conversion, a holder will receive an amount in cash, per $1,000 principal amount of the 2021 Notes, equal to the settlement amount as calculated under the 2021 Notes Indenture. If we undergo a fundamental change, as defined in the 2021 Notes Indenture, subject to certain conditions, holders of the 2021 Notes will have the option to require us to repurchase for cash all or a portion of their 2021 Notes at a repurchase price equal to 100% of the principal amount of the 2021 Notes to be repurchased, plus any accrued and unpaid interest to, but excluding, the fundamental change repurchase date, as defined in the 2021 Notes Indenture. In addition, following certain corporate transactions, we, under certain circumstances, will increase the applicable conversion rate for a holder that elects to convert its 2021 Notes in connection with such corporate transaction. The 2021 Notes are senior unsecured obligations that rank: (i) senior in right of payment to any of our indebtedness that is expressly subordinated in right of payment to the 2021 Notes; (ii) equal in right of payment to any of our unsecured indebtedness that is not so subordinated; (iii) effectively junior in right of payment to any of our secured indebtedness to the extent of the value of the assets securing such indebtedness; and (iv) structurally junior to all indebtedness and other liabilities (including trade payables) of our subsidiaries. As a result of the issuance of the 2021 Notes, we recorded deferred financing charges of approximately $7.3 million, which are being amortized over the term of the 2021 Notes using the effective interest method.
In the first fiscal quarter of 2017, the closing price of our ordinary shares was greater than 130% of the 2021 Notes conversion price for 20 or more of the 30 consecutive trading days preceding the quarter-end; and, therefore, the holders of the 2021 Notes had the ability to convert the notes during the succeeding quarterly period. Due to the ability of the holders of the 2021 Notes to convert the notes during this period, the carrying value of the 2021 Notes and the fair value of the 2021 Notes Conversion Derivative were classified as current liabilities, and the fair value of the 2021 Notes Hedges were classified as current assets as of March 26, 2017. There were no conversions during the second quarter of 2017. The closing price of our ordinary shares was less than 130% of the 2021 Notes conversion price for more than 20 of the 30 consecutive trading days preceding the calendar fiscal quarters ended June 30, 2017, September 30, 2017, and December 31, 2017, which resulted in the 2021 Notes no longer being convertible. As such, the 2021 Notes, 2021 Notes Conversion Derivative and 2021 Notes Hedges were classified as long-term as of December 31, 2017.
The 2021 Notes Conversion Derivative requires bifurcation from the 2021 Notes in accordance with ASC Topic 815, Derivatives and Hedging, and is accounted for as a derivative liability. See Note 6 for additional information regarding the 2021 Notes Conversion Derivative. The fair value of the 2021 Notes Conversion Derivative at the time of issuance of the 2021 Notes was $117.2 million and was recorded as original debt discount for purposes of accounting for the debt component of the 2021 Notes. This discount is amortized as interest expense using the effective interest method over the term of the 2021 Notes. For the fiscal years ended December 31, 2017 and December 25, 2016, we recorded $18.1 million and $9.8 million, respectively, of interest expense related to the amortization of the debt discount based upon an effective rate of 9.72%.
The components of the 2021 Notes were as follows (in thousands):
December 31, 2017 | December 25, 2016 | ||||||
Principal amount of 2021 Notes | $ | 395,000 | $ | 395,000 | |||
Unamortized debt discount | (89,332 | ) | (107,441 | ) | |||
Unamortized debt issuance costs | (5,617 | ) | (6,748 | ) | |||
Net carrying amount of 2021 Notes | $ | 300,051 | $ | 280,811 | |||
The estimated fair value of the 2021 Notes was approximately $481.9 million at December 31, 2017, based on a quoted price in an active market (Level 1).
We entered into 2021 Notes Hedges in connection with the issuance of the 2021 Notes with two counterparties. The 2021 Notes Hedges, which are cash-settled, are generally intended to reduce our exposure to potential cash payments that we would be required to make if holders elect to convert the 2021 Notes at a time when our ordinary share price exceeds the conversion price. However, in connection with certain events, including, among others, (i) a merger or other make-whole fundamental change (as defined in
115
the 2021 Notes Indenture); (ii) certain hedging disruption events, which may include changes in tax laws, an increase in the cost of borrowing our ordinary shares in the market or other material increases in the cost to the option counterparties of hedging the 2021 Note Hedges; (iii) our failure to perform certain obligations under the 2021 Notes Indenture or under the 2021 Notes Hedges; (iv) certain payment defaults on our existing indebtedness in excess of $25 million; or (v) if we or any of our significant subsidiaries become insolvent or otherwise becomes subject to bankruptcy proceedings, the option counterparties have the discretion to terminate the 2021 Notes Hedges, which may reduce the effectiveness of the 2021 Notes Hedges. In addition, the option counterparties have broad discretion to make certain adjustments to the 2021 Notes Hedges and warrant transactions upon the occurrence of certain other events, including, among others, (i) any adjustment to the conversion rate of the 2021 Notes; or (ii) upon the announcement of certain significant corporate events, including events that may give rise to a termination event as described above, such as the announcement of a third-party tender offer. Any such adjustment may also reduce the effectiveness of the 2021 Note Hedges. The aggregate cost of the 2021 Notes Hedges was $99.8 million and is accounted for as a derivative asset in accordance with ASC Topic 815. See Note 6 of the consolidated financial statements for additional information regarding the 2021 Notes Hedges and the 2021 Notes Conversion Derivative.
We also entered into warrant transactions in which we sold warrants for an aggregate of 18.5 million ordinary shares to the two option counterparties, subject to adjustment, for an aggregate of $54.6 million. The strike price of the warrants is $30.00 per share, which was 69% above the last reported sale price of our ordinary shares on May 12, 2016. The warrants are expected to be net-share settled and exercisable over the 100 trading day period beginning on February 15, 2022. The warrant transactions will have a dilutive effect on our ordinary shares to the extent that the market value per ordinary share during such period exceeds the applicable strike price of the warrants. However, in connection with certain events, these option counterparties have the discretion to make certain adjustments to warrant transactions, which may increase our obligations under the warrant transactions.
Aside from the initial payment of the $99.8 million premium in the aggregate to the two option counterparties and subject to the right of the option counterparties to terminate the 2021 Notes Hedges in certain circumstances, we do not expect to be required to make any cash payments to the option counterparties under the 2021 Notes Hedges and expect to be entitled to receive from the option counterparties cash, generally equal to the amount by which the market price per ordinary share exceeds the strike price of the convertible note hedging transactions during the relevant valuation period. The strike price under the 2021 Notes Hedges is initially equal to the conversion price of the 2021 Notes. However, in connection with certain events, these option counterparties have the discretion to make certain adjustments to the 2021 Note Hedges, which may reduce the effectiveness of the 2021 Note Hedges. Additionally, if the market value per ordinary share exceeds the strike price on any settlement date under the warrant transaction, we will generally be obligated to issue to the option counterparties in the aggregate a number of shares equal in value to one percent of the amount by which the then-current market value of one ordinary share exceeds the then-effective strike price of each warrant, multiplied by the number of ordinary shares into which the 2021 Notes are initially convertible. We will not receive any additional proceeds if warrants are exercised.
As described in more detail below, concurrently with the issuance and sale of the 2021 Notes, certain holders of the 2017 Notes and the 2020 Notes exchanged their 2017 Notes or 2020 Notes for the 2021 Notes.
2020 Notes
On February 13, 2015, WMG issued $632.5 million aggregate principal amount of the 2020 Notes pursuant to an indenture (2020 Notes), dated as of February 13, 2015 between WMG and The Bank of New York Mellon Trust Company, N.A., as trustee. The 2020 Notes require interest to be paid semi-annually on each February 15 and August 15 at an annual rate of 2.00%, and mature on February 15, 2020 unless earlier converted or repurchased. The 2020 Notes were initially issued whereby they were convertible at the option of the holder, during certain periods and subject to certain conditions described below, solely into cash at an initial conversion rate of 32.3939 shares of WMG common stock per $1,000 principal amount of the 2020 Notes, subject to adjustment upon the occurrence of certain events, which represented an initial conversion price of approximately $30.87 per share of WMG common stock. On November 24, 2015, Wright Medical Group N.V. executed a supplemental indenture, fully and unconditionally guaranteeing, on a senior unsecured basis, WMG’s obligations relating to the 2020 Notes, changing the underlying reference securities from WMG common stock to Wright Medical Group N.V. ordinary shares and making a corresponding adjustment to the conversion price. From and after the effective time of the Wright/Tornier merger, (i) all calculations and other determinations with respect to the 2020 Notes previously based on references to WMG common stock are calculated or determined by reference to our ordinary shares, and (ii) the conversion rate (as defined in the 2020 Notes Indenture) for the 2020 Notes was adjusted to a conversion rate of 33.39487 ordinary shares (subject to adjustment as provided in the 2020 Notes Indenture) per $1,000 principal amount of the 2020 Notes, which represents a conversion price of approximately $29.94 per ordinary share (subject to, and in accordance with, the settlement provisions of the 2020 Notes Indenture). The 2020 Notes may not be redeemed by WMG prior to the maturity date, and no “sinking fund” is available for the 2020 Notes, which means that WMG is not required to redeem or retire the 2020 Notes periodically.
116
The holders of the 2020 Notes may convert their notes at any time prior to August 15, 2019 solely into cash, in multiples of $1,000 principal amount, upon satisfaction of one or more of the following circumstances: (1) during any calendar quarter commencing after the calendar quarter ending on March 31, 2015 (and only during such calendar quarter), if the last reported sale price of our ordinary shares for at least 20 trading days (whether or not consecutive) during a period of 30 consecutive trading days ending on the last trading day of the immediately preceding calendar quarter is greater than or equal to 130% of the conversion price on each applicable trading day; (2) during the five business day period after any five consecutive trading day period in which the trading price per $1,000 principal amount of 2020 Notes for each trading day of the measurement period was less than 98% of the product of the last reported sale price of our ordinary shares and the conversion rate on each such trading day; or (3) upon the occurrence of specified corporate events. The Wright/Tornier merger did not result in a conversion right for holders of the 2020 Notes. On or after August 15, 2019 until the close of business on the second scheduled trading day immediately preceding the maturity date, holders may convert their 2020 Notes solely into cash, regardless of the foregoing circumstances. Upon conversion, a holder will receive an amount in cash, per $1,000 principal amount of the 2020 Notes, equal to the settlement amount as calculated under the 2020 Notes Indenture. If WMG undergoes a fundamental change, as defined in the 2020 Notes Indenture, subject to certain conditions, holders of the 2020 Notes will have the option to require WMG to repurchase for cash all or a portion of their notes at a purchase price equal to 100% of the principal amount of the 2020 Notes to be repurchased, plus any accrued and unpaid interest to, but excluding, the fundamental change repurchase date, as defined in the 2020 Notes Indenture. In addition, following certain corporate transactions, WMG, under certain circumstances, will increase the applicable conversion rate for a holder that elects to convert its 2020 Notes in connection with such corporate transaction. The 2020 Notes are senior unsecured obligations that rank: (i) senior in right of payment to any of WMG's indebtedness that is expressly subordinated in right of payment to the 2020 Notes; (ii) equal in right of payment to any of WMG's unsecured indebtedness that is not so subordinated; (iii) effectively junior in right of payment to any secured indebtedness to the extent of the value of the assets securing such indebtedness; and (iv) structurally junior to all indebtedness and other liabilities (including trade payables) of WMG's subsidiaries. In conjunction with the issuance of the 2020 Notes, we recorded deferred financing charges of approximately $18.1 million, which are being amortized over the term of the 2020 Notes using the effective interest method.
The 2020 Notes Conversion Derivative requires bifurcation from the 2020 Notes in accordance with ASC Topic 815, Derivatives and Hedging, and is accounted for as a derivative liability. See Note 6 of the consolidated financial statements for additional information regarding the 2020 Notes Conversion Derivative. The fair value of the 2020 Notes Conversion Derivative at the time of issuance of the 2020 Notes was $149.8 million and was recorded as original debt discount for purposes of accounting for the debt component of the 2020 Notes. This discount is amortized as interest expense using the effective interest method over the term of the 2020 Notes. For the fiscal years ended December 31, 2017 and December 25, 2016, we recorded $27.3 million and $25.9 million, respectively, of interest expense related to the amortization of the debt discount based upon an effective rate of 8.54%.
Concurrently with the issuance and sale of the 2021 Notes, certain holders of the 2020 Notes exchanged approximately $45.0 million aggregate principal amount of their 2020 Notes for the 2021 Notes. For each $1,000 principal amount of 2020 Notes validly submitted for exchange, we delivered $990.00 principal amount of the 2021 Notes (subject to rounding down to the nearest $1,000 principal amount of the 2021 Notes, the difference being referred as the rounded amount) to the investor plus an amount of cash equal to the unpaid interest on the 2020 Notes and the rounded amount. As a result of this note exchange and retirement of $45.0 million aggregate principal amount of the 2020 Notes, we recognized approximately $9.3 million for the write-off of related pro rata unamortized deferred financing fees and debt discount within “Other expense (income), net” in our consolidated statements of operations during the fiscal year ended December 25, 2016.
The components of the 2020 Notes were as follows (in thousands):
December 31, 2017 | December 25, 2016 | ||||||
Principal amount of 2020 Notes | $ | 587,500 | $ | 587,500 | |||
Unamortized debt discount | (66,418 | ) | (93,749 | ) | |||
Unamortized debt issuance costs | (8,068 | ) | (11,387 | ) | |||
Net carrying amount of 2020 Notes | $ | 513,014 | $ | 482,364 | |||
The estimated fair value of the 2020 Notes was approximately $603.8 million at December 31, 2017, based on a quoted price in an active market (Level 1).
WMG entered into the 2020 Notes Hedges in connection with the issuance of the 2020 Notes with three option counterparties. See Note 6 of the consolidated financial statements for additional information on the 2020 Notes Hedges. The 2020 Notes Hedges, which are cash-settled, are generally intended to reduce WMG's exposure to potential cash payments that WMG would be required to make if holders elect to convert the 2020 Notes at a time when our ordinary share price exceeds the conversion price. However,
117
in connection with certain events, including, among others, (i) a merger or other make-whole fundamental change (as defined in the 2020 Notes indenture); (ii) certain hedging disruption events, which may include changes in tax laws, an increase in the cost of borrowing our ordinary shares in the market or other material increases in the cost to the option counterparties of hedging the 2020 Note Hedges; (iii) WMG's failure to perform certain obligations under the 2020 Notes Indenture or under the 2020 Notes Hedges; (iv) certain payment defaults on WMG's existing indebtedness in excess of $25 million; or (v) if WMG or any of its significant subsidiaries become insolvent or otherwise becomes subject to bankruptcy proceedings, the option counterparties have the discretion to terminate the 2020 Note Hedges at a value determined by them in a commercially reasonable manner and/or adjust the terms of the 2020 Note Hedges, which may reduce the effectiveness of the 2020 Note Hedges. In addition, the option counterparties have broad discretion to make certain adjustments to the 2020 Notes Hedges upon the occurrence of certain other events, including, among others, (i) any adjustment to the conversion rate of the 2020 Notes; or (ii) upon the announcement of certain significant corporate events, including events that may give rise to a termination event as described above, such as the announcement of a third-party tender offer. Any such adjustment may also reduce the effectiveness of the 2020 Note Hedges. The aggregate cost of the 2020 Notes Hedges was $144.8 million and is accounted for as a derivative asset in accordance with ASC Topic 815. See Note 6 of the consolidated financial statements for additional information regarding the 2020 Notes Hedges and the 2020 Notes Conversion Derivative.
WMG also entered into warrant transactions in which it sold warrants for an aggregate of 20.5 million shares of WMG common stock to the three option counterparties, subject to adjustment. The strike price of the warrants was initially $40 per share of WMG common stock, which was 59% above the last reported sale price of WMG common stock on February 9, 2015. On November 24, 2015, Wright Medical Group N.V. assumed WMG's obligations pursuant to the warrants. Following the assumption, the warrants became exercisable for 21.1 million Wright Medical Group N.V. ordinary shares and the strike price of the warrants was adjusted to $38.8010 per ordinary share. The warrants are expected to be net-share settled and exercisable over the 200 trading day period beginning on May 15, 2020. The warrant transactions will have a dilutive effect on our ordinary shares to the extent that the market value per ordinary share during such period exceeds the applicable strike price of the warrants. However, in connection with certain events, these option counterparties have the discretion to make certain adjustments to warrant transactions, which may increase our obligations under the warrant transactions.
In addition, during the second quarter of 2016, we settled a portion of the 2020 Notes Hedges (receiving $3.9 million) and repurchased a portion of the warrants associated with the 2020 Notes (paying $3.3 million), generating net proceeds of approximately $0.6 million. Subsequent to this partial settlement, we had warrants which were exercisable for 19.6 million ordinary shares and the strike price of the warrants remained $38.8010 per ordinary share.
Aside from the initial payment of the $144.8 million premium in the aggregate to the option counterparties, we do not expect to be required to make any cash payments to the option counterparties under the 2020 Notes Hedges and expect to be entitled to receive from the option counterparties cash, generally equal to the amount by which the market price per ordinary share exceeds the strike price of the convertible note hedging transactions during the relevant valuation period. The strike price under the 2020 Notes Hedges is initially equal to the conversion price of the 2020 Notes. However, in connection with certain events, these option counterparties have the discretion to make certain adjustments to the 2020 Note Hedges, which may reduce the effectiveness of the 2020 Note Hedges. Additionally, if the market value per ordinary share exceeds the strike price on any settlement date under the warrant transaction, we will generally be obligated to issue to the option counterparties in the aggregate a number of ordinary shares equal in value to one half of one percent of the amount by which the then-current market value of one ordinary share exceeds the then-effective strike price of each warrant, multiplied by the number of reference ordinary shares into which the 2020 Notes are initially convertible. We will not receive any additional proceeds if warrants are exercised.
2017 Notes
On August 31, 2012, WMG issued $300 million aggregate principal amount of the 2017 Notes pursuant to an indenture (2017 Notes) dated as of August 31, 2012 between WMG and The Bank of New York Mellon Trust Company, N.A., as trustee. The 2017 Notes matured on August 15, 2017. Prior to maturity, we paid interest on the 2017 Notes semi-annually on each February 15 and August 15 at an annual rate of 2.00%. WMG could not redeem the 2017 Notes prior to the maturity date, and no “sinking fund” was available for the 2017 Notes, which means that WMG was not required to redeem or retire the 2017 Notes periodically. The 2017 Notes were convertible at the option of the holder, during certain periods and subject to certain conditions as described below, solely into cash at an initial conversion rate of 39.3140 shares per $1,000 principal amount of the 2017 Notes, subject to adjustment upon the occurrence of specified events, which represented an initial conversion price of $25.44 per share. Holders could have converted their 2017 Notes at any time prior to February 15, 2017 only under the following circumstances: (1) during any calendar quarter commencing after the calendar quarter ending December 31, 2012 (and only during such calendar quarter), if the last reported sale price of our ordinary shares for at least 20 trading days (whether or not consecutive) during a period of 30 consecutive trading days ending on the last trading day of the immediately preceding calendar quarter was greater than or equal to 130% of
118
the conversion price on each applicable trading day; (2) during the five business day period after any five consecutive trading day period in which the trading price per $1,000 principal amount of notes for each trading day of the measurement period was less than 98% of the product of the last reported sale price of our ordinary shares and the conversion rate on each such trading day; or (3) upon the occurrence of specified corporate events. On or after February 15, 2017 until the close of business on the second scheduled trading day immediately preceding the maturity date, holders could convert their 2017 Notes solely into cash, regardless of the foregoing circumstances. The 2017 Notes were senior unsecured obligations that ranked: (i) senior in right of payment to any of WMG's indebtedness that is expressly subordinated in right of payment to the 2017 Notes; (ii) equal in right of payment to any of WMG's unsecured indebtedness that is not so subordinated; (iii) effectively junior in right of payment to any secured indebtedness to the extent of the value of the assets securing such indebtedness; and (iv) structurally junior to all indebtedness and other liabilities (including trade payables) of WMG's subsidiaries. As a result of the issuance of the 2017 Notes, we recognized deferred financing charges of approximately $8.8 million, which were amortized over the term of the 2017 Notes using the effective interest method.
The 2017 Notes Conversion Derivative required bifurcation from the 2017 Notes in accordance with ASC Topic 815, Derivatives and Hedging, and was accounted for as a derivative liability. See Note 6 of the consolidated financial statements for additional information regarding the 2017 Notes Conversion Derivative. The fair value of the 2017 Notes Conversion Derivative at the time of issuance of the 2017 Notes was $48.1 million and was recorded as original debt discount for purposes of accounting for the debt component of the 2017 Notes. This discount was amortized as interest expense using the effective interest method over the term of the 2017 Notes. For the fiscal year ended December 25, 2016, we recorded $0.9 million of interest expense related to the amortization of the debt discount based upon an effective rate of 6.47%. Interest on the 2017 Notes for the fiscal year ended December 31, 2017 was not significant.
In connection with the issuance of the 2020 Notes, on February 13, 2015, WMG repurchased and extinguished $240 million aggregate principal amount of the 2017 Notes and settled all of the 2017 Notes Hedges (receiving $70 million) and repurchased all of the warrants (paying $60 million) associated with the 2017 Notes. As a result of the repurchase, we recognized approximately $25.1 million for the write-off of related pro rata unamortized deferred financing fees and debt discount within “Other expense (income), net” in our consolidated statements of operations during the fiscal year ended December 27, 2015.
Concurrently with the issuance and sale of the 2021 Notes, certain holders of the 2017 Notes exchanged approximately $54.4 million aggregate principal amount their 2017 Notes for the 2021 Notes. For each $1,000 principal amount of 2017 Notes validly submitted for exchange, we delivered $1,035.40 principal amount of 2021 Notes (subject to rounding down to the nearest $1,000 principal amount of the 2021 Notes, the difference being referred as the rounded amount) to the investor plus an amount of cash equal to the unpaid interest on the 2017 Notes and the rounded amount. In addition, during the fiscal quarter ended June 26, 2016, we repurchased and extinguished an additional $3.6 million aggregate principal amount of the 2017 Notes in privately negotiated transactions. As a result of this exchange and these repurchases, we recognized approximately $3.0 million for the write-off of related pro rata unamortized deferred financing fees and debt discount within “Other expense (income), net” in our consolidated statements of operations during the fiscal year ended December 25, 2016.
The components of the 2017 Notes were as follows (in thousands):
December 31, 2017 | December 25, 2016 | ||||||
Principal amount of 2017 Notes | $ | — | $ | 2,026 | |||
Unamortized debt discount | — | (47 | ) | ||||
Unamortized debt issuance costs | — | (8 | ) | ||||
Net carrying amount of 2017 Notes | $ | — | $ | 1,971 | |||
ABL Facility
On December 23, 2016, we, together with WMG and certain of our other wholly-owned U.S. subsidiaries (collectively, Borrowers), entered into a ABL Credit Agreement with Midcap Financial Trust, as administrative agent (Agent) and a lender and the additional lenders from time to time party thereto. The ABL Credit Agreement provides for a $150.0 million senior secured asset based line of credit, subject to the satisfaction of a borrowing base requirement (ABL Facility). The ABL Facility may be increased by up to $100.0 million upon the Borrowers’ request, subject to the consent of the Agent and each of the other lenders providing such increase. All borrowings under the ABL Facility are subject to the satisfaction of customary conditions, including the absence of default, the accuracy of representations and warranties in all material respects and the delivery of an updated borrowing base certificate. As of December 31, 2017 and December 25, 2016 we had $53.6 million and $30.0 million, respectively, in borrowings outstanding under the ABL Facility. We have reflected this debt as a current liability on our consolidated balance sheets as of December 31, 2017 and December 25, 2016, as required by US GAAP due to the weekly lockbox repayment/re-borrowing
119
arrangement underlying the agreement, as well as the ability for the lenders to accelerate the repayment of the debt under certain circumstances as described below. As of December 31, 2017 and December 25, 2016, we had $2.2 million and $2.5 million, respectively, of unamortized debt issuance costs related to the ABL Facility. These amounts are included within “Other assets” on our consolidated balance sheets as of December 31, 2017 and December 25, 2016 and will be amortized over the five-year term of the ABL Facility as described below.
The interest rate margin applicable to borrowings under the ABL Facility is, at the option of the Borrowers, equal to either (a) 3.25% for base rate loans or (b) 4.25% for LIBOR rate loans, subject to a 0.75% LIBOR floor. In addition to paying interest on the outstanding loans under the ABL Facility, the Borrowers also are required to pay a customary unused line fee equal to 0.50% per annum in respect of unutilized commitments and certain other customary fees related to Agent’s administration of the ABL Facility. Beginning January 1, 2017, the Borrowers are required to maintain a minimum drawn balance on the ABL Facility equal to 20% of the average borrowing base for each month. To the extent the actual drawn balance is less than 20%, the Borrowers must pay a fee equal to the amount the lenders under the ABL Facility would have earned had the Borrowers maintained a minimum drawn balance equal to 20% of the average borrowing base for such month.
The ABL Credit Agreement requires that the Borrowers calculate the borrowing base for the ABL Facility on at least a monthly basis and each time the Borrowers make a draw on the ABL Facility in accordance with the formula set forth in the ABL Credit Agreement. The borrowing base is subject to adjustment and the implementation of reserves by the Agent in its permitted discretion, as further described in the ABL Credit Agreement. If at any time the outstanding drawn balance under the ABL Facility exceeds the borrowing base as in effect at such time, Borrowers will be required to prepay loans under the ABL Facility in an amount equal to such excess. Certain accounts receivables and proceeds of collateral of the Borrowers will be applied to reduce the outstanding principal amount of the ABL Facility on a periodic basis.
There is no scheduled amortization under the ABL Facility and (subject to borrowing base requirements and applicable conditions to borrowing) the available revolving commitment may be borrowed, repaid and reborrowed without restriction. All outstanding loans under the ABL Facility will be due and payable in full on the date that is the earliest to occur of (x) December 23, 2021; (y) the date that is 91 days prior to the maturity date of the 2020 Notes or (z) the date that is 91 days prior to the maturity date of the 2021 Notes; provided that, the springing maturity under clauses (y) and (z) are subject to the Borrowers’ ability to refinance, extend, renew or replace the 2020 Notes and/or the 2021 Notes, as applicable, in full pursuant to the terms of the ABL Credit Agreement. Any voluntary or mandatory permanent reduction or termination of the revolving commitments under the ABL Facility is subject to a prepayment premium applicable to such reduced or terminated amount equal to (i) 3.0% through December 23, 2017, (ii) 2.0% from December 24, 2017 through December 23, 2018 and (iii) 0.75% at any time thereafter.
The ABL Credit Agreement contains certain negative covenants that restrict our ability to take certain actions as specified in the ABL Credit Agreement and an affirmative covenant that we maintain net revenue at or above minimum levels and maintain liquidity in the United States at a level specified in the ABL Credit Agreement, subject to certain exceptions. All of the obligations under the ABL Facility are guaranteed jointly and severally by Wright Medical Group N.V. and each of the Borrowers on the terms set forth in the ABL Credit Agreement. Subject to certain exceptions set forth in the ABL Credit Agreement, amounts outstanding under the ABL Facility are secured by a senior first priority security interest in substantially all existing and after-acquired assets of Wright Medical Group N.V. and each Borrower.
Other Debt
Other debt primarily includes mortgages, shareholder debt and loans acquired as a result of the IMASCAP acquisition. We have mortgages that had an outstanding balance of $1.0 million and $1.5 million at December 31, 2017 and December 25, 2016, respectively. These mortgages are secured by an office building in Montbonnot, France and bear fixed annual interest rates of 2.55%-4.9%. As a result of the IMASCAP acquisition, we have two zero interest loans with a state investment company that had an outstanding balance of $1.2 million at December 31, 2017. We also had shareholder debt outstanding of $1.6 million and $1.8 million as of December 31, 2017 and December 25, 2016, respectively. The remainder of other debt totals approximately $4.2 million and $1.0 million as of December 31, 2017 and December 25, 2016, respectively.
The shareholder debt was acquired in conjunction with the Wright/Tornier merger. This debt was the result of a 2008 transaction where a 51%-owned and consolidated subsidiary of legacy Tornier borrowed $2.2 million from a then-current member of the legacy Tornier board of directors, who was also a 49% owner of the consolidated subsidiary. This loan was used to partially fund the purchase of real estate in Grenoble, France, to be used as a manufacturing facility. Interest on the debt is variable-based on the three-month Euro Libor rate plus 0.5% and has no stated term.
120
Maturities
Aggregate annual maturities of our current and long-term obligations at December 31, 2017, excluding capital lease obligations and the ABL Facility, are as follows (in thousands):
2018 | $ | 1,737 | |
2019 | 1,048 | ||
2020 | 588,728 | ||
2021 | 395,840 | ||
2022 | 191 | ||
Thereafter | 2,959 | ||
$ | 990,503 | ||
The table set forth above excludes amounts borrowed under the ABL Facility. As described previously, all outstanding loans under the ABL Facility will be due and payable in full on December 23, 2021 or earlier under certain specified circumstances as previously described.
As discussed in Note 7, we have acquired certain property and equipment pursuant to capital leases. At December 31, 2017, future minimum lease payments under capital lease obligations, together with the present value of the net minimum lease payments, are as follows (in thousands):
2018 | $ | 4,371 | |
2019 | 4,334 | ||
2020 | 3,612 | ||
2021 | 2,718 | ||
2022 | 2,112 | ||
Thereafter | 6,543 | ||
Total minimum payments | 23,690 | ||
Less amount representing interest | (3,289 | ) | |
Present value of minimum lease payments | 20,401 | ||
Current portion | (3,524 | ) | |
Long-term portion | $ | 16,877 | |
10. Accumulated Other Comprehensive Income (AOCI)
Other comprehensive income (OCI) includes certain gains and losses that under US GAAP are included in comprehensive income but are excluded from net loss as these amounts are initially recorded as an adjustment to shareholders’ equity. Amounts in OCI may be reclassified to net loss upon the occurrence of certain events.
Our 2015, 2016, and 2017 OCI is comprised solely of foreign currency translation adjustments.
Changes in AOCI for the fiscal years ended December 27, 2015, December 25, 2016, and December 31, 2017 were as follows (in thousands):
Currency translation adjustment | |||
Balance December 31, 2014 | $ | 2,398 | |
Other comprehensive loss | (12,882 | ) | |
Balance December 27, 2015 | $ | (10,484 | ) |
Other comprehensive loss | (8,977 | ) | |
Balance December 25, 2016 | $ | (19,461 | ) |
Other comprehensive income | 41,751 | ||
Balance December 31, 2017 | $ | 22,290 | |
121
11. Income Taxes
The components of our loss from continuing operations before income taxes are as follows (in thousands):
Fiscal year ended | |||||||||||
December 31, 2017 | December 25, 2016 | December 27, 2015 | |||||||||
U.S. | $ | (56,808 | ) | $ | (140,190 | ) | $ | (225,473 | ) | ||
Foreign | (43,097 | ) | (38,150 | ) | (15,535 | ) | |||||
Loss from continuing operations before income taxes | $ | (99,905 | ) | $ | (178,340 | ) | $ | (241,008 | ) | ||
The components of our benefit for income taxes are as follows (in thousands):
Fiscal year ended | |||||||||||
December 31, 2017 | December 25, 2016 | December 27, 2015 | |||||||||
Current (benefit) provision: | |||||||||||
U.S.: | |||||||||||
Federal | $ | (23,781 | ) | $ | (1,971 | ) | $ | — | |||
State | 390 | (281 | ) | 255 | |||||||
Foreign | 2,214 | 3,860 | 562 | ||||||||
Total current (benefit) provision | (21,177 | ) | 1,608 | 817 | |||||||
Deferred (benefit) provision: | |||||||||||
U.S.: | |||||||||||
Federal | (5,098 | ) | 1,244 | (1,450 | ) | ||||||
State | (93 | ) | 142 | (166 | ) | ||||||
Foreign | (8,600 | ) | (16,400 | ) | (2,853 | ) | |||||
Total deferred benefit | (13,791 | ) | (15,014 | ) | (4,469 | ) | |||||
Total benefit for income taxes | $ | (34,968 | ) | $ | (13,406 | ) | $ | (3,652 | ) | ||
A reconciliation of the statutory U.S. federal income tax rate to our effective income tax rate for continuing operations is as follows:
Fiscal year ended | ||||||||
December 31, 2017 | December 25, 2016 | December 27, 2015 | ||||||
Income tax benefit at statutory rate | 35.0 | % | 35.0 | % | 35.0 | % | ||
State income taxes | 1.5 | % | 2.9 | % | 3.7 | % | ||
Change in valuation allowance | (3.5 | )% | (32.6 | )% | (36.5 | )% | ||
CVR fair market value adjustment | (1.9 | )% | (1.7 | )% | 1.1 | % | ||
Foreign income tax rate differential | (6.1 | )% | 3.3 | % | (0.9 | )% | ||
Changes in tax reserves | 2.9 | % | 0.8 | % | (0.1 | )% | ||
Effects of U.S. tax reform | 6.5 | % | — | % | — | % | ||
Other, net | 0.6 | % | (0.2 | )% | (0.6 | )% | ||
Total | 35.0 | % | 7.5 | % | 1.7 | % | ||
122
The significant components of our deferred income taxes as of December 31, 2017 and December 25, 2016 are as follows (in thousands):
Fiscal year ended | |||||||
December 31, 2017 | December 25, 2016 | ||||||
Deferred tax assets: | |||||||
Net operating loss carryforwards | $ | 283,708 | $ | 333,282 | |||
General business credit carryforwards | 12,993 | 5,671 | |||||
Reserves and allowances | 90,246 | 158,834 | |||||
Share-based compensation expense | 13,679 | 20,818 | |||||
Convertible debt notes and conversion options | 10,747 | 28,437 | |||||
Other | 1,642 | 1,173 | |||||
Valuation allowance | (366,825 | ) | (479,404 | ) | |||
Total deferred tax assets | 46,190 | 68,811 | |||||
Deferred tax liabilities: | |||||||
Depreciation | 6,383 | 10,055 | |||||
Intangible assets | 42,862 | 52,123 | |||||
Convertible notes bond hedges | 11,668 | 30,120 | |||||
Other | 120 | 2,565 | |||||
Total deferred tax liabilities | 61,033 | 94,863 | |||||
Net deferred tax liabilities | $ | (14,843 | ) | $ | (26,052 | ) | |
The 2017 Tax Act was enacted on December 22, 2017. The 2017 Tax Act includes a number of changes in existing tax law impacting businesses, including a one-time deemed repatriation of cumulative undistributed foreign earnings and a permanent reduction in the U.S. federal statutory rate from 35% to 21%. We recognized the income tax effects of the 2017 Tax Act in our 2017 financial statements in accordance with Staff Accounting Bulletin No. 118, which provides SEC staff guidance for the application of ASC Topic 740, Income Taxes, in the reporting period in which the 2017 Tax Act was signed into law. As such, our financial results include an approximate $6.6 million benefit resulting from the revaluation of our net deferred tax liabilities and reduction of our valuation allowance due to the change in the net operating loss carryforward period. Our analysis is complete with respect to these items. While we have included a provisional amount pertaining to the one-time deemed repatriation charge, there is no net income tax impact due to the valuation allowance provided on our U.S. deferred tax assets. Based on current guidance and interpretations, we did not identify other items for which the income tax effects of the 2017 Tax Act have not been completed and a reasonable estimate could not be determined as of December 31, 2017.
At December 31, 2017, we had net operating loss carryforwards for U.S. federal income tax purposes of approximately $960.0 million. The federal net operating losses begin to expire in 2018 and extend through 2037. State net operating loss carryforwards at December 31, 2017 totaled approximately $1.0 billion, which begin to expire in 2018 and extend through 2037. Additionally, we had general business credit carryforwards of approximately $13.0 million, which begin to expire in 2018 and extend through 2037. At December 31, 2017, we had foreign net operating loss carryforwards of approximately $137.0 million, $65.0 million of which do not expire and $72.0 million which begin to expire in 2018 and extend through 2026.
At December 31, 2017 and December 25, 2016, we had a valuation allowance of $367.0 million and $479.0 million, respectively, related to certain U.S. and foreign deferred tax assets. We realized a net decrease in the valuation allowance of $112.0 million during the fiscal year ended December 31, 2017, of which approximately $30.0 million was recognized as an income tax benefit. The net decrease was primarily due to recent U.S. tax reform and change in the realizability of certain U.S. deferred tax assets, offset by the valuation allowance on projected current year taxable losses. The ultimate realization of deferred tax assets is dependent upon the generation of future taxable income during the periods in which those temporary differences become deductible. Management considers the scheduled reversal of deferred tax liabilities (including the impact of available carryback and carryforward periods), projected future taxable income, and tax planning strategies in making this assessment. Based upon the levels of historical taxable income, projections of future taxable income and the reversal of deferred tax liabilities over the periods
123
in which the deferred tax assets are deductible, management believes it is more likely than not that we will realize the benefits of these deductible differences, net of the existing valuation allowance.
It is our current practice and intention to reinvest the earnings of our subsidiaries in those operations. Therefore, we do not provide for deferred taxes on the excess of the financial reporting over the tax basis in our investments in subsidiaries that are essentially permanent in duration. We would recognize a deferred income tax liability if we were to determine that such earnings are no longer indefinitely reinvested. Due to the number of tax jurisdictions involved, the complexity of our legal entity structure, and the complexity of the tax laws in the relevant jurisdictions, we believe it is not practicable to estimate the amount of additional taxes which may be payable upon distribution of these earnings, however it is not expected to be significant. Further, the 2017 Tax Act imposed a mandatory transition tax on accumulated foreign earnings of our U.S. controlled foreign subsidiaries and eliminates U.S. income taxes on distributions from U.S. controlled foreign subsidiaries.
As of December 31, 2017, our unrecognized tax benefits totaled approximately $6.0 million. The total amount of net unrecognized tax benefits that, if recognized, would affect the tax rate was approximately $3.0 million at December 31, 2017. Our 2015 U.S. federal income tax return and our 2012-2015 French corporate income tax returns are currently under audit by the respective tax authorities. It is, therefore, reasonably possible that our unrecognized tax benefits could change in the next twelve months as a result of settlements with taxing authorities as well as expirations of the statutes of limitations.
A reconciliation of the beginning and ending amount of unrecognized tax benefits is as follows (in thousands):
Fiscal year ended | |||||||
December 31, 2017 | December 25, 2016 | ||||||
Balance at beginning of fiscal year | $ | 8,095 | $ | 9,941 | |||
Additions for tax positions related to current year | 215 | 407 | |||||
Additions for tax positions of prior years | 20 | 721 | |||||
Reductions for tax positions of prior years | (3,174 | ) | (2,657 | ) | |||
Settlements | — | (74 | ) | ||||
Foreign currency translation | 869 | (243 | ) | ||||
Balance at end of fiscal year | $ | 6,025 | $ | 8,095 | |||
We accrue interest required to be paid by the tax law for the underpayment of taxes on the difference between the amount claimed or expected to be claimed on the tax return and the tax benefit recognized in the financial statements. Management has made the policy election to record this interest as interest expense and penalties, that if incurred, would be recognized as penalty expense within “Other expense (income)” on our consolidated statements of operations. As of December 31, 2017, accrued interest and penalties related to our unrecognized tax benefits totaled approximately $0.2 million.
We file numerous consolidated and separate company income tax returns in the United States and in many foreign jurisdictions. With few exceptions, we are subject to U.S. federal, state, and local income tax examinations for years 2014 through 2016. We are no longer subject to foreign income tax examinations by tax authorities in significant jurisdictions for years before 2012. However, U.S. and foreign tax authorities have the ability to review years prior to these to the extent that we utilize tax attributes carried forward from those prior years.
12. Other Balance Sheet Information
Other long-term liabilities consist of the following (in thousands):
124
Accrued expenses and other current liabilities consist of the following (in thousands):
December 31, 2017 | December 25, 2016 | ||||||
Employee bonuses | $ | 12,803 | $ | 28,791 | |||
Other employee benefits | 22,401 | 20,383 | |||||
Royalties | 12,563 | 8,534 | |||||
Taxes other than income | 8,933 | 19,559 | |||||
Commissions | 19,330 | 16,891 | |||||
Professional and legal fees | 12,388 | 11,031 | |||||
Contingent consideration (Note 6) | 1,168 | 1,330 | |||||
Product liability and other legal accruals (Note 16) | 151,027 | 264,827 | |||||
CVRs (Note 6) | 42,044 | — | |||||
Other | 31,901 | 36,358 | |||||
$ | 314,558 | $ | 407,704 | ||||
13. Capital Stock and Earnings Per Share
We are authorized to issue up to 320 million ordinary shares, each share with a par value of three Euro cents (€0.03). We had 105.8 million and 103.4 million ordinary shares issued and outstanding as of December 31, 2017 and December 25, 2016, respectively. As discussed in Note 3, the Wright/Tornier merger completed on October 1, 2015 has been accounted for as a “reverse acquisition” under US GAAP. As such, legacy Wright was considered the acquiring entity for accounting purposes; and therefore, legacy Wright’s historical results of operations replaced legacy Tornier’s historical results of operations for all periods prior to the merger. Additionally, each legacy Wright share was converted into the right to receive 1.0309 ordinary shares of the combined company and the par value was revised to reflect the €0.03 par value as compared to the legacy Wright par value of $0.01. As a result of the 2015 share conversion, the ordinary shares and APIC balances for the 2014 period included within the statements of shareholders' equity have been restated.
FASB ASC Topic 260, Earnings Per Share, requires the presentation of basic and diluted earnings per share. Basic earnings per share is calculated based on the weighted-average number of ordinary shares outstanding during the period. Diluted earnings per share is calculated to include any dilutive effect of our ordinary share equivalents. For the fiscal year ended December 31, 2017, our ordinary share equivalents consisted of stock options, restricted stock units, performance share units, and warrants. For the fiscal years ended December 25, 2016 and December 27, 2015, our ordinary share equivalents consisted of stock options, restricted stock units, and warrants. The dilutive effect of the stock options, restricted stock units, performance share units, and warrants is calculated using the treasury-stock method.
We had outstanding options to purchase 10.0 million ordinary shares, 1.3 million restricted stock units, and 0.1 million performance share units (assuming target performance) at December 31, 2017, options to purchase 10.4 million ordinary shares and 1.3 million restricted stock units at December 25, 2016, and options to purchase 9.9 million ordinary shares and 1.1 million restricted stock units at December 27, 2015. We had outstanding net-share settled warrants on the 2020 Notes of 19.6 million ordinary shares at December 31, 2017 and December 25, 2016 and 21.1 million ordinary shares at December 27, 2015. We also had net-share settled warrants on the 2021 Notes of 18.5 million ordinary shares at December 31, 2017 and December 25, 2016.
None of the options, restricted stock units, performance share units, or warrants were included in diluted earnings per share for the fiscal years ended December 31, 2017, December 25, 2016, and December 27, 2015 because we recorded a net loss for all periods; and therefore, including these instruments would be anti-dilutive.
The weighted-average number of ordinary shares outstanding for basic and diluted loss per share purposes is as follows (in thousands):
Fiscal year ended | ||||||||
December 31, 2017 | December 25, 2016 | December 27, 2015 | ||||||
Weighted-average number of ordinary shares outstanding — basic | 104,531 | 102,968 | 64,808 | |||||
Ordinary share equivalents | — | — | — | |||||
Weighted-average number of ordinary shares outstanding — diluted | 104,531 | 102,968 | 64,808 | |||||
125
14. Share-Based Compensation
We currently have two share-based compensation plans under which share-based awards may be granted - the Wright Medical Group N.V. 2017 Equity and Incentive Plan and the Wright Medical Group N.V. Amended and Restated Employee Stock Purchase Plan, which are described below. In addition, we have the Wright Medical Group N.V. Amended and Restated 2010 Incentive Plan and several legacy Wright and legacy Tornier share-based compensation plans and non-plan agreements under which stock options and restricted stock units are outstanding, but no future share-based awards may be granted.
Amounts recognized in the consolidated financial statements with respect to share-based compensation are as follows:
Fiscal year ended | |||||||||||
December 31, 2017 | December 25, 2016 | December 27, 2015 | |||||||||
Total cost of share-based arrangements | $ | 19,485 | $ | 14,406 | $ | 24,716 | |||||
Amounts capitalized into inventory | (669 | ) | (416 | ) | (51 | ) | |||||
Amortization of capitalized amounts | 577 | 426 | 299 | ||||||||
Impact to net loss | $ | 19,393 | $ | 14,416 | $ | 24,964 | |||||
Impact to basic and diluted loss per share 1 | $ | 0.19 | $ | 0.14 | $ | 0.39 | |||||
Weighted-average number of shares outstanding - basic and diluted 1 | 104,531 | 102,968 | 64,808 | ||||||||
1 | The 2015 balances were converted to meet post-merger valuations as described in Note 13. |
The compensation costs related to share-based awards were as follows:
Fiscal year ended | |||||||||||
December 31, 2017 | December 25, 2016 | December 27, 2015 | |||||||||
Stock options | $ | 8,988 | $ | 5,844 | $ | 15,985 | |||||
Restricted stock units and restricted stock awards | 9,373 | 8,416 | 8,731 | ||||||||
Performance share units | 441 | — | — | ||||||||
Employee stock purchase plan | 683 | 146 | — | ||||||||
Total compensation cost for share-based awards | $ | 19,485 | $ | 14,406 | $ | 24,716 | |||||
As of December 31, 2017, we had $44.3 million of total unrecognized share-based compensation cost related to unvested share-based compensation arrangements. This cost is expected to be recognized over a weighted-average period of 2.67 years.
On October 1, 2015, all stock options, restricted stock units and restricted stock awards outstanding as of the effective time of the Wright/Tornier merger automatically vested, resulting in $14.2 million in share-based compensation expense. Upon this acceleration, 1.3 million stock options vested with a weighted-average exercise price of $25.53 per share, and 0.3 million restricted stock units and restricted stock awards vested with a weighted-average grant-date fair value of $26.30 per share.
Equity Incentive Plans and Non-Plan Inducement Agreements
The Wright Medical Group N.V. 2017 Equity and Incentive Plan (the 2017 Plan) was approved by our shareholders on June 23, 2017. The 2017 Plan authorizes us to grant a wide variety of share-based and cash-based awards, including incentive and non-qualified stock options, stock appreciation rights, restricted stock awards, restricted stock units, performance awards, cash-based awards, and other share-based awards. To date, only stock options, restricted stock units (RSUs), and performance share units (PSUs) have been granted.
The options and RSUs granted to our employees generally have graded vesting periods of 4 years. The options granted to our non-executive directors have graded vesting period of 2 years and the RSUs granted to our non-executive directors cliff vest on the one-year anniversary of the date of grant. All options are granted with exercise prices equal to the closing price of our ordinary shares on the date of grant, as reported by the Nasdaq Global Select Market, and expire 10 years after the grant date. The PSUs granted to our executive officers cliff vest after a three-year performance period only if certain minimum pre-established performance criteria are achieved and the number shares issued upon vesting depends upon the level of achievement of the performance criteria, with a cap of 200% of target levels. The PSUs granted during the fiscal year ended December 31, 2017 were granted in the third quarter of 2017 and have a performance period from June 26, 2017 to June 28, 2020.
The 2017 Plan reserves for issuance a number of ordinary shares equal to the sum of (i) 5,000,000 shares; (ii) 1,329,648 shares, which was the number of shares available for grant under the Wright Medical Group N.V. Amended and Restated 2010 Incentive
126
Plan (the 2010 Plan) as of June 23, 2017, the date of shareholder approval of the 2017 Plan, but not subject to outstanding awards; and (iii) up to 6,405,992 shares subject to awards outstanding under the 2010 Plan as of June 23, 2017 that are subsequently forfeited or cancelled or expire or otherwise terminate without the issuance of such shares. As of December 31, 2017, 4,430,789 ordinary shares remained available for future grant of equity awards under the 2017 Plan.
As of December 31, 2017, there were 11,376,770 ordinary shares covering awards outstanding under all of our equity incentive plans, including the 2017 Plan, the 2010 Plan and legacy Wright and legacy Tornier plans and non-plan agreements. The legacy Wright and Tornier plans and non-plan agreements include the Wright Medical Group, Inc. 2009 Equity Incentive Plan, as amended and restated (the Legacy Wright 2009 Plan), the Wright Medical Group, Inc. 1999 Equity Incentive Plan, as amended and restated, the Tornier N.V. Stock Option Plan, as amended and restated, and four legacy Wright non-plan inducement option agreements. All of these plans and non-plan agreements were terminated with respect to future awards, and thus, no future share-based awards may be granted under any of these legacy plans and agreements.
No stock options or other share-based awards were granted under legacy Wright's share-based compensation plans during 2015 due to the then pending Wright/Tornier merger. All of the options issued under the legacy Wright plans and non-plan agreements expire after 10 years from the date of grant. All outstanding awards under the legacy Wright plans and non-plan agreements automatically vested on October 1, 2015 as a result of the Wright/Tornier merger; therefore, there are no restricted stock awards or RSUs outstanding at December 31, 2017 under these plans. However, there were 3,353,172 stock options outstanding as of December 31, 2017 under the legacy Wright plans and non-plan agreements.
Stock options
We estimate the fair value of stock options using the Black-Scholes valuation model. The Black-Scholes option-pricing model requires the input of estimates, including the expected life of stock options, expected stock price volatility, the risk-free interest rate and the expected dividend yield. Prior to the Wright/Tornier merger, the expected life of options was estimated based on historical option exercise and employee termination data. Post-merger, the expected life of options was estimated based on the simplified method due to a lack of comparable, historical option exercise and employee termination data for the combined company. The expected stock price volatility assumption was estimated based upon historical volatility of our ordinary shares for both legacy Wright and legacy Tornier prior to October 1, 2015 and for the combined company after the Wright/Tornier merger. The risk-free interest rate was determined using U.S. Treasury rates where the term is consistent with the expected life of the stock options. Expected dividend yield is not considered as we have never paid dividends and have no plans of doing so in the future. We are required to estimate forfeitures at the time of grant and revise those estimates in subsequent periods if actual forfeitures differ from those estimates. We use historical data to estimate pre-vesting forfeitures and record share-based compensation expense only for those awards that are expected to vest. The fair value of stock options is amortized on a straight-line basis over the respective requisite service period, which is generally the vesting period.
The weighted-average grant date fair value of stock options granted to employees in 2017, 2016, and 2015 was $9.80 per share, $7.36 per share, and $7.05 per share, respectively. The fair value of each option grant is estimated on the date of grant using the Black-Scholes option valuation model using the following assumptions:
Fiscal year ended | |||||
December 31, 2017 | December 25, 2016 | December 27, 2015 | |||
Risk-free interest rate | 1.9% - 2.0% | 1.1% - 1.4% | 1.4% - 1.6% | ||
Expected option life | 6 years | 6 years | 6 years | ||
Expected price volatility | 33% | 34% | 33% | ||
During 2017, 2016, and 2015, we did not grant any stock options to non-employees (other than our non-executive directors who received such grants in consideration of their director service).
127
A summary of our stock option activity during 2017 is as follows:
Shares (000’s) | Weighted-average exercise price | Weighted-average remaining contractual life | Aggregate intrinsic value* ($000’s) | ||||||||
Outstanding at December 25, 2016 | 9,488 | $ | 21.70 | ||||||||
Granted | 1,335 | 27.84 | |||||||||
Exercised | (1,243) | 20.42 | |||||||||
Forfeited or expired | (466) | 22.49 | |||||||||
Outstanding at December 31, 2017 | 9,114 | $ | 22.73 | 6.61 | $ | 11,070 | |||||
Exercisable at December 31, 2017 | 5,862 | $ | 22.24 | 5.44 | $ | 8,501 | |||||
________________________________
* | The aggregate intrinsic value is calculated as the difference between the market value of our ordinary shares as of December 31, 2017 and the respective exercise prices of the options. The market value as of December 31, 2017 was $22.20 per share, which is the closing sale price of our ordinary shares on December 29, 2017, the last trading day prior to December 31, 2017, as reported by the Nasdaq Global Select Market. |
The total intrinsic value of options exercised during 2017, 2016, and 2015 was $9.1 million, $2.1 million, and $0.4 million, respectively.
A summary of our stock options outstanding and exercisable at December 31, 2017 is as follows (shares in thousands):
Options outstanding | Options exercisable | |||||||||||||||
Range of exercise prices | Number outstanding | Weighted-average remaining contractual life | Weighted-average exercise price | Number exercisable | Weighted-average exercise price | |||||||||||
$2.00 — $20.00 | 1,153 | 4.33 | $ | 17.43 | 1,128 | $ | 17.41 | |||||||||
$20.01 — $21.00 | 2,504 | 7.14 | 20.64 | 1,531 | 20.65 | |||||||||||
$21.01 — $25.00 | 3,002 | 6.58 | 22.08 | 2,021 | 22.49 | |||||||||||
$25.01 — $32.00 | 2,455 | 7.17 | 28.15 | 1,182 | 28.49 | |||||||||||
9,114 | 6.61 | $ | 22.73 | 5,862 | $ | 22.24 | ||||||||||
Restricted stock units and restricted stock awards
We calculate the grant date fair value of RSUs using the closing sale price of our ordinary shares on the grant date, as reported by the Nasdaq Global Select Market. We are required to estimate forfeitures at the time of grant and revise those estimates in subsequent periods if actual forfeitures differ from those estimates. We use historical data to estimate pre-vesting forfeitures and record share-based compensation expense only for those awards that are expected to vest.
During 2017, 2016, and 2015, we granted 0.5 million, 0.7 million, 1.1 million RSUs to employees with weighted-average grant-date fair values of $27.83, $21.17, and $20.60 per share, respectively. The fair value of the unvested restricted stock units granted after completion of the Wright/Tornier merger will be recognized on a straight-line basis over the respective requisite service period, which is generally the vesting period.
During 2017, 2016, and 2015, we did not grant any RSUs to non-employees (other than our non-executive directors who received such grants in consideration of their director service).
128
A summary of our RSU activity during 2017 is as follows:
Shares (000’s) | Weighted-average grant-date fair value | Aggregate intrinsic value* ($000’s) | ||||||||
Unvested at December 25, 2016 | 1,335 | $ | 20.91 | |||||||
Granted | 493 | 27.83 | ||||||||
Vested | (404 | ) | 20.91 | |||||||
Forfeited | (144 | ) | 22.02 | |||||||
Unvested at December 31, 2017 | 1,280 | $ | 23.45 | $ | 28,407 | |||||
___________________
* | The aggregate intrinsic value is calculated as the market value of our ordinary shares as of December 31, 2017. The market value as of December 31, 2017 was $22.20 per share, which is the closing sale price of our ordinary shares on December 29, 2017, the last trading day prior to December 31, 2017, as reported by the Nasdaq Global Select Market. |
The total fair value of shares underlying RSUs and restricted stock awards vested during 2017, 2016, and 2015 was $9.0 million, $7.0 million, and $11.8 million, respectively.
Performance share units
We calculate the grant date fair value of PSUs as the closing sale price of our ordinary shares on the grant date, as reported by the Nasdaq Global Select Market. Share-based compensation expense associated with outstanding PSUs is measured using the grant date fair value and is based on the estimated achievement of the established performance criteria at the end of each reporting period until the performance period ends, recognized on a straight-line basis over the performance period. Share-based compensation expense is only recognized for PSUs that we expect to vest, which we estimate based upon an assessment of the probability that the performance criteria will be achieved. The PSUs granted during the fiscal year ended December 31, 2017 have a three-year performance-based metric measured over a performance period from June 26, 2017 to June 28, 2020. Share-based compensation expense associated with outstanding PSUs is updated for actual forfeitures.
During 2017, we granted 0.1 million PSUs (based on an assumed target level of performance) to employees with a weighted-average grant-date fair value of $27.86 per share. During 2017, we did not grant any PSUs to non-employees.
A summary of our PSU activity during 2017 is as follows:
Shares (000’s) | Weighted-average grant-date fair value | Aggregate intrinsic value* ($000’s) | ||||||||
Unvested at December 25, 2016 | — | — | ||||||||
Granted | 114 | 27.86 | ||||||||
Vested | — | — | ||||||||
Forfeited | (6 | ) | 27.86 | |||||||
Unvested at December 31, 2017 | 108 | $ | 27.86 | $ | 2,407 | |||||
___________________
* | The aggregate intrinsic value is calculated as the market value of our ordinary shares as of December 31, 2017. The market value as of December 31, 2017 was $22.20 per share, which is the closing sale price of our ordinary shares on December 29, 2017, the last trading day prior to December 31, 2017, as reported by the Nasdaq Global Select Market. |
Non-plan inducement stock options
On occasion, legacy Wright granted stock options under a non-plan inducement stock option agreement, in order to induce a candidate to commence employment with legacy Wright as a member of the executive management team. These options, which are fully vested, vested over a service period ranging from 3 to 4 years. All of the options granted under these non-plan agreements will expire 10 years from the date of grant.
129
A summary of our non-plan inducement stock option activity during 2017 is as follows:
Shares (000’s) | Weighted-average exercise price | Weighted-average remaining contractual life | Aggregate intrinsic value* ($000’s) | |||||||||
Outstanding at December 25, 2016 | 917 | $ | 16.69 | |||||||||
Granted | — | — | ||||||||||
Exercised | (42 | ) | 20.61 | |||||||||
Forfeited or expired | — | — | ||||||||||
Outstanding at December 31, 2017 | 875 | $ | 16.50 | 3.9 | $ | 4,986 | ||||||
Exercisable at December 31, 2017 | 875 | $ | 16.50 | 3.9 | $ | 4,986 | ||||||
________________________________
* | The aggregate intrinsic value is calculated as the difference between the market value of our ordinary shares as of December 31, 2017 and the respective exercise prices of the options. The market value as of December 31, 2017 was $22.20 per share, which is the closing sale price of our ordinary shares on December 29, 2017, the last trading day prior to December 31, 2017, as reported by the Nasdaq Global Select Market. |
A summary of our non-plan inducement stock options outstanding and exercisable at December 31, 2017 is as follows (shares in thousands):
Options outstanding | Options exercisable | |||||||||||||||
Range of exercise prices | Number outstanding | Weighted-average remaining contractual life | Weighted-average exercise price | Number exercisable | Weighted-average exercise price | |||||||||||
$2.00 — $16.00 | 696 | 3.7 | $ | 15.57 | 696 | $ | 15.57 | |||||||||
$16.01 — $32.00 | 179 | 4.7 | 20.12 | 179 | 20.12 | |||||||||||
875 | 3.9 | $ | 16.50 | 875 | $ | 16.50 | ||||||||||
Employee Stock Purchase Plan
The Wright Medical Group N.V. Amended and Restated Employee Stock Purchase Plan (the ESPP), which is an amended and restated version of the Tornier N.V. 2010 Employee Stock Purchase Plan, was approved by our shareholders on June 28, 2016. Under the ESPP, we are authorized to issue and sell up to the sum of (i) 333,333 ordinary shares registered previously under the Tornier N.V. 2010 Employee Stock Purchase Plan and (ii) 216,227 additional ordinary shares approved under the ESPP. The total of 550,000 ordinary shares are authorized to be issued to employees of our company and certain designated subsidiaries who work at least 20 hours per week. Under the ESPP, there are two six-month offering periods during each calendar year, one beginning January 1 and ending on June 30, and the other beginning July 1 and ending on December 31. However the compensation committee of the board of directors determined that the first offering period would be the three months beginning October 1, 2016 and ending December 31, 2016. Under the terms of the ESPP, each eligible employee can choose each offering period to have up to 20% of his or her eligible earnings withheld to purchase up to 1,000 ordinary shares. The purchase price of the shares is 85% of the market price on the first or last trading day of the offering period, whichever is lower. As of December 31, 2017, there were 434,293 ordinary shares available for future issuance under the ESPP.
Under the ESPP, the first offering period purchase occurred on December 31, 2016, which was during the 2017 fiscal year.
In applying the Black-Scholes methodology to purchase rights granted under the ESPP, we used the following assumptions:
Fiscal year ended | |||
December 31, 2017 | December 25, 2016 | ||
Risk-free interest rate | 1.3% - 1.9% | 1.2% - 1.3% | |
Expected life | 6 months | 3 months | |
Expected price volatility | 24% | 33% | |
15. Retirement Benefit Plans
During the fiscal year ended December 31, 2017 and December 25, 2016, we offered a defined contribution retirement benefit plan for our U.S. based employees. Our defined contribution plan under Section 401(k) of the Internal Revenue Code of 1986,
130
as amended (Code), covers U.S. employees who are 18 years of age and over. Under this plan, we have elected to make matching contributions to all eligible participants in an amount equal to 100% of the first three percent of eligible compensation, and 50% of the next two percent of eligible compensation, contributed to the Plan as deferral contributions. Employees are 100% vested in their rollover contributions, employer non-elective contributions, employer matching contributions, qualified non-elective contributions, deferral contributions, safe harbor matching employer contributions and any earnings thereon. The expense related to this plan recognized within our results from continuing operations was $5.5 million in 2017 and $4.9 million in 2016.
Prior to 2016, we offered one plan sponsored by legacy Wright and another sponsored by legacy Tornier. Expense related to the Legacy Wright defined contribution plan recognized within our results from continuing operations was $2.5 million in 2015. Expense related to the Legacy Tornier qualified defined contribution plan recognized within our results from continuing operations was $0.2 million in 2015.
16. Commitments and Contingencies
Operating Leases
We lease certain equipment and office space under non-cancelable operating leases. Rental expense under operating leases approximated $8.9 million, $10.5 million, and $8.6 million for the fiscal years ended December 31, 2017, December 25, 2016, and December 27, 2015, respectively. Future minimum payments, by year and in the aggregate, under non-cancelable operating leases with initial or remaining lease terms of one year or more, are as follows at December 31, 2017 (in thousands):
2018 | $ | 8,076 | |
2019 | 7,196 | ||
2020 | 5,713 | ||
2021 | 4,833 | ||
2022 | 3,292 | ||
Thereafter | 5,774 | ||
$ | 34,884 | ||
Portions of our payments for operating leases are denominated in foreign currencies and were translated in the table above based on their respective U.S. dollar exchange rates at December 31, 2017. These future payments are subject to foreign currency exchange rate risk.
Purchase Obligations
We have entered into certain supply agreements for our products which include minimum purchase obligations. As of December 31, 2017, we have minimum purchase obligations of $3 million for 2018.
Legal Contingencies
The legal contingencies described in this footnote relate primarily to WMT, an indirect subsidiary of Wright Medical Group N.V., and are not necessarily applicable to Wright Medical Group N.V. or other affiliated entities. Maintaining separate legal entities within our corporate structure is intended to ring-fence liabilities. We believe our ring-fenced structure should preclude corporate veil-piercing efforts against entities whose assets are not associated with particular claims.
As described below, our business is subject to various contingencies, including patent and other litigation, product liability claims, and a government inquiry. These contingencies could result in losses, including damages, fines, or penalties, any of which could be substantial, as well as criminal charges. Although such matters are inherently unpredictable, and negative outcomes or verdicts can occur, we believe we have significant defenses in all of them, and are vigorously defending all of them. However, we could incur judgments, pay settlements, or revise our expectations regarding the outcome of any matter. Such developments, if any, could have a material adverse effect on our results of operations in the period in which applicable amounts are accrued, or on our cash flows in the period in which amounts are paid, however, unless otherwise indicated, we do not believe any of them will have a material adverse effect on our financial position.
Our legal contingencies are subject to significant uncertainties and, therefore, determining the likelihood of a loss or the measurement of a loss can be complex. We have accrued for losses that are both probable and reasonably estimable. Unless otherwise indicated, we are unable to estimate the range of reasonably possible loss in excess of amounts accrued. Our assessment process relies on estimates and assumptions that may prove to be incomplete or inaccurate. Unanticipated events and circumstances may occur that could cause us to change our estimates and assumptions.
131
Governmental Inquiries
On August 3, 2012, we received a subpoena from the United States Attorney's Office for the Western District of Tennessee requesting records and documentation relating to our PROFEMUR® series of hip replacement devices. The subpoena covers the period from January 1, 2000 to August 2, 2012. We will continue to cooperate as required.
Patent Litigation
On September 23, 2014, Spineology filed a patent infringement lawsuit, Case No. 0:14-cv-03767, in the U.S. District Court in Minnesota, alleging that our X-REAM® bone reamer infringes U.S. Patent No. RE42,757 entitled “EXPANDABLE REAMER.” In January 2015, on the deadline for service of its complaint, Spineology dismissed its complaint without prejudice and filed a new, identical complaint. We filed an answer to the new complaint with the Court on April 27, 2015. The Court conducted a Markman hearing on March 23, 2016. Mediation was held on August 11, 2016, but no agreement could be reached. The Court issued a Markman decision on August 30, 2016, in which it found all asserted product claims invalid as indefinite under applicable patent laws and construed several additional claim terms. The parties completed fact and expert discovery with respect to the remaining asserted method claims. We filed a motion for summary judgment of non-infringement of the remaining asserted patent claims and motions to exclude testimony from Spineology’s technical and damages experts. Spineology filed a motion for summary judgment of infringement. On July 25, 2017, the Court granted our motion for summary judgment of non-infringement; denied Spineology’s motion for summary judgment of infringement; and denied all remaining motions as moot. The Court also entered judgment in our favor and against Spineology on all issues. Spineology has appealed the judgment to the U.S. Court of Appeals for the Federal Circuit and we are awaiting oral argument.
On September 13, 2016, we filed a civil action, Case No. 2:16-cv-02737-JPM, against Spineology in the U.S. District Court for the Western District of Tennessee alleging breach of contract, breach of implied warranty against infringement, and seeking a judicial declaration of indemnification from Spineology for patent infringement claims brought against us stemming from our sale and/or use of certain expandable reamers purchased from Spineology. Spineology filed a motion to dismiss on October 17, 2016, but withdrew the motion on November 28, 2016. On December 7, 2016, Spineology filed an answer to our complaint and counterclaims, including counterclaims relating to a 2004 non-disclosure agreement between Spineology and WMT. On December 28, 2016, we filed a motion to dismiss the counterclaims relating to that 2004 agreement. On January 4, 2017, Spineology filed a motion for summary judgment on certain claims set forth in our complaint. We opposed that motion. On January 27, 2017, we filed a motion for summary judgment on certain issues pertaining to our indemnification claims. Spineology opposed that motion. On July 7, 2017, the Court extended the deadlines for completing discovery until after it ruled on those pending motions. On August 29, 2017, the Court ruled on the motions to dismiss and for summary judgment. In view of that decision, on September 22, 2017, the parties stipulated to, and the Court entered, a judgment that effectively ended the case in a draw. We have appealed the judgment as to our claims against Spineology to the U.S. Court of Appeals for the Sixth Circuit. Spineology did not appeal the District Court’s dismissal of its contract counterclaim.
In August 2016, we received a letter from KFx alleging that a legacy Tornier product (the Piton Suture Anchor) infringes one of KFx’s patents when used in knotless double row tissue fixation techniques. On April 6, 2017, we filed a declaratory judgment action in the United States District Court for the District of Delaware, Case No. 1:17-cv-00384, seeking declaratory judgment of non-infringement and invalidity of United States Patent Nos. 7,585,311; 8,100,942; and 8,109,969. On April 20, 2017, KFx filed an answer and counterclaim alleging we indirectly infringe, and induce infringement of, these patents. In February 2018, the parties reached a settlement in principle intended to fully resolve the matter and end the litigation. Under the settlement in principle, we will pay KFx a one-time lump sum license fee in an immaterial amount in exchange for a fully paid global license to the relevant KFx patents. The settlement is presently being documented.
Product Liability
We have received claims for personal injury against us associated with fractures of our PROFEMUR® long titanium modular neck product (PROFEMUR® Claims). As of December 31, 2017 there were approximately 30 pending U.S. lawsuits and approximately 60 pending non-U.S. lawsuits alleging such claims. The overall fracture rate for the product is low and the fractures appear, at least in part, to relate to patient demographics. Beginning in 2009, we began offering a cobalt-chrome version of our PROFEMUR® modular neck, which has greater strength characteristics than the alternative titanium version. Historically, we have reflected our liability for these claims as part of our standard product liability accruals on a case-by-case basis. However, during the fiscal quarter ended September 30, 2011, as a result of an increase in the number and monetary amount of these claims, management estimated our liability to patients in the United States and Canada who have previously required a revision following a fracture of a PROFEMUR® long titanium modular neck, or who may require a revision in the future. Management has estimated that this aggregate liability is $21.5 million. We have classified $12.0 million of this liability as current in “Accrued expenses and other current liabilities,” as we expect to pay such claims within the next twelve months, and $9.5 million as non-current in “Other
132
liabilities” on our consolidated balance sheet. We expect to pay the majority of these claims within the next three years. Any claims associated with this product outside of the United States and Canada, or for any other products, will be managed as part of our standard product liability accrual methodology on a case-by-case basis.
We are aware that MicroPort has recalled certain sizes of its cobalt chrome modular neck products as a result of alleged fractures. As of December 31, 2017, there were four pending U.S. lawsuits and eight pending non-U.S. lawsuits against us alleging personal injury resulting from the fracture of a cobalt chrome modular neck. These claims will be managed as part of our standard product liability accrual methodology on a case-by-case basis. On October 27, 2017, our primary insurance carrier agreed to defend us in connection with these lawsuits under a reservation of rights.
We have maintained product liability insurance coverage on a claims-made basis. During the fiscal quarter ended March 31, 2013, we received a customary reservation of rights from our primary product liability insurance carrier asserting that present and future claims related to fractures of our PROFEMUR® titanium modular neck hip products and which allege certain types of injury (Titanium Modular Neck Claims) would be covered as a single occurrence under the policy year the first such claim was asserted. The effect of this coverage position would be to place Titanium Modular Neck Claims into a single prior policy year in which applicable claims-made coverage was available, subject to the overall policy limits then in effect. Management agrees with the assertion that the Titanium Modular Neck Claims should be treated as a single occurrence, but notified the carrier that it disputed the carrier's selection of available policy years. During the second quarter of 2013, we received confirmation from the primary carrier confirming their agreement with our policy year determination. Based on our insurer's treatment of Titanium Modular Neck Claims as a single occurrence, we increased our estimate of the total probable insurance recovery related to Titanium Modular Neck Claims by $19.4 million, and recognized such additional recovery as a reduction to our selling, general and administrative expenses for the fiscal quarter ended March 31, 2013, within results of discontinued operations. In the fiscal quarter ended June 30, 2013, we received payment from the primary insurance carrier of $5 million. In the fiscal quarter ended September 30, 2013, we received payment of $10 million from the next insurance carrier in the tower. We have requested, but not yet received, payment of the remaining $25 million from the third insurance carrier in the tower for that policy period. The policies with the second and third carrier in this tower are “follow form” policies and management believes the third carrier should follow the coverage position taken by the primary and secondary carriers. On September 29, 2015, that third carrier asserted that the terms and conditions identified in its reservation of rights will preclude coverage for the Titanium Modular Neck Claims. Pursuant to applicable accounting standards, we reduced our insurance receivable balance for this claim to $0, and recorded a $25 million charge within “Net loss from discontinued operations” during the fiscal year ended December 27, 2015. We strongly dispute the carrier's position and, in accordance with the dispute resolution provisions of the policy, have initiated an arbitration proceeding in London, England seeking payment of these funds. The arbitration proceeding was completed on February 15, 2018 and the parties await the decision of the arbitration tribunal.
Claims for personal injury have also been made against us associated with our metal-on-metal hip products (primarily our CONSERVE® product line). The pre-trial management of certain of these claims has been consolidated in the federal court system, in the United States District Court for the Northern District of Georgia under the MDL and certain other claims by the JCCP in state court in Los Angeles County, California (collectively the Consolidated Metal-on-Metal Claims).
As of December 31, 2017, there were approximately 800 lawsuits pending in the MDL and JCCP, and an additional 50 cases pending in various U.S. state courts. As of that date, we have also entered into approximately 700 so called “tolling agreements” with potential claimants who have not yet filed suit. The number of lawsuits pending in the MDL and JCCP and tolling agreements disclosed above includes the claims that have been resolved pursuant to the Master Settlement Agreement and Second Settlement Agreements discussed below. Based on presently available information, we believe approximately 300 of these matters allege claims involving bilateral implants. As of December 31, 2017, there were also approximately 50 non-U.S. lawsuits pending. We believe we have data that supports the efficacy and safety of our metal-on-metal hip products.
Every metal-on-metal hip case involves fundamental issues of law, science and medicine that often are uncertain, that continue to evolve, and which present contested facts and issues that can differ significantly from case to case. Such contested facts and issues include medical causation, individual patient characteristics, surgery specific factors, statutes of limitation, and the existence of actual, provable injury.
The first bellwether trial in the MDL commenced on November 9, 2015 in Atlanta, Georgia. On November 24, 2015, the jury returned a verdict in favor of the plaintiff and awarded the plaintiff $1 million in compensatory damages and $10 million in punitive damages. We believe there were significant trial irregularities and vigorously contested the trial result. On December 28, 2015, we filed a post-trial motion for judgment as a matter of law or, in the alternative, for a new trial or a reduction of damages awarded. On April 5, 2016, the trial judge issued an order reducing the punitive damage award from $10 million to $1.1 million, but otherwise denied our motion. On May 4, 2016, we filed a notice of appeal with the United States Court of Appeals for the Eleventh Circuit.
133
The United States Court of Appeals for the Eleventh Circuit heard oral arguments on January 26, 2017 and on March 20, 2017, the Eleventh Circuit Court of Appeals upheld the lower court’s verdict. On April 10, 2017, we filed a petition for rehearing en banc or for panel rehearing, which was denied. In light of this denial, we elected to forego a further appeal and paid the judgment in July 2017.
The first bellwether trial in the JCCP, which was scheduled to commence on October 31, 2016, and subsequently rescheduled to January 9, 2017, was settled for an immaterial amount.
The first state court metal-on-metal hip trial not part of the MDL or JCCP commenced on October 24, 2016, in St. Louis, Missouri. On November 3, 2016, the jury returned a verdict in our favor. The plaintiff appealed and the appellate court heard oral argument on November 8, 2017. On February 20, 2018, the Missouri Court of Appeals, Eastern District, denied the plaintiff’s appeal and upheld the verdict of the trial court.
On November 1, 2016, WMT entered into the MSA with Court-appointed attorneys representing plaintiffs in the MDL and JCCP. Under the terms of the MSA, the parties agreed to settle 1,292 specifically identified claims associated with CONSERVE®, DYNASTY® and LINEAGE® products that meet the eligibility requirements of the MSA and are either pending in the MDL or JCCP, or subject to court-approved tolling agreements in the MDL or JCCP, for a settlement amount of $240 million.
The $240 million settlement amount is a maximum settlement based on the pool of 1,292 specific, existing claims comprised of an identified mix of CONSERVE®, DYNASTY® and LINEAGE® products (Initial Settlement Pool), with a value assigned to each product type, resulting in a total settlement of $240 million for the 1,292 claims in the Initial Settlement Pool.
Actual settlements paid to individual claimants are determined under the claims administration procedures contained in the MSA and may be more or less than the amounts used to calculate the $240 million settlement for the 1,292 claims in the Initial Settlement Pool. However in no event will variations in actual settlement amounts payable to individual claimants affect WMT’s maximum settlement obligation of $240 million or the manner in which it may be reduced due to opt outs, final product mix, or elimination of ineligible claims.
If it is determined a claim in the Initial Settlement Pool is ineligible due to failure to meet the eligibility criteria of the MSA, such claim will be removed and, where possible, replaced with a new eligible claim involving the same product, with the goal of having the number and mix of claims in the final settlement pool (before opt-outs) (Final Settlement Pool) equal, as nearly as possible, the number and mix of claims in the Initial Settlement Pool. Additionally, if any DYNASTY® or LINEAGE® claims in the Final Settlement Pool are determined to have been misidentified as CONSERVE® claims, or vice versa, the total settlement amount will be adjusted based on the value for each product type (not to exceed $240 million).
The MSA contains specific eligibility requirements and establishes procedures for proof and administration of claims, negotiation and execution of individual settlement agreements, determination of the final total settlement amount, and funding of individual settlement amounts by WMT. Eligibility requirements include, without limitation, that the claimant has a claim pending or tolled in the MDL or JCCP, that the claimant has undergone a revision surgery within eight years of the original implantation surgery, and that the claim has not been identified by WMT as having possible statute of limitation issues. Claimants who have had bilateral revision surgeries will be counted as two claims but only to the extent both claims separately satisfy all eligibility criteria.
The MSA includes a 95% opt-in requirement, meaning the MSA could have been terminated by WMT prior to any settlement disbursement if claimants holding greater than 5% of eligible claims in the Final Settlement Pool elected to “opt-out” of the settlement. WMT has confirmed that of the 1,292 eligible claims, 1,279 opted to participate in the settlement and 13 opted out, resulting in a final opt-in percentage of approximately 99%, well in excess of the required 95% threshold. On March 2, 2017, WMT agreed to replace the 13 opt-out claims with 13 additional claims that would have been eligible to participate in the MSA but for the 1,292 claim limit, bringing the total MSA settlement to the maximum limit of $240 million to settle 1,292 claims. Due to apparent demand from additional claimants excluded from settlement because of the 1,292 claims ceiling, but otherwise eligible for participation, on May 15, 2017 WMT agreed to settle an additional 53 such claims, on terms substantially identical to the MSA settlement terms, for a maximum additional settlement amount of $9.4 million.
During 2016 WMT escrowed $150 million to secure its obligations under the MSA, all of which had been paid as of December 31, 2017. As additional security, Wright Medical Group N.V., the indirect parent company of WMT, agreed to guarantee WMT’s obligations under the MSA.
On October 3, 2017, WMT entered into the Second Settlement Agreements with the Court-appointed attorneys representing plaintiffs in the MDL and JCCP. Under the terms of the Second Settlement Agreements, the parties agreed to settle 629 specifically identified CONSERVE®, DYNASTY® and LINEAGE® claims that meet the eligibility requirements of the Second Settlement Agreements and are either pending in the MDL or JCCP, or subject to court-approved tolling agreements in the MDL or JCCP,
134
for a maximum settlement amount of $89.75 million. The comprehensive settlement amount was contingent on WMT’s recovery of new insurance proceeds totaling at least $35 million from applicable insurance carriers by December 31, 2017. On December 29, 2017, WMT entered into a First Amendment to the Third Settlement Agreement pursuant to which the deadline for the recovery of new insurance proceeds totaling at least $35 million from applicable insurance carriers was extended through February 28, 2018 and, on February 23, 2018, WMT entered into a Second Amendment to the Third Settlement Agreement pursuant to which the deadline was extended through March 30, 2018. To date, certain of the insurance carriers have contributed or agreed to contribute $20 million of funds applicable against the contingency.
The $89.75 million settlement amount is a maximum settlement based on the pool of 629 specific, existing claims comprised of an identified mix of CONSERVE®, DYNASTY® and LINEAGE® products (Second Settlement Initial Settlement Pool), with a value assigned to each product type. The actual settlement may be less, but not more, depending on several factors including the mix of products and claimants in the final settlement pool (Second Settlement Final Settlement Pool) and the number of claimants electing to “opt-out” of the settlement.
The total maximum settlement amount of $89.75 million is allocated among the following three tranches: (1) Tranche 1: $7.9 million to settle 49 additional claims that would have been eligible to participate in the MSA but for the claim limit contained therein, which amount will be funded as such claims are settled; (2) Tranche 2: $5.1 million to settle 39 eligible claims of the oldest claimants (by age), which amount will be funded as such claims are settled; and (3) Tranche 3: $76.75 million to settle 511 eligible claims pending or tolled in the MDL and JCCP existing as of June 30, 2017, and 30 new eligible claims which were presented between July 1, 2017 and October 1, 2017, which amount will be funded as follows: $45 million by June 30, 2018 and $31.75 million by September 30, 2019. Actual funding may extend beyond these dates pending completion of claims administration processes. The Tranche 3 settlement is contingent upon WMT receiving at least $35 million of new insurance proceeds from applicable carriers by March 30, 2018. There is no contingency with respect to Tranches 1 and 2.
Actual settlements paid to individual claimants will be determined under the claims administration procedures contained in the Second Settlement Agreements and may be more or less than the amounts used to calculate the $89.75 million settlement for the 629 claims in the Second Settlement Initial Settlement Pool. However in no event will variations in actual settlement amounts payable to individual claimants affect WMT’s maximum settlement obligation of $89.75 million or the manner in which it may be reduced due to opt outs, final product mix, or elimination of ineligible claims.
If it is determined that a claim in the Second Settlement Initial Settlement Pool is ineligible due to failure to meet the eligibility criteria of the Second Settlement Agreements, such claim will be removed and, where possible, replaced with a new eligible claim involving the same products as the removed claim.
The Second Settlement Agreements contain specific eligibility requirements and establish procedures for proof and administration of claims, negotiation and execution of individual settlement agreements, determination of the final total settlement amount, and funding of individual settlement amounts by WMT. Eligibility requirements include, without limitation, that the claimant has a claim pending or tolled in the MDL or JCCP and that, with limited exceptions, the claimant has undergone a revision surgery. Claimants who have had bilateral revision surgeries will be counted as two claims but only to the extent both claims separately satisfy all eligibility criteria.
Each of the Second Settlement Agreements includes a 95% opt-in requirement, meaning WMT may terminate either Settlement Agreement prior to any settlement disbursement if claimants holding greater than 5% of eligible claims in Tranches 1 and 2, collectively, or claimants holding greater than 5% of eligible claims in Tranche 3 in the Second Settlement Final Settlement Pool, elect to “opt-out” of the settlement. On January 2, 2018, WMT received notification that 100% of the claimants in Tranches 1 and 2 opted-in. WMT is currently reviewing proof of claim documentation for these claimants and has until March 2, 2018 to confirm that the 95% opt-in requirement has been met. Claimants in Tranche 3 have until April 2, 2018 to opt into the Second Settlement Agreements.
While the Second Settlement Agreements did not require WMT to escrow any amount to secure its obligations thereunder, as additional security, Wright Medical Group N.V., the indirect parent company of WMT, agreed to guarantee WMT’s obligations under the Second Settlement Agreements.
The MSA (which reference includes the supplemental settlements described above) and the Second Settlement Agreements were entered into solely as a compromise of the disputed claims being settled and are not evidence that any claim has merit nor are they an admission of wrongdoing or liability by WMT. WMT will continue to vigorously defend metal-on-metal hip claims not settled pursuant to the above agreements. The Second Settlement Agreements are contingent upon the dismissal without prejudice of pending and tolled claims in the MDL and JCCP that do not meet the inclusion criteria of the MDL or JCCP. Additionally, the Second Settlement Agreements are contingent upon the dismissal without prejudice of all remaining non-revision claims in the
135
MDL and JCCP, pursuant to a tolling agreement that tolls applicable statutes of limitation and repose for three months from a revision of the products or determination that a revision of the products is necessary. The MDL and JCCP courts have both entered orders closing these proceedings to new claims.
As of December 31, 2017, we estimate there were approximately 50 outstanding metal-on-metal hip revision claims that were not included in the MSA or Second Settlement Agreements, approximately 50 claims pending in U.S courts other than the MDL and JCCP, and approximately 50 claims pending in non-U.S. courts. We also estimate that there were approximately 600 outstanding metal-on-metal hip non-revision claims as of December 31, 2017. These non-revision cases were excluded from the MSA and Second Settlement Agreements. As a result of entering into the Second Settlement Agreements during the third quarter of 2017, we recorded an additional accrual of $82.7 million for the 629 matters included within the settlement and for matters that have the same eligibility criteria.
As of December 31, 2017, our accrual for metal-on-metal claims totaled $177.5 million, of which $127.4 million is included in our consolidated balance sheet within “Accrued expenses and other current liabilities” and $50.1 million is included within “Other liabilities.” Our accrual is based on (i) case by case accruals for specific cases where facts and circumstances warrant, and (ii) the implied settlement values for eligible claims under the MSA or Second Settlement Agreements. We are unable to reasonably estimate the high-end of a possible range of loss for claims which elected or will elect to opt-out of the MSA or Second Settlement Agreements. Claims we can confirm would meet MSA or Second Settlement Agreements eligibility criteria but are excluded from the settlements due to the maximum settlement cap, or because they are state cases not part of the MDL or JCCP, have been accrued as of the respective settlement rates. Due to the general uncertainties surrounding all metal-on metal claims as noted above, as well as insufficient information about individual claims, we are presently unable to reasonably estimate a range of loss for future claims; hence we have not accrued for these claims at the present time.
We are unable to predict whether we will be successful in recovering the necessary insurance proceeds required to complete the comprehensive settlement pursuant to the Second Settlement Agreements within the requisite timeframe. We continue to believe the high-end of a possible range of loss for existing revision claims that do not meet eligibility criteria of the MSA or Second Settlement Agreements will not, on an average per case basis, exceed the average per case accrual we take for revision claims we can confirm do meet eligibility criteria of the MSA or Second Settlement Agreements, as applicable. Future claims will be evaluated for accrual on a case by case basis using the accrual methodologies described above (which could change if future facts and circumstances warrant).
We have maintained product liability insurance coverage on a claims-made basis. During the fiscal quarter ended September 30, 2012, we received a customary reservation of rights from our primary product liability insurance carrier asserting that certain present and future claims which allege certain types of injury related to our CONSERVE® metal-on-metal hip products (CONSERVE® Claims) would be covered as a single occurrence under the policy year the first such claim was asserted. The effect of this coverage position would be to place CONSERVE® Claims into a single prior policy year in which applicable claims-made coverage was available, subject to the overall policy limits then in effect. Management agrees that there is insurance coverage for the CONSERVE® Claims, but has notified the carrier that it disputes the carrier's characterization of the CONSERVE® Claims as a single occurrence.
In June 2014, Travelers, which was an excess carrier in our coverage towers across multiple policy years, filed a declaratory judgment action in Tennessee state court naming us and certain of our other insurance carriers as defendants and asking the court to rule on the rights and responsibilities of the parties with regard to the CONSERVE® Claims. Among other things, Travelers appeared to dispute our contention that the CONSERVE® Claims arise out of more than a single occurrence thereby triggering multiple policy periods of coverage. Travelers further sought a determination as to the applicable policy period triggered by the alleged single occurrence. We filed a separate lawsuit in state court in California for declaratory judgment against certain carriers and breach of contract against the primary carrier, and moved to dismiss or stay the Tennessee action on a number of grounds, including that California is the most appropriate jurisdiction. During the third quarter of 2014, the California Court granted Travelers' motion to stay our California action. On April 29, 2016, we filed a dispositive motion seeking partial judgment in our favor in the Tennessee action, which motion is pending and has been referred to a Special Master to consider the parties’ arguments. On June 10, 2016, Travelers withdrew its motion for summary judgment in the Tennessee action. One of the other insurance companies in the Tennessee action has stated that it will re-file a similar motion in the future.
In March 2017, Lexington, which had been dismissed from the Tennessee action, requested arbitration under five Lexington insurance policies in connection with the CONSERVE® Claims. We subsequently engaged in discussions and correspondence with Lexington about the scope of the requested arbitration(s). On or about October 27, 2017, Lexington filed an Application for Order to Compel Arbitration in the Commonwealth of Massachusetts, Suffolk County Superior Court, naming WMT, Wright Medical Group, Inc., and Wright Medical Group N.V. We opposed the Application, which remains pending.
136
On October 28, 2016, WMT and Wright Medical Group, Inc. (Wright Entities) entered into a Settlement Agreement, Indemnity and Hold Harmless Agreement and Policy Buyback Agreement (Insurance Settlement Agreement) with a subgroup of three insurance carriers, namely Columbia Casualty Company, Travelers and AXIS Surplus Lines Insurance Company (collectively, the Three Settling Insurers), pursuant to which the Three Settling Insurers paid WMT an aggregate of $60 million (in addition to $10 million previously paid by Columbia) in a lump sum. This amount is in full satisfaction of all potential liability of the Three Settling Insurers relating to metal-on-metal hip and similar metal ion release claims, including but not limited to all claims in the MDL and the JCCP, and all claims asserted by WMT against the Three Settling Insurers in the Tennessee action described above.
On December 13, 2016, we filed a motion in the Tennessee action described above to include allegations of bad faith against the primary insurance carrier. The motion was subsequently amended on February 8, 2017 to add similar bad faith claims against the remaining excess carriers. On April 13, 2017, the Court denied our motion, without prejudice to our right to re-assert the motion at a later time. On August 29, 2017, we refiled the motion to add a bad faith claim against the primary and excess insurance carriers. The Court granted our motion on October 19, 2017 and, on October 23, 2017, we filed amended cross-claims alleging bad faith against all of the insurance carriers. On November 9, 2017, our primary insurance carrier brought a motion to dismiss and strike our bad faith claim. The remaining excess carriers either joined the primary insurer’s motion or brought their own separate motions. On December 22, 2017 and December 29, 2017, we opposed the insurers’ motions to dismiss and strike our claim for bad faith. The motions remain pending.
As part of the settlement with the Three Settling Insurers, the Three Settling Insurers bought back from WMT their policies in the five policy years beginning with the August 15, 2007- August 15, 2008 policy year (Repurchased Policy Years). Consequently, the Wright Entities have no further coverage from the Three Settling Insurers for any present or future claims falling in the Repurchased Policy Years, or any other period in which a released claim is asserted. Additionally, the Insurance Settlement Agreement contains a so-called most favored nation provision which could require us to refund a pro rata portion of the settlement amount if we voluntarily enter into a settlement with the remaining carriers in the Repurchased Policy Years on certain terms more favorable than analogous terms in the Insurance Settlement Agreement. The Tennessee action will continue as to the remaining defendant insurers other than the Three Settling Insurers. The amount due to the Wright Entities under the Insurance Settlement Agreement was paid in the fourth quarter of 2016 and the Three Settling Insurers have been dismissed from the Tennessee action.
On February 22, 2018, we and certain of our subsidiaries entered into the Second Insurance Settlement Agreement with Federal, pursuant to which Federal agreed to pay us an aggregate of $15 million (in addition to $5 million previously paid by Federal) in a lump sum on or before the 10th business day after execution of the Second Insurance Settlement Agreement. This amount will be in full satisfaction of all potential liability of Federal relating to designated metal-on-metal hip claims, including but not limited to all claims asserted by our subsidiary WMT against Federal in the previously disclosed insurance coverage litigation. We have recorded a $15 million receivable as a result of this agreement within “Other current assets” as of December 31, 2017. On February 9, 2018, the Tennessee action was stayed for 60 days to allow Wright and Federal to finalize and document their settlement and for the remaining parties to negotiate potential settlement of all remaining claims.
As of December 31, 2017, we have received $78.4 million of insurance proceeds, including the above amount from the Three Settling Insurers, and our insurance carriers have paid a total of $6.7 million directly to claimants in connection with various settlements, which represents amounts undisputed by the carriers. Except as provided in the Insurance Settlement Agreement and the Second Insurance Settlement Agreement, our acceptance of the insurance proceeds was not a waiver of any other claim we may have against the insurance carriers. However, the amount we ultimately receive will depend on the outcome of our dispute with the remaining carriers (other than the Three Settling Carriers and Federal) concerning the number of policy years available. We believe our contracts with the insurance carriers are enforceable for these claims; and, therefore, we believe it is probable we will receive additional recoveries from the remaining carriers. Settlement discussions with the remaining insurance carriers continue.
Given the substantial or indeterminate amounts sought in these matters, and the inherent unpredictability of such matters, an adverse outcome in these matters in excess of the amounts included in our accrual for contingencies could have a material adverse effect on our financial condition, results of operations and cash flow. Future revisions to our estimates of these provisions could materially impact our results of operations and financial position. We use the best information available to determine the level of accrued product liabilities, and believe our accruals are adequate.
In June 2015, a jury returned a $4.4 million verdict against us in a case involving a fractured hip implant stem sold prior to the MicroPort closing. This was a one-of-a-kind case unrelated to the modular neck fracture cases we have been reporting. There are no other cases pending related to this component, nor are we aware of other instances where this component has fractured. In September 2015, the trial judge reduced the jury verdict to $1.025 million and indicated that if the plaintiff did not accept the reduced award he would schedule a new trial solely on the issue of damages. The plaintiff elected not to accept the reduced damage
137
award, and both parties have appealed. The Court has not set a date for a new trial on the issue of damages and we do not expect it will do so until the appeals are adjudicated. We will maintain our current $4.4 million accrual as a probable liability until the matter is resolved. The $4.4 million probable liability associated with this matter is reflected within “Accrued expenses and other current liabilities,” and a $4 million receivable associated with the probable recovery from product liability insurance is reflected within “Other current assets.” On November 14, 2017, our primary insurance carrier agreed to defend and indemnify us in connection with this lawsuit under a reservation of rights. On January 9, 2018, the California appellate court heard oral argument on the parties’ cross-appeals.
Other
In addition to those noted above, we are subject to various other legal proceedings, product liability claims, corporate governance, and other matters which arise in the ordinary course of business.
17. Restricted Cash
During the fourth quarter of 2016, WMT deposited $150.0 million into a restricted escrow account to secure its obligations under the MSA that WMT entered into in connection with the metal-on-metal hip litigation, as described in Note 16 to the consolidated financial statements. All individual settlements under the MSA were funded first from the escrow account and then, once all funds held in the escrow account have been exhausted, directly by WMT. During the fiscal year ended December 31, 2017, WMT paid $150 million in settlement payments from the escrow account, bringing the balance in the restricted escrow account to $0 as of December 31, 2017. Therefore, as of December 31, 2017, none of our cash was considered restricted under US GAAP. See Note 16 to the consolidated financial statements for further discussion regarding the MSA and the metal-on-metal hip litigation.
The following table provides a reconciliation of cash, cash equivalents, and restricted cash reported within our consolidated balance sheets that sum to the totals of the same such amounts shown in the consolidated statements of cash flows (in thousands):
December 31, 2017 | December 25, 2016 | ||||||
Cash and cash equivalents | $ | 167,740 | $ | 262,265 | |||
Restricted cash | — | 150,000 | |||||
Total cash, cash equivalents, and restricted cash shown in the consolidated statements of cash flows | $ | 167,740 | $ | 412,265 | |||
18. Certain Relationships and Related-Party Transactions
The related party disclosures in this note relate to transactions with a former director of legacy Tornier, Alain Tornier. Mr. Tornier departed from our board of directors effective October 1, 2015 in connection with the closing of the Wright/Tornier merger. Accordingly, the indebtedness and lease agreements described below are not related party transactions during 2016 or 2017.
On July 29, 2008, Tornier SAS, a subsidiary of legacy Tornier, formed a real estate holding company (SCI Calyx) together with Alain Tornier, a former director of legacy Tornier (Mr. Tornier). SCI Calyx is owned 51% by Tornier SAS and 49% by Mr. Tornier. SCI Calyx was initially capitalized by a contribution of capital of €10,000 funded 51% by Tornier SAS and 49% by Mr. Tornier. SCI Calyx then acquired a combined manufacturing and office facility in Montbonnot, France, for approximately $6.1 million. The manufacturing and office facility acquired was to be used to support the manufacture of certain of legacy Tornier’s current products and house certain operations already located in Montbonnot, France. This real estate purchase was funded through mortgage borrowings of $4.1 million and $2.0 million cash borrowed from the two current shareholders of SCI Calyx. The $2.0 million cash borrowed from the SCI Calyx shareholders originally consisted of a $1.0 million note due to Mr. Tornier and a $1.0 million note due to Tornier SAS. Both of the notes issued by SCI Calyx bear annual interest at the three-month Euro Libor rate plus 0.5% and have no stated term. During 2010, SCI Calyx borrowed approximately $1.4 million from Mr. Tornier in order to fund on-going leasehold improvements necessary to prepare the Montbonnot facility for its intended use. This cash was borrowed under the same terms as the original notes. On September 3, 2008, Tornier SAS entered into a lease agreement with SCI Calyx relating to these facilities. The agreement, which terminates in 2018, provides for an annual rent payment of €440,000, which has subsequently been increased and is currently €965,655 annually. Annual lease payments to SCI Calyx amounted to $2.2 million during the fiscal year ended December 27, 2015, $0.6 million of which is reflected in our consolidated financial statements in light of the timing of the Wright/Tornier merger. As of December 27, 2015, future minimum payments under this lease were $12.3
138
million in the aggregate. As of December 27, 2015, SCI Calyx had related-party debt outstanding to Mr. Tornier of $2.0 million. The SCI Calyx entity is consolidated by us, and the related real estate and liabilities are included on our consolidated balance sheets.
Since 2006, Tornier SAS has entered into various lease agreements with entities affiliated with Mr. Tornier or members of his family. On December 29, 2007, Tornier SAS entered into a lease agreement with Animus SCI, relating to our facilities in Montbonnot Saint Martin, France. On August 18, 2012, the parties amended the lease agreement to extend the term until May 31, 2022 and reduce the annual rent. The amended agreement provides for an initial annual rent payment of €279,506, which was subsequently increased to €296,861. Animus SCI is wholly owned by Mr. Tornier. On February 6, 2008, Tornier SAS entered into a lease agreement with Balux SCI, effective as of May 22, 2006, relating to our facilities in Montbonnot Saint Martin, France. On August 18, 2012, the parties amended the lease agreement to extend the term until May 31, 2022 and reduce the annual rent. The amended agreement provides for an initial annual rent payment of €252,254, which was subsequently increased to €564,229. Balux SCI is wholly-owned by Mr. Tornier and his sister, Colette Tornier.
19. Quarterly Results of Operations (unaudited):
The following tables present a summary of our unaudited quarterly operating results for each of the four quarters in 2017 and 2016, respectively (in thousands). This information was derived from unaudited interim financial statements that, in the opinion of management, have been prepared on a basis consistent with the financial statements contained elsewhere in this report and include all adjustments, consisting only of normal recurring adjustments, necessary for a fair statement of such information when read in conjunction with our audited financial statements and related notes. The operating results for any quarter are not necessarily indicative of results for any future period.
2017 | |||||||||||||||
First quarter | Second quarter | Third quarter | Fourth quarter | ||||||||||||
Net sales | $ | 177,191 | $ | 179,693 | $ | 170,503 | $ | 217,602 | |||||||
Cost of sales | 37,126 | 38,122 | 38,421 | 47,278 | |||||||||||
Gross profit | 140,065 | 141,571 | 132,082 | 170,324 | |||||||||||
Operating expenses: | |||||||||||||||
Selling, general and administrative | 129,834 | 130,818 | 131,421 | 133,149 | |||||||||||
Research and development | 12,432 | 12,547 | 11,992 | 13,144 | |||||||||||
Amortization of intangible assets | 7,397 | 6,999 | 7,178 | 6,822 | |||||||||||
Total operating expenses | 149,663 | 150,364 | 150,591 | 153,115 | |||||||||||
Operating (loss) income | (9,598 | ) | (8,793 | ) | (18,509 | ) | 17,209 | ||||||||
Net (loss) income from continuing operations, net of tax | (36,707 | ) | (20,960 | ) | (34,122 | ) | 26,852 | ||||||||
(Loss) income from discontinued operations, net of tax | (21,992 | ) | (20,202 | ) | (97,748 | ) | 2,281 | ||||||||
Net (loss) income | $ | (58,699 | ) | $ | (41,162 | ) | $ | (131,870 | ) | $ | 29,133 | ||||
Net (loss) income, continuing operations per share, basic | $ | (0.35 | ) | $ | (0.20 | ) | $ | (0.33 | ) | $ | 0.26 | ||||
Net (loss) income, continuing operations per share, diluted | $ | (0.35 | ) | $ | (0.20 | ) | $ | (0.33 | ) | $ | 0.25 | ||||
Net (loss) income per share, basic | $ | (0.57 | ) | $ | (0.39 | ) | $ | (1.26 | ) | $ | 0.28 | ||||
Net (loss) income per share, diluted | $ | (0.57 | ) | $ | (0.39 | ) | $ | (1.26 | ) | $ | 0.27 | ||||
Weighted-average number of shares outstanding-basic | 103,663 | 104,377 | 104,836 | 105,195 | |||||||||||
Weighted-average number of shares outstanding-diluted | 103,663 | 104,377 | 104,836 | 106,578 | |||||||||||
Our 2017 operating (loss) income included the following:
• | transaction and transition costs totaling $3.0 million, $3.2 million, $3.3 million, and $2.9 million during the first, second, third, and fourth quarters of 2017, respectively; and |
• | a benefit from incentive and indirect tax projects of $9.0 million in the fourth quarter of 2017. |
Our 2017 net (loss) income from continuing operations included the following:
• | the after-tax effect of the above amounts; |
139
• | the after-tax effects of our CVR mark-to-market adjustments of $6.2 million unrealized loss, $3.9 million unrealized gain, $4.5 million unrealized loss, and $1.4 million unrealized gain recognized in the first, second, third, and fourth quarters of 2017, respectively; |
• | the after-tax effects of non-cash interest expense related to the amortization of the debt discount on our 2017 Notes, 2020 Notes and 2021 Notes totaling $11.0 million, $11.2 million, $11.5 million, and $11.7 million during the first, second, third, and fourth quarters of 2017, respectively; |
• | the after-tax effects of our mark-to-market adjustments on derivative assets and liabilities totaling a $0.4 million loss, $4.3 million gain, $0.2 million gain, and $0.6 million gain recognized in the first, second, third, and fourth quarters of 2017, respectively; |
• | the after-tax effects of our fair value adjustments to contingent consideration totaling a $0.2 million unrealized loss, $0.1 million unrealized loss, and $0.2 million unrealized gain in the second, third, and fourth quarters of 2017, respectively; |
• | a tax benefit related to the realizability of net operating losses of $8.9 million and $16.0 million in the third and fourth quarters of 2017, respectively; |
• | the tax effects of tax law reform in the U.S. and France totaling $8.3 million in the fourth quarter of 2017; and |
• | the tax effects of a benefit from incentive and indirect tax projects of $0.8 million in the fourth quarter of 2017. |
2016 | |||||||||||||||
First quarter | Second quarter | Third quarter | Fourth quarter | ||||||||||||
Net sales | $ | 169,291 | $ | 170,716 | $ | 157,332 | $ | 193,023 | |||||||
Cost of sales | 46,666 | 49,009 | 46,149 | 50,583 | |||||||||||
Gross profit | 122,625 | 121,707 | 111,183 | 142,440 | |||||||||||
Operating expenses: | |||||||||||||||
Selling, general and administrative | 134,746 | 136,483 | 129,840 | 140,489 | |||||||||||
Research and development | 12,116 | 12,108 | 12,481 | 13,809 | |||||||||||
Amortization of intangible assets | 6,457 | 7,484 | 7,466 | 7,434 | |||||||||||
Total operating expenses | 153,319 | 156,075 | 149,787 | 161,732 | |||||||||||
Operating loss | (30,694 | ) | (34,368 | ) | (38,604 | ) | (19,292 | ) | |||||||
Net loss, continuing operations, net of tax | (40,193 | ) | (42,031 | ) | (52,709 | ) | (30,002 | ) | |||||||
Net loss, discontinued operations, net of tax | (7,799 | ) | (187,329 | ) | (57,436 | ) | (14,874 | ) | |||||||
Net loss | $ | (47,992 | ) | $ | (229,360 | ) | $ | (110,145 | ) | $ | (44,876 | ) | |||
Net loss, continuing operations per share, basic and diluted | $ | (0.39 | ) | $ | (0.41 | ) | $ | (0.51 | ) | $ | (0.29 | ) | |||
Net loss per share, basic and diluted | $ | (0.47 | ) | $ | (2.23 | ) | $ | (1.07 | ) | $ | (0.43 | ) | |||
Weighted-average number of shares outstanding-basic and diluted 1 | 102,704 | 102,785 | 103,072 | 103,309 | |||||||||||
Our 2016 operating loss included the following:
• | transaction and transition costs totaling $10.8 million, $9.0 million, $8.1 million, and $8.4 million during the first, second, third, and fourth quarters of 2016, respectively; |
• | amortization of inventory step-up of $10.2 million, $10.4 million, $10.3 million, and $6.8 million in the first, second, third, and fourth quarters of 2016, respectively, associated with inventory acquired from the Wright/Tornier merger; |
• | costs associated with executive management changes of $1.3 million in the second quarter of 2016; |
• | costs related to a legal settlement of $1.8 million in the second quarter of 2016; and |
• | costs associated with debt refinancing of $0.2 million in the second quarter of 2016. |
Our 2016 net loss from continuing operations included the following:
• | the after-tax effect of the above amounts; |
140
• | the after-tax effects of our CVR mark-to-market adjustments of $5.3 million unrealized loss, $1.4 million unrealized loss, $2.2 million unrealized loss, and $0.3 million unrealized gain recognized in the first, second, third, and fourth quarters of 2016, respectively; |
• | the after-tax effects of $12.3 million non-cash loss of extinguishment of debt to write-off unamortized debt discount and deferred financing fees associated with the partial settlement of 2017 Notes and 2020 Notes during the second quarter of 2016; |
• | the after-tax effects of non-cash interest expense related to the amortization of the debt discount on our 2017 Notes, 2020 Notes and 2021 Notes totaling $7.1 million, $8.2 million, $10.5 million, and $10.8 million during the first, second, third, and fourth quarters of 2016, respectively; |
• | the after-tax effects of our mark-to-market adjustments on derivative assets and liabilities totaling a $6.6 million gain, $16.6 million gain, $3.2 million gain, and $1.8 million gain recognized in the first, second, third, and fourth quarters of 2016, respectively; |
• | the after-tax effects of charges due to the fair value adjustment to contingent consideration totaled $0.3 million, $0.1 million, and $0.1 million in the second, third, and fourth quarters of 2016, respectively; |
• | the after-tax effects of a $3.1 million interest and income tax benefit related to the settlement of an IRS audit in the second quarter of 2016; and |
• | a $5.6 million income tax benefit representing the deferred tax effects associated with the acquired Tornier operations in the fourth quarter of 2016. |
20. Segment and Geographic Data
During the first quarter of 2016, our management, including our Chief Executive Officer, who is our chief operating decision maker, began managing our operations as four operating business segments: U.S. Lower Extremities & Biologics, U.S. Upper Extremities, International Extremities & Biologics, and Large Joints. We determined that each of these operating segments represented a reportable segment. Our Chief Executive Officer reviews financial information at the operating segment level to allocate resources and to assess the operating results and performance of each segment. As a result of the classification of the Large Joints business as a discontinued operation during the second quarter of 2016, the Large Joints reportable segment is presented in our consolidated statements of operations as discontinued operations and is excluded from segment results for all periods presented. See Note 4 of the consolidated financial statements for additional information regarding this divestiture. U.S. Lower Extremities & Biologics, U.S. Upper Extremities, and International Extremities & Biologics are our remaining three reportable segments as of December 31, 2017.
Our U.S. Lower Extremities & Biologics segment consists of our operations focused on the sale in the United States of our lower extremities products, such as joint implants and bone fixation devices for the foot and ankle, and our biologics products used to support treatment of damaged or diseased bone, tendons, and soft tissues or to stimulate bone growth. Our U.S. Upper Extremities segment consists of our operations focused on the sale in the United States of our upper extremities products, such as joint implants and bone fixation devices for the shoulder, elbow, wrist, and hand and products used across several anatomic sites to mechanically repair tissue-to-tissue or tissue-to-bone injuries and other ancillary products. As the IMASCAP operations will be managed by the U.S. Upper Extremities management team, results of operations and assets related to IMASCAP will be included within the U.S. Upper Extremities segment. Our International Extremities & Biologics segment consists of our operations focused on the sale outside the United States of all lower and upper extremities products, including associated biologics products.
Management measures segment profitability using an internal operating performance measure that excludes the impact of inventory step-up amortization and due diligence, transaction and transition costs associated with acquisitions, as such items are not considered representative of segment results. Management's change to the way it monitors performance, aligns strategies, and allocates resources results in a change in our reportable segments and a change in reporting units for goodwill impairment measurement purposes. We have determined that each reportable segment represents a reporting unit and, in accordance with ASC 350, requires an allocation of goodwill to each reporting unit. As of December 31, 2017, we have allocated $218.5 million, $630.7 million, and $84.5 million of goodwill to the U.S. Lower Extremities & Biologics, U.S. Upper Extremities, and International Extremities & Biologics reportable segments, respectively.
141
Net sales by product line are as follows (in thousands):
Fiscal year ended | |||||||||||
December 31, 2017 | December 25, 2016 | December 27, 2015 | |||||||||
U.S. | |||||||||||
Lower extremities | $ | 228,044 | $ | 222,936 | $ | 187,096 | |||||
Upper extremities | 239,965 | 201,579 | 58,756 | ||||||||
Biologics | 78,361 | 74,603 | 50,583 | ||||||||
Sports med & other | 8,141 | 8,429 | 3,388 | ||||||||
Total U.S. | $ | 554,511 | $ | 507,547 | $ | 299,823 | |||||
International | |||||||||||
Lower extremities | $ | 58,473 | $ | 62,701 | $ | 51,200 | |||||
Upper extremities | 94,699 | 86,502 | 24,789 | ||||||||
Biologics | 22,276 | 18,883 | 19,652 | ||||||||
Sports med & other | 15,030 | 14,729 | 9,862 | ||||||||
Total International | $ | 190,478 | $ | 182,815 | $ | 105,503 | |||||
Total | $ | 744,989 | $ | 690,362 | $ | 405,326 | |||||
Our principal geographic regions consist of the United States, EMEA (which includes Europe, the Middle East and Africa), and Other (which principally represents Asia, Australia, Canada, and Latin America). Net sales attributed to each geographic region are based on the location in which the products were sold.
Net sales by geographic region are as follows (in thousands):
Fiscal year ended | |||||||||||
December 31, 2017 | December 25, 2016 | December 27, 2015 | |||||||||
Net sales by geographic region: | |||||||||||
United States | $ | 554,511 | $ | 507,547 | $ | 299,823 | |||||
EMEA | 120,202 | 117,268 | 62,662 | ||||||||
Other | 70,276 | 65,547 | 42,841 | ||||||||
Total | $ | 744,989 | $ | 690,362 | $ | 405,326 | |||||
No single foreign country accounted for more than 10% of our total net sales during 2017, 2016, or 2015.
Assets in the U.S. Upper Extremities, U.S. Lower Extremities & Biologics, and International Extremities & Biologics segments are those assets used exclusively in the operations of each business segment or allocated when used jointly. Assets in the Corporate category are principally cash and cash equivalents, derivative assets, property, plant and equipment associated with our corporate headquarters, assets associated with discontinued operations, product liability insurance receivables, and assets associated with income taxes. Total assets by business segment as of December 31, 2017 and December 25, 2016 are as follows (in thousands):
December 31, 2017 | |||||||||||||||||||
U.S. Lower Extremities & Biologics | U.S. Upper Extremities | International Extremities & Biologics | Corporate | Total | |||||||||||||||
Total assets | $ | 490,528 | $ | 929,930 | $ | 301,985 | $ | 406,281 | $ | 2,128,724 | |||||||||
December 25, 2016 | |||||||||||||||||||
U.S. Lower Extremities & Biologics | U.S. Upper Extremities | International Extremities & Biologics | Corporate | Total | |||||||||||||||
Total assets | $ | 491,531 | $ | 845,102 | $ | 264,680 | $ | 689,273 | $ | 2,290,586 | |||||||||
142
Selected financial information related to our segments is presented below for the fiscal years ended December 31, 2017, December 25, 2016, and December 27, 2015 (in thousands):
Fiscal year ended December 31, 2017 | |||||||||||||||||||
U.S. Lower Extremities & Biologics | U.S. Upper Extremities | International Extremities & Biologics | Corporate 1 | Total | |||||||||||||||
Net sales from external customers | $ | 309,713 | $ | 244,798 | $ | 190,478 | $ | — | $ | 744,989 | |||||||||
Depreciation expense | 12,532 | 10,211 | 12,366 | 21,723 | 56,832 | ||||||||||||||
Amortization expense | — | — | — | 28,396 | 28,396 | ||||||||||||||
Segment operating income (loss) | $ | 79,889 | $ | 78,866 | $ | 3,631 | $ | (178,642 | ) | $ | (16,256 | ) | |||||||
Other: | |||||||||||||||||||
Transaction and transition expenses | 12,400 | ||||||||||||||||||
Incentive and indirect tax projects | (8,965 | ) | |||||||||||||||||
Operating loss | (19,691 | ) | |||||||||||||||||
Interest expense, net | 74,644 | ||||||||||||||||||
Other expense, net | 5,570 | ||||||||||||||||||
Loss before income taxes | $ | (99,905 | ) | ||||||||||||||||
Capital expenditures | $ | 19,355 | $ | 22,897 | $ | 19,555 | $ | 1,667 | $ | 63,474 | |||||||||
Fiscal year ended December 25, 2016 | |||||||||||||||||||
U.S. Lower Extremities & Biologics | U.S. Upper Extremities | International Extremities & Biologics | Corporate 1 | Total | |||||||||||||||
Net sales from external customers | $ | 300,847 | $ | 206,700 | $ | 182,815 | $ | — | $ | 690,362 | |||||||||
Depreciation expense | 13,000 | 11,190 | 11,427 | 20,213 | 55,830 | ||||||||||||||
Amortization expense | — | — | — | 28,841 | 28,841 | ||||||||||||||
Segment operating income (loss) | $ | 85,645 | $ | 65,231 | $ | 5,872 | $ | (202,261 | ) | $ | (45,513 | ) | |||||||
Other: | |||||||||||||||||||
Inventory step-up amortization | 37,689 | ||||||||||||||||||
Transaction and transition expenses | 36,374 | ||||||||||||||||||
Legal settlement | 1,800 | ||||||||||||||||||
Management changes | 1,348 | ||||||||||||||||||
Costs associated with new convertible debt | 234 | ||||||||||||||||||
Operating loss | (122,958 | ) | |||||||||||||||||
Interest expense, net | 58,530 | ||||||||||||||||||
Other income, net | (3,148 | ) | |||||||||||||||||
Loss before income taxes | $ | (178,340 | ) | ||||||||||||||||
Capital expenditures | $ | 13,145 | $ | 10,101 | $ | 13,517 | $ | 13,336 | $ | 50,099 | |||||||||
143
Fiscal year ended December 27, 2015 | |||||||||||||||||||
U.S. Lower Extremities & Biologics | U.S. Upper Extremities | International Extremities & Biologics | Corporate 1 | Total | |||||||||||||||
Net sales from external customers | $ | 239,748 | $ | 60,075 | $ | 105,503 | $ | — | $ | 405,326 | |||||||||
Depreciation expense | 10,502 | 1,092 | 5,795 | 12,119 | 29,508 | ||||||||||||||
Amortization expense | — | — | — | 16,754 | 16,754 | ||||||||||||||
Segment operating income (loss) | $ | 39,008 | $ | 21,394 | $ | (5,567 | ) | $ | (136,836 | ) | $ | (82,001 | ) | ||||||
Other: | |||||||||||||||||||
Inventory step-up amortization | 10,315 | ||||||||||||||||||
Due diligence, transaction and transition expenses | 82,195 | ||||||||||||||||||
Share-based compensation acceleration | 14,190 | ||||||||||||||||||
Distributor conversion and non-compete charges | 65 | ||||||||||||||||||
Operating loss | (188,766 | ) | |||||||||||||||||
Interest expense, net | 41,358 | ||||||||||||||||||
Other expense, net | 10,884 | ||||||||||||||||||
Loss before income taxes | $ | (241,008 | ) | ||||||||||||||||
Capital expenditures | $ | 25,410 | $ | 6,903 | $ | 7,140 | $ | 4,213 | $ | 43,666 | |||||||||
1 | The Corporate category primarily reflects general and administrative expenses not specifically associated with the U.S. Lower Extremities & Biologics, U.S. Upper Extremities, and International Extremities & Biologics segments. These non-allocated corporate expenses relate to global administrative expenses that support all segments, including salaries and benefits of certain executive officers and expenses such as: information technology administration and support; corporate headquarters; legal, compliance, and corporate finance functions; insurance; and all share-based compensation. |
144
Item 9. Changes in and Disagreements with Accountants on Accounting and Financial Disclosure.
Not applicable.
Item 9A. Controls and Procedures.
Evaluation of Disclosure Controls and Procedures
Our disclosure controls and procedures (as defined in Rules 13a-15(e) and 15d-15(e) under the Securities Exchange Act of 1934, as amended) are designed to ensure that information required to be disclosed in the reports that we file or submit under the Exchange Act is recorded, processed, summarized and reported within the time periods specified in the rules and forms of the Securities and Exchange Commission and to ensure that information required to be disclosed is accumulated and communicated to management, including our principal executive officer and principal financial officer, to allow timely decisions regarding disclosure. The CEO and the CFO, with assistance from other members of management, have reviewed the design and effectiveness of our disclosure controls and procedures as of December 31, 2017 and, based on their evaluation, have concluded that the disclosure controls and procedures were effective as of December 31, 2017.
Management’s Annual Report on Internal Control over Financial Reporting
Our management is responsible for establishing and maintaining adequate internal control over financial reporting as defined in Rules 13a-15(f) under the Exchange Act.
Management assessed the effectiveness of our internal control over financial reporting as of December 31, 2017, based on the criteria established in Internal Control - Integrated Framework (2013) issued by the Committee of Sponsoring Organization of the Treadway Commission (COSO). Based on this assessment, management concluded that our internal control over financial reporting was effective as of December 31, 2017.
Our internal control over financial reporting as of December 31, 2017 has been audited by KPMG LLP, an independent registered public accounting firm, as stated in their report, which is included herein.
Remediation of Prior Year Material Weakness
A material weakness is a deficiency, or a combination of deficiencies, in internal control over financial reporting, such that there is a reasonable possibility that a material misstatement of our annual or interim financial statements will not be prevented or detected on a timely basis. Management previously reported in our Annual Report on Form 10-K for the fiscal year ended December 25, 2016 a material weakness in our internal control over financial reporting related to ineffective design and operation of general information technology controls related to user access to certain information technology systems that are relevant to our financial reporting processes and that are intended to ensure that access to financial applications and data is adequately restricted to appropriate personnel and monitored to ensure adherence to Company policies. During 2017, as disclosed in our Quarterly Reports on Form 10-Q for the first three quarters of 2017, the Company implemented and executed a plan to remediate the material weakness and as of the end of the third quarter of 2017, such remediation plans were successfully tested and the material weakness was deemed remediated.
Changes in Internal Control Over Financial Reporting
There were no changes in our internal control over financial reporting (as defined in Rules 13a-15(f) and 15d-15(f) under the Securities Exchange Act of 1934, as amended) during the fiscal quarter ended December 31, 2017, that materially affected, or that are reasonably likely to materially affect, our internal control over financial reporting, except for changes that we made to begin to incorporate the internal control over financial reporting of IMASCAP with and into our internal control over financial reporting.
Item 9B. Other Information.
Second Amendment to the Third Settlement Agreement
As previously reported, on October 3, 2017, WMT, a wholly-owned subsidiary of Wright Medical Group N.V. (the Company), and the Court-appointed attorneys representing plaintiffs in the metal-on-metal hip litigation known as In Re: Wright Medical Technology, Inc., CONSERVE® Hip Implant Products Liability Litigation, MDL No. 2329 (MDL) and In re: Wright Hip System Cases, Judicial Council Coordination Proceeding No. 4710 (JCCP) agreed on a comprehensive settlement intended to resolve substantially all remaining metal-on-metal hip claims pending or tolled in the MDL and JCCP that were not settled in the previously disclosed Master Settlement Agreement dated November 1, 2016. The comprehensive settlement was contingent on WMT’s receipt of new insurance proceeds totaling at least $35 million from applicable insurance carriers by December 31, 2017. On December 29, 2017, WMT and the Court-appointed attorneys representing plaintiffs in the MDL and JCCP entered into an amendment to extend this date to February 28, 2018 and, on February 23, 2018, the parties entered into a second amendment that extended this date to March 30, 2018.
The foregoing represents only a summary of the material terms of the foregoing described amendment, does not purport to be complete and is qualified in its entirety by reference to the complete text of the amendment, which is filed as Exhibit 10.90 to this Annual Report on Form 10-K, and is incorporated by reference herein.
Settlement and Release Agreement
On February 22, 2018, we and certain of our subsidiaries entered into a Settlement and Release Agreement with Federal Insurance Company, a subsidiary of Chubb Insurance (Federal), pursuant to which Federal agreed to pay us an aggregate of $15 million (in addition to $5 million previously paid by Federal) in a lump sum on or before the 10th business day after execution of the settlement agreement. This amount will be in full satisfaction of all potential liability of Federal relating to designated metal-on-metal hip claims, including but not limited to all claims asserted by our subsidiary WMT against Federal in the previously disclosed insurance coverage litigation.
More information regarding the pending insurance coverage litigation can be found at Note 16 to the consolidated financial statements contained in this report and in the section entitled “Legal Proceedings.”
145
PART III
Item 10. Directors, Executive Officers and Corporate Governance.
Directors and Executive Officers
The table below sets forth, as of February 23, 2018, certain information concerning our current directors and executive officers. No family relationships exist among any of our directors or executive officers.
Name | Age | Position | |||
Robert J. Palmisano | 73 | President and Chief Executive Officer and Executive Director | |||
Lance A. Berry | 45 | Senior Vice President and Chief Financial Officer | |||
Robert P. Burrows | 71 | Senior Vice President, Supply Chain | |||
James A. Lightman | 60 | Senior Vice President, General Counsel and Secretary | |||
J. Wesley Porter | 48 | Senior Vice President and Chief Compliance Officer | |||
Julie D. Tracy | 56 | Senior Vice President and Chief Communications Officer | |||
Jason D. Asper | 43 | Senior Vice President, Strategy and Corporate Development | |||
Jennifer S. Walker | 50 | Senior Vice President, Process Improvement | |||
Kevin D. Cordell | 52 | President, U.S. | |||
Peter S. Cooke | 52 | President, International | |||
Patrick Fisher | 44 | President. Lower Extremities | |||
Timothy L. Lanier | 56 | President, Upper Extremities | |||
Julie B. Andrews | 46 | Vice President and Chief Accounting Officer | |||
David D. Stevens(1)(2) | 64 | Chairman and Non-Executive Director | |||
Gary D. Blackford(1)(3) | 60 | Non-Executive Director | |||
John L. Miclot(4) | 58 | Non-Executive Director | |||
Kevin C. O’Boyle(3)(4) | 61 | Non-Executive Director | |||
Amy S. Paul(1) | 66 | Non-Executive Director | |||
Richard F. Wallman(2)(3) | 66 | Non-Executive Director | |||
Elizabeth H. Weatherman(1)(2)(4) | 57 | Non-Executive Director | |||
________________________
(1) Member of the nominating, corporate governance and compliance committee.
(2) Member of the strategic transactions committee.
(3) Member of the audit committee.
(4) Member of the compensation committee.
The following is a biographical summary of the experience of our directors and executive officers:
Robert J. Palmisano was appointed our President and Chief Executive Officer and an executive director and member of our board of directors in October 2015 in connection with the Wright/Tornier merger. Mr. Palmisano has served as President and Chief Executive Officer of Wright Medical Group, Inc. since September 2011. Prior to joining legacy Wright, Mr. Palmisano served as President and Chief Executive Officer of ev3 Inc., a global endovascular device company, from April 2008 to July 2010, when it was acquired by Covidien plc. From 2003 to 2007, Mr. Palmisano was President and Chief Executive Officer of IntraLase Corp. Before joining IntraLase, Mr. Palmisano was President and Chief Executive Officer of MacroChem Corporation from 2001 to 2003. Mr. Palmisano currently serves on the Providence College Board of Trustees and serves on the board of directors of Avedro Inc., a privately held ophthalmic medical device and pharmaceutical company. Mr. Palmisano previously served on the board of directors of ev3 Inc., Osteotech, Inc. and Abbott Medical Optics, Inc., all publicly held companies, and Bausch & Lomb, a privately held company. Under the terms of his employment agreement, we have agreed that Mr. Palmisano will be nominated by our board of directors for election as an executive director and a member of our board of directors at each annual general meeting of shareholders during the term of his employment as President and Chief Executive Officer of our company. Mr. Palmisano’s qualifications to serve on our board of directors include his day-to-day knowledge of our company and business due to his position as President and Chief Executive Officer, his experience serving on other public companies’ boards of directors, and his extensive business knowledge working with other public companies in the medical device industry.
146
Lance A. Berry was appointed our Senior Vice President and Chief Financial Officer in October 2015 in connection with the Wright/Tornier merger. Mr. Berry has served as Senior Vice President and Chief Financial Officer of Wright Medical Group, Inc. since 2009. He joined legacy Wright in 2002, and, until his appointment as Chief Financial Officer, served as Vice President and Corporate Controller. Prior to joining Wright, Mr. Berry served as audit manager with the Memphis, Tennessee office of Arthur Andersen LLP from 1995 to 2002.
Robert P. Burrows was appointed our Senior Vice President, Supply Chain in October 2015 in connection with the Wright/Tornier merger. Mr. Burrows joined Wright Medical Group, Inc. in August 2014 as Senior Vice President, Supply Chain. Prior to joining legacy Wright, he served as Managing Principal of The On-Point Group, a privately held logistics and supply chain consultancy, from July 1994 through July 2014. While at On-Point, Mr. Burrows led over 40 client engagements, most recently as an operations consultant overseeing the transition and expansion of legacy Wright’s extremities and biologics manufacturing.
James A. Lightman was appointed our Senior Vice President, General Counsel and Secretary in October 2015 in connection with the Wright/Tornier merger. Mr. Lightman joined Wright Medical Group, Inc. in December 2011 as Senior Vice President, General Counsel and Secretary. Prior to joining legacy Wright, Mr. Lightman served in various legal and executive positions with Bausch & Lomb Incorporated, a privately held supplier of eye health products. From February 2008 to November 2009, Mr. Lightman served as Vice President and Assistant General Counsel of Bausch & Lomb, and most recently held the position of Vice President, Global Sales Operations until August 2011. From June 2007 to February 2008, he served as Vice President and General Counsel of Eyeonics, Inc. Prior to joining Eyeonics, Mr. Lightman served as Senior Vice President and General Counsel of IntraLase Corp. from February 2005 to April 2007.
J. Wesley Porter was appointed our Senior Vice President and Chief Compliance Officer in October 2015 in connection with the Wright/Tornier merger. Mr. Porter joined Wright Medical Group, Inc. in July 2014 as Vice President, Compliance and became Senior Vice President and Chief Compliance Officer in October 2014. Prior to joining legacy Wright, Mr. Porter served as Vice President, Deputy Compliance Officer of Allergan, Inc. from September 2012 to February 2014, Vice President, Ethics and Compliance of CareFusion Corp. from June 2009 to September 2012, and Senior Corporate Counsel, Compliance, HIPAA and Reimbursement of Smith & Nephew, Inc. from April 2006 to May 2009.
Julie D. Tracy was appointed our Senior Vice President and Chief Communications Officer in October 2015 in connection with the Wright/Tornier merger. Ms. Tracy served as Senior Vice President, Chief Communications Officer of Wright Medical Group, Inc. from October 2011 to October 2015. Prior to joining legacy Wright, Ms. Tracy served as Chief Communications Officer of Epocrates, Inc., a publicly held company that sold physician platforms for clinical content, practice tools and health industry engagement, from March 2011 to October 2011. From January 2008 to July 2010, Ms. Tracy was Senior Vice President and Chief Communications Officer of ev3 Inc. Prior to ev3, Ms. Tracy held marketing and investor relations positions at Kyphon Inc. from January 2003 to November 2007 and Thoratec Corporation from January 1998 to January 2003. Ms. Tracy currently serves as a member of the board of directors for the National Investor Relations Institute, the professional association of corporate officers and investor relations consultants responsible for communication among corporate management, shareholders, securities analysts and other financial community constituents.
Jason D. Asper was appointed our Senior Vice President, Strategy and Corporate Development in August 2017. Prior to joining Wright, Mr. Asper served as a principal for Deloitte Consulting, LLP, a global consulting company, from September 2012 to July 2017.
Jennifer S. Walker was appointed our Senior Vice President, Process Improvement in October 2015 in connection with the Wright/Tornier merger. Ms. Walker served as Senior Vice President, Process Improvement of Wright Medical Group, Inc. from December 2011 to October 2015 and Vice President and Corporate Controller from December 2009 to December 2011. Since joining legacy Wright’s financial organization in 1993, she served as Assistant Controller, Director, Financial Reporting & Risk Management, Director, Corporate Tax & Risk Management, and Tax Manager of legacy Wright. Prior to joining legacy Wright, Ms. Walker was a senior tax accountant with Arthur Andersen LLP. Ms. Walker is a certified public accountant.
Kevin D. Cordell was appointed our President, U.S. in June 2016. From October 2015 to June 2016, he served as our President, Lower Extremities and Biologics. Mr. Cordell served as President, U.S. Extremities of Wright Medical Group, Inc. from September 2014 to October 2015. Prior to joining legacy Wright, Mr. Cordell served as Vice President of Sales for the GI Solutions business at Covidien plc, a global healthcare products company, from May 2012 to September 2014. While at Covidien, he served as Vice President of Sales and Global Marketing for its Peripheral Vascular business from July 2010 to May 2012. He joined Covidien in July 2010 through the acquisition of ev3 Inc., a global endovascular device company, where he served as Vice President of U.S. Sales from January 2009 to July 2010. Prior to ev3, Mr. Cordell served as Vice President, Global Sales of FoxHollow Technologies, Inc. from March 2007 until it was acquired by ev3 in October 2007. Earlier in his career, Mr. Cordell held various positions of
147
increasing responsibility for Johnson & Johnson’s Cordis Cardiology and Centocor companies. Mr. Cordell serves on the board of directors of TissueGen, Inc., a privately-held developer of biodegradable polymer technology for implantable drug delivery.
Peter S. Cooke was appointed our President, International in October 2015 in connection with the Wright/Tornier merger. Mr. Cooke served as President, International of Wright Medical Group, Inc. from January 2014 to October 2015 and served as Senior Vice President, International from January 2013 to January 2014. Prior to joining legacy Wright, Mr. Cooke served as Vice President and General Manager, Vascular Therapies Emerging Markets of Covidien plc, a global healthcare products company, from July 2010 to January 2013. Prior to Covidien, Mr. Cooke served in various general management roles for ev3 Inc., a global endovascular device company acquired by Covidien in July 2010, including Vice President and General Manager, International from July 2008 to July 2010; Vice President, General Manager, International from November 2006 to June 2008; Vice President, Sales International from January 2005 until November 2006; and Regional Director Asia Pacific and China from February 2003 until January 2005. Prior to ev3, Mr. Cooke spent eleven years at Guidant Corporation, three years at Baxter Healthcare Corporation and two years at St. Jude Medical, Inc.
Patrick Fisher was appointed our President, Lower Extremities in June 2016. From October 2015 to June 2016, Mr. Fisher served as our Vice President, U.S. Sales. From October 2012 to October 2015, Mr. Fisher served as Vice President, U.S. Sales of Wright Medical Group, Inc., and from October 2010 to October 2012, Mr. Fisher served as Regional Vice President of Sales - West Region.
Timothy L. Lanier was appointed our President, Upper Extremities in June 2016. Mr. Lanier has over 25 years of experience in medical device and commercial operations in both small and large companies that include various medical specialties such as orthopedics, vascular, oncology and ophthalmology. Prior to joining Wright, from September 2013 to June 2016, Mr. Lanier served as Vice President of Sales of DFINE Inc., a company committed to the treatment of metastatic tumors and other diseases of the spine. From July 2010 to September 2013, Mr. Lanier served as Vice President of US Sales for the Endovascular Division of Covidien plc, a global healthcare products company, where he built a world-class sales organization dedicated to treating both arterial and venous disease. He joined Covidien in July 2010 through the acquisition of ev3 Inc., where he served as Area Vice President from January 2008 to July 2010. Prior to ev3, Mr. Lanier served as Vice President of Commercial Operations at Anulex Technologies, Inc. from January 2007 to January 2008. He also had increasing executive responsibility at Zimmer Orthopedics, Spine Division and Spine-Tech, Inc. from 1997 to 2007, including Vice President of Commercial Operations.
Julie B. Andrews was appointed our Vice President and Chief Accounting Officer in October 2015 in connection with the Wright/Tornier merger. Ms. Andrews served as Vice President and Chief Accounting Officer of Wright Medical Group, Inc. from May 2012 to October 2015. From February 1998 to May 2012, Ms. Andrews held numerous key financial positions with Medtronic, Inc., a global medical device company. Most recently, Ms. Andrews served as Medtronic’s Vice President, Finance for its spinal and biologics business units. Ms. Andrews has significant accounting, finance, and business skills as well as global experience, having held positions in worldwide planning and analysis in Medtronic Sofamor Danek and in Medtronic’s spinal and biologics business. Prior to joining Medtronic, Ms. Andrews worked with Thomas & Betts Corporation in Memphis, Tennessee and Thomas Havey, LLP in Chicago, Illinois.
David D. Stevens joined our board of directors as a non-executive director in October 2015 in connection with the Wright/Tornier merger. Mr. Stevens serves as our Chairman. Mr. Stevens was a member of the board of directors of Wright Medical Group, Inc. from 2004 to 2015 and served as Chairman of the Board from 2009 to October 2015 and interim Chief Executive Officer of Wright from April 2011 to September 2011. He has been a private investor since 2006. Mr. Stevens served as Chief Executive Officer of Accredo Health Group, Inc., a subsidiary of Medco Health Solutions, Inc., from 2005 to 2006. He was Chief Executive Officer of Accredo Health, Inc. from 1996 to 2005, served as Chairman of the Board from 1999 to 2005, and was President and Chief Operating Officer of the predecessor companies of Accredo Health from their inception in 1983 until 1996. He serves on the board of directors of Allscripts Healthcare Solutions, Inc., a publicly held company. He previously served on the board of directors of Viasystems Group, Inc., a publicly held company, from 2012 until May 2015 when it was acquired by TTM Technologies, Inc., Medco Health Solutions, Inc., a publicly held company, from 2006 until 2012 when it was acquired by Express Scripts Holding Company, and Thomas & Betts Corporation, a publicly held company, from 2004 to 2012 when it was acquired by ABB Ltd. Mr. Stevens's qualifications to serve on our board of directors include his extensive experience serving as a chief executive officer, including as interim chief executive officer of legacy Wright, his close familiarity with our business, and his prior experience as a director of legacy Wright.
Gary D. Blackford joined our board of directors as a non-executive director in October 2015 in connection with the Wright/Tornier merger. Mr. Blackford was a member of the board of directors of Wright Medical Group, Inc. from 2008 to 2015. From 2002 to February 2015, Mr. Blackford served as President and Chief Executive Officer and a member of the board of directors of Universal Hospital Services, Inc., a provider of medical technology outsourcing and services to the healthcare industry, and from 2007 to February 2015, served as Chairman of the Board. From 2001 to 2002, Mr. Blackford served as Chief Executive Officer of Curative
148
Health Services Inc. From 1999 to 2001, Mr. Blackford served as Chief Executive Officer of ShopforSchool, Inc. He served as Chief Operating Officer for Value Rx from 1995 to 1998 and Chief Operating Officer and Chief Financial Officer of MedIntel Systems Corporation from 1993 to 1994. Mr. Blackford currently serves on the board of directors of Halyard Health, Inc. and ReShape Lifesciences Inc. (formerly EnteroMedics Inc.), both publicly held companies. He also serves on the board of directors of Pipeline Rx, Inc., a privately held telepharmacy company and is the Vice Chairman of the Minnesota Children's Hospitals and Clinics. Mr. Blackford previously served on the board of directors of Compex Technologies, Inc., a publicly held medical device company, from 2005 until its acquisition by Encore Medical Corporation in 2006. Mr. Blackford’s qualifications to serve as a member of our board of directors include his experience as a chief executive officer and director of a healthcare services company and other companies and as a director of other public companies in the healthcare industry, his extensive experience leading healthcare companies, and his prior experience as a director of legacy Wright.
John L. Miclot joined our board of directors as a non-executive director in October 2015 in connection with the Wright/Tornier merger. Mr. Miclot was a member of the board of directors of Wright Medical Group, Inc. from 2007 to 2015. Mr. Miclot has served as President and Chief Executive Officer and a member of the board of directors of LinguaFlex, Inc., a medical device company focused on treatment of sleep disordered breathing, since August 2015. From December 2011 to December 2014, he served as Chief Executive Officer and a member of the board of directors of Tengion Inc., a publicly held company that focused on organ and cell regeneration. Prior to joining Tengion, Mr. Miclot was an Executive-in Residence at Warburg Pincus, LLC. From 2008 to 2010, he was President and Chief Executive Officer of CCS Medical, Inc., a provider of products and services for patients with chronic diseases. From 2003 until 2008, he served as President and Chief Executive Officer of Respironics, Inc., a provider of sleep and respiratory products, and prior to such time, served in various positions at Respironics, Inc. from 1998 to 2003, including Chief Strategic Officer and President of the Homecare Division. From 1995 to 1998, he served as Senior Vice President, Sales and Marketing of Healthdyne Technologies, Inc., a medical device company that was acquired by Respironics, Inc. in 1998. Mr. Miclot spent the early part of his medical career at DeRoyal Industries, Inc., Baxter International Inc., Ohmeda Medical, Inc. and Medix Inc. Mr. Miclot serves as Chairman and a member of the board of directors of Breathe Technologies, Inc., a privately held company. Mr. Miclot also serves as a director of the Pittsburgh Zoo and PPG Aquarium, charitable and educational institutions, serves on the University of Iowa Tippie College of Business board of advisors and serves as an industrial advisor to EQT Partners, an investment company. Mr. Miclot previously served on the board of directors of DENTSPLY International Inc., a dental products company, prior to its merger with Sirona Dental Systems, Inc. in February 2016, and ev3 Inc., a global endovascular device company, prior to the sale of the company in 2010. Mr. Miclot’s qualifications to serve on our board of directors include his substantial experience as a chief executive officer of several medical device companies, his deep knowledge of the medical device industry, and his prior experience as a director of legacy Wright.
Kevin C. O’Boyle has served as a non-executive director and member of our board of directors since June 2010. In November 2012, Mr. O’Boyle was appointed as Interim Vice Chairman of Tornier, a position he held for about a year. From December 2010 to July 2011, Mr. O’Boyle served as Senior Vice President and Chief Financial Officer of Advanced BioHealing Inc., a medical device company that was acquired by Shire plc in July 2011. From January 2003 until December 2009, Mr. O’Boyle served as Chief Financial Officer of NuVasive, Inc., a medical device orthopedics company specializing in spinal disorders. Prior to that time, Mr. O’Boyle served in various positions during his six years with ChromaVision Medical Systems, Inc., a publicly held medical device company specializing in the oncology market, including as its Chief Financial Officer and Chief Operating Officer. Mr. O’Boyle also held various positions during his seven years with Albert Fisher North America, Inc., a publicly held international food company, including Chief Financial Officer and Senior Vice President of Operations. Mr. O’Boyle serves on the board of directors of GenMark Diagnostics, Inc. and Sientra, Inc., both publicly held companies. Mr. O’Boyle previously served on the board of directors of ZELTIQ Aesthetics, Inc., a public company acquired by Allergan plc in April 2017, and Durata Therapeutics, Inc. until its acquisition by Actavis plc in November 2014. Mr. O’Boyle’s qualifications to serve on our board of directors includes his executive experience in the healthcare industry, his experience with companies during their transition from being privately held to publicly held, and his financial and accounting expertise.
Amy S. Paul joined our board of directors as a non-executive director in October 2015 in connection with the Wright/Tornier merger. Ms. Paul was a member of the board of directors of Wright Medical Group, Inc. from 2008 to 2015. Ms. Paul retired in 2008 following a 26-year career with C.R. Bard, Inc., a medical device company, most recently serving as the Group Vice President-International since 2003. She served in various positions at C.R. Bard, Inc. from 1982 to 2003, including President of Bard Access Systems, Inc., President of Bard Endoscopic Technologies, Vice President and Business Manager of Bard Ventures, Vice President of Marketing of Bard Cardiopulmonary Division, Marketing Manager for Davol Inc., and Senior Product Manager for Davol Inc. Ms. Paul previously served on the board of directors of Derma Sciences, Inc., a publicly held company, Viking Systems, Inc., a publicly held company, until October 2012 when it was acquired by Conmed Corporation, and was a commissioner of the Northwest Commission on Colleges and Universities from 2010 to 2013. Ms. Paul serves on the President’s Innovation Network at Westminster College. Ms. Paul’s qualifications to serve on our board of directors include her over three decades of experience in the medical
149
device industry, including having served in various executive roles with responsibilities that include international and divisional operations as well as marketing and sales functions, her experience as a director of other public companies in the healthcare industry, and her prior experience as a director of legacy Wright.
Richard F. Wallman has served as a non-executive director and member of our board of directors since December 2008. From 1995 through his retirement in 2003, Mr. Wallman served as Senior Vice President and Chief Financial Officer of Honeywell International, Inc., a diversified technology company, and AlliedSignal, Inc., a diversified technology company (prior to its merger with Honeywell International, Inc.). Prior to joining AlliedSignal, Inc., Mr. Wallman served as Controller of International Business Machines Corporation. Mr. Wallman serves on the board of directors of Charles River Laboratories International, Inc., Extended Stay America, Inc. and Roper Technologies, Inc., all publicly held companies. Mr. Wallman previously served on the board of directors of Convergys Corporation, Dana Holding Corporation and ESH Hospitality, Inc., all publicly held companies. Mr. Wallman’s qualifications to serve on our board of directors include his prior public company experience, including as Chief Financial Officer of Honeywell, his significant public company director experience, and his financial experience and expertise.
Elizabeth H. Weatherman has served as a non-executive director and member of our board of directors since July 2006. Ms. Weatherman was initially appointed as a director of Tornier in connection with the securityholders’ agreement that Tornier entered into with certain shareholders. The securityholders’ agreement terminated by its terms in May 2016. Ms. Weatherman has been a Special Limited Partner of Warburg Pincus LLC, a private equity firm, since January 2016. Ms. Weatherman previously was a Partner of Warburg Pincus & Co., a Member and Managing Director of Warburg Pincus LLC and a member of the firm’s Executive Management Group. Ms. Weatherman joined Warburg Pincus in 1988 and primarily focused on the firm’s healthcare investment activities. Ms. Weatherman serves on the board of directors of several privately held companies. Ms. Weatherman previously served on the boards of directors of several publicly held companies, primarily in the medical device industry, including ev3 Inc., Wright Medical Group, Inc., and Kyphon Inc. Ms. Weatherman’s qualifications to serve on our board of directors include her extensive experience as a director of several public and private companies in the medical device industry.
Board Structure and Composition
We have a one-tier board structure. Our articles of association provide that the number of members of our board of directors will be determined by our board of directors, provided that our board of directors will be comprised of at least one executive director and two non-executive directors. Our board of directors currently consists of eight directors, one of whom is an executive director and seven of whom are non-executive directors. With respect to the composition of our board of directors, under the terms of his employment agreement, we have agreed that Mr. Palmisano will be nominated by our board of directors for election as an executive director and a member of our board of directors at each annual general meeting of shareholders.
All seven of our non-executive directors are “independent directors” under the Listing Rules of the Nasdaq Stock Market. Independence requirements for service on our audit committee are discussed below under “Audit Committee” and independence requirements for service on our compensation committee are discussed below under “Compensation Committee.” All of our non-executive directors are independent under the independence definition in the Dutch Corporate Governance Code.
The general meeting of shareholders appoints the members of our board of directors, subject to a binding nomination to be drawn up by our board of directors in accordance with the relevant provisions of the Dutch Civil Code. Our board of directors makes the binding nomination based on a recommendation of our nominating, corporate governance and compliance committee. If the list of candidates contains one candidate for each open position to be filled, such candidate will be appointed by the general meeting of shareholders unless the binding nature of the nominations by our board of directors is set aside by the general meeting of shareholders. The binding nature of nomination(s) by our board of directors can only be set aside by a vote of at least two-thirds of the votes cast at an annual or extraordinary general meeting of shareholders, provided such two-thirds vote constitutes more than one-half of our issued share capital. In such case, a new meeting is called at which the resolution for appointment of a member of our board of directors will require a majority of at least two-thirds of the votes cast representing more than one-half of our issued share capital.
A resolution of the general meeting of shareholders to suspend a member of our board of directors requires the affirmative vote of an absolute majority of the votes cast. A resolution of the general meeting of shareholders to suspend or dismiss members of our board of directors, other than pursuant to a proposal by our board of directors, requires a majority of at least two-thirds of the votes cast, representing more than one-half of our issued share capital.
Under our articles of association, our internal rules for the board of directors, and Dutch law, the members of our board of directors are collectively responsible for our management, general and financial affairs, and policy and strategy. Our executive director is primarily responsible for managing our day-to-day affairs as well as other responsibilities that have been delegated to him in accordance with our articles of association and internal rules for the board of directors. Our non-executive directors supervise our
150
executive director and our general affairs and provide general advice to him. In performing their duties, our directors are guided by the interests of our company and, within the boundaries set by relevant Dutch law, must take into account the relevant interests of our stakeholders. The internal affairs of our board of directors are governed by our internal rules for the board of directors, a copy of which is available on the Investor Relations-Corporate Information-Governance Documents & Charters section of our corporate website at www.wright.com.
Mr. Stevens serves as our Chairman. The duties and responsibilities of the Chairman include, among others: determining the agenda and chairing the meetings of our board of directors, managing our board of directors to ensure that it operates effectively, ensuring that the members of our board of directors receive accurate, timely and clear information, encouraging active engagement by all the members of our board of directors, promoting effective relationships and open communication between the non-executive directors and the executive director, and monitoring effective implementation of our board of directors decisions.
Under our internal rules for the board of directors, meetings of our board of directors may be held in such locations as the board of directors determines appropriate. At each meeting, each director has the right to cast one vote and may be represented at a meeting of our board of directors by a fellow director. Our board of directors may pass resolutions only if a majority of the directors is present at the meeting and all resolutions must be passed by a majority of the directors that have no conflict of interest present or represented. As required by Dutch law, our articles of association provide that when one or more members of our board of directors is absent or prevented from acting, the remaining members of our board of directors will be entrusted with the management of our company. The intent of this provision is to satisfy certain requirements under Dutch law and provide that, in rare circumstances, when a director is incapacitated, severely ill, or similarly absent or prevented from acting, the remaining members of our board of directors (or, in the event there are no such remaining members, a person appointed by our shareholders at a general meeting) will be entitled to manage our company, notwithstanding the general requirement that otherwise requires a majority of our board of directors in office to be present. In these limited circumstances, our articles of association permit our board of directors to pass resolutions even if a majority of the directors in office is not present at the meeting.
Subject to Dutch law and any director’s objection, resolutions may be passed in writing by all of the directors in office. Under Dutch law, members of the board of directors may not participate in the deliberation and the decision-making process on a subject or transaction in relation to which he or she has a direct or indirect personal interest that conflicts with the interest of our company and business enterprise. If all directors are conflicted and in the absence of a supervisory board, the resolution will be adopted by the general meeting of shareholders, except if the articles of association prescribe otherwise. Our articles of association provide that a director will not take part in any vote on a subject or transaction in relation to which he or she has a direct or indirect personal interest that conflicts with the interest of our company and business enterprise. In such event, the other directors will be authorized to adopt the resolution. If all directors have a conflict of interest as mentioned above, the resolution will be adopted by the non-executive directors.
Board Committees
Our board of directors has four standing board committees: audit committee, compensation committee, nominating, corporate governance and compliance committee, and strategic transactions committee. Each of these committees has the composition described in the table below and the responsibilities described in the sections below. Our board of directors has adopted a written charter for each committee of our board of directors. These charters are available on the Investor Relations-Corporate Information-Governance Documents & Charters section of our corporate website at www.wright.com. Our board of directors from time to time may establish other committees.
The following table summarizes the current membership of each of our four board committees.
Director | Audit | Compensation | Nominating, corporate governance and compliance | Strategic transactions | ||||
Robert J. Palmisano | — | — | — | — | ||||
Gary D. Blackford | √ | — | √ | — | ||||
John L. Miclot | — | Chair | — | — | ||||
Kevin C. O’Boyle | √ | √ | — | — | ||||
Amy S. Paul | — | — | Chair | — | ||||
David D. Stevens | — | — | √ | √ | ||||
Richard F. Wallman | Chair | — | — | √ | ||||
Elizabeth H. Weatherman | — | √ | √ | Chair | ||||
151
Audit Committee
The audit committee oversees a broad range of issues surrounding our accounting and financial reporting processes and audits of our consolidated financial statements. The primary responsibilities of the audit committee include:
• | assisting our board of directors in monitoring the integrity of our consolidated financial statements, our compliance with legal and regulatory requirements insofar as they relate to our consolidated financial statements and financial reporting obligations and any accounting, internal accounting controls or auditing matters, our independent registered public accounting firm's qualifications and independence, and the performance of our internal audit function and independent registered public accounting firm; |
• | appointing, compensating, retaining, and overseeing the work of any independent registered public accounting firm engaged for the purpose of performing any audit, review, or attest services and dealing directly with any such auditing firm; provided, that such appointment will be subject to shareholder ratification or decision in the case of the auditor for our Dutch statutory annual accounts; |
• | providing a medium for consideration of matters relating to any audit issues; |
• | establishing procedures for the receipt, retention, and treatment of complaints received by us regarding accounting, internal accounting controls, or auditing matters, and for the confidential, anonymous submission by our employees of concerns regarding questionable accounting or auditing matters; and |
• | reviewing and approving all related party transactions required to be disclosed under the U.S. federal securities laws. |
The audit committee reviews and evaluates, at least annually, the performance of the audit committee and its members, including compliance of the committee with its charter.
The audit committee has the sole authority to select, retain, oversee, and terminate its own counsel, consultants, and advisors and approve the fees and other retention terms of such counsel, consultants, and advisors, as it deems appropriate.
The audit committee consists of Mr. Wallman (Chair), Mr. Blackford, and Mr. O’Boyle. We believe that the composition of the audit committee complies with the applicable rules of the SEC and the Nasdaq Stock Market. Our board of directors has determined that each of Mr. Wallman, Mr. Blackford, and Mr. O’Boyle is an “independent director” under the rules of the Nasdaq Stock Market, an “audit committee financial expert,” as defined in SEC rules, and satisfies the financial sophistication requirements of the Nasdaq Stock Market. Our board of directors also has determined that each of Mr. Wallman, Mr. Blackford, and Mr. O’Boyle meets the more stringent independence requirements for audit committee members of Rule 10A-3(b)(1) under the Exchange Act and the Listing Rules of the Nasdaq Stock Market and is independent under the Dutch Corporate Governance Code.
Compensation Committee
The primary responsibilities of our compensation committee, which are within the scope of the board of directors compensation policy adopted by the general meeting of our shareholders, include:
• | reviewing and approving corporate goals and objectives relevant to the compensation of our Chief Executive Officer and other executive officers, evaluating the performance of these officers in light of those goals and objectives, and setting compensation of these officers based on such evaluations; |
• | making recommendations to our board of directors with respect to incentive compensation and equity-based plans that are subject to board and shareholder approval, administering or overseeing all of our incentive compensation and equity-based plans, and discharging any responsibilities imposed on the committee by any of these plans; |
• | reviewing and recommending to our board of directors any severance or similar termination payments proposed to be made to our Chief Executive Officer and reviewing and approving any severance or similar termination payments proposed to be made to any other executive officer; |
• | reviewing and discussing with our Chief Executive Officer and reporting periodically to our board of directors plans for development and corporate succession plans for our executive officers and other key employees, which include transitional leadership in the event of an unplanned vacancy; |
• | reviewing and discussing with management the “Compensation Discussion and Analysis” section of this report and based on such discussions, recommending to our board of directors whether the “Compensation Discussion and Analysis” section should be included in this report; and |
152
• | approving, or recommending to our board of directors for approval, the compensation programs, and the payouts for all programs, applying to our non-executive directors, including reviewing the competitiveness of our non-executive director compensation programs and reviewing the terms to make sure they are consistent with our board of directors compensation policy adopted by the general meeting of our shareholders. |
The compensation committee reviews and evaluates, at least annually, the performance of the compensation committee and its members, including compliance of the committee with its charter.
The compensation committee has the sole authority to select, retain, oversee, and terminate its own counsel, consultants, and advisors and approve the fees and other retention terms of such counsel, consultants, and advisors, as it deems appropriate. Before selecting any such counsel, consultant or advisor, the compensation committee reviews and considers the independence of such counsel, consultant or advisor, including any other services the counsel, consultant or other advisor is providing to our company and management.
The compensation committee consists of Mr. Miclot (Chair), Mr.O’Boyle, and Ms. Weatherman. We believe that the composition of our compensation committee complies with the applicable rules of the SEC and the Nasdaq Stock Market. Our board of directors has determined that each of Mr. Miclot, Mr. O’Boyle and Ms. Weatherman is an “independent director” under the rules of the Nasdaq Stock Market, meets the more stringent independence requirements for compensation committee members of Rule 10C-1 under the Exchange Act and the Listing Rules of the Nasdaq Stock Market and is independent under the Dutch Corporate Governance Code. None of our executive officers has served as a member of the board of directors or compensation committee of any entity that has an executive officer serving as a member of our board of directors.
Nominating, Corporate Governance and Compliance Committee
The primary responsibilities of our nominating, corporate governance and compliance committee include:
• | reviewing and making recommendations to our board of directors regarding the size and composition of our board of directors; |
• | identifying, reviewing, and recommending nominees for election as directors; |
• | making recommendations to our board of directors regarding corporate governance matters and practices, including any revisions to our internal rules for our board of directors; and |
• | overseeing our compliance efforts with respect to our legal, regulatory, and quality systems requirements and ethical programs, including our code of business conduct, other than with respect to matters relating to our financial statements and financial reporting obligations and any accounting, internal accounting controls or auditing matters, which are within the purview of the audit committee. |
The nominating, corporate governance and compliance committee reviews and evaluates, at least annually, the performance of the nominating, corporate governance and compliance committee and its members, including compliance of the committee with its charter.
The nominating, corporate governance and compliance committee has the sole authority to select, retain, oversee, and terminate its own counsel, consultants, and advisors and approve the fees and other retention terms of such counsel, consultants, and advisors, as it deems appropriate.
The nominating, corporate governance and compliance committee consists of Ms. Paul (Chair), Mr. Blackford, Mr. Stevens, and Ms. Weatherman. We believe that the composition of our nominating, corporate governance and compliance committee complies under the applicable rules of the Nasdaq Stock Market. Our board of directors has determined that each of Ms. Paul, Mr. Blackford, Mr. Stevens, and Ms. Weatherman is an “independent director” under the rules of the Nasdaq Stock Market.
The nominating, corporate governance and compliance committee considers all candidates recommended by our shareholders pursuant to specific minimum qualifications that the nominating, corporate governance and compliance committee believes must be met by a recommended nominee for a position on our board of directors, which qualifications are described in the nominating, corporate governance and compliance committee’s charter, a copy of which is available on the Investor Relations-Corporate Information-Governance Documents & Charters section of our corporate website www.wright.com. We have made no material changes to the procedures by which shareholders may recommend nominees to our board of directors as described in our most recent proxy statement.
153
Strategic Transactions Committee
The primary responsibilities of our strategic transactions committee include:
• | reviewing and evaluating potential opportunities for strategic business combinations, acquisitions, mergers, dispositions, divestitures, investments, and similar strategic transactions involving our company or any one or more of our subsidiaries outside the ordinary course of our business that may arise from time to time; |
• | approving on behalf of our board of directors any strategic transaction that may arise from time to time and is deemed appropriate by the strategic transactions committee and involves total cash consideration of less than $5.0 million; provided, however, that the strategic transactions committee is not authorized to approve any strategic transaction involving the issuance of capital stock or in which any director, officer, or affiliate of our company has a material interest; |
• | making recommendations to our board of directors concerning approval of any strategic transactions that may arise from time to time and are deemed appropriate by the strategic transactions committee and are beyond the authority of the strategic transactions committee to approve; |
• | reviewing integration efforts with respect to completed strategic transactions from time to time and making recommendations to management and our board of directors, as appropriate; |
• | assisting management in developing, implementing, and adhering to a strategic plan and direction for its activities with respect to strategic transactions and making recommendations to management and our board of directors, as appropriate; |
• | reviewing and approving the settlement or compromise of any material litigation or claim against us; and |
• | reviewing and evaluating potential opportunities for restructuring our business in response to completed strategic transactions or otherwise in an effort to realize anticipated cost and expense savings for, and other benefits, to our company and making recommendations to management and our board of directors, as appropriate. |
The strategic transactions committee reviews and evaluates periodically the performance of the committee and its members, including compliance of the committee with its charter.
The strategic transactions committee has the sole authority to select, retain, oversee, and terminate its own counsel, consultants, and advisors and approve the fees and other retention terms of such counsel, consultants, and advisors, as it deems appropriate.
The strategic transactions committee consists of Ms. Weatherman (Chair), Mr. Stevens, and Mr. Wallman.
Code of Business Conduct
We have adopted a code of business conduct, which applies to all of our directors, officers, and employees. The code of business conduct is available on the Investor Relations-Corporate Information-Governance Documents & Charters section of our corporate website at www.wright.com. Any person may request a copy free of charge by writing to James A. Lightman, Senior Vice President, General Counsel and Secretary, Wright Medical Group N.V., Prins Bernhardplein 200, 1097 JB Amsterdam, the Netherlands. We intend to disclose on our corporate website any amendment to, or waiver from, a provision of our code of business conduct that applies to directors and executive officers and that is required to be disclosed pursuant to the rules of the SEC and the Nasdaq Stock Market.
Section 16(a) Beneficial Ownership Reporting Compliance
Section 16(a) of the Exchange Act requires our directors, executive officers, and all persons who beneficially own more than 10% of our outstanding ordinary shares to file with the SEC initial reports of ownership and reports of changes in ownership of our ordinary shares. Directors, executive officers, and greater than 10% beneficial owners also are required to furnish us with copies of all Section 16(a) forms they file. To our knowledge, based on review of the copies of such reports and amendments to such reports furnished to us with respect to the fiscal year ended December 31, 2017, and based on written representations by our directors and executive officers, all required Section 16 reports under the Exchange Act for our directors, executive officers, and beneficial owners of greater than 10% of our ordinary shares were filed on a timely basis during the fiscal year ended December 31, 2017.
Item 11. Executive Compensation.
Compensation Discussion and Analysis
In this Compensation Discussion and Analysis (CD&A), we describe the key principles and approaches we use to determine elements of compensation paid to, awarded to and earned by the following executive officers, whose compensation is set forth in
154
the Summary Compensation Table found under “-Executive Compensation Tables and Narratives-Summary Compensation Information”:
• | Robert J. Palmisano, who serves as our President and Chief Executive Officer; |
• | Lance A. Berry, who serves as our Senior Vice President and Chief Financial Officer; |
• | Kevin D. Cordell, who serves as our President, U.S.; |
• | Jason D. Asper, who serves as our Senior Vice President, Strategy and Corporate Development; and |
• | James A. Lightman, who serves as our Senior Vice President, General Counsel and Secretary. |
We refer to these executive officers as our “named executive officers” and our President and Chief Executive Officer as our “CEO” in this CD&A. This CD&A should be read in conjunction with the accompanying compensation tables, corresponding notes and narrative discussion, as they provide additional information and context to our compensation disclosures.
Executive Summary
One of our key executive compensation objectives is to link pay to performance by aligning the financial interests of our executives with those of our shareholders and by emphasizing pay for performance in our compensation programs. We strive to accomplish this objective primarily through our annual performance incentive plan (PIP), which compensates executives for achieving annual corporate and divisional financial and other goals. For 2017, we had three corporate performance measures. While our 2017 net sales increased 8% over 2016, they were below our targeted expectations as set forth in our corporate performance goals for 2017. Our earnings before interest, taxes, depreciation and amortization, as adjusted, and free cash flow for 2017 also were below our targeted expectations as set forth in our corporate performance goals for 2017.
The table below sets forth the three corporate performance measures for 2017, in each case, from continuing operations and as adjusted for certain items, and our actual results and performance vis a vis these corporate objectives. Because our overall weighted achievement rating was between minimum and threshold performance, there were no PIP payouts based on corporate performance. This resulted in decreased total compensation for 2017 for our CEO and most of our other named executive officers compared to 2016.
2017 corporate performance measures and weighting | Actual | 2017 performance | ||
Global net sales (40%) | $730.9 million | Between minimum and threshold | ||
Adjusted EBITDA (30%) | $108.9 million | Between threshold and target | ||
Free cash flow (30%) | $(24.0) million | Below minimum | ||
Overall weighted corporate performance achievement rating | Between minimum and threshold | |||
Only two NEOs received bonuses based on 2017 performance: Mr. Cordell and Mr. Lightman. A portion of Mr. Cordell’s PIP payout was based on the performance of our U.S. business and a portion of Mr. Lightman’s PIP payout was based on individual performance. The table below sets forth the five U.S. business performance measures for 2017 and our actual results and performance vis a vis these objectives.
2017 divisional performance measures and weighting | 2017 performance | |
U.S. net sales (35%) | Between minimum and threshold | |
Adjusted EBITDA for U.S. business (30%) | Slightly below threshold | |
Day-on-hand for U.S. business (15%) | Between target and above target | |
Days sales outstanding for U.S. business (15%) | Between threshold and target | |
AUGMENT® Bone Graft revenue (5%) | Slightly below threshold | |
Overall weighted achievement rating | At threshold | |
As described in more detail below under “-Shareholder Outreach Efforts and 2017 Changes to Our Executive Compensation”, we reviewed our executive compensation program last year to ensure that it not only motivates our executives, but also aligns with shareholder interests and prevailing market practice. As a result of this review and based on feedback from investors and shareholders, we implemented several new executive compensation practices. One of these changes was to change the mix of our long-term incentives to incorporate performance-based awards. Our current long-term incentive mix now consists of one-third performance share unit awards in addition to time-based stock options and time-based restricted stock unit awards. To further emphasize the importance of future revenue growth, the performance share unit awards will vest only upon achievement of a minimum net sales growth goal over a three-year performance period. We intend to continue to review our executive compensation program to align the financial interests of our executives with those of our shareholders and emphasize pay for performance.
155
Shareholder Outreach Efforts and 2017 Changes to Our Executive Compensation
During 2017, we spent considerable time reviewing our executive compensation program to ensure that it not only motivates our executives, but also aligns with shareholder interests and prevailing market practice. As part of this review, we reached out and listened to shareholders. In 2017, we contacted our top 50 institutional shareholders, representing approximately 89% of our outstanding ordinary shares and attended over 300 meetings for investors and interested investors. For the individual investor meetings, our CEO, Chief Financial Officer and/or Chief Communications Officer attended. The agenda for these meetings requested feedback from investors and shareholders and generally included: (1) a review of our operations and results to date; (2) a summary of our strategic priorities and focus; and (3) a review of our compensation philosophy and its alignment with our strategic direction. The three most common themes noted from investors and shareholders included incorporating the use of performance-based equity awards, eliminating single trigger change-in-control provisions in our equity plan and holding an annual (versus triennial) say-on-pay vote.
As a result of this review and based on feedback from investors and shareholders, we implemented the following new executive compensation practices during 2017:
Performance-Based Awards | We changed the mix of our executive long-term incentive awards to incorporate performance-based awards. We moved to a mix comprised of one-third performance share unit awards, one-third time-based stock options and one-third time-based restricted stock unit awards. The performance share unit awards will vest upon achievement of performance goals over a three-year performance period. | |
Double Trigger Vesting | Our new equity and incentive plan (approved by shareholders in 2017) (referred to as our 2017 equity plan) includes a double trigger change-in-control vesting provision. | |
Minimum Vesting Periods | Our 2017 equity plan requires all new equity awards to contain minimum vesting periods of at least one year for performance-based awards and three years for time-based full value awards granted to employees. | |
Clawback Policy | We adopted a clawback policy that authorizes recovery of gains from incentive compensation, including equity awards, in the event of certain financial restatements. | |
Annual Say-on-Pay Vote | We now provide our shareholders with an annual say-on-pay vote as opposed to our prior practice of a triennial say-on-pay vote. | |
Compensation Highlights and Best Practices
Our compensation practices include many best pay practices that support our executive compensation objectives and principles, and benefit our shareholders.
What We Do:
Pay for Performance | We tie compensation directly to financial and other performance metrics. Our annual incentive plan pays out only if certain levels of performance are met. In 2017, we granted performance share units, which comprise of one-third of executives’ long-term incentive and will be earned only if certain levels of performance are met. | |
Bonus Caps | We cap our PIP bonuses and new performance-based awards at 200% of target. | |
Performance Measure Mix | We use a mix of performance measures within our PIP. | |
At-risk Pay | A significant portion of our executive compensation is “performance-based” or “at risk.” | |
Equity-based Pay | A significant portion of our executive compensation is “equity-based” and in the form of equity awards. | |
LTI Grant Guidelines | We have adopted and review annually long-term incentive guidelines for the grant of equity awards. | |
Long-term Vesting | Value received under equity awards is tied to three to four-year vesting and any value from stock options is contingent upon long-term stock price performance. Our performance-based awards vest only if certain levels of performance are achieved over a three-year performance period. | |
Clawback Policy | Our clawback policy authorizes recovery of gains from incentive compensation in the event of certain financial restatements. | |
Stock Ownership Guidelines | We maintain stock ownership guidelines for all our executives. | |
Independent Committee and Consultant | We have an independent compensation committee which is advised by an independent external compensation consultant. | |
156
What We Don't Do:
No Repricing | We do not allow repricing or exchange of any equity awards without shareholder approval. | |
No Excessive Perquisites | We do not provide excessive perquisites to our executives. | |
No Tax Gross-Ups | We do not provide tax “gross-up” payments to our executives, other than customary tax gross-up payments under our relocation policy and to our CEO under his employment agreement. | |
No Hedging or Pledging | We do not allow our employees to engage in hedging transactions, including short sales, transactions in publicly traded options, such as puts, calls and other derivatives, and pledging our securities. | |
No Dividends on Unvested Awards | We do not pay dividends on unvested equity awards. | |
Say-on-Pay Vote
At our 2017 annual general meeting, our shareholders had the opportunity to vote on an advisory say-on-pay proposal. At this meeting, almost 80% of the votes cast by our shareholders were in favor of our say-on-pay vote. Additionally, as required every six years, our shareholders had the opportunity at our 2017 annual general meeting to provide an advisory vote on the frequency of future advisory say-on-pay votes. Our board of directors recommended, and our shareholders approved, an annual say-on-pay vote. Some of the changes made to our executive compensation program in 2017, as described above, were made in response to shareholder feedback, including our say-on-pay vote last year.
Compensation Objectives and Philosophies
Our executive compensation policies, plans and programs seek to enhance our financial performance, and thus shareholder value, by aligning the financial interests of our executives with those of our shareholders and by emphasizing pay-for-performance. Specifically, our executive compensation programs are designed to:
• | Reinforce our corporate mission, vision and values; |
• | Attract and retain executives important to the success of our Company; |
• | Align the interests of our executives with the interests of our shareholders; and |
• | Reward executives for the achievement of Company performance objectives, the creation of shareholder value in the short- and long-term, and their contributions to the success of our Company. |
To achieve these objectives, although the compensation committee has not adopted any formal or informal policies or guidelines for allocating compensation, the committee makes executive compensation decisions based on the following philosophies:
• | Base salary and total compensation levels are generally targeted to be within a reasonable range of the 67th percentile of a group of similarly-sized peer companies. However, the specific competitiveness of any individual executive’s salary and compensation will be determined considering factors like the executive’s experience, skills and capabilities, contributions as a member of the executive management team, contributions to our overall performance, and the sufficiency of total compensation potential to ensure the retention of an executive when considering the compensation potential that may be available elsewhere. |
• | At least two-thirds of the CEO’s compensation and half of other executives’ compensation opportunity should be in the form of variable compensation that is tied to financial results and/or creation of shareholder value. |
• | The portion of total compensation that is performance-based or at-risk should increase with an executive’s overall responsibilities, job level, and compensation. However, compensation programs should not encourage excessive risk-taking behavior among executives and should support our commitment to corporate compliance. |
• | Primary emphasis should be placed on company performance as measured against goals approved by the compensation committee rather than on individual performance. |
• | At least half of the CEO’s compensation and one-third of other executives’ compensation opportunity should be in the form of stock-based incentive awards. |
Executive Compensation Components
The principal elements of our executive compensation program for 2017 were:
• | base salary; |
• | short-term cash incentive compensation; |
157
• | long-term equity-based incentive compensation, in the form of stock options, restricted stock unit (RSU) awards and performance share unit (PSU) awards; and |
• | other compensation arrangements, such as benefits made generally available to our other employees, limited and modest executive benefits and perquisites, and severance and change in control arrangements. |
Except as otherwise described in this CD&A, the compensation committee has not adopted any formal or informal policies or guidelines for allocating compensation between long-term and currently paid out compensation, between cash and non-cash compensation, or among different forms of non-cash compensation. However, the compensation committee’s philosophy is to make a greater percentage of an executive’s compensation performance-based, and therefore at risk, as the executive’s position changes and responsibility increases given the influence more senior level executives generally have on Company performance. Thus, individuals with greater roles and responsibilities associated with achieving our objectives should bear a greater proportion of the risk that those goals are not achieved and should receive a greater proportion of the reward if objectives are met or surpassed. Accordingly, our objective is that at least two-thirds of the CEO’s compensation and one-half of other executives’ compensation opportunity be in the form of variable compensation that is tied to financial results or share price and that at least half of the CEO’s compensation and one-third of other executives’ compensation opportunity be in the form of stock-based incentive awards.
The overall mix of annual base salaries, target annual cash incentive awards and grant date fair value long-term incentive awards as a percent of target total direct compensation for our CEO and other named executive officers as a group for 2017 is provided below. The value of the long-term incentives represented is based on the grant date fair value of stock options, RSU awards and PSU awards granted during 2017. Actual long-term incentive value will be based on long-term stock price performance and whether the PSU performance goals are achieved. All other compensation is excluded from the table below.
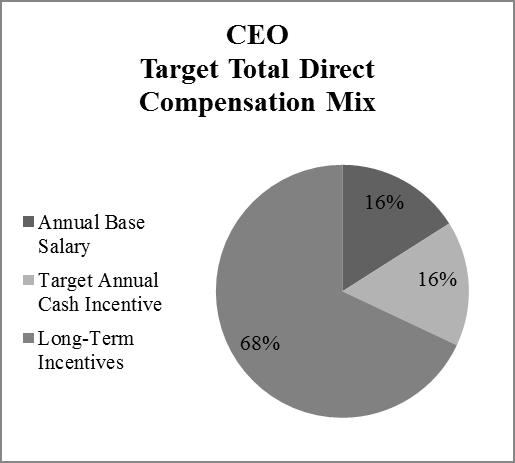
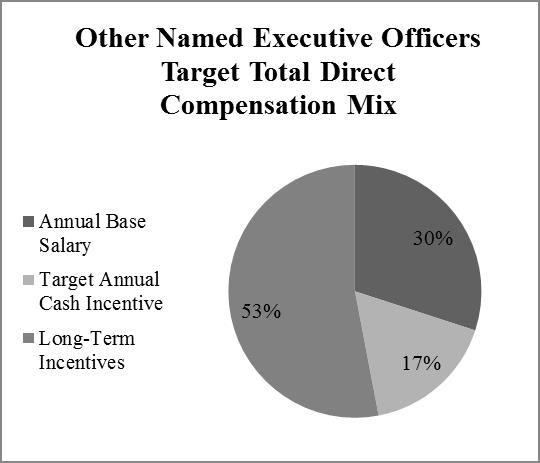
Base Salary
Overview. We provide a base salary for our named executive officers that, unlike some of the other elements of our executive compensation program, is not subject to company or individual performance risk. We recognize the need for most executives to receive at least a portion of their total compensation in the form of a guaranteed base salary that is paid in cash regularly throughout the year. Base salaries are established upon hiring an executive, and are subject to subsequent annual adjustments.
Setting Initial Salaries for New Executives. We initially fix base salaries for executives at a level we believe enables us to hire and retain them in a competitive environment and to reward satisfactory individual performance and a satisfactory level of contribution to our overall business objectives. During 2017, we hired Jason D. Asper as Senior Vice President, Strategy and Corporate Development. In setting his initial base salary at $335,000, we considered his base salary at his prior employer and target market positioning of companies in our peer group.
Annual Salary Increases. We review the base salaries of our named executive officers each year following the completion of our prior year individual performance reviews. If appropriate, we increase base salaries to recognize annual increases in the cost of living and superior individual performance and to ensure that our base salaries remain market competitive. In addition, with respect to Mr. Palmisano, we also take into consideration his employment agreement which provides that we review his base salary at least annually for any increase. We refer to annual base salary increases as a result of cost of living adjustments and individual performance as “merit increases.” In addition, we may make additional upward adjustments to an executive’s base salary to compensate the executive for assuming increased roles and responsibilities, to retain an executive at risk of recruitment by other
158
companies, and/or to bring an executive’s base salary closer to our target market positioning of companies in our peer group. We refer to these base salary increases as “market adjustments.”
The 2017 base salary merit increases for our named executive officers ranged from 3.5% to 4.0% over their respective 2016 base salaries. No upward market adjustments were made during 2017, except in the case of Mr. Berry who received an upward market adjustment of approximately $20,000. We believe the base salaries of all of our named executive officers are within a reasonable range of our targeted positioning among our peer group.
2017 Base Salaries. The table below sets forth the 2016 base salaries (which were effective April 1, 2016) of our named executive officers, their 2017 base salaries effective April 1, 2017, and the percentage increase compared to their 2016 base salaries:
Name | 2016 base salary ($) | 2017 base salary ($) | 2017 base salary % increase compared to 2016 base salary | |||
Robert J. Palmisano | $921,648 | $958,514 | 4.0% | |||
Lance A. Berry | 413,400 | 450,000 | 8.9% | |||
Kevin D. Cordell | 454,740 | 470,656 | 3.5% | |||
Jason D. Asper | N/A | 335,000 | N/A | |||
James A. Lightman | 388,024 | 403,545 | 4.0% | |||
Short-Term Cash Incentive Compensation
Our short-term cash incentive compensation is paid as an annual cash bonus under our PIP and is intended to compensate executives for achieving annual corporate financial performance goals and, in some cases, divisional financial and individual performance goals. The PIP provides broad discretion to the compensation committee in interpreting and administering the plan. All 2017 short-term cash incentive bonuses to our named executive officers are expected to be paid out in early March 2018 and were dependent upon executives’ continued service through the end of 2017.
Target Bonus Percentages. Target short-term cash incentive bonuses for 2017 for each executive were based on a percentage of base salary and were as follows for each named executive officer:
Name | Percentage of base salary | |
Robert J. Palmisano | 100% | |
Lance A. Berry | 65% | |
Kevin D. Cordell | 60% | |
Jason D. Asper | 45% | |
James A. Lightman | 50% | |
The 2017 target bonus percentages for our named executive officers did not change from their 2016 levels for those executives who were executives in 2016. Based on an executive compensation analysis by our compensation consultant, we believe the target bonus percentages for our named executive officers are generally aligned with our target market positioning within our peer group.
Performance Goal Mix. 2017 bonuses to our named executive officers were based upon achievement of corporate performance goals for all executives, as well as divisional performance goals for Mr. Cordell, and individual performance goals for Mr. Lightman.
Named executive officer | Percentage based upon corporate performance goals | Percentage based upon divisional performance goals | Percentage based upon individual performance goals | |||
Robert J. Palmisano | 100% | 0% | 0% | |||
Lance A. Berry | 100% | 0% | 0% | |||
Kevin D. Cordell | 40% | 60% | 0% | |||
Jason D. Asper | 100% | 0% | 0% | |||
James A. Lightman | 80% | 0% | 20% | |||
159
Corporate Performance Goals. For 2017, we had three corporate performance measures as set forth in the table below. These three measures were selected because they were determined to be the three most important indicators of our financial performance for 2017 as evaluated by management and analysts.
2017 corporate performance metric | Weighting | |
Global net sales (1) | 40% | |
Adjusted EBITDA (2) | 30% | |
Free cash flow (3) | 30% | |
_________________
(1) | This performance measure was calculated using a non-GAAP financial measure, which we believe provides meaningful supplemental information regarding our core operational performance. The net sales goal and actual results were calculated based on a foreign currency exchange planning rate to adjust for any impact of foreign currency on underlying performance. |
(2) | This performance measure was calculated using a non-GAAP financial measure, which we believe provides meaningful supplemental information regarding our core operational performance. Adjusted EBITDA from continuing operations means net loss from continuing operations plus charges for interest, income taxes, depreciation and amortization expenses, non-cash share-based compensation expense and non-operating income and expense. Additionally, adjusted EBITDA from continuing operations excluded transaction and transition costs associated with acquisitions and divestitures; tax benefit related to realizability of net operating losses; and bonus compensation. |
(3) | This performance measure was calculated using a non-GAAP financial measure, which we believe provides meaningful supplemental information regarding our core operational performance. Adjusted free cash flow means net cash flow provided by operating activities (excluding net cash flow from certain discontinued operations, AUGMENT payment milestone and foreign currency gains and losses) less capital expenditures. |
The percentage of the target bonus earned by bonus objective was based on the following performance levels and an overall weighted average corporate payout:
Performance level | Percent of target bonus earned | |
Minimum | 0% | |
Threshold (50% payout) | 50.1% to 99.9% | |
Target (100% payout) | 100% | |
Above target (150% payout) | 100.1% to 150% | |
High (200% payout) | 150.1% to 200% | |
In setting the threshold, target, above target, and maximum performance achievement levels, we considered past performance, market conditions, and the financial, strategic, and operational plans presented by management. When setting the target performance levels, we sought to ensure that at- or above-market performance was the goal. For above-target performance levels, the achievement levels required “stretch” performance by the management team to achieve this level of performance. At the threshold level, targets would be set on a steeper slope than at the above target/maximum categories, so that missed target performance would result in more rapidly declining bonus opportunity.
The performance level of each corporate performance measure is set forth in the table below.
Performance level | Global net sales | Adjusted EBITDA | Free cash flow | |||
Minimum | $717.2 million | $89.7 million | $(5.0) million | |||
Threshold (50% payout) | $744.7 million | $101.0 million | $0.0 million | |||
Target (100% payout) | $779.4 million | $112.3 million | $9.05 million | |||
Above target (150% payout) | $799.9 million | $136.0 million | $27.7 million | |||
High (200% payout) | $827.5 million | $160.1 million | $42.1 million | |||
The table below sets forth our actual performance for each corporate performance measure and the overall weighted corporate performance achievement rating, which was between minimum and threshold, resulting in a zero payout for our corporate performance measures.
2017 corporate performance measures and weighting | Actual | Payout | ||
Global net sales (40%) | $730.9 million | Between minimum and threshold | ||
160
2017 corporate performance measures and weighting | Actual | Payout | ||
Adjusted EBITDA (30%) | $108.9 million | Between threshold and target | ||
Free cash flow (30%) | $(24.0) million | Below minimum | ||
Overall weighted achievement rating | Between minimum and threshold | |||
Divisional Performance Goals. As President, U.S., Mr. Cordell’s 2017 PIP bonus was based 40% on corporate performance goals and 60% on U.S. business performance goals. The portion of Mr. Cordell’s 2017 PIP bonus that was tied to the performance of the U.S. business was based on five divisional performance measures. The table below sets forth the five U.S. divisional performance measures and reflects how that business unit performed in 2017 and the overall weighted average divisional performance achievement rating. Mr. Cordell’s 2017 PIP bonus reflected an overall weighted average achievement rating for the U.S. business performance goals of 50% of target.
2017 divisional performance measures and weighting | 2017 performance | |
U.S. net sales (35%) | Between minimum and threshold | |
Adjusted EBITDA for U.S. business (30%) | Slightly below threshold | |
Days-on-hand for U.S. business (15%) | Between target and above target | |
Days sales outstanding for U.S. business (15%) | Between threshold and target | |
AUGMENT® Bone Graft revenue (5%) | Slightly below threshold | |
Overall weighted achievement rating | At threshold | |
The specific performance levels for our U.S. divisional performance measures are maintained as proprietary and confidential. We believe that disclosure of these specific performance levels would represent competitive harm to us as these divisional goals and results are not publicly disclosed and are competitively sensitive. For each divisional performance measure, the target goal reflects the annual financial business plan goal set for the division. Based on historical performance, the compensation committee believes the attainment of the target performance level, while uncertain, could be reasonably anticipated. Threshold goals represent the minimum level of performance necessary for that performance measure and the compensation committee believes the threshold goals are likely to be achieved. Maximum goals represent levels of performance at which the compensation committee determines a payout of 200% of target would be appropriate. The compensation committee believes that the maximum goals established for each division performance measure are more aggressive goals.
Individual Performance Goals. To foster cooperation and communication among executives, the compensation committee places primary emphasis on overall corporate and divisional performance goals rather than on individual performance goals. For named executive officers, at least 80% of their 2017 annual PIP bonuses were determined based on the achievement of corporate or divisional performance goals and only 20% or less were based on achievement of individual performance goals. The individual performance goals used to determine annual PIP bonuses were management by objectives, known internally as MBOs. MBOs are generally two to three written, specific and measurable objectives agreed to and approved by the executive, CEO and compensation committee in the beginning of the year. The only named executive officer with MBOs for 2017 was Mr. Lightman. His MBOs for 2017 related to our insurance carrier litigation and customer satisfaction and his MBO achievement rating was 75%.
2017 Actual PIP Bonuses. The table below sets for the 2017 PIP bonuses for all named executive officers, which bonuses are anticipated to be paid in early March 2018:
Named executive officer | 2017 PIP bonus | |||
Robert J. Palmisano | $ | 0 | ||
Lance A. Berry | 0 | |||
Kevin D. Cordell | 84,718 | |||
Jason D. Asper | 0 | |||
James A. Lightman | 30,266 | |||
PIP Performance Goals for 2018. In February 2017, the compensation committee approved PIP performance goals for 2018. The 2018 target bonus percentages for our named executive officers did not change from their 2017 levels. Consistent with the design for 2017 plan, the annual bonus for our CEO is based 100% on achievement of corporate performance goals, with no individual performance components. Bonuses for our other named executive officers are based 100% on achievement of corporate performance goals for Mr. Berry, 40% on achievement of corporate performance goals and 60% on achievement of divisional performance goals for Mr. Cordell, and 80% on achievement of corporate performance goals and 20% on achievement of individual goals for Messrs. Asper and Lightman. The corporate performance measures for 2018 are based on net sales, adjusted EBITDA
161
from continuing operations, and free cash flow. The divisional performance goals for Mr. Cordell are similar to the goals for 2017, except that there will be no AUGMENT Bone Graft net sales goal.
Long-Term Equity-Based Incentive Compensation
Generally. The compensation committee’s primary objectives with respect to long-term equity-based incentives are to align the interests of our executives with the long-term interests of our shareholders, promote stock ownership, and create significant incentives for executive retention. Long-term equity-based incentives typically comprise a significant portion of each named executive officer’s compensation package, consistent with our executive compensation philosophy.
Types of Equity Grants. Under our long-term incentive grant guidelines, our board of directors, on recommendation of the compensation committee, generally grants two types of equity-based incentive awards to our named executive officers: annual performance recognition grants and new hire talent acquisition grants. On limited occasion, we may make special recognition grants or discretionary grants to executive officers for retention or other purposes. Such grants may vest based on the passage of time and/or the achievement of certain performance goals. During 2017, annual performance recognition grants and new hire talent acquisition grants were made to one or more of our named executive officers, as described in more detail under “-2017 Equity Awards.”
Annual performance recognition grants are discretionary annual grants that are made during mid-year to give the compensation committee another formal opportunity during the year to review executive compensation and recognize executive and other key employee performance. The recipients and size of the annual performance recognition grants are determined based on our long-term incentive grant guidelines, which we review annually to ensure continued alignment with our target positioning. Under our long-term incentive grant guidelines for annual performance recognition grants, named executive officers received a certain percentage of their respective base salaries in stock options, RSU awards and PSU awards. Consistent with the principle that the interests of our executives should be aligned with those of our shareholders and that the portion of an executive’s total compensation that varies with performance and is at risk should increase with the executive’s level of responsibility, incentive grants, expressed as a percentage of base salary and dollar values, increase as an executive’s level of responsibility increases.
The table below describes our long-term incentive grant guidelines for annual performance recognition grants that applied to our named executive officers for 2017. Mr. Asper did not receive an annual performance recognition grant since he joined Wright in August 2017.
Named executive officer | Incentive grant guideline expressed as % of base salary | Dollar value of incentive grant guideline as of July 25, 2017 grant date ($) | ||||
Robert J. Palmisano | 400% | $ | 3,834,056 | |||
Lance A. Berry | 200% | 900,000 | ||||
Kevin D. Cordell | 175% | 823,648 | ||||
James A. Lightman | 125% | 504,431 | ||||
Once the target total long-term equity value was determined for each executive based on the executive’s relevant percentage of base salary, one-third of the value was provided in stock options, one-third was provided in RSU awards and one-third was provided in PSU awards. The reasons why we use stock options, RSU awards and PSU awards are described below under “-Stock Options,” “-RSU Awards” and “-PSU Awards.” The number of stock options, RSU awards and target PSU awards is based on the Black-Scholes value of our ordinary shares as determined on the third business day prior to the corporate approval of the award and using an average closing price of our ordinary shares over the most recent 10-trading days.
Talent acquisition grants are used for new hires. These new hire equity grants are considered and approved as part of the executive’s compensation package at the time of hire (with the grant date and exercise price delayed until the hire date). As with our annual performance recognition grants, the size of our talent acquisition grants is determined by dollar amount (as opposed to number of underlying shares), and under our long-term incentive grant guidelines, is generally two times the long-term incentive grant guidelines for annual performance recognition grants, as recommended by our compensation consultant. We recognize that higher initial grants often are necessary to attract a new executive, especially one who may have accumulated a substantial amount of equity-based long-term incentive awards or other equity at a previous employer that would typically be forfeited upon acceptance of employment with us. In some cases, we may need to further increase a talent acquisition grant to attract an executive. Mr. Asper was the only named executive officer to receive new hire talent acquisition grants during 2017. His incentive grant guideline expressed as a percentage of base salary is 100% and consistent with our practice for new hire talent acquisition grants was two times the long-term incentive grant guideline for annual performance recognition grants, resulting in a new hire talent acquisition grant value equal to $670,000.
Stock Options. Historically, we have granted stock options to our named executive officers, as well as other key employees. We believe that options effectively incentivize employees to maximize company performance, as the value of awards is directly tied
162
to an appreciation in the value of our ordinary shares. They also provide an effective retention mechanism because of vesting provisions. An important objective of our long-term incentive program is to strengthen the relationship between the long-term value of our ordinary shares and the potential financial gain for employees. Stock options provide recipients with the opportunity to purchase our ordinary shares at a price fixed on the grant date regardless of future market price. The vesting of our stock options is generally time-based, with 25% of the shares underlying the stock option typically vesting on the one-year anniversary of the grant date and the remaining 75% of the underlying shares vesting over a three-year period thereafter in 36 nearly equal monthly installments. Our policy is to grant options only with an exercise price equal to or more than the fair market value of an ordinary share on the grant date.
Because stock options become valuable only if the share price increases above the exercise price and the option holder remains employed during the period required for the option to vest, they provide an incentive for an executive to remain employed. In addition, stock options link a portion of an employee’s compensation to the interests of our shareholders by providing an incentive to achieve corporate goals and increase the market price of our ordinary shares over the four-year vesting period.
RSU Awards. RSU awards are intended to retain key employees, including named executive officers, through vesting periods. RSU awards provide the opportunity for capital accumulation and more predictable long-term incentive value than stock options. All of our RSU awards are a commitment by us to issue ordinary shares at the time the RSU award vests. The specific terms of vesting of an RSU award depends on whether the award is an annual performance recognition grant or new hire talent acquisition grant. Annual performance recognition grants of RSU awards are made mid-year and vest in four annual installments on August 15th of each year. New hire talent acquisition grants of RSU awards vest in a similar manner, except that the first installment is often pro-rated and vests in four annual installments beginning on either August 15, November 15, March 1st or May 15th depending on the grant date. In all cases, the first vesting date is at least one year after the grant date. We changed our RSU award vesting in 2017 upon the adoption of our 2017 equity plan, which contains a minimum one-year vesting provision.
PSU Awards. PSU awards are intended to retain key employees, including named executive officers, through the three-year performance periods. PSU awards are paid out in Wright ordinary shares following completion of a three-year performance period if certain performance goals are achieved. Because the PSU award grants are made in July each year, they are based on three-year performance periods beginning on the first day of our third fiscal quarter and ending on the last day of our second fiscal quarter of the third year thereafter.
At the beginning of the first year in the three-year period, the compensation committee establishes performance measures, weightings, goals and performance adjustment events, if any, for the entire three-year performance period, as well as thresholds, targets, and maximums. Factors we consider when establishing the performance goals for the three-year period include our prior year and year-to-date financial business results and long-term strategic plan outlook, our competitive situation and anticipated state of our business, and any anticipated business opportunities. At the end of the three-year performance period, the compensation committee will certify performance against the performance goals, including the applicability of any performance adjustment events, and a corresponding payout, which is expressed as a percent of target. Actual payouts for the PSU awards can range from 0% (if the threshold levels of performance are not met) to 200% of the target award (if maximum levels of performance are met).
While the performance measure is net sales growth, the specific performance goal for the three-year PSU awards granted in 2017 is maintained by us as proprietary and confidential. We believe that disclosure of this specific performance goal would represent competitive harm to us. Based on historical performance, we believe the attainment of the target performance level, while uncertain, could be reasonably anticipated. The threshold goal represents the minimum level of performance necessary for there to be a payout and we believe is likely to be achieved. The maximum goal represents the performance at which a payout is 200% of the target award and represents the level of performance of which we believe a payout of 200% would be appropriate. We believe that the maximum goal established for the performance measure is much more aggressive than the target goal.
Since 2017 was the first year that we granted PSU awards and since the performance period was three years, no payouts for PSU awards were determined during 2017.
2017 Equity Awards. The table below sets forth the number of stock options, RSU awards and target PSU awards granted to each of our named executive officers in 2017. As mentioned earlier, Mr. Asper received new hire talent acquisition grants, which are two times the long-term incentive grant guideline for annual performance recognition grants and do not include PSU awards.
Named executive officer | Stock options (#) | RSU awards (#) | PSU awards (assuming target performance) (#) | ||||||
Robert J. Palmisano | 137,373 | 46,533 | 46,533 | ||||||
Lance A. Berry | 32,247 | 10,923 | 10,923 | ||||||
Kevin D. Cordell | 29,511 | 9,996 | 9,996 | ||||||
Jason D. Asper | 35,303 | 12,321 | N/A | ||||||
163
Named executive officer | Stock options (#) | RSU awards (#) | PSU awards (assuming target performance) (#) | ||||||
James A. Lightman | 18,074 | 6,122 | 6,122 | ||||||
Additional information concerning the long-term incentive compensation information for our named executive officers for 2017 is included in the Summary Compensation Table and Grants of Plan-Based Awards Table under the heading “Executive Compensation Tables and Narratives.”
All Other Compensation
Retirement Benefits. In 2017, our named executive officers had the opportunity to participate in retirement plans maintained by our operating subsidiaries, including a 401(k) plan, on the same basis as our other employees. We believe these plans provide an opportunity for our executives to plan for and meet their retirement savings needs. Except for these plans, we do not provide pension arrangements or post-retirement health coverage for our employees, including named executive officers. We also do not provide any nonqualified defined contribution or other deferred compensation plans.
Relocation Benefits. We provide our executive officers with customary relocation assistance benefits if they relocate at our request. Tax protection may be provided in these situations to avoid an executive being penalized from a tax perspective for a relocation on behalf of our company. During 2017, both Messrs. Asper and Lightman received relocation benefits. The value of these benefits can be found under “Executive Compensation Tables and Narratives-Summary Compensation Information-All Other Compensation for 2017-Supplemental.”
Perquisites and Other Benefits. We provide our executive officers with modest perquisites to attract and retain them. The perquisites provided to our named executive officers during 2017 included $1,000 for certain personal insurance premiums and up to $5,000 reimbursement for financial and tax planning and tax preparation. In addition, we are required to provide our CEO additional perquisites under the terms of his employment agreement, which we agreed upon at the time of his initial hiring by legacy Wright to attract him to our company. These additional perquisites include additional reimbursement for financial and tax planning and tax preparation, a monthly allowance of $7,500 for housing and automobile expenses, reimbursement for reasonable travel expenses between Memphis, Tennessee and his residences, and an annual physical examination. To the extent that the reimbursements for his housing and automobile expenses and travel expenses between Memphis, Tennessee and his residences are not deductible by Mr. Palmisano for income tax purposes, such amounts are “grossed-up” for income tax purposes so that the reimbursed items will be received net of any deduction for income and payroll taxes. We agreed to this gross-up provision at the time of his initial hiring by legacy Wright to attract him to our company and ease the financial burden on him to travel between Memphis, Tennessee and his residences.
In addition, in 2017, we provided certain additional benefits to Mr. Asper to encourage him to accept an offer of employment with us, including a sign-on bonus, guaranteed pro rata annual incentive bonus for 2017 and reimbursement for reasonable travel expenses between Memphis, Tennessee and his current residence in Chicago, Illinois. The sign-on bonus must be paid back by Mr. Asper if he voluntarily terminates his employment with Wright prior to the two-year anniversary of his hire date.
We believe perquisites and certain other benefits are an important part of our overall compensation package and help us accomplish our goal of attracting, retaining, and rewarding top executive talent. The value of all of the perquisites and other compensation provided to our named executive officers for 2017 can be found under “Executive Compensation Tables and Narratives- Summary Compensation Information-All Other Compensation for 2017-Supplemental.”
Change in Control and Post-Termination Severance Arrangements
Change in Control Arrangements. To encourage continuity, stability and retention when considering the potential disruptive impact of an actual or potential corporate transaction, we have established change in control arrangements, including provisions in our equity-based compensation plans, separation pay agreements with our executives, and our employment agreement with our CEO, which are described in more detail below and under “Executive Compensation Tables and Narratives-Potential Payments Upon a Termination or Change in Control.” These arrangements are designed to incentivize our executives to remain with our company in the event of a change in control or potential change in control.
Under the terms of our prior equity plan and the individual award documents provided to recipients of awards under that plan, all stock options and RSU awards will become immediately vested (and, in the case of options, exercisable) upon the completion of a change in control of our company. Thus, the immediate vesting of stock options and RSU awards is triggered by the change in control, itself, and thus is known as a “single trigger” change in control arrangement. The intent of our prior “single trigger” equity acceleration change in control arrangements was to provide retention incentives during what can often be an uncertain time for employees. They also provided executives with additional monetary motivation to focus on and complete a transaction that our board of directors believes is in the best interests of our company and shareholders rather than to seek new employment opportunities. The immediate acceleration of equity-based awards also aligned the interests of our executives and other employees with those
164
of our shareholders by allowing our executives to participate fully in the benefits of a change in control as to all of their equity. If an executive were to leave before the completion of the change in control, unvested awards held by the executive would terminate.
However, we recognized that our single trigger change in control arrangements did not align with current market practice and the desires of many of our shareholders. Accordingly, in connection with our new 2017 equity plan that our shareholders approved at our 2017 annual general meeting, we implemented a new “double trigger” change in control provision with respect to equity awards. Under this new provision, equity awards granted under the 2017 equity plan will not vest in connection with a change in control unless there is a termination event or the equity awards are not continued, assumed or substituted with like awards by the successor. The equity awards granted to our named executive officers during 2017 were granted under the 2017 equity plan and, therefore, are subject to the new “double trigger” change in control provision.
In addition to the change in control provisions in our 2017 equity plan, we have entered into an employment agreement with our CEO and separation pay agreements with our other named executive officers and other officers which provide certain payments and benefits in the event of a termination of employment in connection with a change in control. These “double trigger” change in control protections are intended to induce executives to accept or continue employment with our company, provide consideration to executives for certain restrictive covenants that apply following termination of employment, and provide continuity of management in connection with a threatened or actual change in control transaction. If an executive’s employment is terminated without “cause” or by the executive for “good reason” (as such terms are defined in the agreements) within 12 months (24 months for our CEO) following a change in control, the executive will be entitled to receive a severance payment and certain benefits. These arrangements and a quantification of the payment and benefits provided under these arrangements are described in more detail under “Executive Compensation Tables and Narratives-Potential Payments Upon a Termination or Change in Control.”
We believe our change in control arrangements are an important part of our executive compensation program in part because they mitigate some of the risk for executives working in a smaller company where there is a meaningful likelihood that the company may be acquired. Change in control benefits are intended to attract and retain qualified executives who, absent these arrangements and in anticipation of a possible change in control of our company, might consider seeking employment alternatives to be less risky than remaining with our company through the transaction. We believe that relative to our company’s overall value, our potential change in control benefits are relatively small and are aligned with current peer company practices.
Other Severance Arrangements. Each of our named executive officers is entitled to receive severance benefits upon certain other qualifying terminations of employment, other than a change in control, pursuant to the provisions of an employment agreement for our CEO and separation pay agreements for our other named executive officers. These severance arrangements are intended to induce the executives to accept or continue employment with our company and are primarily intended to retain our executives and provide consideration to those executives for certain restrictive covenants that apply following a termination of employment. Additionally, we entered into these agreements because they provide us valuable protection by subjecting the executives to restrictive covenants that prohibit the disclosure of confidential information during and following their employment and limit their ability to engage in competition with us or otherwise interfere with our business relationships following their termination of employment.
For more information on our severance arrangements with our named executive officers, see the discussions below under “-Executive Compensation Tables and Narratives-Potential Payments Upon a Termination or Change in Control.”
Stock Ownership Guidelines
We have established stock ownership guidelines that are intended to further align the interests of our executives with those of our shareholders. Stock ownership targets for each of our executive officers have been set at that number of our ordinary shares with a value equal to a multiple of the executive’s annual base salary. Each of the executive officers has five years from the date of hire or, if the ownership multiple has increased during his or her tenure, five years from the date established in connection with such increase to reach his or her stock ownership targets. Until his or her stock ownership target is achieved, each executive is required to retain an amount equal to 75% of the net shares received as a result of the exercise of stock options or the vesting of RSU awards. If there is a significant decline in the price of our ordinary shares that causes executives to be out of compliance, such executives will be subject to the 75% retention ratio, but will not be required to purchase additional shares to meet the applicable targets. Our compensation committee reports on compliance with the guidelines at least annually to our board of directors. Each of our named executive officers is in compliance with our stock ownership guidelines, taking to account the five-year compliance deadline for new hires.
Named executive officer | Stock ownership target as a multiple of base salary | In compliance (yes/no) | ||
Robert J. Palmisano | 4x | Yes | ||
Lance A. Berry | 2x | Yes | ||
Kevin D. Cordell | 2x | Yes | ||
165
Named executive officer | Stock ownership target as a multiple of base salary | In compliance (yes/no) | ||
Jason D. Asper | 2x | Yes | ||
James A. Lightman | 2x | Yes | ||
Anti-Hedging and Pledging
Our code of conduct on insider trading and confidentiality prohibits our executive officers from engaging in hedging transactions, such as short sales, transactions in publicly traded options, such as puts, calls and other derivatives, and pledging our ordinary shares.
Clawback Policy
During 2017, we adopted a clawback policy that authorizes recovery of gains from incentive compensation, including equity awards, in the event of certain financial restatements. In addition, under our equity plans, if an executive is determined by the compensation committee to have taken action that would constitute “cause” or an “adverse action,” as those terms are defined in the plan, during or within one year after the termination of the executive’s employment, all rights of the executive under the plan and any agreements evidencing an equity award then held by the executive will terminate and be forfeited. In addition, the compensation committee may require the executive to surrender and return to us any shares received, and/or to disgorge any profits or any other economic value made or realized by the executive in connection with any awards or any shares issued upon the exercise or vesting of any awards during or within one year after the termination of the executive’s employment or other service. Mr. Palmisano’s employment agreement also contains a clawback provision in the event of certain financial restatements.
Risk Assessment
As a result of our annual assessment on risk in our compensation programs, we concluded that our compensation policies, practices, and programs and related compensation governance structure, work together in a manner so as to encourage our executives (and other employees) to pursue growth strategies that emphasize shareholder value creation, but not to take unnecessary or excessive risks that could threaten the value of our company. For more information on this assessment, see the discussions below under “-Executive Compensation Tables and Narratives-Risk Assessment of Compensation Policies, Practices and Programs.”
Executive Compensation Decision Making
Role of Compensation Committee and Board. The responsibilities of the compensation committee include reviewing and approving corporate goals and objectives relevant to the compensation of our executive officers, evaluating each executive’s performance in light of those goals and objectives and, either as a committee or together with the other directors, determining and approving each executive’s compensation, including performance-based compensation based on these evaluations (and, in the case of executives, other than the CEO, the CEO’s evaluation of such executive’s individual performance). Consistent with our shareholder-approved board of directors compensation policy, the compensation package for our CEO, who also serves as executive director of our company, is determined by our non-executive directors, based upon recommendations from the compensation committee.
In setting or recommending executive compensation for our named executive officers, the compensation committee considers the following primary factors:
• | each executive’s position within the company and the level of responsibility; |
• | the ability of the executive to impact key business initiatives; |
• | the executive’s individual experience and qualifications; |
• | compensation paid to executives of comparable positions by companies similar to us; |
• | company performance, as compared to specific pre-established objectives; |
• | individual performance, generally and as compared to specific pre-established objectives; |
• | the executive’s current and historical compensation levels; |
• | advancement potential and succession planning considerations; |
• | an assessment of the risk that the executive would leave us and the harm to our business initiatives if the executive left; |
• | the retention value of executive equity holdings, including outstanding stock options, RSU awards and PSU awards; |
• | the dilutive effect on the interests of our shareholders of long-term equity-based incentive awards; and |
• | anticipated share-based compensation expense as determined under applicable accounting rules. |
166
The compensation committee also considers the recommendations of our CEO with respect to executive compensation to be paid to other executives. In making its final decision regarding the form and amount of compensation to be paid to our named executive officers (other than the CEO), the compensation committee considers and gives great weight to the recommendations of the CEO recognizing that due to his reporting and otherwise close relationship with each executive, the CEO often is in a better position than the compensation committee to evaluate the performance of each executive (other than himself). In making its final decision regarding the form and amount of compensation to be paid to the CEO, the compensation committee considers the results of the CEO’s self-review and his individual annual performance review by the compensation committee, benchmarking data gathered by our compensation consultant, and the recommendations of our non-executive directors.
Role of Management. Three members of our executive team play a role in our executive compensation process and regularly attend meetings of the compensation committee - the CEO, Senior Vice President, Human Resources, and Senior Vice President, General Counsel and Secretary. The CEO assists the compensation committee primarily by making formal recommendations regarding the amount and type of compensation to be paid to executives (other than himself). In making these recommendations, the CEO considers many of the same factors listed above that the compensation committee considers in setting executive compensation, including in particular the results of each executive’s annual performance review and the executive’s achievement of his or her individual management performance objectives established in connection with our PIP, described below. The Senior Vice President, Human Resources assists the compensation committee primarily by gathering compensation related data regarding executives and coordinating the exchange of this information and other executive compensation information among the members of the compensation committee, the compensation committee’s compensation consultant and management in anticipation of compensation committee meetings. The Senior Vice President, General Counsel and Secretary assists the compensation committee primarily by ensuring compliance with legal and regulatory requirements and educating the committee on executive compensation trends and best practices from a corporate governance perspective and acting as corporate secretary of meetings. Final deliberations and decisions regarding the compensation to be paid to each executive, however, are made by our board of directors or compensation committee without the presence of the executive.
Role of Consultant. The compensation committee has retained the services of Mercer (US) Inc. (Mercer) to provide executive compensation advice. Mercer’s engagement by the compensation committee includes reviewing and advising on all significant aspects of executive compensation, as well as non-executive director compensation. This includes base salaries, short-term cash incentives and long-term equity incentives for executives. At the request of the compensation committee, each year, Mercer recommends a peer group of companies, collects relevant market data from these companies to allow the compensation committee to compare elements of our compensation program to those of our peers, provides information on executive compensation trends and implications for us and makes other recommendations to the compensation committee regarding certain aspects of our executive compensation program. Our management, principally the Senior Vice President, Human Resources and the chair of the compensation committee, regularly consult with a representative of Mercer before compensation committee meetings. A representative of Mercer regularly attends meetings of the compensation committee. In making its final decision regarding the form and amount of compensation to be paid to executives, the compensation committee considers the information gathered by and recommendations of Mercer. The compensation committee values Mercer’s benchmarking information and input regarding best practices and trends in executive compensation matters.
Use of Peer Group and Other Market Data. To help determine appropriate levels of compensation for certain elements of our executive compensation program, the compensation committee reviews annually the compensation levels of our named executive officers and other executives against the compensation levels of comparable positions with companies similar to us in terms of industry, revenues, products and operations. The elements of our executive compensation program to which the compensation committee “benchmarks” or uses to base or justify a compensation decision or to structure a framework for compensating executives include base salary, short-term cash incentive opportunity, and long-term equity incentives. With respect to other elements of our executive compensation program, such as perquisites, severance, and change in control arrangements, the compensation committee benchmarks these elements on a periodic or as needed basis and in some cases uses peer group or market data more as a “market check” after determining the compensation on some other basis. The compensation committee believes that compensation paid by peer group companies is more representative of the compensation required to attract, retain, and motivate our executive talent than broader survey data and that compensation paid by peer companies that are in the same industry, with similar products and operations, and with revenues in a range similar to us, generally provides more relevant comparisons.
167
In 2016, Mercer worked with the compensation committee to identify a peer group of 13 companies. Companies in the peer group are public companies in the health care equipment and supplies business with products and operations similar to ours and that had annual revenues generally within a range of our annual revenues. The peer group included the following companies:
The Cooper Companies, Inc. | Masimo Corporation | NuVasive, Inc. |
Globus Medical, Inc. | Merit Medical Systems, Inc. | ResMed Inc. |
Greatbatch, Inc. | Natus Medical Incorporated | Insulet Corporation |
Haemonetics Corporation | NxStage Medical, Inc. | Abiomed, Inc. |
Integra LifeSciences Holdings Corporation | ||
The table below sets forth certain revenue and other financial information as of a date available prior to the date Mercer used to compile the proposed peer group and market capitalization information as of May 31, 2016 regarding the peer group that the compensation committee used in connection with its recommendations and decisions regarding executive compensation for 2017.
Trailing 12-month revenue (in millions) | One-year revenue growth | Three-year revenue growth | Trailing 12-month EBIT | Market capitalization (in millions) | |||||
25th percentile | $374 | 6% | 24% | $58 | $1,217 | ||||
50th percentile | 647 | 7% | 29% | 107 | 2,315 | ||||
75th percentile | 917 | 12% | 39% | 137 | 2,770 | ||||
Wright's percentile rank | 52% | N/A | N/A | N/A | 45% | ||||
In reviewing benchmarking data, the compensation committee recognizes that benchmarking may not always be appropriate as a stand-alone tool for setting compensation due to aspects of our business and objectives that may be unique to us. Nevertheless, the compensation committee believes that gathering this information is an important part of its compensation-related decision-making process. However, where a sufficient basis for comparison does not exist between the peer group data and an executive, the compensation committee gives less weight to the peer group data. For example, relative compensation benchmarking analysis does not consider individual specific performance or experience or other case-by-case factors that may be relevant in hiring or retaining a particular executive.
Market Positioning. In general, we target base salary and total compensation levels to be within a reasonable range of the 67th percentile of our peer group. However, the specific competitiveness of any individual executive’s pay will be determined considering factors like the executive’s experience, skills and capabilities, contributions as a member of the executive management team, and contributions to our overall performance. The compensation committee will also consider the sufficiency of total compensation potential and the structure of pay plans to ensure the hiring or retention of an executive when considering the compensation potential that may be available elsewhere.
Tax Deductibility of Compensation
In designing our executive compensation program, we consider the deductibility of executive compensation under Code Section 162(m), which provides that we may not deduct more than $1 million (referred to as the $1 Million Cap) paid to certain executive officers. During 2017, there was an exception for “performance-based” compensation meeting certain requirements. Our equity plans incorporate provisions intended to satisfy the requirements for awarding “performance-based” compensation as defined in Code Section 162(m) under the plan. Other than stock options and our PSU awards, we did not grant any other “performance-based” compensation under the plans during 2017. In addition, while we designed our plans to operate in a manner intended to qualify as “performance-based” under Code Section 162(m), the compensation committee may administer the plans in a manner that does not satisfy the requirements of Code Section 162(m) to achieve a result that the compensation committee determines to be appropriate.
The Tax Cuts and Jobs Act signed into law on December 22, 2017 (referred to as the Tax Act), repealed the exception from the $1 Million Cap for “performance-based” compensation. This change is effective for our fiscal years beginning January 1, 2018 and thereafter. In addition, the Tax Act expanded the group of executive officers who are subject to the $1 Million Cap. The revised limit for the $1 Million Cap will apply to any named executive officer who in the fiscal year ending in 2017, or in any year thereafter, was either the principal executive officer, the principal financial officer, or one of the three highest paid officers (referred to as a Covered Employee), and, once the limit applies to a Covered Employee, all future compensation payable to or on behalf of that individual will remain subject to the $1 Million Cap. As a result, compensation amounts that were previously outside of the scope of the $1 Million Cap will now be subject to it. Despite the changes to Code Section 162(m) as a result of the Tax Act, we expect that we will continue to structure our executive compensation program so that a significant portion of total executive compensation is linked to the performance of our company.
168
Compensation Committee Report
The compensation committee has reviewed and discussed the foregoing “-Compensation Discussion and Analysis” with our management. Based on this review and these discussions, the compensation committee has recommended to our board of directors that the foregoing “-Compensation Discussion and Analysis” be included in our Annual Report on Form 10-K for the fiscal year ended December 31, 2017 and proxy statement in connection with our 2018 annual general meeting of shareholders.
Compensation Committee
John L. Miclot
Kevin C. O’Boyle
Elizabeth H. Weatherman
Executive Compensation Tables and Narratives
Summary Compensation Information
The table below provides summary information concerning all compensation awarded to, earned by, or paid to the individuals that served as our principal executive officer or principal financial officer during the fiscal year ended December 31, 2017 and other named executive officers for each of the last three fiscal years of which they served as an executive officer.
SUMMARY COMPENSATION TABLE - 2017
Name and principal position | Year | Salary(1) ($) | Bonus(2) ($) | Stock awards(3) ($) | Option awards(4) ($) | Non-equity incentive plan compensation(5) ($) | All other compen-sation(6) ($) | Total ($) | ||||||||||||||
Robert J. Palmisano(7) President and Chief Executive Officer and Executive Director | 2017 | 945,792 | — | 2,592,818 | 1,346,571 | — | 261,593 | 5,146,774 | ||||||||||||||
2016 | 905,095 | — | 2,003,654 | 2,004,824 | 1,435,928 | 264,272 | 6,613,773 | |||||||||||||||
2015 | 228,185 | — | 5,972,830 | 5,914,722 | 1,247,655 | 1,668,463 | 15,031,855 | |||||||||||||||
Lance A. Berry(8) Senior Vice President and Chief Financial Officer | 2017 | 440,146 | — | 608,630 | 316,095 | — | 16,800 | 1,381,671 | ||||||||||||||
2016 | 409,119 | — | 449,375 | 449,628 | 418,650 | 17,430 | 1,744,202 | |||||||||||||||
2015 | 105,894 | — | 837,275 | 829,143 | 343,379 | 253,346 | 2,369,037 | |||||||||||||||
Kevin D. Cordell(9) President, U.S. | 2017 | 466,371 | — | 556,978 | 289,276 | 84,718 | 16,800 | 1,414,143 | ||||||||||||||
2016 | 429,789 | — | 432,510 | 432,765 | 376,693 | 16,600 | 1,688,357 | |||||||||||||||
Jason D. Asper(10) Senior Vice President, Strategy and Corporate Development | 2017 | 115,962 | 452,183 | 351,765 | 354,619 | — | 29,151 | 1,303,680 | ||||||||||||||
James A. Lightman(11) Senior Vice President, General Counsel and Secretary | 2017 | 399,366 | — | 341,118 | 177,167 | 30,266 | 208,207 | 1,156,124 | ||||||||||||||
2016 | 384,006 | — | 263,610 | 263,764 | 192,003 | 10,600 | 1,113,983 | |||||||||||||||
2015 | 97,295 | — | 561,420 | 555,955 | 253,015 | 285,730 | 1,753,415 | |||||||||||||||
____________________
(1) | Five percent of Mr. Palmisano’s annual base salary was allocated to his service as an executive director and member of our board of directors. |
(2) | We generally do not pay any discretionary bonuses or bonuses that are subjectively determined and did not pay any such bonuses to any named executive officers in 2017, other than a sign-on bonus and guaranteed pro rata annual bonus paid to Mr. Asper as part of his offer package. Annual cash incentive bonus payouts based on performance against pre-established performance goals under our performance incentive plan are reported in the “Non-equity incentive plan compensation” column. |
169
(3) | Amounts reported represent the aggregate grant date fair value for RSU and PSU awards for 2017 and RSU awards for 2016 and 2015, in each case computed in accordance with FASB ASC Topic 718. The grant date fair value is determined based on the per share closing sale price of our ordinary shares on the grant date. Amounts reported for each named executive officer and each award for 2017 are set forth in the “Grants of Plan-Based Awards - 2017” table in the “Grant Date Fair Value of Stock and Option Awards” column. Provided below is the 2017 grant date fair value of PSU awards assuming maximum levels of performance. The maximum value is calculated using the number of shares reflected in the “Maximum” column of the “Estimated Future Payouts Under Equity Incentive Plan Awards” section of the “Grants of Plan-Based Awards - 2017” table and the closing price of our ordinary shares on July 25, 2017, the grant date, of $27.86, as reported by Nasdaq Global Select Market. |
Name | Grant Date Fair Value at Maximum Levels of Performance ($) | ||
Mr. Palmisano | 2,592,818 | ||
Mr. Berry | 608,630 | ||
Mr. Cordell | 556,977 | ||
Mr. Asper | — | ||
Mr. Lightman | 341,118 | ||
(4) | Amounts reported represent the aggregate grant date fair value for option awards granted to each named executive officer computed in accordance with FASB ASC Topic 718. The grant date fair value is determined based on our Black-Scholes option pricing model. The table below sets forth the specific assumptions used in the valuation of each such option award: |
Grant date | Grant date fair value per share ($) | Risk free interest rate | Expected life | Expected volatility | Expected dividend yield | |||||
07/25/2017 | 9.80 | 1.875% | 6.10 years | 32.50% | — | |||||
08/14/2017 | 10.05 | 1.875% | 6.10 years | 32.50% | — | |||||
07/19/2016 | 7.40 | 1.125% | 6.08 years | 34.00% | — | |||||
10/13/2015 | 7.06 | 1.375% | 6.08 years | 32.70% | — | |||||
(5) | Amounts reported represent payouts under our performance incentive plan and for each year reflect the amounts earned for that year but paid during the following year. |
(6) | Amounts reported in this column for 2017 are described under “-All Other Compensation for 2017 - Supplemental.” |
(7) | Mr. Palmisano was appointed our President and Chief Executive Officer effective upon completion of the Wright/Tornier merger, on October 1, 2015. Prior to such time, Mr. Palmisano served as President and Chief Executive Officer of Wright Medical Group, Inc. and, in such capacity, earned or was awarded or paid salary and other compensation by legacy Wright prior to October 1, 2015, which amounts are not included in the above table. |
(8) | Mr. Berry was appointed our Senior Vice President and Chief Financial Officer effective upon completion of the Wright/Tornier merger, on October 1, 2015. Prior to such time, Mr. Berry served as Senior Vice President and Chief Financial Officer of Wright Medical Group, Inc. and, in such capacity, earned or was paid salary and other compensation by legacy Wright prior to October 1, 2015, which amounts are not included in the above table. |
(9) | Mr. Cordell was not a named executive officer in 2015; therefore, his information is only provided for 2017 and 2016. |
(10) | Mr. Asper was appointed our Senior Vice President, Strategy and Corporate Development effective August 14, 2017 and was not a named executive officer in 2016 or 2015; therefore, his information is only provided for 2017. |
(11) | Mr. Lightman was appointed our Senior Vice President, General Counsel and Secretary effective upon completion of the Wright/Tornier merger, on October 1, 2015. Prior to such time, Mr. Lightman served as Senior Vice President, General Counsel and Secretary of Wright Medical Group, Inc. and, in such capacity, earned or was paid salary and other compensation by legacy Wright prior to October 1, 2015, which amounts are not included in the above table. |
Agreements with Robert J. Palmisano. Effective October 1, 2015, we entered into a service agreement and one of our subsidiaries entered into an employment agreement with Robert J. Palmisano, our President and Chief Executive Officer.
The service agreement deals with certain Dutch law matters relating to Mr. Palmisano’s role as an executive director. Under the terms of the service agreement, we have allocated a portion of Mr. Palmisano’s annual base salary to his service as an executive director, which amounts are paid after deduction of applicable withholdings for taxes and social security contributions. In addition, under the terms of the service agreement, we have agreed to provide Mr. Palmisano with indemnification and director and officer liability insurance, on terms and conditions that are at least as favorable to Mr. Palmisano as those then provided to any other current or former director or executive officer of our company or any of our affiliates.
170
The employment agreement provides that during the term of the agreement, Mr. Palmisano will serve as President and Chief Executive Officer of our company and each principal operating subsidiary and will report to our Chairman and board of directors. During the term, we agreed to nominate Mr. Palmisano for election as an executive director and member of our board of directors at each annual general meeting of shareholders. The employment agreement expires on December 31, 2019, subject to earlier termination under certain circumstances. On October 1, 2018 and on each anniversary thereafter, the term will automatically extend for an additional one-year period, unless at least 30 days prior to such date, either party gives notice of non-extension to the other.
With respect to compensation, the employment agreement established an annual base salary for Mr. Palmisano and provides that our board of directors will review his compensation at least annually for any increase. The employment agreement acknowledges that a certain percentage of Mr. Palmisano’s base salary will be paid by Wright Medical Group N.V. in consideration for his services as an executive director under the service agreement described above. The employment agreement provides that Mr. Palmisano is eligible to receive an annual performance incentive bonus depending on whether, and to what extent, certain performance goals established by the compensation committee for such year have been achieved. The amount of the performance incentive bonus payable to Mr. Palmisano will be targeted at 100% of his annual base salary and will not exceed 200% of his annual base salary. The employment agreement provides that Mr. Palmisano will receive an annual equity grant equal to 300% of his annual base salary. In addition, the employment agreement provides that Mr. Palmisano is eligible to participate in the fringe benefit programs, including those for medical and disability insurance and retirement benefits that we generally make available to our executive officers from time to time. During the term, Mr. Palmisano will be reimbursed for up to $1,000 for personal insurance premiums, other than for insurance coverage that pays for medical, prescription drug, dental, vision, or other medical care expenses. In addition, he may elect, in accordance with our cafeteria plan rules, not to participate in the medical and disability insurance programs provided by us, in which case, we will pay him up to $900 per month (or such greater amount that we would otherwise pay for medical and disability coverage for him and his spouse under our benefits programs). Mr. Palmisano is also entitled to receive reimbursement for up to $15,000 for financial and tax planning and tax preparation, and an annual physical examination at our expense. The employment agreement also provides for a monthly allowance of $7,500 for housing and automobile expenses, and Mr. Palmisano will be reimbursed for reasonable travel expenses between Memphis, Tennessee and his residences. To the extent that these reimbursements are not deductible by Mr. Palmisano for income tax purposes, such amounts will be “grossed-up” for income tax purposes so that the reimbursed items will be received net of any deduction for income and payroll taxes. The employment agreement contains severance provisions as described in more detail under “-Potential Payments Upon a Termination or Change in Control.” We have guaranteed the obligations of our subsidiary under Mr. Palmisano’s employment agreement.
Mr. Palmisano and one of our subsidiaries also entered into a confidentiality, non-competition, non-solicitation and intellectual property rights agreement, pursuant to which Mr. Palmisano agreed to certain covenants that impose obligations on him regarding confidentiality of information, transfer of inventions, non-solicitation of employees, customers and suppliers, and non-competition with our business.
Agreements with Other Named Executive Officers. Each of the other named executive officers also is a party to a confidentiality, non-competition, non-solicitation and intellectual property rights agreement with us, the material terms of which are substantially similar to Mr. Palmisano’s agreement, as described above. In addition, through one of our subsidiaries, we have entered into separation pay agreements with our named executive officers who are currently executive officers, other than Mr. Palmisano, which agreements are described in more detail under “-Potential Payments Upon a Termination or Change in Control.”
Offer Letter with Jason D. Asper. In July 2017, we entered into an offer letter with Mr. Asper pursuant to which we agreed to provide him certain additional benefits to encourage him to accept an offer of employment with us, including a sign-on bonus, guaranteed pro rata annual incentive bonus for 2017 and reimbursement for reasonable travel expenses between Memphis, Tennessee and his current residence in Chicago, Illinois. The sign-on bonus must be paid back by Mr. Asper if he voluntarily terminates his employment with Wright prior to the two-year anniversary of his hire date.
Indemnification Agreements. We have entered into indemnification agreements with all of our named executive officers. The indemnification agreements are governed by the laws of the State of Delaware (USA) and provide, among other things, for indemnification to the fullest extent permitted by law and our articles of association against any and all expenses (including attorneys’ fees) and liabilities, judgments, fines and amounts paid in settlement that are paid or incurred by the executive or on his or her behalf in connection with such action, suit or proceeding. We will be obligated to pay these amounts only if the executive acted in good faith and in a manner he or she reasonably believed to be in or not opposed to the best interests of our company. The indemnification agreements provide that the executive will not be indemnified and expenses advanced with respect to an action, suit or proceeding initiated by the executive unless (i) so authorized or consented to by our board of directors or the company has joined in such action, suit or proceeding or (ii) the action, suit or proceeding is one to enforce the executive’s rights under the indemnification agreement. The company’s indemnification and expense advance obligations are subject to the condition that an appropriate person or body not party to the particular action, suit or proceeding shall not have determined that the executive is not permitted to be indemnified under applicable law. The indemnification agreements also set forth procedures that apply in the event an executive requests indemnification or an expense advance.
171
All Other Compensation for 2017 - Supplemental. The table below provides information concerning amounts reported in the “All other compensation” column of the Summary Compensation Table for 2017 with respect to each named executive officer. Additional detail on these amounts are provided below the table.
Name | Retirement benefits $ | Housing/car allowance $ | Commuting expenses $ | Relocation benefits $ | Financial and tax planning $ | Insurance premium $ | Gross-up payments $ | Total other compensation $ | ||||||||||||||||
Mr. Palmisano | 10,800 | 90,000 | 43,250 | — | 15,000 | 10,800 | 91,743 | 261,593 | ||||||||||||||||
Mr. Berry | 10,800 | — | — | — | 5,000 | 1,000 | — | 16,800 | ||||||||||||||||
Mr. Cordell | 10,800 | — | — | — | 5,000 | 1,000 | — | 16,800 | ||||||||||||||||
Mr. Asper | — | — | 29,151 | — | — | — | — | 29,151 | ||||||||||||||||
Mr. Lightman | 9,814 | — | — | 193,393 | 5,000 | — | — | 208,207 | ||||||||||||||||
Retirement Benefits. Under our 401(k) plan, participants, including our named executive officers, may voluntarily request that we reduce his or her pre-tax compensation and contribute such amounts to the 401(k) plan’s trust up to certain statutory maximums. We contribute matching contributions in an amount equal to 3% of the participant’s eligible earnings for a pay period, or if less, 50% of the participant’s pre-tax 401(k) contributions (other than catch-up contributions) for that pay period. We do not provide any nonqualified defined contribution or other deferred compensation plans for our executives, although Mr. Asper's benefits were in the form of commuting expenses.
Relocation Benefits. We provide our executive officers with customary relocation assistance benefits if they relocate at our request. Tax protection may be provided in these situations to avoid an executive being penalized from a tax perspective for a relocation on behalf of our company. During 2017, both Messrs. Asper and Lightman received relocation benefits.
Perquisites and Other Benefits. We provide our executive officers with modest perquisites to attract and retain them. The perquisites provided to our named executive officers during 2017 included $1,000 for certain personal insurance premiums and up to $5,000 reimbursement for financial and tax planning and tax preparation. In addition, we are required to provide our CEO additional perquisites under the terms of his employment agreement, which we agreed upon at the time of his initial hiring by legacy Wright to attract him to our company. These additional perquisites include additional reimbursement for financial and tax planning and tax preparation, a monthly allowance of $7,500 for housing and automobile expenses, reimbursement for reasonable travel expenses between Memphis, Tennessee and his residences, and an annual physical examination. To the extent that the reimbursements for his housing and automobile expenses and travel expenses between Memphis, Tennessee and his residences are not deductible by Mr. Palmisano for income tax purposes, such amounts are “grossed-up” for income tax purposes so that the reimbursed items will be received net of any deduction for income and payroll taxes. We agreed to this gross-up provision at the time of his initial hiring by legacy Wright to attract him to our company and ease the financial burden on him to travel between Memphis, Tennessee and his residences.
To encourage Mr. Asper to accept an offer of employment with us, we agreed in his offer letter to provide him a $400,000 sign-on bonus, a guaranteed pro rata target annual incentive bonus for 2017 which amounted to $52,183, and reimbursement for reasonable travel expenses between Memphis, Tennessee and his current residence in Chicago, Illinois. The sign-on bonus must be paid back by Mr. Asper if he voluntarily terminates his employment with Wright prior to the two-year anniversary of his hire date.
172
Grants of Plan-Based Awards
The table below provides information concerning grants of plan-based awards to each of our named executive officers during the fiscal year ended December 31, 2017. Non-equity incentive plan awards were granted to our named executive officers under our performance incentive plan, the material terms of which are described under “-Compensation Discussion and Analysis.” Stock awards (in the form of RSU awards and PSU awards) and option awards were granted under the Wright Medical Group N.V. 2017 Equity and Incentive Plan (2017 plan). The material terms of these awards and the material plan provisions relevant to these awards are described under “-Compensation Discussion and Analysis,” or in the notes to the table below or the narrative following the table below.
GRANTS OF PLAN-BASED AWARDS - 2017
Board approval date | Estimated future payouts under non-equity incentive plan awards(1) | Estimated future payouts under non-equity incentive plan awards(4) | All other stock awards: number of shares of stock or units(5) (#) | All other option awards: number of securities underlying options(6) (#) | Exercise or base price of option awards ($/Sh) | Grant date fair value stock and option awards(7)(8) ($) | ||||||||||||||||
Name | Grant date | Thres-hold(2) ($) | Target ($) | Maxi-mum(3) ($) | Thres-hold (#) | Target (#) | Maxi-mum (#) | |||||||||||||||
Robert J. Palmisano | ||||||||||||||||||||||
Cash incentive award | N/A | 2/15/17 | 479,257 | 958,514 | 1,917,028 | — | — | — | — | — | — | — | ||||||||||
RSU award | 7/25/17 | 7/25/17 | — | — | — | 46,533 | — | — | 1,296,409 | |||||||||||||
PSU award | 7/25/17 | 7/25/17 | — | — | — | 23,266 | 46,533 | 93,066 | — | — | — | 1,296,409 | ||||||||||
Stock option | 7/25/17 | 7/25/17 | — | — | — | — | — | — | — | 137,373 | 27.86 | 1,346,571 | ||||||||||
Lance A. Berry | ||||||||||||||||||||||
Cash incentive award | N/A | 2/15/17 | 146,250 | 292,500 | 585,000 | — | — | — | — | — | — | — | ||||||||||
RSU award | 7/25/17 | 7/25/17 | — | — | — | — | — | — | 10,923 | — | — | 304,315 | ||||||||||
PSU award | 7/25/17 | 7/25/17 | — | — | — | 5,461 | 10,923 | 21,846 | — | — | — | 304,315 | ||||||||||
Stock option | 7/25/17 | 7/25/17 | — | — | — | — | — | — | — | 32,247 | 27.86 | 316,095 | ||||||||||
Kevin D. Cordell | ||||||||||||||||||||||
Cash incentive award | N/A | 2/15/17 | 56,478 | 282,394 | 564,787 | — | — | — | — | — | — | — | ||||||||||
RSU award | 7/25/17 | 7/25/17 | — | — | — | — | — | — | 9,996 | — | — | 278,489 | ||||||||||
PSU award | 7/25/17 | 7/25/17 | — | — | — | 4,998 | 9,996 | 19,992 | — | — | — | 278,489 | ||||||||||
Stock option | 7/25/17 | 7/25/17 | — | — | — | — | — | — | — | 29,511 | 27.86 | 289,276 | ||||||||||
Jason D. Asper | ||||||||||||||||||||||
Cash incentive award | N/A | 7/24/17 | 26,092 | 52,183 | 104,366 | — | — | — | — | — | — | — | ||||||||||
RSU award | 8/14/17 | 7/25/17 | — | — | — | — | — | — | 12,321 | — | — | 351,765 | ||||||||||
Stock option | 8/14/17 | 7/25/17 | — | — | — | — | — | — | — | 35,303 | 28.55 | 354,619 | ||||||||||
James A. Lightman | ||||||||||||||||||||||
Cash incentive award | N/A | 2/15/17 | 20,177 | 201,773 | 403,545 | — | — | — | — | — | — | — | ||||||||||
RSU award | 7/25/17 | 7/25/17 | — | — | — | — | — | — | 6,122 | — | — | 170,559 | ||||||||||
PSU award | 7/25/17 | 7/25/17 | — | — | — | 3,061 | 6,122 | 12,244 | — | — | — | 170,559 | ||||||||||
Stock option | 7/25/17 | 7/25/17 | — | — | — | — | — | — | — | 18,074 | 27.86 | 177,167 | ||||||||||
____________________
(1) | Amounts reported represent estimated future payouts under our performance incentive plan. Actual payouts under these performance incentive plans are reflected in the “Non-equity incentive compensation” column of the Summary Compensation Table. |
(2) | Threshold amounts for awards payable under the performance incentive plan assume the satisfaction of the threshold level of the lowest weighted corporate performance goal. |
(3) | Maximum amounts reflect payouts at a maximum rate of 200% of target for our performance incentive plan. |
(4) | Amounts reported represent PSU awards granted under our 2017 plan. The PSU awards have a three-year performance period from June 26, 2017 to June 28, 2020. Information regarding the PSU awards is set forth within the “Compensation Discussion and Analysis” under “Long-Term Incentives-PSU Awards”. |
(5) | Amounts reported represent RSU awards granted under our 2017 plan. The RSU awards vest and become issuable over time, with the last tranche becoming issuable on August 15, 2021, in each case, so long as the individual remains an employee or consultant of our company. |
(6) | Amounts reported represent option awards granted under our 2017 plan. All options have a ten-year term and vest over a four-year period, with 25% of the underlying shares vesting on the one-year anniversary of the grant date and the remaining 75% of the underlying |
173
shares vesting over a three-year period thereafter in 36 as nearly equal as possible monthly installments, in each case, so long as the individual remains an employee or consultant of our company.
(7) | See notes (3) and (4) to the Summary Compensation Table for a discussion of the assumptions made in calculating the grant date fair value of stock and option awards. |
(8) | Amounts reported represent the grant date fair value of PSU awards, assuming target performance, based on the closing price of our ordinary shares, as reported by the Nasdaq Global Select Market, on July 25, 2017, the date of grant, of $27.86. These amounts are reflected in the “Stock Awards” column of the Summary Compensation Table. |
Wright Medical Group N.V. Performance Incentive Plan. Under the terms of the Wright Medical Group N.V. Performance Incentive Plan, our named executive officers, as well as other employees, may earn cash incentive bonuses based on our financial performance for 2017. The material terms of the plan are described in detail under “-Compensation Discussion and Analysis-Short-Term Cash Incentive Compensation.”
Wright Medical Group N.V. 2017 Equity and Incentive Plan. At an annual general meeting of shareholders held on June 23, 2017, our shareholders approved the Wright Medical Group N.V. 2017 Equity and Incentive Plan, which permits the grant of a wide variety of stock-based and cash-based awards, including non-statutory and incentive stock options, stock appreciation rights, restricted stock awards, restricted stock units, deferred stock units, performance awards, annual performance cash awards, non-employee director awards, other cash-based awards and other stock-based awards. Our 2017 plan is designed to assist us in attracting and retaining employees, directors and consultants, provide an additional incentive to such individuals to work to increase the value of our ordinary shares, and provide such individuals with a stake in our future which corresponds to the stake of our shareholders.
The 2017 plan reserves for issuance a number of ordinary shares equal to the sum of (i) 5,000,000 shares, (ii) the number of ordinary shares available for grant under the Wright Medical Group N.V. Amended and Restated 2010 Incentive Plan as of June 23, 2017 (not including issued or outstanding shares granted pursuant to options under such plan as of such date) which was 1,329,648, and (iii) the number of ordinary shares forfeited upon the expiration, cancellation, forfeiture, cash settlement, or other termination following June 23, 2017 under our 2010 plan which was 6,405,992. As of December 31, 2017, 4,430,789 ordinary shares remained available for future grant of equity awards under the 2017 plan.
Ordinary shares that are issued under the 2017 plan or that are subject to outstanding awards will be applied to reduce the maximum number of ordinary shares remaining available for issuance under the 2017 plan only to the extent they are used; provided, however, that the full number of ordinary shares subject to a stock-settled SAR or other stock-based award will be counted against the ordinary shares authorized for issuance under the 2017 plan, regardless of the number of ordinary shares actually issued upon settlement of such SAR or other stock-based award. Furthermore, any ordinary shares withheld to satisfy tax withholding obligations on awards issued under the 2017 plan, any ordinary shares withheld to pay the exercise price or grant price of awards under the 2017 plan and any ordinary shares not issued or delivered as a result of the “net exercise” of an outstanding option or settlement of a SAR in shares will be counted against the ordinary shares authorized for issuance under the 2017 plan and will not be available again for grant under the 2017 plan. Any ordinary shares subject to awards settled in cash will again be available for issuance under the 2017 plan. Any ordinary shares repurchased by us on the open market using the proceeds from the exercise of an award will not increase the number of ordinary shares available for future grant of awards. Any ordinary shares related to awards granted under the 2017 plan, and ordinary shares related to awards granted under the 2010 plan, that terminate by expiration, forfeiture, cancellation or otherwise without the issuance of the ordinary shares, will be available again for grant under the 2017 plan and correspondingly increase the total number of ordinary shares available for issuance under the 2017 plan. To the extent permitted by applicable law, ordinary shares issued in assumption of, or in substitution for, any outstanding awards of any entity acquired in any form of combination by us will not be counted against ordinary shares available for issuance pursuant to the 2017 plan. The ordinary shares available for issuance under the 2017 plan may be authorized and unissued ordinary shares or ordinary shares which have been reacquired by us.
Under the terms of the 2017 plan, stock options must be granted with a per share exercise price equal to at least 100% of the fair market value of an ordinary share on the grant date. For purposes of the plan, the fair market value of an ordinary share is the closing sale price of our ordinary shares, as reported by the Nasdaq Global Select Market. We set the per share exercise price of all stock options granted under the plan at an amount at least equal to 100% of the fair market value of our ordinary shares on the grant date. Options become exercisable at such times and in such installments as may be determined by our board of directors, provided that most options may not be exercisable after 10 years from their grant date. The vesting of our stock options is generally time-based and is as follows: 25% of the shares underlying the stock option vest on the one-year anniversary of the grant date and the remaining 75% of the underlying shares vest over a three-year period thereafter in 36 as nearly equal as possible monthly installments, in each case so long as the individual remains an employee or consultant of our company.
Currently, optionees must pay the exercise price of stock options in cash, except that the compensation committee may allow payment to be made (in whole or in part) by a “cashless exercise” effected through an unrelated broker through a sale on the open market, by a “net exercise” of the option, or by a combination of such methods. In the case of a “net exercise” of an option, we
174
will not require a payment of the exercise price of the option from the grantee but will reduce the number of our ordinary shares issued upon the exercise by the largest number of whole shares that has a fair market value that does not exceed the aggregate exercise price for the shares exercised under this method.
The 2017 plan provides for certain default rules in the event of a termination of a participant’s employment or other service. These default rules may be modified in an award agreement, any individual agreement between a participant and us or any plan or policy of our company applicable to the participant. If a participant’s employment or other service with us is terminated for cause, then all outstanding awards held by such participant will be immediately terminated and forfeited. In the event a participant’s employment or other service with us is terminated by reason of death or disability, then:
• | All outstanding stock options and SARs held by the participant will, to the extent exercisable, remain exercisable for a period of one year after such termination, but not later than the date the stock options or SARs expire and all outstanding stock options and SARs that are not exercisable will be terminated and forfeited; provided, however, that if the exercise of a stock option that is exercisable is prevented by securities laws or other restrictions, the stock option will remain exercisable until 30 days after the date such exercise first would no longer be prevented by such provisions, but in any event no later than the date the stock option expires; |
• | All outstanding unvested restricted stock awards will be terminated and forfeited; and |
• | All outstanding but unvested RSUs, performance awards, annual performance cash awards, other cash-based awards and other stock-based awards held by the participant will terminate and be forfeited. However, with respect to any awards that vest based on the achievement of performance goals, if a participant’s employment or other service with us is terminated prior to the end of the performance period of such award, but after the conclusion of a portion of the performance period (but in no event less than one year), the committee may cause shares to be delivered or payment made with respect to the participant’s award, but only if otherwise earned for the entire performance period and only with respect to the portion of the applicable performance period completed at the date of such event, with proration based on the number of months or years that the participant was employed or performed services during the performance period. |
In the event a participant’s employment or other service with us is terminated by reason other than for cause, death or disability, then:
• | All outstanding stock options and SARs held by the participant that then are exercisable will remain exercisable for three months after the date of such termination, but will not be exercisable later than the date the stock options or SARs expire and all outstanding stock options and SARs that are not exercisable will be terminated and forfeited; provided, however, that if the exercise of a stock option that is exercisable is prevented by securities laws or other restrictions, the stock option will remain exercisable until 30 days after the date such exercise first would no longer be prevented by such provisions, but in any event no later than the date the stock option expires; |
• | All outstanding unvested restricted stock awards will be terminated and forfeited; and |
• | All outstanding unvested RSUs, performance awards, annual performance cash awards, other cash-based awards and other stock-based awards will be terminated and forfeited. However, with respect to any awards that vest based on the achievement of performance goals, if a participant’s employment or other service with us is terminated prior to the end of the performance period of such award, but after the conclusion of a portion of the performance period (but in no event less than one year), the committee may, in its sole discretion, cause shares to be delivered or payment made with respect to the participant’s award, but only if otherwise earned for the entire performance period and only with respect to the portion of the applicable performance period completed at the date of such event, with proration based on the number of months or years that the participant was employed or performed services during the performance period. |
Upon a participant’s termination of employment or other service with us, the committee may, in its discretion (which may be exercised at any time on or after the grant date, including following such termination) cause stock options or SARs (or any part thereof) held by such participant as of the effective date of such termination to become or continue to become exercisable or remain exercisable following such termination of employment or service, and restricted stock, RSUs, performance awards, annual performance cash awards, other cash-based awards and other stock-based awards held by such participant as of the effective date of such termination to vest or become free of restrictions and conditions to payment, as the case may be, following such termination of employment or service, in each case in the manner determined by the committee; provided, however, that (a) no stock option or SAR may remain exercisable beyond its expiration date; (b) the committee may not adjust the amount payable pursuant to an award under the 2017 plan that is intended to qualify as “performance-based compensation” under Code Section 162(m) upwards (unless the applicable tax or securities laws change to permit committee discretion to alter the governing performance measures without obtaining shareholder approval, in which case the committee will have sole discretion to make such changes without obtaining shareholder approval); and (c) any such action by the committee adversely affecting any outstanding award will not be effective without the consent of the affected participant, except to the extent the committee is authorized by the 2017 plan to take such action.
175
If a participant is determined by the committee to have taken any action while providing services to us or within one year after termination of such services, that would constitute “cause” or an “adverse action,” as such terms are defined in the 2017 plan, all rights of the participant under the 2017 plan and any agreements evidencing an award then held by the participant will terminate and be forfeited. The committee has the authority to rescind the exercise, vesting, issuance or payment in respect of any awards of the participant that were exercised, vested, issued or paid, and require the participant to pay to us, within 10 days of receipt of notice, any amount received or the amount gained as a result of any such rescinded exercise, vesting, issuance or payment. We may defer the exercise of any stock option or SAR for up to six months after receipt of notice of exercise in order for the committee to determine whether “cause” or “adverse action” exists. We are entitled to withhold and deduct future wages to collect any amount due.
All awards also are subject to any required automatic clawback, forfeiture or other penalties pursuant to any applicable law, including without limitation under Section 304 of the Sarbanes-Oxley Act of 2002. In addition, all awards are subject to clawback, forfeiture or other penalties pursuant to any policy adopted by us and such clawback, forfeiture and/or penalty conditions or provisions as determined by the committee. In 2017, we adopted a clawback policy that provides for the clawback of certain incentive compensation in the event of certain financial accounting restatements.
As a condition of receiving awards, recipients, including our named executive officers, must agree to pay all applicable tax withholding obligations in connection with the awards. In the case of our RSU and PSU award grants, recipients upon acceptance of the award may provide a “sell-to-cover” instruction pursuant to which the executive gives instructions to, and authorizes, a brokerage firm to sell on the executive’s behalf that number of ordinary shares issuable upon vesting of the award as determined to be appropriate to generate cash proceeds sufficient to satisfy any applicable tax withholding obligations.
As described in more detail under “-Potential Payments Upon Termination or Change in Control,” if a change in control of our company occurs, then under certain circumstances, the award may vest or lapse.
Outstanding Equity Awards at Fiscal Year-End
The table below provides information regarding unexercised options awards, unvested RSU awards and unvested PSU awards for each of our named executive officers that remained outstanding at our fiscal year-end, December 31, 2017.
OUTSTANDING EQUITY AWARDS AT FISCAL YEAR-END - 2017
Option awards | Stock awards | ||||||||||||||||||||||
Name | Number of securities underlying unexercised options exercisable (#) | Number of securities underlying unexercised option unexercisable(1) (#) | Option exercise price ($) | Option expiration date(2) | Number of shares or units of stock that have not vested(3) (#) | Market value of shares or units that have not vested(4) ($) | Equity incentive plan awards: number of unearned shares, units or other rights that have not vested(5) (#) | Equity incentive plan awards: market or payout value of unearned shares, units or other rights that have not vested(6) ($) | |||||||||||||||
Robert J. Palmisano | |||||||||||||||||||||||
Stock options | 628,849 | — | 15.55 | 09/17/2021 | |||||||||||||||||||
4,112 | — | 17.70 | 04/16/2022 | ||||||||||||||||||||
145,500 | — | 20.75 | 05/09/2022 | ||||||||||||||||||||
9,771 | — | 22.55 | 04/17/2023 | ||||||||||||||||||||
144,625 | — | 23.93 | 05/14/2023 | ||||||||||||||||||||
7,939 | — | 30.14 | 04/01/2024 | ||||||||||||||||||||
129,462 | — | 29.06 | 05/13/2024 | ||||||||||||||||||||
453,624 | 384,559 | 20.62 | 10/13/2025 | ||||||||||||||||||||
95,960 | 175,116 | 21.24 | 07/19/2026 | ||||||||||||||||||||
— | 137,373 | 27.86 | 07/25/2027 | ||||||||||||||||||||
RSU awards | 262,116 | 5,818,975 | |||||||||||||||||||||
PSU award | 46,533 | 1,033,033 | |||||||||||||||||||||
176
Option awards | Stock awards | ||||||||||||||||||||||
Name | Number of securities underlying unexercised options exercisable (#) | Number of securities underlying unexercised option unexercisable(1) (#) | Option exercise price ($) | Option expiration date(2) | Number of shares or units of stock that have not vested(3) (#) | Market value of shares or units that have not vested(4) ($) | Equity incentive plan awards: number of unearned shares, units or other rights that have not vested(5) (#) | Equity incentive plan awards: market or payout value of unearned shares, units or other rights that have not vested(6) ($) | |||||||||||||||
Lance A. Berry | |||||||||||||||||||||||
Stock options | 10,309 | — | 28.32 | 05/14/2018 | |||||||||||||||||||
6,575 | — | 15.01 | 05/13/2019 | ||||||||||||||||||||
9,635 | — | 17.82 | 05/13/2020 | ||||||||||||||||||||
12,528 | — | 15.04 | 05/11/2021 | ||||||||||||||||||||
1,924 | — | 17.70 | 04/16/2022 | ||||||||||||||||||||
19,557 | — | 20.75 | 05/09/2022 | ||||||||||||||||||||
30,602 | — | 23.93 | 05/14/2023 | ||||||||||||||||||||
18,262 | — | 29.06 | 05/13/2024 | ||||||||||||||||||||
63,590 | 53,909 | 20.62 | 10/13/2025 | ||||||||||||||||||||
21,521 | 39,274 | 21.24 | 07/19/2026 | ||||||||||||||||||||
— | 32,247 | 27.86 | 07/25/2027 | ||||||||||||||||||||
RSU awards | 47,094 | 1,045,487 | |||||||||||||||||||||
PSU award | 10,923 | 242,491 | |||||||||||||||||||||
Kevin D. Cordell | |||||||||||||||||||||||
Stock options | 34,626 | — | 30.08 | 09/26/2024 | |||||||||||||||||||
36,337 | 30,805 | 20.62 | 10/13/2025 | ||||||||||||||||||||
20,714 | 37,801 | 21.24 | 07/19/2026 | ||||||||||||||||||||
— | 29,511 | 27.86 | 07/25/2027 | ||||||||||||||||||||
RSU awards | 36,871 | 818,536 | |||||||||||||||||||||
PSU award | 9,996 | 221,911 | |||||||||||||||||||||
Jason D. Asper | |||||||||||||||||||||||
Stock options | — | 35,303 | 28.55 | 08/14/2027 | |||||||||||||||||||
RSU awards | 12,321 | 273,526 | |||||||||||||||||||||
James A. Lightman | |||||||||||||||||||||||
Stock options | 33,504 | — | 15.75 | 12/29/2021 | |||||||||||||||||||
566 | — | 17.70 | 04/16/2022 | ||||||||||||||||||||
7,444 | — | 20.75 | 05/09/2022 | ||||||||||||||||||||
1,999 | — | 22.55 | 04/17/2023 | ||||||||||||||||||||
11,099 | — | 23.93 | 05/14/2023 | ||||||||||||||||||||
9,086 | — | 29.06 | 05/13/2024 | ||||||||||||||||||||
42,638 | 36,147 | 20.62 | 10/13/2025 | ||||||||||||||||||||
12,625 | 23,039 | 21.24 | 07/19/2026 | ||||||||||||||||||||
— | 18,074 | 27.86 | 07/25/2027 | ||||||||||||||||||||
RSU awards | 29,045 | 644,799 | |||||||||||||||||||||
PSU award | 6,122 | 135,908 | |||||||||||||||||||||
____________________
(1) | All stock options vest over a four-year period, with 25% of the underlying shares vesting on the one-year anniversary of the grant date and the remaining 75% of the underlying shares vesting over a three-year period thereafter in 36 as nearly equal as possible monthly installments, in each case so long as the individual remains an employee or consultant of our company. If a change in control of our company occurs, outstanding options may become immediately exercisable in full and remain exercisable for the remainder of their terms, depending upon the plan under which the options were granted and, in the case of options granted under the 2017 plan, whether the option is continued, assumed or substituted by the successor entity and whether the executive experiences a termination event in |
177
connection with or within two years following the change in control. For more information, see the discussion under “-Potential Payments Upon a Termination or Change in Control.”
(2) | All option awards have a 10-year term, but may terminate earlier if the recipient’s employment or service relationship with our company terminates. |
(3) | The release dates and release amounts for the unvested RSU awards are as follows: |
Name | 06/01/2018 | 08/15/2018 | 06/01/2019 | 08/15/2019 | 06/01/2020 | 08/15/2020 | 08/15/2021 | ||||||||||||||
Mr. Palmisano | 95,999 | 11,633 | 96,000 | 11,633 | 23,584 | 11,633 | 11,634 | ||||||||||||||
Mr. Berry | 15,440 | 2,730 | 15,441 | 2,731 | 5,290 | 2,731 | 2,731 | ||||||||||||||
Mr. Cordell | 10,891 | 2,499 | 10,893 | 2,499 | 5,091 | 2,499 | 2,499 | ||||||||||||||
Mr. Asper | — | 3,080 | — | 3,080 | — | 3,080 | 3,081 | ||||||||||||||
Mr. Lightman | 9,910 | 1,530 | 9,910 | 1,531 | 3,103 | 1,530 | 1,531 | ||||||||||||||
If a change in control of our company occurs, outstanding unvested RSU awards may become immediately vested in full, depending upon the plan under which the stock awards were granted and, in the case of RSU awards granted under the 2017 plan, whether the award is continued, assumed or substituted by the successor entity and whether the executive experiences a termination event in connection with or within two years following the change in control. For more information, see the discussion under “-Potential Payments Upon a Termination or Change in Control.”
(4) | The market value of RSU awards that had not vested as of December 31, 2017 is based on the closing sale price of our ordinary shares, as reported by the Nasdaq Global Select Market, on the last trading day of our fiscal year, December 29, 2017 ($22.20). |
(5) | Amounts reported represent the number of PSU awards that were in progress based on target levels of performance. The PSU awards will vest based on the achievement of the performance goal established for the June 26, 2017 - June 28, 2020 performance period. For information regarding the treatment of such awards upon a change in control of our company, see the discussion under “-Potential Payments Upon a Termination or Change in Control.” |
(6) | Amounts reported represent the target value of PSU awards that were in progress based on the closing sale price of our ordinary shares, as reported by the Nasdaq Global Select Market, on the last trading day of our fiscal year, December 29, 2017 ($22.20). |
Options Exercised and Stock Vested During Fiscal Year
The table below provides information regarding stock awards that vested for each of our named executive officers during the fiscal year ended December 31, 2017. No option awards were exercised by any of our named executive officers during the fiscal year ended December 31, 2017.
Stock awards(1) | ||||||
Name | Number of shares acquired on vesting (#) | Value realized on vesting ($) | ||||
Robert J. Palmisano | ||||||
Restricted stock units | 95,998 | 2,615,946 | ||||
Lance A. Berry | ||||||
Restricted stock units | 15,441 | 420,767 | ||||
Kevin D. Cordell | ||||||
Restricted stock units | 10,891 | 296,780 | ||||
Jason D. Asper | ||||||
Restricted stock units | — | — | ||||
James A. Lightman | ||||||
Restricted stock units | 9,909 | 270,020 | ||||
____________________
(1) | The number of shares acquired upon vesting reflects the gross number of shares acquired absent netting of shares surrendered or sold to satisfy tax withholding requirements. The value realized on vesting of the RSU awards held by each of the named executive represents the gross number of ordinary shares acquired, multiplied by the closing sale price of our ordinary shares on the vesting date or the last trading day prior to the vesting date if the vesting date was not a trading day, as reported by the Nasdaq Global Select Market. |
Potential Payments Upon a Termination or Change in Control
Employment Agreement with Robert J. Palmisano. Effective October 1, 2015, Wright Medical Group, Inc., one of our subsidiaries, entered into an employment agreement with Robert J. Palmisano, our President and Chief Executive Officer. Under the terms of
178
our employment agreement with Mr. Palmisano, in the event of a termination of his employment, the post-employment pay and benefits, if any, to be received by him will vary according to the basis for his termination. We have guaranteed the obligations under the employment agreement since our subsidiary, Wright Medical Group, Inc., is party to the agreement. The employment agreement will continue until December 31, 2019, subject to earlier termination under certain circumstances, and on October 1, 2018, will automatically renew for additional one-year periods unless we or Mr. Palmisano provides notice of non-extension of the agreement.
In the event that Mr. Palmisano’s employment is terminated for “cause” or he terminates his employment other than for “good reason” (as such terms are defined in the employment agreement) or disability, we will have no obligations to him, other than payment of accrued obligations. Accrued obligations include: (i) any accrued base salary through the date of termination; (ii) any annual cash incentive compensation awards earned but not yet paid; (iii) the value of any accrued vacation; (iv) reimbursement for any unreimbursed business expenses; and (v) only in the case of a termination at any time by reason of death or disability, his annual target incentive payment for the year that includes the date of termination.
In the event of an involuntary termination of his employment, we will be required to provide him, in addition to his accrued obligations: (i) a lump sum payment equal to two and one-half times the sum of: (a) his then current annual base salary; plus (b) his annual target incentive bonus; (ii) payment or reimbursement for the cost of COBRA continuation coverage for up to 12 months; (iii) outplacement assistance for a period of 12 months, subject to termination if Mr. Palmisano accepts employment with another employer; (iv) financial planning services for a period of 12 months; and (v) an annual physical examination within 12 months of termination.
In the event of a termination of his employment due to death or disability, we will be required to provide him, in addition to his accrued obligations, his annual target incentive bonus.
In the event of an involuntary termination of his employment in anticipation of or within a 24-month period following a “change in control,” we will be required to provide him, in addition to his accrued obligations: (i) a lump sum payment equal to three times the sum of: (a) his then current annual base salary, plus (b) his annual target incentive bonus; (ii) his annual target incentive bonus for the year in which his termination occurs; (iii) payment or reimbursement for the cost of COBRA continuation coverage for up to 12 months; (iv) outplacement assistance for a period of 12 months, subject to termination if Mr. Palmisano accepts employment with another employer; (v) financial planning services for a period of 12 months; and (vi) an annual physical examination within 12 months of termination.
Upon termination for any reason other than for cause, disability, or death, Mr. Palmisano must enter into a release of all claims within 30 days after the date of termination before any payments will be made to him under the employment agreement, other than accrued obligations. If he breaches the terms of the confidentiality, non-competition, non-solicitation, intellectual property rights agreement, then our obligations to make payments or provide benefits will cease immediately and permanently, and he will be required to repay an amount equal to 30% of the post-employment payments and benefits previously provided to him under the employment agreement, with interest. The employment agreement provides for other clawback and forfeiture provisions, including if we are required to restate our financial statements under certain circumstances. All payments under his employment agreement will be net of applicable tax withholding obligations. The agreement also provides that if any severance payments or other payments or benefits deemed made in connection with a future change in control are subject to the “golden parachute” excise tax under Code Section 4999, the payments will be reduced to one dollar less than the amount that would subject him to the excise tax if the reduction results in him receiving a greater amount on a net-after tax basis than would be received if he received the payments and benefits and paid the excise tax.
Severance Pay Agreements with Other Named Executive Officers. Our subsidiary, Wright Medical Group, Inc., has entered into separation pay agreements with our named executive officers, other than Mr. Palmisano. We have guaranteed the obligations under these separation pay agreements. The separation pay agreements will continue until October 1, 2019 and, on October 1, 2018, will automatically renew for additional one-year periods unless we or the executive provides notice of termination of the agreement.
Under the terms of the separation pay agreement, in the event that the executive is terminated for cause or the executive terminates his employment other than for good reason or disability, we will have no obligations, other than payment of accrued obligations. Accrued obligations include: (i) any accrued base salary through the date of termination; (ii) any annual cash incentive compensation awards earned but not yet paid; (iii) the value of any accrued vacation; (iv) reimbursement for any unreimbursed business expenses; and (v) only in the case of a termination at any time by reason of death or disability, an annual incentive target bonus for the year that includes the date of termination, prorated for the portion of the year that the executive was employed.
In the event of an involuntary termination of the executive’s employment, other than for cause, we will be obligated to pay a severance payment and accrued obligations and provide certain benefits to the executive. The severance payment will equal the sum of (i) the executive’s then current annual base salary, plus (ii) an amount equal to his then current annual target bonus. Half of the total severance payment amount will be payable at or within a reasonable time after the date of termination and the remaining half will be payable in installments beginning six months after the date of termination, with a final installment to be made on or
179
before March 15 of the calendar year following the year of termination. In the event of an involuntary termination of the executive’s employment in connection with a change in control, then his severance payment will equal two times the amount of his severance payment as described above. Under the separation pay agreement, an involuntary termination of the executive’s employment will occur if we terminate the executive’s employment other than for cause, disability, voluntary retirement, or death or if the executive resigns for good reason, in each case as defined in the separation pay agreement.
In addition to a severance payment, the executive also will be entitled to receive the following benefits in the event of an involuntary termination of his employment: (i) a pro rata portion of the executive’s annual cash incentive compensation award for the fiscal year that includes the termination date, if earned pursuant to the terms thereof and at such time and in such manner as determined pursuant to the terms thereof, less any payments thereof already made during such fiscal year (or, in the event of an involuntary termination in connection with a change in control, a pro rata portion of the executive’s target annual cash incentive compensation award for the fiscal year that includes the termination date, less any payments thereof already made during such fiscal year); (ii) payment or reimbursement for the cost of COBRA continuation coverage for up to 12 months (18 months in the event of an involuntary termination in connection with a change in control); (iii) outplacement assistance for a period of one year (two years in the event of an involuntary termination in connection with a change in control), subject to termination if the executive accepts employment with another employer; (iv) financial planning services for a period of one year (two years in the event of an involuntary termination in connection with a change in control); (v) payment to continue insurance coverage equal to the executive’s annual supplemental insurance premium benefit provided to him or her prior to the date of termination (twice the premium benefit in the event of an involuntary termination in connection with a change in control); (vi) an annual physical examination within 12 months of termination; and (vii) reasonable attorneys’ fees and expenses if any such fees or expenses are incurred to recover benefits rightfully owed under the separation pay agreement.
In the event of a termination of an executive’s employment due to death or disability, we will be required to provide the executive, in addition to his or her accrued obligations, a pro rata portion of his or her annual target incentive bonus.
Upon termination for any reason other than cause, disability, or death, the executive must enter into a release of all claims within 30 days after the date of termination before any payments will be made to the executive under the separation pay agreement, other than accrued obligations. If the executive breaches the terms of the confidentiality, non-competition, non-solicitation, and intellectual property rights agreement or the release, then our obligations to make payments or provide benefits will cease immediately and permanently, and the executive will be required to repay an amount equal 90% of the payments and benefits previously provided to the executive under the separation pay agreement, with interest. All payments under the separation pay agreement will be net of applicable tax withholding obligations. The separation pay agreement provides that if any severance payments or other payments or benefits deemed made in connection with a future change in control are subject to the “golden parachute” excise tax under Code Section 4999, the payments will be reduced to one dollar less than the amount that would subject the executive to the excise tax if the reduction results in the executive receiving a greater amount on a net-after tax basis than would be received if the executive received the payments and benefits and paid the excise tax.
Change in Control Provisions in Equity Plans. Our equity plans under which awards have been granted to our named executive officers contain “change in control” provisions.
Under our current 2017 equity plan, a “change in control” means:
• | the acquisition (other than from us) by any person, entity or group, subject to certain exceptions, of 50% or more of either our then-outstanding ordinary shares or the combined voting power of our then-outstanding ordinary shares or the combined voting power of our then-outstanding capital stock entitled to vote generally in the election of directors; |
• | the “continuity directors” cease for any reason to constitute at least a majority of our board of directors; |
• | consummation of a reorganization, merger or consolidation, in each case, with respect to which persons who were our shareholders immediately prior to such reorganization, merger or consolidation do not, immediately thereafter, own more than 50% of the combined voting power entitled to vote generally in the election of directors of the then-outstanding voting securities of the reorganized, merged, consolidated, or other surviving corporation (or its direct or indirect parent corporation); |
• | approval by our shareholders of a liquidation or dissolution of our company; or |
• | the consummation of the sale of all or substantially all of our assets with respect to which persons who were our shareholders immediately prior to such sale do not, immediately thereafter, own more than 50% of the combined voting power entitled to vote generally in the election of directors of the then-outstanding voting securities of the acquiring corporation (or its direct or indirect parent corporation). |
Under the 2017 equity plan, if a change in control of our company occurs, then if an award is continued, assumed or substituted by the successor entity, the award will not vest or lapse solely as a result of the change of control but will instead remain outstanding under the terms pursuant to which it has been continued, assumed or substituted and will continue to vest or lapse pursuant to such
180
terms. If the award is continued, assumed or substituted by the successor entity and within two years following the change in control the participant is either terminated by the successor entity without “cause” or, if the participant is an employee, resigns for “good reason,” each as defined in the 2017 plan, then:
• | All outstanding stock options and SARs held by such participant will become immediately vested and exercisable in full and will remain exercisable for the remainder of their respective terms; |
• | All restrictions imposed on restricted stock, RSUs or deferred units that are not performance-based held by such participant will lapse and be of no further force and effect; |
• | All performance-based awards held by such participant for which the performance period has been completed as of the date of such termination or resignation but have not yet been paid will vest and be paid in cash or shares and at such time as provided in the award agreement based on actual attainment of each performance goal; and |
• | All performance-based awards held by such participant for which the performance period has not been completed as of the date of such termination or resignation will with respect to each performance goal vest and be paid out for the entire performance period (and not pro rata) based on actual performance achieved through the date of such termination or resignation with the manner of payment to be made in cash or shares as provided in the award agreement within 30 days following the date of termination or resignation. |
If a change in control of our company occurs, and if an award participant suffers a “termination of continued employment” in connection with such change in control, or if outstanding awards are not continued, assumed or substituted with equivalent awards by the successor entity, or in the case of a dissolution or liquidation of our company, outstanding awards will be subject to the following rules:
• | All outstanding stock options and SARs will become fully vested and exercisable and the committee will give such participant a reasonable opportunity to exercise any and all stock options and SARs before but conditioned upon the resulting change in control and if a participant does not exercise all stock options and SARs, the committee will pay such participant the difference between the exercise price for the stock option or grant price for the SAR and the per share consideration provided to other similarly situated shareholders in the change in control, provided that if the exercise or grant price exceeds the consideration in the change in control, provided, however, that if the exercise price or grant price exceeds the consideration provided, then such exercised stock option or SAR will be canceled and terminated without payment; |
• | All restrictions imposed on restricted stock, RSUs or deferred units that are not performance-based will lapse and be of no further force and effect, and RSUs and deferred units will be settled and paid in cash or shares and at such time as provided in the award agreement, provided, however, that if any such payment is to be made in shares, the committee may provide such holders the consideration provided to other similarly situated shareholders in the change in control; |
• | All performance-based awards held by such participant for which the performance period has been completed as of the date of the change in control but have not yet been paid will vest and be paid in cash or shares and at such time as provided in the award agreement based on actual attainment of each performance goal; and |
• | All performance-based awards held by such participant for which the performance period has not been completed as of the date of the change in control will with respect to each performance goal vest and be paid out for the entire performance period (and not pro rata) based on actual performance achieved through the date of the change in control with the manner of payment to be made in cash or shares as provided in the award agreement within 30 days following the change in control. |
These change in control provisions may not be terminated, amended or modified in any manner that adversely affects any then-outstanding award or award participant without the prior written consent of such participant.
The 2017 plan defines “cause” as, unless otherwise provided in an award agreement, cause as defined in any employment, consulting, severance or similar agreement between the participant and us (an “individual agreement”), or if there is no such individual agreement or if it does not define cause: (i) the participant has engaged in conduct that in the judgment of the committee constitutes gross negligence, misconduct, or gross neglect in the performance of the participant’s duties and responsibilities or conduct resulting or intending to result directly or indirectly in gain or personal enrichment for the participant at our expense; (ii) the participant has engaged or is about to engage in conduct materially injurious to us; (iii) the participant has engaged in or is about to engage in conduct that is materially inconsistent with our legal and healthcare compliance policies, programs or obligations, including but not limited to our code of business conduct and ethics and our code of conduct on insider trading and confidentiality; (iv) the participant’s bar from participation in programs administered by the United States Department of Health and Human Services or the United States Food and Drug Administration or any succeeding agencies; (v) the participant’s conviction of or entering of a guilty or no contest plea to a felony charge (or equivalent thereof) in any jurisdiction; or (vi) the participant has engaged in a
181
material breach of any employment, service, confidentiality, non-compete or non-solicitation agreement entered into with us or a breach of any company policy for which termination of employment or service is a permissible consequence of such breach.
The 2017 plan defines “good reason” as, unless otherwise provided in an award agreement, the occurrence of any of the following without the prior written consent of the participant, unless such act or failure to act is corrected by us within 30 days of the participant providing notice of the occurrence: (a) a material reduction in the participant's then current responsibilities or assignment to the participant of duties materially inconsistent with such participant's then current range of duties and responsibilities; and for the avoidance of doubt, the following circumstances would be considered a material reduction of a participant's responsibilities: (i) the reporting structure of a participant who reports to the chief executive officer of the entire organization is modified or the participant is informed that it will be modified such that the participant would no longer report to such chief executive officer or (ii) a participant who is the chief executive officer or organization-wide leader of a material function in a public company would no longer be, or is informed that he or she will no longer be, the chief executive officer or organization-wide leader of such function, or would no longer lead that function in a public company environment; (b) a material reduction (i.e., more than 10%) in the participant's aggregate annualized compensation target (including bonus opportunity as a percentage of base salary) and benefits opportunities, except for an across the board reduction or modification to any benefit plan affecting all similarly situated participants; (c) failure to pay to the participant any portion of the participant's current compensation and benefits, under any plan, program or policy of, or other contract or agreement within 30 days of the date such compensation and/or benefits are due; (d) cancellation or material reduction in scope of any indemnification and/or director and officer liability insurance; (e) the relocation of the participant's then current principal place of employment, or principal location, to a location which is more than 40 miles from the principal location; or (f) material breach other than by the participant of any material provision of the participant's employment, severance or similar agreement.
The 2017 plan defines “termination of continued employment” as termination of an individual’s employment with our company or if the individual is a director, his or her service as a director, without cause in connection with a change of control and includes, by way of example and without limitation, the following circumstances: (i) such individual is notified within the 60 day period preceding the change of control that the individual’s employment is or will be terminated without cause prior to or after the change of control, (ii) such individual is notified within the 60 day period preceding the change of control that the individual’s continued employment with our company after the change of control is conditioned upon acceptance of a position with the successor or an affiliate of the successor under terms which would entitle the individual to resign for good reason and the individual in fact resigns for good reason on this basis, and (iii) such individual is a director and will not become a director of the successor parent immediately after the change in control.
Under the terms of our 2010 equity plan, if there is a change in control of our company, then, all outstanding options become immediately exercisable in full and remain exercisable for the remainder of their terms and all issuance conditions on all outstanding RSU awards will be deemed satisfied. Alternatively, the compensation committee may determine that outstanding awards will be cancelled as of the consummation of the change in control and that holders of cancelled awards will receive a payment in respect of such cancellation based on the amount of per share consideration being paid in connection with the change in control less, in the case of options and other awards subject to exercise, the applicable exercise price.
182
Potential Payments to Named Executive Officers. The table below reflects the amount of compensation and benefits payable to each named executive officer, in the event of (i) any voluntary resignation or termination or termination for cause; (ii) an involuntary termination without cause; (iii) an involuntary termination without cause or a resignation for good reason within 12 months (24 months in the case of Mr. Palmisano and two years in the case of equity awards acceleration) following a change in control, or a qualifying change in control termination; (iv) termination by reason of an executive’s death or disability; and (v) a change in control. The amounts reported in the table assume that the applicable triggering event occurred on December 31, 2017, and, therefore, are estimates of the amounts that would be paid to the named executive officers upon the occurrence of such triggering event.
Name | Type of payment(1) | Voluntary/ for cause termination ($) | Involuntary termination without cause ($) | Qualifying change in control termination ($) | Death/ disability ($) | Change in control ($) | |||||||||||
Robert J. Palmisano | Cash severance | — | 4,792,570 | 5,751,084 | — | — | |||||||||||
Benefit continuation | — | 19,920 | 19,920 | — | — | ||||||||||||
Annual bonus(2) | — | 958,514 | 958,514 | 958,514 | — | ||||||||||||
Outplacement benefits | — | 30,000 | 30,000 | — | — | ||||||||||||
Other termination benefits(3) | — | 6,000 | 6,000 | — | — | ||||||||||||
Option award acceleration(4) | — | — | 775,715 | — | 775,715 | ||||||||||||
RSU award acceleration(5) | — | — | 5,818,975 | — | 5,818,975 | ||||||||||||
PSU award acceleration(6) | — | — | 1,033,033 | — | 1,033,033 | ||||||||||||
Total | — | 5,807,004 | 14,393,241 | 958,514 | 7,627,723 | ||||||||||||
Lance A. Berry | Cash severance | — | 742,500 | 1,485,000 | — | — | |||||||||||
Benefit continuation | — | 19,920 | 29,880 | — | — | ||||||||||||
Annual bonus(2) | — | 292,500 | 292,500 | 292,500 | — | ||||||||||||
Outplacement benefits | — | 30,000 | 60,000 | — | — | ||||||||||||
Other termination benefits(3) | — | 6,000 | 12,000 | — | — | ||||||||||||
Option award acceleration(4) | — | — | 122,879 | — | 122,879 | ||||||||||||
RSU award acceleration(5) | — | — | 1,045,487 | — | 1,045,487 | ||||||||||||
PSU award acceleration(6) | — | — | 242,491 | — | 242,491 | ||||||||||||
Total | — | 1,090,920 | 3,290,237 | 292,500 | 1,410,857 | ||||||||||||
Kevin D. Cordell | Cash severance | — | 753,050 | 1,506,099 | — | — | |||||||||||
Benefit continuation | — | 19,920 | 29,880 | — | — | ||||||||||||
Annual bonus(2) | — | 282,394 | 282,394 | 282,394 | — | ||||||||||||
Outplacement benefits | — | 30,000 | 60,000 | — | — | ||||||||||||
Other termination benefits(3) | — | 6,000 | 12,000 | — | — | ||||||||||||
Option award acceleration(4) | — | — | 84,961 | — | 84,961 | ||||||||||||
RSU award acceleration(5) | — | — | 818,536 | — | 818,536 | ||||||||||||
PSU award acceleration(6) | — | — | 221,911 | — | 221,911 | ||||||||||||
Total | — | 1,091,364 | 3,015,781 | 282,394 | 1,125,408 | ||||||||||||
183
Name | Type of payment(1) | Voluntary/ for cause termination ($) | Involuntary termination without cause ($) | Qualifying change in control termination ($) | Death/ disability ($) | Change in control ($) | |||||||||||
Jason D. Asper | Cash severance | — | 519,250 | 1,038,500 | — | — | |||||||||||
Benefit continuation | — | 19,920 | 29,880 | — | — | ||||||||||||
Annual bonus(2) | — | 184,250 | 184,250 | 184,250 | — | ||||||||||||
Outplacement benefits | — | 30,000 | 60,000 | — | — | ||||||||||||
Other termination benefits(3) | — | 6,000 | 12,000 | — | — | ||||||||||||
Option award acceleration(4) | — | — | — | — | — | ||||||||||||
RSU award acceleration(5) | — | — | 273,526 | — | 273,526 | ||||||||||||
Total | — | 759,420 | 1,598,156 | 184,250 | 273,526 | ||||||||||||
James A. Lightman | Cash severance | — | 605,318 | 1,210,635 | — | — | |||||||||||
Benefit continuation | — | 19,920 | 29,880 | — | — | ||||||||||||
Annual bonus(2) | — | 201,773 | 201,773 | 201,773 | — | ||||||||||||
Outplacement benefits | — | 30,000 | 60,000 | — | — | ||||||||||||
Other termination benefits(3) | — | 6,000 | 12,000 | — | — | ||||||||||||
Option award acceleration(4) | — | — | 79,230 | — | 79,230 | ||||||||||||
RSU award acceleration(5) | — | — | 644,799 | — | 644,799 | ||||||||||||
PSU award acceleration(6) | — | — | 135,908 | — | 135,908 | ||||||||||||
Total | — | 863,011 | 2,374,225 | 201,773 | 859,937 | ||||||||||||
(1) | The benefit amounts set forth in the table do not reflect any reduction that may be necessary to prevent the payment from being subject to an excise tax under Code Section 280G, if applicable. |
(2) | Assumes payment equal to full target annual bonus for the year in which the termination date occurs. |
(3) | Reflects the cost of financial planning services and continued executive insurance. Reimbursement of reasonable attorneys’ fees and expenses is not included as the amount is not estimable. |
(4) | Based on the difference between: (i) the per share market price of the ordinary shares underlying the unvested stock options held by such executive as of December 29, 2017, the last trading day of fiscal 2017, based upon the closing sale price of our ordinary shares, as reported by the Nasdaq Global Select Market, on the last trading day of our fiscal year, December 29, 2017 ($22.20), and (ii) the per share exercise price of the options held by such executive. The per share exercise price of all unvested stock options held by our named executive officers included in the table as of December 31, 2017 range from $20.62 to $28.55. The “Change in Control” scenario assumes that options granted under the 2017 plan are not continued, assumed or substituted with equivalent awards in connection with the change in control. |
(5) | Based on: (i) the number of unvested RSU awards held by such executive as of December 31, 2017, multiplied by (ii) the per share market price of our ordinary shares as of December 29, 2017, the last trading day of fiscal 2017, based upon the closing sale price of our ordinary shares, as reported by the Nasdaq Global Select Market, on the last trading day of our fiscal year, December 29, 2017 ($22.20). The “Change in Control” scenario assumes that RSU awards granted under the 2017 plan are not continued, assumed or substituted with equivalent awards in connection with the change in control. |
(6) | Amounts reported represent the value of the immediate payout of the target number of ordinary shares that the named executive officer would have been entitled to receive as payout for PSU awards for the June 26, 2017 - June 28, 2020 performance period. The value is based on: (a) the number of outstanding PSU awards at target, multiplied by (b) the closing sale price of our ordinary shares, as reported by the Nasdaq Global Select Market, on the last trading day of our fiscal year, December 29, 2017 ($22.20). The “Change in Control” scenario assumes that PSU awards granted under the 2017 plan are not continued, assumed or substituted with equivalent awards in connection with the change in control and are paid out, assuming target performance. |
Risk Assessment of Compensation Policies, Practices, and Programs
As a result of our annual assessment on risk in our compensation programs, we concluded that our compensation policies, practices, and programs and related compensation governance structure, work together in a manner so as to encourage our employees, including our named executive officers, to pursue growth strategies that emphasize shareholder value creation, but not to take unnecessary or excessive risks that could threaten the value of our company. As part of our assessment, we noted in particular the following:
• | annual base salaries for employees are not subject to performance risk and, for most non-executive employees, constitute the largest part of their total compensation; |
184
• | while performance-based, or at risk, compensation constitutes a significant percentage of the overall total compensation of many of our employees, including our executives, non-performance based compensation for most employees for most years is still a sufficiently high percentage of their overall total compensation that the performance-based compensation does not encourage unnecessary or excessive risk taking; |
• | for most employees, our performance-based compensation has appropriate maximums; |
• | a significant portion of performance-based compensation of our employees is in the form of long-term equity incentives which do not encourage unnecessary or excessive risk because they generally vest over a three to four-year period of time thereby focusing our employees on our long-term interests; and |
• | performance-based or variable compensation awarded to our employees, which for our higher-level employees, including our named executive officers, constitutes the largest part of their total compensation, is appropriately balanced between annual and long-term performance and cash and equity compensation, and utilizes several different performance measures and goals that are drivers of long-term success for our company and shareholders. |
As a matter of best practice, we will continue to monitor our compensation policies, practices, and programs to ensure that they continue to align the interest of our employees, including in particular our executive officers, with those of our long-term shareholders while avoiding unnecessary or excessive risk.
Compensation Committee Interlocks and Insider Participation
Sean D. Carney, John L. Miclot, Kevin C. O’Boyle and Elizabeth H. Weatherman served as members of the compensation committee of our board of directors during 2017. Sean D. Carney, a former director, served as a member of the compensation committee of our board of directors until April 30, 2017. No member of the compensation committee is or was an officer or employee of ours or any of our subsidiaries while serving on the compensation committee. In addition, no executive officer of ours served during 2017 as a director or a member of the compensation committee of any entity that had an executive officer serving as our director or a member of the compensation committee.
Director Compensation
Overview
Under the terms of our board of directors compensation policy, which was approved by the general meeting of our shareholders on August 26, 2010 and was amended on October 28, 2010, the compensation packages for our non-executive directors are determined by our non-executive directors, based upon a recommendation by the compensation committee. Such compensation is determined by our non-executive directors pursuant to the terms of our articles of association, which provide that if all directors have a conflict of interest in the matter to be acted upon, the matter shall be approved by our non-executive directors. In determining non-executive director compensation, we target compensation in the market median range of our peer companies; although, we may deviate from the median if we determine necessary or appropriate on a case-by-case basis.
Under the terms of our non-executive director compensation program, compensation for our non-executive directors is comprised of both cash compensation and equity-based compensation. Cash compensation is in the form of annual or other retainers for non-executive directors, chairman, committee chairs, and committee members. Equity-based compensation is in the form of initial and annual stock option and RSU award grants. Each of these components is described in more detail below. We do not provide perquisites and other personal benefits to our non-executive directors.
Cash Compensation
The table below sets forth the annual cash retainers paid to each non-executive director and the additional annual cash retainers paid to the chairman and each board committee chair and board committee member during 2017:
Description | Annual cash retainer ($) | |
Non-executive director | 60,000 | |
Chairman premium | 75,000 | |
Audit committee chair premium | 20,000 | |
Compensation committee chair premium | 13,000 | |
Nominating, corporate governance and compliance committee chair premium | 10,000 | |
Strategic transactions committee chair premium | 10,000 | |
Audit committee member (including chair) | 15,000 | |
Compensation committee member (including chair) | 7,000 | |
Nominating, corporate governance and compliance committee member (including chair) | 7,000 | |
185
Description | Annual cash retainer ($) | |
Strategic transactions committee member (including chair) | 5,000 | |
The annual cash retainers are paid on a quarterly basis in arrears within 30 days of the end of each calendar quarter. For example, the retainers for the first calendar quarter covering the period from January 1 through March 31 are paid within 30 days of March 31. In addition, each non-executive director receives a cash travel stipend of $2,000 for each board meeting attended in person that takes place in the Netherlands or other location outside the United States.
Equity-Based Compensation
The equity-based compensation component of our non-executive director compensation consists of initial stock option and RSUs awards to new non-executive directors upon their first appointment or election to our board of directors and annual stock option and RSU awards to all non-executive directors on the same date that annual performance recognition grants of equity awards are made to our employees.
Non-executive directors, upon their initial election to our board of directors and on an annual basis thereafter effective as of the same date that annual performance recognition grants of equity awards are made to our employees, receive a certain dollar amount equal to $195,000, one-half of which is paid in stock options and the remaining one-half of which is paid in RSU awards. The number of ordinary shares underlying the stock options and RSU awards is determined based on the 10‑trading day average closing sale price of an ordinary share, as reported by the Nasdaq Global Select Market, and as determined on the third trading day prior to the date of anticipated corporate approval of the award. The stock options have a term of 10 years and a per share exercise price equal to 100% of the fair market value of an ordinary share on the grant date. The stock options vest over a two-year period, with one-half of the underlying shares vesting on each of the one-year and two-year anniversaries of the grant date, in each case so long as the director is still a director as of such date. The RSU awards vest in full on the one-year anniversary of the grant date so long as the director is still a director as of such date.
Election to Receive Equity-Based Compensation in Lieu of Cash Compensation
Our non-executive director compensation policy allows our non-executive directors to elect to receive an RSU award in lieu of 100% of their annual cash retainers payable for services to be rendered as a non-executive director, chairman and chair or member of any board committee. Each non-executive director who elects to receive an RSU award in lieu of such director’s annual cash retainers is granted an RSU award under our 2017 plan for that number of ordinary shares as determined by dividing the aggregate dollar amount of all annual cash retainers anticipated to payable to such director for the period commencing on July 1 of each year to June 30 of the following year by the 10-trading day average closing sale price of our ordinary shares as reported by the Nasdaq Global Select Market and as determined on the third trading day prior to the date of anticipated corporate approval of the award. These RSU awards are typically granted effective as of the same date that other director equity grants are made and annual performance recognition grants of equity awards are made to our employees. These RSU awards vest in four equal installments on the following September 30th, December 31st, March 31st and June 30th.
If a non-executive director who elected to receive an RSU award in lieu of such director’s annual cash retainers is no longer a director before such director’s interest in all of the ordinary shares underlying RSU award have vested and become issuable, then such director will forfeit his or her rights to receive all of the shares underling such RSU award that have not vested and been issued as of the date such director’s status as a director so terminates. In such case, the non-executive director will receive in cash a pro rata portion of his or her annual cash retainers for the quarter in which the director’s status as a director terminates.
If a non-executive director who elected to receive an RSU award in lieu of such director’s annual cash retainers becomes entitled to receive an increased or additional annual cash retainer during the period from July 1 to June 30 of the next year, such director will receive such increased or additional annual cash retainer in cash until July 1 of the next year when the director may elect (on or prior to June 15 of the next year) to receive an RSU award in lieu of such director’s annual cash retainers.
If a non-executive director who elected to receive an RSU award in lieu of such director’s annual cash retainers experiences a change in the director’s membership on one or more board committees or chair positions prior to June 30 of the next year such that the director becomes entitled to receive annual cash retainers for the period from July 1 to June 30 of the next year aggregating an amount less than the aggregate amount used to calculate the director’s most recent RSU award received, the director will forfeit as of the effective date of such board committee or chair change his or her rights to receive a pro rata portion of the shares underlying such RSU award reflecting the decrease in the director’s aggregate annual cash retainers and the date on which such decrease occurred. In addition, the vesting of the RSU award will be revised appropriately to reflect any such change in the number of shares underlying the RSU award and the date on which such change occurred.
Summary of Cash and Other Director Compensation
The table below summarizes the compensation received by each individual who served as a non-executive director of our company during the fiscal year ended December 31, 2017. While Mr. Palmisano did not receive additional compensation for his service as
186
executive director, a portion of his compensation was allocated to his service as executive director. For more information regarding the allocation of Mr. Palmisano’s compensation, please refer to note (1) to the Summary Compensation Table under “-Executive Compensation Tables and Narratives-Summary Compensation.”
DIRECTOR COMPENSATION- 2017
Name | Fees earned or paid in cash(1) ($) | Stock awards(2)(3) ($) | Option awards(4)(5) ($) | All other compensation(6)(7) ($) | Total ($) | ||||||||||
Gary D. Blackford | 79,667 | 99,906 | 100,719 | 8,000 | 288,292 | ||||||||||
Sean D. Carney(8) | 29,000 | — | — | 4,000 | 33,000 | ||||||||||
John L. Miclot | 75,667 | 99,906 | 100,719 | 8,000 | 284,292 | ||||||||||
Kevin C. O’Boyle | 79,667 | 99,906 | 100,719 | 8,000 | 288,292 | ||||||||||
Amy S. Paul | 77,000 | 99,906 | 100,719 | 8,000 | 285,625 | ||||||||||
David D. Stevens | 147,000 | 99,906 | 100,719 | 8,000 | 355,625 | ||||||||||
Richard F. Wallman | 100,000 | 152,375 | 100,719 | 8,000 | 361,094 | ||||||||||
Elizabeth H. Weatherman | 82,000 | 99,906 | 100,719 | 8,000 | 290,625 | ||||||||||
(1) | Unless a director otherwise elects to convert all of his or her annual retainers into RSU awards, annual retainers are paid in cash on a quarterly basis in arrears within 30 days of the end of each calendar quarter. One of our non-executive directors elected to convert all of his annual retainers covering the period of service and from July 1, 2017 to June 30, 2018 into RSU awards and accordingly, was granted an RSU award on July 25, 2017 under our 2017 plan for that number of ordinary shares as determined based on the following formula: (a) the aggregate dollar amount of all annual cash retainers that otherwise would have been payable to the non-executive director for services to be rendered as a non-executive director, chairman and chair or member of any board committee (based on such director’s board committee memberships and chair positions as of the grant date), divided by (b) the 10‑trading day average closing sale price of an ordinary share, as reported by the Nasdaq Global Select Market, and as determined on the third trading day prior to the date of anticipated corporate approval of the award. The RSU award vests and the underlying shares become issuable in four as nearly equal as possible quarterly installments, on September 30, December 31, March 31 and June 30, in each case so long as the non-executive director is a director of our company as of such date. |
The table below sets forth: (a) the number of RSU awards granted to the non-executive director on July 25, 2017; (b) the total amount of annual retainers converted by such director into RSU awards; (c) of such total amount of annual retainers converted into RSU awards, the amount attributed to the director’s service during 2017, which amount is included in the “Fees earned or paid in cash” column for each director; (d) the grant date fair value of the stock awards computed in accordance with FASB ASC Topic 718; and (e) the incremental grant date fair value for the stock awards above and beyond the amount of annual retainers for 2017 service converted into RSU awards computed in accordance with FASB ASC Topic 718.
Name | Total amount of retainers converted into RSU awards ($) | Number of RSU awards (#) | Amount of retainer converted into RSU awards attributable to 2016 service ($) | Grant date fair value of RSU awards ($) | Incremental grant date fair value of RSU awards received during 2016 ($) | |||||
Mr. Wallman | 100,000 | 3,678 | 50,000 | 102,469 | 52,469 | |||||
(2) | On July 25, 2017, each non-executive director received an RSU award for 3,586 ordinary shares granted under the 2017 plan. The RSU awards vest and the underlying shares become issuable on the one-year anniversary of the grant date, so long as the non-executive director is a director of our company as of such date. In addition, as described above in note (1), Mr. Wallman elected to convert his annual retainers covering the period of service from July 1, 2017 to June 30, 2018 into RSU awards under our 2017 plan. The amount reported in the “Stock awards” column represents the aggregate grant date fair value for the July 25, 2017 RSU awards granted to each director in 2017 and for Mr. Wallman, the incremental grant date fair value for the additional RSU awards granted to him as described above in note (1), in each case as computed in accordance with FASB ASC Topic 718. The grant date fair value for RSU awards is determined based on the closing sale price of our ordinary shares on the grant date. |
(3) | As of December 31, 2017, each non-executive director held the following number of unvested stock awards (all of which are in the form of RSU awards): Mr. Blackford (3,586); Mr. Carney (0); Mr. Miclot (3,586); Mr. O’Boyle (3,586); Ms. Paul (3,586); Mr. Stevens (3,586); Mr. Wallman (5,425); and Ms. Weatherman (3,586). |
(4) | On July 25, 2017, each non-executive director received a stock option to purchase 10,275 ordinary shares at an exercise price of $27.86 per share granted under the 2017 plan. Such option expires on July 25, 2027 and vests with respect to one-half of the underlying ordinary shares on each of July 25, 2018 and July 25, 2019, so long as the individual remains a director of our company as of such date. Amounts reported in the “Option awards” column represent the aggregate grant date fair value for option awards granted to each non-executive director in 2017 computed in accordance with FASB ASC Topic 718. The grant date fair value is determined based on our Black-Scholes option pricing model. The grant date fair value per share for the options granted on July 25, 2017 was $9.80 and |
187
was determined using the following specific assumptions: risk free interest rate: 1.875%; expected life: 6.10 years; expected volatility: 32.5%; and expected dividend yield: 0.
(5) | The table below provides information regarding the aggregate number of options to purchase ordinary shares outstanding at December 31, 2017 and held by each of the non-executive directors named in the above table: |
Name | Aggregate number of shares underlying options | Exercisable/ unexercisable | Range of exercise price(s) ($) | Range of expiration date(s) | ||||||
Mr. Blackford | 94,910 | 78,752/16,158 | 15.01-29.06 | 05/14/2018-07/25/2027 | ||||||
Mr. Carney | — | — | — | — | ||||||
Mr. Miclot | 105,221 | 89,063/16,158 | 15.01-29.06 | 05/14/2018-07/25/2027 | ||||||
Mr. O’Boyle | 110,878 | 94,720/16,158 | 18.04-27.86 | 06/03/2020-07/25/2027 | ||||||
Ms. Paul | 110,375 | 94,217/16,158 | 15.01-29.06 | 05/14/2018-07/25/2027 | ||||||
Mr. Stevens | 84,603 | 68,445/16,158 | 15.01-29.06 | 05/14/2018-07/25/2027 | ||||||
Mr. Wallman | 29,840 | 13,682/16,158 | 21.24-27.86 | 05/12/2021-07/25/2027 | ||||||
Ms. Weatherman | 35,349 | 19,191/16,158 | 20.62-27.86 | 05/12/2021-07/25/2027 | ||||||
(6) | Represents travel stipends of $2,000 for each board meeting attended in person that takes place in the Netherlands or other location outside the United States. |
(7) | We do not provide perquisites and other personal benefits to our non-executive directors. Any perquisites or personal benefits actually provided to any non-executive director were less than $10,000 in the aggregate. |
(8) | Mr. Carney resigned from our board of directors effective as of April 30, 2017. |
Item 12. Security Ownership of Certain Beneficial Owners and Management and Related Stockholder Matters.
Security Ownership of Certain Beneficial Owners
The table below sets forth certain information concerning the beneficial ownership of our ordinary shares as of February 23, 2018, by each person known by us to beneficially own more than 5% of our ordinary shares. The calculations in the table below assume that there are 105,906,409 ordinary shares outstanding. Beneficial ownership is determined in accordance with the rules and regulations of the SEC. In computing the number of ordinary shares beneficially owned by a person and the percentage ownership of that person, we have included ordinary shares that the person has the right to acquire within 60 days, including through the exercise of any option, warrant or other right, the conversion of any other security, and the issuance of ordinary shares upon the vesting of stock awards granted in the form of restricted stock units. The ordinary shares that a shareholder has the right to acquire within 60 days, however, are not included in the computation of the percentage ownership of any other person.
Class of | Ordinary shares beneficially owned | |||||
securities | Name and address of beneficial owner | Number | Percent | |||
Ordinary shares | FMR LLC (1) | 15,717,232 | 14.8% | |||
Ordinary shares | T. Rowe Price Associates, Inc. (2) | 10,366,976 | 9.8% | |||
Ordinary shares | The Vanguard Group, Inc. (3) | 8,745,836 | 8.3% | |||
Ordinary shares | BlackRock, Inc. (4) | 7,255,388 | 6.9% | |||
Ordinary shares | OrbiMed Advisors LLC (5) | 6,852,068 | 6.5% | |||
Ordinary shares | Invesco Ltd. (6) | 5,841,441 | 5.5% | |||
____________________
* | Represents beneficial ownership of less than 1% of our outstanding ordinary shares. |
(1) | Based solely on information contained in a Schedule 13G/A of FMR LLC, an investment advisor, filed with the SEC on February 13, 2018, with sole investment discretion with respect to all such shares and sole voting authority with respect to 1,058,818 shares. Abigail P. Johnson is a Director, the Chairman and Chief Executive Officer of FMR LLC. Members of the Johnson family, including Abigail P. Johnson, are the predominant owners, directly or through trusts, of Series B voting common shares of FMR LLC, representing 49% of the voting power of FMR LLC. The Johnson family group and all other Series B shareholders have entered into a shareholders’ voting agreement under which all Series B voting common shares will be voted in accordance with the majority vote of Series B voting common shares. Accordingly, through their ownership of voting common shares and the execution of the shareholders’ voting agreement, members of the Johnson family may be deemed, under the Investment Company Act of 1940, to form a controlling group with respect to FMR. Neither FMR nor Abigail P. Johnson has the sole power to vote or direct the voting of the shares owned directly by the various investment companies registered under the Investment Company Act (Fidelity Funds) advised by Fidelity Management & Research Company (FMR Co), a wholly owned subsidiary of FMR, which power resides with the Fidelity Funds’ Boards of Trustees. |
188
Fidelity Co carries out the voting of the shares under written guidelines established by the Fidelity Funds’ Boards of Trustees. The business address of FMR LLC is 245 Summer Street, Boston, Massachusetts 02210.
(2) | Based solely on information contained in a Schedule 13G/A of T. Rowe Price Associates, Inc., an investment advisor, filed with the SEC on February 14, 2018, reflecting beneficial ownership as of December 31, 2017, with sole investment discretion with respect to all such shares, and sole voting authority with respect to 1,523,091 shares. The address of T. Rowe Price Associates, Inc. is 100 East Pratt Street, Baltimore, Maryland 21202. |
(3) | Based solely on information contained in a Schedule 13G/A of The Vanguard Group, Inc., an investment adviser, filed with the SEC on February 8, 2018, reflecting beneficial ownership as of December 31, 2017, with sole investment discretion with respect to 8,536,079 shares, sole voting authority with respect to 203,683 shares, shared investment discretion with respect to 209,757 shares and shared voting authority with respect to 15,075 shares. The address of The Vanguard Group, Inc. is 100 Vanguard Boulevard, Malvern, Pennsylvania 19355. |
(4) | Based solely on information contained in a Schedule 13G/A of BlackRock, Inc., a parent holding company, filed with the SEC on January 30, 2018, reflecting beneficial ownership as of December 31, 2017, with sole investment discretion with respect to all such shares, and sole voting authority with respect to 7,044,125 shares. The address of BlackRock, Inc. is 55 East 52nd Street, New York, New York 10055. |
(5) | Based solely on a Schedule 13G/A filed on February 13, 2018 by OrbiMed Advisors LLC (Advisors) and OrbiMed Capital LLC (Capital), reflecting beneficial ownership as of December 31, 2017. The beneficial ownership reflected in the table includes 2,778,004 ordinary shares beneficially owned by Advisors with shared voting and investment discretion and 4,074,064 ordinary shares beneficially owned by Capital with shared voting and investment discretion. Advisors and Capital exercise investment and voting power over the shares through a management committee comprised of Carl L. Gordon, Sven H. Borho and Jonathan T. Silverstein, each of whom disclaims beneficial ownership of the shares. Neither reporting person beneficially owns more than 5% of the outstanding shares. Advisors disclaims beneficial ownership of the shares held indirectly by Capital, and Capital disclaims beneficial ownership of the shares held indirectly by Advisors. The address of their principal business office is 601 Lexington Avenue, 54th Floor, New York, New York 10022 |
(6) | Based solely on information contained in a Schedule 13G/A of Invesco Ltd., a parent holding company, filed with the SEC on February 13, 2018, reflecting beneficial ownership as of December 29, 2017, with sole investment discretion with respect to all such shares and sole voting authority with respect to 5,411,205 shares. The address of Invesco Ltd. is 1555 Peachtree Street NE, Suite 1800, Atlanta, Georgia 30309. |
Security Ownership of Management
The table below sets forth certain information concerning the beneficial ownership of our ordinary shares as of February 23, 2018, by each of our directors and named executive officers and all of our current directors and executive officers as a group.
The calculations in the table below assume that there are 105,906,409 ordinary shares outstanding. Beneficial ownership is determined in accordance with the rules and regulations of the SEC. In computing the number of ordinary shares beneficially owned by a person and the percentage ownership of that person, we have included ordinary shares that the person has the right to acquire within 60 days, including through the exercise of any option, warrant or other right, the conversion of any other security, and the issuance of ordinary shares upon the vesting of stock awards granted in the form of restricted stock units. The ordinary shares that a shareholder has the right to acquire within 60 days, however, are not included in the computation of the percentage ownership of any other person.
Class of | Ordinary shares beneficially owned(1) | ||||||
securities | Name and address of beneficial owner | Number | Percent | ||||
Ordinary shares | David D. Stevens | 141,787 | * | ||||
Ordinary shares | Gary D. Blackford | 140,439 | * | ||||
Ordinary shares | John L. Miclot | 123,513 | * | ||||
Ordinary shares | Kevin C. O’Boyle | 110,345 | * | ||||
Ordinary shares | Amy S. Paul | 130,131 | * | ||||
Ordinary shares | Richard F. Wallman | 109,203 | * | ||||
Ordinary shares | Elizabeth H. Weatherman | 27,405 | * | ||||
Ordinary shares | Robert J. Palmisano | 2,031,500 | 1.9% | ||||
Ordinary shares | Lance A. Berry | 281,760 | * | ||||
Ordinary shares | Kevin D. Cordell | 121,307 | * | ||||
Ordinary shares | Jason D. Asper | — | * | ||||
Ordinary shares | James A. Lightman | 149,038 | * | ||||
Ordinary shares | All directors and executive officers as a group (20 persons) | 4,045,597 | 3.7% | ||||
____________________
189
* | Represents beneficial ownership of less than 1% of our outstanding ordinary shares. |
(1) | Includes for the persons listed below the following ordinary shares subject to options held by that person that are currently exercisable or become exercisable within 60 days of February 23, 2018 and ordinary shares issuable upon the vesting of RSU awards within 60 days of February 23, 2018: |
Name | Options | RSU awards | ||||
David D. Stevens | 68,445 | — | ||||
Gary D. Blackford | 78,752 | — | ||||
John L. Miclot | 89,063 | — | ||||
Kevin C. O’Boyle | 94,720 | — | ||||
Amy S. Paul | 94,217 | — | ||||
Richard F. Wallman | 13,682 | 919 | ||||
Elizabeth H. Weatherman | 19,191 | — | ||||
Robert J. Palmisano | 1,712,132 | — | ||||
Lance A. Berry | 209,336 | — | ||||
Kevin D. Cordell | 102,130 | — | ||||
Jason D. Asper | — | — | ||||
James A. Lightman | 128,483 | — | ||||
All directors and executive officers as a group (20 persons) | 3,169,687 | 919 | ||||
Securities Authorized for Issuance Under Equity Compensation Plans
The table below provides information regarding the number of ordinary shares to be issued upon the exercise of outstanding stock options and RSU awards granted under our equity compensation plans and the number of ordinary shares remaining available for future issuance our equity compensation plans as of December 31, 2017.
EQUITY COMPENSATION PLAN INFORMATION
Plan category | Number of securities to be issued upon exercise of outstanding options, warrants and rights (a) | Weighted‑average exercise price of outstanding options, warrants and rights (b) | Number of securities remaining available for future issuance under equity compensation plans (excluding securities reflected in column (a)) (c) | |||
Equity compensation plans approved by security holders | 8,023,598 (1)(2)(3) | $22.22 (4) | 4,865,082 (5) | |||
Equity compensation plans not approved by security holders | — | — | — | |||
Total | 8,023,598 (1)(2)(3) | $22.22 (4) | 4,865,082 (5) | |||
____________________
(1) | Amount includes ordinary shares issuable upon the exercise of stock options granted under the Wright Medical Group N.V. 2017 Equity and Incentive Plan, Wright Medical Group N.V. Amended and Restated 2010 Incentive Plan and Tornier N.V. Amended and Restated Stock Option Plan, ordinary shares issuable upon the vesting of RSU awards granted under the Wright Medical Group N.V. 2017 Equity and Incentive Plan and Wright Medical Group N.V. Amended and Restated 2010 Incentive Plan and PSU awards granted under the Wright Medical Group N.V. 2017 Equity and Incentive Plan, assuming target PSU payouts. |
(2) | Excludes employee stock purchase rights under the Wright Medical Group N.V. Amended and Restated Employee Stock Purchase Plan, which is an amended and restated version of the Tornier N.V. 2010 Employee Stock Purchase Plan, was approved by our shareholders on June 28, 2016. Under such plan, each eligible employee may purchase ordinary shares at semi-annual intervals on June 30th and December 31st each calendar year at a purchase price per share equal to 85% of the closing sales price per share of our ordinary shares on the last day of the offering period. |
(3) | Excludes an aggregate of 3,353,172 ordinary shares issuable upon the exercise of stock options granted under legacy Wright equity compensation plans and non-plan inducement option agreements assumed by us in connection with the Wright/Tornier merger. The weighted-average per share exercise price of these assumed stock options as of December 31, 2017 was $22.12. No further grants or awards will be made under these assumed legacy Wright equity compensation plans and non-plan inducement option agreements. |
(4) | Not included in the weighted-average exercise price calculation are 1,279,588 RSU awards and 108,414 PSU awards. |
(5) | Amount includes 4,430,789 ordinary shares remaining available for future issuance under the Wright Medical Group N.V. 2017 Equity and Incentive Plan and 434,293 ordinary shares remaining available for future issuance under the Wright Medical Group N.V. Amended and Restated Employee Stock Purchase Plan, assuming maximum PSU payouts. No shares remain available for grant under the Wright |
190
Medical Group N.V. Amended and Restated 2010 Incentive Plan, Tornier N.V. Amended and Restated Stock Option Plan or any of the legacy Wright equity compensation plans since such plans have been terminated with respect to future grants.
Item 13. Certain Relationships and Related Transactions, and Director Independence.
Procedures Regarding Approval of Related Party Transactions
As provided in our audit committee charter, all related party transactions are to be reviewed and pre-approved by the audit committee. Related party transactions are transactions to which we were or are a participant and in which:
• | the amounts involved exceeded or will exceed $120,000; and |
• | a related person (including any director, director nominee, executive officer, holder of more than 5% of our ordinary shares or any member of their immediate family) had or will have a direct or indirect material interest. |
In determining whether to approve a related party transaction, the audit committee generally will evaluate the transaction in terms of (i) the benefits to our Company; (ii) the impact on a director’s independence in the event the related person is a director, an immediate family member of a director, or an entity in which a director is a partner, shareholder or executive officer; (iii) the availability of other sources for comparable products or services; (iv) the terms and conditions of the transaction; and (v) the terms available to unrelated third parties or to employees generally. The audit committee will then document its findings and conclusions in written minutes. In the event a transaction relates to a member of the audit committee, that member will not participate in the audit committee’s deliberations.
We are unaware of any related party transactions that have occurred since the beginning of our last fiscal year, or any currently proposed related party transactions requiring disclosure in this report.
Director Independence
The information regarding director independence is disclosed in “Part III - Item 10. Directors, Executive Officers and Corporate Governance—Board Structure and Composition” and in “Part III - Item 10. Directors, Executive Officers and Corporate Governance—Board Committees” of this report.
Item 14. Principal Accounting Fees and Services.
Appointment of Independent Registered Public Accounting Firms
The audit committee of our board of directors is directly responsible for the appointment, compensation, and oversight of our independent auditor or independent registered public accounting firm. Our general meeting of shareholders is directly responsible for the appointment of the auditor that audits our Dutch statutory annual accounts prepared in accordance with Dutch law each year.
Audit, Audit-Related, Tax, and All Other Fees
The following table shows the fees that we paid or accrued for audit and other services provided by our independent registered public accounting firm, KPMG LLP, for 2017 and 2016:
Fees | 2017 | 2016 | ||||||
Audit fees | $ | 2,050,153 | $ | 2,400,253 | ||||
Audit-related fees | 72,550 | 43,000 | ||||||
Tax fees | — | 265,000 | ||||||
All other fees | 3,000 | 120,000 | ||||||
Total | $ | 2,125,703 | $ | 2,828,253 | ||||
In the above table, in accordance with the SEC’s definitions and rules, “audit fees” are fees for professional services for the audit of our consolidated financial statements included in this annual report on Form 10-K, and the review of our consolidated financial statements included in quarterly reports on Form 10-Q and registration statements and for services that are normally provided by our independent registered public accounting firm in connection with statutory and regulatory filings or engagements; “audit-related fees” are fees for assurance and related services that are reasonably related to the performance of the audit or review of our consolidated financial statements and are not included in “audit fees” and include fees for services performed related to audits on our benefit plan and due diligence on acquisitions; “tax fees” are fees for tax compliance and consultation primarily related to assistance with international tax compliance and tax audits, tax advice on acquisitions, and tax planning; and “all other fees” are fees for any services not included in the first three categories, which includes fees for a risk management review and assessment.
191
Pre-Approval Policies and Procedures
In addition to retaining KPMG LLP to audit our consolidated financial statements for 2017, the audit committee retained KPMG LLP to provide other auditing and advisory services in 2017. The audit committee understands the need for our independent registered public accounting firm to maintain objectivity and independence in its audits of our consolidated financial statements. The audit committee has reviewed all non-audit services provided by KPMG LLP in 2017 and has concluded that the provision of such services was compatible with maintaining KPMG LLP’s independence in the conduct of its auditing functions.
To help ensure the independence of the independent auditor, the audit committee pre-approves all audit and permissible non-audit services to be provided to us by our independent registered public accounting firm prior to commencement of services. Our audit committee chairman has the delegated authority to pre-approve such services up to a specified aggregate fee amount. These pre-approval decisions are presented to the full audit committee at its next scheduled meeting.
192
PART IV
Item 15. Exhibits, Financial Statement Schedules.
Financial Statements
See Index to Consolidated Financial Statements in “Item 8. Financial Statements and Supplementary Data.”
Financial Statement Schedules
See Schedule II — Valuation and Qualifying Accounts on page S-1 of this report.
Exhibits
The exhibits to this report are listed below. A copy of any of the exhibits will be furnished at a reasonable cost, upon receipt of a written request for any such exhibit. Such request should be sent to James A. Lightman, Senior Vice President, General Counsel and Secretary, Wright Medical Group N.V., Prins Bernhardplein 200, 1097 JB Amsterdam, the Netherlands. The Exhibit Index indicates each management contract or compensatory plan or arrangement required to be filed as an exhibit to this report.
Exhibit No. | Exhibit | Method of Filing | ||
2.1 | Business Sale Agreement dated October 21, 2016 between Tornier SAS, Corin France SAS, Corin Orthopaedics Holdings Limited and Certain Related Entities Party Thereto* | |||
2.2 | Agreement and Plan of Merger dated as of October 27, 2014 among Tornier N.V., Trooper Holdings Inc., Trooper Merger Sub Inc. and Wright Medical Group, Inc.* | |||
2.3 | Agreement and Plan of Merger dated as of January 30, 2014 among Wright Medical Group, Inc., WMMS, LLC, OrthoPro, L.L.C. and OP CHA, Inc., as Company Holders’ Agent* | |||
2.4 | Agreement and Plan of Merger dated as of January 30, 2014 among Wright Medical Group, Inc., Winter Solstice LLC, Solana Surgical, LLC, and Alan Taylor, as Members’ Representative* | |||
2.5 | Asset Purchase Agreement dated as of June 18, 2013 among MicroPort Medical B.V., MicroPort Scientific Corporation and Wright Medical Group, Inc.* | |||
2.6 | Agreement and Plan of Merger dated as of November 19, 2012 among BioMimetic Therapeutics, Inc., Wright Medical Group, Inc., Achilles Merger Subsidiary, Inc. and Achilles Acquisition Subsidiary, LLC* | |||
3.1 | Articles of Association of Wright Medical Group N.V. | |||
4.1 | Indenture dated as of May 20, 2016 between Wright Medical Group N.V. and The Bank of New York Mellon Trust Company, N.A. (including the Form of the 2.25% Cash Convertible Senior Note due 2021) | |||
4.2 | Indenture dated as of February 13, 2015 between Wright Medical Group, Inc. and Bank of New York Mellon Trust Company, N.A. (including the Form of the 2.00% Cash Convertible Senior Note due 2020) | |||
193
Exhibit No. | Exhibit | Method of Filing | ||
4.3 | Supplemental Indenture dated as of November 24, 2015 among Wright Medical Group, Inc., Wright Medical Group N.V., as Guarantor, and The Bank of New York Mellon Trust Company, N.A., as Trustee | |||
4.4 | Contingent Value Rights Agreement dated as of March 1, 2013 between Wright Medical Group, Inc. and American Stock Transfer & Trust Company, LLC | |||
4.5 | Assignment and Assumption Agreement dated as of October 1, 2015 between Wright Medical Group, Inc., Wright Medical Group N.V. and American Stock Transfer & Trust Company, LLC, as Trustee | |||
10.1 | Wright Medical Group N.V. 2017 Equity and Incentive Plan** | |||
10.2 | Form of Option Award Agreement under the Wright Medical Group N.V. 2017 Equity and Incentive Plan Representing Stock Options Granted to Executive Officers** | |||
10.3 | Form of Restricted Stock Unit Award Agreement under the Wright Medical Group N.V. 2017 Equity and Incentive Plan Representing Restricted Stock Units Granted to Executive Officers** | |||
10.4 | Form of Restricted Stock Unit Award Agreement under the Wright Medical Group N.V. 2017 Equity and Incentive Plan Representing Restricted Stock Units Granted to New Executive Officers** | |||
10.5 | Form of Performance Award Agreement under the Wright Medical Group N.V. 2017 Equity and Incentive Plan Representing Performance Awards Granted to Executive Officers** | |||
10.6 | Form of Option Award Agreement under the Wright Medical Group N.V. 2017 Equity and Incentive Plan Representing Stock Options Granted to Robert J. Palmisano** | |||
10.7 | Form of Restricted Stock Unit Award Agreement under the Wright Medical Group N.V. 2017 Equity and Incentive Plan Representing Restricted Stock Units Granted to Robert J. Palmisano** | |||
10.8 | Form of Performance Award Agreement under the Wright Medical Group N.V. 2017 Equity and Incentive Plan Representing Performance Awards Granted to Robert J. Palmisano** | |||
10.9 | Form of Option Award Agreement under the Wright Medical Group N.V. 2017 Equity and Incentive Plan Representing Stock Options Granted to Non-Executive Directors** | |||
10.10 | Form of Restricted Stock Unit Award Agreement under the Wright Medical Group N.V. 2017 Equity and Incentive Plan Representing Restricted Stock Units Granted to Non-Executive Directors** | |||
194
Exhibit No. | Exhibit | Method of Filing | ||
10.11 | Form of Restricted Stock Unit Award Agreement under the Wright Medical Group N.V. 2017 Equity and Incentive Plan Representing Restricted Stock Units Granted to Non-Executive Directors in Lieu of Cash Retainers** | |||
10.12 | Wright Medical Group N.V. Amended and Restated 2010 Incentive Plan** | |||
10.13 | Form of Option Certificate under the Wright Medical Group N.V. Amended and Restated 2010 Incentive Plan Representing Stock Options Granted to Executive Officers** | |||
10.14 | Form of Stock Grant Certificate (in the Form of a Restricted Stock Unit) under the Wright Medical Group N.V. Amended and Restated 2010 Incentive Plan Representing Restricted Stock Units Granted to Executive Officers** | |||
10.15 | Form of Stock Grant Certificate (in the Form of a Restricted Stock Unit) under the Wright Medical Group N.V. Amended and Restated 2010 Incentive Plan Representing Restricted Stock Units Granted to New Executive Officers** | |||
10.16 | Form of Option Certificate under the Wright Medical Group N.V. Amended and Restated 2010 Incentive Plan Representing Stock Options Granted to Robert J. Palmisano** | |||
10.17 | Form of Stock Grant Certificate (in the Form of a Restricted Stock Unit) under the Wright Medical Group N.V. Amended and Restated 2010 Incentive Plan Representing Restricted Stock Units Granted to Robert J. Palmisano** | |||
10.18 | Form of Option Certificate under the Wright Medical Group N.V. Amended and Restated 2010 Incentive Plan Representing Stock Options Granted to Non-Executive Directors** | |||
10.19 | Form of Stock Grant Certificate (in the Form of a Restricted Stock Unit) under the Wright Medical Group N.V. Amended and Restated 2010 Incentive Plan Representing Restricted Stock Units Granted to Non-Executive Directors** | |||
10.20 | Form of Stock Grant Certificate (in the Form of a Restricted Stock Unit) under the Wright Medical Group N.V. Amended and Restated 2010 Incentive Plan Representing Restricted Stock Units Granted to Non-Executive Directors in Lieu of Cash Retainers** | |||
10.21 | Tornier N.V. Amended and Restated 2010 Incentive Plan** | |||
10.22 | Form of Option Certificate under the Tornier N.V. 2010 Incentive Plan** | |||
10.23 | Tornier N.V. Amended and Restated Stock Option Plan** | |||
195
Exhibit No. | Exhibit | Method of Filing | ||
10.24 | Form of Option Agreement under the Tornier N.V. Stock Option Plan for Directors and Officers** | |||
10.25 | Wright Medical Group, Inc. Second Amended and Restated 2009 Equity Incentive Plan** | |||
10.26 | Form of Executive Stock Option Agreement under the Wright Medical Group, Inc. Second Amended and Restated 2009 Equity Incentive Plan** | |||
10.27 | Form of Non-Employee Director Stock Option Agreement under the Wright Medical Group, Inc. Second Amended and Restated 2009 Equity Incentive Plan** | |||
10.28 | Wright Medical Group, Inc. Fifth Amended and Restated 1999 Equity Incentive Plan** | |||
10.29 | First Amendment to the Wright Medical Group, Inc. Fifth Amended and Restated 1999 Equity Incentive Plan** | |||
10.30 | Form of Executive Stock Option Agreement under the Wright Medical Group, Inc. Fifth Amended and Restated 1999 Equity Incentive Plan** | |||
10.31 | Form of Non-Employee Director Stock Option Agreement under the Wright Medical Group, Inc. Fifth Amended and Restated 1999 Equity Incentive Plan** | |||
10.32 | Wright Medical Group N.V. Amended and Restated Employee Stock Purchase Plan** | |||
10.33 | Wright Medical Group N.V. Performance Incentive Plan** | |||
10.34 | Form of Indemnification Agreement** | |||
10.35 | Service Agreement effective as of October 1, 2015 between Wright Medical Group N.V. and Robert J. Palmisano** | |||
10.36 | Employment Agreement effective as of October 1, 2015 between Wright Medical Group, Inc. and Robert J. Palmisano** | |||
10.37 | Guaranty by Wright Medical Group N.V. effective as of October 1, 2015 with respect to Wright Medical Group, Inc. Obligations under Employment Agreement with Robert J. Palmisano** | |||
196
Exhibit No. | Exhibit | Method of Filing | ||
10.38 | Confidentiality, Non-Competition, Non-Solicitation and Intellectual Property Rights Agreement effective as of October 1, 2015 between Wright Medical Group, Inc. and Robert J. Palmisano** | |||
10.39 | Inducement Stock Option Grant Agreement dated as of September 17, 2011 between Wright Medical Group, Inc. and Robert J. Palmisano** | |||
10.40 | Confidentiality, Non-Competition, Non-Solicitation and Intellectual Property Rights Agreement effective as of October 1, 2015 between Wright Medical Group, Inc. and Lance A. Berry** | |||
10.41 | Separation Pay Agreement effective as of October 1, 2015 between Wright Medical Group, Inc. and Lance A. Berry** | |||
10.42 | Confidentiality, Non-Competition, Non-Solicitation and Intellectual Property Rights Agreement effective as of October 1, 2015 between Wright Medical Group, Inc. and Kevin D. Cordell** | |||
10.43 | Separation Pay Agreement effective as of October 1, 2015 between Wright Medical Group, Inc. and Kevin D. Cordell** | |||
10.44 | Confidentiality, Non-Competition, Non-Solicitation and Intellectual Property Rights Agreement dated as of August 14, 2017 between Wright Medical Group, Inc. and Jason D. Asper** | |||
10.45 | Separation Pay Agreement effective as of August 14, 2017 between Wright Medical Group, Inc. and Jason D. Asper** | |||
10.46 | Offer Letter dated July 3, 2017 between Wright Medical Group, Inc. and Jason D. Asper** | |||
10.47 | Confidentiality, Non-Competition, Non-Solicitation and Intellectual Property Rights Agreement effective as of October 1, 2015 between Wright Medical Group, Inc. and James A. Lightman** | |||
10.48 | Separation Pay Agreement effective as of October 1, 2015 between Wright Medical Group, Inc. and James A. Lightman** | |||
10.49 | Inducement Stock Option Grant Agreement dated as of December 29, 2011 between Wright Medical Group, Inc. and James A. Lightman** | |||
10.50 | Form of Guaranty by Wright Medical Group N.V. with respect to Wright Medical Group, Inc. Obligations under Separation Pay Agreements with Executive Officers** | |||
10.51 | Credit, Security and Guaranty Agreement dated as of December 23, 2016 among Wright Medical Group N.V. (as Guarantor), Wright Medical Group, Inc. (as Borrower), Certain Other Direct and Indirect Subsidiaries Listed on the Signature Pages Thereto (each as Borrower), Midcap Financial Trust (as Lender and Agent) and the Financial Institutions or Other Entities Parties Thereto | |||
197
Exhibit No. | Exhibit | Method of Filing | ||
10.52 | Amendment No. 1 to Credit, Security and Guaranty Agreement dated as of February 2, 2017 among Wright Medical Group N.V. (as Guarantor), Wright Medical Group, Inc. (as Borrower), Certain Other Direct and Indirect Subsidiaries Listed on the Signature Pages Thereto (each as Borrower), Midcap Funding IV Trust (as Lender and Agent) and the Financial Institutions or other Entities Parties Thereto | |||
10.53 | Limited Consent and Amendment No. 2 to Credit, Security and Guaranty Agreement dated as of December 14, 2017 among Wright Medical Group N.V. (as Guarantor), Wright Medical Group, Inc. (as Borrower), Certain Other Direct and Indirect Subsidiaries Listed on the Signature Pages Thereto (each as Borrower), Midcap Funding IV Trust (as Lender and Agent) and the Financial Institutions or other Entities Parties Thereto | |||
10.54 | Form of Exchange/Subscription Agreement dated as of May 12, 2016 between Wright Medical Group N.V. and Each Investor Party Thereto | |||
10.55 | Form of Subscription Agreement dated as of May 12, 2016 between Wright Medical Group N.V. and Each Investor Party Thereto | |||
10.56 | Call Option Transaction Confirmation dated as of May 12, 2016 between Wright Medical Group N.V. and JPMorgan Chase Bank, National Association | |||
10.57 | Call Option Transaction Confirmation dated as of May 12, 2016 between Wright Medical Group N.V. and Bank of America, N.A. | |||
10.58 | Warrants Confirmation dated as of May 12, 2016 between Wright Medical Group N.V. and JPMorgan Chase Bank, National Association | |||
10.59 | Warrants Confirmation dated as of May 12, 2016 between Wright Medical Group N.V. and Bank of America, N.A. | |||
10.60 | Base Call Option Transaction Confirmation dated as of February 9, 2015 between Wright Medical Group, Inc. and Deutsche Bank AG, London Branch | |||
10.61 | Base Call Option Transaction Confirmation dated as of February 9, 2015 between Wright Medical Group, Inc. and JPMorgan Chase Bank, National Association | |||
10.62 | Base Call Option Transaction Confirmation dated as of February 9, 2015 between Wright Medical Group, Inc. and Wells Fargo Bank, National Association | |||
10.63 | Base Warrants Confirmation dated as of February 9, 2015 between Wright Medical Group, Inc. and Deutsche Bank AG, London Branch | |||
10.64 | Base Warrants Confirmation dated as of February 9, 2015 between Wright Medical Group, Inc. and JPMorgan Chase Bank, National Association | |||
198
Exhibit No. | Exhibit | Method of Filing | ||
10.65 | Base Warrants Confirmation dated as of February 9, 2015 between Wright Medical Group, Inc. and Wells Fargo Bank, National Association | |||
10.66 | Additional Call Option Transaction Confirmation dated as of February 10, 2015 between Wright Medical Group, Inc. and Deutsche Bank AG, London Branch | |||
10.67 | Additional Call Option Transaction Confirmation dated as of February 10, 2015 between Wright Medical Group, Inc. and JPMorgan Chase Bank, National Association | |||
10.68 | Additional Call Option Transaction Confirmation dated as of February 10, 2015 between Wright Medical Group, Inc. and Wells Fargo Bank, National Association | |||
10.69 | Additional Warrants Confirmation dated as of February 10, 2015 between Wright Medical Group, Inc. and Deutsche Bank AG, London Branch | |||
10.70 | Additional Warrants Confirmation dated as of February 10, 2015 between Wright Medical Group, Inc. and JPMorgan Chase Bank, National Association | |||
10.71 | Additional Warrants Confirmation dated as of February 10, 2015 between Wright Medical Group, Inc. and Wells Fargo Bank, National Association | |||
10.72 | Amendment to the Base Warrant Confirmation dated as of November 24, 2015 between Wright Medical Group N.V. and Deutsche Bank AG, London Branch | |||
10.73 | Amendment to the Base Warrant Confirmation dated as of November 24, 2015 between Wright Medical Group N.V. and JPMorgan Chase Bank, National Association | |||
10.74 | Amendment to the Base Warrant Confirmation dated as of November 24, 2015 between Wright Medical Group N.V. and Wells Fargo Bank, National Association | |||
10.75 | Amendment to the Additional Warrant Confirmation dated as of November 24, 2015 between Wright Medical Group N.V. and Deutsche Bank AG, London Branch | |||
10.76 | Amendment to the Additional Warrant Confirmation dated as of November 24, 2015 between Wright Medical Group N.V. and JPMorgan Chase Bank, National Association | |||
10.77 | Amendment to the Additional Warrant Confirmation dated as of November 24, 2015 between Wright Medical Group N.V. and Wells Fargo Bank, National Association | |||
10.78 | Form of Partial Termination Confirmation among Wright Medical Group N.V., Wright Medical Group, Inc. and each of JPMorgan Chase | |||
10.79 | Agreement of Lease dated as of December 31, 2013 between RBM Cherry Road Partners and Wright Medical Technology, Inc. | |||
199
Exhibit No. | Exhibit | Method of Filing | ||
10.80 | First Amendment to Agreement of Lease dated as of January 1, 2014 between RBM Cherry Road Partners and Wright Medical Technology, Inc. | |||
10.81 | Second Amendment to Agreement of Lease dated as of January 1, 2014 between RBM Cherry Road Partners and Wright Medical Technology, Inc. | |||
10.82 | Third Amendment to Agreement of Lease dated as of May 1, 2015 between RBM Cherry Road Partners and Wright Medical Technology, Inc. | |||
10.83 | Lease Agreement dated as of May 14, 2012 between Liberty Property Limited Partnership, as Landlord, and Tornier, Inc., as Tenant | |||
10.84 | Commercial Lease dated December 23, 2008 between Seamus Geaney and Tornier Orthopedics Ireland Limited | |||
10.85 | Commercial Supply Agreement dated March 29, 2016 between BioMimetic Therapeutics, LLC and FUJIFILM Diosynth Biotechnologies U.S.A., Inc. (1) | |||
10.86 | Settlement Agreement dated as of November 1, 2016 between Wright Medical Technology, Inc. and the Counsel Listed on the Signature Pages Thereto | |||
10.87 | Second Settlement Agreement dated as of October 3, 2017 between Wright Medical Technology, Inc. and the Counsel Listed on the Signature Pages Thereto | |||
10.88 | Third Settlement Agreement dated as of October 3, 2017 between Wright Medical Technology, Inc. and the Counsel Listed on the Signature Pages Thereto | |||
10.89 | First Amendment to the Third Settlement Agreement dated as of December 29, 2017 between Wright Medical Technology, Inc. and the Counsel Listed on the Signature Pages Thereto | |||
10.90 | Second Amendment to the Third Settlement Agreement dated as of February 23, 2018 between Wright Medical Technology, Inc. and the Counsel Listed on the Signature Pages Thereto | |||
12.1 | Computation of Ratio of Earnings to Fixed Charges | |||
21.1 | Subsidiaries of Wright Medical Group N.V. | |||
23.1 | Consent of KPMG LLP, an Independent Registered Public Accounting Firm | |||
31.1 | Certification of Chief Executive Officer pursuant to Exchange Act Rules 13a-14(a)/15d-14(a), as adopted pursuant to Section 302 of the Sarbanes-Oxley Act of 2002 | |||
31.2 | Certification of Chief Financial Officer pursuant to Exchange Act Rules 13a-14(a)/15d-14(a), as adopted pursuant to Section 302 of the Sarbanes-Oxley Act of 2002 | |||
200
Exhibit No. | Exhibit | Method of Filing | ||
32.1 | Certification of Chief Executive Officer and Chief Financial Officer pursuant to 18 U.S.C. Section 1350, as adopted pursuant to Section 906 of the Sarbanes-Oxley Act of 2002 | |||
101 | The following materials from Wright Medical Group N.V.’s Annual Report on Form 10-K for the fiscal year ended December 31, 2017, formatted in XBRL (Extensible Business Reporting Language): (i) the Consolidated Balance Sheets as of December 31, 2017 and December 25, 2016, (ii) the Consolidated Statements of Operations for each of the fiscal years in the three-year period ended December 31, 2017, (iii) the Consolidated Statements of Comprehensive Loss for each of the fiscal years in the three-year period ended December 25, 2016, (iv) the Consolidated Statements of Cash Flows for each of the fiscal years in the three-year period ended December 31, 2017, (v) Consolidated Statements of Shareholders’ Equity for each of the fiscal years in the three-year period ended December 31, 2017, and (vi) Notes to Consolidated Financial Statements | Filed herewith | ||
__________________________
* | All exhibits and schedules to this agreement have been omitted pursuant to Item 601(b)(2) of Regulation S-K. The Registrant will furnish the omitted exhibits and schedules to the Securities and Exchange Commission upon request by the Securities and Exchange Commission. |
** | A management contract or compensatory plan or arrangement. |
(1) | Portions of this exhibit have been redacted and are subject to an order granting confidential treatment under Rule 24b-2 of the Securities Exchange Act of 1934, as amended (File No. 001-35065, CF #33696). The redacted material was filed separately with the Securities and Exchange Commission. |
Note: | Certain instruments defining the rights of holders of long-term debt securities of the Registrant or its subsidiaries are omitted pursuant to Item 601(b)(4)(iii) of SEC Regulation S-K. The Registrant hereby undertakes to furnish to the Securities and Exchange Commission, upon request, copies of any such instruments. |
Item 16. Form 10-K Summary.
None.
201
SIGNATURES
Pursuant to the requirements of Section 13 or 15(d) of the Securities Exchange Act of 1934, the registrant has duly caused this report to be signed on its behalf by the undersigned, thereunto duly authorized.
February 27, 2018
WRIGHT MEDICAL GROUP N.V. | |
By: | /s/ Robert J. Palmisano |
Robert J. Palmisano | |
President and Chief Executive Officer | |
Pursuant to the requirements of the Securities Exchange Act of 1934, this report has been signed below by the following persons on behalf of the registrant and in the capacities and on the dates indicated.
Signature | Title | Date | ||
/s/ Robert J. Palmisano Robert J. Palmisano | President, Chief Executive Officer and Executive Director (Principal Executive Officer) | February 27, 2018 | ||
/s/ Lance A. Berry Lance A. Berry | Senior Vice President and Chief Financial Officer (Principal Financial Officer ) | February 27, 2018 | ||
/s/ Julie B. Andrews Julie B. Andrews | Vice President and Chief Accounting Officer (Principal Accounting Officer ) | February 27, 2018 | ||
/s/ David D. Stevens David D. Stevens | Chairman | February 27, 2018 | ||
/s/ Gary D. Blackford Gary D. Blackford | Non-Executive Director | February 27, 2018 | ||
/s/ John L. Miclot John L. Miclot | Non-Executive Director | February 27, 2018 | ||
/s/ Kevin C. O'Boyle Kevin C. O'Boyle | Non-Executive Director | February 27, 2018 | ||
/s/ Amy S. Paul Amy S. Paul | Non-Executive Director | February 27, 2018 | ||
/s/ Richard F. Wallman Richard F. Wallman | Non-Executive Director | February 27, 2018 | ||
/s/ Elizabeth H. Weatherman Elizabeth H. Weatherman | Non-Executive Director | February 27, 2018 | ||
202
Wright Medical Group N.V. Schedule II-Valuation and Qualifying Accounts (In thousands) | |||||||||||||||
Balance at Beginning of Period | Charged to Cost and Expenses | Deductions and Other | Balance at End of Period | ||||||||||||
Allowance for doubtful accounts: | |||||||||||||||
For the period ended: | |||||||||||||||
December 31, 2017 | $ | 4,469 | $ | 1,243 | $ | (1,384 | ) | $ | 4,328 | ||||||
December 25, 2016 | $ | 1,189 | $ | 3,475 | $ | (195 | ) | $ | 4,469 | ||||||
December 27, 2015 | $ | 930 | $ | (878 | ) | $ | 1,137 | $ | 1,189 | ||||||
S-1