Attached files
| file | filename |
|---|---|
| EX-31.2 - EX-31.2 - EQUAL ENERGY LTD. | d604808dex312.htm |
| EX-99.1 - EX-99.1 - EQUAL ENERGY LTD. | d604808dex991.htm |
| EX-31.1 - EX-31.1 - EQUAL ENERGY LTD. | d604808dex311.htm |
| EX-32.1 - EX-32.1 - EQUAL ENERGY LTD. | d604808dex321.htm |
| EX-32.2 - EX-32.2 - EQUAL ENERGY LTD. | d604808dex322.htm |
Table of Contents
UNITED STATES
SECURITIES AND EXCHANGE COMMISSION
Washington, D.C. 20549
Form 10-K/A
(Amendment No. 1)
(Mark One)
| x | ANNUAL REPORT PURSUANT TO SECTION 13 OR 15(d) OF THE SECURITIES EXCHANGE ACT OF 1934 |
For the fiscal year ended December 31, 2012
or
| ¨ | TRANSITION REPORT PURSUANT TO SECTION 13 OR 15(d) OF THE SECURITIES EXCHANGE ACT OF 1934 |
Commission File Number 001-34759
EQUAL ENERGY LTD.
(Exact name of registrant as specified in its charter)
| Alberta, Canada | 98-0533758 | |
| (State of other jurisdiction of incorporation or organization) |
(I.R.S. Employer identification No.) | |
| 4801 Gaillardia Pkwy, Suite 325 Oklahoma City, OK |
73142 | |
| (Address of principal executive offices) | (Zip code) | |
Registrant’s telephone number, including area code:
(403) 263-0262
Securities registered pursuant to Section 12(b) of the Act:
| Title of each class |
Name of each exchange on which registered | |
| Common shares, without par value | The New York Stock Exchange |
Securities registered pursuant to Section 12(g) of the Act:
None
Indicate by check mark if the registrant is a well-known seasoned issuer, as defined in Rule 405 of the Securities Act. Yes ¨ No x
Indicate by check mark if the registrant is not required to file reports pursuant to Section 13 or Section 15(d) of the Act. Yes ¨ No x
Indicate by check mark whether the registrant (1) has filed all reports required to be filed by Section 13 or 15(d) of the Securities Exchange Act of 1934 during the preceding 12 months (or for such shorter period that the registrant was required to file such reports), and (2) has been subject to such filing requirements for the past 90 days. Yes x No ¨
Indicate by check mark whether the registrant has submitted electronically and posted on its corporate Web site, if any, every Interactive Data File required to be submitted and posted pursuant to Rule 405 of Regulation S-T (§232.405 of this chapter) during the preceding 12 months (or for such shorter period that the registrant was required to submit and post such files). Yes x No ¨
Indicate by check mark if disclosure of delinquent filers pursuant to Item 405 of Regulation S-K (§ 229.405 of this chapter) is not contained herein, and will not be contained, to the best of registrant’s knowledge, in definitive proxy or information statements incorporated by reference in Part III of this Form 10-K or any amendment to this Form 10-K. ¨
Indicate by check mark whether the registrant is a large accelerated filer, an accelerated filer, a non-accelerated filer, or a smaller reporting company. See the definitions of “large accelerated filer,” “accelerated filer” and “smaller reporting company” in Rule 12b-2 of the Exchange Act. (Check one):
| Large accelerated filer | ¨ | Accelerated filer | x | |||
| Non-accelerated filer | ¨ (Do not check if a smaller reporting company) | Smaller reporting company | ¨ | |||
Indicate by check mark whether the registrant is a shell company (as defined in Rule 12b-2 of the Exchange Act). Yes ¨ No x
The aggregate market value of the common stock held by non-affiliates of the registrant as of June 29, 2012, was approximately $87.3 million, based on the closing price as quoted by the New York Stock Exchange. As of March 14, 2013, 35,562,967 million shares of common stock were outstanding.
DOCUMENTS INCORPORATED BY REFERENCE
Certain portions of the registrant’s definitive proxy statement filed with the Securities and Exchange Commission in connection with the 2013 annual meeting of stockholders are incorporated by reference into — Part III of this Annual Report on Form 10-K.
Table of Contents
EXPLANATORY NOTE
This Amendment No. 1 to the Annual Report on Form 10-K of Equal Energy Ltd. for the fiscal year ended December 31, 2012, originally filed with the Securities and Exchange Commission on March 15, 2013 (the “Original Report”), is being filed in order to clarify and update certain information included in the original filing. In particular, this Amendment No. 1 is being filed in order to amend various sections in Part I - Items 1 and 2. Business and Properties, Part I - Item 1A. Risk Factors, Part II - Item 7. Management’s Discussion and Analysis of Financial Condition and Results of Operations, footnote 16. Supplemental Information on Oil and Natural Gas Producing Activities (Unaudited) of Item 8. Financial Statements and Supplementary Data, Part III - Item 10. Directors, Executive Officers and Corporate Governance, PART III - Item 11. Executive Compensation, Part III - Item 12. Security Ownership of Certain Beneficial Owners and Management and Related Stockholder Matters, Part III - Item 13. Certain Relationships and Related Transactions, and Director Independence, Part IV - Item 15. Exhibits and Financial Statement Schedules of the Original Report.
This Amendment No. 1 speaks as of the initial filing date of the Original Report. Other than as expressly set forth above and other than certain conforming amendments, no part of the Original Report is being amended. Accordingly, other than as discussed above, this Amendment No. 1 does not purport to amend, update or restate any other information or disclosure included in the Original Report, or reflect any events that have occurred after the initial filing date of the Original Report. As a result, Equal Energy’s Annual Report on Form 10-K for the fiscal year ended December 31, 2012 continues to speak as of March 15, 2013 or, to the extent applicable, such other date as may be indicated in the Original Report.
Information Regarding Forward-Looking Statements
Various statements contained in this report, including those that express a belief, expectation, or intention, as well as those that are not statements of historical fact, are forward-looking statements within the meaning of Section 27A of the Securities Act of 1933, as amended (the “Securities Act”), and Section 21E of the Securities Exchange Act of 1934, as amended (the “Exchange Act”). These statements express a belief, expectation or intention and generally are accompanied by words that convey projected future events or outcomes. These forward-looking statements may include projections and estimates concerning capital expenditures, the Company’s liquidity, capital resources, and debt profile, pending acquisitions or dispositions, the timing and success of specific projects, outcomes and effects of litigation, claims and disputes, elements of the Company’s business strategy, compliance with governmental regulation of the oil and natural gas industry, including environmental regulations, acquisitions and divestitures and the effects thereof on the Company’s financial condition and other statements concerning the Company’s operations, economic performance and financial condition. Forward-looking statements are generally accompanied by words such as “estimate,” “assume,” “target,” “project,” “predict,” “believe,” “expect,” “anticipate,” “potential,” “could,” “may,” “foresee,” “plan,” “goal,” “should,” “intend” or other words that convey the uncertainty of future events or outcomes. The Company has based these forward-looking statements on its current expectations and assumptions about future events. These statements are based on certain assumptions and analyses made by the Company in light of its experience and perception of historical trends, current conditions and expected future developments as well as other factors the Company believes are appropriate under the circumstances. The actual results or developments anticipated may not be realized or, even if substantially realized, may not have the expected consequences to or effects on the Company’s business or results. Such statements are not guarantees of future performance and actual results or developments may differ materially from those projected in such forward-looking statements. These forward-looking statements speak only as of the date hereof. The Company disclaims any obligation to update or revise these forward-looking statements unless required by law, and it cautions readers not to rely on them unduly. While the Company’s management considers these expectations and assumptions to be reasonable, they are inherently subject to significant business, economic, competitive, regulatory and other risks, contingencies and uncertainties relating to, among other matters, the risks and uncertainties discussed in “Risk Factors” in Item 1A of this report, including the following:
| • | risks associated with drilling oil and natural gas wells; |
1
Table of Contents
| • | the volatility of oil and natural gas prices; |
| • | uncertainties in estimating oil and natural gas reserves; |
| • | the need to replace the oil and natural gas the Company produces; |
| • | the Company’s ability to execute its growth strategy by drilling wells as planned; |
| • | risks and liabilities associated with acquired properties and risks related to the integration of acquired businesses; |
| • | amount, nature and timing of capital expenditures, including future development costs, required to develop the Company’s undeveloped areas; |
| • | concentration of operations in Central Oklahoma; |
| • | inability to retain drilling rigs and other services; |
| • | risk of currency fluctuations; |
| • | the potential adverse effect of commodity price declines on the carrying value of the Company’s oil and natural gas properties; |
| • | severe or unseasonable weather that may adversely affect production; |
| • | availability of satisfactory oil and natural gas marketing and transportation; |
| • | availability and terms of capital to fund capital expenditures; |
| • | amount and timing of proceeds of asset sales and asset monetizations; |
| • | ability to fund ongoing dividends; |
| • | limitations on operations resulting from debt restrictions and financial covenants; |
| • | potential financial losses or earnings reductions from commodity derivatives; |
| • | potential elimination or limitation of tax incentives; |
| • | competition in the oil and natural gas industry; |
| • | risks associated with consent solicitations and proxy contests conducted by dissident stockholders; |
| • | general economic conditions, either internationally or domestically or in the areas where the Company operates; |
2
Table of Contents
| • | inability to obtain required regulatory approvals for development activities; |
| • | costs to comply with current and future governmental regulation of the oil and natural gas industry, including environmental, health and safety laws and regulations, and regulations with respect to hydraulic fracturing; and |
| • | the need to maintain adequate internal control over financial reporting. |
The reader is further cautioned that the preparation of the financial statements in this report that are in accordance with GAAP requires management to make certain judgments and estimates that affect the reported amounts of assets, liabilities, revenues and expenses. Estimating reserves is also critical to several accounting estimates and requires judgments and decisions based upon available geological, geophysical, engineering and economic data. These estimates may change, having either a negative or positive effect on the financial status of the Company as further information becomes available, and as the economic environment changes.
Many of these risk factors and other specific risks and uncertainties are discussed in further detail throughout this report and in the Corporation’s management’s discussion and analysis for the year ended December 31, 2012 (the “MD&A”), which is available through the internet on the Corporation’s SEDAR profile at www.sedar.com, on EDGAR at www.sec.gov, and on the Corporation’s website at www.equalenergy.ca. Readers are also referred to the risk factors described in this report under “Risk Factors” and in other documents the Corporation’s files from time to time with securities regulatory authorities. Copies of these documents are available without charge from the Corporation or electronically on the internet on the Corporation’s SEDAR profile at www.sedar.com on EDGAR at www.sec.gov and on the Corporation’s website at www.equalenergy.ca.
Boe’s may be misleading, particularly if used in isolation. A boe conversion ratio of six mcf to one boe is based on an energy equivalency conversion method primarily applicable at the burner tip and does not necessarily represent a value equivalence at the wellhead.
CONVENTIONS
Unless otherwise indicated, all references herein to dollar amounts are in Canadian dollars (Cdn$) and references herein to “$” or “dollars” are to Canadian dollars or “M$” are to a thousand Canadian dollars or “MM$” are to a million Canadian dollars.
The information set out in this REPORT is stated as at December 31, 2012 unless otherwise indicated. Capitalized terms used but not defined in the text are defined in the Glossary.
3
Table of Contents
EQUAL ENERGY LTD
FORM 10-K
4
Table of Contents
Items 1 and 2. Business and Properties
General
Equal Energy Ltd. is an exploration and production oil and gas company which has its head office in Calgary, Alberta, which the Company plans to move to Oklahoma City, Oklahoma during 2013. Equal’s oil and gas properties are located in Oklahoma.
Equal Energy is the successor to the Trust following the completion of the reorganization of the Trust from an income trust structure to a corporate structure by way of court approved plan of arrangement under the ABCA on May 31, 2010 (the Arrangement”). The Arrangement involved the exchange, on a three-for-one basis (the “Consolidation”), of all outstanding Trust Units for Common Shares.
Equal Energy was incorporated on April 8, 2010 under the ABCA and did not carry on any active business prior to the Arrangement, other than executing the arrangement agreement pursuant to which the Arrangement was implemented. On January 1, 2011, Equal Energy amalgamated with its wholly-owned subsidiary, Equal Energy Corp. (the successor of EEC). During 2013, the Company plans to move its head office to 4801 Gaillardia Parkway, Suite 325, Oklahoma City, OK 73142. The Company’s head office and registered office is located at 4300 Bankers Hall West, 888 – 3rd Street S.W., Calgary, Alberta, Canada T2P 5C5.
EEUSHI is an indirect, wholly-owned subsidiary of Equal Energy. EEUSHI holds all of Equal’s Oklahoma oil and gas properties and associated assets through its wholly owned subsidiary, Equal Energy US Inc., corporation incorporated under the laws of the state of Oklahoma. Equal Energy also has a U.S. office located at 4801 Gaillardia Parkway, Suite 325 Oklahoma City, Oklahoma.
On December 12, 2012 Equal Energy Ltd. was amalgamated with Equal Energy Partner Corp. and Equal Energy Production Partnership.
Equal Energy is engaged in the exploration for, and acquisition development and production of, petroleum and natural gas with operations in Oklahoma. The Company also reviews new drilling opportunities and potential acquisitions in Oklahoma to supplement its exploration and development activities. Production during 2012 averaged 7,186 boe/d and was comprised of approximately 53% natural gas 2% crude oil and 45% NGLs. For 2013, production is expected to be approximately 52% natural gas, 2% crude oil and 46% NGLs. At December 31, 2012 The Company had 126 gross (106 net) producing wells virtually all of which it operates and approximately 83,803 gross (54,211 net) total acres under lease or held by production.
Business Strategy
Equal’s strategy is to provide a balance between future growth and return of capital by way of a dividend and is focused on delivering results under the 2013 business plan and to position Equal to take advantage of the anticipated recovery in commodity prices. The Company plans to continue to exploit its proven resource play with near term drilling in the liquids rich Hunton play. 2013 cash from operations are based on the Company’s assumptions for planning purposes and differ from the prices used to estimate the proved reserves and standardized measure as of December 31, 2012.
For 2013, Equal is anticipating production to average 6,400 boe/d net of royalties (7,900 boe/d gross working interest volumes). Cash from operations is estimated at $33 million based on the assumptions of Nymex Natural Gas: USD$3.90/mmbtu (Equal realization 87% of Nymex), Propane at Conway Kansas: USD$0.90/gallon (Equal NGL realization 89% of Conway Propane) and WTI Oil: USD$90.00/bbl (Equal realization 96% of WTI). Capital spending of $36 million ($30 million for drilling and related infrastructure; $6 million for land and maintenance capital). Equal operates all of its drilling and can dictate the pace and targets of its drilling programs. The Company can also adjust quickly to changing circumstances, including any changes in commodity prices if necessary. Equal has an extensive drilling inventory so it can increase capital spending in a higher commodity price environment and has the financial flexibility to do so through the Credit Facility. Primary objectives of the plan are to maintain financial flexibility by ensuring ongoing balance sheet strength and to maintain its recently declared annual dividend of US$0.20 per common share.
5
Table of Contents
2012 DEVELOPMENTS
In the first quarter of 2012, Equal sold non-core assets in Saskatchewan for proceeds of $8.3 million which was used to reduce amounts outstanding on the credit facility.
In the second quarter of 2012, Equal through its 100% owned subsidiary EEUSHI, sold 50% of its interest in approximately 14,500 net undeveloped acres prospective for Mississippian light oil for total cash consideration of approximately US$18 million. Concurrently with the sale, Equal entered into a joint venture with Atlas to embark on drilling program in the Mississippian play. On May 3, 2012 Equal’s Board of Directors initiated a strategic review process to identify, examine and consider alternatives with the view to enhancing shareholder value. Strategic alternatives considered but were not limited to, the sale of all or a portion of the Company’s assets, the outright sale of the corporation, a merger or other business combination, a recapitalization, acquisitions, as well as continued execution of its business plan, or any combination thereof.
In the third quarter of 2012, Equal, through its 100% subsidiary EEUSHI, sold its interest in its Northern Oklahoma assets located in Grant, Garfield and Alfalfa Counties for cash consideration of US$40.0 million. The assets sold included 1,130 barrels of oil equivalent per day from the Hunton formation, related infrastructure and interests in approximately 8,550 acres of Mississippian lands.
In the fourth quarter of 2012, Equal sold the following Canadian assets: Halkirk/Alliance/Wainwright/Clair assets for $15.4 million, Lochend Cardium assets for $62 million and its royalty fee title assets and the residual resource income tax pools for $12.1 million. As a result of these sales, Equal has discontinued operations in Canada.
On November 27, 2012, Equal announced the termination of its Strategic Review process and announced the initiation of a US$0.20 per share annual dividend beginning January 1, 2013 payable quarterly at the end of each calendar quarter.
Oil and Gas Properties
Property Profiles
The following is a description of the Company’s material oil and natural gas properties as at December 31, 2012. Production stated is sales production on a net revenue interest basis to the Company and, unless otherwise stated, is the average daily production for December 2012. Reserve amounts are total proved reserves based on constant prices and costs as at December 31, 2012. Unless otherwise specified, gross and net acres and well count information are as at December 31, 2012.
Overview
In December 2012 the Company’s production comes from its Oklahoma based operations. The U.S. core area assets are located mainly in Lincoln and Logan Counties of Oklahoma. The Corporation also has an inventory of minor producing assets, minor royalty interests and various exploration and exploitation prospects on undeveloped lands in Oklahoma.
6
Table of Contents
Oklahoma
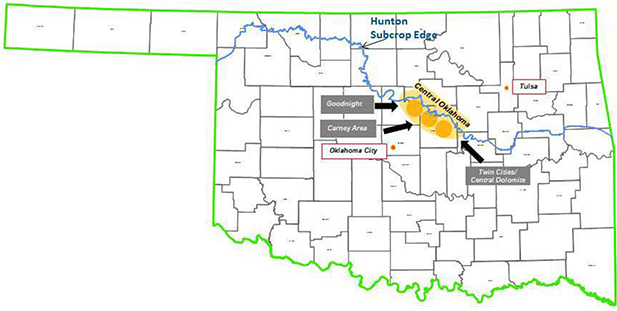
Hunton
In Oklahoma the key producing horizon is the Hunton formation. The Hunton is a carbonate rock formation which has been largely ignored by the industry in areas with high water/hydrocarbon production ratios. Over the last decade, new drilling and production techniques have enabled profitable development of the Hunton formation. Extensive dewatering lowers reservoir pressure allowing the liberation and mobilization of oil, natural gas and NGLs from smaller rock pores. Typical peak hydrocarbon production rates average 120 boe/d per horizontal well and are generally observed within six months of production commencement.
Average Hunton production for December 2012 was 19.0 MMcf/d of natural gas, 3,207 bbl/d of NGLs and 169 bbl/d of oil from a total of 126 producing wells. The Haas Report has attributed total proved reserves of 268 Mbbl of crude oil, and 63.4 Bcf of natural gas and 8,893 Mbbl of NGLs to the Company.
In Oklahoma, there are approximately 9,800 net undeveloped acres of land, at year end 2012. This acreage is centered in Lincoln and Logan Counties.
Proved Reserves
Preparation of Reserve Estimates
The estimates of oil and natural gas reserves in this report are based on reserve reports, all of which were prepared by Haas independent petroleum engineers. To achieve reasonable certainty, the Company’s engineers relied on technologies that have been demonstrated to yield results with consistency and repeatability. The technologies and economic data used to estimate the Company’s proved reserves include, but are not limited to, well logs, geological maps, seismic data, well test data, production data, historical price and cost information and property ownership interests. This data was reviewed by various levels of management for accuracy, before consultation with independent petroleum engineers. Such consultation included review of properties, assumptions and any new data available. Internal reserves estimates and methodologies were compared to those prepared by independent petroleum engineers to test the reserves estimates and conclusions before the reserves estimates were included in this report. The accuracy of the reserve estimates is dependent on many factors, including the following:
| • | the quality and quantity of available data and the engineering and geological interpretation of that data; |
7
Table of Contents
| • | estimates regarding the amount and timing of future costs, which could vary considerably from actual costs; |
| • | the accuracy of mandated economic assumptions such as the future price of oil and natural gas; and |
| • | the judgment of the personnel preparing the estimates. |
All evaluations and reviews of future net cash flow are stated prior to any provision for interest costs or general and administrative costs and after the deduction of estimated future capital expenditures for wells to which reserves have been assigned. It should not be assumed that the estimated future net cash flow shown below is representative of the fair market value of the Company’s properties. There is no assurance that such price and cost assumptions will be attained, and variances could be material. The recovery and reserve estimates of crude oil, NGL and natural gas reserves provided herein are estimates only and there is no guarantee that the estimated reserves will be recovered. Actual crude oil, NGL and natural gas reserves may be greater than or less than the estimates provided herein.
Equal’s Senior Vice President of Engineering was the technical person primarily responsible for overseeing the preparation of the Company’s reserve estimates. He has a Bachelor of Science degree in Mechanical Engineering with over 20 years of practical engineering experience.
The qualifications of the technical personnel at Haas primarily responsible for overseeing Haas’ preparation of the Company’s reserves estimates are set forth below. The qualifications meet or exceed the Society of Petroleum Engineers’ standard requirements to be a professionally qualified Reserve Estimator and Auditor.
| • | practical experience in petroleum engineering with more than 35 years and experience estimating and evaluating reserve information for more than 30 years. |
| • | Licensed Professional Engineers in the State of Texas; and |
| • | Bachelor of Science Degree in Petroleum Engineering. |
In addition to conducting these internal and external reviews, we also have a Reserves Committee that consists of three independent members of our Board of Directors. This committee provides additional oversight of our reserves estimation and certification process. The Reserves Committee assists the Board of Directors with its duties and responsibilities in evaluating and reporting our proved reserves, much like our Audit Committee assists the Board of Directors in supervising our audit and financial reporting requirements. Besides being independent, the members of our Reserves Committee also have educational backgrounds in geology or petroleum engineering, as well as experience relevant to the reserves estimation process.
Technologies
Under SEC rules, proved reserves are those quantities of oil and natural gas, which, by analysis of geoscience and engineering data, can be estimated with reasonable certainty to be economically producible, based on prices used to estimate reserves, from a given date forward from known reservoirs, and under existing economic conditions, operating methods, and government regulations prior to the time at which contracts providing the right to operate expire, unless evidence indicates that renewal is reasonably certain. The term “reasonable certainty” implies a high degree of confidence that the quantities of oil and/or natural gas actually recovered will equal or exceed the estimate. Reasonable certainty can be established using techniques that have been proved effective by actual production from projects in the same reservoir or an analogous reservoir or by other evidence using reliable technology that establishes reasonable certainty. Reliable technology is a grouping of one or more technologies (including computational methods) that have been field tested and have been demonstrated to provide reasonably certain results with consistency and repeatability in the formation being evaluated or in an analogous formation.
8
Table of Contents
The area of a reservoir considered proved includes (i) the area identified by drilling and limited by fluid contacts, if any, and (ii) adjacent undrilled portions of the reservoir that can, with reasonable certainty, be judged to be continuous with it and to contain economically producible oil or natural gas on the basis of available geoscience and engineering data. In the absence of data on fluid contacts, proved quantities in a reservoir are limited by the lowest known hydrocarbons as seen in a well penetration unless geoscience, engineering or performance data and reliable technology establish a lower contact with reasonable certainty.
Where direct observation from well penetrations has defined a highest known oil elevation and the potential exists for an associated gas cap, proved oil reserves may be assigned in the structurally higher portions of the reservoir only if geoscience, engineering or performance data and reliable technology establish the higher contact with reasonable certainty.
Existing economic conditions include prices and costs at which economic producibility from a reservoir is to be determined. In determining the amount of proved reserves, the price used must be the average price during the 12-month period prior to the ending date of the period covered by the reserve report, determined as an unweighted arithmetic average of the first-day-of-the-month price for each month within such period, unless prices are defined by contractual arrangements, excluding escalations based upon future conditions.
The estimates of proved developed reserves included in the reserve report were prepared using decline curve analysis to determine the reserves of individual producing wells. After estimating the reserves of each proved developed well, it was determined that a reasonable level of certainty exists with respect to the reserves that can be expected from close offset undeveloped wells in the field.
Reserve Quantities, PV-10 and Standardized Measure
The following estimates of proved oil, natural gas and NGL reserves are based on reserve reports as of December 31, 2012, 2011 and 2010, substantially all of which were prepared by independent petroleum engineers. The PV-10 values shown in the table below are not intended to represent the current market value of the Company’s estimated oil and natural gas reserves as of the dates shown. The reserve reports were based on the Company’s drilling schedule and the unweighted arithmetic average price during the 12-month period ended December 31, 2012, 2011 and 2010, using first-day-of-the-month prices for each month. The Company estimates that approximately 80% of its current proved undeveloped reserves will be developed by the end of 2014 and all of its current proved undeveloped reserves will be developed by the end of 2016. See “Critical Accounting Policies and Estimates” in Item 7 of this report for further discussion of uncertainties inherent to the reserves estimates. All historical Canadian reserves information has been excluded from the following reserve information because all Canadian assets were sold during 2012 and the results of the Canadian operations have been recorded as discontinued operations in the Company’s GAAP financial statements.
| December 31 | ||||||||||||
| 2012 | 2011 | 2010 | ||||||||||
| Estimated Proved Reserves(1) |
||||||||||||
| Developed |
||||||||||||
| Oil (MMbbls) |
0.3 | 0.4 | 0.5 | |||||||||
| NGL (MMbbls) |
7.4 | 7.8 | 4.5 | |||||||||
| Natural gas (Bcf) |
52.3 | 59.6 | 31.1 | |||||||||
| Total proved developed (MMboe) |
16.4 | 18.2 | 10.2 | |||||||||
| Undeveloped |
||||||||||||
| Oil (MMbbls) |
— | — | — | |||||||||
| NGL (MMbbls) |
1.5 | 2.8 | 2.4 | |||||||||
| Natural gas (Bcf) |
11.1 | 22.0 | 19.2 | |||||||||
| Total proved undeveloped (MMboe) |
3.3 | 6.5 | 5.6 | |||||||||
9
Table of Contents
| Total Proved |
||||||||||||
| Oil (MMbbls) |
0.3 | 0.4 | 0.5 | |||||||||
| NGL (MMbbls) |
8.9 | 10.6 | 6.9 | |||||||||
| Natural gas (Bcf) |
63.4 | 81.6 | 50.3 | |||||||||
| Total proved (MMboe) |
19.7 | 24.6 | 15.8 | |||||||||
| PV-10 (in millions)(2) |
$ | 153.6 | $ | 316.6 | $ | 197.1 | ||||||
| Standardized Measure of Discounted Net Cash Flows (in millions)(3) |
$ | 153.6 | $ | 305.2 | $ | 197.1 |
| (1) | The Company’s estimated proved reserves and the future net revenues, PV-10 and Standardized Measure were determined using the 12-month average price for oil and natural gas, based on the unweighted arithmetic average of the first-day-of-the month price for each month. The prices realized by the Company differ from index prices; the Company receives daily average index prices, net of adjustments for transportation and regional price differentials. The prices used in the Company’s external and internal reserve reports yield weighted average wellhead prices, which are based on the first day of the month index prices for the preceding 12 months, adjusted for transportation and regional price differentials. The index prices and the equivalent weighted average wellhead prices are shown in the table below. |
| Index prices | Unweighted arithmetic average wellhead prices |
|||||||||||||||||||||||
| Oil per Bbl) |
Natural gas per mcf) |
NGL realization as a % of Oil |
Oil (per Bbl) |
Natural gas (per mcf) |
Natural (% of oil) |
|||||||||||||||||||
| December 31, 2012 |
$ | 94.71 | $ | 2.86 | 37 | % | $ | 92.63 | $ | 2.22 | 34 | % | ||||||||||||
| December 31, 2011 |
$ | 96.19 | $ | 4.33 | 53 | % | $ | 89.22 | $ | 3.46 | 53 | % | ||||||||||||
| December 31, 2010 |
$ | 79.43 | $ | 4.54 | 51 | % | $ | 78.72 | $ | 3.93 | 53 | % | ||||||||||||
| (2) | PV-10 is a non-GAAP financial measure and represents the present value of estimated future cash inflows from proved oil and natural gas reserves, less future development and production costs, discounted at 10% per annum to reflect timing of future cash flows and using 12-month unweighted arithmetic average of the first-day-of-the month prices for the years ended December 31, 2012, 2011 and 2010. PV-10 differs from Standardized Measure because it does not include the effects of income taxes on future net revenues. Neither PV-10 nor Standardized Measure represents an estimate of fair market value of the Company’s oil and natural gas properties. PV-10 is used by the industry and by the Company’s management as an arbitrary reserve asset value measure to compare against past reserve bases and the reserve bases of other business entities that is not dependent on the taxpaying status of the entity. The following table provides a reconciliation of the Company’s Standardized Measure to PV-10: |
| December 31, | ||||||||||||
| 2012 | 2011 | 2010 | ||||||||||
| (In millions) | ||||||||||||
| Standardized Measure of Discounted Net Cash Flows |
$ | 153.6 | $ | 307.9 | $ | 197.1 | ||||||
| Present value of future income tax discounted at 10% |
0.0 | 2.7 | 0.0 | |||||||||
| PV-10 |
$ | 153.6 | $ | 305.2 | $ | 197.1 | ||||||
| 3) | Standardized Measure represents the present value of estimated future cash inflows from proved oil and natural gas reserves, less future development and production costs, and income tax expenses, discounted at 10% per annum to reflect timing of future cash flows and using the same pricing assumptions used to calculate PV-10. Standardized Measure differs from PV-10 as Standardized Measure includes the effect of future income taxes. |
10
Table of Contents
Undeveloped Reserves
In general, undeveloped reserves are reserves scheduled to be developed within the next three years.
Proved undeveloped reserves have been assigned to the Corporation’s properties.
Proved undeveloped reserves of 3,335 Mboe (56% natural gas) have been assigned in the December 31, 2012 Haas Report, representing 16.9% of the Oklahoma proved reserves on a boe basis. These proved undeveloped reserves represent 22 gross (7.8 net) well locations. All of the locations are in Lincoln County.
The Oklahoma assets provide a large inventory of undeveloped opportunity. As the current undeveloped location inventory is developed, it is anticipated that additional undeveloped locations will be recognized by Haas and added to the undeveloped inventory.
Proved Undeveloped Reserves. The following table summarizes activity associated with proved undeveloped reserves during the periods presented:
| Year Ended December 31, | ||||||||||||
| 2012 | 2011 | 2010 | ||||||||||
| Reserves converted from proved undeveloped to proved developed (MMboe) |
1.1 | 1.7 | 0.1 | |||||||||
| Drilling capital expended to convert proved undeveloped reserves to proved developed reserves (in millions) |
$ | 7.8 | $ | 13.1 | $ | 1.6 | ||||||
Production and Price History
The following tables set forth information regarding the Company’s net natural gas, NGL and oil production and certain price and cost information for each of the periods indicated.
| Year Ended December 31, | ||||||||||||
| 2012 | 2011 | 2010 | ||||||||||
| Production Data |
||||||||||||
| Oil (Mbbls) |
63 | 77 | 82 | |||||||||
| Natural gas (MMcf) |
8,272 | 6,373 | 4,363 | |||||||||
| Natural gas liquids (Mbbls) |
1,182 | 877 | 662 | |||||||||
|
|
|
|
|
|
|
|||||||
| Total volumes (Mboe) |
2,624 | 2,016 | 1,471 | |||||||||
|
|
|
|
|
|
|
|||||||
| Average daily total volumes (boe/d) |
7,186 | 5,523 | 4,030 | |||||||||
|
|
|
|
|
|
|
|||||||
| Average Prices(1) |
||||||||||||
| Oil (per bbl) |
$ | 92.63 | $ | 89.22 | $ | 78.72 | ||||||
| Natural gas (per mcf) |
$ | 2.22 | $ | 3.46 | $ | 3.93 | ||||||
| Natural gas liquids (per bbl) |
$ | 31.41 | 47.46 | 41.73 | ||||||||
|
|
|
|
|
|
|
|||||||
| Total (per boe) |
$ | 23.37 | $ | 34.98 | $ | 34.81 | ||||||
|
|
|
|
|
|
|
|||||||
| (1) | Prices represent actual average prices for the periods presented and do not include effects of derivative transactions. |
11
Table of Contents
Expenses
| Year Ended December 31, | ||||||||||||
| 2012 | 2011 | 2010 | ||||||||||
| Expenses per boe |
||||||||||||
| Lease operating expenses |
||||||||||||
| Production and transportation |
$ | 7.78 | $ | 8.39 | $ | 7.11 | ||||||
| Production taxes(1) |
$ | 1.43 | $ | 1.64 | $ | 1.79 | ||||||
|
|
|
|
|
|
|
|||||||
| Total operating expenses and ad valorem taxes |
$ | 9.21 | $ | 10.03 | $ | 8.90 | ||||||
|
|
|
|
|
|
|
|||||||
| (1) | Net of severance tax refunds. |
Productive Wells
The following table sets forth the number of producing wells in which the Company owned a working interest at December 31, 2012. Gross wells are the total number of producing wells in which the Company has a working interest and net wells are the sum of the Company’s fractional working interests owned in gross wells. A single, non-producing well was owned in Canada as at December 31, 2012.
| Oil | Natural Gas | Total | ||||||||||||||||||||||
| Gross | Net | Gross | Net | Gross | Net | |||||||||||||||||||
| Oklahoma |
2 | 0.8 | 124 | 105.2 | 126 | 106.0 | ||||||||||||||||||
Developed and Undeveloped Acreage
The following table sets forth information regarding the Company’s developed and undeveloped acreage at December 31, 2012:
| Developed Acreage | Undeveloped Acreage | |||||||||||||||
| Gross | Net | Gross | Net | |||||||||||||
| Oklahoma |
54,432 | 44,413 | 29,371 | 9,798 | ||||||||||||
Many of the leases comprising the undeveloped acreage set forth in the table above will expire at the end of their respective primary terms unless production from the leasehold acreage is established prior to such date, in which event the lease will remain in effect until production has ceased. The following table sets forth as of December 31, 2012 the expiration periods of the gross and net acres that are subject to leases in the undeveloped acreage summarized in the above table.
| Acres Expiring | ||||||||
| Gross | Net | |||||||
| Twelve Months Ending |
||||||||
| December 31, 2013 |
13,044 | 5,239 | ||||||
| December 31, 2014 |
9,921 | 2,496 | ||||||
| December 31, 2015 |
6,086 | 1,844 | ||||||
| December 31, 2016 and later |
320 | 219 | ||||||
| Total |
29,371 | 9,798 | ||||||
12
Table of Contents
Drilling Activity
The following table sets forth information with respect to wells the Company completed during the periods indicated. Drilling success represents the percentage of developed wells determined to be productive. The information presented is not necessarily indicative of future performance, and should not be interpreted to present any correlation between the number of productive wells drilled and quantities or economic value of reserves found. Productive wells are those that produce commercial quantities of hydrocarbons, regardless of whether they produce a reasonable rate of return. Gross wells refer to the total number of wells in which the Company had a working interest and net wells are the sum of the Company’s fractional working interests owned in gross wells. The Company did not drill any wells it classified as exploratory during this period.
| 2012 | 2011 | 2010 | ||||||||||||||||||||||||||||||||||||||||||||||
| Gross | Drilling Success % |
Net | Drilling Success % |
Gross | Drilling Success % |
Net | Drilling Success % |
Gross | Drilling Success % |
Net | Drilling Success % |
|||||||||||||||||||||||||||||||||||||
| Completed Wells |
||||||||||||||||||||||||||||||||||||||||||||||||
| Development |
||||||||||||||||||||||||||||||||||||||||||||||||
| Productive |
9.0 | 100 | % | 7.2 | 100 | % | 13.0 | 100 | % | 11.3 | 100 | % | 3.0 | 100 | % | 1.6 | 100 | % | ||||||||||||||||||||||||||||||
| Dry |
— | — | — | — | — | — | — | — | — | — | — | — | ||||||||||||||||||||||||||||||||||||
|
|
|
|
|
|
|
|
|
|
|
|
|
|
|
|
|
|
|
|
|
|
|
|
|
|||||||||||||||||||||||||
| Total |
9.0 | 100 | % | 7.2 | 100 | % | 13.0 | 100 | % | 11.3 | 100 | % | 3.0 | 100 | % | 1.6 | 100 | % | ||||||||||||||||||||||||||||||
|
|
|
|
|
|
|
|
|
|
|
|
|
|
|
|
|
|
|
|
|
|
|
|
|
|||||||||||||||||||||||||
Title to Properties
Title to properties is subject to contractual arrangements customary in the oil and gas industry, liens for taxes not yet due and, in some instances, other encumbrances. We believe that such burdens do not materially detract from the value of properties or from the respective interests therein or materially interfere with their use in the operation of the business. As is customary in the industry, other than a preliminary review of local records, little investigation of record title is made at the time of acquisitions of undeveloped properties. Investigations, which generally include a title opinion of outside counsel, are made prior to the consummation of an acquisition of producing properties and before commencement of drilling operations on undeveloped properties.
Oil, Gas and NGL Marketing
The spot markets for oil, gas and NGLs are subject to volatility as supply and demand factors fluctuate. The Company sells our production under both long-term (one year or more) and short-term (less than one year) agreements at prices negotiated with third parties. Regardless of the term of the contract, the production is all sold at variable, or market-sensitive, prices.
Additionally, we may periodically enter into financial hedging arrangements or fixed-price contracts associated with a portion of our oil, gas and NGL production. These activities are intended to support targeted price levels and to manage our exposure to price fluctuations. See Note 10 to the financial statements included in “Item 8. Financial Statements and Supplementary Data” of this report for further information.
Marketing and Customers
Our production of oil and natural gas is sold to a limited number of customers and the inability to accept our production due to capacity constraints, or a credit default of one of these customers, could have a temporary adverse effect on us. Our revenues are generated under contracts with a limited number of customers. All of the natural gas from our properties is sold to Copano Energy, LLC (formerly Scissortail Energy, LLC) and DCP Midstream, LP. The oil from our properties is sold to ConocoPhillips. Our results of operations would be adversely affected as a result of non-performance by any of our customers. A non-payment default by one of these large customers could have an adverse effect on us, temporarily reducing our cash flow.
Equal does not have any commitments to deliver fixed and determinable quantities of natural gas, NGLs or oil in the future under existing contracts or sales agreements.
13
Table of Contents
COMPETITION
The Company believes that its leasehold acreage position, concentration of operations, extensive water handling infrastructure and technical and operational capabilities enable it to compete effectively with other exploration and production operations. However, the oil and natural gas industry is intensely competitive, and the Company faces competition from other industry participants.
The Company competes with major oil and natural gas companies and independent oil and natural gas companies for leases, equipment, personnel and markets for the sale of oil and natural gas. Many of these competitors may be financially stronger or weaker than the Company, but generally all competitors can affect the market because of their need to develop and sell oil and natural gas to maintain cash flow. Certain companies may be able to pay more for producing properties and undeveloped acreage. In addition, these companies may have a greater ability to continue exploration activities during periods of low oil and natural gas prices. The Company’s larger or fully integrated competitors may be able to absorb the burden of existing and any future federal, state and local laws and regulations more easily than the Company can, which would adversely affect its competitive position. The Company’s ability to acquire additional properties and to discover reserves in the future depends on its ability to evaluate and select suitable properties and to consummate transactions in a highly competitive environment. In addition, because the Company has fewer financial and human resources than many companies in its industry, the Company may be at a disadvantage in bidding for exploratory prospects and producing oil and natural gas properties.
SEASONAL NATURE OF BUSINESS
Generally, demand for natural gas and NGL decreases during the summer months and increases during the winter months. Certain natural gas and NGL users utilize natural gas storage facilities and purchase some of their anticipated winter requirements during the summer, which can lessen seasonal demand fluctuations. Seasonal weather conditions and lease stipulations can limit the Company’s drilling and producing activities and other oil and natural gas operations in a portion of its operating areas. For example winter storms and equipment freeze-ups can cause disruption and delays to both drilling activities and ongoing production performance. These seasonal anomalies can pose challenges for meeting the Company’s well drilling objectives, can delay the installation of production facilities, and can increase competition for equipment, supplies and personnel during certain times of the year, which could lead to shortages and increase costs or delay the Company’s operations.
ENVIRONMENTAL REGULATIONS
General
The exploration, development and production of oil and natural gas are subject to stringent and comprehensive federal, state, tribal, regional and local laws and regulations governing the discharge of materials into the environment or otherwise relating to environmental protection or to employee health and safety. These laws and regulations may, among other things, require permits to conduct drilling, water withdrawal and waste disposal operations; govern the amounts and types of substances that may be disposed or released into the environment; limit or prohibit construction or drilling activities or require formal mitigation measures in sensitive areas such as wetlands, wilderness areas or areas inhabited by endangered or threatened species; require investigatory and remedial actions to mitigate pollution conditions arising from the Company’s operations or attributable to former operations; impose restrictions designed to protect employees from exposure to hazardous substances; and impose obligations to reclaim and abandon well sites and pits. Failure to comply with these laws and regulations may result in the assessment of sanctions, including monetary penalties, the imposition of remedial obligations and the issuance of orders enjoining operations in affected areas. Pursuant to such laws, regulations and permits, the Company may be subject to operational restrictions and has made, and expects to continue to make, capital and other compliance expenditures.
Increasingly, restrictions and limitations are being placed on activities that may affect the environment. Any changes in environmental laws and regulations or re-interpretation of enforcement policies that result in more stringent and costly construction, drilling, water management, completion, waste handling, storage, transport, disposal, or remediation requirements or emission or discharge limits could have a material adverse effect on the Company. Moreover, accidental releases or spills may occur in the course of the Company’s operations, and there can be no assurance that the Company will not incur significant costs and liabilities as a result of such releases or spills, including any third-party claims for damage to property and natural resources or personal injury.
14
Table of Contents
The following is a summary of the more significant existing environmental and employee, health and safety laws and regulations applicable to the oil and natural gas industry and for which compliance may have a material adverse impact on the Company.
Hazardous Substances and Wastes
The Company currently owns, leases, or operates, and in the past has owned, leased, or operated, properties that have been used to explore for and produce oil and natural gas. The Company believes it has utilized operating and disposal practices that were standard in the industry at the applicable time, but hydrocarbons and wastes may have been disposed or released on or under the properties owned, leased, or operated by the Company or on or under other locations where these hydrocarbons and wastes have been taken for treatment or disposal. These properties and wastes disposed thereon may be subject to the Comprehensive Environmental Response, Compensation, and Liability Act, as amended (“CERCLA”), the Resource Conservation and Recovery Act, as amended (“RCRA”) and analogous state laws. Under these laws, the Company could be required to remove or remediate previously disposed wastes, to investigate and clean up contaminated property and to perform remedial operations to prevent future contamination or to pay some or all of the costs of any such action.
CERCLA, also known as the Superfund law, and comparable state laws impose joint and several liability without regard to fault or legality of conduct on certain classes of persons who are considered to be responsible for the release of a “hazardous substance” into the environment. These persons include current and prior owners or operators of the site where the release occurred and entities that disposed or arranged for the disposal of the hazardous substances at the site. Under CERCLA, these “responsible persons” may be subject to strict, joint and several liability for the costs of cleaning up the hazardous substances that have been released into the environment, for damages to natural resources and for the costs of certain environmental and health studies. In addition, it is not uncommon for neighboring landowners and other third parties to file claims for personal injury, natural resource damage, and property damage allegedly caused by the release of hazardous substances into the environment. CERCLA also authorizes the Environmental Protection Agency (“EPA”) and, in some instances, third parties to act in response to threats to the public health or the environment and to seek recovery from the responsible classes of persons the costs the third parties incur. The Company uses and generates materials in the course of its operations that may be regulated as hazardous substances. To date, no Company-owned or operated site has been designated as a Superfund site, and the Company has not been identified as a responsible party for any Superfund site.
The Company also generates wastes that are subject to the requirements of RCRA and comparable state statutes. RCRA imposes strict requirements on the generation, transportation, treatment, storage, disposal and cleanup of hazardous and non-hazardous wastes. Drilling fluids, produced waters and other wastes associated with the exploration, production and/or development of crude oil and natural gas are currently exempt from regulation as hazardous wastes under RCRA. However, it is possible that certain oil and natural gas exploration and production wastes now classified as non-hazardous could be classified as hazardous wastes in the future. In September 2010, the Natural Resources Defense Council filed a petition for rulemaking with the EPA requesting reconsideration of the RCRA exemption for exploration, production, and development wastes. To date, the EPA has not taken any formal action on the petition. Any change in the RCRA exemption for such wastes could result in an increase in costs to manage and dispose of wastes. In the course of the Company’s operations, it generates petroleum hydrocarbon wastes and ordinary industrial wastes that are subject to regulation under the RCRA. The Company believes it is in substantial compliance with all regulations regarding the handling and disposal of oil and natural gas wastes from its operations.
Air Emissions
The Clean Air Act, as amended, the Outer Continental Shelf Lands Act (the “OCSLA”) and comparable state laws and regulations restrict the emission of air pollutants from many sources and also impose various permitting, monitoring and reporting requirements. These laws and regulations may require the Company to obtain pre-approval for the construction or modification of certain projects or facilities expected to produce or significantly increase air emissions, obtain and strictly comply with air permit requirements or utilize specific equipment or technologies to control emissions. Obtaining permits has the potential to delay the development of oil and natural gas projects. The
15
Table of Contents
Company may be required to incur certain capital expenditures for air pollution control equipment or other air emissions-related issues as a result of such requirements. Additionally, violations of lease conditions or regulations related to air emissions can result in civil and criminal penalties, as well as potential court injunctions curtailing operations and canceling leases. Such enforcement liabilities can result from either governmental or citizen prosecution.
In August 2012, the EPA issued final regulations that established new air emission controls for oil and natural gas production and natural gas processing, including, among other things, new source performance standards for volatile organic compounds that would apply to newly hydraulically fractured wells, existing wells that are re-fractured, compressors, pneumatic controllers, storage vessels and natural gas processing plants placed in service after August 2011. However, on January 16, 2013, the EPA made an unopposed motion in federal court to seek an abeyance of legal challenges to the regulations while it reconsiders and potentially revises portions of the new rules. The EPA has also implemented an engine emission testing program to ensure certain categories of engines, depending on the date manufactured, meet the EPA emission standards. The federal standard for engines manufactured before 2006 also requires emission testing on engines greater than 500 horsepower and strict engine maintenance plans to be in place by October 2013. The Company currently has such maintenance plans in place.
Water Discharges
The Federal Water Pollution Act, as amended (the “Clean Water Act”), and analogous state laws impose restrictions and strict controls regarding the discharge of pollutants into navigable waters. Pursuant to these laws and accompanying regulations, permits must be obtained to discharge produced waters and sand, drilling fluids, drill cuttings and other substances related to the oil and natural gas industry into onshore, coastal and offshore waters of the United States or state waters. Any such discharge of pollutants into regulated waters must be performed in accordance with the terms of the permit issued by the EPA or the analogous state agency. The Clean Water Act and other laws, such as the OCSLA, require the Company to develop and implement spill response plans intended to prepare the owner of the facility to respond to a hazardous substance or oil discharge. In addition, spill prevention, control and countermeasure requirements under federal law require appropriate containment berms and similar structures to help prevent the contamination of navigable waters or adjoining shorelines in the event of a spill, rupture or leak from an onshore, or offshore, facility. The Clean Water Act and analogous state laws also require individual permits or coverage under general permits for discharges of storm water runoff from certain types of facilities.
The Clean Water Act further imposes certain duties and liabilities on “responsible parties” related to the prevention of oil spills and damages resulting from such spills in, or threatening, U.S. waters. A liable responsible party includes the owner or operator of a facility, vessel, or pipeline that is a source, or a potential threat, of an oil discharge. The Clean Water Act assigns joint and several strict liability, without regard to fault, to each liable party for all containment and oil removal costs and a variety of public and private damages including, but not limited to, the costs of responding to a release of oil, natural resource damages, and economic damages suffered by persons adversely affected by an oil spill. Although defenses exist to the liability imposed by the Clean Water Act, they are limited. If an oil discharge or substantial threat of discharge were to occur, the Company may be liable for costs and damages, which costs and damages could be material to its results of operations and financial position.
Climate Change
In December 2009, the EPA published its findings that emissions of CO2, methane and certain other greenhouse gases (“GHGs”) present an endangerment to public health and the environment because emissions of such gases are, according to the EPA, contributing to warming of the Earth’s atmosphere and other climatic changes. These findings allow the EPA to adopt and implement regulations that restrict emissions of GHGs under existing provisions of the Clean Air Act. Accordingly, the EPA has adopted rules that require a reduction in emissions of GHGs from motor vehicles and also trigger Clean Air Act construction and operating permit review for GHG emissions from certain stationary sources. EPA’s endangerment finding and GHG rules were upheld by the United States Court of Appeals for the D.C. Circuit in a June 2012 decision, and a petition for review of the case by the entire D.C. Circuit was denied in December 2012.
The EPA has also adopted rules requiring the reporting of GHG emissions from onshore and offshore oil and natural gas production and processing facilities in the United States on an annual basis. The Company believes it has complied with all applicable reporting requirements to date. However, the adoption and implementation of any
16
Table of Contents
regulations imposing reporting obligations on, or limiting emissions of GHG gases from, the Company’s equipment and operations could require it to incur additional costs to reduce emissions of GHGs associated with its operations or could adversely affect demand for the oil and natural gas it produces. Finally, to the extent increasing concentrations of GHGs in the Earth’s atmosphere may produce climate changes that have significant physical effects, such as increased frequency and severity of storms, droughts, floods and other climatic events. Such events could have a material adverse effect on the Company and potentially subject the Company to further regulation.
In addition, Congress has considered legislation to reduce emissions of GHGs and more than one-half of the states have begun taking actions to control and/or reduce emissions of GHGs, primarily through the adoption of a climate change action plan, completion of GHG emission inventories and/or regional GHG cap and trade programs. Any future federal laws or implemented regulations that may be adopted to address GHG emissions could require the Company to incur increased operating costs, adversely affect demand for the oil and natural gas that the Company produces and have a material adverse effect on the Company’s business, financial condition and results of operations.
Endangered Species
The federal Endangered Species Act (the “ESA”) restricts activities that may affect endangered or threatened species or their habitats. The Company believes its operations are in substantial compliance with the ESA. If endangered species are located in areas of the underlying properties where the Company wishes to conduct development activities or abandonment operations, the work could be prohibited or delayed or expensive mitigation may be required. Moreover, as a result of a settlement approved by the U.S. District Court for the District of Columbia on September 9, 2011, the U.S. Fish and Wildlife Service is required to consider listing more than 250 species as endangered under the ESA. Under the September 9, 2011 settlement, the federal agency is required to make a determination on listing of the species as endangered or threatened over the six-year period ending with the agency’s 2017 fiscal year. The designation of previously unprotected species as threatened or endangered in areas where underlying property operations are conducted could cause the Company to incur increased costs arising from species protection measures or could result in limitations on its exploration and production activities that could have an adverse impact on its ability to develop and produce reserves.
Employee Health and Safety
The Company’s operations are subject to a number of federal and state laws and regulations, including the federal Occupational Safety and Health Act, as amended (“OSHA”), and comparable state statutes, whose purpose is to protect the health and safety of workers. In addition, the OSHA Hazardous Communication Standard requires that information be maintained concerning hazardous materials used or produced in the Company’s operations and that this information be provided to employees. Pursuant to the Emergency Planning and Community Right-to-Know Act, also known as Title III of the federal Superfund Amendment and Reauthorization Act, businesses that store threshold amounts of chemicals that are subject to OSHA’s Hazardous Communication Standard must submit information to state and local authorities in order to facilitate emergency planning and response. That information is generally available to the public. The Company believes that it is in substantial compliance with all applicable laws and regulations relating to worker health and safety.
State Regulation
The state in which the Company operates, along with some municipalities and Native American tribal areas, regulate some or all of the following activities: the drilling for, and the production and gathering of, oil and natural gas, including requirements relating to drilling permits, the location, spacing and density of wells, unitization and pooling of interests, the method of drilling, casing and equipping of wells, the protection of fresh water sources, the orderly development of common sources of supply of oil and natural gas, the operation of wells, allowable rates of production, the use of fresh water in oil and natural gas operations, saltwater injection and disposal operations, the plugging and abandonment of wells and the restoration of surface properties, the prevention of waste of oil and natural gas resources, the protection of the correlative rights of oil and natural gas owners and, where necessary to avoid unfair, unjust or discriminatory service, the fees, terms and conditions for the gathering of natural gas. These regulations may affect the number and location of the Company’s wells and the amounts of oil and natural gas that may be produced from the Company’s wells, and increase the costs of the Company’s operations.
17
Table of Contents
Equal Energy believes that it is, and intends to continue to be, in material compliance with applicable environmental laws and regulations and is committed to meeting its responsibilities to protect the environment wherever it operates or holds working interests. Equal Energy anticipates that this compliance may result in increased expenditures of both a capital and expense nature as a result of increasingly stringent laws relating to the protection of the environment. Equal Energy believes that it is reasonably likely that the trend in environmental legislation and regulation will continue toward stricter standards. The oil and gas industry is subject to regulations that require that well and facility sites be abandoned and reclaimed to the satisfaction of environmental authorities. As at December 31, 2012, Equal Energy recorded an obligation on its balance sheet of $5.5 million for asset retirement. The Corporation maintains an insurance program consistent with industry practice to protect against losses due to accidental destruction of assets, well blowouts, pollution and other operating accidents or disruptions. The Corporation also has operational and emergency response procedures and safety and environmental programs in place to reduce potential loss exposure. No assurance can be given that the application of environmental laws to the business and operations of Equal Energy will not result in a curtailment of production or a material increase in the costs of production, development or exploration activities or otherwise adversely affect Equal Energy’s financial condition, results of operations or prospects. See “Environmental Risks” and “Industry Conditions” under “Risk Factors”.
Hydraulic Fracturing
All of Equal’s wells budgeted for 2013 will be completed without the use of hydraulic fracturing but the Company may use this completion technique in the future. Hydraulic fracturing, which involves the injection of water, sand and chemicals under pressure into formations to fracture the surrounding rock and stimulate production, is typically regulated by state oil and gas commissions. However, the EPA has asserted federal regulatory authority over certain hydraulic fracturing practices, including the use of diesel, kerosene and similar compounds in the fracturing fluid. In August 2012, the EPA issued final Clean Air Act regulations governing performance standards, including for the capture of air emissions released during hydraulic fracturing. However, in January 2013 the EPA submitted an unopposed motion to the United States Court of Appeals for the D.C. Circuit seeking to stay legal challenges to the Clean Air Act regulations while it reconsiders portions of the new rules. Also, federal legislation previously was introduced, but not enacted, to provide for federal regulation of hydraulic fracturing and to require disclosure of the chemicals used in the fracturing process. In May 2012, the Bureau of Land Management within the U.S. Department of the Interior issued a proposed rule containing disclosure requirements and other mandates for hydraulic fracturing on federal lands, but in January 2013 it announced that it would be submitting a revised rule proposal. That revised proposal is expected to be published in the first quarter of 2013.
If new laws or regulations that significantly restrict hydraulic fracturing are adopted at either the state or federal level, the Company’s fracturing activities, if used in future, could become subject to additional permit requirements, reporting requirements or operational restrictions and also to associated permitting delays and potential increases in costs. These delays or additional costs could adversely affect the determination of whether a well is commercially viable.
In addition to asserting regulatory authority, a number of federal entities are analyzing, or have been requested to review, a variety of environmental issues associated with hydraulic fracturing. In April 2012, President Obama issued an executive order that established a working group for the purpose of coordinating policy, information sharing and planning across federal agencies and offices regarding “unconventional natural gas production,” including hydraulic fracturing. In December 2012, the EPA issued an initial progress report on a study begun in 2011 of the potential environmental effects of hydraulic fracturing on drinking water and groundwater, with a final report expected to be issued in late 2014. The EPA has also announced an intent to propose by 2014 effluent limit guidelines that waste water from shale gas extraction operations must meet before going to a treatment plant; the agency also projects that it will publish an Advance Notice of Proposed Rulemaking regarding the Toxic Substances Control Act reporting of the chemical substances and mixtures used in hydraulic fracturing. Additionally, a committee of the United States House of Representatives has conducted an investigation of hydraulic fracturing practices, and certain members of Congress have called upon the U.S. Government Accountability Office to investigate how hydraulic fracturing might adversely affect water resources; the SEC to investigate the natural gas industry and any possible misleading of investors or the public regarding the economic feasibility of pursuing natural gas deposits in shales by means of hydraulic fracturing; and the U.S. Energy Information Administration to provide a better understanding of that agency’s estimates regarding natural gas reserves, including reserves from shale formations, as well as uncertainties associated with those estimates. The studies and initiatives described above, depending on their degree of pursuit and any meaningful results obtained, could spur efforts to further regulate hydraulic fracturing under the Safe Drinking Water Act or other regulatory mechanisms.
18
Table of Contents
The Company reviews best practices and industry standards and complies with all regulatory requirements in the protection of potable water sources. If hydraulic fracturing is used in future, the Company plans to use, protective practices including, but are not limited to, setting multiple strings of protection pipe across the potable water sources and cementing these pipes from setting depth to surface, continuously monitoring the hydraulic fracturing process in real time and disposing of all non-commercially produced fluids in certified disposal wells at depths below the potable water sources.
OTHER REGULATION OF THE OIL AND NATURAL GAS INDUSTRY
The oil and natural gas industry is extensively regulated by numerous federal, state, local, and regional authorities, as well as Native American tribes. Legislation affecting the oil and natural gas industry is under constant review for amendment or expansion, frequently increasing the regulatory burden. Also, numerous departments and agencies, both federal and state, and Native American tribes are authorized by statute to issue rules and regulations affecting the oil and natural gas industry and its individual members, some of which carry substantial penalties for noncompliance. Although the regulatory burden on the oil and natural gas industry increases the Company’s cost of doing business and, consequently, affects its profitability, these burdens generally do not affect the Company any differently or to any greater or lesser extent than they affect other companies in the industry with similar types, quantities and locations of production.
The availability, terms and cost of transportation significantly affect sales of oil and natural gas. The interstate transportation and sale for resale of oil and natural gas is subject to federal regulation, including regulation of the terms, conditions and rates for interstate transportation, storage and various other matters, primarily by the Federal Energy Regulatory Commission (“FERC”). Federal and state regulations govern the price and terms for access to oil and natural gas pipeline transportation. The FERC’s regulations for interstate oil and natural gas transmission in some circumstances may also affect the intrastate transportation of oil and natural gas.
Sales of oil and natural gas are not currently regulated and are made at market prices. Although oil and natural gas prices are currently unregulated, Congress historically has been active in the area of oil and natural gas regulation. The Company cannot predict whether new legislation to regulate oil and natural gas might be proposed, what proposals, if any, might actually be enacted by Congress or the various state legislatures, and what effect, if any, the proposals might have on the Company’s operations.
Drilling and Production
The Company’s operations are subject to various types of regulation at federal, state, local and Native American tribal levels. These types of regulation include requiring permits for the drilling of wells, drilling bonds and reports concerning operations. Most states, and some counties, municipalities and Native American tribal areas where the Company operates also regulate one or more of the following activities:
| • | the location of wells; |
| • | the method of drilling and casing wells; |
| • | the timing of construction or drilling activities; |
| • | the rates of production, or “allowables” |
| • | the use of surface or subsurface waters; |
19
Table of Contents
| • | the surface use and restoration of properties upon which wells are drilled; |
| • | the plugging and abandoning of wells; and |
| • | the notice to surface owners and other third parties. |
State laws regulate the size and shape of drilling and spacing units or proration units governing the pooling of oil and natural gas properties. Some states allow forced pooling or integration of tracts to facilitate exploration while other states rely on voluntary pooling of lands and leases. In some instances, forced pooling or unitization may be implemented by third parties and may reduce the Company’s interest in the unitized properties. In addition, state conservation laws establish maximum rates of production from oil and natural gas wells, generally prohibit the venting or flaring of natural gas and impose requirements regarding the ratability of production. These laws and regulations may limit the amount of oil and natural gas the Company can produce from its wells or limit the number of wells or the locations at which the Company can drill. Moreover, each state generally imposes a production or severance tax with respect to the production and sale of oil, natural gas, and natural gas liquids within its jurisdiction.
AVAILABLE INFORMATION
We file or furnish annual reports on Form 10-K, quarterly reports on Form 10-Q and current reports on Form 8-K with the U.S. Securities and Exchange Commission (“SEC”). Through our website at http://www.equalenergy.ca, we make available electronic copies of the documents we file or furnish to the SEC. Access to these electronic filings is available free of charge as soon as reasonably practicable after filing or furnishing them to the SEC.
An investment in a company engaged in oil and gas exploration involves a high amount of risk, both unknown and known, present and potential, including the risks enumerated below. An investment in our Common Shares is speculative and subject to a number of known and unknown risks. Only those persons who can bear the risk of the entire loss of their investment should purchase our securities. An investor should carefully consider the risks described below and the other information that we file with the SEC and with Canadian securities regulators before investing in our Common Shares. The risks described below are not the only ones we face, as additional risks that we are not currently aware of or that we currently believe are immaterial may become important factors that affect our business. The risk factors set forth below and elsewhere in this Form 10-K, and the risks discussed in our other filings with the SEC and Canadian securities regulators, may have a significant effect on our business, financial condition and/or results of operations and could cause our actual results to differ materially from those projected in any forward-looking statements. See “Information Regarding Forward-Looking Statements” in the Form 10-K.
Our failure to successfully address the risks and uncertainties described below would have a material adverse effect on our business, financial condition and/or results of operations, and the trading price of our common shares may decline and investors may lose all or part of their investment. We cannot assure you that we will successfully address these risks or other unknown risks that may affect our business.
If we are unable to find, acquire, develop and commercially produce oil and natural gas reserves, our reserves and production will decline, which will adversely affect our business, financial results and stock price and could eventually result in us having to cease operations.
The long-term commercial success of the Company depends on its ability to find, acquire, develop and commercially produce oil and natural gas reserves. Without the continual addition of new reserves, any existing reserves the Company may have at any particular time, and the production therefrom will decline over time as such existing reserves are exploited. A future increase in the Company’s reserves will depend not only on its ability to explore and develop any properties it may have from time to time, but also on its ability to select and acquire suitable producing properties or prospects on satisfactory terms. If we are unable to discover additional commercial quantities
20
Table of Contents
of oil and natural gas. if we are unable to locate satisfactory properties for acquisition or participation, or if we determine that current markets, terms of acquisition or pricing conditions make such acquisitions or participations uneconomic, we will be unable to replace our reserves and our production will decline over time, which would affect our business, financial results and stock price, and could eventually result in our company ceasing operations.
Oil and gas exploration, development and production operations have a high degree of risk, and realization of the associated risks could adversely affect our business or result in increased costs or liability.
Oil and natural gas exploration, development and production operations are subject to all the risks and hazards typically associated with such operations, including hazards such as fire, explosion, blowouts, cratering, sour gas releases and spills, each of which could result in substantial damage to oil and natural gas wells, production facilities, other property and the environment or personal injury. In particular, the Company may explore for and produce sour natural gas in certain areas. An unintentional leak of sour natural gas could result in personal injury, loss of life or damage to property and may necessitate an evacuation of populated areas, all of which could result in liability to the Company. In accordance with industry practice, the Company is not fully insured against all of these risks, nor are all such risks insurable. The nature of these risks is such that liabilities could exceed insurance policy limits, in which event the Company could incur significant costs that could have a material adverse effect upon its financial condition. Oil and natural gas production operations are also subject to all the risks typically associated with such operations, including encountering unexpected formations or pressures, premature decline of reservoirs and the invasion of water into producing formations, the occurrence of any of which could result in significant costs for the Company.
Future oil and natural gas exploration may involve unprofitable efforts, not only from dry wells, but also from wells that are productive but do not produce sufficient petroleum substances to return a profit after drilling, operating and other costs. Completion of a well does not assure a profit on the investment or recovery of drilling, completion and operating costs. In addition, drilling hazards or environmental damage could greatly increase the cost of operations, and various field operating conditions may adversely affect the production from successful wells. These conditions include delays in obtaining governmental approvals or consents, shut-ins of connected wells resulting from extreme weather conditions, insufficient storage or transportation capacity or other geological and mechanical conditions. Production delays and declines from normal field operating conditions cannot be eliminated and can be expected to adversely affect revenue and cash flow levels to varying degrees.
While we currently operate more than 95% of our production, we do not operate all of the assets in which we have an interest and could enter into material non-operator positions in the future, and we therefore cannot ensure that those assets, or potential assets, will be operated in a manner favorable to us.
Other companies operate some of the assets in which the Company has an interest. As a result, Equal Energy has limited ability to exercise influence over the operation of those assets or their associated costs, which could adversely affect the Company’s financial performance. The Company’s return on assets operated by others depends upon a number of factors that may be outside of the Equal Energy’s control, including the timing and amount of capital expenditures, the operator’s expertise and financial resources, the approval of other participants, the selection of technology and risk management practices.
Our ability to successfully execute projects and market oil and natural gas depends upon factors beyond our control, and as a result of these factors we might not be able to execute projects on time, on budget or at all, and we might not be able to effectively market our oil and natural gas.
Equal Energy manages a variety of small and large projects in the conduct of its business. Project delays may delay expected revenues from operations. Significant project cost over-runs could make a project uneconomic. Equal Energy’s ability to execute projects and market oil and natural gas depends upon numerous factors beyond the Company’s control, including:
| • | the availability of processing capacity; |
| • | the availability and proximity of pipeline capacity; |
operational risks associated with pipelines and processing facilities;
21
Table of Contents
| • | the availability of storage capacity; |
| • | the supply of and demand for oil and natural gas; |
| • | the availability of alternative fuel sources; |
| • | the effects of inclement weather; |
| • | the availability of drilling and related equipment; |
| • | unexpected cost increases; |
| • | accidental events; |
| • | currency fluctuations; |
| • | changes in regulations; |
| • | the availability and productivity of skilled labor; and |
| • | the regulation of the oil and natural gas industry by various levels of government and governmental agencies. |
Because of these factors, the Company may not be able to execute projects on time, on budget or at all, and may not be able to effectively market the oil and natural gas that it produces.
Oil, Natural Gas and NGL prices are volatile, and a sustained price drop would have an adverse effect on the carrying value of our proved reserves, and our borrowing capacity, revenues, profitability and cash flows from operations.
Equal Energy’s revenues, profitability and future growth and the carrying value of its oil and gas properties are substantially dependent upon prevailing prices of oil and gas. The Company’s ability to borrow and to obtain additional capital on attractive terms is also substantially dependent upon oil and gas prices. Prices for oil and gas are subject to large fluctuations in response to relatively minor changes in the supply of and demand for oil and gas, market uncertainty and a variety of additional factors beyond the control of the Company. These factors include economic conditions in the United States, Canada, the actions of the OPEC and Russia, governmental regulation, political stability in the Middle East and elsewhere, the foreign supply of oil and gas, the price of foreign imports and the availability of alternative fuel sources.
Volatile oil and gas prices make it difficult to estimate the value of producing properties for acquisition and often cause disruption in the market for oil and gas producing properties, as buyers and sellers have difficulty agreeing on such value. Price volatility also makes it difficult to budget for and project the return on acquisitions and development and exploitation projects.
In addition, bank borrowings available to Equal Energy are in part determined by the Company’s borrowing base. A sustained material decline in prices from historical average prices could reduce the Company’s borrowing base, therefore reducing the bank credit available to the Company which could require that a portion, or all, of the Company’s bank debt be repaid.
Any substantial and extended decline in the price of oil and gas would have an adverse effect on the Company’s carrying value of its proved reserves, borrowing capacity, revenues, profitability and cash flows from operations.
22
Table of Contents
We anticipate making substantial capital expenditures for future acquisition, exploration, development and production projects. We might not be able to obtain capital or financing necessary to support these projects on satisfactory terms, or at all.
Equal Energy anticipates making substantial capital expenditures for the acquisition, exploration, development and production of oil and natural gas reserves in the future. If the Company’s revenues or reserves decline, it may limit Equal Energy’s ability to expend or access the capital necessary to undertake or complete future drilling programs. Debt or equity financing, or cash generated by operations, might not be available to us or might not be sufficient to meet our requirements for capital expenditures or for other corporate purposes. Even if debt or equity financing is available, it might not be available on terms acceptable to the Company. The inability of the Company to access sufficient capital for its operations could have a material adverse effect on the Company’s financial condition, results of operations and prospects. The market events and conditions witnessed over the past three years, including disruptions in the international credit markets and other financial systems and the deterioration of global economic conditions, have caused significant volatility in commodity prices and increases in the rates at which Equal Energy is able to borrow funds for its capital programs. If these conditions are not resolved, Equal Energy may continue to face restricted access to capital and increased borrowing costs, which would have an adverse effect on the Company, as its ability to make future capital expenditures is dependent upon, among other factors, the overall state of the capital markets and investor appetite for investments in the energy industry generally and the Company’s securities in particular.
We will be required to raise capital in order to fund our operations. We may not be able to obtain capital or financing on satisfactory terms, or at all.
Equal Energy’s cash flow from its producing reserves may not be sufficient to fund its ongoing activities at all times. From time to time, the Company may require additional financing in order to carry out its acquisition, exploration and development activities. Failure to obtain such financing on a timely basis could cause the Company to forfeit its interest in certain properties, miss certain acquisition opportunities and reduce or terminate its operations. If the Company’s revenues from its reserves decrease as a result of lower oil and natural gas prices or otherwise, it will affect the Company’s ability to expend the necessary capital to replace its reserves or to maintain its production. If the Company’s cash flow from operations is not sufficient to satisfy its capital expenditure requirements, additional debt or equity financing might not be available to meet these requirements or available on satisfactory terms.
We may issue indebtedness in connection with our acquisitions, which would increase the amount of our outstanding indebtedness and increase the amount of cash used for debt service, and could affect our ability to incur future indebtedness or take advantage of business opportunities.
From time to time Equal Energy may enter into transactions to acquire assets or the shares of other entities. These transactions may be financed partially or wholly with debt, which may increase the Company’s debt levels above industry standards for oil and natural gas companies of similar size. Depending on future exploration and development plans, the Company may require additional debt financing that may not be available or, if available, may not be available on favorable terms. Neither the articles of the Company nor its by-laws limit the amount of indebtedness that the Company may incur. The level of the Company’s indebtedness from time to time could impair its ability to obtain additional financing on a timely basis to take advantage of business opportunities that may arise and could negatively affect the Company’s debt ratings. This in turn, could have a material adverse effect on the Company’s business, financial condition, results of operations and cash flow.
Our exploration and development activities may be delayed if drilling and related equipment is unavailable or if access to drilling locations is restricted. These events could have an adverse effect on our business and profitability.
Oil and natural gas exploration and development activities depend upon the availability of drilling and related equipment (typically leased from third parties) in the particular areas where such activities will be conducted. Demand for such limited equipment or access restrictions may affect the availability of such equipment to the Company and may delay exploration and development activities. To the extent the Company is not the operator of its oil and gas properties, the Company will be dependent on such operators for the timing of activities related to such properties and will be largely unable to direct or control the activities of the operators.
We are exposed to potential liabilities that may not be covered, in whole or in part, by insurance.
Equal Energy’s involvement in the exploration for and development of oil and natural gas properties may result in the Company becoming subject to liability for pollution, blow-outs, property damage, personal injury or other hazards. Although prior to conducting drilling and other field activities the Company will obtain insurance in accordance with industry standards to address such risks, such insurance has limitations on liability that may not be sufficient to cover
23
Table of Contents
the full extent of such liabilities. In addition, such risks may not, in all circumstances, be insurable or, in certain circumstances, the Company may elect not to obtain insurance to deal with specific risks due to the high premiums associated with such insurance or other reasons. The payment of such uninsured liabilities would reduce the funds available to the Company. The occurrence of a significant event that the Company is not fully insured against, or the insolvency of the insurer of such event, could have a material adverse effect on the Company’s financial position, results of operations or prospects.
Our operation of oil and natural gas wells, and our participation in oil and natural gas wells operated by others, could subject us to environmental claims and liability and/or increased compliance costs, all of which could affect the market price of our common shares and reduce the amount of cash available to run our business. All phases of the oil and natural gas business present environmental risks and hazards and are subject to environmental regulation pursuant to a variety of international conventions and international, national, provincial, state and local law and regulation. Environmental legislation provides for, among other things, restrictions and prohibitions on spills, releases or emissions of various substances produced in association with oil and gas operations. The legislation also requires that wells and facility sites be operated, maintained, abandoned and reclaimed to the satisfaction of applicable regulatory authorities. Compliance with such legislation can require significant expenditures and a breach of same can result in the imposition of clean-up orders, civil liability for pollution damage, and the imposition of fines and/or penalties, some of which may be material, as well as possible forfeiture of requisite approval obtained from the various governmental authorities.
Environmental legislation is evolving in a manner expected to result in stricter standards and enforcement, larger fines and legal liability, and potentially increased capital expenditures and operating costs. Our exploration and production facilities and other operations and activities emit greenhouse gases and require us to comply with greenhouse gas emissions legislation. The direct or indirect costs of these regulations may have a material adverse effect on our business, financial condition, results of operations and prospects. The discharge of greenhouse gas (“GHG”) emissions, oil, natural gas or other pollutants into the air, soil or water may give rise to liabilities to governments and third parties and may require us to incur costs to remedy such discharge. If we are not in material compliance with applicable environmental regulations, it could result in a curtailment of production or a material increase in the costs of production, development or exploration activities or otherwise have a material adverse effect on our business, financial condition, results of operations and prospects. See “Industry Conditions”.
We may incur material expenses complying with new or amended laws and regulations governing climate change.
The future implementation or modification of greenhouse gases or other environmental regulations could have a material impact on the nature of oil and natural gas operations, including those conducted by us, and could result in increased direct and indirect costs for us. Given the evolving nature of the debate related to climate change and the control of greenhouse gases and resulting requirements, it is not currently possible to predict either the nature of those requirements or the impact on us and our operations and financial condition.
Fluctuations in foreign currency exchange rates and interest rates could adversely affect our business, and adversely affect the market price of our common shares.
World oil prices are denominated in United States dollars and the Canadian dollar price received by Canadian producers is therefore affected by the Canadian/U.S. dollar exchange rate, which fluctuates over time. The price that Equal Energy receives for a majority of its oil and natural gas is based on United States dollar denominated benchmarks and therefore the revenue recorded in Canadian dollars is affected by the exchange rate between the two currencies. In recent years, the Canadian dollar has increased materially in value against the United States dollar and has at times traded above par against the United States dollar. A material increase in the value of the Canadian dollar relative to the United States dollar may negatively affect the Company’s net production revenue by decreasing the Canadian dollar revenue recorded in the financial statements. Equal conducts its business and operations in the United States and is therefore also exposed to foreign currency risk on its costs to the extent the value of the Canadian dollar decreases relative to the United States dollar.
An increase in interest rates could result in a significant increase in the amount we pay to refinance or service future borrowings, resulting in a decrease in the cash available to fund our operations.
24
Table of Contents
We may be unable to successfully compete with other companies in our industry, which could negatively affect the market price of our common shares.
The oil and gas industry is highly competitive. Equal Energy actively competes for reserve acquisitions, exploration leases, licenses and concessions, access to equipment, markets, transportation capacity, drilling, service rigs and processing facilities, production and development of oil and natural gas properties, skilled industry personnel, and the capital to finance such activities, with a substantial number of other oil and gas companies, many of which have significantly greater financial and personnel resources than the Company. The Company’s competitors include major integrated oil and natural gas companies and numerous other independent oil and natural gas companies and individual producers and operators.
Certain of Equal Energy’s customers and potential customers are themselves exploring for oil and gas, and the results of such exploration efforts could affect the Company’s ability to sell or supply oil or gas to these customers in the future. The Company’s ability to successfully bid on and acquire additional property rights, to discover reserves, to participate in drilling opportunities and to identify and enter into commercial arrangements with customers depends upon developing and maintaining close working relationships with its future industry partners and joint operators and its ability to select and evaluate suitable properties and to consummate transactions in a highly competitive environment.
As a result of increasing competition, it has become (and the Company expects it to continue to be) more difficult to acquire producing assets and reserves on accretive terms.
Our production is sold to a limited number of customers, and their inability to accept our production would have an adverse effect on our profitability.
Our production of oil and natural gas is sold to a limited number of customers and the inability to accept our production due to capacity constraints, or a credit default of one of these customers, could have a temporary adverse effect on us. Our revenues are generated under contracts with a limited number of customers. All of the natural gas from our properties is sold to Copano Energy, LLC (formerly Scissortail Energy, LLC) and DCP Midstream, LP. The oil from our properties is sold to ConocoPhillips. Our results of operations would be adversely affected as a result of non-performance by any of our customers. A non-payment default by one of these large customers could have an adverse effect on us, reducing our cash flow until payment is made.
We depend upon our management and other key personnel, and the loss of one or more of such individuals could negatively affect our business.
Equal Energy’s success depends in large measure on certain key personnel. The Company does not have key personnel insurance in effect for management. The contributions of these individuals to the Company’s immediate operations are likely to be of central importance. In addition, the competition for qualified personnel in the oil and natural gas industry is intense and if Equal Energy is unable to attract and retain all personnel necessary for the development and operation of its business, Equal Energy could be unable to successfully operate its business. Investors must rely upon the ability, expertise, judgment, discretion, integrity and good faith of the Company’s management.
Our operations require licenses, leases and permits from various governmental authorities. There can be no assurance that we will be able to obtain all necessary licenses, leases and permits that may be required to carry out exploration and development at our projects.
Equal Energy’s properties are held in the form of licenses and leases and working interests in licenses and leases. If the Company or the holder of the license or lease fails to meet the specific requirement of a license or lease, the license or lease may terminate or expire. There can be no assurance that any of the obligations required to maintain each license or lease will be met. The termination or expiration of the Company’s licenses or leases or the working interests relating to a license or lease, or the inability of the Company to obtain or maintain necessary permits, may have an adverse effect on its results of operations and its ability to conduct its business.
Our profitability depends upon the level of royalties and production taxes that we pay, and the availability to us of incentives provided by the State of Oklahoma and the federal government
In addition to federal regulations, each state has legislation and regulations which govern land tenure, royalties, production rates, environmental protection and other matters. The royalty regime is a significant factor in the profitability of oil and natural gas production. Royalties payable on production are determined by negotiations between the mineral owner and the lessee. If royalty rates or production taxes are increased, or if Oklahoma does not make available to us royalty rate reductions, royalty holidays or tax credits, our profitability will be negatively affected.
25
Table of Contents
If we are unable to renew our land leases on satisfactory terms, our operations will be adversely affected.
Oil and natural gas lands located in Oklahoma are generally privately owned and rights to explore for and produce such oil and natural gas are granted by lease on such terms and conditions as may be negotiated. In general terms the term of most leases is three years. Once a productive well is established on the lands the land is held by production for as long as the subject well is consistently producing. If we are unable to renew our land leases, we will be unable to operate out business as it is currently being conducted.
An unforeseen defect in the chain of title to our oil and natural gas producing properties may arise to defeat our claim, which could have an adverse effect on the market price of our common shares.
Although title reviews may be conducted prior to the purchase of oil and natural gas producing properties or the commencement of drilling wells, such reviews do not guarantee or certify that an unforeseen defect in the chain of title will not arise to defeat Equal Energy’s claim, which could result in a reduction of the revenue received by the Company.
The ability of residents of the United States to enforce civil remedies against us and our directors and officers may be limited.
Equal Energy is incorporated under the ABCA and all of the Company’s directors and all but two of its officers are residents of Canada. Consequently, it may be difficult for United States investors to effect service of process within the United States upon the Company or upon its directors or officers who are not residents of the United States, or to realize in the United States upon judgments against the Company’s current or future non-U.S. resident executive officers or directors of United States courts predicated upon civil liabilities under United States federal or state securities laws. Furthermore, it may be difficult for investors to enforce judgments of the U.S. courts based on civil liability provisions of the U.S. federal or state securities laws in a Canadian court against the Company or any of the Company’s non-U.S. resident executive officers or directors. There is substantial doubt whether an original lawsuit could be brought successfully in Canada against any of such persons or the Company predicated solely upon such civil liabilities.
Actual reserves will vary from reserve estimates and those variations could be material and negatively affect the market price of our common shares
There are numerous uncertainties inherent in estimating quantities of oil, natural gas and NGL reserves and cash flow to be derived therefrom, including many factors beyond our control. The reserve, recovery and associated revenue information contained in the Haas Report are only estimates and the actual production and ultimate reserves from Equal Energy’s properties may be greater or less than the estimates prepared in such reports. The Reserve Reports have been prepared using certain commodity price assumptions which are described in the notes to the reserve tables in this Form 10-K. If lower prices for crude oil, NGLs and natural gas are realized by the Company and substituted for the price assumptions utilized in the Reserve Reports, the present value of estimated future net cash flows for the Company’s reserves would be reduced and the reduction could be significant, particularly based on the constant price case assumptions. Exploration for oil and natural gas involves many risks, which even a combination of experience and careful evaluation may not be able to overcome. There is no assurance that further commercial quantities of oil and natural gas will be discovered by the Company.
In general, estimates of economically recoverable oil and natural gas reserves and the future net revenue there from are based up a number of variable factors and assumptions, such as:
| • | historical production from the properties; |
| • | estimated production decline rates; |
26
Table of Contents
| • | ultimate estimated reserve recovery; |
| • | changes in technology; |
| • | timing and amount and effectiveness of future capital expenditures; |
| • | marketability and price of oil and natural gas; |
| • | royalty rates; |
| • | the assumed effects of regulation by governmental agencies; and |
| • | future operating costs; |
all of which may vary from actual results. As a result, estimates of the economically recoverable oil and natural gas reserves attributable to any particular group of properties, classification of such reserves based on risk of recovery and estimates of future net revenues expected therefrom prepared by different engineers, or by the same engineers at different times, may vary. Our actual production, revenues and development and operating expenditures will vary from reserve estimates thereof and such variations could be material.
Estimates of proved reserves that may be developed and produced in the future are sometimes based upon volumetric calculations and upon analogy to similar types of reserves rather than actual production history. Estimates based on these methods are generally less reliable than those based on actual production history. Subsequent evaluation of the same reserves based upon production history and production practices will result in variations in the estimated reserves and such variations could be material.
In accordance with applicable securities laws, HAAS has used constant price and cost estimates in calculating reserve quantities included herein. Actual future net revenue will be affected by other factors including but not limited to actual production levels, supply and demand for oil and natural gas, curtailments or increases in consumption by oil and natural gas purchasers, changes in governmental regulation or taxation and the impact of inflation on costs.
Actual production and revenue derived from reserves will vary from the reserve estimates contained in the HAAS Report, and such variations could be material. The HAAS Report is based in part upon the assumption that certain activities will be undertaken by us in future years and the further assumption that such activities will be successful. The reserves and estimated revenue to be derived therefrom contained in the HAAP Report will be reduced in future years to the extent that such activities are not undertaken or, if undertaken, do not achieve the level of success assumed in the HAAS Report.
Future acquisitions, financings or other transactions may result in shareholder dilution.
Equal Energy may make future acquisitions or enter into financing or other transactions involving the issuance of securities of Equal Energy, which may be dilutive to shareholders of the Company.
We have never paid dividends on our Common Shares.
Equal Energy has not paid any dividends on its outstanding Common Shares. Payment of dividends on the Common Shares in the future will depend upon, among other things, the cash flow, results of operations and financial condition of the Company, the need for funds to finance ongoing operations and other business considerations as the Company’s Board of Directors considers relevant.
27
Table of Contents
The failure of third parties to meet their contractual obligations to us may have a material adverse effect on our financial condition.
Equal Energy is exposed to third party credit risk through its contractual arrangements with its current or future joint venture partners, third party operators, marketers of its petroleum and natural gas production and other parties. In the event such entities fail to meet their contractual obligations to the Company, such failures could have a material adverse effect on the Company and its cash flow from operations. In addition, poor credit conditions in the industry and of joint venture partners may impact a joint venture partner’s willingness to participate in the Company’s ongoing capital program, potentially delaying the program and the results of such program until the Company finds a suitable alternative partner.
We may not be able to achieve the anticipated benefits of acquisitions and the integration of acquisitions may result in the loss of key employees and the disruption of on-going business relationships.
Equal Energy makes acquisitions and dispositions of businesses and assets in the ordinary course of business. Achieving the benefits of acquisitions depends in part on successfully consolidating functions and integrating operations and procedures in a timely and efficient manner, as well as the Company’s ability to realize the anticipated growth opportunities and synergies from combining the acquired businesses and operations with those of the Company. The integration of an acquired business may require substantial management effort, time and resources and may divert management’s focus from other strategic opportunities and operational matters, and may also result in the loss of key employees, the disruption of on-going business, supplier, customer and employee relationships and deficiencies in internal controls or information technology controls. We continually assess the value and mix of our assets in light of our business plans and strategic objectives. In this regard, non-core assets are periodically disposed of, so that the Company can focus its efforts and resources more efficiently. Depending on the state of the market for such non-core assets, certain non-core assets of the Company, if disposed of, could realize less than their carrying value on the financial statements of the Company.
Our hedging program could result in us not realizing the full benefit of oil and natural gas price increases.
From time to time Equal Energy may enter into agreements to receive fixed prices on its oil and natural gas production to offset the risk of revenue losses if commodity prices decline; however, if commodity prices increase beyond the levels set in such agreements, the Company will not benefit from such increases and the Company may nevertheless be obligated to pay royalties on such higher prices, even though not received by it, after giving effect to such agreements. Similarly, from time to time the Company may enter into agreements to fix the exchange rate of Canadian to United States dollars in order to offset the risk of revenue losses if the Canadian dollar increases in value compared to the United States dollar; however, if the Canadian dollar declines in value compared to the United States dollar, the Company will not benefit from the fluctuating exchange rate. The extent that we engage in risk management activities, there are potential credit risks associated with the counterparties with which we contract.
Our directors may have conflicts of interest that create incentives for them to act contrary to or in competition with the interests of our shareholders.
Certain of the directors of Equal Energy are also directors and officers of other oil and gas companies involved in natural resource exploration and development, and conflicts of interest may arise between their duties as directors of the Company and as officers and directors of such other companies. Such conflicts must be disclosed in accordance with, and are subject to such other procedures and remedies as apply under the ABCA and under Code of Business Conduct.
Item 1B. Unresolved Staff Comments
Not applicable.
There are no outstanding legal proceedings material to the Company to which the Company is a party or in respect of which any of the Company’s properties are subject, nor are there any such proceedings known to be contemplated.
Item 4. Mine Safety Disclosures
Not applicable.
28
Table of Contents
Item 5. Market for Common Equity, Related Stockholder Matters and Issuer Purchases of Equity Securities
The Common Shares are listed on the TSX and NYSE and commenced trading under the symbol “EQU”.
The following table sets forth the price range and trading volume of the Common Shares as reported by the TSX and the NYSE for the period indicated.
| Toronto Stock Exchange | New York Stock Exchange | |||||||||||||||
| High (Cdn$) |
Low (Cdn$) |
High (US$) |
Low (US$) |
|||||||||||||
| 2012 |
||||||||||||||||
| Q1 |
5.12 | 3.73 | 4.95 | 3.73 | ||||||||||||
| Q2 |
3.85 | 2.42 | 3.85 | 2.38 | ||||||||||||
| Q3 |
3.95 | 2.55 | 4.05 | 2.48 | ||||||||||||
| Q4 |
3.94 | 2.94 | 3.97 | 2.96 | ||||||||||||
| 2011 |
||||||||||||||||
| Q1 |
8.24 | 5.50 | 8.47 | 5.53 | ||||||||||||
| Q2 |
7.35 | 6.15 | 7.76 | 6.61 | ||||||||||||
| Q3 |
6.91 | 4.32 | 7.23 | 4.25 | ||||||||||||
| Q4 |
5.45 | 3.91 | 6.06 | 3.73 | ||||||||||||
The 6.75% Debentures were listed on the TSX on February 9, 2011 under the symbol “EQU.DB.B”.
| High (Cdn$) |
Low (Cdn$) |
|||||||
| 2012 |
||||||||
| Q1 |
100.00 | 97.00 | ||||||
| Q2 |
99.50 | 90.00 | ||||||
| Q3 |
100.00 | 96.00 | ||||||
| Q4 |
100.99 | 93.00 | ||||||
| 2011 |
||||||||
| Q1 |
110.00 | 102.50 | ||||||
| Q2 |
110.00 | 101.00 | ||||||
| Q3 |
103.00 | 97.25 | ||||||
| Q4 |
99.99 | 85.00 | ||||||
29
Table of Contents
Performance Graph
The following graph compares the cumulative shareholder return on a $100 investment in Common Shares for the Corporation’s (or its predecessor, as applicable) five most recent financial years commencing January 1, 2008, with a cumulative total shareholder return on the S&P / TSX Composite Index and the SIC Oil & Gas Exploration and Production Index for the same period assuming reinvestment of all distributions and dividends.
| 1-Jan-08 | 31-Dec-08 | 31-Dec-09 | 31-Dec-10 | 31-Dec-11 | 31-Dec-12 | |||||||||||||||||||
| ENT/ EQU |
$ | 100 | $ | 44 | $ | 161 | $ | 151 | $ | 113 | $ | 76 | ||||||||||||
| S&P / TSX Composite Index |
$ | 100 | $ | 65 | $ | 85 | $ | 97 | $ | 86 | $ | 90 | ||||||||||||
| SIC Oil & Gas Exploration & Production |
$ | 100 | $ | 66 | $ | 91 | $ | 99 | $ | 79 | $ | 68 | ||||||||||||
Note: Restated to reflect the three for one exchange of trust units for Common Shares
The number of record holders as of December 31, 2012, was 197.
Equal did not declare any dividends during the years 2008, 2009, 2010, 2011 and 2012.
Issuer Purchases of Equity Securities
The Company did not purchase any common stock or debentures during 2012.
Under the Equal Energy Savings Plan (the “Plan”), eligible employees may purchase shares of our common stock which is administered by an independent trustee. Eligible employees purchased approximately 143,203 shares of our common stock in 2012, at then-prevailing stock prices.
30
Table of Contents
Item 6. Selected Financial Data
In thousands of Canadian dollars, except for share amounts.
| 2012 | 2011 | 2010 | 2009 | 2008 | ||||||||||||||||
| FINANCIAL |
||||||||||||||||||||
| Oil, NGL and natural gas revenues |
61,478 | 70,512 | 51,206 | 45,260 | 78,722 | |||||||||||||||
| Funds from operations (2) |
30,002 | 31,955 | 19,620 | 19,575 | 40,457 | |||||||||||||||
| Net income/(loss) from continuing operations |
31,111 | 2 | 3,615 | 10,625 | 25,292 | |||||||||||||||
| Per share – basic(1)($) |
0.89 | 0.00 | 0.14 | 0.50 | 1.23 | |||||||||||||||
| Per share – diluted(1)($) |
0.82 | 0.00 | 0.14 | 0.49 | 1.23 | |||||||||||||||
| Net income/(loss) from discontinued operations |
30,716 | 5,371 | (12,957 | ) | 3,508 | (57,094 | ) | |||||||||||||
| Per share – basic(1)($) |
0.87 | 0.17 | (0.52 | ) | 0.17 | (2.78 | ) | |||||||||||||
| Per share – diluted(1)($) |
0.76 | 0.16 | (0.52 | ) | 0.16 | (2.78 | ) | |||||||||||||
| Net income/(loss) |
61,827 | 5,373 | (9,342 | ) | 14,133 | (31,802 | ) | |||||||||||||
| Per share – basic(1)($) |
1.76 | 0.17 | (0.38 | ) | 0.67 | (1.55 | ) | |||||||||||||
| Per share – diluted(1)($) |
1.58 | 0.16 | (0.38 | ) | 0.65 | (1.55 | ) | |||||||||||||
| Total assets |
226,222 | 323,094 | 247,228 | 252,931 | 279,389 | |||||||||||||||
| Working capital (deficiency) |
26,602 | 7,358 | (1,832 | ) | 17,358 | 13,007 | ||||||||||||||
| Long-term debt |
— | 138,820 | 117,019 | 70,000 | 95,466 | |||||||||||||||
| Convertible debentures |
45,000 | 45,000 | 119,775 | 119,858 | 120,331 | |||||||||||||||
| Shareholders’ equity(3) |
161,277 | 99,880 | 37,329 | — | — | |||||||||||||||
| SHARES/UNITS OUTSTANDING |
||||||||||||||||||||
| Shares outstanding – basic(1) (000s) |
35,062 | 32,040 | 24,595 | 21,119 | 20,554 | |||||||||||||||
| Shares outstanding – diluted(1) (000s) |
41,125 | 32,768 | 24,896 | 21,611 | 20,554 | |||||||||||||||
| Shares outstanding at period end(1) (000s) |
35,227 | 34,779 | 27,710 | 21,701 | 20,719 | |||||||||||||||
| (1) | Restated to reflect three for one exchange of trust units for common shares. |
| (2) | Funds from operation is a non-GAAP financial measures. Please refer to “Non-GAAP Financial Measures”. |
| (3) | At December 31, 2009 and 2008, the Company had a trust structure which did not qualify as having shareholders’ equity. |
Item 7. Management’s Discussion and Analysis of Financial Condition and Results of Operations
This report, and in particular this Management’s Discussion and Analysis of Financial Condition and Results of Operations, contains forward-looking statements within the meaning of Section 27A of the Securities Act of 1933 and Section 21E of the Securities Exchange Act of 1934. Please see the cautionary language at the very beginning of this Annual Report on Form 10-K regarding the identification of and risks relating to forward-looking statements, as well as Part I, Item 1A “Risk Factors” in this Annual Report on Form 10-K.
The following discussion of our financial condition and results of operations should be read in conjunction with the “Financial Statements and Supplementary Data” as set out in Part II, Item 8 of this Annual Report on Form 10-K.
CORPORATE PROFILE
Equal Energy Ltd. is an exploration and production oil and gas company which had its head office in Calgary, Alberta for 2012 which has subsequently moved to Oklahoma City, Oklahoma during 2013. Equal’s shares are listed on the New York Stock Exchange (EQU) and Equal’s shares and convertible debentures are listed on the Toronto Stock Exchange (EQU and EQU.DB.B). Its current production is approximately 6,400 boe per day (49% NGLs, 49% natural gas and 2% crude oil) all of which is produced in Oklahoma.
31
Table of Contents
On May 3, 2012, the Company’s board of directors initiated a strategic review process to identify, examine and consider alternatives with the view to enhancing shareholder value. As a result of the strategic review process, several important initiatives were concluded:
| • | A major reduction in debt as a result of several asset sales. |
| • | Initiation of a USD$0.20 per share annual dividend starting January 1, 2013, which is to be paid quarterly. |
| • | A review of the composition of the board of directors and senior management team. |
| • | A review of compensation policies. |
| • | A focus on the liquids-rich natural gas Hunton property in Central Oklahoma. |
As a result of the Canadian asset sales in Q4 2012, the Canadian operations are considered discontinued for 2012 and all comparative years in the following Management’s Discussion and Analysis (“MD&A”), financial statements and notes to the financial statements. Only the Company’s continuing operations, which include the Oklahoma operations and corporate costs, are discussed in the following MD&A except in the Discontinued Operations section where the Canadian operations are discussed and referred to.
It is important to note that within this MD&A, production volumes reflect the Company’s continuing operations net of royalty interest which is in accordance with U.S. regulations. Reported production volumes in previous press releases, quarterly reports, annual reports and other public documents included discontinued Canadian operations and were in accordance with the Canadian National Instrument 51 – 101 which is before the deduction of royalty interest.
| Financial and Operations Summary | Year ended December 31, | |||||||||||||||||||
| (in thousands except for volumes, percentages and per share and boe amounts) |
2012 | Change | 2011 | Change | 2010 | |||||||||||||||
| FINANCIAL |
||||||||||||||||||||
| Oil, NGL and natural gas revenues |
61,478 | (13 | %) | 70,512 | 38 | % | 51,206 | |||||||||||||
| Total gain on commodity contracts |
2,915 | (63 | %) | 7,799 | (143 | %) | 3,209 | |||||||||||||
| Funds from operations (1) |
30,002 | (6 | %) | 31,955 | 63 | % | 19,620 | |||||||||||||
| Net income/(loss) from continuing operations |
31,111 | >1000 | % | 2 | (100 | %) | 3,615 | |||||||||||||
| Per share – basic (2) ($) |
0.89 | >1000 | % | 0.00 | (100 | %) | 0.14 | |||||||||||||
| Per share – diluted (2) ($) |
0.82 | >1000 | % | 0.00 | (100 | %) | 0.14 | |||||||||||||
| Net income/(loss) from discontinued operations |
30,716 | 472 | % | 5,371 | (141 | %) | (12,957 | ) | ||||||||||||
| Per share – basic (2) ($) |
0.87 | 412 | % | 0.17 | (133 | %) | (0.52 | ) | ||||||||||||
| Per share – diluted (2) ($) |
0.76 | 375 | % | 0.16 | (131 | %) | (0.52 | ) | ||||||||||||
| Net income/(loss) |
61,827 | >1000 | % | 5,373 | (158 | %) | (9,342 | ) | ||||||||||||
| Per share – basic (2) ($) |
1.76 | 935 | % | 0.17 | (145 | %) | (0.38 | ) | ||||||||||||
| Per share – diluted (2) ($) |
1.58 | 888 | % | 0.16 | (142 | %) | (0.38 | ) | ||||||||||||
| Total assets |
226,222 | 323,094 | 247,228 | |||||||||||||||||
32
Table of Contents
| Working capital (deficiency) including long-term debt (1) |
26,602 | (131,462 | ) | (26,697 | ) | |||||||||||||||
| Convertible debentures |
45,000 | 45,000 | 119,775 | |||||||||||||||||
| Shareholders’ equity |
161,277 | 99,880 | 37,329 | |||||||||||||||||
| SHARES OUTSTANDING |
||||||||||||||||||||
| Shares outstanding – basic(2) (000s) |
35,062 | 32,040 | 24,595 | |||||||||||||||||
| Shares outstanding – diluted(2) (000s) |
41,125 | 32,768 | 24,896 | |||||||||||||||||
| Shares outstanding at period end (000s) |
35,227 | 34,779 | 27,710 | |||||||||||||||||
| OPERATIONS |
||||||||||||||||||||
| Average daily production net of royalties(3) |
||||||||||||||||||||
| NGL (bbls per day) |
3,237 | 35 | % | 2,401 | 32 | % | 1,813 | |||||||||||||
| Natural gas (mcf per day) |
22,664 | 30 | % | 17,461 | 46 | % | 11,954 | |||||||||||||
| Oil (bbls per day) |
172 | (19 | %) | 212 | (5 | %) | 224 | |||||||||||||
|
|
|
|
|
|
|
|
|
|
|
|||||||||||
| Total (boe per day) |
7,186 | 30 | % | 5,523 | 37 | % | 4,030 | |||||||||||||
|
|
|
|
|
|
|
|
|
|
|
|||||||||||
| Average sales price, excluding impact of commodity contracts |
||||||||||||||||||||
| NGL ($ per bbl) |
31.41 | (34 | %) | 47.46 | 14 | % | 41.73 | |||||||||||||
| Gas ($ per mcf) |
2.22 | (36 | %) | 3.46 | (12 | %) | 3.93 | |||||||||||||
| Oil ($ per bbl) |
92.82 | 4 | % | 89.11 | 13 | % | 78.67 | |||||||||||||
| Cash flow netback (1) ($ per boe) |
||||||||||||||||||||
| Revenue (4) |
23.37 | (33 | %) | 34.98 | 0 | % | 34.81 | |||||||||||||
| Production expenses |
7.78 | (7 | %) | 8.39 | 18 | % | 7.11 | |||||||||||||
| Production taxes |
1.43 | (13 | %) | 1.64 | (8 | %) | 1.79 | |||||||||||||
| Operating netback |
16.47 | (37 | %) | 26.13 | (9 | %) | 28.71 | |||||||||||||
| Cash general and administrative |
2.88 | (31 | %) | 4.20 | (56 | %) | 9.62 | |||||||||||||
| Interest expense |
2.25 | (54 | %) | 4.88 | (27 | %) | 6.68 | |||||||||||||
| Other cash costs (5) |
(0.08 | ) | (162 | %) | (0.31 | ) | (111 | %) | (0.93 | ) | ||||||||||
|
|
|
|
|
|
|
|
|
|
|
|||||||||||
| Cash flow netback |
11.42 | (33 | %) | 16.73 | 25 | % | 13.34 | |||||||||||||
|
|
|
|
|
|
|
|
|
|
|
33
Table of Contents
| (1) | Funds from operations, cash flow netback and working capital including long-term debt are non-GAAP financial measures. Please refer to “Non-GAAP Financial Measures”. |
| (2) | Weighted average shares outstanding. See Note 9 to the Financial Statements. |
| (3) | Production volumes reflect the Company’s continuing operations net of royalty interest which is in accordance with U.S. regulations. Reported production volumes in previous press releases, quarterly reports, annual reports and other public documents included discontinued Canadian operations and were in accordance with the Canadian National Instrument 51 – 101 which is before the deduction of royalty interest. |
| (4) | Price received includes royalty deductions. |
| (5) | Other cash costs include realized foreign exchange gains and losses. |
34
Table of Contents
QUARTERLY FINANCIAL INFORMATION (in thousands of Canadian dollars except for per share amounts)
| Full Year | 2012 | Full Year | 2011 | |||||||||||||||||||||||||||||||||||||
| 2012 | Q4 | Q3 | Q2 | Q1 | 2011 | Q4 | Q3 | Q2 | Q1 | |||||||||||||||||||||||||||||||
| Revenues |
64,393 | 14,960 | 11,793 | 19,034 | 18,606 | 78,311 | 18,727 | 27,018 | 23,393 | 9,173 | ||||||||||||||||||||||||||||||
|
|
|
|
|
|
|
|
|
|
|
|
|
|
|
|
|
|
|
|
|
|||||||||||||||||||||
| Funds from operations(1) |
30,002 | 7,760 | 6,281 | 6,236 | 9,725 | 31,955 | 10,726 | 10,696 | 6,344 | 4,189 | ||||||||||||||||||||||||||||||
|
|
|
|
|
|
|
|
|
|
|
|
|
|
|
|
|
|
|
|
|
|||||||||||||||||||||
| Income/(loss) before taxes from continuing operations |
37,945 | (1,245 | ) | 34,873 | 290 | 4,027 | 10,834 | 5,036 | 1,959 | 9,239 | (5,400 | ) | ||||||||||||||||||||||||||||
|
|
|
|
|
|
|
|
|
|
|
|
|
|
|
|
|
|
|
|
|
|||||||||||||||||||||
| Net income/(loss) from continuing operations |
31,111 | (5,153 | ) | 38,615 | (5,429 | ) | 3,078 | 2 | 92 | (1,885 | ) | 8,007 | (6,212 | ) | ||||||||||||||||||||||||||
|
|
|
|
|
|
|
|
|
|
|
|
|
|
|
|
|
|
|
|
|
|||||||||||||||||||||
| Net income/(loss) from discontinued operations |
30,716 | 28,057 | 3,346 | (1,566 | ) | 879 | 5,371 | (1,192 | ) | 810 | 1,131 | 4,622 | ||||||||||||||||||||||||||||
|
|
|
|
|
|
|
|
|
|
|
|
|
|
|
|
|
|
|
|
|
|||||||||||||||||||||
| Net income/(loss) |
61,827 | 22,904 | 41,961 | (6,995 | ) | 3,957 | 5,373 | (1,100 | ) | (1,075 | ) | 9,138 | (1,590 | ) | ||||||||||||||||||||||||||
|
|
|
|
|
|
|
|
|
|
|
|
|
|
|
|
|
|
|
|
|
|||||||||||||||||||||
| Basic net income/(loss) per |
||||||||||||||||||||||||||||||||||||||||
| Continuing operations |
0.89 | (0.15 | ) | 1.10 | (0.16 | ) | 0.09 | 0.00 | 0.00 | (0.05 | ) | 0.26 | (0.22 | ) | ||||||||||||||||||||||||||
|
|
|
|
|
|
|
|
|
|
|
|
|
|
|
|
|
|
|
|
|
|||||||||||||||||||||
| Discontinued operations |
0.87 | 0.80 | 0.10 | (0.04 | ) | 0.02 | 0.17 | (0.03 | ) | 0.02 | 0.04 | 0.16 | ||||||||||||||||||||||||||||
|
|
|
|
|
|
|
|
|
|
|
|
|
|
|
|
|
|
|
|
|
|||||||||||||||||||||
| Net income/(loss) |
1.76 | 0.65 | 1.20 | (0.20 | ) | 0.11 | 0.17 | (0.03 | ) | (0.03 | ) | 0.30 | (0.06 | ) | ||||||||||||||||||||||||||
|
|
|
|
|
|
|
|
|
|
|
|
|
|
|
|
|
|
|
|
|
|||||||||||||||||||||
| Diluted net income/(loss) per share ($ per share): |
||||||||||||||||||||||||||||||||||||||||
| Continuing operations |
0.82 | (0.15 | ) | 0.94 | (0.16 | ) | 0.09 | 0.00 | 0.00 | (0.05 | ) | 0.22 | (0.22 | ) | ||||||||||||||||||||||||||
|
|
|
|
|
|
|
|
|
|
|
|
|
|
|
|
|
|
|
|
|
|||||||||||||||||||||
| Discontinued operations |
0.76 | 0.68 | 0.08 | (0.04 | ) | 0.02 | 0.16 | (0.03 | ) | 0.02 | 0.04 | 0.14 | ||||||||||||||||||||||||||||
|
|
|
|
|
|
|
|
|
|
|
|
|
|
|
|
|
|
|
|
|
|||||||||||||||||||||
| Net income/(loss) |
1.58 | 0.57 | 1.03 | (0.20 | ) | 0.11 | 0.16 | (0.03 | ) | (0.03 | ) | 0.26 | (0.06 | ) | ||||||||||||||||||||||||||
|
|
|
|
|
|
|
|
|
|
|
|
|
|
|
|
|
|
|
|
|
|||||||||||||||||||||
| (1) | Funds from operations is a non-GAAP financial measure. Please refer to “Non-GAAP Financial Measures”. |
For 2012, quarterly revenues and funds from operations were generally lower than the previous quarters mainly due to the asset disposition in Q4 2011 and decreased prices received for NGLs and natural gas. The Company’s sale of its assets in Northern Oklahoma in Q3 2012 resulted in a gain of $36.0 million which increased net income. The Company’s sale of its assets in Canada in Q4 2012 resulted in a gain of $56.8 million which increased net income during the quarter and resulted in the discontinuation of operations in Canada.
Q4, Q3 and Q2 2011 revenues and funds from operations are higher than the previous quarters due to the June 1, 2011 acquisition of working interest s from a former joint venture partner in Oklahoma (the “Hunton Acquisition”). During Q1 2011, funds from operations were lower due to legal fees relating to legal proceedings against a former joint venture partner in Oklahoma.
35
Table of Contents
OVERALL PERFORMANCE
Average production for 2012 of 7,186 boe per day was 30% higher than the 2011 production of 5,523 boe per day mainly due to the Hunton Acquisition which occurred in June 2011 contributing for the full year in 2012 and contribution from new wells drilled during 2012 which was partially offset by the sale of the Northern Oklahoma assets on September 24, 2012, that produced approximately 1,100 boe per day, and the natural decline in older production.
Revenues decreased 13% to $61.5 million from $70.5 million in 2011 due to decreased NGL and natural gas prices. The decreases in prices were partially offset by increased NGL and natural gas production. The average price received for NGLs decreased 34% to $31.41 per bbl compared to $47.46 per bbl in 2011 due to excess supply relative to demand in the mid-continent of the United States where Equal’s NGL production is located. The average price received for natural gas in 2012 decreased 36% to $2.22 per mcf from $3.46 per mcf in 2011 due to an oversupply situation for North American natural gas. The average price received for oil in 2012 increased 4% to $92.63 per bbl from $89.22 per bbl in 2011.
Production expense increased 21% to $20.5 million from $16.9 million in 2011 mainly due to increased volumes from the Hunton Acquisition in June 2011 and the addition of new wells drilled during the past year. On a per boe basis, production expense decreased 7% to $7.78 per boe in 2012 from $8.39 per boe in 2011 partially due to the sale of the Northern Oklahoma assets that had a higher average production expense per boe than the Company’s average production costs and a Company focus on cost control. Production taxes increased 13% to $3.8 million from $3.3 million in 2011 mainly due to the 30% increase in production which was partially offset by the decrease in prices received for NGLs and natural gas.
General and administrative costs (“G&A”) decreased 11% to $7.6 million from $8.5 million in 2011. The decrease in G&A costs was mainly due to higher costs in 2011 for legal fees related to court proceedings involving a former joint venture participant that ended during Q2 2011. Interest expense was $5.9 million which was 40% lower than $9.8 million in 2011. The lower interest expense is mainly due to proceeds from the asset dispositions being used to pay down the bank credit facility and lower interest paid on the convertible debentures as an 8.25% debenture was redeemed in Q4 2011.
The overall result was that funds from operations decreased by 11% to $30.0 million in 2012 compared to $33.7 million in 2011 due to the decrease in revenues and increase in production expense which were partially offset by decreases in G&A and interest expense.
In 2012, the Company had net income of $61.8 million which was mainly due to the $36.0 million ($22.3 million net of income tax) gain on sale of assets in Oklahoma and the $58.8 million ($42.6 million net of income tax) gain on sale of assets in Canada.
36
Table of Contents
PRODUCTION VOLUMES
Production Net of Royalties
| Year ended December 31 | ||||||||||||||||||||
| 2012 | Change | 2011 | Change | 2010 | ||||||||||||||||
| Daily sales volumes net of royalties(1) – average |
||||||||||||||||||||
| NGL (bbls per day) |
3,237 | 35 | % | 2,401 | 32 | % | 1,813 | |||||||||||||
| Natural gas (mcf per day) |
22,664 | 30 | % | 17,461 | 46 | % | 11,954 | |||||||||||||
| Oil (bbls per day) |
172 | (19 | %) | 212 | (5 | %) | 224 | |||||||||||||
|
|
|
|
|
|
|
|
|
|
|
|||||||||||
| Total (boe per day) |
7,186 | 30 | % | 5,523 | 37 | % | 4,030 | |||||||||||||
|
|
|
|
|
|
|
|
|
|
|
|||||||||||
| Sales volumes mix by product |
||||||||||||||||||||
| NGL |
45 | % | 43 | % | 45 | % | ||||||||||||||
| Natural gas |
53 | % | 53 | % | 49 | % | ||||||||||||||
| Oil |
2 | % | 4 | % | 6 | % | ||||||||||||||
|
|
|
|
|
|
|
|
|
|
|
|||||||||||
| 100 | % | 100 | % | 100 | % | |||||||||||||||
|
|
|
|
|
|
|
|
|
|
|
|||||||||||
| (1) | Production volumes reflect the Company’s continuing operations net of royalty interest which is in accordance with U.S. regulations. Reported production volumes in previous press releases, quarterly reports, annual reports and other public documents included discontinued Canadian operations and were in accordance with the Canadian National Instrument 51 – 101 which is before the deduction of royalty interest. |
In 2012, production of 7,186 boe per day was 30% higher compared to 5,523 boe per day during 2011. The increase in production is primarily due to the Hunton Acquisition which occurred in June 2011 contributing to the full year in 2012 and volumes from new wells drilled during 2012 which was partially offset by the sale of the Northern Oklahoma assets in September 2012 that produced approximately 1,100 boe per day and the natural production decline.
In 2011, production of 5,523 boe per day was 37% higher compared to 4,030 boe per day during 2010. The increase in production is primarily due to the Hunton Acquisition which occurred in June 2011, wells drilled during 2011 and a reactivation and workover program.
On September 24, 2012, Equal closed the sale of its interest in its Northern Oklahoma assets for total cash consideration of US$40.0 million to its Mississippian joint venture partner Atlas Resource Partners L.P. (“Atlas”). The assets sold include production of approximately 1,100 boe per day which is primarily natural gas and NGLs, related infrastructure and interests in approximately 8,550 acres of Mississippian lands.
The Company’s current portfolio of assets consists almost exclusively of the liquids-rich natural gas asset in Central Oklahoma. Equal’s current corporate production is approximately 6,400 boe per day consisting of 49% natural gas, 49% NGLs and 2% crude oil.
For the year ended December 31, 2012, Equal drilled 9 (7.2 net) producing wells, resulting in a 100% success rate:
| • | 3 (2.7 net) Twin Cities / Central Dolomite Hunton liquids-rich natural gas wells in Central Oklahoma; |
| • | 4 (3.5 net) K-9 Hunton vertical liquids-rich natural gas wells in Northern Oklahoma which were sold in Q3 2012; and |
| • | 2 (1.0 net) K-9 Mississippian horizontal oil wells which were sold in Q3 2012. |
COMMODITY PRICING
Pricing Benchmarks
| Year ended December 31 | ||||||||||||||||||||
| 2012 | Change | 2011 | Change | 2010 | ||||||||||||||||
| Propane, Conway, KS (US$ per bbl) |
36.12 | (37 | %) | 56.89 | 20 | % | 47.24 | |||||||||||||
|
|
|
|
|
|
|
|
|
|
|
|||||||||||
| NYMEX natural gas (US$ per mmbtu) |
2.79 | (32 | %) | 4.08 | (8 | %) | 4.42 | |||||||||||||
|
|
|
|
|
|
|
|
|
|
|
|||||||||||
| NYMEX natural gas (US$ per mcf) (1) |
2.89 | (32 | %) | 4.22 | (8 | %) | 4.57 | |||||||||||||
|
|
|
|
|
|
|
|
|
|
|
|||||||||||
| WTI (US$ per bbl) |
94.19 | (1 | %) | 95.12 | 20 | % | 79.53 | |||||||||||||
|
|
|
|
|
|
|
|
|
|
|
|||||||||||
| Average exchange rate: US$ to Cdn$1.00 |
1.00 | (1 | %) | 1.01 | 4 | % | 0.97 | |||||||||||||
|
|
|
|
|
|
|
|
|
|
|
|||||||||||
| WTI (Cdn$ per bbl) |
94.19 | 0 | % | 94.17 | 15 | % | 81.92 | |||||||||||||
|
|
|
|
|
|
|
|
|
|
|
|||||||||||
| (1) | Conversion rate of 1.0350 mmbtu per mcf. |
37
Table of Contents
The prices Equal receives for its NGLs are indexed to Conway, Kansas prices, so the price variations at Conway are reflected in Equal’s variations in NGL price. The propane price quoted at Conway, Kansas has historically been a representative proxy of the price Equal receives for its basket of NGL products produced in Oklahoma. The NYMEX natural gas price is based at Henry Hub in Louisiana and is priced in U.S. dollars per mmbtu. West Texas Intermediate (“WTI”) is a standard benchmark for the price of oil and is expressed in U.S. dollars per barrel. For the purposes of financial reporting, Equal expresses its realized prices for oil, NGLs and natural gas in Canadian dollars.
Benchmark propane prices for 2012 decreased 37% to an average of US$36.12 per bbl from US$56.89 per bbl in 2011 due to an increased supply in the market from increased liquids-rich drilling and lower consumption from a warmer than usual winter. Benchmark propane prices for 2011 increased 20% to an average of US$56.89 per bbl from US$47.24 per bbl compared to the same period in 2010 which was also partially offset in Canadian dollar terms, by the strengthening of the Canadian dollar compared to the U.S. dollar.
Benchmark natural gas prices for 2012 on the NYMEX decreased 32% to an average of US$2.79 per mmbtu from US$4.08 per mmbtu in 2011. Benchmark natural gas prices for 2011 on the NYMEX decreased 8% to an average of US$4.08 per mmbtu from US$4.42 per mmbtu compared 2010.
Benchmark oil prices for 2012 decreased slightly by 1% to an average of US$94.19 per bbl WTI from US$95.12 per bbl WTI in 2011. Benchmark oil prices for the 2011 increased 20% to an average of US$95.12 per bbl WTI from US$79.53 per bbl WTI in 2010.
Average Commodity Prices Received Before Impact of Commodity Contracts
| Year ended December 31 | ||||||||||||||||||||
| 2012 | Change | 2011 | Change | 2010 | ||||||||||||||||
| NGL (Cdn$ per bbl) |
31.41 | (34 | %) | 47.46 | 14 | % | 41.73 | |||||||||||||
|
|
|
|
|
|
|
|
|
|
|
|||||||||||
| Natural gas (Cdn$ per mcf) |
2.22 | (36 | %) | 3.46 | (12 | %) | 3.93 | |||||||||||||
|
|
|
|
|
|
|
|
|
|
|
|||||||||||
| Oil (Cdn$ per bbl) |
92.82 | 4 | % | 89.11 | 13 | % | 78.67 | |||||||||||||
|
|
|
|
|
|
|
|
|
|
|
|||||||||||
| Total (Cdn$ per boe) |
23.37 | (33 | %) | 34.98 | 0 | % | 34.81 | |||||||||||||
|
|
|
|
|
|
|
|
|
|
|
|||||||||||
In 2012, the average price received for NGLs decreased 34% to $31.41 per bbl compared to $47.46 per bbl in 2011 due to excess supply relative to demand in the mid-continent of the United States where Equal’s NGL production is located. The average price received for natural gas in 2012 decreased 36% to $2.22 per mcf from $3.46 per mcf in 2011 due to an oversupply situation in North America resulting in a decrease in market prices for natural gas. The average price received for oil in 2012 increased 4% to $92.63 per bbl from $89.22 per bbl in 2011.
In 2011, the average price received for NGLs increased 14% to $47.46 per bbl compared to $41.73 per bbl in 2010. The average price received for natural gas in 2011, decreased 12% to $3.46 per mcf from $3.93 per mcf in 2010 due to an oversupply situation resulting in a decrease in market prices for natural gas. The average price received for oil in 2011 increased 13% to $89.22 per bbl from $78.72 per bbl in 2010.
38
Table of Contents
REVENUES
Revenues (in thousands of Canadian dollars)
| Year ended December 31 | ||||||||||||||||||||
| 2012 | Change | 2011 | Change | 2010 | ||||||||||||||||
| NGL revenues |
37,202 | (11 | %) | 41,593 | 51 | % | 27,620 | |||||||||||||
| Natural gas revenues |
18,433 | (16 | %) | 22,024 | 28 | % | 17,154 | |||||||||||||
| Oil revenues |
5,843 | (15 | %) | 6,895 | 7 | % | 6,432 | |||||||||||||
| Total Gain on commodity contracts |
2,915 | (63 | %) | 7,799 | 143 | % | 3,209 | |||||||||||||
|
|
|
|
|
|
|
|
|
|
|
|||||||||||
| Total Revenues |
64,393 | (18 | %) | 78,311 | 44 | % | 54,415 | |||||||||||||
In 2012, total revenues decreased 18% to $64.4 million from $78.3 million in 2011 due to decreased NGL and natural gas prices. The decreases in prices were partially offset by increased NGL and natural gas production and gains on commodity contracts.
NGL revenues for 2012 decreased 11% to $37.2 million from $41.6 million in 2011 which was the result of a 34% decrease in sales price received for NGLs partially offset by a 35% increase in production volumes. Natural gas revenues for 2012 decreased 16% to $18.4 million from $22.0 million in 2011 which was the result of a 36% decrease in sales price received for natural gas partially offset by a 30% increase in production volumes. Oil revenues for 2012 decreased 15% to $5.8 million compared to $6.9 million in 2011 which was the result of a 19% decrease in production volumes partially offset by a 4% increase in price received. In 2012, there was a gain on commodity contracts of $2.9 million compared to a $7.8 million gain in 2011.
In 2011, total revenues increased 44% to $78.3 million from $54.4 million in 2010 due to increased NGL and natural gas volumes produced from the Hunton Acquisition in June 2011.
NGL revenues for 2011 increased 51% to $41.6 million from $27.6 million in 2010 which was the result of a 32% increase in production volumes and a 14% increase in sales price received for NGLs. Natural gas revenues for 2011 increased 28% to $22.0 million from $17.2 million in 2010 which was the result of a 46% increase in production volumes partially offset by a 12% decrease in sales price received for natural gas. Oil revenues for 2011 increased 7% to $6.9 million compared to $6.4 million in 2010 which was the result of a 13% increase in sales price received partially offset by a 5% decrease production volume. In 2011, there was a gain on commodity contracts of $7.8 million compared to $3.2 million gain in 2010.
The Company’s 2013 assumptions for planning purposes are: US$90.00 per bbl for WTI (Equal realization of 96% of WTI), US$3.90 per mmbtu for NYMEX natural gas (Equal realization of 87% of NYMEX), US$0.90 per gallon (US$37.80 per bbl) for Conway propane (Equal realization of 89% of Conway Propane). The Company constantly monitors actual prices against plan prices and adjusts its operational plans to address changes in cash flow caused by commodity price fluctuation.
COMMODITY CONTRACTS
The Company has a risk management policy which is in line with the terms of its bank credit facility that permits management to use specified price risk management strategies for up to 65% of its estimated net oil and gas production which includes fixed price contracts, costless collars and the purchase of floor price options and other derivative instruments to reduce the impact of price volatility and ensure minimum prices for a maximum of 36 months. The program is designed to provide price protection on a portion of Equal’s future production in the event of adverse commodity price movement, while retaining exposure to upside price movements. By doing this, Equal seeks to provide a measure of stability and predictability of cash inflows to enable it to carry out its planned capital spending programs.
39
Table of Contents
The mark-to-market value of the commodity contracts is determined based on the estimated fair value as at December 31, 2012 that was obtained from the counterparties to the economic hedges. Equal then evaluates the reasonableness of the valuations in comparison to the value of other commodity contracts it currently owns as well as recently quoted prices received from other counterparties for various commodity contracts. The Company deals with large, credit-worthy financial institutions to diversify its counterparty risk. The credit worthiness of each counterparty is assessed at the time of purchase of each financial instrument and is regularly assessed based on any new information regarding the counterparty.
At December 31, 2012, Equal had the following financial derivatives and fixed price contracts outstanding:
| Derivative Instrument |
Commodity | Price (2) | Volume per day (2) | Period | ||||
| Fixed |
Gas | 3.45 (US$/mmbtu) (3.57 US$/mcf) |
2,000 mmbtu (1,932 mcf) |
January 1, 2013 – December 31, 2013 | ||||
| Fixed |
Gas | 3.60 (US$/mmbtu) (3.73 US$/mcf) |
3,000 mmbtu (2,899 mcf) |
January 1, 2013 – December 31, 2013 | ||||
| Fixed |
Gas | 3.61 (US$/mmbtu) (3.74 US$/mcf) |
2,000 mmbtu (1,932 mcf) |
January 1, 2013 – December 31, 2013 | ||||
| Fixed |
Gas | 3.65 (US$/mmbtu) (3.78 US$/mcf) |
2,000 mmbtu (1,932 mcf) |
January 1, 2013 – December 31, 2013 | ||||
| Fixed |
Gas | 3.70 (US$/mmbtu) (3.83 US$/mcf) |
2,000 mmbtu (1,932 mcf) |
January 1, 2013 – December 31, 2013 | ||||
| Fixed |
Gas | 3.99 (US$/mmbtu) (4.13 US$/mcf) |
1,000 mmbtu (966 mcf) |
January 1, 2013 – December 31, 2013 | ||||
| Fixed |
Gas | 4.05 (US$/mmbtu) (4.19 US$/mcf) |
2,000 mmbtu (1,932 mcf) |
January 1, 2013 – December 31, 2013 | ||||
| Fixed |
Gas | 4.25 (US$/mmbtu) (4.40 US$/mcf) |
2,000 mmbtu (1,932 mcf) |
January 1, 2014 – December 31, 2014 | ||||
| Fixed Basis Differential (1) |
Gas | Differential Fixed @ $0.20 US$/mmbtu ($0.21 US$/mcf) |
7,000 mmbtu (6,763 mcf) |
January 1, 2013 – December 31, 2013 | ||||
| Fixed Basis Differential (1) |
Gas | Differential Fixed @ $0.205 US$/mmbtu ($0.212 US$/mcf) |
5,000 mmbtu (4,831 mcf) |
January 1, 2013 – December 31, 2013 | ||||
| Fixed |
Oil | 101.50 (Cdn$/bbl) | 200 bbl | January 1, 2013 – December 31, 2013 |
| (1) | NYMEX / Southern Star (Oklahoma) basis differential. |
| (2) | Conversion rate of 1.0350 mmbtu per mcf. |
40
Table of Contents
As at December 31, 2012 the above commodity contracts had a net mark-to-market asset position of $1.6 million compared to a net mark-to-market asset position of $4.8 million on December 31, 2011. The mark-to-market asset position at December 31, 2012 relates to the oil and natural gas contracts which have average hedged prices higher than the market prices at December 31, 2012.
Subsequent to December 31, 2012, Equal entered fixed price contracts with the following details:
| Derivative Instrument |
Commodity | Price (1) | Volume per day (1) | Period | ||||
| Fixed |
Gas | 4.05 (US$/mmbtu) (4.19 US$/mcf) |
4,000 mmbtu (3,865 mcf) |
January 1, 2014 – December 31, 2014 | ||||
| Fixed |
Gas | 4.055 (US$/mmbtu) (4.20 US$/mcf) |
2,000 mmbtu (1,932 mcf) |
January 1, 2014 – December 31, 2014 | ||||
| Fixed |
Gas | 4.06 (US$/mmbtu) (4.20 US$/mcf) |
2,000 mmbtu (1,932 mcf) |
January 1, 2014 – December 31, 2014 | ||||
| Fixed |
Gas | 4.10 (US$/mmbtu) (4.24 US$/mcf) |
2,000 mmbtu (1,932 mcf) |
January 1, 2014 – December 31, 2014 |
| (1) | Conversion rate of 1.0350 mmbtu per mcf. |
Equal has 14,000 mmbtu per day of its 2013 natural gas hedged at US$3.69 per mmbtu and 200 bbls per day of its 2013 oil and NGL hedged at $101.50 per barrel which is 38% of the Company’s total production hedged for calendar year 2013 based on 2013 budgeted production levels of 6,400 boe per day.
The Company also has 12,000 mmbtu per day of its 2014 natural gas hedged at US$4.09 per mmbtu which is 30% of the Company’s current production levels of 6,400 boe per day.
PRODUCTION EXPENSE
Production Expense (in thousands of Canadian dollars except for percentages and per boe amounts)
| Year ended December 31 | ||||||||||||||||||||
| 2012 | Change | 2011 | Change | 2010 | ||||||||||||||||
| Production expense |
20,457 | 21 | % | 16,908 | 62 | % | 10,462 | |||||||||||||
|
|
|
|
|
|
|
|
|
|
|
|||||||||||
| Production expense per boe ($) |
7.78 | (7 | %) | 8.39 | 18 | % | 7.11 | |||||||||||||
|
|
|
|
|
|
|
|
|
|
|
|||||||||||
41
Table of Contents
In 2012, production expense increased 21% to $20.5 million from $16.9 million in 2011 mainly due to increased volumes from the Hunton Acquisition in June 2011 and the addition of new wells drilled during the past year. On a per boe basis, production expense decreased 7% to $7.78 per boe in 2012 from $8.39 per boe in 2011 due to the sale of the Northern Oklahoma assets that had a higher average production expense per boe than the Company’s average production costs and a general Company focus on cost control.
In 2011, production expense increased 62% to $16.9 million from $10.5 million in 2010 mainly due to increased volumes from the Hunton Acquisition in June 2011 and the addition of new wells drilled during 2011. On a per boe basis, production expenses increased 18% to $8.39 per boe in 2011 from $7.11 per boe in 2010 due to the initial high water volumes from newly completed wells during their early producing phase and the increased utilization of rental pumps in the older producing wells.
PRODUCTION TAXES
Production Taxes (in thousands of Canadian dollars except for percentages and per boe amounts)
| Year ended December 31 | ||||||||||||||||||||
| 2012 | Change | 2011 | Change | 2010 | ||||||||||||||||
| Production taxes |
3,754 | 13 | % | 3,312 | 26 | % | 2,639 | |||||||||||||
|
|
|
|
|
|
|
|
|
|
|
|||||||||||
| Production taxes per boe ($) |
1.43 | (13 | %) | 1.64 | (8 | %) | 1.79 | |||||||||||||
|
|
|
|
|
|
|
|
|
|
|
|||||||||||
In 2012, production taxes increased 13% to $3.8 million from $3.3 million in 2011 mainly due to the 30% increase in production. On a per boe basis, production taxes decreased to $1.43 per boe compared from $1.64 per boe due to the decrease in natural gas prices.
In 2011, production taxes increased 26% to $3.3 million from $2.6 million in 2010 mainly due to the 37% increase in production. On a per boe basis, production taxes decreased to $1.64 per boe compared from $1.79 per boe due to the decrease in natural gas prices.
GENERAL AND ADMINISTRATIVE EXPENSE EXCLUDING SHARE-BASED COMPENSATION
General and Administrative Expense (in thousands of Canadian dollars except for percentages and per boe amounts)
| Year ended December 31 | ||||||||||||||||||||
| 2012 | Change | 2011 | Change | 2010 | ||||||||||||||||
| Gross G&A expense |
10,124 | (6 | %) | 10,749 | (34 | %) | 16,253 | |||||||||||||
| Capitalized |
(748 | ) | 64 | % | (456 | ) | (3 | %) | (472 | ) | ||||||||||
| Recoveries |
(1,799 | ) | (1 | %) | (1,819 | ) | 12 | % | (1,628 | ) | ||||||||||
|
|
|
|
|
|
|
|
|
|
|
|||||||||||
| G&A expense |
7,577 | (11 | %) | 8,474 | (40 | %) | 14,153 | |||||||||||||
|
|
|
|
|
|
|
|
|
|
|
|||||||||||
| G&A expense per boe ($) |
2.88 | (31 | %) | 4.20 | (56 | %) | 9.62 | |||||||||||||
|
|
|
|
|
|
|
|
|
|
|
|||||||||||
In 2012, the general and administrative costs decreased 11% to $7.6 million from $8.5 million in 2011. The decrease in G&A costs was mainly due to higher costs in 2011 for legal fees related to court proceedings involving a former joint venture participant that ended in Q2 2011.
In 2011, the general and administrative costs decreased 40% to $8.5 million from $14.2 million in 2010. The decrease in G&A costs was mainly due to higher costs in 2010 for professional fees incurred relating to the conversion from a trust to a corporate entity and legal fees related to court proceedings involving a former joint venture participant that ended in Q2 2011.
42
Table of Contents
SHARE-BASED COMPENSATION EXPENSE
Share-Based Compensation Expense (in thousands of Canadian dollars except for percentages and per boe amounts)
| Year ended December 31 | ||||||||||||||||||||
| 2012 | Change | 2011 | Change | 2010 | ||||||||||||||||
| Share-based compensation expense |
3,568 | 43 | % | 2,501 | 13 | % | 2,217 | |||||||||||||
|
|
|
|
|
|
|
|
|
|
|
|||||||||||
| Share-based compensation expense per boe ($) |
1.36 | 10 | % | 1.24 | (18 | %) | 1.51 | |||||||||||||
|
|
|
|
|
|
|
|
|
|
|
|||||||||||
In 2012, the non-cash share-based compensation expense was $3.6 million which was 43% higher compared to $2.5 million in 2011. The increase in the share-based compensation was mainly due to the accelerated vesting and cancellation of restricted shares related to staff reductions as part of the discontinued operations in Canada which totaled $0.7 million ($0.27 per boe).
In 2011, the non-cash share-based compensation expense was $2.5 million which was 13% higher compared to $2.2 million in 2010. The increase in the share-based compensation was due to an employee retention initiative which resulted in a higher number of restricted shares and options outstanding during 2011 compared to 2010.
INTEREST EXPENSE
Interest Expense (in thousands of Canadian except for percentages and per boe amounts)
| Year ended December 31 | ||||||||||||||||||||
| 2012 | Change | 2011 | Change | 2010 | ||||||||||||||||
| Interest expense on long-term debt |
3,757 | (11 | %) | 4,222 | 161 | % | 1,616 | |||||||||||||
| Interest expense on convertible debentures |
3,038 | (57 | %) | 7,088 | 27 | % | 9,684 | |||||||||||||
|
|
|
|
|
|
|
|
|
|
|
|||||||||||
| Interest expense before allocation to discontinued operations |
6,795 | (40 | %) | 11,310 | 0 | % | 11,300 | |||||||||||||
| Interest expense allocated to discontinued operations (1) |
(883 | ) | (40 | %) | (1,470 | ) | 0 | % | (1,469 | ) | ||||||||||
|
|
|
|
|
|
|
|
|
|
|
|||||||||||
| Total interest expense of continuing operations |
5,912 | (40 | %) | 9,840 | 0 | % | 9,831 | |||||||||||||
|
|
|
|
|
|
|
|
|
|
|
|||||||||||
| Total interest expense per boe ($) |
2.25 | (54 | %) | 4.88 | (27 | %) | 6.68 | |||||||||||||
|
|
|
|
|
|
|
|
|
|
|
|||||||||||
| (1) | Interest expense allocated to discontinued operations was 13% of the total interest expense in accordance with EITF Issue No. 87-24. |
In 2012, interest expense was $5.9 million which was 40% lower than $9.8 million in 2011. The lower interest expense is mainly due to proceeds from the asset dispositions being used to pay down the bank credit facility and lower interest paid on the convertible debentures as an 8.25% debenture was redeemed in Q4 2011. During 2011, Equal re-structured its balance sheet by partially redeeming its convertible debentures which paid interest amounts of 8.0% and 8.25% and replacing these with lower interest paying 6.75% convertible debentures and the bank credit facility which also carries a lower interest rate.
43
Table of Contents
In 2011, interest expense was $9.8 million which was consistent with 2010. The lower cash interest expense on convertible debentures was offset by higher interest on the long-term debt due to a greater outstanding balance. Equal’s bank credit facility was undrawn at December 31, 2012 compared to $138.8 million at December 31, 2011. The bank credit facility was repaid with the proceeds of asset sales during 2012 which included the sales of all the Company’s Canadian assets and the assets in Northern Oklahoma.
The maturity date of Equal’s bank credit facility is June 2013 and should the lenders decide not to renew the facility, any amounts borrowed on the credit facility at that time must be repaid by June 2014. The bank credit facility was reviewed after the asset sales and was lowered to a total of $125.0 million from $200.0 million at the beginning of 2012 and is secured against the borrowing base of the Oklahoma assets.
DEPLETION AND DEPRECIATION (“D&D”)
Depletion and Depreciation (in thousands Canadian dollars except for percentages and per boe amounts)
| Year ended December 31 | ||||||||||||||||||||
| 2012 | Change | 2011 | Change | 2010 | ||||||||||||||||
| D&D |
22,888 | 53 | % | 14,936 | 250 | % | 4,262 | |||||||||||||
|
|
|
|
|
|
|
|
|
|
|
|||||||||||
| D&D per boe ($) |
8.70 | 17 | % | 7.41 | 156 | % | 2.90 | |||||||||||||
|
|
|
|
|
|
|
|
|
|
|
|||||||||||
In 2012, depletion and depreciation increased to $22.9 million from $14.9 million in 2011. The increase in depletion expense is due to the increase in production and the Hunton Acquisition in June 2011. The increase in D&D on a per boe basis is mainly due to the Hunton Acquisition in June 2011 and 2012 capital expenditures on wells drilled.
In 2011, depletion and depreciation increased to $14.9 million from $4.3 million in 2010. The increase in D&D expense is mainly due to the Hunton Acquisition in June 2011 and the increase in production. In years prior to 2010, the depletable base was significantly affected by ceiling test write-downs which decreased the oil and natural gas properties by $295.0 million ($177.2 million after tax). The increase in D&D on a per boe basis is mainly due to the Hunton Acquisition in June 2011 and 2011 capital expenditures on wells drilled.
AMORTIZATION OF DEFERRED CHARGES
In 2012, the amortization of deferred charges was $0.4 million compared to $1.9 million in 2011. The amortization of deferred charges relates to the initial fees for the issuance of the Company’s convertible debentures. The $0.4 million in 2012 are for the only outstanding 6.75% convertible debentures and the $1.8 million in 2011 was the remaining deferred charge for the 8.0% and 8.25% convertible debentures before they were redeemed.
In 2011, the amortization of deferred charges was $1.9 million compared to $1.2 million in 2010.
ACCRETION OF ASSET RETIREMENT OBLIGATION
In 2012, the accretion of the asset retirement obligation was $0.4 million compared to $0.2 million in 2011. The accretion expense in 2012 increased compared to 2011 mainly due to the change in management’s estimate which occurred in Q4 2011 which increased the asset retirement obligation and as a result, the accretion expense going forward.
In 2011 and 2010, the accretion of the asset retirement obligation was $0.2 million.
GAIN ON SALE OF ASSETS
In 2012, there was a gain on sale of assets of $36.0 million from the sale of Equal’s Northern Oklahoma assets. Equal sold 50% of its working interest in the Mississippian oil play in Northern Oklahoma for US$18.1 million on April 26, 2012 and the remaining Northern Oklahoma properties for US$40.0 million on September 24, 2012.
44
Table of Contents
There were no gains or losses on sales of assets in 2011 and 2010.
TRANSACTION COSTS ON ASSET ACQUISITION/DISPOSITIONS
In 2012, the transaction costs associated with the Northern Oklahoma sale totaled $0.7 million.
In 2011, the transaction costs associated with the Hunton Acquisition totaled $1.8 million.
There were no transaction costs during 2010.
FOREIGN EXCHANGE
In 2012, there was a foreign exchange gain of $3.2 million mainly due to the effect of the strengthening of the Canadian dollar against the U.S. dollar on the Company’s U.S. dollar denominated debt.
In 2011, there was a foreign exchange loss of $4.7 million mainly due to the effect of the weakening of the Canadian dollar against the U.S. dollar on the Company’s U.S. dollar denominated debt.
In 2010, there was a foreign exchange gain of $1.3 million mainly due to the effect of the strengthening of the Canadian dollar against the U.S. dollar on the Company’s U.S. dollar denominated debt.
TAXES
The tax expenses for the years 2012, 2011 and 2010 were $6.8 million, $10.8 million and $7.1 million, respectively.
DISCONTINUED OPERATIONS
On May 3, 2012, Equal announced that its Board of Directors initiated a strategic review process to identify, examine and consider alternatives with the view to enhancing shareholder value. As a result of the strategic review process, the Company completed the following asset sales from which the proceeds were used to pay down the Company’s outstanding bank debt:
| • | on September 24, 2012, the Northern Oklahoma assets were sold for total cash consideration of US$40.0 million to its Mississippian joint venture partner; |
| • | on October 15, 2012, the assets in the Halkirk, Wainwright, Alliance and Clair areas of Alberta sold for $15.4 million in addition with the transfer of substantially all of its non-producing, suspended and abandoned wells in Alberta; |
| • | on November 2, 2012, the assets in the Lochend Cardium were sold for $62.1 million; and |
| • | on December 13, 2012, the royalty and fee title lands in Western Canada were sold for $12.1 million. |
The three asset sales in Q4 2012 resulted in the discontinuation of operations in Canada.
The results from the discontinued operations added $30.7 million to the Company’s net income for 2012. This included a $56.8 million gain on sale of assets ($42.6 million net of income tax) and $6.6 million for advisory fees, legal fees, severance and termination of contracts related to the discontinuation of operations in Canada.
Discontinued operations had net income of $5.4 million in 2011 and a loss of $13.0 million in 2010.
In 2012, Equal spent $14.1 million to develop two Lochend Cardium oil wells, participate in associated infrastructure (gathering lines, batteries and gas plants) and support all other Canadian operations. One of the Cardium wells had new proved reserves of 114.6 Mboe and new probable reserves of 43.2 Mboe (each, net of royalties) and the other Cardium well converted 157.8 Mboe from proved undeveloped to proved developed (net of royalties).
Including a property sale of $8.3 million in Canada previous to the initiation of the Strategic Review, all Canadian assets were disposed for $97.9 million which included proved reserves of 2.9 MMboe (net of royalties).
45
Table of Contents
NET INCOME
In 2012, the Company had net income of $61.8 million which was higher than the $5.4 million in 2011 mainly due to the $36.0 million ($22.3 million net of tax) gain on sale of assets in Oklahoma and the $56.8 million ($42.6 million net of income tax) gain on sale of assets in Canada which was partially offset by decrease in revenues, increase in production expense and increase in depletion.
In 2011, the Company had net income of $5.4 million compared to a loss of $9.3 million in 2010 due to the increase in revenues from the Hunton Acquisition and decreased G&A which was partially offset by the increase in production expense, increase in depletion and the unrealized foreign exchange loss.
COMPREHENSIVE INCOME/LOSS
In 2012, the Company had comprehensive income of $56.7 million compared to comprehensive income $10.2 million in 2011. The difference between the net income and comprehensive income in 2012 is due to the negative foreign currency translation adjustment in 2012 of $5.1 million related to the Company’s investment in U.S. operations which fluctuates with the change in exchange rate between the Canadian and U.S. dollar.
In 2011, the Company had comprehensive income of $10.2 million compared to comprehensive loss of $15.9 million in 2010. The difference between the net income and comprehensive income in 2011 is due to the positive foreign currency translation adjustment in 2011 of $4.8 million related to the Company’s investment in U.S. operations which fluctuates with the change in exchange rate between the Canadian and U.S. dollar.
NON-GAAP FINANCIAL MEASURES
Management uses certain key performance indicators (“KPIs”) and industry benchmarks such as funds from operations, cash flow netback and working capital including long-term debt to analyze financial performance. Management feels that these KPIs and benchmarks are key measures of profitability and overall sustainability for Equal. These KPIs and benchmarks as presented do not have any standardized meanings prescribed by U.S. GAAP and therefore may not be comparable with the calculation of similar measures presented by other entities.
Funds from Operations
The Company considers funds from operations a key measure for the ability of the Company to repay debt and to fund future growth through capital investment. Funds from operations, as presented, is not intended to represent cash provided by operating activities nor should it be viewed as an alternative to cash provided by operating activities or other measures of financial performance calculated in accordance with U.S. GAAP. All references to funds from operations throughout this MD&A are based on cash provided by operating activities as reconciled in the table below:
Funds from Operations (in thousands of Canadian dollars)
| Year ended December 31 | ||||||||||||
| 2012 | 2011 | 2010 | ||||||||||
| Cash provided by operations activities – continuing operations |
27,584 | 29,138 | 6,504 | |||||||||
| Changes in operating assets and liabilities |
||||||||||||
| Accounts receivable |
(3,899 | ) | 6,708 | 8,691 | ||||||||
| Prepaid expenses and other current assets |
386 | (983 | ) | 460 | ||||||||
| Accounts payable and accrued liabilities |
5,931 | (2,908 | ) | 3,965 | ||||||||
|
|
|
|
|
|
|
|||||||
| Funds from operations |
30,002 | 31,955 | 19,620 | |||||||||
|
|
|
|
|
|
|
|||||||
46
Table of Contents
Funds from operations decreased by 6% to $30.0 million in 2012 compared to $32.0 million in 2011 due to the decrease in revenues and increase in production expense which were partially offset by the decrease in interest expense. The decrease in revenues is attributed to the decreased prices received for NGLs and natural gas and the increase in production expense is mainly due to the increase in production volumes. The decrease in interest expense is mainly due to proceeds from the asset dispositions being used to pay down the bank credit facility and lower interest paid on the convertible debentures as an 8.25% debenture was redeemed in Q4 2011.
Funds from operations increased by 63% to $32.0 million in 2011 compared to $19.6 million in 2010 due to the increase in revenues and decrease in G&A expense which were partially offset by the increase in production expense. The increase in revenues is mainly due to the Hunton Acquisition in June 2011 and the decrease in G&A expense is mainly due to the legal proceedings with a former joint venture participant that ended in Q2 2011. The increase in production expense is mainly due to the increase in production volumes.
Cash Flow Netback
Management uses cash flow netback to analyze the profitability of its operations. Cash flow netback, as presented, is not intended to represent an alternative to net income (loss) or other measures of financial performance calculated in accordance with GAAP. All references to cash flow netback throughout this MD&A are based on the reconciliation in the following table:
Cash Flow Netback (in thousands of Canadian dollars, except for volume and per boe amounts)
| Year ended December 31 | ||||||||||||
| 2012 | 2011 | 2010 | ||||||||||
| NGL, natural gas and oil revenues |
61,478 | 70,512 | 51,206 | |||||||||
| Cash settlements on commodity contracts |
6,063 | 2,375 | 4,121 | |||||||||
| Production expense |
(20,457 | ) | (16,908 | ) | (10,462 | ) | ||||||
| Production taxes |
(3,754 | ) | (3,312 | ) | (2,639 | ) | ||||||
| General and administrative expense |
(7,577 | ) | (8,474 | ) | (14,153 | ) | ||||||
| Interest expense |
(5,912 | ) | (9,840 | ) | (9,831 | ) | ||||||
| Realized foreign exchange |
207 | (240 | ) | 1,673 | ||||||||
| Other |
(46 | ) | (391 | ) | (295 | ) | ||||||
|
|
|
|
|
|
|
|||||||
| Cash flow netback |
30,002 | 33,722 | 19,620 | |||||||||
| Total production volume (Mboe) |
2,630 | 2,016 | 1,471 | |||||||||
|
|
|
|
|
|
|
|||||||
| Cash flow netback (non-GAAP) ($ per boe) |
11.41 | 16.73 | 13.34 | |||||||||
|
|
|
|
|
|
|
|||||||
Cash flow netback decreased 32% to $11.41 per boe in 2012 compared to $16.73 per boe in 2011 mainly due to the 29% decrease in revenues to $25.68 per boe in 2012 compared to $36.16 per boe in 2011 as a result of the decrease in prices for NGLs and natural gas. The decreases in revenues on a per boe basis was partially offset by the per boe decreases in production expense, production taxes, G&A and interest expense.
Cash flow netback increased 25% to $16.73 per boe in 2011 compared to $13.34 per boe in 2010 mainly due to the per boe decreases G&A and interest expense which were partially offset by per boe decreases in revenues and increases in production expenses.
47
Table of Contents
Working Capital (Deficit) including Long-term Debt
| Working Capital (Deficit) including Long-term Debt (in thousands of Canadian dollars) |
December 31, 2012 | December 31, 2011 | ||||||
| Cash |
22,969 | 5,553 | ||||||
| Accounts receivable |
15,524 | 19,742 | ||||||
| Prepaid expenses, deposits and other |
926 | 552 | ||||||
| Accounts payable and accrued liabilities |
(8,600 | ) | (14,673 | ) | ||||
| Accounts receivable – discontinued operations |
1,463 | 5,432 | ||||||
| Prepaid expenses, deposits and other – discontinued operations |
130 | 318 | ||||||
| Accounts payable and accrued liabilities – discontinued operations |
(5,810 | ) | (9,566 | ) | ||||
|
|
|
|
|
|||||
| Working capital |
26,602 | 7,358 | ||||||
| Long-term debt |
— | (138,820 | ) | |||||
|
|
|
|
|
|||||
| Working capital (deficit) including long-term debt |
26,602 | (131,462 | ) | |||||
|
|
|
|
|
|||||
The working capital including long-term debt at December 31, 2012 was $26.6 million which was higher compared to a working capital deficit including long-term debt at December 31, 2011 of $131.5 million. The increase in working capital is mainly attributed to surplus cash from the asset sales during the year which totaled Cdn$97.9 million and US$58.1 million from which proceeds exceeded amounts required to repay the outstanding long-term debt.
CAPITAL EXPENDITURES
Capital Expenditures (in thousands of Canadian dollars)
| Year ended December 31 | ||||||||||||
| 2012 | 2011 | 2010 | ||||||||||
| Property, plant and equipment expenditures (1) |
24,480 | 32,900 | 13,207 | |||||||||
| Hunton Acquisition (2) |
— | 91,656 | — | |||||||||
| Dispositions (1) |
(63,925 | ) | — | — | ||||||||
|
|
|
|
|
|
|
|||||||
| Total |
(39,445 | ) | 124,556 | 13,207 | ||||||||
|
|
|
|
|
|
|
|||||||
| (1) | Includes the settlement of $5.2 million (US$5.2 million) in payables to Atlas as part of the Mississippian Sales in 2012. |
| (2) | Includes the settlement of $5.6 million (US$5.8 million) in receivables from JV Participant in 2011. |
During the year ended December 31, 2012, expenditures in the U.S. totaled $24.5 million and proceeds from dispositions totaled $63.9 million. The major components of these expenditures include:
| • | $19.2 million related to wells, drilling and workovers; |
| • | $2.9 million on capital enhancements; |
| • | $1.6 million on acquisitions of land for future development in Oklahoma; and |
| • | $0.8 million related to the capitalization of certain G&A costs attributable to exploration and development activities. |
48
Table of Contents
In two separate transactions on April 26, 2012 and September 24, 2012, the Company sold its Northern Oklahoma assets to its Mississippian joint venture partner for total cash proceeds of US$58.1 million and the settlement of US$5.2 million in payables owed to the joint venture partner.
During 2012, the Company drilled a total of 9 (7.2 net) wells in Oklahoma. Of the 9 wells drilled in Oklahoma, 6 (4.5 net) wells were sold to Atlas on September 24, 2012 as part of the asset disposition in Northern Oklahoma.
BUSINESS RISKS
The disclosures under this heading should be read in conjunction with Note 10 to the consolidated financial statements.
In the current volatile economic and financial market conditions, Equal continually assesses its risks and manages those risks to the best of its abilities. Equal is exposed to normal market risks inherent in the oil and natural gas business, including but not limited to exploration, development and production risks, volatility of commodity prices, capital risks, funding risks, risks associated with reserves, foreign currency risks, interest rate risks, acquisitions, environmental risks and liquidity risks. From time to time, Equal attempts to mitigate its exposure to these risks by using commodity hedging contracts and by other means. These risks are described in more detail in Equal’s annual filings with securities regulatory authorities.
Exploration, Development and Production Risks
Oil and natural gas operations involve many risks that even a combination of experience, knowledge and careful evaluation may not be able to overcome. The long-term commercial success of the Company depends on its ability to find, acquire, develop and commercially produce oil and natural gas reserves. Without the continual addition of new reserves, any existing reserves the Company may have at any particular time, and the production therefrom will decline over time as such existing reserves are exploited. A future increase in the Company’s reserves will depend not only on its ability to explore and develop any properties it may have from time to time, but also on its ability to select and acquire suitable producing properties or prospects. No assurance can be given that the Company will be able to continue to locate satisfactory properties for acquisition or participation. Moreover, if such acquisitions or participations are identified, management of the Company may determine that current markets, terms of acquisition and participation or pricing conditions make such acquisitions or participations uneconomic. There is no assurance that further commercial quantities of oil and natural gas will be discovered or acquired by the Company.
Future oil and natural gas exploration may involve unprofitable efforts, not only from dry wells, but also from wells that are productive but do not produce sufficient petroleum substances to return a profit after drilling, operating and other costs. Completion of a well does not assure a profit on the investment or recovery of drilling, completion and operating costs. In addition, drilling hazards or environmental damage could greatly increase the cost of operations, and various field operating conditions may adversely affect the production from successful wells. These conditions include delays in obtaining governmental approvals or consents, shut-ins of connected wells resulting from extreme weather conditions, insufficient storage or transportation capacity or other geological and mechanical conditions. While diligent well supervision and effective maintenance operations can contribute to maximizing production rates over time, production delays and declines from normal field operating conditions cannot be eliminated and can be expected to adversely affect revenue and cash flow levels to varying degrees.
Oil and natural gas exploration, development and production operations are subject to all the risks and hazards typically associated with such operations, including hazards such as fire, explosion, blowouts, cratering, sour gas releases and spills, each of which could result in substantial damage to oil and natural gas wells, production facilities, other property and the environment or personal injury. In particular, the Company may explore for and produce sour natural gas in certain areas. An unintentional leak of sour natural gas could result in personal injury, loss of life or damage to property and may necessitate an evacuation of populated areas, all of which could result in liability to the Company. In accordance with industry practice, the Company is not fully insured against all of these risks, nor are all such risks insurable. Although the Company maintains liability insurance in an amount that it considers consistent with industry practice, the nature of these risks is such that liabilities could exceed policy limits, in which event the Company could incur significant costs that could have a material adverse effect upon its financial condition. Oil and natural gas production operations are also subject to all the risks typically associated with such operations, including encountering unexpected formations or pressures, premature decline of reservoirs and the invasion of water into producing formations. Losses resulting from the occurrence of any of these risks could have a material adverse effect on the Company.
49
Table of Contents
Oil, Gas and NGL Prices are Volatile
The marketability and price of oil and natural gas that may be acquired or discovered by Equal Energy is and will continue to be affected by numerous factors beyond its control. The Company’s ability to market its oil and natural gas may depend upon its ability to acquire space on pipelines that deliver natural gas to commercial markets. The Company may also be affected by deliverability uncertainties related to the proximity of its reserves to pipelines and processing and storage facilities and operational problems affecting such pipelines and facilities as well as extensive government regulation relating to price, taxes, royalties, land tenure, allowable production, the export of oil and natural gas and many other aspects of the oil and natural gas business.
Equal Energy’s revenues, profitability and future growth and the carrying value of its oil and gas properties are substantially dependent on prevailing prices of oil and gas. The Company’s ability to borrow and to obtain additional capital on attractive terms is also substantially dependent upon oil and gas prices. Prices for oil and gas are subject to large fluctuations in response to relatively minor changes in the supply of and demand for oil and gas, market uncertainty and a variety of additional factors beyond the control of the Company. These factors include economic conditions, in the United States, Canada, the actions of the OPEC and Russia, governmental regulation, political stability in the Middle East and elsewhere, the foreign supply of oil and gas, the price of foreign imports and the availability of alternative fuel sources. Any substantial and extended decline in the price of oil and gas would have an adverse effect on the Company’s carrying value of its proved reserves, borrowing capacity, revenues, profitability and cash flows from operations.
Volatile oil and gas prices make it difficult to estimate the value of producing properties for acquisition and often cause disruption in the market for oil and gas producing properties, as buyers and sellers have difficulty agreeing on such value. Price volatility also makes it difficult to budget for and project the return on acquisitions and development and exploitation projects.
In addition, bank borrowings available to Equal Energy are in part determined by the Company’s borrowing base. A sustained material decline in prices from historical average prices could reduce the Company’s borrowing base, therefore reducing the bank credit available to the Company which could require that a portion, or all, of the Company’s bank debt be repaid.
Substantial Capital Requirements
Equal Energy anticipates making substantial capital expenditures for the acquisition, exploration, development and production of oil and natural gas reserves in the future. If the Company’s revenues or reserves decline, it may limit Equal Energy’s ability to expend or access the capital necessary to undertake or complete future drilling programs. There can be no assurance that debt or equity financing or cash generated by operations will be available or sufficient to meet these requirements or for other corporate purposes or, if debt or equity financing is available, that it will be on terms acceptable to the Company. The inability of the Company to access sufficient capital for its operations could have a material adverse effect on the Company’s financial condition, results of operations or prospects.
Capital Markets
The market events and conditions witnessed over the past three years, including disruptions in the international credit markets and other financial systems and the deterioration of global economic conditions, have caused significant volatility in commodity prices and increases in the rates at which Equal Energy is able to borrow funds for its capital programs. While there have been recent signs which may suggest the beginning of a global economic recovery, there can be no certainty regarding the timing or extent of a potential recovery, and such continued uncertainty in the global economic situation means that the Company, along with all other oil and gas entities, may continue to face restricted access to capital and increased borrowing costs. This could have an adverse effect on the Company, as its ability to make future capital expenditures is dependent on, among other factors, the overall state of the capital markets and investor appetite for investments in the energy industry generally and the Company’s securities in particular.
50
Table of Contents
Additional Funding Requirements
Equal Energy’s cash flow from its producing reserves may not be sufficient to fund its ongoing activities at all times. From time to time, the Company may require additional financing in order to carry out its acquisition, exploration and development activities. Failure to obtain such financing on a timely basis could cause the Company to forfeit its interest in certain properties, miss certain acquisition opportunities and reduce or terminate its operations. If the Company’s revenues from its reserves decrease as a result of lower oil and natural gas prices or otherwise, it will affect the Company’s ability to expend the necessary capital to replace its reserves or to maintain its production. If the Company’s cash flow from operations is not sufficient to satisfy its capital expenditure requirements, there can be no assurance that additional debt or equity financing will be available to meet these requirements or available on favorable terms.
Issuance of Debt
From time to time Equal Energy may enter into transactions to acquire assets or the shares of other corporations. These transactions may be financed partially or wholly with debt, which may increase the Company’s debt levels above industry standards for oil and natural gas companies of similar size. Depending on future exploration and development plans, the Company may require additional debt financing that may not be available or, if available, may not be available on favourable terms. Neither the articles of the Company nor its by-laws limit the amount of indebtedness that the Company may incur. The level of the Company’s indebtedness from time to time, could impair its ability to obtain additional financing on a timely basis to take advantage of business opportunities that may arise and could negatively affect the Company’s debt ratings. This in turn, could have a material adverse effect on the Company’s business, financial condition, results of operations and cash flow.
Reserve Estimates
The reserves information contained in Equal’s independent reserve evaluations are estimates. The actual production and ultimate reserves from the properties may be greater or less than the estimates prepared by the independent reserve evaluators. The reserve reports were prepared using certain commodity price assumptions. If lower prices for oil, NGLs and natural gas are realized by Equal and substituted for the price assumptions utilized in those reserve reports, the present value of estimated future net cash flows for Equal’s reserves as well as the amount of Equal’s reserves would be reduced and the reduction could be significant.
Foreign Currency Rates
The price that Equal Energy receives for a majority of its oil and natural gas is based on United States dollar denominated benchmarks and therefore the revenue recorded in Canadian dollars is affected by the exchange rate between the two currencies. A material increase in the value of the Canadian dollar relative to the United States dollar, may negatively impact the Company’s net production revenue by decreasing the Canadian dollar revenue recorded in the financial statements. Equal conducts its business and operations in the United States and is therefore exposed to foreign currency risk on both revenues and costs to the extent the value of the Canadian dollar decreases relative to the United States dollar.
Interest Rates
Interest rate risk arises from changes in market interest rates that may affect the fair value of future cash flows from the Company’s financial instruments. Equal has a floating interest rate for its long-term debt and fixed interest rate for its convertible debentures.
Acquisitions
The price paid for acquisitions is based on engineering and economic estimates of the potential reserves made by independent engineers modified to reflect the technical views of management. These assessments include a number of material assumptions regarding such factors as recoverability and marketability of oil, NGLs and natural gas, future prices of oil, NGLs and natural gas and operating costs, future capital expenditures and royalties and other government levies that will be imposed over the producing life of the reserves. Many of these factors are subject to change and are beyond the control of the operators of the working interests, management and Equal. In particular, changes in the prices of and markets for oil, NGLs and natural gas from those anticipated at the time of making such assessments will affect the value of the shares. In addition, all such estimates involve a measure of geological and engineering uncertainty that could result in lower production and reserves than attributed to the working interests. Actual reserves could vary materially from these estimates. Consequently, the reserves acquired may be less than expected, which could adversely impact cash flows and distributions to shareholders.
51
Table of Contents
Environmental
All phases of the oil and natural gas business present environmental risks and hazards and are subject to environmental regulation pursuant to a variety of international conventions and international, national, provincial, state and local law and regulation. Environmental legislation provides for, among other things, restrictions and prohibitions on spills, releases or emissions of various substances produced in association with oil and gas operations. The legislation also requires that wells and facility sites be operated, maintained, abandoned and reclaimed to the satisfaction of applicable regulatory authorities. Compliance with such legislation can require significant expenditures and a breach of same can result in the imposition of clean-up orders, fines and/or penalties, some of which may be material, as well as possible forfeiture of requisite approval obtained from the various governmental authorities. The discharge of green house gas (“GHG”) emissions and other pollutants into the air, soil or water may give rise to liabilities to governments and third parties and may require the Company to incur costs to remedy such discharge. Although the Company believes that it is in material compliance with current applicable environmental regulations, no assurance can be given that environmental laws will not result in a curtailment of production or a material increase in the costs of production, development or exploration activities or otherwise adversely affect its financial condition, results of operations or prospects.
Liquidity Risk
Liquidity risk is the risk that Equal is unable to meet its financial liabilities as they come due. Management utilizes a long-term financial and capital forecasting program that includes continuous review of debt forecasts to ensure credit facilities are sufficient relative to forecast debt levels, capital program levels are appropriate and financial covenants will be met. In the short term, liquidity is managed through daily cash management activities, short-term financing strategies and the use of commodity hedging contracts to increase the predictability of cash flow from operating activities. Additional information on specific instruments is discussed in the “Commodity Contracts” section, “Liquidity and Capital Resources” section and in Note 10 to the consolidated financial statements.
Commitments
As of December 31, 2012, Equal has commitments for the following payments:
Commitments & Obligations (in thousands of Canadian dollars)
| 2013 | 2014 | 2015 | 2016 | 2017 and past |
Total | |||||||||||||||||||
| Long-term debt (1) |
— | — | — | — | — | — | ||||||||||||||||||
| Interest on long-term debt (2) |
625 | 313 | — | — | — | 938 | ||||||||||||||||||
| Convertible debentures (3) |
— | — | — | 45,000 | — | 45,000 | ||||||||||||||||||
| Interest on convertible debentures (3) |
3,038 | 3,038 | 3,038 | 759 | — | 9,873 | ||||||||||||||||||
| Accounts payable & accrued liabilities |
8,600 | — | — | — | — | 8,600 | ||||||||||||||||||
| Office leases |
985 | 995 | 1,007 | 763 | — | 3,750 | ||||||||||||||||||
| Vehicle leases |
150 | 133 | 72 | 44 | — | 399 | ||||||||||||||||||
| Liabilities from discontinued operations |
5,840 | — | — | — | 783 | 6,623 | ||||||||||||||||||
|
|
|
|
|
|
|
|
|
|
|
|
|
|||||||||||||
| Total |
19,238 | 4,479 | 4,117 | 46,566 | 783 | 75,183 | ||||||||||||||||||
|
|
|
|
|
|
|
|
|
|
|
|
|
|||||||||||||
| (1) | The bank credit facility was undrawn as of December 31, 2012. If the bank credit facility is not renewed in June 2013, any outstanding balance is to be paid by June 2014. |
| (2) | Interest is based on the standby-charge of 0.5% for the unused balance of the bank credit facility. |
| (3) | The convertible debentures bear interest at 6.75% per annum and mature March 31, 2016. |
52
Table of Contents
LIQUIDITY & CAPITAL RESOURCES
Development activities and acquisitions may be funded internally through cash flow or through external sources such as debt or the issuance of equity. The Company finances its operations and capital activities primarily with funds generated from operating activities, but also through the issuance of shares, debentures and borrowing from its credit facility. The Company believes its sources of cash, including bank debt and funds from operations, will be sufficient to fund its operations and anticipated capital expenditure program in 2013. Equal’s ability to fund its operations will also depend on operating performance and is subject to commodity prices and other economic conditions which may be beyond its control. The Company will monitor commodity prices and adjust the 2013 capital expenditure program to stay within its means. The Company operates all of its drilling programs and as a result, can control the pace and targets of its capital spending to react quickly to changes in cash flow to ensure ongoing financial flexibility.
Equal’s capital structure at December 31, 2012 is as follows:
| Capitalization (in thousands of Canadian dollars except percentages) |
December 31, 2012 | |||||||
| Amount | % | |||||||
| Working capital surplus (1) |
(26,602 | ) | (21 | %) | ||||
| Convertible debentures |
45,000 | 35 | % | |||||
| Shares issued, at market (2) |
108,498 | 86 | % | |||||
|
|
|
|
|
|||||
| Total capitalization |
126,896 | 100 | % | |||||
|
|
|
|
|
|||||
| (1) | Refer to Non-GAAP Financial Measures for more information. |
| (2) | The market price of Equal’s shares on December 31, 2012 was $3.08 per share. |
Cash Flow from Operating, Investing and Financing Activities (in thousands of Canadian dollars)
| Year ended December 31 | ||||||||||||
| 2012 | 2011 | 2010 | ||||||||||
| Cash provided by operating activities – continuing operations |
27,584 | 29,138 | 6,504 | |||||||||
| Cash provided by operating activities – discontinued operations |
7,211 | 27,141 | 27,932 | |||||||||
|
|
|
|
|
|
|
|||||||
| Cash provided by operating activities |
34,795 | 56,279 | 34,436 | |||||||||
|
|
|
|
|
|
|
|||||||
| Cash provided by (used in) investing activities – continuing operations |
37,124 | (116,933 | ) | (10,517 | ) | |||||||
| Cash provided by (used in) investing activities – discontinued operations |
80,646 | (12,972 | ) | (32,197 | ) | |||||||
|
|
|
|
|
|
|
|||||||
| Cash provided by (used in) investing activities |
117,770 | (129,905 | ) | (42,714 | ) | |||||||
|
|
|
|
|
|
|
|||||||
| Cash provided by (used in) financing activities |
(135,066 | ) | 76,612 | (8,071 | ) | |||||||
|
|
|
|
|
|
|
|||||||
In 2012, cash provided by operating activities has decreased to $34.8 million from $56.3 million in 2011 mainly due to the asset disposition in Q4 2011. In 2012, cash provided by investing activities was $117.8 million due to the asset sales in Canada and Oklahoma compared to the cash used in investing activities in 2011 for capital expenditures. In 2012, the cash used in financing activities was $135.1 million due to the repayment of the bank credit facility using proceeds from the asset sales which occurred during 2012.
53
Table of Contents
In 2011, cash provided by operating activities has increased to $56.3 million from $34.4 million in 2010 mainly due to the Hunton acquisition in June 2011. In 2011, cash used in investing activities was $129.9 million from capital expenditures compared to $47.7 million in 2010. In 2011, the cash provided by financing activities was $76.6 million due to the drawdown of the bank credit facility to redeem the 8.0% convertible debentures.
Long-term Debt
Long-term debt is represented by the amounts drawn on the bank credit facility. At December 31, 2012, Equal did not have any outstanding long-term debt as the Company repaid the outstanding bank credit facility with the proceeds of the sales during 2012. As a result of the asset dispositions, the bank credit facility was reduced from a maximum of $200.0 million to $125.0 million which is secured against the borrowing base of the Oklahoma assets.
Equal monitors capital using an interest coverage ratio that has been externally imposed as part of the credit agreement. Equal is required to maintain an interest coverage ratio greater than 3.00 to 1.00; this ratio is calculated as follows:
| As at | ||||||||
| (in thousands of Canadian dollars except for ratios) |
December 31, 2012 |
December 31, 2011 |
||||||
| Interest coverage (1): |
||||||||
| Cash flow over the prior four quarters |
36,135 | 69,246 | ||||||
| Interest expenses over the prior four quarters (2) |
6,795 | 11,338 | ||||||
|
|
|
|
|
|||||
| Interest coverage ratio |
5.32 : 1.00 | 6.11 : 1.00 | ||||||
|
|
|
|
|
|||||
| (1) | These amounts are defined terms within the credit agreements. |
| (2) | The interest expense is the gross amount before the deduction of the amount allocated to discontinued operations. |
Working Capital
The working capital at December 31, 2012 was $26.6 million which increased compared to working capital at December 31, 2011 of $7.4 million. The increase in working capital is mainly attributed to the asset sales during the year which totaled Cdn$97.9 million and US$58.1 million from which proceeds were used to repay the outstanding long-term debt.
| Working Capital (in thousands of Canadian dollars) |
December 31, 2012 |
December 31, 2011 |
||||||
| Cash |
22,969 | 5,553 | ||||||
| Accounts receivable |
15,524 | 19,742 | ||||||
| Prepaid expenses, deposits and other |
926 | 552 | ||||||
| Accounts payable and accrued liabilities |
(8,600 | ) | (14,673 | ) | ||||
| Accounts receivable – discontinued operations |
1,463 | 5,432 | ||||||
| Prepaid expenses, deposits and other – discontinued operations |
130 | 318 | ||||||
| Accounts payable and accrued liabilities – discontinued operations |
(5,810 | ) | (9,566 | ) | ||||
|
|
|
|
|
|||||
| Working capital |
26,602 | 7,358 | ||||||
| Long-term debt |
— | (138,820 | ) | |||||
|
|
|
|
|
|||||
| Working capital including long-term debt |
26,602 | (131,462 | ) | |||||
|
|
|
|
|
|||||
54
Table of Contents
Convertible Debentures
As at December 31, 2012 and 2011, Equal had $45.0 million of 6.75% convertible debentures (EQU.DB.B) outstanding. The 6.75% convertible debentures have the conversion price of $9.00 per share. Each $1,000 principal amount of EQU.DB.B debentures is convertible into approximately 111.11 Equal shares and mature on March 31, 2016.
EQUITY INFORMATION
Equal is capitalized through a combination of shares and convertible debt. Equal also has a share option plan and restricted share plan.
The following table outlines the outstanding equity instruments:
| Outstanding Equity Data as at |
March 13, 2013 | December 31, 2012 | December 31, 2011 | |||||||||
| Shares |
35,562,967 | 35,226,526 | 34,779,435 | |||||||||
| Share options |
596,459 | 734,537 | 1,303,495 | |||||||||
| Restricted shares |
820,014 | 1,220,489 | 946,285 | |||||||||
| 6.75% Convertible debentures ($1,000 per debenture) |
45,000 | 45,000 | 45,000 | |||||||||
OUTLOOK
As a part of the of the Strategic Review, the Canadian operations and Northern Oklahoma operations were sold so that Equal could focus on a single asset base in Central Oklahoma, the liquids-rich natural gas Hunton formation. Equal will continue to operate its Central Oklahoma assets consisting of approximately 6,400 boe per day of liquids-rich natural gas where it’s had strong historical drilling success. The Company has identified a strong inventory of future drilling locations and has a staff of experienced people in Oklahoma managing these assets. Management believes that in addition to successful drilling, there is significant additional upside from natural gas and NGL commodity price recovery.
The Company has re-commenced drilling in the Hunton during 2013 and plans to drill up to 10 wells as part of the 2013 capital budget of $36.0 million that was approved by the board; which includes $30.0 million for drilling and related infrastructure and $6.0 million for land and maintenance capital.
As a result of the asset sales, the Company has strengthened the balance sheet and re-paid all of the outstanding debt on its bank credit facility and has surplus cash remaining to exit 2012 with a working capital balance of $26.6 million. With the strong balance sheet and projected cash flows, Equal will pay a USD$0.20 per share annual dividend, beginning on January 1, 2013 and payable at the end of each calendar quarter.
ENVIRONMENTAL AND CLIMATE CHANGE RISK
The oil and gas industry has a number of environmental risks and hazards and is subject to regulation by all levels of government. Environmental legislation includes, but is not limited to, operational controls, final site restoration requirements and increasing restrictions on emissions of various substances produced in association with oil and natural gas operations. Compliance with such legislation could require additional expenditures and a failure to comply may result in fines and penalties which could, in the aggregate, become material.
55
Table of Contents
DISCLOSURE CONTROLS AND PROCEDURES
As of December 31, 2012, an internal evaluation was carried out of the effectiveness of Equal’s disclosure controls and procedures as defined in Rule 13a-15 under the US Securities Exchange Act of 1934 and as defined in Canada by National Instrument 52-109, Certification of Disclosure in Issuers’ Annual and Interim Filings. Based on that evaluation, the President and Chief Executive Officer and the Chief Financial Officer concluded that the disclosure controls and procedures are effective to ensure that the information required to be disclosed in the reports that Equal files or submits under the Exchange Act or under Canadian Securities legislation is recorded, processed, summarized and reported, within the time periods specified in the rules and forms therein. Disclosure controls and procedures include, without limitation, controls and procedures designed to ensure that the information required to be disclosed by Equal in the reports that it files or submits under the Exchange Act or under Canadian Securities Legislation is accumulated and communicated to Equal’s management, including the senior executive and financial officers, as appropriate to allow timely decisions regarding the required disclosure.
INTERNAL CONTROL OVER FINANCIAL REPORTING
Internal control over financial reporting is a process designed to provide reasonable assurance that all assets are safeguarded, transactions are appropriately authorized and to facilitate the preparation of relevant, reliable and timely information. Because of its inherent limitations, internal control over financial reporting may not prevent or detect misstatements. Management has assessed the effectiveness of Equal’s internal control over financial reporting as defined in Rule 13a-15 under the US Securities Exchange Act of 1934 and as defined in Canada by National Instrument 52-109, Certification of Disclosure in Issuers’ Annual and Interim Filings. The assessment was based on the framework in Internal Control – Integrated Framework issued by the Committee of Sponsoring Organizations of the Treadway Commission (“COSO”). Management concluded that Equal’s internal control over financial reporting was effective as of December 31, 2012. The effectiveness of Equal’s internal control over financial reporting as of December 31, 2012 has been audited by KPMG LLP, an independent registered public accounting firm. No changes were made to Equal’s internal control over financial reporting during the year ending December 31, 2012, that have materially affected, or are reasonably likely to materially affect, the internal controls over financial reporting.
CHANGES IN ACCOUNTING POLICIES
As required by Rule 3b-4(c) of the United States Securities Exchange Act of 1934, as amended, and Rule 405 of the United States Securities Act of 1933, as amended, Equal has adopted U.S. GAAP financial reporting starting with the reporting of the quarter ended December 31, 2012. The Company no longer qualifies as a foreign private issuer as it did not meet certain conditions and, therefore, must follow the requirements of a U.S. domestic filer which includes financial reporting in accordance with U.S. GAAP.
Recently Issued Accounting Pronouncements
In December 2011, the FASB issued ASU 2011-11, “Balance Sheet – Disclosure about Offsetting Assets and Liabilities (Topic 210).” The update requires an entity to disclose information about offsetting assets and liabilities and related arrangements to enable users of its financial statements to understand the effect of those arrangements on its financial position. This ASU is effective for fiscal years, and interim periods within those fiscal years, beginning after January 1, 2013. The implementation of this update is not expected to materially impact the Company’s disclosure.
CRITICAL ACCOUNTING ESTIMATES
Equal has continuously evolved and documented its management and internal reporting systems to provide assurance that accurate, timely internal and external information is gathered and disseminated.
Equal’s financial and operating results incorporate certain estimates including:
| • | estimated revenues, royalties and operating costs on production as at a specific reporting date but for which actual revenues and costs have not yet been received; |
| • | estimated capital projects that are in progress; |
| • | estimated depletion and depreciation that are based on estimates of oil, NGL and natural gas reserves and useful lives of equipment; |
| • | estimated future recoverable value of property, plant and equipment that are based on estimates of oil, NGL and natural gas reserves that Equal expects to recover in the future; |
| • | estimated value of assert retirement obligations that are dependent upon estimates of future costs and timing of expenditures; |
56
Table of Contents
| • | estimated fair values of derivative contracts that are subject to fluctuation depending upon the underlying commodity prices; |
| • | estimated expenses from Equal’s share-based compensation plans that are based on pricing models such as the Black-Scholes model; and |
| • | estimated deferred income taxes which are dependent upon tax interpretations, regulations and legislation in various jurisdictions in which the Company operates that are subject to change. |
Equal has hired individuals and consultants who have the skills required to make such estimates and ensures that individuals or departments with the most knowledge of the activity are responsible for the estimates. Further, past estimates are reviewed and compared to actual results, and actual results are compared to budgets in order to make more informed decisions on future estimates.
The Equal leadership team’s mandate includes ongoing development of procedures, standards and systems to allow Equal staff to make the best decisions possible and ensuring those decisions are in compliance with Equal’s environmental, health and safety policies.
ADDITIONAL INFORMATION
Additional information relating to Equal Energy Ltd. can be found on SEDAR at www.sedar.com, on EDGAR at www.sec.gov/edgar.shtml, as well as on the website at www.equalenergy.ca.
Item 7A. Quantitative and Qualitative Disclosures About Market Risk
General
This discussion provides information about the financial instruments Equal uses to manage commodity price volatility. All contracts are settled in cash and do not require the actual delivery of a commodity at settlement.
Commodity Price Risk. Equal’s most significant market risk relates to the prices it receives for its natural gas and NGL production. Oil represents only 2% of total production so volatility of oil prices has a small affect. Due to the historical price volatility of these commodities, Equal periodically has entered into natural gas and oil derivative arrangements, and expects in the future to enter into, derivative arrangements for the purpose of reducing the variability of natural gas and NGL prices Equal receives for its production. The Company’s credit facility limits its ability to enter into derivative transactions for a maximum term of 3 years and up to 65% of expected production volumes.
The Company uses, and may continue to use, a variety of commodity-based derivative contracts, including fixed price swaps, collars and basis swaps. At December 31, 2012, the Company’s commodity derivative contracts consisted of fixed price swaps and basis swaps for natural gas and a fixed price swap for oil, which are described below:
| Fixed price swaps | The Company receives a fixed price for the contract and pays a floating market price to the counterparty over a specified period for a contracted volume. | |
| Basis swaps | The Company receives a payment from the counterparty if the settled price differential is greater than the stated terms of the contract and pays the counterparty if the settled price differential is less than the stated terms of the contract, which guarantees the Company a price differential for oil and natural gas from a specified delivery point. | |
The Company’s natural gas fixed price swap transactions are settled based upon NYMEX prices, and the Company’s natural gas basis swap transactions are settled based upon the index price of natural gas at the Southern Star pipeline delivery point in Oklahoma compared to NYMEX prices. The Company’s natural gas contracts are settled based upon the NYMEX prices on the penultimate commodity business day for the relevant contract. Settlement for oil derivative contracts occurs in the succeeding month or quarter and natural gas derivative contracts are settled in the production month or quarter.
57
Table of Contents
At December 31, 2012, the Company’s open commodity derivative contracts consisted of the following:
| Derivative Instrument |
Commodity | Price (2) |
Volume per day (2) |
Period | ||||
| Fixed | Gas | 3.45 (US$/mmbtu) | 2,000 mmbtu | January 1, 2013 – December 31, 2013 | ||||
| Fixed | Gas | 3.60 (US$/mmbtu) | 3,000 mmbtu | January 1, 2013 – December 31, 2013 | ||||
| Fixed | Gas | 3.61 (US$/mmbtu) | 2,000 mmbtu | January 1, 2013 – December 31, 2013 | ||||
| Fixed | Gas | 3.65 (US$/mmbtu) | 2,000 mmbtu | January 1, 2013 – December 31, 2013 | ||||
| Fixed | Gas | 3.70 (US$/mmbtu) | 2,000 mmbtu | January 1, 2013 – December 31, 2013 | ||||
| Fixed | Gas | 3.99 (US$/mmbtu) | 1,000 mmbtu | January 1, 2013 – December 31, 2013 | ||||
| Fixed | Gas | 4.05 (US$/mmbtu) | 2,000 mmbtu | January 1, 2013 – December 31, 2013 | ||||
| Fixed | Gas | 4.25 (US$/mmbtu) | 2,000 mmbtu | January 1, 2014 – December 31, 2014 | ||||
| Fixed Basis Differential (1) | Gas | Differential Fixed @ $0.20 US$/mmbtu |
7,000 mmbtu | January 1, 2013 – December 31, 2013 | ||||
| Fixed Basis Differential (1) | Gas | Differential Fixed @ $0.205 US$/mmbtu |
5,000 mmbtu | January 1, 2013 – December 31, 2013 | ||||
| Fixed | Oil | 101.50 (Cdn$/bbl) | 200 bbl | January 1, 2013 – December 31, 2013 |
| (1) | NYMEX / Southern Star (Oklahoma) basis differential. |
58
Table of Contents
Equal has not designated any of its derivative contracts as hedges for accounting purposes. The Company records all derivative contracts at fair value, which reflects changes in commodity prices. Changes in fair values of the Company’s derivative contracts are recognized as a gain and loss in current period earnings. As a result, the Company’s current period earnings may be significantly affected by changes in the fair value of its commodity derivative contracts. Changes in fair value are principally measured based on period-end prices compared to the contract price.
Credit Risk. All of the Company’s hedging transactions have been carried out in the over-the-counter market. The use of hedging transactions in over-the-counter markets involves the risk that the counterparties may be unable to meet the financial terms of the transactions. The counterparties for all of the Company’s hedging transactions have an “investment grade” credit rating. The Company monitors on an ongoing basis the credit ratings of its hedging counterparties. The Company’s derivative contracts are primarily with its lead bank for its credit facility.
A default by the Company under its credit facility constitutes a default under its derivative contracts with counterparties that are lenders under the senior credit facility. The Company does not require collateral or other security from counterparties to support derivative instruments. The Company has master netting agreements with all of its derivative contract counterparties, which allows the Company to net its derivative assets and liabilities with the same counterparty. As a result of the netting provisions, the Company’s maximum amount of loss under derivative transactions due to credit risk is limited to the net amounts due from the counterparties under the derivatives. The Company’s loss is further limited as any amounts due from a defaulting counterparty that is a lender under the senior credit facility can be offset against amounts owed to such counterparty under the Company’s senior credit facility. As of December 31, 2012, the counterparties to the Company’s open derivative contracts consisted of three financial institutions, two of which are also lenders under the Company’s senior credit facility. The Company is not required to post additional collateral under derivative contracts.
Interest Rate Risk. The Company is subject to interest rate risk on its long-term fixed and variable interest rate borrowings. Fixed rate debt, where the interest rate is fixed over the life of the instrument, exposes the Company to (i) changes in market interest rates reflected in the fair value of the debt and (ii) the risk that the Company may need to refinance maturing debt with new debt at a higher rate. Variable rate debt, where the interest rate fluctuates, exposes the Company to short-term changes in market interest rates as its interest obligations on these instruments are periodically re-determined based on prevailing market interest rates, primarily the LIBOR rate. The Company had no outstanding variable rate debt as of December 31, 2012. Equal has no interest rate derivative contracts outstanding at December 31, 2012.
59
Table of Contents
Item 8. Financial Statements and Supplementary Data
REPORTS OF INDEPENDENT REGISTERED ACCOUNTING FIRM
To the Board of Directors and Shareholders of Equal Energy Ltd.
We have audited the accompanying consolidated balance sheets of Equal Energy Ltd. as of December 31, 2012 and December 31, 2011 and the related consolidated statements of operations and comprehensive income, changes in shareholders’ equity and cash flows for each of the years in the three-year period ended December 31, 2012. These consolidated financial statements are the responsibility of the Company’s management. Our responsibility is to express an opinion on these consolidated financial statements based on our audits.
We conducted our audits in accordance with the standards of the Public Company Accounting Oversight Board (United States). Those standards require that we plan and perform the audit to obtain reasonable assurance about whether the financial statements are free of material misstatement. An audit includes examining, on a test basis, evidence supporting the amounts and disclosures in the financial statements. An audit also includes assessing the accounting principles used and significant estimates made by management, as well as evaluating the overall financial statement presentation. We believe that our audits provide a reasonable basis for our opinion.
In our opinion, the consolidated financial statements referred to above present fairly, in all material respects, the consolidated financial position of Equal Energy Ltd. as of December 31, 2012 and December 31, 2011, and the results of their consolidated operations and their consolidated cash flows for each of the years in the three-year period ended December 31, 2012 in conformity with U.S. generally accepted accounting principles.
We also have audited, in accordance with the standards of the Public Company Accounting Oversight Board (United States), Equal Energy Ltd.’s internal control over financial reporting as of December 31, 2012, based on the criteria established in Internal Control – Integrated Framework issued by the Committee of Sponsoring Organizations of the Treadway Commission, and our report dated March 14, 2013 expressed an unqualified opinion on the effectiveness of Equal Energy Ltd.’s internal control over financial reporting.
Signed “KPMG LLP”
Chartered Accountants
Calgary, Canada
March 14, 2013
60
Table of Contents
To the Board of Directors and Shareholders of Equal Energy Ltd.
We have audited Equal Energy Ltd.’s (the “Company”) internal control over financial reporting as of December 31, 2012, based on the criteria established in Internal Control – Integrated Framework issued by the Committee of Sponsoring Organizations of the Treadway Commission (COSO). The Company’s management is responsible for maintaining effective internal control over financial reporting and for its assessment of the effectiveness of internal control over financial reporting, included in the section of the Form 10-K titled “Management’s Annual Report on Internal Control Over Financial Reporting”. Our responsibility is to express an opinion on the Company’s internal control over financial reporting based on our audit.
We conducted our audit in accordance with the standards of the Public Company Accounting Oversight Board (United States). Those standards require that we plan and perform the audit to obtain reasonable assurance about whether effective internal control over financial reporting was maintained in all material respects. Our audit included obtaining an understanding of internal control over financial reporting, assessing the risk that a material weakness exists, and testing and evaluating the design and operating effectiveness of internal control based on the assessed risk. Our audit also included performing such other procedures as we considered necessary in the circumstances. We believe that our audit provides a reasonable basis for our opinion.
An entity’s internal control over financial reporting is a process designed to provide reasonable assurance regarding the reliability of financial reporting and the preparation of financial statements for external purposes in accordance with generally accepted accounting principles. An entity’s internal control over financial reporting includes those policies and procedures that (1) pertain to the maintenance of records that, in reasonable detail, accurately and fairly reflect the transactions and dispositions of the assets of the entity; (2) provide reasonable assurance that transactions are recorded as necessary to permit preparation of financial statements in accordance with generally accepted accounting principles, and that receipts and expenditures of the entity are being made only in accordance with authorizations of management and directors of the entity; and (3) provide reasonable assurance regarding prevention or timely detection of unauthorized acquisition, use, or disposition of the entity’s assets that could have a material effect on the financial statements.
Because of its inherent limitations, internal control over financial reporting may not prevent or detect misstatements. Also, projections of any evaluation of effectiveness to future periods are subject to the risk that controls may become inadequate because of changes in conditions, or that the degree of compliance with the policies or procedures may deteriorate.
In our opinion, the Company maintained, in all material respects, effective internal control over financial reporting as of December 31, 2012, based on the criteria established in Internal Control – Integrated Framework issued by the Committee of Sponsoring Organizations of the Treadway Commission (COSO).
We also have audited, in accordance with the standards of the Public Company Accounting Oversight Board (United States), the consolidated balance sheets of the Company as of December 31, 2012 and 2011, and the related consolidated statements of operations and comprehensive loss, changes in shareholders’ equity and cash flows for each of the years in the three-year period ended December 31, 2012, and our report dated March 14, 2013 expressed an unqualified opinion on those consolidated financial statements.
Signed “KPMG”
Chartered Accountants
Calgary, Canada
March 14, 2013
61
Table of Contents
Equal Energy Ltd.
Consolidated Balance Sheets
| (in thousands of Canadian dollars) |
December 31, 2012 | December 31, 2011 | ||||||
| Assets |
||||||||
| Current assets |
||||||||
| Cash and cash equivalents |
22,969 | 5,553 | ||||||
| Accounts receivable (note 3) |
15,524 | 19,742 | ||||||
| Prepaid expenses, deposits and other |
926 | 552 | ||||||
| Commodity contracts (note 10) |
1,446 | 4,813 | ||||||
| Assets of discontinued operations (note 13) |
2,168 | 5,750 | ||||||
|
|
|
|
|
|||||
| Total current assets |
43,033 | 36,410 | ||||||
| Oil and natural gas properties, full cost method of accounting: (note 4) |
||||||||
| Proved |
145,442 | 173,417 | ||||||
| Unproved |
2,080 | 4,627 | ||||||
|
|
|
|
|
|||||
| Total oil and natural gas properties, net |
147,522 | 178,044 | ||||||
| Other capital assets |
485 | 917 | ||||||
|
|
|
|
|
|||||
| Total property, plant and equipment, net |
148,007 | 178,961 | ||||||
| Other assets |
1,422 | 1,859 | ||||||
| Commodity contracts (note 10) |
159 | — | ||||||
| Deferred income tax asset (note 11) |
33,601 | 41,293 | ||||||
| Assets of discontinued operations (note 13) |
— | 64,571 | ||||||
|
|
|
|
|
|||||
| Total assets |
226,222 | 323,094 | ||||||
|
|
|
|
|
|||||
| Liabilities |
||||||||
| Current liabilities |
||||||||
| Accounts payable and accrued liabilities |
8,600 | 14,673 | ||||||
| Liabilities of discontinued operations (note 13) |
5,840 | 10,887 | ||||||
|
|
|
|
|
|||||
| Total current liabilities |
14,440 | 25,560 | ||||||
62
Table of Contents
| Long-term debt (note 5) |
— | 138,820 | ||||||
| Convertible debentures (note 6) |
45,000 | 45,000 | ||||||
| Asset retirement obligation (note 7) |
4,722 | 5,270 | ||||||
| Liabilities of discontinued operations (note 13) |
783 | 8,564 | ||||||
|
|
|
|
|
|||||
| Total liabilities |
64,945 | 223,214 | ||||||
|
|
|
|
|
|||||
| Shareholders’ equity |
||||||||
| Common shares (35,226,526 and 34,779,435 shares issued and outstanding) |
225,249 | 223,437 | ||||||
| Contributed surplus |
9,298 | 6,439 | ||||||
| Accumulated other comprehensive loss (note 15) |
(26,218 | ) | (21,117 | ) | ||||
| Deficit |
(47,052 | ) | (108,879 | ) | ||||
|
|
|
|
|
|||||
| Total shareholders’ equity |
161,277 | 99,880 | ||||||
|
|
|
|
|
|||||
| Total liabilities and shareholders’ equity |
226,222 | 323,094 | ||||||
|
|
|
|
|
Commitments and contingencies (notes 10 and 14)
See accompanying notes to the consolidated financial statements
63
Table of Contents
Equal Energy Ltd.
Consolidated Statement of Changes in Shareholders’ Equity
| (in thousands of Canadian dollars except shares) |
Number of common shares |
Share capital |
Contributed surplus |
Accumulated other comprehensive income/(loss) |
Deficit | Shareholders’ equity |
||||||||||||||||||
| Balances, December 31, 2009 |
— | $ | — | $ | — | $ | (19,394 | ) | $ | (103,691 | ) | $ | (123,085 | ) | ||||||||||
|
|
|
|
|
|
|
|
|
|
|
|
|
|||||||||||||
| Conversion – effected through Plan of Arrangement (note 8) |
21,902,530 | 136,673 | 3,110 | — | (1,219 | ) | 138,564 | |||||||||||||||||
| Issue of common shares under restricted share plan |
193,729 | 1,105 | (1,105 | ) | — | — | — | |||||||||||||||||
| Issue of common shares under equity offering (net of issue costs/tax) |
5,613,600 | 36,215 | — | — | — | 36,215 | ||||||||||||||||||
| Share-based compensation before capitalization |
— | — | 1,529 | — | — | 1,529 | ||||||||||||||||||
| Comprehensive loss and loss for the year |
— | — | — | (6,552 | ) | (9,342 | ) | (15,894 | ) | |||||||||||||||
|
|
|
|
|
|
|
|
|
|
|
|
|
|||||||||||||
| Balances, December 31, 2010 |
27,709,859 | $ | 173,993 | $ | 3,534 | $ | (25,946 | ) | $ | (114,252 | ) | $ | 37,329 | |||||||||||
|
|
|
|
|
|
|
|
|
|
|
|
|
|||||||||||||
| Issue of common shares under restricted share plan |
194,576 | 1,142 | (1,142 | ) | — | — | — | |||||||||||||||||
| Issue of common shares on exercise of options |
25,000 | 134 | (10 | ) | — | — | 124 | |||||||||||||||||
| Issue of common shares under equity offering (net of issue costs/tax) |
6,850,000 | 48,168 | — | — | — | 48,168 | ||||||||||||||||||
| Share-based compensation before capitalization |
— | — | 4,057 | — | — | 4,057 | ||||||||||||||||||
| Comprehensive income and net income for the year |
— | — | — | 4,829 | 5,373 | 10,202 | ||||||||||||||||||
|
|
|
|
|
|
|
|
|
|
|
|
|
|||||||||||||
| Balances, December 31, 2011 |
34,779,435 | $ | 223,437 | $ | 6,439 | $ | (21,117 | ) | $ | (108,879 | ) | $ | 99,880 | |||||||||||
|
|
|
|
|
|
|
|
|
|
|
|
|
|||||||||||||
| Issue of common shares under restricted share plan |
447,091 | 1,812 | (1,812 | ) | — | — | — | |||||||||||||||||
| Share-based compensation before capitalization |
— | — | 4,671 | — | — | 4,671 | ||||||||||||||||||
| Comprehensive loss and net income for the year |
— | — | — | (5,101 | ) | 61,827 | 56,726 | |||||||||||||||||
|
|
|
|
|
|
|
|
|
|
|
|
|
|||||||||||||
| Balances, December 31, 2012 |
35,226,526 | $ | 225,249 | $ | 9,298 | $ | (26,218 | ) | $ | (47,052 | ) | $ | 161,277 | |||||||||||
|
|
|
|
|
|
|
|
|
|
|
|
|
|||||||||||||
See accompanying notes to the consolidated financial statements.
64
Table of Contents
Equal Energy Ltd.
Consolidated Statements of Operations and Comprehensive Income
| Year ended December 31 | ||||||||||||
| (in thousands of Canadian dollars except per share amounts) |
2012 | 2011 | 2010 | |||||||||
| Revenues |
||||||||||||
| NGL, natural gas and oil revenues |
61,478 | 70,512 | 51,206 | |||||||||
| Total gain on commodity contracts (note 10) |
2,915 | 7,799 | 3,209 | |||||||||
|
|
|
|
|
|
|
|||||||
| Total revenues |
64,393 | 78,311 | 54,415 | |||||||||
| Expenses |
||||||||||||
| Production |
20,457 | 16,908 | 10,462 | |||||||||
| Production taxes |
3,754 | 3,312 | 2,639 | |||||||||
| General and administrative including share-based compensation (note 8) |
11,145 | 10,975 | 16,370 | |||||||||
| Interest expense (notes 5, 6 and 12) |
5,912 | 9,840 | 9,831 | |||||||||
| Depletion and depreciation (note 4) |
22,888 | 14,936 | 4,262 | |||||||||
| Amortization of deferred charges |
437 | 1,860 | 1,242 | |||||||||
| Accretion of asset retirement obligation (note 7) |
405 | 248 | 175 | |||||||||
| Gain on sale of assets (note 4) |
(36,036 | ) | — | — | ||||||||
| Transaction costs on asset acquisition/dispositions |
708 | 1,767 | — | |||||||||
| Redemption fee on convertible debentures (note 6) |
— | 2,975 | — | |||||||||
| Realized foreign exchange (gain)/loss |
(207 | ) | 240 | (1,673 | ) | |||||||
| Unrealized foreign exchange (gain)/loss |
(3,015 | ) | 4,416 | 383 | ||||||||
|
|
|
|
|
|
|
|||||||
| 26,448 | 67,477 | 43,691 | ||||||||||
|
|
|
|
|
|
|
|||||||
| Income from continuing operations before taxes |
37,945 | 10,834 | 10,724 | |||||||||
| Taxes (note 11) |
||||||||||||
| Current tax expense |
— | 391 | 295 | |||||||||
| Deferred tax expense |
6,834 | 10,441 | 6,814 | |||||||||
|
|
|
|
|
|
|
|||||||
| 6,834 | 10,832 | 7,109 | ||||||||||
|
|
|
|
|
|
|
|||||||
| Income/(loss) from continuing operations |
31,111 | 2 | 3,615 | |||||||||
65
Table of Contents
| Discontinued operations (note 13): |
||||||||||||
| Income/(loss) from discontinued operations |
(11,890 | ) | 5,371 | (12,957 | ) | |||||||
| Gain on sales of discontinued operations, net of tax expense of $13.4 million |
42,606 | — | — | |||||||||
|
|
|
|
|
|
|
|||||||
| Net income / (loss) |
61,827 | 5,373 | (9,342 | ) | ||||||||
| Other comprehensive income/(loss) |
||||||||||||
| Foreign currency translation adjustment |
(5,101 | ) | 4,829 | (6,552 | ) | |||||||
|
|
|
|
|
|
|
|||||||
| Comprehensive income/(loss) |
56,726 | 10,202 | (15,894 | ) | ||||||||
|
|
|
|
|
|
|
|||||||
| Earnings per share information (note 9) |
||||||||||||
| Basic earnings per share from continuing operations |
$ | 0.89 | $ | 0.00 | $ | 0.14 | ||||||
| Basic earnings per share from discontinued operations |
$ | 0.87 | $ | 0.17 | ($ | 0.52 | ) | |||||
|
|
|
|
|
|
|
|||||||
| Basic earnings per share |
$ | 1.76 | $ | 0.17 | ($ | 0.52 | ) | |||||
| Diluted earnings per share from continuing operations |
$ | 0.82 | $ | 0.00 | $ | 0.14 | ||||||
| Diluted earnings per share from discontinued operations |
$ | 0.76 | $ | 0.16 | ($ | 0.52 | ) | |||||
|
|
|
|
|
|
|
|||||||
| Diluted earnings per share |
$ | 1.58 | $ | 0.16 | ($ | 0.38 | ) | |||||
|
|
|
|
|
|
|
See accompanying notes to the consolidated financial statements.
66
Table of Contents
Equal Energy Ltd.
Consolidated Statements of Cash Flows
| Year ended December 31 | ||||||||||||
| (in thousands of Canadian dollars) |
2012 | 2011 | 2010 | |||||||||
| Operating Activities |
||||||||||||
| Net income / (loss) |
61,827 | 5,373 | (9,342 | ) | ||||||||
| Net income / (loss) from discontinued operations |
(30,716 | ) | (5,371 | ) | 12,957 | |||||||
| Adjustments to reconcile net income to net cash provided by operating activities |
||||||||||||
| Depletion and depreciation (note 4) |
22,888 | 14,936 | 4,262 | |||||||||
| Accretion of asset retirement obligation (note 7) |
405 | 248 | 175 | |||||||||
| Share-based compensation (note 8) |
3,568 | 2,501 | 2,217 | |||||||||
| Amortization of deferred charges |
437 | 1,860 | 1,242 | |||||||||
| Commodity derivative fair value gains |
(2,915 | ) | (7,799 | ) | (3,209 | ) | ||||||
| Cash receipts for settled derivatives (note 10) |
6,063 | 2,375 | 4,121 | |||||||||
| Gain on sale of assets (note 4) |
(36,036 | ) | — | — | ||||||||
| Transactions costs on asset dispositions |
708 | — | — | |||||||||
| Redemption fee on convertible debentures |
— | 2,975 | — | |||||||||
| Deferred tax expense |
6,834 | 10,441 | 6,814 | |||||||||
| Cash paid on asset retirement obligation (note 7) |
(46 | ) | — | — | ||||||||
| Unrealized foreign exchange (gain)/loss |
(3,015 | ) | 4,416 | 383 | ||||||||
| Changes in operating assets and liabilities: |
||||||||||||
| Accounts receivable |
3,899 | (6,708 | ) | (8,691 | ) | |||||||
| Prepaid expenses and other current assets |
(386 | ) | 983 | (460 | ) | |||||||
| Accounts payable and accrued liabilities |
(5,931 | ) | 2,908 | (3,965 | ) | |||||||
|
|
|
|
|
|
|
|||||||
| Cash provided by operating activities – continuing operations |
27,584 | 29,138 | 6,504 | |||||||||
| Cash provided by operating activities – discontinued operations |
7,211 | 27,141 | 27,932 | |||||||||
|
|
|
|
|
|
|
|||||||
| Cash provided by operating activities |
34,795 | 56,279 | 34,436 | |||||||||
| Investing Activities |
||||||||||||
| Property, plant and equipment additions |
(20,841 | ) | (30,835 | ) | (14,020 | ) | ||||||
| Asset acquisition |
— | (86,098 | ) | — | ||||||||
| Proceeds on sale of property, plant and equipment |
58,673 | — | — | |||||||||
| Transaction costs on asset dispositions |
(708 | ) | — | — | ||||||||
67
Table of Contents
| Repayment of long-term receivable |
— | — | 3,503 | |||||||||
|
|
|
|
|
|
|
|||||||
| Cash provided by / (used in) investing activities – continuing operations |
37,124 | (116,933 | ) | (10,517 | ) | |||||||
| Cash provided by / (used in) investing activities – discontinued operations |
80,646 | (12,972 | ) | (32,197 | ) | |||||||
|
|
|
|
|
|
|
|||||||
| Cash provided by / (used in) investing activities |
117,770 | (129,905 | ) | (42,714 | ) | |||||||
| Financing Activities |
||||||||||||
| Increase / (decrease) in long-term debt (note 5) |
(135,066 | ) | 109,047 | (43,630 | ) | |||||||
| Issue of shares, net of issuance costs |
— | 47,417 | 35,641 | |||||||||
| Issuance of convertible debentures, net of costs |
— | 42,741 | — | |||||||||
| Redemption of convertible debentures |
— | (119,618 | ) | (82 | ) | |||||||
| Redemption fee on convertible debentures |
— | (2,975 | ) | — | ||||||||
|
|
|
|
|
|
|
|||||||
| Cash provided by / (used in) financing activities |
(135,066 | ) | 76,612 | (8,071 | ) | |||||||
| Foreign exchange on financial balances |
(83 | ) | 62 | (826 | ) | |||||||
|
|
|
|
|
|
|
|||||||
| Change in cash and cash equivalents |
17,416 | 3,048 | (17,175 | ) | ||||||||
| Cash and cash equivalents, beginning of year |
5,553 | 2,505 | 19,680 | |||||||||
|
|
|
|
|
|
|
|||||||
| Cash and cash equivalents, end of year |
22,969 | 5,553 | 2,505 | |||||||||
|
|
|
|
|
|
|
|||||||
| Supplementary Cash Flow Information |
||||||||||||
| Interest paid |
6,795 | 10,945 | 12,048 | |||||||||
| Income tax paid |
67 | 391 | 693 |
See accompanying notes to the consolidated financial statements.
68
Table of Contents
Equal Energy Ltd.
Notes to Consolidated Financial Statements
| 1. | Description of Business |
Equal Energy Ltd. (“Equal” or the “Company”) is a publicly listed company whose common shares trade on both the Toronto Stock Exchange (“TSX”) and the New York Stock Exchange (“NYSE”) under the symbol EQU. Equal is engaged in the exploration, development and production of oil, NGLs and natural gas in the United States and conducts many of its activities jointly with others. These financial statements reflect only the Company’s proportionate interest in such activities.
As required by Rule 3b-4(c) of the United States Securities Exchange Act of 1934, as amended, and Rule 405 of the United States Securities Act of 1933, as amended, Equal has adopted generally accepted accounting principles in the United States of America (“U.S. GAAP”) financial reporting. The Company no longer qualifies as a foreign private issuer as it did not meet certain conditions and, therefore, must follow the requirements of a U.S. domestic filer which includes financial reporting in accordance with U.S. GAAP.
| 2. | Significant Accounting Policies |
The consolidated financial statements have been prepared in accordance with U.S. GAAP. The Company believes that the information and disclosures presented are adequate to ensure the information presented is not misleading.
Significant accounting policies are:
Basis of consolidation
These consolidated financial statements include the accounts of the Company and its wholly-owned subsidiaries. All intercompany accounts and transactions have been eliminated.
Use of estimates
The preparation of financial statements in conformity with U.S. GAAP requires management to make estimates and assumptions that affect the reported amounts of assets and liabilities and disclosure of contingent assets and liabilities at the date of the consolidated financial statements and the reported amounts of revenues and expenses during the reporting period. Significant estimates made by management include: oil and natural gas reserves and related present value of future cash flows; depreciation, depletion, amortization and impairment (“DD&A”); timing of transfers from oil and gas properties not subject to amortization to the amortization base; asset retirement obligations; determining the value of the consideration transferred and the net identifiable assets acquired and liabilities assumed in connection with business combinations; income taxes; legal and other contingencies; and stock-based compensation. Although management believes these estimates are reasonable, changes in facts and circumstances or discovery of new information may result in revised estimates, and actual results may differ from these estimates.
Discontinued operations
As a part of the Strategic Review which the board of directors initiated on May 3, 2012, the Company’s Canadian assets were sold in Q4 2012 and are classified as discontinued operations (Note 13).
The captions assets of discontinued operations and liabilities of discontinued operations in the accompanying consolidated balance sheets present the assets and liabilities associated with Equal’s discontinued operations. Equal measures its assets of discontinued operations at the lower of its carrying amount or estimated fair value less costs to sell.
69
Table of Contents
Cash and cash equivalents
The Company considers all highly liquid investments with an original maturity of three months or less to be cash equivalents.
Allowance for doubtful accounts
The Company estimates losses on receivables based on known uncollectible accounts, if any, and historical experience of losses incurred. The allowance for doubtful receivables was $0.2 million at December 31, 2012 (December 31, 2011 – $35 thousand).
Income taxes
Income taxes are recognized using the liability method, whereby deferred tax assets and liabilities are recognized for the future tax consequences attributable to differences between the consolidated financial statement carrying amounts of existing assets and liabilities and their respective tax base, and operating loss and tax credit carry forwards. Deferred tax assets and liabilities are measured using enacted tax rates expected to apply to taxable income in the years in which those temporary differences and carry forwards are expected to be recovered or settled. Valuation allowances are provided if, after considering available evidence, it is not more likely than not that some or all of the deferred tax assets will be realized.
The tax benefit from an uncertain tax position is recognized when it is more likely than not, based on the technical merits of the position, that the position will be sustained on examination by the taxing authorities. Additionally, the amount of the tax benefit recognized is the largest amount of benefit that has a greater than 50% likelihood of being realized upon ultimate settlement. In evaluating whether a tax position has met the more-likely-than-not recognition threshold, the Company presumes that the position will be examined by the appropriate taxing authority that has full knowledge of all relevant information. The Company recognizes potential penalties and interest related to unrecognized tax benefits as a component of income tax expense.
Oil and gas properties
The Company uses the full cost method of accounting for its investment in oil and natural gas properties as defined by the Securities and Exchange Commission (“SEC”). Under this method, the Company capitalizes all acquisition, exploration and development costs incurred for the purpose of finding oil and natural gas reserves, including salaries, benefits and other internal costs directly attributable to these activities. Costs associated with production and general corporate activities; however, are expensed as incurred. Separate cost centers are maintained for each country in which the Company incurs costs.
The Company computes depletion of oil and natural gas properties on a quarterly basis using the unit-of-production method based upon production and estimates of proved reserve quantities. Future development costs related to properties with proved reserves are also included in the amortization base for computation of depletion. The costs of unproved properties are excluded from the amortization until the properties are evaluated. The cost of exploratory dry wells is transferred to proved properties, and thus subject to amortization, immediately upon determination that a well is dry in those countries where proved reserves exist.
The Company performs a ceiling test calculation each quarter in accordance with SEC Regulation S-X Rule 4-10. In performing its ceiling test, the Company limits, on a country-by-country basis, the capitalized costs of proved oil and natural gas properties, net of accumulated depletion and deferred income taxes, to the estimated future net cash flows from proved oil and natural gas reserves discounted at 10%, net of related tax effects, plus the lower of cost or fair value of unproved properties included in the costs being amortized. If such capitalized costs exceed the ceiling, the Company will record a write-down to the extent of such excess as a non-cash charge to net income. Any such write-down will reduce earnings in the period of occurrence and results in a lower DD&A rate in future periods. A write-down may not be reversed in future periods even though higher oil and natural gas prices may subsequently increase the ceiling.
70
Table of Contents
The Company implemented the SEC final rule “Modernization of Oil and Gas Reporting” at December 31, 2009 and calculates future net cash flows by applying the average of prices in effect on the first day of the month for the preceding 12 month period, adjusted for location and quality differentials.
Unproved properties are not depleted pending the determination of the existence of proved reserves. Costs are transferred into the amortization base on an ongoing basis as the properties are evaluated and proved reserves are established or impairment is determined. Unproved properties are evaluated quarterly to ascertain whether impairment has occurred. This evaluation considers, among other factors, seismic data, requirements to relinquish acreage, drilling results and activity, remaining time in the commitment period, remaining capital plans, and political, economic, and market conditions. During any period in which factors indicate an impairment, the cumulative costs incurred to date for such property are transferred to the full cost pool and are then subject to amortization.
In exploration areas, related geological and geophysical (“G&G”) costs are capitalized in unproved property and evaluated as part of the total capitalized costs associated with a property. G&G costs related to development projects are recorded in proved properties and therefore subject to amortization as incurred.
Gains and losses on the sale or other disposition of oil and natural gas properties are not recognized, unless the gain or loss would significantly alter the relationship between capitalized costs and proved reserves of oil and natural gas attributable to a country.
Other capital assets
Other capital assets, including additions and replacements, are recorded at cost upon acquisition and include furniture, fixtures and leasehold improvement, computer equipment and automobiles. Depreciation is provided over the estimated useful life of the respective asset which is approximately 5 years. The cost of repairs and maintenance is charged to expense as incurred.
Asset retirement obligations
The Company records the fair value of a liability for a legal obligation to retire an asset in the period in which the liability is incurred with an offsetting increase to the related oil and gas properties. The fair value of asset retirement obligations is measured by reference to the expected future cash outflows required to satisfy the retirement obligations discounted at the Company’s credit-adjusted risk-free interest rate. Accretion expense is recognized over time as the discounted liabilities are accreted to their expected settlement value, while the asset retirement cost is amortized over the estimated productive life of the related assets. The accretion of the asset retirement obligation and amortization of the asset retirement cost are included in DD&A. If estimated future costs of asset retirement obligations change, an adjustment is recorded to both the asset retirement obligation and oil and gas properties. Revisions to the estimated asset retirement obligation can result from changes in retirement cost estimates, revisions to estimated inflation rates and changes in the estimated timing of abandonment.
Revenue recognition
Revenues associated with the sale of crude oil, NGLs and natural gas is recognized when title passes from Equal to its customers based on contracts which establish the price of products sold and when collection is reasonably assured.
Share-based compensation
Equal has multiple share based compensation plans, which are described in Note 8. Compensation expense associated with each share based compensation plan is recognized in earnings over the vesting period of the plan with a corresponding increase in contributed surplus. Any consideration received upon the exercise of the share based compensation together with the amount of non-cash compensation expense recognized in contributed surplus is recorded as an increase in shareholders’ capital. Compensation expense is based on the estimated fair value of the share based compensation at the date of grant.
71
Table of Contents
Foreign currency transactions
Transactions completed in foreign currencies are reflected in Canadian dollars at the foreign currency exchange rates prevailing at the time of the transactions. Monetary assets and liabilities denominated in foreign currencies are reflected in the financial statements at the Canadian equivalent at the rate of exchange prevailing at the balance sheet date. Gains and losses are included in earnings.
The U.S. subsidiaries of Equal are considered to be “self-sustaining operations” and have a U.S. dollar functional currency. As a result, the revenues and expenses are translated to Canadian dollars using average exchange rates for the period. Assets and liabilities are translated at the period-end exchange rate. Gains or losses resulting from the translation are included in accumulated other comprehensive income (loss) in shareholders’ equity.
Per share amounts
Per share amounts are calculated using the weighted average number of shares outstanding. Equal follows the treasury stock method to determine dilutive effect of options, warrants and other dilutive instruments. Under the treasury stock method, only “in-the-money” dilutive instruments impact the diluted calculations. Convertible debentures are included in the calculation of diluted income per share based on the number of shares that would be issued on conversion of the convertible debentures at the end of the year and an add-back of the associated interest expense for the year as long as the conversion results in dilution to Equal shareholders.
Financial instruments
Equal has policies and procedures in place with respect to the required documentation and approvals for the use of derivative financial instruments and their use is limited to mitigating market price risk associated with expected cash flows.
Financial instruments are measured at fair value on the balance sheet upon initial recognition of the instrument. Measurement in subsequent years depends on whether the financial instrument has been classified in one of the following categories: held-for-trading, available-for-sale, held-to-maturity, loans and receivables, or other financial liabilities.
Subsequent measurement and changes in fair value will depend on initial classification, as follows: held-for-trading financial assets are measured at fair value and changes in fair value are recognized in net income; available-for-sale financial instruments are measured at fair value with changes in fair value recorded in Other Comprehensive Income (“OCI”) until the instrument or a portion thereof is derecognized or impaired at which time the amounts would be recorded in net income; and held to maturity financial assets, loans and receivables and other financial liabilities are measured at amortized cost. Equal currently has no held to maturity or available-for-sale financial assets.
Cash and cash equivalents are designated as held-for-trading and are measured at cost, which approximates fair value due to the short-term nature of these instruments. Accounts receivable are designated as loans and receivables. Accounts payable and accrued liabilities, the liability component of convertible debentures and long-term debt are designated as other financial liabilities. All commodity contract assets and liabilities are derivative financial instruments designated as held-for-trading.
| 3. | Accounts Receivable |
The components of account receivable include the following:
| (in thousands of Canadian dollars) |
December 31, 2012 | December 31, 2011 | ||||||
| Accounts receivable – trade |
10,677 | 12,841 | ||||||
| Accounts receivable – other |
5,019 | 6,936 | ||||||
| Allowance for doubtful accounts |
(172 | ) | (35 | ) | ||||
|
|
|
|
|
|||||
| 15,524 | 19,742 | |||||||
|
|
|
|
|
|||||
72
Table of Contents
| 4. | Property, Plant and Equipment (“PP&E”) |
| Property, Plant and Equipment | As at December 31, 2012 | |||||||||||
| (in thousands of Canadian dollars) |
Cost | Accumulated DD&A |
Net Book Value |
|||||||||
| Oil and natural gas properties |
||||||||||||
| Proved |
498,686 | (353,244 | ) | 145,442 | ||||||||
| Unproved |
2,080 | — | 2,080 | |||||||||
|
|
|
|
|
|
|
|||||||
| 500,766 | (353,244 | ) | 147,522 | |||||||||
| Other capital assets |
1,150 | (665 | ) | 485 | ||||||||
|
|
|
|
|
|
|
|||||||
| Total Property, Plant and Equipment |
501,916 | (353,909 | ) | 148,007 | ||||||||
|
|
|
|
|
|
|
|||||||
| Property, Plant and Equipment | As at December 31, 2011 | |||||||||||
| (in thousands of Canadian dollars) |
Cost | Accumulated DD&A |
Net Book Value |
|||||||||
| Oil and natural gas properties |
||||||||||||
| Proved |
527,784 | (354,367 | ) | 173,417 | ||||||||
| Unproved |
4,627 | — | 4,627 | |||||||||
|
|
|
|
|
|
|
|||||||
| 532,411 | (354,367 | ) | 178,044 | |||||||||
| Other capital assets |
1,415 | (498 | ) | 917 | ||||||||
|
|
|
|
|
|
|
|||||||
| Total Property, Plant and Equipment |
533,826 | (354,865 | ) | 178,961 | ||||||||
|
|
|
|
|
|
|
|||||||
On January 31, 2012, the Company completed the sale of non-core assets in Saskatchewan for proceeds of $8.3 million.
On April 26, 2012, the Company closed the sale of 50% of its interest in approximately 14,500 net undeveloped acres prospective for Mississippian light oil for total cash consideration of US$18.1 million. Concurrent with the sale, Equal entered into a joint venture agreement with the counterparty of the sale to develop those assets.
On May 3, 2012, Equal announced that its Board of Directors initiated a strategic review process to identify, examine and consider alternatives with the view to enhancing shareholder value. As a result of the strategic review process, the Company completed the following asset sales from which the proceeds were used to pay down the Company’s outstanding bank debt:
| • | on September 24, 2012, the Northern Oklahoma assets were sold for total cash consideration of US$40.0 million to its Mississippian joint venture partner; |
| • | on October 15, 2012, the assets in the Halkirk, Wainwright, Alliance and Clair areas of Alberta sold for $15.4 million in addition with the transfer of substantially all of its non-producing, suspended and abandoned wells in Alberta; |
| • | on November 2, 2012, the assets in the Lochend Cardium were sold for $62.1 million; and |
| • | on December 13, 2012, the royalty and fee title lands in Western Canada were sold for $12.1 million. |
The sale of the Northern Oklahoma assets resulted in a gain on sale of $36.0 million and the three Canadian asset sales in Q4 2012 resulted in a gain on sale of $56.8 million ($42.6 million net of income tax) which is included in the discontinued operations (Note 13).
On June 1, 2011, Equal closed the Hunton acquisition from a former joint venture participant and settled all outstanding legal matters and other claims among the Company, Petroflow and Petroflow’s banks. The Hunton acquisition increased production, resolved all matters outstanding between Petroflow, its lenders and the Company and expanded operations in Oklahoma. The consideration for the Hunton acquisition of $92.4 million (US$95.7 million), which was allocated to property, plant and equipment, was composed of $83.7 million (US$86.7 million) in cash, settlement of $5.6 million (US$5.8 million) in accounts receivable, operating income from the assets for June 2011 of $2.4 million (US$2.5 million) and the non-cash assumption of decommissioning liabilities of $0.5 million
73
Table of Contents
(US$0.7 million). Total transaction costs for the Hunton acquisition was $1.8 million for legal and financial advisory fees. Had the acquisition closed on January 1, 2011, proforma revenues from oil, NGLs and natural gas would have been $83.3 million (unaudited) and proforma net income would have been $11.9 million (unaudited) for 2011. The fair value of the Hunton acquisition was determined using a reserve report based on forecasted commodity prices for proved and probable reserves from an external oil and gas reserve engineer.
Equal completed ceiling test calculations at December 31, 2012 and 2011 to assess the recoverability of costs recorded in respect of the petroleum and natural gas properties. The ceiling test calculations did not result in an impairment at December 31, 2012 and 2011.
| 5. | Long-term Debt |
| (in thousands of Canadian dollars) |
December 31, 2012 | December 31, 2011 | ||||||
| Long-term debt |
— | 138,820 | ||||||
Effective November 2, 2012, the Company‘s syndicated bank credit facility was $125.0 million and is comprised of a $105.0 million revolving credit facility and a $20.0 million operating credit facility. The next scheduled review of the borrowing base is anticipated to be completed in June 2013. Changes to the amount of credit available may be made after this review is completed. The revolving and operating credit facilities are secured with a first priority charge over the assets of Equal. The maturity date of the revolving and operating credit facilities is June 2013 and should the lenders decide not to renew the facility, the debt must be repaid by June 2014.
Interest rates and standby fees for the credit facilities are set quarterly according to a grid based on the ratio of bank debt to cash flow with the interest rates based on Canadian dollar BA (“Bankers Acceptance”) or U.S. dollar LIBOR rate plus 2.0% to 4.0% depending on the ratio of bank debt to cash flow. For any unused balance of the credit facility, between 0.50% to 1.00% is charged as a standby fee which is recorded in interest expense. As at December 31, 2012, the marginal interest rate and standby fee were 2.50% and 0.625%, respectively.
As at December 31, 2012, the credit facility was undrawn due to proceeds from asset dispositions during 2012 which were used to fully repay the outstanding amount on the credit facility (see Note 4). As at December 31, 2012, letters of credit totaling $0.7 million (December 31, 2011 – $0.5 million) reduced the amount that can be drawn under the bank credit facility.
Equal is required to maintain several financial and non-financial covenants. The primary financial covenant is an interest coverage ratio of 3.0:1.0 as calculated pursuant to the terms of the credit agreement. For the twelve months ended December 31, 2012, the interest coverage ratio was 5.32 (December 31, 2011 – 6.11). Equal is in compliance with the terms and covenants of the credit facilities as at December 31, 2012.
| 6. | Convertible Debentures |
| (in thousands of Canadian dollars) |
EQU.DB 8% Series |
EQU.DB.A 8.25% Series |
EQU.DB.B 6.75% Series |
Total | ||||||||||||
| Balance, January 1, 2011 |
80,128 | 39,649 | — | 119,777 | ||||||||||||
| Issuance |
45,000 | 45,000 | ||||||||||||||
| Redeemed |
(80,128 | ) | (39,649 | ) | — | (119,777 | ) | |||||||||
|
|
|
|
|
|
|
|
|
|||||||||
| Balance, December 31, 2011 |
— | — | 45,000 | 45,000 | ||||||||||||
|
|
|
|
|
|
|
|
|
|||||||||
| Balance at December 31, 2012 |
— | — | 45,000 | 45,000 | ||||||||||||
|
|
|
|
|
|
|
|
|
|||||||||
On February 9, 2011, Equal issued $45.0 million of convertible unsecured junior subordinated debentures with a face value of $1,000 per debenture that mature on March 31, 2016 and bear interest at 6.75% per annum paid semi-annually on March 31 and September 30 of each year. The 6.75% convertible debentures are convertible at the option of the holder into shares at any time prior to the maturity date at a conversion price of $9.00 per share.
On March 14, 2011, the outstanding $79.9 million in face value of 8.00% convertible unsecured debentures were redeemed for $83.2 million which included the early redemption premium of $1.9 million and interest of $1.3 million. The redemption was funded by the issuance of the 6.75% convertible unsecured junior subordinated debentures and Equal’s credit facility.
74
Table of Contents
On December 15, 2011, the outstanding $39.1 million in face value of 8.25% convertible unsecured debentures were redeemed for $41.5 million which included the early redemption premium of $1.0 million and interest of $1.5 million. The redemption was funded by the sale of non-core assets in November 2011.
At December 31, 2012, the Company had $45.0 million (December 31, 2011 - $45.0 million) of 6.75% convertible debentures outstanding with an estimated fair value of $45.0 million (December 31, 2011 - $44.8 million).
| 7. | Asset Retirement Obligation |
At December 31, 2012, the asset retirement obligation is estimated to be $4.7 million (December 31, 2011 – $5.3 million). These obligations will be settled at the end of the useful lives of the underlying assets, which currently averages 13 years, but extends up to 30 years into the future. This amount has been calculated using an inflation rate of 2.0% and discounted using a credit-adjusted risk free rate of 8.0% to 10.0%.
The following table reconciles the asset retirement obligation:
| (in thousands of Canadian dollars) |
December 31, 2012 | December 31, 2011 | ||||||
| Balance, beginning of year |
5,270 | 2,710 | ||||||
| Additions |
79 | 38 | ||||||
| Accretion expense |
405 | 248 | ||||||
| Acquired |
— | 495 | ||||||
| Dispositions |
(833 | ) | — | |||||
| Costs incurred |
(46 | ) | — | |||||
| Change in estimate |
(21 | ) | 1,689 | |||||
| Foreign exchange |
(132 | ) | 90 | |||||
|
|
|
|
|
|||||
| Balance, end of year |
4,722 | 5,270 | ||||||
|
|
|
|
|
|||||
| 8. | Shareholders’ Equity and Share-based Compensation |
Common shares
An unlimited number of common shares may be issued.
As part of the Strategic Review, the Company has initiated a US$0.20 per share annual dividend, starting January 1, 2013, to be paid quarterly.
Trust units
On May 31, 2010, Enterra Energy Trust (“Enterra” or the “Trust”) completed its conversion from an income trust to a corporation. Pursuant to the Plan of Arrangement (the “Arrangement”), all outstanding trust units were exchanged for common shares of Equal. Under U.S. GAAP this exchange was recorded at the carrying value of the trust units outstanding at May 31, 2010, which was $136.7 million. On conversion, the liability associated with the unit-based compensation had a fair value of $3.1 million and the temporary equity adjustment was a loss of $1.2 million.
75
Table of Contents
Share options
Equal has a Share Option Plan where the Company may grant share options to its directors, officers and employees. Each share option permits the holder to purchase one share at the stated exercise price. All options vest over a 1 to 3 year period and have a term of 3 to 5 years. The exercise price is equal to the market price at the time of the grant. The forfeiture rate is estimated to be 16%. The following table is a continuity of the options:
| (in Canadian dollars, except for number of options) |
Number of Options(1) |
Weighted Average Exercise Price(1) |
Number of Non-vested Options(1) |
Weighted Average Grant Date Fair Value(1) |
||||||||||||
| Options outstanding at December 31, 2009 |
235,331 | $ | 19.80 | 10,000 | $ | 2.10 | ||||||||||
| Options granted |
986,708 | 5.91 | 986,708 | 2.30 | ||||||||||||
| Options vested |
— | — | (26,667 | ) | 2.31 | |||||||||||
| Options forfeited |
(163,887 | ) | 12.86 | (94,887 | ) | 2.32 | ||||||||||
|
|
|
|
|
|
|
|
|
|||||||||
| Options outstanding at December 31, 2010 |
1,058,152 | $ | 7.92 | 875,154 | $ | 2.30 | ||||||||||
| Options exercised |
(25,000 | ) | 4.95 | — | — | |||||||||||
| Options granted |
568,713 | 7.16 | 568,713 | 2.93 | ||||||||||||
| Options vested |
— | — | (166,056 | ) | 2.43 | |||||||||||
| Options forfeited |
(298,370 | ) | 13.03 | (159,261 | ) | 2.32 | ||||||||||
|
|
|
|
|
|
|
|
|
|||||||||
| Options outstanding at December 31, 2011 |
1,303,495 | $ | 6.47 | 1,118,550 | $ | 2.59 | ||||||||||
| Options granted |
50,000 | 2.95 | 50,000 | 1.02 | ||||||||||||
| Options vested |
— | — | (482,950 | ) | 2.57 | |||||||||||
| Options forfeited |
(618,957 | ) | 6.21 | (382,041 | ) | 2.38 | ||||||||||
|
|
|
|
|
|
|
|
|
|||||||||
| Options outstanding at December 31, 2012 |
734,538 | $ | 6.45 | 303,559 | $ | 2.63 | ||||||||||
|
|
|
|
|
|
|
|
|
|||||||||
| Options exercisable at December 31, 2012 |
430,979 | $ | 6.46 | |||||||||||||
|
|
|
|
|
|
|
|
|
|||||||||
| (1) | Restated to reflect the three for one exchange of trust units for common shares on May 31, 2010. |
| (in Canadian dollars, except for number of options) |
||||||||||||||||||||
| Exercise price range |
Number of options |
Weighted average exercise price |
Weighted average remaining contract life in years |
Number of options exercisable |
Weighted average price of exercisable options |
|||||||||||||||
| $4.66 to $4.90 |
134,150 | $ | 4.78 | 1.74 | 51,067 | $ | 4.87 | |||||||||||||
| $6.15 to $6.67 |
263,733 | 6.21 | 0.85 | 234,866 | 6.19 | |||||||||||||||
| $7.16 to $7.26 |
306,322 | 7.26 | 2.03 | 114,713 | 7.26 | |||||||||||||||
| $8.19 to $8.40 |
30,333 | 8.21 | 1.13 | 30,333 | 8.21 | |||||||||||||||
|
|
|
|
|
|
|
|
|
|
|
|||||||||||
| Balance at December 31, 2012 |
734,538 | $ | 6.45 | 1.52 | 430,979 | $ | 6.46 | |||||||||||||
|
|
|
|
|
|
|
|
|
|
|
|||||||||||
For the year ended December 31, 2012, there were no common shares issued upon the exercise of any share options (year ended December 31, 2011 – 25,000; year ended December 31, 2010 – nil).
The weighted average grant date fair value for options granted in 2012 was $1.02 (2011 – $2.93; 2010 – $2.30). The weighted average grant date fair value for non-vested options at December 31, 2012 was $2.63 (December 31, 2011 – $2.59). The weighted average grant date fair value for options vested in 2012 was $2.57 (2011 – $2.43; 2010 – $2.31). The total fair value of options vested during 2012 was $1.2 million (2011 – $0.4 million; 2010 – $0.1 million).
The aggregate intrinsic value of options outstanding at December 31, 2012 is nil (December 31, 2011 – nil) based on the Company’s closing stock price of $3.08 at December 31, 2012 (December 31, 2011 – $4.59). There were no options exercised in 2012, therefore, the intrinsic value was nil (2011 – $10 thousand; 2010 – nil).
In 2012, the expense from options was $1.1 million (2011 – $2.0 million; 2010 – $1.4 million) of which $1.0 million (2011 – $1.8 million; 2010 – $1.2 million) was recorded as share-based compensation and $0.1 million (2011 – $0.2 million; 2010 – $0.2 million) was capitalized as part of exploration and development costs.
76
Table of Contents
At December 31, 2012, there was $0.6 million (2011 – $2.6 million; 2010 – $3.3 million) of unrecognized share-based compensation expense from options expected to be recognized over the next two years.
The estimated grant date fair value of options was determined using the Black-Scholes model under the following assumptions:
| 2012 | 2011 | 2010 | ||||||||||
| Weighted-average fair value of options granted ($/option) |
1.02 | 2.93 | 2.30 | |||||||||
| Risk-free interest rate (%) |
1.13 | 2.00 | 1.71 | |||||||||
| Estimated hold period prior to exercise (years) |
3.0 | 4.0 | 4.0 | |||||||||
| Expected volatility (%) |
50 | 50 | 50 | |||||||||
| Expected cash distribution yield (%) |
— | — | — | |||||||||
Restricted shares
Equal has granted restricted shares to directors, officers, and employees. Restricted shares vest over a contracted period ranging from vesting on grant to 3 years and provide the holder with shares on the vesting dates of the restricted shares. The estimated value of the restricted shares is based on the trading price of the shares on the grant date. Upon vesting of the restricted shares, the plan administrator automatically sells a portion of the common shares on a public stock exchange for the estimated income tax. The forfeiture rate is estimated to be 16%.
The following table is a continuity of the restricted shares:
| (in thousands of Canadian dollars, except for number of restricted shares and grant date values) |
Number of Restricted Shares(1) |
Weighted Average Grant Date Fair Value(1) |
Vest Date Intrinsic Value |
|||||||||
| Restricted shares outstanding at December 31, 2009 |
534,730 | $ | 10.41 | |||||||||
| Restricted shares granted |
438,279 | 5.24 | ||||||||||
| Restricted shares vested and exercised |
(395,896 | ) | 8.91 | $ | 2,382 | |||||||
| Restricted shares forfeited |
(69,354 | ) | 11.09 | |||||||||
|
|
|
|
|
|
|
|||||||
| Restricted shares outstanding at December 31, 2010 |
507,759 | $ | 7.03 | |||||||||
| Restricted shares granted |
740,105 | 7.17 | ||||||||||
| Restricted shares vested and exercised |
(194,576 | ) | 10.52 | $ | 1,142 | |||||||
| Restricted shares forfeited |
(107,003 | ) | 5.67 | |||||||||
|
|
|
|
|
|
|
|||||||
| Restricted shares outstanding at December 31, 2011 |
946,285 | $ | 6.57 | |||||||||
| Restricted shares granted |
1,063,082 | 3.82 | ||||||||||
| Restricted shares vested and exercised |
(447,091 | ) | 6.35 | $ | 1,805 | |||||||
| Restricted shares forfeited |
(341,787 | ) | 4.75 | |||||||||
|
|
|
|
|
|
|
|||||||
| Restricted shares outstanding at December 31, 2012 |
1,220,489 | $ | 4.77 | |||||||||
|
|
|
|
|
|
|
|||||||
| (1) | Restated to reflect the three for one exchange of trust units for common shares on May 31, 2010. |
For the year ended December 31, 2012, there were 447,091 common shares issued upon the vesting and exercise of restricted shares (year ended December 31, 2011 – 194,576; year ended December 31, 2010 – 395,896). The total fair value of restricted shares vested during 2012 was $1.8 million (2011 – $1.1 million; 2010 – $2.4 million). As part of discontinuing operations in Canada, subsequent to the year-end, 272,993 restricted shares were vested and exercised which had a fair value of $0.8 million.
The weighted average grant date fair value for restricted shares granted in 2012 was $3.82 (2011 – $7.17; 2010 – $5.24). The weighted average grant date fair value for non-vested options at December 31, 2012 is $4.77 (December 31, 2011 – $6.57). The weighted average grant date fair value for restricted shares vested in 2012 was $6.35 (2011 – $10.52; 2010 – $8.91).
The aggregate intrinsic value of options outstanding at December 31, 2012 is $3.8 million (December 31, 2011 – $4.3 million) based on the Company’s closing stock price of $3.08 at December 31, 2012 (December 31, 2011 – $4.59). The intrinsic value of restricted shares vested and exercised in 2012 was $1.8 million (2011 – $1.1 million; 2010 – $2.4 million).
77
Table of Contents
In 2012, the expense from restricted shares was $3.5 million (2011 – $2.1 million; 2010 – $2.3 million) of which $3.3 million (2011 – $1.9 million; 2010 – $2.1 million) was recorded as share-based compensation and $0.2 million (2011 – $0.2 million; 2010 – $0.2 million) was capitalized as part of exploration and development costs.
At December 31, 2012, there was $3.2 million (2011 – $4.1 million; 2010 – $1.7 million) of unrecognized share-based compensation expense from restricted shares expected to be recognized over the next three years.
| 9. | Net Income per Share |
For the year ended December 31, 2012
| (in thousands of Canadian dollars except shares and per share amounts) |
Net Income |
Weighted Average Shares Outstanding |
Per Share |
|||||||||
| Basic – from continuing operations |
31,111 | 35,062,257 | $ | 0.89 | ||||||||
| Basic – from discontinued operations |
30,716 | 35,062,257 | 0.87 | |||||||||
|
|
|
|
|
|
|
|||||||
| Basic – combined continuing and discontinued operations |
61,827 | 35,062,257 | $ | 1.76 | ||||||||
|
|
|
|
|
|
|
|||||||
| Diluted – from continuing operations |
33,754 | 41,125,104 | $ | 0.82 | ||||||||
| Diluted – from discontinued operations |
31,111 | 41,125,104 | 0.76 | |||||||||
|
|
|
|
|
|
|
|||||||
| Diluted – combined continuing and discontinued operations |
64,865 | 41,125,104 | $ | 1.58 | ||||||||
|
|
|
|
|
|
|
|||||||
For the calculation of the weighted average number of diluted shares outstanding for the year ended December 31, 2012, the convertible debentures and restricted shares were included as they were dilutive to the calculation. All options were excluded from the calculation as their exercise prices were higher than the average share price during 2012.
For the year ended December 31, 2011
| (in thousands of Canadian dollars except shares and per share amounts) |
Net Income |
Weighted Average Shares Outstanding |
Per Share |
|||||||||
| Basic – from continuing operations |
2 | 32,039,817 | $ | 0.00 | ||||||||
| Basic – from discontinued operations |
5,371 | 32,039,817 | 0.17 | |||||||||
|
|
|
|
|
|
|
|||||||
| Basic – combined continuing and discontinued operations |
5,373 | 32,039,817 | $ | 0.17 | ||||||||
|
|
|
|
|
|
|
|||||||
| Diluted – from continuing operations |
2 | 32,768,049 | $ | 0.00 | ||||||||
| Diluted – from discontinued operations |
5,371 | 32,768,049 | 0.16 | |||||||||
|
|
|
|
|
|
|
|||||||
| Diluted – combined continuing and discontinued operations |
5,373 | 32,768,049 | $ | 0.16 | ||||||||
|
|
|
|
|
|
|
|||||||
For the calculation of the weighted average number of diluted shares outstanding for the year ended December 31, 2011, all restricted shares and 51,236 options were included as they were dilutive to the calculation. The convertible debentures were excluded as they were anti-dilutive and 1,051,645 options were excluded as their exercise prices were higher than the average share price during 2011.
78
Table of Contents
For the year ended December 31, 2010
| (in thousands of Canadian dollars except shares and per share amounts) |
Net Income / (Loss) |
Weighted Average Shares Outstanding |
Per Share |
|||||||||
| Basic – from continuing operations |
3,615 | 24,594,866 | $ | 0.14 | ||||||||
| Basic – from discontinued operations |
(12,957 | ) | 24,594,866 | (0.52 | ) | |||||||
|
|
|
|
|
|
|
|||||||
| Basic – combined continuing and discontinued operations |
(9,342 | ) | 24,594,866 | ($ | 0.38 | ) | ||||||
|
|
|
|
|
|
|
|||||||
| Diluted– from continuing operations |
3,615 | 24,896,067 | $ | 0.14 | ||||||||
|
|
|
|
|
|
|
|||||||
| Diluted – from discontinued operations |
(12,957 | ) | 24,594,866 | (0.52 | ) | |||||||
|
|
|
|
|
|
|
|||||||
| Diluted– combined continuing and discontinued operations |
(9,342 | ) | 24,594,866 | ($ | 0.38 | ) | ||||||
|
|
|
|
|
|
|
|||||||
For the calculation of the weighted average number of diluted shares outstanding for the year ended December 31, 2010, all restricted shares were dilutive for the continuing operations and all options and the convertible debentures were excluded as they were anti-dilutive to the calculation.
Weighted Average Shares Outstanding
| Year ended December 31 | ||||||||||||
| (in thousands of Canadian dollars except shares and per share amounts) |
2012 | 2011 | 2010 | |||||||||
| Weighted average number of shares outstanding |
35,062,257 | 32,039,817 | 24,594,866 | |||||||||
| Shares issuable pursuant to options |
— | 51,236 | — | |||||||||
| Shares issuable pursuant to restricted shares |
1,062,847 | 676,996 | 301,201 | |||||||||
| Shares issuable pursuant to convertible debentures(1) |
5,000,000 | — | — | |||||||||
|
|
|
|
|
|
|
|||||||
| Weighted average number of diluted shares outstanding |
41,125,104 | 32,768,049 | 24,896,067 | |||||||||
|
|
|
|
|
|
|
|||||||
| (1) | In 2012, the conversion of the convertible debentures would result in an interest reduction of $3.0 million. |
| 10. | Risk Management |
| (a) | Fair value of financial instruments |
Equal classifies the fair value measurements of its financial instruments recognized at fair value in the balance sheet according to the following hierarchy based on the amount of observable inputs used to value the instrument.
| • | Level 1 – Quoted prices are available in active markets for identical assets or liabilities as of the reporting date. Active markets are those in which transactions occur in sufficient frequency and volume to provide pricing information on an ongoing basis. |
| • | Level 2 – Pricing inputs are other than quoted prices in active markets included in Level 1. Prices in Level 2 are either directly or indirectly observable as of the reporting date. Level 2 valuations are based on inputs, including quoted forward prices for commodities, time value and volatility factors, which can be substantially observed or corroborated in the marketplace. |
| • | Level 3 – Valuations in this level are those with inputs for the asset or liability that are not based on observable market data. |
The carrying values of cash and cash equivalents, accounts receivable and accounts payable and accrued liabilities approximated fair value at December 31, 2012 and 2011 as the amounts were short term in nature or bore interest at floating rates. The long-term debt approximates fair value as interest rates and margins are reflective of current market rates. The fair value of the convertible debentures is disclosed in Note 6 and is based on the trading price of the debentures at the reporting date (Level 1). These assets and liabilities are not presented in the following tables.
79
Table of Contents
As at December 31, 2012 and 2011, the only asset or liability measured at fair value on a recurring basis are the commodity contracts. The following tables provide fair value measurement information for such assets and liabilities as of December 31, 2012 and 2011.
| As at December 31, 2012 |
||||||||||||||||||||
| Fair Value Measurements Using: | ||||||||||||||||||||
| (in thousands of Canadian dollars) |
Carrying Amount |
Fair Value |
Level 1 | Level 2 | Level 3 | |||||||||||||||
| Commodity contracts asset |
1,605 | 1,605 | — | 1,605 | — | |||||||||||||||
| As at December 31, 2011 |
||||||||||||||||||||
| Fair Value Measurements Using: | ||||||||||||||||||||
| (in thousands of Canadian dollars) |
Carrying Amount |
Fair Value |
Level 1 | Level 2 | Level 3 | |||||||||||||||
| Commodity contracts asset |
4,813 | 4,813 | — | 4,813 | — | |||||||||||||||
| (b) | Financial risk management |
In the normal course of operations, Equal is exposed to various market risks such as liquidity, credit, interest rate, foreign exchange and commodity risk. To manage these risks, management determines what activities must be undertaken to minimize potential exposure to risks. The objectives of Equal to managing risk are as follows:
Objectives:
| • | maintaining sound financial condition; |
| • | financing operations; and |
| • | ensuring liquidity in the U.S. operations. |
In order to satisfy the objectives above, Equal has adopted the following policies:
| • | prepare budget documents at prevailing market rates to ensure clear, corporate alignment to performance management and achievement of targets; |
| • | recognize and observe the extent of operating risk within the business; |
| • | identify the magnitude of the impact of market risk factors on the overall risk of the business and take advantage of natural risk reductions that arise from these relationships; and |
| • | utilize financial instruments, including derivatives to manage the remaining residual risk to levels that are within the risk tolerance of the Company. |
The objective with respect to the utilization of derivative financial instruments is to selectively mitigate the impact of fluctuations in commodity prices. The use of any derivative instruments is carried out in accordance with approved limits as authorized by the board of directors and imposed by external financial covenants. It is not the intent of Equal to use financial derivatives or commodity instruments for trading or speculative purposes and no financial derivatives have been designated as accounting hedges.
(i) Market risks
Oil and gas commodity price risks
The Company has a risk management policy which is in line with the terms of its bank credit facility that permits management to use specified price risk management strategies for up to 65% of its estimated net oil and gas production which includes fixed price contracts, costless collars and the purchase of floor price options and other derivative instruments to reduce the impact of price volatility and ensure minimum prices for a maximum of 36 months. The program is designed to provide price protection on a portion of Equal’s future production in the event of adverse commodity price movement, while retaining exposure to upside price movements. By doing this, Equal seeks to provide a measure of stability and predictability of cash inflows to enable it to carry out its planned capital spending programs.
80
Table of Contents
Equal has entered into commodity contracts to minimize the exposure to fluctuations in crude oil and natural gas prices. At December 31, 2012, the following financial derivative contracts were outstanding:
| Derivative Instrument |
Commodity | Price (2) |
Volume per day (2) |
Period | ||||
| Fixed | Gas | 3.45 (US$/mmbtu) (3.57 US$/mcf) |
2,000 mmbtu (1,932 mcf) |
January 1, 2013 – December 31, 2013 | ||||
| Fixed | Gas | 3.60 (US$/mmbtu) (3.73 US$/mcf) |
3,000 mmbtu (2,899 mcf) |
January 1, 2013 – December 31, 2013 | ||||
| Fixed | Gas | 3.61 (US$/mmbtu) (3.74 US$/mcf) |
2,000 mmbtu (1,932 mcf) |
January 1, 2013 – December 31, 2013 | ||||
| Fixed | Gas | 3.65 (US$/mmbtu) (3.78 US$/mcf) |
2,000 mmbtu (1,932 mcf) |
January 1, 2013 – December 31, 2013 | ||||
| Fixed | Gas | 3.70 (US$/mmbtu) (3.83 US$/mcf) |
2,000 mmbtu (1,932 mcf) |
January 1, 2013 – December 31, 2013 | ||||
| Fixed | Gas | 4.05 (US$/mmbtu) (4.19 US$/mcf) |
2,000 mmbtu (1,932 mcf) |
January 1, 2013 – December 31, 2013 | ||||
| Fixed | Gas | 3.99 (US$/mmbtu) (4.13 US$/mcf) |
1,000 mmbtu (966 mcf) |
January 1, 2013 – December 31, 2013 | ||||
| Fixed | Gas | 4.25 (US$/mmbtu) (4.40 US$/mcf) |
2,000 mmbtu (1,932 mcf) |
January 1, 2014 – December 31, 2014 | ||||
| Fixed Basis Differential (1) | Gas | Differential Fixed @ ($0.21 US$/mcf) |
7,000 mmbtu (6,763 mcf) |
January 1, 2013 – December 31, 2013 | ||||
| Fixed Basis Differential (1) | Gas | Differential Fixed @ ($0.212 US$/mcf) |
5,000 mmbtu (4,831 mcf) |
January 1, 2013 – December 31, 2013 | ||||
| Fixed | Oil | 101.50 ($/bbl) | 200 bbl | January 1, 2013 – December 31, 2013 |
| (1) | NYMEX / Southern Star (Oklahoma) basis differential. |
| (2) | Conversion rate of 1.0350 mmbtu per mcf. |
The following sensitivities show the result to pre-tax net income for year ended December 31, 2012 related to commodity contracts of the respective changes in crude oil, natural gas and fixed basis differential.
| Increase (decrease) to pre-tax net income | ||||||||
| (in thousands of Canadian dollars) |
Decrease in market price ($1.00 per bbl and $0.50 per mcf) |
Increase in market price ($1.00 per bbl and $0.50 per mcf) |
||||||
| Crude oil derivative contracts |
73 | (73 | ) | |||||
| Natural gas derivative contracts |
2,920 | (2,920 | ) | |||||
| Decrease in differential price ($0.02 per mcf) |
Increase in differential price ($0.02 per mcf) |
|||||||
| Fixed basis differential contracts |
(88 | ) | 88 | |||||
Foreign exchange currency risks
Equal is exposed to foreign currency risk from its U.S. division and U.S. denominated working capital. Equal has not entered into any foreign exchange derivative contracts to mitigate its currency risks as at December 31, 2012 and 2011.
81
Table of Contents
Changes in the U.S. to Canadian foreign exchange rates affect other comprehensive income as the U.S. division is considered a self-sustaining foreign operation. The following financial instruments were denominated in U.S. dollars as at December 31, 2012:
| (in thousands of dollars) As at December 31, 2012 |
Canadian division (in U.S. dollars) |
U.S. division (in U.S. dollars) |
||||||
| Cash and cash equivalents |
9,319 | 5,810 | ||||||
| Accounts receivable |
— | 14,458 | ||||||
| Prepaid expenses, deposits and other |
— | 558 | ||||||
| Commodity contracts |
— | 896 | ||||||
| Accounts payable |
(4 | ) | (7,534 | ) | ||||
| Long-term debt |
— | — | ||||||
|
|
|
|
|
|||||
| Net exposure |
9,315 | 14,188 | ||||||
|
|
|
|
|
|||||
| Effect of a $0.02 increase in U.S. to Cdn exchange rate: |
||||||||
| Change to pre-tax net income |
186 | — | ||||||
| Change to other comprehensive income |
— | 284 | ||||||
|
|
|
|
|
|||||
| Effect of a $0.02 decrease in U.S. to Cdn exchange rate: |
||||||||
| Change to pre-tax net income |
(186 | ) | — | |||||
| Change to other comprehensive income |
— | (284 | ) | |||||
|
|
|
|
|
|||||
Interest rate risk
Interest rate risk arises on the outstanding long-term debt that bears interest at floating rates.
Equal has not entered into any derivative contracts to mitigate the risks related to fluctuations in interest rates as at December 31, 2012 and 2011. The following sensitivities show the impact to pre-tax net income for the year ended December 31, 2012 of the respective changes in market interest rates (increase / (decrease)) based on the average debt balance outstanding during the year.
| (in thousands of Canadian dollars) |
Change to pre-tax net income | |||||||
| 1% decrease in market interest rates |
1% increase in market interest rates |
|||||||
| Interest on long-term debt |
402 | (402 | ) | |||||
The convertible debentures bear interest at fixed rates.
(ii) Credit risk
Credit risk is the risk of loss if counterparties do not fulfill their contractual obligations and arises principally from trade, joint venture receivables, long-term receivables as well as any derivative financial instruments in a receivable position. Equal does not hold any collateral from counterparties. The maximum exposure to credit risk is the carrying amount of the related amounts receivable.
Should Equal determine that the ultimate collection of a receivable is in doubt based on the processes for managing credit risk, it will provide the necessary provision in its allowance for doubtful accounts with a corresponding charge to earnings. If Equal subsequently determines an account is uncollectible, the account is written off with a corresponding decrease in the allowance for doubtful accounts.
The credit quality of financial assets has been assessed and adequately evaluated for impairment based on historical information about the nature of the counterparties.
Purchasers of the natural gas, crude oil and natural gas liquids comprise a substantial portion of accounts receivable. A portion of accounts receivable are with joint venture partners in the oil and gas industry. Equal takes the following precautions to reduce credit risk:
| • | the financial strength of the counterparties is assessed; |
| • | the total exposure is reviewed regularly and extension of credit is limited; and |
| • | collateral may be required from some counterparties. |
82
Table of Contents
(iii) Liquidity risks
Liquidity risk is the risk that Equal will not be able to meet its financial obligations as they are due. Equal mitigates this risk through actively managing its capital, which it defines as shareholders’ equity, convertible debentures and long-term debt less cash and cash equivalents. Management of liquidity risk over the short and longer term, includes continual monitoring of forecasted and actual cash flows to ensure sufficient liquidity to meet financial obligations when due and maintaining a flexible capital management structure. Equal strives to balance the proportion of debt and equity in its capital structure given its current oil and gas assets and planned investment opportunities.
All financial liabilities have short-term maturities with the exception of the long-term debt (Note 5), the 6.75% convertible debentures (Note 6) and the liabilities from discontinued operations, as set out below:
Commitments & Obligations (in thousands of Canadian dollars)
| 2013 | 2014 | 2015 | 2016 | 2017 and past |
Total | |||||||||||||||||||
| Long-term debt (1) |
— | — | — | — | — | — | ||||||||||||||||||
| Interest on long-term debt (2) |
625 | 313 | — | — | — | 938 | ||||||||||||||||||
| Convertible debentures (3) |
— | — | — | 45,000 | — | 45,000 | ||||||||||||||||||
| Interest on convertible debentures (3) |
3,038 | 3,038 | 3,038 | 759 | — | 9,873 | ||||||||||||||||||
| Accounts payable & accrued liabilities |
8,600 | — | — | — | — | 8,600 | ||||||||||||||||||
| Office leases |
985 | 995 | 1,007 | 763 | — | 3,750 | ||||||||||||||||||
| Vehicle leases |
150 | 133 | 72 | 44 | — | 399 | ||||||||||||||||||
| Liabilities from discontinued operations |
5,840 | — | — | — | 783 | 6,623 | ||||||||||||||||||
|
|
|
|
|
|
|
|
|
|
|
|
|
|||||||||||||
| Total |
19,238 | 4,479 | 4,117 | 46,566 | 783 | 75,183 | ||||||||||||||||||
|
|
|
|
|
|
|
|
|
|
|
|
|
|||||||||||||
| (1) | The bank credit facility was undrawn as of December 31, 2012. If the bank credit facility is not renewed in June 2013, any outstanding balance is to be paid by June 2014. |
| (2) | Interest is based on the standby-charge of 0.5% for the unused balance of the bank credit facility. |
| (3) | The convertible debentures bear interest at 6.75% per annum and mature March 31, 2016. |
| 11. | Taxes |
Income Tax Benefit Expense
The (loss) earnings from continuing operations before income taxes and the components of income tax (benefit) expense for the years 2012, 2011 and 2010 were as follows:
| (in thousands of Canadian dollars) |
2012 | 2011 | 2010 | |||||||||
| Current income tax expense |
||||||||||||
| U.S. federal and state |
— | 391 | 295 | |||||||||
| Deferred income tax expense |
||||||||||||
| U.S. federal and state |
6,834 | 10,441 | 6,814 | |||||||||
|
|
|
|
|
|
|
|||||||
| Total income tax expense |
6,834 | 10,832 | 7,109 | |||||||||
|
|
|
|
|
|
|
|||||||
83
Table of Contents
The taxes on the results of discontinued operations presented in the accompanying consolidated statements of operations were all related to Equal’s Canadian operations.
The income tax provision differs from the amount of tax expense calculated by applying the U.S. federal income tax rate to earnings (loss) from continuing operations before income taxes as a result of the following:
| (in thousands of Canadian dollars) |
2012 | 2011 | 2010 | |||||||||
| Earnings (loss) from continuing operations before income taxes: |
37,945 | 10,834 | 10,724 | |||||||||
| Combined federal and state income tax rate |
37.96 | % | 37.96 | % | 37.96 | % | ||||||
|
|
|
|
|
|
|
|||||||
| Computed income tax expense (reduction) |
14,404 | 4,113 | 4,071 | |||||||||
| Increase (decrease) resulting from: |
||||||||||||
| Other non-deductible items |
1,355 | 1,883 | 842 | |||||||||
| Difference between U.S. and Canadian tax rates and foreign exchange and change in tax rates |
(4,784 | ) | 4,104 | 4,365 | ||||||||
| Other |
(4,141 | ) | 732 | (2,169 | ) | |||||||
|
|
|
|
|
|
|
|||||||
| 6,834 | 10,832 | 7,109 | ||||||||||
|
|
|
|
|
|
|
|||||||
Deferred Tax Assets and Liabilities
The components of the net deferred income tax assets at December 31 were as follows:
| (in thousands of Canadian dollars) |
2012 | 2011 | ||||||
| Deferred income tax assets: |
||||||||
| Non-capital loss carry-forwards and other |
11,949 | 13,399 | ||||||
| Asset retirement obligations |
1,792 | 2,001 | ||||||
| Property, plant and equipment |
20,197 | 27,668 | ||||||
|
|
|
|
|
|||||
| 33,938 | 43,068 | |||||||
| Deferred income tax liabilities: |
||||||||
| Commodity contracts |
(337 | ) | (1,775 | ) | ||||
|
|
|
|
|
|||||
| Net deferred income tax assets |
33,601 | 41,293 | ||||||
|
|
|
|
|
|||||
Non-capital loss carry-forwards amongst Canadian and U.S. subsidiaries, totaled $67.2 million (2011 – $85.3 million) and expire from 2014 to 2028.
As shown in the above table, Equal has recognized $33.9 million of deferred tax assets as of December 31, 2012. Included in total deferred tax assets is $11.9 million related to various carry-forwards available to offset future income taxes. The carry-forwards consist of $11.9 million net operating loss carry-forwards, which expire primarily between 2013 and 2034. The tax benefits of carry-forwards are recorded as an asset to the extent that management assesses the utilization of such carry-forwards to be “more likely than not.” When the future utilization of some portion of the carry-forwards is determined not to be “more likely than not,” a valuation allowance is provided to reduce the recorded tax benefits from such assets.
Equal expects the tax benefits from the net operating loss carry-forwards to be utilized between 2013 and 2015. Such expectation is based upon current estimates of taxable income during this period, considering limitations on the annual utilization of these benefits as set forth by tax regulations. Significant changes in such estimates caused by variables such as future oil and gas prices or capital expenditures could alter the timing of the eventual utilization of such carry-forwards. There can be no assurance that Equal will generate any specific level of continuing taxable earnings. However, management believes that Equal’s future taxable income will more likely than not be sufficient to utilize substantially all its tax carry-forwards prior to their expiration.
84
Table of Contents
For the U.S. tax returns, the open taxation years range from 2010 to 2012. The U.S. federal statute of limitations for assessment of income tax is generally closed for the tax years ending on or prior to 2005. In certain circumstances, the U.S. federal statute of limitations can reach beyond the standard three year period. U.S. state statutes of limitations for income tax assessment vary from state to state. Tax authorities of U.S. have not audited any of Equal’s, or its subsidiaries’, income tax returns for the open taxation years noted above.
Equal recognizes interest and penalties related to uncertain tax positions in tax expense. During the years ended December 31, 2012 and 2011, there were no charges for interest or penalties, nor a provision for uncertain tax positions.
| 12. | Interest Expense |
Equal’s interest expense was comprised of the following below.
Interest Expense (in thousands of Canadian)
| Year ended December 31 | ||||||||||||
| 2012 | 2011 | 2010 | ||||||||||
| Interest expense on long-term debt |
3,757 | 4,222 | 1,616 | |||||||||
| Interest expense on convertible debentures |
3,038 | 7,088 | 9,684 | |||||||||
|
|
|
|
|
|
|
|||||||
| Interest expense before allocation to discontinued operations |
6,795 | 11,310 | 11,300 | |||||||||
| Interest expense allocated to discontinued operations(1) |
(883 | ) | (1,470 | ) | (1,469 | ) | ||||||
|
|
|
|
|
|
|
|||||||
| Total interest expense of continuing operations |
5,912 | 9,840 | 9,831 | |||||||||
|
|
|
|
|
|
|
|||||||
| (1) | Interest expense allocated to discontinued operations was 13% of the total interest expense. |
| 13. | Discontinued Operations |
On May 3, 2012, Equal announced that its Board of Directors initiated a strategic review process to identify, examine and consider alternatives with the view to enhancing shareholder value. As a result of the strategic review process, the Company completed the following asset sales from which the proceeds were used to pay down the Company’s outstanding bank debt:
| • | on September 24, 2012, the Northern Oklahoma assets were sold for total cash consideration of US$40.0 million to its Mississippian joint venture partner; |
| • | on October 15, 2012, the assets in the Halkirk, Wainwright, Alliance and Clair areas of Alberta sold for $15.4 million in addition with the transfer of substantially all of its non-producing, suspended and abandoned wells in Alberta; |
| • | on November 2, 2012, the assets in the Lochend Cardium were sold for $62.1 million; and |
| • | on December 13, 2012, the royalty and fee title lands in Western Canada were sold for $12.1 million. |
The three Canadian asset sales in Q4 2012 for total proceeds of $89.6 million resulted in the discontinuation of operations in Canada. Prior to the initiation of the Strategic Review, there was a Canadian asset sale for proceeds of $8.3 million which included heavy oil properties in Saskatchewan.
Prior to the discontinued operations, Equal had two reportable segments consisting of Canada and the U.S. The operations and balance sheets of the Canadian segment are summarized in this note and the U.S. segment’s operations and consolidated balance sheet are on the consolidated balance sheets and statements of operations.
85
Table of Contents
Summarized results from discontinued operations were as follows:
| Discontinued Operations | For the year ended December 31 | |||||||||||
| (in thousands of Canadian dollars) |
2012 | 2011 | 2010 | |||||||||
| Revenues |
27,465 | 61,085 | 61,694 | |||||||||
|
|
|
|
|
|
|
|||||||
| Income from discontinued operations |
53,380 | 9,718 | 9,252 | |||||||||
| Tax expense |
(22,664 | ) | (4,347 | ) | (22,209 | ) | ||||||
|
|
|
|
|
|
|
|||||||
| Discontinued operations, net of taxes |
30,716 | 5,371 | (12,957 | ) | ||||||||
|
|
|
|
|
|
|
|||||||
Included in the 2012 income from discontinued operations is a $56.8 million gain on sale of assets ($42.6 million net of tax) and direct costs related to the disposal of the Canadian operations totaling $6.6 million which include costs paid for advisory fees, legal fees, severance and termination of contracts.
The carrying amounts of the major classes of assets and liabilities of discontinued operations in the consolidated balance sheets were as follows:
| Discontinued Operations | As at December 31 | |||||||
| (in thousands of Canadian dollars) |
2012 | 2011 | ||||||
| Accounts receivable |
1,463 | 5,432 | ||||||
| Prepaid expenses, deposits and other |
130 | 318 | ||||||
| Capital assets to be disposed |
575 | — | ||||||
|
|
|
|
|
|||||
| Total current assets |
2,168 | 5,750 | ||||||
| Oil and natural gas properties, full cost method of accounting: |
||||||||
| Proved |
— | 27,191 | ||||||
| Unproved |
— | 13,818 | ||||||
|
|
|
|
|
|||||
| Total oil and natural gas properties |
— | 41,009 | ||||||
| Other capital assets |
— | 867 | ||||||
|
|
|
|
|
|||||
| Total property, plant and equipment |
— | 41,876 | ||||||
| Deferred income tax asset |
— | 22,695 | ||||||
|
|
|
|
|
|||||
| Total assets of discontinued operations |
2,168 | 70,321 | ||||||
| Accounts payable and accrued liabilities |
5,810 | 9,566 | ||||||
| Current portion of asset retirement obligation |
30 | 1,321 | ||||||
|
|
|
|
|
|||||
| Total current liabilities |
5,840 | 10,887 | ||||||
| Asset retirement obligation |
783 | 8,564 | ||||||
|
|
|
|
|
|||||
| Total liabilities of discontinued operations |
6,623 | 19,451 | ||||||
|
|
|
|
|
|||||
The asset retirement obligation in Canada of $0.8 million is under dispute as it is the Company’s position that this obligation should be the responsibility of two different entities as part of asset sales.
| 14. | Contingencies |
Certain claims have been brought against Equal in the ordinary course of business. In the opinion of management, all such claims are adequately covered by insurance, or if not so covered, are not expected to materially affect the Company’s financial position or results of operations.
86
Table of Contents
| 15. | Accumulated Other Comprehensive Income/(Loss) |
| (in thousands of Canadian dollars) |
||||
| Balance, December 31, 2009 |
(19,394 | ) | ||
| Cumulative translation of self-sustaining operations |
(6,552 | ) | ||
|
|
|
|||
| Balance, December 31, 2010 |
(25,946 | ) | ||
| Cumulative translation of self-sustaining operations |
4,829 | |||
|
|
|
|||
| Balance, December 31, 2011 |
(21,117 | ) | ||
| Cumulative translation of self-sustaining operations |
(5,101 | ) | ||
|
|
|
|||
| Balance at December 31, 2012 |
(26,218 | ) | ||
|
|
|
|||
Accumulated other comprehensive income/(loss) is comprised entirely of currency translation adjustments on the U.S. operations.
| 16. | Supplemental Information on Oil and Natural Gas Producing Activities (Unaudited) |
The supplemental information includes capitalized costs related to oil and natural gas producing activities; costs incurred in oil and natural gas property acquisition, exploration and development; and the results of operations for oil and natural gas producing activities. Supplemental information is also provided for oil and natural gas production and average sales prices; the estimated quantities of proved oil and natural gas reserves; the standardized measure of discounted future net cash flows associated with proved oil and natural gas reserves; and a summary of the changes in the standardized measure of discounted future net cash flows associated with proved oil and natural gas reserves. All historical Canadian reserves information has been excluded from this supplemental information because all Canadian assets were sold during 2012 and the results of the Canadian operations have been recorded as discontinued operations in the Company’s financial statements.
Capitalized Costs Related to Oil and Natural Gas Producing Activities
The Company’s capitalized costs for oil and natural gas activities consisted of the following (in thousands):
| December 31, | ||||||||||||
| 2012 | 2011 | 2010 | ||||||||||
| Oil and natural gas properties |
||||||||||||
| Proved |
$ | 498,686 | $ | 527,784 | $ | 411,498 | ||||||
| Unproved |
2,080 | 4,627 | 4,374 | |||||||||
|
|
|
|
|
|
|
|||||||
| Total oil and natural gas properties |
500,766 | 532,411 | 415,872 | |||||||||
| Less accumulated depreciation, depletion and impairment |
(353,244 | ) | (354,367 | ) | (336,430 | ) | ||||||
|
|
|
|
|
|
|
|||||||
| Net oil and natural gas properties capitalized costs |
$ | 147,522 | $ | 178,044 | $ | 76,442 | ||||||
|
|
|
|
|
|
|
|||||||
87
Table of Contents
Costs Incurred in Oil and Natural Gas Property Acquisition, Exploration and Development
Costs incurred in oil and natural gas property acquisition, exploration and development activities which have been capitalized are summarized as follows (in thousands):
| Year Ended December 31, | ||||||||||||
| 2012 | 2011 | 2010 | ||||||||||
| Acquisitions of properties |
||||||||||||
| Proved |
$ | — | $ | 91,675 | $ | 5,485 | ||||||
| Exploration |
2,395 | 2,980 | 1,808 | |||||||||
| Development |
22,085 | 31,245 | 5,914 | |||||||||
|
|
|
|
|
|
|
|||||||
| Total cost incurred |
$ | 24,480 | $ | 125,900 | $ | 13,207 | ||||||
|
|
|
|
|
|
|
|||||||
Results of Operations for Oil and Natural Gas Producing Activities
The Company’s results of operations from oil and natural gas producing activities for each of the years 2012, 2011 and 2010 are shown in the following table (in thousands):
| Year Ended December 31, | ||||||||||||
| 2012 | 2011 | 2010 | ||||||||||
| Revenues (1) |
$ | 61,478 | $ | 70,512 | $ | 51,206 | ||||||
| Expenses |
||||||||||||
| Production costs |
20,457 | 16,908 | 10,462 | |||||||||
| Production taxes |
3,754 | 3,312 | 2,639 | |||||||||
| Depreciation and depletion |
22,888 | 14,936 | 4,262 | |||||||||
| Accretion of asset retirement obligations |
405 | 248 | 175 | |||||||||
|
|
|
|
|
|
|
|||||||
| Total expenses |
47,504 | 35,404 | 17,718 | |||||||||
|
|
|
|
|
|
|
|||||||
| Income before income taxes |
13,974 | 35,108 | 33,488 | |||||||||
| Income taxes(2) |
(5,305 | ) | (13,327 | ) | (12,712 | ) | ||||||
|
|
|
|
|
|
|
|||||||
| Results of operations for oil and natural gas producing activities (excluding corporate overhead and interest costs) |
$ | 8,669 | $ | 21,781 | $ | 20,776 | ||||||
|
|
|
|
|
|
|
|||||||
| Depletion and depreciation rate ($ per boe) |
$ | 8.70 | $ | 7.41 | $ | 2.90 | ||||||
|
|
|
|
|
|
|
|||||||
| (1) | Excludes gains on commodity contracts |
| (2) | Reflects the Company’s effective tax rate. |
Oil and Natural Gas Reserve Quantities
Proved oil and natural gas reserves are those quantities of oil and natural gas, which, by analysis of geoscience and engineering data, can be estimated with reasonable certainty to be economically producible, based on prices used to estimate reserves, from a given date forward from known reservoirs, and under existing economic conditions, operating methods, and government regulation prior to the time at which contracts providing the right to operate expire, unless evidence indicates that renewal is reasonably certain.
The term “reasonable certainty” implies a high degree of confidence that the quantities of oil and/ or natural gas actually recovered will equal or exceed the estimate. To achieve reasonable certainty, the Company’s engineers and independent petroleum consultants relied on technologies that have been demonstrated to yield results with consistency and repeatability. The technologies and economic data used to estimate the Company’s proved reserves include, but are not limited to, well logs, geologic maps, seismic data, well test data, production data, historical price and cost information and property ownership interests. The accuracy of the reserve estimates is dependent on many factors, including the following:
88
Table of Contents
| • | the quality and quantity of available data and the engineering and geological interpretation of that data; |
| • | estimates regarding the amount and timing of future costs, which could vary considerably from actual costs; |
| • | the accuracy of mandated economic assumptions such as the future prices of oil and natural gas; and |
| • | the judgment of the personnel preparing the estimates. |
Proved developed reserves are proved reserves expected to be recovered through existing wells with existing equipment and operating methods or in which the cost of the required equipment is relatively minor compared with the cost of a new well. Proved undeveloped reserves are reserves that are expected to be recovered from new wells on undrilled acreage, or from existing wells where a relatively large major expenditure is required for recompletion.
The table below represents the Company’s estimate of proved oil and natural gas reserves attributable to the Company’s net interest in oil and natural gas properties, all of which are located in the continental United States, based upon the evaluation by the Company and its independent petroleum engineers of pertinent geoscience and engineering data in accordance with the SEC’s regulations. Estimates of all of the Company’s proved reserves have been prepared by independent reservoir engineers and geoscience professionals and are reviewed by members of the Company’s senior management with professional training in petroleum engineering to ensure that the Company consistently applies rigorous professional standards and the reserve definitions prescribed by the SEC.
Haas Petroleum Engineering Services, Inc., independent oil and natural gas consultants, prepared the estimates of proved reserves of oil and natural gas attributable to all of the Company’s net interest in oil and natural gas properties as of the end of 2012, 2011 and 2010. Haas is an independent petroleum engineering, geological, geophysical and petrophysical organization.
The Company believes the geoscience and engineering data examined provides reasonable assurance that the proved reserves are economically producible in future years from known reservoirs, and under existing economic conditions, operating methods and governmental regulations. Estimates of proved reserves are subject to change, either positively or negatively, as additional information is available and contractual and economic conditions change.
2010 Activity. During 2010, the Company recognized additional proved reserves of 3.5 MMboe, which were primarily attributable to the positive revisions based on well performance and improved liquids yield recognition. Continuing well performance that exceeded prior years’ engineering assumptions and improved geological mapping of the Hunton field resulted in per well booking of reserves for proved, undeveloped locations. Three wells (1.6 net) were drilled during 2010, adding 105 Mboe of new reserves. One well (0.8 net) was drilled in the liquids rich natural gas Hunton play and two (0.8 net) Circus oil wells were drilled.
Production of proved reserves during 2010 totaled 82 Mbbls of oil, 662 Mbbls of NGL, and 4,363 MMcf of natural gas.
2011 Activity. During 2011 the Company recognized additional proved reserves of 8.8 MMboe. The primary event that affected reserves was the Hunton acquisition that was completed in June of 2011 for a total of US$91.7 million adding approximately 6.7 MMboe of proved reserves. Positive technical revisions of proved reserves were experienced in 2011 in the amount of 0.8 Mboe as producing wells continued to perform above prior years’ expectations. A total of 13 wells (11.3 net) were drilled in 2011 targeting liquids rich Hunton natural gas and to preserve rights in the emerging Mississippian oil play. The drilling program added 3.3 MMboe of reserves during 2011.
Production of proved reserves during 2011 totaled 77 Mbbls of oil, 877 Mbbls of NGL, and 6,373 MMcf of natural gas.
89
Table of Contents
2012 Activity. During 2012 the Company recognized a reduction of proved reserves of 4.9 MMboe. Equal drilled three (2.7 net) wells in the Twin Cities Central Dolomite area of its central Oklahoma Hunton play, adding a total of 2.7 MMboe of proved reserves. Negative revisions of proved reserves was experienced in 2012 for 3.2 MMboe, primarily in the booking of proven undeveloped reserves relating to reduced working interests in the PUD’s booked and an overall reduction in future development capital recorded. Dispositions of Hunton reserves in northern Oklahoma removed 1.8 MMboe of reserves.
Production of proved reserves during 2012 totaled 63 Mbbls of oil, 1,185 Mbbls of NGL and 8,295 MMcf of natural gas.
The summary below presents changes in the Company’s estimated reserves for 2010, 2011 and 2012.
| Oil | Natural Gas Liquids |
Natural Gas |
Oil Equivalent |
|||||||||||||
| (Mbbls) | (Mbbls) | (MMcf) | (Mboe) | |||||||||||||
| Proved developed and undeveloped reserves |
||||||||||||||||
| As of December 31, 2009 |
512 | 5,662 | 37,099 | 12,357 | ||||||||||||
| Revisions of previous estimates |
18 | 1,660 | 16,234 | 4,384 | ||||||||||||
| Acquisitions of new reserves |
81 | 199 | 961 | 440 | ||||||||||||
| Extensions and discoveries |
— | 44 | 367 | 105 | ||||||||||||
| Sales of reserves in place |
— | — | — | — | ||||||||||||
| Production |
(82 | ) | (662 | ) | (4,363 | ) | (1,471 | ) | ||||||||
|
|
|
|
|
|
|
|
|
|||||||||
| As of December 31, 2010 |
529 | 6,903 | 50,298 | 15,815 | ||||||||||||
| Revisions of previous estimates |
(257 | ) | 804 | 1,543 | 804 | |||||||||||
| Acquisitions of new reserves |
210 | 2,522 | 23,972 | 6,727 | ||||||||||||
| Extensions and discoveries |
1 | 1,276 | 12,170 | 3,305 | ||||||||||||
| Sales of reserves in place |
— | — | — | — | ||||||||||||
| Production |
(77 | ) | (877 | ) | (6,373 | ) | (2,016 | ) | ||||||||
|
|
|
|
|
|
|
|
|
|||||||||
| As of December 31, 2011 |
406 | 10,628 | 81,610 | 24,636 | ||||||||||||
| Revisions of previous estimates |
(9 | ) | (1,137 | ) | (12,395 | ) | (3,212 | ) | ||||||||
| Acquisitions of new reserves |
— | — | — | — | ||||||||||||
| Extensions and discoveries |
43 | 947 | 10,260 | 2,700 | ||||||||||||
| Sales of reserves in place |
(109 | ) | (360 | ) | (7,807 | ) | (1,770 | ) | ||||||||
| Production |
(63 | ) | (1,185 | ) | (8,295 | ) | (2,631 | ) | ||||||||
|
|
|
|
|
|
|
|
|
|||||||||
| As of December 31, 2012 |
268 | 8,893 | 63,373 | 19,723 | ||||||||||||
|
|
|
|
|
|
|
|
|
|||||||||
90
Table of Contents
| Oil | Natural Liquids |
Natural Gas |
Oil Equivalent |
|||||||||||||
| (Mbbls) | (Mbbls) | (MMcf) | (Mboe) | |||||||||||||
| Proved developed reserves of December 31, 2012 |
268 | 7,410 | 52,263 | 16,389 | ||||||||||||
| Proved undeveloped reserves of December 31, 2012 |
— | 1,483 | 11,110 | 3,335 | ||||||||||||
| Oil | Natural Gas Liquids |
Natural Gas |
Oil Equivalent |
|||||||||||||
| (Mbbls) | (Mbbls) | (MMcf) | (Mboe) | |||||||||||||
| Proved developed reserves |
||||||||||||||||
| As of December 31, 2009 |
508 | 4,342 | 26,325 | 9,238 | ||||||||||||
| As of December 31, 2010 |
529 | 4,543 | 31,063 | 10,249 | ||||||||||||
| As of December 31, 2011 |
406 | 7,824 | 59,649 | 18,172 | ||||||||||||
| Proved undeveloped reserves |
||||||||||||||||
| As of December 31, 2009 |
4 | 1,320 | 10,744 | 3,115 | ||||||||||||
| As of December 31, 2010 |
— | 2,360 | 19,235 | 5,566 | ||||||||||||
| As of December 31, 2011 |
— | 2,804 | 21,961 | 6,464 | ||||||||||||
Standardized Measure of Discounted Future Net Cash Flows (Unaudited)
The standardized measure of discounted cash flows and summary of the changes in the standardized measure computation from year to year are prepared in accordance with Accounting Standards Codification Topic 932, Extractive Activities—Oil and Gas (“ASC Topic 932”). The assumptions underlying the computation of the standardized measure of discounted cash flows may be summarized as follows:
| • | the standardized measure includes the Company’s estimate of proved oil, natural gas and natural gas liquids reserves and projected future production volumes based upon economic conditions; |
| • | pricing is applied based upon 12-month unweighted average index prices at December 31, 2012, 2011 and 2010. The prices realized by the Company differ from index prices; the Company receives daily average index prices, net of adjustments for transportation and regional price differentials. Calculated first of the month, 12-month unweighted arithmetic average per unit index prices, not inclusive of adjustments for transportation and regional price differentials, for the Company’s proved reserves and future net revenues were as follows: |
| At December 31, | ||||||||||||
| 2012 | 2011 | 2010 | ||||||||||
| Oil (US$ per Bbl) |
$ | 94.71 | $ | 96.19 | $ | 79.43 | ||||||
| Natural gas (US$ per mcf) |
$ | 2.86 | $ | 4.33 | $ | 4.54 | ||||||
| Natural gas liquids (% of WTI) |
37 | % | $ | 53 | % | $ | 51 | % | ||||
91
Table of Contents
| • | future development and production costs are determined based upon actual cost at year-end; |
| • | the standardized measure includes projections of future abandonment costs based upon actual costs at year-end; and |
| • | a discount factor of 10% per year is applied annually to the future net cash flows. |
92
Table of Contents
The summary below presents the Company’s future net cash flows relating to proved oil and natural gas reserves based on the standardized measure in ASC Topic 932 (in thousands).
| At December 31, | ||||||||||||
| 2012 | 2011 | 2010 | ||||||||||
| Future cash inflows from production |
$ | 453,905 | $ | 848,555 | $ | 492,322 | ||||||
| Future production costs |
(155,132 | ) | (201,328 | ) | (105,066 | ) | ||||||
| Future development costs(1) |
(28,075 | ) | (57,393 | ) | (36,997 | ) | ||||||
| Future income tax expenses |
— | (11,349 | ) | — | ||||||||
|
|
|
|
|
|
|
|||||||
| Undiscounted future net cash flows |
270,698 | 578,485 | 350,259 | |||||||||
| 10% annual discount |
(117,135 | ) | (273,239 | ) | (153,165 | ) | ||||||
|
|
|
|
|
|
|
|||||||
| Standardized measure of discounted future net cash flows |
$ | 153,563 | $ | 305,246 | $ | 197,093 | ||||||
|
|
|
|
|
|
|
|||||||
| (1) | Includes abandonment costs. |
The following table represents the Company’s estimate of changes in the standardized measure of discounted future net cash flows from proved reserves (in thousands):
| Present value as of December 31, 2009 |
$ | 83,770 | ||
| Changes during the year |
||||
| Revenues less production and other costs |
(38,015 | ) | ||
| Net changes in prices, production and other costs |
60,675 | |||
| Development costs incurred |
16,759 | |||
| Net changes in future development costs |
7,215 | |||
| Extensions and discoveries |
2,575 | |||
| Revisions of previous quantity estimates |
47,274 | |||
| Accretion of discount |
8,377 | |||
| Net change in income taxes |
2,720 | |||
| Purchases of reserves in-place |
10,778 | |||
| Sales of reserves in-place |
— | |||
| Other(1) |
(4,945 | ) | ||
|
|
|
|||
| Net change for the year |
11,323 | |||
| Present value as of December 31, 2010 |
197,093 | |||
| Changes during the year |
||||
| Revenues less production and other costs |
(50,292 | ) | ||
| Net changes in prices, production and other costs |
17,717 | |||
| Development costs incurred |
21,155 | |||
| Net changes in future development costs |
(40,588 | ) | ||
| Extensions and discoveries |
39,304 | |||
| Revisions of previous quantity estimates |
20,971 | |||
| Accretion of discount |
19,709 | |||
| Net change in income taxes |
(5,976 | ) |
93
Table of Contents
| Purchases of reserves in-place |
81,297 | |||
| Sales of reserves in-place |
— | |||
| Other(1) |
4,856 | |||
|
|
|
|||
| Net change for the year |
108,153 | |||
| Present value as of December 31, 2011 |
305,246 | |||
| Changes during the year |
||||
| Revenues less production and other costs |
(37,267 | ) | ||
| Net changes in prices, production and other costs |
(137,223 | ) | ||
| Development costs incurred |
7,705 | |||
| Net changes in future development costs |
20,238 | |||
| Extensions and discoveries |
40,484 | |||
| Revisions of previous quantity estimates |
(48,158 | ) | ||
| Accretion of discount |
30,525 | |||
| Net change in income taxes |
5,976 | |||
| Purchases of reserves in-place |
— | |||
| Sales of reserves in-place |
(26,542 | ) | ||
| Other(1) |
(7,421 | ) | ||
|
|
|
|||
| Net change for the year |
(152,432 | ) | ||
|
|
|
|||
| Present value as of December 31, 2012(2) |
$ | 153,563 | ||
|
|
|
| (1) | Primarily related to currency conversions. |
94
Table of Contents
| 17. | Summarized Quarterly Financial Information (unaudited) |
(in thousands of Canadian dollars except per share amounts)
| Full Year | 2012 | Full Year | 2011 | |||||||||||||||||||||||||||||||||||||
| 2012 | Q4 | Q3 | Q2 | Q1 | 2011 | Q4 | Q3 | Q2 | Q1 | |||||||||||||||||||||||||||||||
| Revenues |
64,393 | 14,960 | 11,793 | 19,034 | 18,606 | 78,311 | 18,727 | 27,018 | 23,393 | 9,173 | ||||||||||||||||||||||||||||||
|
|
|
|
|
|
|
|
|
|
|
|
|
|
|
|
|
|
|
|
|
|||||||||||||||||||||
| Income/(loss) before taxes from continuing operations |
37,945 | (1,245 | ) | 34,873 | 290 | 4,027 | 10,834 | 5,036 | 1,959 | 9,239 | (5,400 | ) | ||||||||||||||||||||||||||||
|
|
|
|
|
|
|
|
|
|
|
|
|
|
|
|
|
|
|
|
|
|||||||||||||||||||||
| Net income/(loss) from continuing operations |
31,111 | (5,153 | ) | 38,615 | (5,429 | ) | 3,078 | 2 | 92 | (1,885 | ) | 8,007 | (6,212 | ) | ||||||||||||||||||||||||||
|
|
|
|
|
|
|
|
|
|
|
|
|
|
|
|
|
|
|
|
|
|||||||||||||||||||||
| Net income/(loss) from discontinued operations |
30,716 | 28,057 | 3,346 | (1,566 | ) | 879 | 5,371 | (1,192 | ) | 810 | 1,131 | 4,622 | ||||||||||||||||||||||||||||
|
|
|
|
|
|
|
|
|
|
|
|
|
|
|
|
|
|
|
|
|
|||||||||||||||||||||
| Net income/(loss) |
61,827 | 22,904 | 41,961 | (6,995 | ) | 3,957 | 5,373 | (1,100 | ) | (1,075 | ) | 9,138 | (1,590 | ) | ||||||||||||||||||||||||||
|
|
|
|
|
|
|
|
|
|
|
|
|
|
|
|
|
|
|
|
|
|||||||||||||||||||||
| Basic net income/(loss) per |
||||||||||||||||||||||||||||||||||||||||
| Continuing operations |
0.89 | (0.15 | ) | 1.10 | (0.16 | ) | 0.09 | 0.00 | 0.00 | (0.05 | ) | 0.26 | (0.22 | ) | ||||||||||||||||||||||||||
|
|
|
|
|
|
|
|
|
|
|
|
|
|
|
|
|
|
|
|
|
|||||||||||||||||||||
| Discontinued operations |
0.87 | 0.80 | 0.10 | (0.04 | ) | 0.02 | 0.17 | (0.03 | ) | 0.02 | 0.04 | 0.16 | ||||||||||||||||||||||||||||
|
|
|
|
|
|
|
|
|
|
|
|
|
|
|
|
|
|
|
|
|
|||||||||||||||||||||
| Net income/(loss) |
1.76 | 0.65 | 1.20 | (0.20 | ) | 0.11 | 0.17 | (0.03 | ) | (0.03 | ) | 0.30 | (0.06 | ) | ||||||||||||||||||||||||||
|
|
|
|
|
|
|
|
|
|
|
|
|
|
|
|
|
|
|
|
|
|||||||||||||||||||||
| Diluted net income/(loss) per share ($ per share) |
||||||||||||||||||||||||||||||||||||||||
| Continuing operations |
0.82 | (0.15 | ) | 0.94 | (0.16 | ) | 0.09 | 0.00 | 0.00 | (0.05 | ) | 0.22 | (0.22 | ) | ||||||||||||||||||||||||||
|
|
|
|
|
|
|
|
|
|
|
|
|
|
|
|
|
|
|
|
|
|||||||||||||||||||||
| Discontinued operations |
0.76 | 0.68 | 0.08 | (0.04 | ) | 0.02 | 0.16 | (0.03 | ) | 0.02 | 0.04 | 0.14 | ||||||||||||||||||||||||||||
|
|
|
|
|
|
|
|
|
|
|
|
|
|
|
|
|
|
|
|
|
|||||||||||||||||||||
| Net income/(loss) |
1.58 | 0.57 | 1.03 | (0.20 | ) | 0.11 | 0.16 | (0.03 | ) | (0.03 | ) | 0.26 | (0.06 | ) | ||||||||||||||||||||||||||
|
|
|
|
|
|
|
|
|
|
|
|
|
|
|
|
|
|
|
|
|
|||||||||||||||||||||
95
Table of Contents
Item 9. Changes in and Disagreements with Accountants on Accounting and Financial Disclosure
Not Applicable.
Item 9A. Controls and Procedures
We have established disclosure controls and procedures to ensure that material information relating to Equal, including its consolidated subsidiaries, is made known to the officers who certify Equal’s financial reports and to other members of senior management and the Board of Directors.
Based on their evaluation, our principal executive and principal financial officers have concluded that our disclosure controls and procedures (as defined in Rules 13a-15(e) and 15d-15(e) under the Securities Exchange Act of 1934) were effective as of December 31, 2012 to ensure that the information required to be disclosed by Equal in the reports that it files or submits under the Securities Exchange Act of 1934 is recorded, processed, summarized and reported within the time periods specified in the SEC rules and forms.
Management’s Annual Report on Internal Control Over Financial Reporting
Our management is responsible for establishing and maintaining adequate internal control over financial reporting for Equal, as such term is defined in Rules 13a-15(f) and 15d-15(f) under the Securities Exchange Act of 1934. Under the supervision and with the participation of Equal’s management, including our principal executive and principal financial officers, we conducted an evaluation of the effectiveness of our internal control over financial reporting based on the framework in Internal Control — Integrated Framework issued by the Committee of Sponsoring Organizations of the Treadway Commission (the “COSO Framework”). Based on this evaluation under the COSO Framework, which was completed on March14, 2013, management concluded that its internal control over financial reporting was effective as of December 31, 2012.
The effectiveness of our internal control over financial reporting as of December 31, 2012 has been audited by KPMG LLP, an independent registered public accounting firm who audited our consolidated financial statements as of and for the year ended December 31, 2012, as stated in their report, which is included under “Item 8. Financial Statements and Supplementary Data” in this report.
Changes in Internal Control Over Financial Reporting
There was no change in our internal control over financial reporting during the fourth quarter of 2012 that has materially affected, or is reasonably likely to materially affect, our internal control over financial reporting.
Not Applicable.
Item 10. Directors, Executive Officers and Corporate Governance
The information called for by this Item 10 is incorporated herein by reference to the definitive Proxy Statement filed by Equal pursuant to Regulation 14A of the General Rules and Regulations under the Securities Exchange Act of 1934 on April 12, 2013.
Item 11. Executive Compensation
The information called for by this Item 11 is incorporated herein by reference to the definitive Proxy Statement filed by Equal pursuant to Regulation 14A of the General Rules and Regulations under the Securities Exchange Act of 1934 on April 12, 2013.
Item 12. Security Ownership of Certain Beneficial Owners and Management and Related Stockholder Matters
The information called for by this Item 12 is incorporated herein by reference to the definitive Proxy Statement filed by Equal pursuant to Regulation 14A of the General Rules and Regulations under the Securities Exchange Act of 1934 on April 12, 2013.
96
Table of Contents
Item 13. Certain Relationships and Related Transactions, and Director Independence
The information called for by this Item 13 is incorporated herein by reference to the definitive Proxy Statement filed by Equal pursuant to Regulation 14A of the General Rules and Regulations under the Securities Exchange Act of 1934 on April 12, 2013.
Item 14. Principal Accounting Fees and Services
External Auditor Service Fees
KPMG LLP audited the annual financial statements for the 2012 and 2011 fiscal year.
| (in $ thousands) |
2012 | 2011 | ||||||
| Audit fees (1) |
476.7 | 619.5 | ||||||
| Tax fees (2) |
56.8 | 21.2 | ||||||
| All other fees (3) |
— | 87.7 | ||||||
|
|
|
|
|
|||||
| Total |
533.8 | 728.4 | ||||||
|
|
|
|
|
|||||
Notes:
| (1) | Audit fees include professional services rendered by KPMG LLP for the audit of the annual consolidated financial statements as well as services provided in connection with statutory and regulatory filings and engagements as well as International Financial Reporting Standards, and prospectus documents. |
| (2) | Tax fees include fee for tax compliance, tax advice and tax planning. |
| (3) | All other fees related to advisory for International Financial Reporting Standards and document translation. |
Item 15. Exhibits and Financial Statement Schedules
(a) The following documents are filed as part of this report:
1. Consolidated Financial Statements
Reference is made to the Index to Consolidated Financial Statements and Consolidated Financial Statement Schedules appearing at “Item 8. Financial Statements and Supplementary Data” in this report.
2. Consolidated Financial Statement Schedules
All financial statement schedules are omitted as they are inapplicable, or the required information has been included in the consolidated financial statements or notes thereto.
3. Exhibits
| 3(ii) | Amendments to Bylaws; Change in Fiscal Year | |
| 10 | Equal Energy ltd. Stock Option Plan | |
| 10 | Equal Energy Ltd. Restricted Share and Performance Share Incentive Plan (2010) | |
| 2.1 | Notification that a class of securities of successor issuer is deemed to be registered pursuant to section 12(b), item 8.01 Plan of Arrangement where Enterra Energy Trust unitholders exchange units for shares of Equal Energy Ltd. The Arrangement was effected pursuant to Section 193 of the Business Corporation Act (Alberta) | |
| 31.1 | Section 302 Certification – Chief Executive Officer | |
| 31.2 | Section 302 Certification – Chief Financial Officer | |
| 32.1 | Section 906 Certification – Chief Executive Officer | |
| 32.2 | Section 906 Certification – Chief Financial Officer | |
| 99.1 | Report of Haas Petroleum Engineering Service, Inc. | |
97
Table of Contents
ABBREVIATIONS, CONVENTIONS AND CONVERSION FACTORS
ABBREVIATIONS
| Oil and Natural Gas Liquids | Natural Gas | |||||
| NGLs | natural gas liquids | mcf | thousand cubic feet of natural gas | |||
| bbls | barrels | MMcf | million cubic feet of natural gas | |||
| Mbbl | thousand barrels | Bcf | Billion cubic feet of natural gas | |||
| MMbbl | millions of barrels of oil | mcf/d | thousand cubic feet of natural gas per day | |||
| bbls/d | barrels per day | MMcf/d | million cubic feet of natural gas per day | |||
| mmbtu | millions of British Thermal Units | |||||
| Oil Equivalents (6 mcf:1 boe) | ||||||
| boe | barrels of oil equivalent | |||||
| Mboe | thousands of barrels of oil equivalent | |||||
| MMboe | millions of barrels of oil equivalent | |||||
| boe/d | barrels of oil equivalent per day | |||||
| Mboe/d | thousands of barrels of oil equivalent per day | |||||
| Other | ||
| API | American Petroleum Institute | |
| °API | an indication of the specific gravity of crude oil measured on the API gravity scale. Liquid petroleum with a specified gravity of 28°API or higher is generally referred to as light crude oil | |
| NI 51-101 | National Instrument 51-101 | |
| NYMEX | New York Mercantile Exchange | |
| Q1 | first quarter of the year - January 1 to March 31 | |
| Q2 | second quarter of the year - April 1 to June 30 | |
| Q3 | third quarter of the year - July 1 to September 30 | |
| Q4 | fourth quarter of the year - October 1 to December 31 | |
| SEC | Securities and Exchange Commission | |
| US$ | United States dollars | |
| WTI | West Texas Intermediate, the reference price paid in U.S. dollars at Cushing, Oklahoma for crude oil of standard grade | |
98
Table of Contents
CONVERSION FACTORS
The following table sets forth certain standard conversions from Standard Imperial Units to the International System of Units (or metric units):
| To Convert from | To | Multiply by | ||
| mcf | Cubic metres | 28.174 | ||
| Cubic metres | Cubic feet | 35.494 | ||
| bbls | Cubic metres | 0.159 | ||
| Cubic metres | bbls oil | 6.290 | ||
| Feet | Metres | 0.305 | ||
| Metres | Feet | 3.281 | ||
| Miles | Kilometres | 1.609 | ||
| Kilometres | Miles | 0.621 | ||
| Acres | Hectares | 0.4047 | ||
| Hectares | Acres | 2.471 |
GLOSSARY
The following are defined terms used in this report:
“6.75% Debentures” means the convertible unsecured junior subordinated debentures of the Company due March 31, 2016;
“ABCA” means the Business Corporations Act (Alberta);
“Common Shares” means common share in the capital stock of the corporation;
“Credit Facility” means a $105.0 million revolving credit facility with a syndicate of lenders, and a $20.0 million operating facility with Bank of Nova Scotia, as lender, provided pursuant to the Second Amended and Restated Credit Agreement;
“Debentures” means the 6.75% Debentures;
“Delaware GCL” means Delaware general corporation law;
“EEC” means Enterra Energy Corp., a corporation amalgamated under the ABCA;
“EEFI” means Equal Energy Finance Inc., a corporation incorporated under the laws of the State of Delaware;
“EEF(D)I” means Equal Energy Finance (Delaware) Inc., a corporation incorporated under the laws of the State of Delaware;
“EEPP” means the Equal Energy Production Partnership, a partnership organized pursuant to the laws of Alberta;
“EEPC” means Equal Energy Partner Corp., a corporation incorporated under the ABCA;
“EEUSHI” means Equal Energy US Holdings Inc., a corporation incorporated under the laws of the State of Delaware;
“EEUSI” means Equal Energy US Inc., a corporation incorporated under the laws of the State of Oklahoma;
“Equal”, “Equal Energy”, the “Corporation”, “we”, “our” or the “Company” means Equal Energy Ltd., a corporation amalgamated under the laws of the Province of Alberta and, where the context requires, the subsidiaries through which it conducts business;
“GAAP” means generally accepted accounting principles in the United States;
“Haas” means Haas Petroleum Engineering Services, Inc., independent petroleum engineering consultants;
99
Table of Contents
“Haas Report” means the independent engineering evaluation of certain oil, NGL and natural gas interests of the Corporation prepared by Haas dated February 6, 2013 and effective December 31, 2012;
“Non-Resident” means (a) a person who is not a resident of Canada for the purposes of the Tax Act and any applicable income tax convention; or (b) a partnership that is not a Canadian partnership for the purposes of the Tax Act;
“Operating Subsidiaries” means collectively, the direct and indirect subsidiaries of the Corporation that own and operate assets for the benefit of the Corporation (with the material Operating Subsidiaries being EEPC, EEPP, EEUSI, EEUSHI, EEFI, and EEF(D)I;
“Reserve Reports” means the Haas Report;
“Second Amended and Restated Credit Agreement” means the second amended and restated syndicated credit agreement dated June 25, 2010 as revised and updated, between Equal Energy and the Bank of Nova Scotia;
“Shareholder” means a holder of Common Shares;
“Tax Act” means the Income Tax Act (Canada) and the regulations thereunder, as amended from time to time;
“Trust” means Enterra Energy Trust, an unincorporated open-ended investment trust established under the laws of Alberta pursuant to the Trust Indenture;
“Trust Indenture” means the amended and restated trust indenture dated November 25, 2003 among Olympia Trust Company, as trustee, Luc Chartrand as settlor, and EEC, as may be amended, supplemented, and restated from time to time;
“Trust Units” means trust units of the Trust.
100
Table of Contents
Pursuant to the requirements of Section 13 or 15(d) of the Securities Exchange Act of 1934, the Registrant has duly caused this report to be signed on its behalf by the undersigned, thereunto duly authorized.
| EQUAL ENERGY LTD. | ||
| By: | /s/ DON KLAPKO | |
| Don Klapko | ||
| President and Chief Executive Officer | ||
December 26, 2013
Pursuant to the requirements of the Securities Exchange Act of 1934, this report has been signed below by the following persons on behalf of the Registrant and in the capacities and on the dates indicated.
| /s/ DON KLAPKO |
President, Chief Executive Officer and Director | December 26, 2013 | ||
| Don Klapko | ||||
| /s/ MICHAEL DOYLE |
Chairman of the Board and Director | December 26, 2013 | ||
| Michael Doyle | ||||
| /s/ SCOTT SMALLING |
Senior Vice President Finance and Chief Financial Officer | December 26, 2013 | ||
| Scott Smalling |
||||
| /s/ MICHAEL COFFMAN |
Director | December 26, 2013 | ||
| Michael Coffman | ||||
| /s/ LEE CANAAN |
Director | December 26, 2013 | ||
| Lee Canaan | ||||
| /s/ VICTOR DUSIK |
Director | December 26, 2013 | ||
| Victor Dusik | ||||
| /s/ PAUL KYLE TRAVIS |
Director | December 26, 2013 | ||
| Paul Kyle Travis | ||||
| /s/ ROBERT WILKINSON |
Director | December 26, 2013 | ||
| Robert Wilkinson | ||||
101
Table of Contents
| Incorporated by Reference | ||||||||||||
| Exhibit No. |
Exhibit Description |
Form |
SEC File No. |
Exhibit |
Filing Date |
Filed Herewith | ||||||
| 3(ii) | Amendments to Bylaws; Change in Fiscal Year | 8-K | 001-34759 | 3.1 | 2013-01-25 | |||||||
| 10 | Equal Energy Ltd. Stock Option Plan | S-8 | 333-167236 | 10.1 | 2010-06-01 | |||||||
| 10 | Equal Energy Ltd. Restricted Share and Performance Share Incentive Plan (2010) | S-8 | 333-167236 | 10.2 | 2010-06-01 | |||||||
| 2.1 | Notification that a class of securities of successor issuer is deemed to be registered pursuant to section 12(b), item 8.01 Plan of Arrangement where Enterra Energy Trust unitholders exchange units for shares of Equal Energy Ltd. The Arrangement was effected pursuant to Section 193 of the Business Corporation Act (Alberta) | 8-K12B/A | 001-34759 | 3.1 | 2010-06-01 | |||||||
| 31.1 | Section 302 Certification – Chief Executive Officer | * | ||||||||||
| 31.2 | Section 302 Certification – Chief Financial Officer | * | ||||||||||
| 32.1 | Section 906 Certification – Chief Executive Officer | * | ||||||||||
| 32.2 | Section 906 Certification – Chief Financial Officer | * | ||||||||||
| 99.1 | Report of Haas Petroleum Engineering Service, Inc. | * | ||||||||||
102