Attached files
| file | filename |
|---|---|
| EX-31.1 - EX-31.1 - EQUAL ENERGY LTD. | d702424dex311.htm |
| EX-31.2 - EX-31.2 - EQUAL ENERGY LTD. | d702424dex312.htm |
| EXCEL - IDEA: XBRL DOCUMENT - EQUAL ENERGY LTD. | Financial_Report.xls |
| EX-32.1 - EX-32.1 - EQUAL ENERGY LTD. | d702424dex321.htm |
| EX-32.2 - EX-32.2 - EQUAL ENERGY LTD. | d702424dex322.htm |
Table of Contents
UNITED STATES
SECURITIES AND EXCHANGE COMMISSION
Washington, D.C. 20549
Form 10-Q
(Mark One)
| x | QUARTERLY REPORT UNDER SECTION 13 OR 15(d) OF THE SECURITIES EXCHANGE ACT OF 1934 |
For the quarterly period ended March 31, 2014
or
| ¨ | TRANSITION REPORT PURSUANT TO SECTION 13 OR 15(d) OF THE SECURITIES EXCHANGE ACT OF 1934 |
Commission File Number 001-34759
EQUAL ENERGY LTD.
(Exact name of registrant as specified in its charter)
| Alberta, Canada | 98-0533758 | |
| (State of other jurisdiction of incorporation or organization) |
(I.R.S. Employer identification No.) |
| 4801 Gaillardia Pkwy, Suite 325 Oklahoma City, OK |
73142 | |
| (Address of principal executive offices) | (Zip code) |
Registrant’s telephone number, including area code:
(405) 242-6000
Indicate by check mark whether the registrant (1) has filed all reports required to be filed by Section 13 or 15(d) of the Securities Exchange Act of 1934 during the preceding 12 months (or for such shorter period that the registrant was required to file such reports), and (2) has been subject to such filing requirements for the past 90 days. Yes x No ¨
Indicate by check mark whether the registrant has submitted electronically and posted on its corporate Web site, if any, every Interactive Data File required to be submitted and posted pursuant to Rule 405 of Regulation S-T during the preceding 12 months (or for such shorter period that the registrant was required to submit and post such files). Yes x No ¨
Indicate by check mark whether the registrant is a large accelerated filer, an accelerated filer, a non-accelerated filer, or a smaller reporting company. See the definitions of “large accelerated filer,” “accelerated filer” and “smaller reporting company” in Rule 12b-2 of the Exchange Act. (Check one):
| Large accelerated filer | ¨ | Accelerated filer | x | |||
| Non-accelerated filer | ¨ (Do not check if a smaller reporting company) | Smaller reporting company | ¨ | |||
Indicate by check mark whether the registrant is a shell company (as defined in Rule 12b-2 of the Exchange Act). Yes ¨ No x
As of May 5, 2014, there were 36,100,788 shares of our common stock, par value $0.01, outstanding.
Table of Contents
TABLE OF CONTENTS
| Part I Financial Information | ||||
| Item 1. Consolidated Financial Statements |
||||
| 3 | ||||
| 4 | ||||
| 5 | ||||
| 6 | ||||
| 7 | ||||
| Item 2. Management’s Discussion and Analysis of Financial Condition and Results of Operations |
13 | |||
| Item 3. Quantitative and Qualitative Disclosures About Market Risk |
23 | |||
| 24 | ||||
| 25 | ||||
| 25 | ||||
| Item 2. Unregistered Sales of Equity Securities and Use of Proceeds |
25 | |||
| 25 | ||||
| 26 | ||||
| 26 | ||||
| 26 | ||||
| 27 | ||||
Page 1 of 28
Table of Contents
EQUAL ENERGY LTD.
GLOSSARY
| Oil and Natural Gas Liquids | Natural Gas | |||||
| NGLs | natural gas liquids | mcf | thousand cubic feet of natural gas | |||
| bbls | barrels | MMcf | million cubic feet of natural gas | |||
| Mbbls | thousand barrels | Bcf | Billion cubic feet of natural gas | |||
| MMbls | millions of barrels of oil | mcf/d | thousand cubic feet of natural gas per day | |||
| bbls/d | barrels per day | MMcf/d | million cubic feet of natural gas per day | |||
| mmbtu | millions of British Thermal Units | |||||
| Oil Equivalents (6 mcf:1 boe) | ||||||
| boe | barrels of oil equivalent | |||||
| Mboe | thousands of barrels of oil equivalent | |||||
| MMboe | millions of barrels of oil equivalent | |||||
| boe/d | barrels of oil equivalent per day | |||||
| Mboe/d | thousands of barrels of oil equivalent per day | |||||
In this Form 10-Q, all currency amounts are in United States dollars unless otherwise indicated. References to “CAD $” refer to Canadian dollars.
Page 2 of 28
Table of Contents
CONSOLIDATED BALANCE SHEETS
| (unaudited) ( in thousands) |
March 31, 2014 | December 31, 2013 | ||||||
| Assets |
||||||||
| Current assets |
||||||||
| Cash and cash equivalents |
$ | 17,477 | $ | 15,631 | ||||
| Accounts receivable, net |
15,234 | 13,581 | ||||||
| Prepaid expenses, deposits and other |
715 | 1,051 | ||||||
|
|
|
|
|
|||||
| Total current assets |
33,426 | 30,263 | ||||||
| Oil and natural gas properties, full cost method of accounting: |
||||||||
| Proved, net of accumulated depletion of $247 million and $243 million, respectively |
159,745 | 162,061 | ||||||
| Unproved |
4,064 | 4,014 | ||||||
|
|
|
|
|
|||||
| Total oil and natural gas properties |
163,809 | 166,075 | ||||||
| Other capital assets, net of accumulated depreciation of $0.8 million and $0.8 million, respectively |
224 | 152 | ||||||
|
|
|
|
|
|||||
| Total property, plant and equipment, net |
164,033 | 166,227 | ||||||
| Other assets |
882 | 989 | ||||||
| Deferred income tax asset |
29,150 | 30,906 | ||||||
|
|
|
|
|
|||||
| Total assets |
$ | 227,491 | $ | 228,385 | ||||
|
|
|
|
|
|||||
| Liabilities |
||||||||
| Current liabilities |
||||||||
| Accounts payable and accrued liabilities |
$ | 10,841 | $ | 17,134 | ||||
| Asset retirement obligation |
284 | 278 | ||||||
| Commodity contracts |
1,235 | 341 | ||||||
|
|
|
|
|
|||||
| Total current liabilities |
12,360 | 17,753 | ||||||
| Convertible debentures |
40,707 | 42,309 | ||||||
| Asset retirement obligation |
4,451 | 4,362 | ||||||
|
|
|
|
|
|||||
| Total liabilities |
57,518 | 64,424 | ||||||
|
|
|
|
|
|||||
| Shareholders’ Equity |
||||||||
| Common shares, $0.01 par value unlimited authorized shares, and 36,100,788 and 35,806,337 shares issued and outstanding, respectively |
361 | 358 | ||||||
| Additional paid-in capital |
230,886 | 230,574 | ||||||
| Accumulated other comprehensive loss |
(102,102 | ) | (102,102 | ) | ||||
| Retained earnings |
40,828 | 35,131 | ||||||
|
|
|
|
|
|||||
| Total shareholders’ equity |
169,973 | 163,961 | ||||||
|
|
|
|
|
|||||
| Total liabilities and shareholders’ equity |
$ | 227,491 | $ | 228,385 | ||||
|
|
|
|
|
|||||
See accompanying notes to the consolidated financial statements.
Page 3 of 28
Table of Contents
CONSOLIDATED STATEMENTS OF INCOME and COMPREHENSIVE INCOME
| Three months ended March 31, | ||||||||
| (unaudited) (in thousands, except per share data) |
2014 | 2013 | ||||||
| Revenues |
||||||||
| NGL, natural gas and oil revenues |
$ | 22,146 | $ | 14,805 | ||||
| Loss on commodity contracts |
(2,062 | ) | (3,271 | ) | ||||
|
|
|
|
|
|||||
| Total revenues |
20,084 | 11,534 | ||||||
| Expenses |
||||||||
| Production |
4,061 | 3,455 | ||||||
| Production taxes |
753 | 926 | ||||||
| General and administrative, including share-based compensation |
3,312 | 3,154 | ||||||
| Interest expense |
879 | 949 | ||||||
| Depletion and depreciation |
4,518 | 4,867 | ||||||
| Amortization of deferred charges |
110 | 110 | ||||||
| Accretion of asset retirement obligation |
95 | 101 | ||||||
| Gain on sale of assets |
(23 | ) | (28 | ) | ||||
| Foreign exchange gain |
(1,526 | ) | (969 | ) | ||||
|
|
|
|
|
|||||
| Total expenses |
12,179 | 12,565 | ||||||
|
|
|
|
|
|||||
| Income (loss) from continuing operations before taxes |
$ | 7,905 | $ | (1,031 | ) | |||
| Taxes |
||||||||
| Current tax expense |
(63 | ) | — | |||||
| Deferred tax (expense) benefit |
(1,756 | ) | 801 | |||||
|
|
|
|
|
|||||
| Income/(loss) from continuing operations |
6,086 | (230 | ) | |||||
| Discontinued operations: |
||||||||
| Income (loss) from discontinued operations |
(328 | ) | 1,762 | |||||
|
|
|
|
|
|||||
| Net income |
$ | 5,758 | $ | 1,532 | ||||
| Other comprehensive income/(loss) |
||||||||
| Foreign currency translation adjustment |
— | 61 | ||||||
|
|
|
|
|
|||||
| Comprehensive income |
$ | 5,758 | $ | 1,593 | ||||
| Earnings per share information : |
||||||||
| Basic earnings (loss) per share from continuing operations |
$ | 0.17 | $ | (0.01 | ) | |||
| Basic earnings (loss) per share from discontinued operations |
(0.01 | ) | 0.05 | |||||
|
|
|
|
|
|||||
| Basic earnings per share |
$ | 0.16 | $ | 0.04 | ||||
| Diluted earnings (loss) per share from continuing operations |
$ | 0.16 | $ | (0.01 | ) | |||
| Diluted earnings (loss) per share from discontinued operations |
(0.01 | ) | 0.05 | |||||
|
|
|
|
|
|||||
| Diluted earnings per share |
$ | 0.15 | $ | 0.04 | ||||
|
|
|
|
|
|||||
See notes to the consolidated financial statements.
Page 4 of 28
Table of Contents
CONSOLIDATED STATEMENTS OF CHANGES IN SHAREHOLDERS’ EQUITY
(unaudited) (in thousands)
|
Common Stock |
Additional Paid-In Capital |
Retained Earnings |
Accumulated Other Comprehensive Loss |
Total Stockholders’ Equity |
||||||||||||||||||||
| Shares | Amount | |||||||||||||||||||||||
| Balances at December 31, 2013 |
35,806 | $ | 358 | $ | 230,574 | $ | 35,131 | $ | (102,102 | ) | $ | 163,961 | ||||||||||||
| Issue of common shares under restricted share plan |
283 | 3 | (3 | ) | — | — | — | |||||||||||||||||
| Share-based compensation before capitalization |
— | — | 254 | — | — | 254 | ||||||||||||||||||
| Stock Dividend |
12 | — | 61 | (61 | ) | — | — | |||||||||||||||||
| Income and comprehensive income for the period |
— | — | — | 5,758 | — | 5,758 | ||||||||||||||||||
|
|
|
|
|
|
|
|
|
|
|
|
|
|||||||||||||
| Balances at March 31, 2014 |
36,101 | $ | 361 | $ | 230,886 | $ | 40,828 | $ | (102,102 | ) | $ | 169,973 | ||||||||||||
|
|
|
|
|
|
|
|
|
|
|
|
|
|||||||||||||
See accompanying notes to the consolidated financial statements.
Page 5 of 28
Table of Contents
CONSOLIDATED STATEMENTS OF CASH FLOWS
(unaudited)
| Three months ended March 31, | ||||||||
| (unaudited) (in thousands) |
2014 | 2013 | ||||||
| Operating Activities |
||||||||
| Net income |
$ | 5,758 | $ | 1,532 | ||||
| Net (income) loss from discontinued operations |
328 | (1,762 | ) | |||||
| Adjustments to reconcile net income to net cash provided by operating activities: |
||||||||
| Depletion and depreciation |
4,518 | 4,867 | ||||||
| Accretion of asset retirement obligation |
95 | 101 | ||||||
| Cash paid on asset retirement obligation |
(2 | ) | — | |||||
| Share-based compensation |
254 | 307 | ||||||
| Amortization of deferred charges |
110 | 110 | ||||||
| Loss on commodity contracts |
2,062 | 3,271 | ||||||
| Cash (payments) receipts from settled derivatives |
(1,168 | ) | 486 | |||||
| Gain on sale of assets |
(23 | ) | (28 | ) | ||||
| Deferred tax (benefit) / expense |
1,756 | (801 | ) | |||||
| Unrealized foreign exchange gain |
(1,526 | ) | (969 | ) | ||||
| Change in assets and liabilities: |
||||||||
| Accounts receivable |
(1,653 | ) | 218 | |||||
| Prepaid expenses and other current assets |
336 | 22 | ||||||
| Accounts payable and accrued liabilities |
(2,274 | ) | 2,974 | |||||
|
|
|
|
|
|||||
| Net cash provided by operating activities – continuing operations |
8,571 | 10,328 | ||||||
| Net cash used in operating activities – discontinued operations |
(328 | ) | (2,716 | ) | ||||
|
|
|
|
|
|||||
| Net cash provided by operating activities |
8,243 | 7,612 | ||||||
|
|
|
|
|
|||||
| Investing Activities |
||||||||
| Property, plant and equipment additions |
(6,420 | ) | (7,363 | ) | ||||
| Proceeds on sale of property, plant and equipment |
23 | — | ||||||
|
|
|
|
|
|||||
| Net cash used in investing activities |
(6,397 | ) | (7,363 | ) | ||||
|
|
|
|
|
|||||
| Financing Activities |
||||||||
| Dividend |
— | (1,805 | ) | |||||
|
|
|
|
|
|||||
| Net cash used in financing activities |
— | (1,805 | ) | |||||
|
|
|
|
|
|||||
| Foreign exchange on financial balances |
— | — | ||||||
|
|
|
|
|
|||||
| Change in cash and cash equivalents |
1,846 | (1,556 | ) | |||||
| Cash and cash equivalents, beginning of period |
15,631 | 23,086 | ||||||
|
|
|
|
|
|||||
| Cash and cash equivalents, end of period |
$ | 17,477 | $ | 21,530 | ||||
|
|
|
|
|
|||||
| Supplementary Cash Flow Information |
||||||||
| Interest paid |
$ | 1,373 | $ | 1,518 | ||||
| Income tax paid |
— | — | ||||||
|
|
|
|
|
|||||
See accompanying notes to the consolidated financial statements.
Page 6 of 28
Table of Contents
NOTES TO CONSOLIDATED FINANCIAL STATEMENTS
(unaudited)
| 1. | Basis of Presentation and Significant Accounting Policies |
Equal Energy Ltd. (“Equal” or the “Company”) is a publicly listed company whose common shares trade on both the Toronto Stock Exchange (“TSX”) and the New York Stock Exchange (“NYSE”) under the symbol EQU. Equal is engaged in the exploration, development and production of Natural Gas Liquids (“NGLs”), natural gas and oil in the United States and conducts many of its activities jointly with others. These consolidated financial statements reflect only the Company’s proportionate interest in such activities.
As required by Rule 3b-4(c) of the United States Securities Exchange Act of 1934, as amended, and Rule 405 of the United States Securities Act of 1933, as amended, Equal has adopted generally accepted accounting principles in the United States of America (“U.S. GAAP”) for financial reporting.
The accompanying unaudited consolidated financial statements have been prepared pursuant to the rules and regulations of the United States Securities and Exchange Commission (“SEC”). Pursuant to such rules and regulations, certain disclosures normally included in financial statements prepared in accordance with U.S. GAAP have been omitted. The accompanying consolidated financial statements should be read in conjunction with the Company’s consolidated financial statements included in Equal’s Annual Report on Form 10-K for the year ended December 31, 2013, filed with the SEC on March 17, 2014. The accompanying unaudited interim consolidated financial statements reflect all adjustments that are, in the opinion of management, necessary for a fair presentation of the Company’s financial position as of March 31, 2014, and the Company’s results of operations and cash flows for the three month periods ended March 31, 2014 and 2013.
Foreign Currency Transactions
As a result of the 2012 strategic review, all of Equal’s Canadian oil and gas assets were sold in Q4 2012. Starting in January 2013, the Company changed its functional currency from the Canadian dollar to the U.S. dollar, as the Company primarily generates revenue and expends cash in U.S. dollars. In addition, effective January 1, 2013, the Company changed its reporting currency from the Canadian dollar to the U.S. dollar.
RECENTLY ADOPTED ACCOUNTING STANDARDS
Effective January 1, 2014, Equal adopted Accounting Standards Update (“ASU”) No. 2013-11, “Presentation of an Unrecognized Tax Benefit When a Net Operating Loss Carryforward, a Similar Tax Loss, or a Tax Credit Carryforward Exists” issued by the Financial Accounting Standards Board (“FASB”). This update requires the netting of unrecognized tax benefits against a deferred tax asset for a loss or other carryforward that would apply in settlement of the uncertain tax positions. Under the amended guidance, unrecognized tax benefits are netted against all available same-jurisdiction loss or other tax carryforwards that would be utilized, rather than only against carryforwards that are created by the unrecognized tax benefits. The updated guidance is applied prospectively, effective January 1, 2014. The adoption of this update concerns presentation and disclosure only as it relates to Equal’s consolidated financial statements and had no impact to the Company at March 31, 2014.
In March 2013, the FASB issued ASU 2013-05, “Foreign Currency Matters: Parent’s Accounting for the Cumulative Translation Adjustment upon Derecognition of Certain Subsidiaries or Groups of Assets within a Foreign Entity or of an Investment in a Foreign Entity.” This ASU provides guidance for transactions that require the entire amount of a cumulative translation adjustment related to an entity’s investment in a foreign entity to be released. This guidance is effective for annual and interim periods beginning after December 15, 2013, and had no impact to the Company at March 31, 2014.
| 2. | Accounts Receivable |
The components of account receivable include the following:
| (in thousands) |
March 31, 2014 | December 31, 2013 | ||||||
| Accounts receivable – trade |
$ | 13,399 | $ | 12,211 | ||||
| Accounts receivable – other |
2,103 | 1,733 | ||||||
| Allowance for doubtful accounts |
(268 | ) | (363 | ) | ||||
|
|
|
|
|
|||||
| $ | 15,234 | $ | 13,581 | |||||
|
|
|
|
|
|||||
Page 7 of 28
Table of Contents
EQUAL ENERGY LTD.
NOTES TO CONSOLIDATED FINANCIAL STATEMENTS
(unaudited)
| 3. | Long-Term Debt |
At March 31, 2014, the Company had a syndicated bank credit facility of CAD $125 million comprised of a CAD $105 million revolving credit facility and a CAD $20 million operating credit facility and can be drawn against in either Canadian dollars or the United States dollar equivalent. The revolving and operating credit facilities are secured with a first priority charge over the assets of Equal. The maturity date of the revolving and operating credit facilities is June 2014 and should the lenders decide not to renew the facility, the debt must be repaid by June 2015.
Interest rates and standby fees for the credit facilities are set quarterly according to a grid based on the ratio of bank debt to cash flow with the interest rates based on Canadian dollar BA (“Bankers Acceptance”) or U.S. dollar LIBOR rate plus 2.0% to 3.5%, depending on the ratio of bank debt to cash flow. For any unused balance of the credit facility, 0.50% to 0.88% is charged as a standby fee which is recorded in interest expense. At March 31, 2014, the marginal interest rate and standby fee were 2.0% and 0.5%, respectively.
Equal is required to maintain several financial and non-financial covenants. The primary financial covenant is an interest coverage ratio of 3:1 as calculated pursuant to the terms of the credit agreement. For the three months ended March 31, 2014, the interest coverage ratio was 10.58:1. At March 31, 2014, Equal was in compliance with the terms and covenants of the credit facilities. At March 31, 2014, no amount was borrowed against the credit facility and the entire balance of CAD $125 million was available.
| 4. | Convertible Debentures |
On February 9, 2011, Equal issued CAD $45 million of convertible unsecured junior subordinated debentures with a face value of CAD $1,000 per debenture that mature on March 31, 2016, and bear interest at 6.75% per annum paid semi-annually on March 31 and September 30 of each year. The 6.75% convertible debentures are convertible at the option of the holder into shares at any time prior to the maturity date at a conversion price of CAD $8.55 per share.
At March 31, 2014, the Company had CAD $45 million (US $40.7 million) in face value of 6.75% convertible debentures outstanding with an estimated fair value of US $41.0 million.
| 5. | Asset Retirement Obligation |
The following table reconciles the asset retirement obligation:
| (in thousands) |
March 31, 2014 | December 31, 2013 | ||||||
| Balance, beginning of period |
$ | 4,640 | $ | 4,746 | ||||
| Liabilities added |
— | 140 | ||||||
| Liabilities settled |
(2 | ) | (43 | ) | ||||
| Revision of estimated obligation |
2 | (614 | ) | |||||
| Accretion of expense on discounted obligation |
95 | 411 | ||||||
|
|
|
|
|
|||||
| Balance, end of period |
$ | 4,735 | $ | 4,640 | ||||
|
|
|
|
|
|||||
| Current portion of Obligation |
$ | 284 | $ | 278 | ||||
|
|
|
|
|
|||||
| 6. | Share-Based Compensation |
As a result of voting at the Company’s shareholders meeting in May 2013, no shares are currently available for future grants under either of the Company’s equity plans. The Company uses the ratable method for calculating compensation expense pursuant to ASC Topic 718, and recognized share-based compensation for share options and restricted shares in General and Administrative expense for the quarters ended March 31, 2014 and 2013.
Share Options
The Company records compensation expense for share options based on the estimated fair value of the options on the date of grant using the Black-Scholes option-pricing model. Total compensation expense recognized for stock options during the three months ended March 31, 2014 and 2013 was $14,000 and $(271,000), respectively. At March 31, 2014, there was $12,000 of unrecognized compensation expense related to share options, and that cost is expected to be recognized over a weighted-average period of 1.7 years. The amount of unrecognized compensation expense noted above does not necessarily represent the amount that will ultimately be realized by the Company in its consolidated statement of operations.
Page 8 of 28
Table of Contents
EQUAL ENERGY LTD.
NOTES TO CONSOLIDATED FINANCIAL STATEMENTS
(unaudited)
The following table summarizes Company’s stock option activities for the quarter ended March 31, 2014:
| Number of Options (000’s) |
Weighted Average Exercise Price Per Share |
Weighted Average Remaining Contractual Term |
Aggregate Intrinsic Value (000’s) |
|||||||||||||
| Options outstanding at December 31, 2013 |
289 | $ | 6.57 | |||||||||||||
| Options granted |
— | $ | — | |||||||||||||
| Options exercised |
— | $ | — | |||||||||||||
| Options forfeited |
— | $ | — | |||||||||||||
|
|
|
|
|
|
|
|
|
|||||||||
| Options outstanding at March 31, 2014 |
289 | $ | 6.57 | 1.7 | $ | 77 | ||||||||||
| Options exercisable at March 31, 2014 |
48 | $ | 4.21 | 1.1 | $ | 77 | ||||||||||
|
|
|
|
|
|
|
|
|
|||||||||
| Vested and expected to vest in the future at March 31, 2014 |
289 | $ | 6.57 | 1.7 | $ | 77 | ||||||||||
Restricted Shares
Total compensation expense recognized for restricted shares during the three months ended March 31, 2014 and 2013 was $240,000 and $578,000, respectively. At March 31, 2014, there was $1.2 million of unrecognized compensation expense related to restricted shares, and that cost is expected to be recognized over a weighted-average period of 1.5 years. The amount of unrecognized compensation expense noted above does not necessarily represent the amount that will ultimately be realized by the Company in its consolidated statements of operations.
The following table summarizes Company’s non-vested restricted share activities for the quarter ended March 31, 2014:
| Number of Restricted Shares (in thousands) |
Weighted Average Grant Date Fair Value |
|||||||
| Restricted shares outstanding at December 31, 2013 |
981 | $ | 3.90 | |||||
| Restricted shares granted |
— | $ | — | |||||
| Restricted shares vested and issued |
(294 | ) | $ | 4.69 | ||||
| Restricted shares forfeited |
(17 | ) | $ | 3.07 | ||||
|
|
|
|
|
|||||
| Restricted shares outstanding at March 31, 2014 |
670 | $ | 3.57 | |||||
|
|
|
|
|
|||||
| 7. | Earnings per Share |
Basic earnings per share (“EPS”) is computed by dividing net income by the weighted-average number of common shares outstanding during the period. Diluted EPS is based on the combined weighted-average number of common shares and dilutive potential common shares outstanding which include, where appropriate, the assumed exercise of options. In computing diluted EPS, the Company utilizes the treasury stock method.
Page 9 of 28
Table of Contents
EQUAL ENERGY LTD.
NOTES TO CONSOLIDATED FINANCIAL STATEMENTS
(unaudited)
The computation of weighted-average common and common equivalent shares used in the calculation of basic and diluted EPS is shown in the following table (in thousands, except share and per share data):
| Three Months Ended | ||||||||
| March 31, | ||||||||
| 2014 | 2013 | |||||||
| Net Income (loss) - Continuing Operations |
$ | 6,086 | $ | (230 | ) | |||
| Net Income (loss) - Discontinued Operations |
(328 | ) | 1,762 | |||||
|
|
|
|
|
|||||
| Total Net Income |
$ | 5,758 | $ | 1,532 | ||||
|
|
|
|
|
|||||
| Basic EPS: |
||||||||
| Weighted-average common shares |
36,062,850 | 35,453,248 | ||||||
|
|
|
|
|
|||||
| Basic EPS - Continuing Operations |
$ | 0.17 | $ | (0.01 | ) | |||
|
|
|
|
|
|||||
| Basic EPS - Discontinued Operations |
$ | (0.01 | ) | $ | 0.05 | |||
|
|
|
|
|
|||||
| Basic EPS - Combined |
$ | 0.16 | $ | 0.04 | ||||
|
|
|
|
|
|||||
| Net Income (loss) - Continuing Operations |
$ | 6,086 | $ | (230 | ) | |||
| Plus: Income impact of assumed conversion: |
||||||||
| Interest on 6.75% convertible debentures |
659 | — | ||||||
|
|
|
|
|
|||||
| Income (loss) after effect of assumed conversion |
$ | 6,745 | $ | (230 | ) | |||
|
|
|
|
|
|||||
| Weighted average shares outstanding, basic |
36,062,850 | 35,453,248 | ||||||
| Shares issuable pursuant to restricted shares |
465,957 | 824,108 | ||||||
| Shares issuable pursuant to dividend equivalent rights |
29,942 | — | ||||||
| Shares issuable pursuant to stock options |
23,274 | 1,712 | ||||||
| Shares issuable pursuant to convertible debentures |
5,263,158 | — | ||||||
|
|
|
|
|
|||||
| Weighted average shares outstanding, diluted |
41,845,181 | 36,279,068 | ||||||
|
|
|
|
|
|||||
| Diluted EPS - Continuing Operations |
$ | 0.16 | $ | (0.01 | ) | |||
| Diluted EPS - Discontinued Operations |
$ | (0.01 | ) | $ | 0.05 | |||
|
|
|
|
|
|||||
| Diluted EPS - Combined |
$ | 0.15 | $ | 0.04 | ||||
|
|
|
|
|
|||||
For the calculation of the weighted average number of diluted shares outstanding for the quarter ended March 31, 2014, the restricted shares, dividend equivalent rights, and convertible debenture shares were included as they were dilutive to the calculation. 217,295 of the stock options were excluded from the calculation as they were anti-dilutive because their exercise prices were higher than the average share price during the quarter.
For the calculation of the weighted average number of diluted shares outstanding for the quarter ended March 31, 2013, the restricted shares were included as they were dilutive to the calculation. The convertible debentures and all options, except for the 34,500 options granted in February 2013, were excluded from the calculation as they were anti-dilutive.
| 8. | Fair Value Measurements |
Financial instruments are presented at fair value in the Company’s balance sheets. To estimate fair values of financial instruments, the Company utilizes three levels of input: Level 1, defined as observable inputs for identical instruments such as quoted prices in active markets; Level 2, defined as inputs, other than quoted prices in active markets, that are either directly or indirectly observable; and Level 3, defined as unobservable inputs in which little or no market data exists, therefore requiring an entity to develop its own assumptions. Due to the unavailability of relevant comparable market data for the Company’s fixed price swaps, the discounted cash flow method is used to estimate fair values by discounting future cash flows based on quoted forward prices for commodities and a risk-adjusted discount rate. Such fair value calculation is then compared to the counterparty valuation for reasonableness.
Page 10 of 28
Table of Contents
EQUAL ENERGY LTD.
NOTES TO CONSOLIDATED FINANCIAL STATEMENTS
(unaudited)
The carrying values of cash, accounts receivable, net, accounts payable and accrued liabilities included in the accompanying consolidated balance sheets approximated fair value at March 31, 2014, and December 31, 2013. The fair value of the convertible debentures is disclosed in Note 4 and is based on the trading price of the debentures at the reporting date (Level 1). These assets and liabilities are not presented in the following tables.
The only asset or liability measured at fair value on a recurring basis is the commodity contracts. The fair values of these contracts are based on a market approach and are estimated using inputs which are either directly or indirectly observable at the reporting date, such as exchange and other published prices, broker quotes and observable trading activity. The following tables provide fair value measurement information for commodity derivatives as of March 31, 2014 and December 31, 2013.
| As of March 31, 2014 |
||||||||||||||||||||
| Fair Value Measurements Using: | ||||||||||||||||||||
| (in thousands of dollars) |
Carrying Amount |
Fair Value | Level 1 | Level 2 | Level 3 | |||||||||||||||
| Commodity contracts liability |
1,235 | 1,235 | — | 1,235 | — | |||||||||||||||
| As of December 31, 2013 |
||||||||||||||||||||
| Fair Value Measurements Using: | ||||||||||||||||||||
| (in thousands of dollars) |
Carrying Amount |
Fair Value | Level 1 | Level 2 | Level 3 | |||||||||||||||
| Commodity contracts liability |
341 | 341 | — | 341 | — | |||||||||||||||
Equal’s convertible debentures actively trade in an established market. There were no transfers in or out of Level 1 or Level 2 measurements for the three months ended March 31, 2014, or the 12 months ended December 31, 2013. The Company’s policy is to recognize transfers between levels as of the beginning of the period in which the event triggering the transfer occurs. The Company had no Level 3 financial instruments at any time during the three months ended March 31, 2014 or 2013.
Page 11 of 28
Table of Contents
EQUAL ENERGY LTD.
NOTES TO CONSOLIDATED FINANCIAL STATEMENTS
(unaudited)
| 9. | Commodity Contracts |
To minimize the exposure to fluctuations in crude oil and natural gas prices, Equal periodically enters into commodity contracts including fixed price swaps, which currently equal approximately 80% of Equal’s natural gas production and approximately 11% of the Company’s oil and NGL production. Such commodity contracts do not qualify for hedge accounting treatment and thus are not designated as hedging instruments. As of March 31, 2014, Equal had financial derivative contracts outstanding with four counterparties. Equal’s commodity contracts are summarized in the table below.
| Derivative Instrument |
Commodity | Price | Volume per day | Period | ||||
| Fixed |
Gas | 4.25 ($/mmbtu) | 2,000 mmbtu | January 1, 2014 – December 31, 2014 | ||||
| Fixed |
Gas | 4.05 ($/mmbtu) | 2,000 mmbtu | January 1, 2014 – December 31, 2014 | ||||
| Fixed |
Gas | 4.10 ($/mmbtu) | 2,000 mmbtu | January 1, 2014 – December 31, 2014 | ||||
| Fixed |
Gas | 4.06 ($/mmbtu) | 2,000 mmbtu | January 1, 2014 – December 31, 2014 | ||||
| Fixed |
Gas | 4.05 ($/mmbtu) | 4,000 mmbtu | January 1, 2014 – December 31, 2014 | ||||
| Fixed |
Gas | 4.34 ($/mmbtu) | 2,000 mmbtu | January 1, 2014 – December 31, 2014 | ||||
| Fixed |
Gas | 4.55 ($/mmbtu) | 2,000 mmbtu | March 1, 2014 – December 31, 2014 | ||||
| Fixed |
Oil | 95.00 ($/bbl) | 200 bbl | March 1, 2014 – December 31, 2014 | ||||
| Fixed |
Normal Butane (1) | 54.60 ($/bbl) | 200 bbl | April 1, 2014 – September 30, 2014 |
| (1) | Conway, Propane (in-well) OPIS |
| 10. | Discontinued Operations |
In 2012, Equal announced that its Board of Directors initiated a strategic review process to identify, examine and consider alternatives with the view to enhance shareholder value. As a result of the strategic review process, the Company sold all of its Canadian assets and certain of its Oklahoma assets.
The Canadian asset sales in late 2012 resulted in the discontinuation of operations in Canada. Prior to the initiation of the strategic review, there was a Canadian asset sale which included heavy oil properties in Saskatchewan. Certain Northern Oklahoma assets, which were not included in discontinued operations, were sold in 2012.
The loss of $0.3 million from discontinued operations for the three months ended March 31, 2014, primarily relates to abandonment costs. Income of $1.8 million from discontinued operations for the same period last year primarily relates to post-closing adjustments.
| 11. | Contingencies |
Equal is party to various legal actions arising in the normal course of business. Matters that are probable of unfavorable outcome to Equal and which can be reasonably estimated are accrued. Such accruals are based on information known about the matters, Equal’s estimates of the outcomes, and its experience in contesting, litigating and settling similar matters. To management’s knowledge, there were no pending legal proceedings which would result in amounts material to Equal’s financial position or results of operations. Actual amounts could differ materially from management’s estimates.
On January 14, 2014, Equal Energy shareholder Johan Van Weelden brought a separate lawsuit in the U.S. District Court for Western District of Oklahoma against Equal Energy, its directors and Petroflow: Van Weelden v. Equal Energy Ltd., et al., No. 14-cv-0047-C. Subsequently three putative class actions were also filed by shareholders in the same federal court: Montemarano et al. v. Equal Energy Ltd., et al., No. 14-cv-0058-C; Cooke v. Equal Energy, Ltd., et al., No. 14-CV-0087-C; Scripture v. Equal Energy Ltd., et al., No. 14-cv-0114-C. These cases allege that disclosures relevant to the proposed Arrangement Agreement with Petroflow violate Section 14(a) and 20(a) of the Securities Exchange Act. Defendants have only recently been served in these matters, and litigation is still in its initial stages. Plaintiffs have moved to consolidate the cases, and the various plaintiffs’ counsel are engaging in motion practice regarding who should be appointed as lead counsel. Plaintiff Montemarano has also moved to obtain early discovery from Equal Energy. Briefing of these matters is ongoing.
| 12. | Subsequent Events |
In preparing the accompanying consolidated financial statements, the Company has reviewed events that have occurred after March 31, 2014, through the issuance of the financial statements.
On April 30, 2014, Equal signed an amended Gas Purchase and Processing Agreement (the “Agreement”) with Scissortail Energy LLC (“Scissortail”), a subsidiary of Kinder Morgan. The primary amendments to the Agreement provide for an extension of its term and a revised pricing formula which will go into effect on August 1, 2014. The impact on Equal’s 2014 cash flow is expected to be a reduction of about $1.3 million, based on recent production levels and forward realized pricing of $35.70/bbl for NGL and $4.16/mmbtu for gas. The Agreement covers over 90% of Equal’s current gas production and secures a market for that production and planned future drilling for the next seven years, and as such provides a certain level of assurance for the strength of the Company’s future operations.
On May 1, 2014, the Arrangement Agreement was amended (the “Amendment”) subsequent to Petroflow securing debt financing commitment letters in order to (a) extend the outside termination date contained therein from May 1, 2014 to July 31, 2014, (b) permit Equal to declare and pay on or after May 1, 2014, and prior to the effective date of the Arrangement, a cash dividend of $0.05 per common share, (c) permit Equal to declare and pay to its common shareholders who are entitled to receive Arrangement consideration upon completion of the Arrangement a cash dividend of $0.05 cents per common share (the “Arrangement Dividend”) and (d) amend the approved budget for Equal agreed to by the parties in the Arrangement Agreement.
Page 12 of 28
Table of Contents
| ITEM 2. | MANAGEMENT’S DISCUSSION AND ANALYSIS OF FINANCIAL CONDITION AND RESULTS OF OPERATIONS |
Forward-Looking Statements
The information discussed in this quarterly report on Form 10-Q includes “forward-looking statements” within the meaning of Section 27A of the Securities Act of 1933 (the “Securities Act”) and Section 21E of the Securities Exchange Act of 1934 (the “Exchange Act”). All statements, other than statements of historical facts, included herein concerning, among other things, planned capital expenditures, changes in oil and gas production, the number of anticipated wells to be drilled after the date hereof, future cash flows and borrowings, pursuit of potential acquisition opportunities, our financial position, business strategy and other plans and objectives for future operations, are forward-looking statements. These forward-looking statements are identified by their use of terms and phrases such as “may,” “expect,” “estimate,” “project,” “plan,” “believe,” “intend,” “achievable,” “anticipate,” “will,” “continue,” “potential,” “should,” “could,” and similar terms and phrases. Although we believe that the expectations reflected in these forward-looking statements are reasonable, they do involve certain assumptions, risks and uncertainties. Our results could differ materially from those anticipated in these forward-looking statements as a result of certain factors, including, among others:
| • | the pending sale of the company to Petroflow; |
| • | risks associated with drilling oil and natural gas wells; |
| • | the volatility of oil and natural gas prices; |
| • | uncertainties in estimating oil and natural gas reserves; |
| • | the need to replace the oil and natural gas the Company produces; |
| • | the Company’s ability to execute its growth strategy by drilling wells as planned; |
| • | risks and liabilities associated with acquired properties and risks related to the integration of acquired businesses; |
| • | amount, nature and timing of capital expenditures, including future development costs, required to develop the Company’s undeveloped areas; |
| • | concentration of operations in Central Oklahoma; |
| • | inability to retain drilling rigs and other services; |
| • | risk of currency fluctuations; |
| • | the potential adverse effect of commodity price declines on the carrying value of the Company’s oil and natural gas properties; |
| • | severe or unseasonable weather that may adversely affect production and drilling; |
| • | availability of satisfactory oil and natural gas marketing and transportation; |
| • | availability and terms of capital to fund capital expenditures; |
| • | amount and timing of proceeds of asset sales and asset monetization; |
| • | ability to fund ongoing dividends; |
| • | limitations on operations resulting from debt restrictions and financial covenants; |
| • | potential financial losses or earnings reductions from commodity derivatives; |
| • | potential elimination or limitation of tax incentives; |
| • | competition in the oil and natural gas industry; |
| • | risks associated with consent solicitations and proxy contests conducted by dissident stockholders; |
| • | general economic conditions, either internationally or domestically or in the areas where the Company operates; |
| • | inability to obtain required regulatory approvals for development activities; |
| • | costs to comply with current and future governmental regulation of the oil and natural gas industry, including environmental, health and safety laws and regulations, and regulations with respect to water disposal and hydraulic fracturing; |
| • | the need to maintain adequate internal control over financial reporting. |
Finally, our future results will depend upon various other risks and uncertainties, including, but not limited to, those detailed in the section entitled “Risk Factors” included in our 2013 Annual Report on Form 10-K. All forward-looking
Page 13 of 28
Table of Contents
statements attributable to us or persons acting on our behalf are expressly qualified in their entirety by the cautionary statements in this section and elsewhere in this report. Other than as required under securities laws, we do not assume a duty to update these forward-looking statements, whether as a result of new information, subsequent events or circumstances, changes in expectations or otherwise.
The following discussion and analysis addresses material changes in our results of operations and capital resources and uses for the three months ended March 31, 2014, compared to the three months ended March 31, 2013, and in our financial condition and liquidity since December 31, 2013, and should be read in conjunction with “Item 1. Consolidated Financial Statements” of this report and “Item 7. Management’s Discussion and Analysis of Financial Condition and Results of Operations” in our 2013 Annual Report on Form 10-K.
In addition, the following discussion is for our continuing operations (U.S. operations) for the three months ended March 31, 2014.
Overview
Equal Energy Ltd. is a Calgary, Alberta based company headquartered in Oklahoma City, Oklahoma, engaged in the exploration, acquisition, development and production of petroleum and natural gas in Oklahoma. The Company also reviews new drilling opportunities and potential acquisitions in Oklahoma to supplement its exploration and development activities.
The Company averaged approximately 7,000 boe/d of production for the three months ended March 31, 2014, which was comprised of approximately 48% natural gas, 49% NGLs and 3% crude oil. At March 31, 2014, the Company had 142 gross (119 net) producing wells, virtually all of which it operates, and approximately 90,000 gross (59,000 net) acres under lease or held by production.
Arrangement to Sell all Issued and Outstanding Shares of the Company
On December 6, 2013, Equal, Petroflow Energy Corporation, a Delaware corporation (“Petroflow”), and Petroflow Canada Acquisition Corp., an Alberta, Canada corporation and wholly-owned subsidiary of Petroflow (“PetroflowSub”), entered into an Arrangement Agreement (the “Arrangement Agreement”), pursuant to which Petroflow has agreed to acquire, indirectly through PetroflowSub, all of the outstanding common shares of Equal for $5.43 per share in cash, without interest, and pursuant to which Equal will become an indirect wholly-owned subsidiary of Petroflow (the “Arrangement”). On May 1, 2014, the Arrangement Agreement was amended (the “Amendment”) subsequent to Petroflow securing debt financing commitment letters in order to (a) extend the outside termination date contained therein from May 1, 2014 to July 31, 2014, (b) permit Equal to declare and pay on or after May 1, 2014, and prior to the effective date of the Arrangement, a cash dividend of $0.05 per common share, (c) permit Equal to declare and pay to its common shareholders who are entitled to receive Arrangement consideration upon completion of the Arrangement a cash dividend of $0.05 cents per common share (the “Arrangement Dividend”) and (d) amend the approved budget for Equal agreed to by the parties in the Arrangement Agreement.
On the terms of and subject to the conditions set forth in the Arrangement Agreement, which has been unanimously approved by the Board of Directors of Equal, at the effective time of the Arrangement (the “Effective Time”), and as a result thereof, each common share of Equal that is issued and outstanding immediately prior to the Effective Time (other than Equal common shares for which dissenter’s rights have been validly exercised and not withdrawn) will be converted at the Effective Time into the right to receive $5.43 in cash (the “Consideration”), without interest, less any applicable withholding taxes as described in the Arrangement Agreement and the Plan of Arrangement included in our proxy statement in connection with the Arrangement. Each stock option outstanding immediately prior to the Effective Time (whether vested or unvested), shall be transferred from the option holder to Equal. Upon the transfer, if the Consideration, expressed in Canadian dollars in respect of each stock option, exceeds the exercise price per common share of such stock option, the option holder will receive cash consideration equal to such difference, subject to applicable withholding taxes and deductions. Where the Consideration, expressed in Canadian dollars, in respect of each stock option, does not exceed the exercise price per common share of such option, the option holder will not receive any payment in respect of such option. All options will be cancelled immediately after the transfer to Equal. Pursuant to the Arrangement Agreement, Equal has agreed to take all steps necessary or desirable to give effect to the foregoing, including entering into option cancellation agreements (“Option Agreements”) with each option holder in respect of all options and to obtain necessary consents from option holders to the transfer and cancellation of the options as described above. At the Effective Time, the Arrangement Dividend will be paid.
At the Effective Time, all Equal common shares issuable pursuant to Equal’s restricted share and performance share incentive plan will be issued and those Equal common shares will be converted into the right to receive the Consideration, less any applicable withholding taxes.
Page 14 of 28
Table of Contents
Equal and Petroflow have made customary representations, warranties and covenants in the Arrangement Agreement, including, among others, covenants by Equal that: (i) subject to certain provisions in the Arrangement Agreement relating to the conduct of business up to the Effective Time, Equal will conduct its business in the normal and ordinary course of business and consistent with past practice, during the interim period between the execution of the Arrangement Agreement and the Effective Time; (ii) Equal will not engage in certain kinds of transactions during such period; (iii) Equal will cause a meeting of the Equal shareholders to be held to consider approval of the Arrangement Agreement; and (iv) subject to certain customary exceptions, that the Board of Directors of Equal will recommend approval by its shareholders of the Arrangement Agreement. Petroflow and Equal have agreed to cooperate to make any required filings, applications and submissions with governmental authorities, and to obtain any required consents, waivers and approvals from those authorities. Equal has also made certain additional customary covenants, including, among others, covenants not to (i) solicit proposals relating to alternative business combination transactions or (ii) subject to certain exceptions, enter into discussions concerning or provide confidential information in connection with any proposals for alternative business combination transactions. Petroflow has agreed to use commercially reasonable efforts to fulfill, or cause to be fulfilled, the conditions that are within its control for funding and closing of the financing necessary for Petroflow to pay the Consideration in connection with the consummation of the Arrangement, and Equal has agreed to provide, and to cause its officers, employees and advisors to provide, upon the reasonable request of Petroflow, all reasonable cooperation in connection with the arrangement of the financing for Petroflow’s consummation of the Arrangement.
Consummation of the Arrangement is subject to customary conditions, including, among others: (i) approval of the holders of a majority of the votes cast by shareholders at the meeting of Equal shareholders to be held to consider approval of the Arrangement, excluding any Equal common shares held by the President and Chief Executive Officer of Equal; (ii) approval of the holders of 66 2/3% of the votes cast by shareholders at the meeting of Equal shareholders to be held to consider approval of the Arrangement; (iii) the absence of any law or order prohibiting the consummation of the Arrangement; (iv) the granting of an interim and final court order under Alberta law approving the Arrangement; (v) the absence of a material adverse effect with respect to Equal; (vi) the obtaining by Petroflow of financing necessary to consummate the Arrangement; (vii) no make-whole premium be payable in respect of Equal’s outstanding convertible debentures; (viii) Option Agreements must be in place with the holders of Equal’s stock options; and (ix) dissent rights shall not have been exercised with respect to more than 5% of the Equal common shares, calculated on a fully diluted basis. Many of the conditions to consummation have not yet been satisfied.
The Arrangement Agreement contains certain termination rights for both Petroflow and Equal, and further provides that, upon termination of the Arrangement Agreement under certain specified circumstances, Equal would be required to pay Petroflow a termination fee of $2,000,000 or Petroflow would be required to pay Equal a reverse termination fee of $2,000,000.
In connection with the parties’ entry into the Arrangement Agreement, the directors and officers of Equal (the “Locked-Up Parties”) have entered into a Lock-Up and Support Agreement (the “Lock-Up Agreement”) with respect to a total of 847,477 common shares of Equal legally or beneficially owned by the Locked-Up Parties (the “Locked-Up Shares”), which represent approximately 2.35% of Equal’s outstanding common shares, as of May 5, 2014. Any of Equal’s common shares acquired after the date of the Lock-Up Agreement (including, without limitation, pursuant to the exercise of options or other convertible securities or restricted stock) will also become subject to the Lock-Up Agreement as provided in the Lock-Up Agreement. Under the Lock-Up Agreement, each Locked-Up Party has agreed to vote its Locked-Up Shares in favor of the Arrangement and has also agreed to certain restrictions on the disposition of such Locked-Up Shares, subject to the terms and conditions set forth in the Lock-Up Agreement. The Lock-Up Agreement provides that it will terminate concurrently with any termination of the Arrangement Agreement.
Petroflow has agreed that following the Effective Date, Petroflow will satisfy or cause Equal to satisfy, all of Equal’s obligations regarding our convertible debentures, including that Petroflow will cause Equal to make an offer to purchase all of Equal’s outstanding CAD $45 million of convertible debentures within 30 days. In accordance with the terms of the indenture governing the convertible debentures, cash consideration equal to 101% of the face value, plus accrued and unpaid interest, will be offered to holders of the convertible debentures.
The foregoing descriptions of the Arrangement, the Arrangement Agreement, the Amendment, the Option Agreement and the Lock-Up Agreement do not purport to be complete and are subject to, and qualified in their entirety by reference to, the full text of the Arrangement Agreement, the full text of the Lock-Up Agreement, and the full text of the Option Agreement, which are incorporated herein by reference as filed in the Company’s Form 8-K on December 9, 2013 as Exhibits No. 2.1, 2.2 and 2.3, respectively. The Amendment is incorporated herein by reference as filed in the Company’s Form 8-K on May 1, 2014 as Exhibit 2.1.
Page 15 of 28
Table of Contents
As described above, the Arrangement Agreement contains representations and warranties by Petroflow and Equal. These representations and warranties have been made solely for the benefit of the other parties to the Arrangement Agreement and (i) may be intended not as statements of fact, but rather as a way of allocating the risk to Petroflow or Equal if those statements prove to be inaccurate, (ii) have been qualified by disclosures that were made to the other party in connection with the negotiation of the Arrangement Agreement, (iii) may apply materiality standards different from what may be viewed as material to investors, and (iv) were made only as of the date of the Arrangement Agreement or such other dates as may be specified in the Arrangement Agreement and are subject to more recent developments. Accordingly, these representations and warranties should not be relied on as characterizations of the actual state of facts or for any other purpose either at the time they were made or at any other time.
Equal’s Properties
The Company’s production comes from its Oklahoma based operations. The core area assets are located in Lincoln and Logan counties of Oklahoma. The Company also has an inventory of minor producing assets, minor royalty interests and various exploration and exploitation prospects on undeveloped lands in Oklahoma.
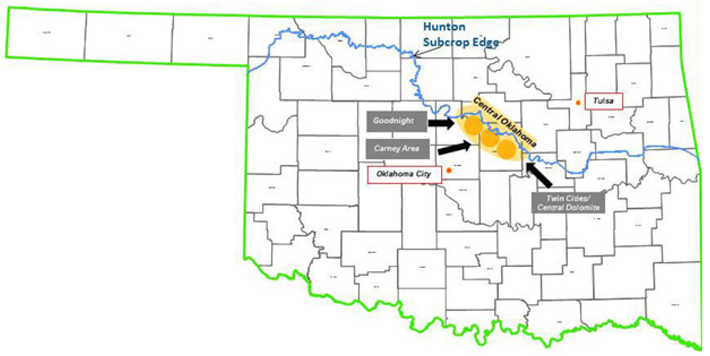
In Oklahoma, the key producing horizon is the Hunton formation. The Hunton is a carbonate rock formation which has been largely ignored by the industry in areas with high water/hydrocarbon production ratios. Over the last decade, new drilling and production techniques have enabled profitable development of the Hunton formation. Extensive dewatering lowers reservoir pressure, allowing the liberation and mobilization of oil, natural gas and NGLs from smaller rock pores. Typical peak wellhead hydrocarbon production rates average 150 boe/d per horizontal well and are generally observed within six months of production commencement.
Average Hunton production for the three months ended March 31, 2014, was approximately 19.9 MMcf/d of natural gas, 3.4 Mbbls/d of NGLs and 0.2 Mbbls/d of oil. At December 31, 2013, the reserve report attributed proved reserves of 280 Mbbls of crude oil, 66 Bcf of natural gas and 12,993 Mbbls of NGLs.
As of March 31, 2014, the Company had approximately 32,000 gross (12,000 net) undeveloped acres of land under leasehold, primarily located in Lincoln and Logan counties of Oklahoma comprising of interests in 86 sections.
Market Conditions
Prices of natural gas, NGLs, and oil that we produce can vary significantly, which impacts our revenues and cash flows. The following table lists average New York Mercantile Exchange (“NYMEX”) prices for natural gas, West Texas Intermediate (“WTI”) prices for crude oil, and propane prices at Conway, KS for the three months ended March 31, 2014 and 2013.
Page 16 of 28
Table of Contents
| Three months ended March 31, | ||||||||
| 2014 | 2013 | |||||||
| Propane, Conway, KS (US$ per bbl) |
$ | 41.08 | $ | 34.32 | ||||
| NYMEX natural gas (US$ per mcf) |
$ | 4.73 | $ | 3.61 | ||||
| WTI (US$ per bbl) |
$ | 98.68 | $ | 94.34 | ||||
Results of Operations for the three months ended March 31, 2014, and March 31, 2013
For the three months ended March 31, 2014, Equal Energy’s production was from the Central Oklahoma properties.
The following table sets forth selected operating data for the periods indicated.
| Three months ended March 31, | ||||||||||||||||
| (in thousands, except for boe/d) | Central Oklahoma | |||||||||||||||
| Q1 2014 | Q1 2013 | Change | % Change | |||||||||||||
| Net Production per Day: |
||||||||||||||||
| Oil (Bbl) |
241 | 157 | 84 | 54 | % | |||||||||||
| NGL (Bbl) |
3,411 | 3,084 | 327 | 11 | % | |||||||||||
| Natural Gas (Mcf) |
19,925 | 18,232 | 1,693 | 9 | % | |||||||||||
|
|
|
|
|
|
|
|
|
|||||||||
| Total (Boe/d) |
6,973 | 6,280 | 693 | 11 | % | |||||||||||
| Net Production: |
||||||||||||||||
| Oil (MBbl) |
22 | 14 | 8 | 57 | % | |||||||||||
| NGL (MBbl) |
307 | 278 | 29 | 10 | % | |||||||||||
| Natural Gas (MMcf) |
1,793 | 1,641 | 152 | 9 | % | |||||||||||
|
|
|
|
|
|
|
|
|
|||||||||
| Total (MBoe) |
628 | 566 | 62 | 11 | % | |||||||||||
| Net Sales: |
||||||||||||||||
| Oil Sales |
$ | 2,090 | $ | 1,305 | $ | 785 | 60 | % | ||||||||
| NGL Sales |
12,477 | 9,146 | 3,331 | 36 | % | |||||||||||
| Natural Gas Sales |
7,579 | 4,354 | 3,225 | 74 | % | |||||||||||
|
|
|
|
|
|
|
|
|
|||||||||
| $ | 22,146 | $ | 14,805 | $ | 7,341 | 50 | % | |||||||||
| Average Sales Prices: |
||||||||||||||||
| Oil (per Bbl) |
$ | 95 | $ | 92.12 | $ | 2.88 | 3 | % | ||||||||
| NGL (per Bbl) |
40.64 | 32.95 | 7.69 | 23 | % | |||||||||||
| Natural Gas (per Mcf) |
4.23 | 2.65 | 1.58 | 60 | % | |||||||||||
|
|
|
|
|
|
|
|
|
|||||||||
| Per Boe |
$ | 35.29 | $ | 26.19 | $ | 9.10 | 35 | % | ||||||||
| Operating Expenses: |
||||||||||||||||
| Production Expenses |
$ | 4,061 | $ | 3,455 | $ | 606 | 18 | % | ||||||||
| Production Taxes |
753 | 926 | (173 | ) | -19 | % | ||||||||||
| Expenses (per Boe): |
||||||||||||||||
| Production Expenses |
$ | 6.47 | $ | 6.12 | $ | 0.35 | 6 | % | ||||||||
| Production Taxes |
1.20 | 1.64 | (0.44 | ) | -27 | % | ||||||||||
| Net Producing Wells at Period End |
119 | 132 | -13 | -10 | % | |||||||||||
Page 17 of 28
Table of Contents
The following table sets forth selected operating data as reported for the periods indicated.
| Q1 2014 | Q1 2013 | Change | % Change | |||||||||||||
| Operating Expenses: |
||||||||||||||||
| General and Administrative Expense |
||||||||||||||||
| (Including Share Based Compensation) |
$ | 3,312 | $ | 3,154 | $ | 158 | 5 | % | ||||||||
| Interest |
879 | 949 | (70 | ) | -7 | % | ||||||||||
| Depletion of Oil and Gas Properties |
4,508 | 4,793 | (285 | ) | -6 | % | ||||||||||
| Costs and Expenses (per Boe): |
||||||||||||||||
| General and Administrative Expense |
||||||||||||||||
| (Including Share Based Compensation) |
$ | 5.28 | $ | 5.58 | $ | (0.99 | ) | -18 | % | |||||||
| Interest |
1.40 | 1.68 | (0.28 | ) | -17 | % | ||||||||||
| Depletion of Oil and Gas Properties |
7.18 | 8.48 | (1.30 | ) | -15 | % | ||||||||||
Oil, Natural Gas and NGL Sales:
Sales in all categories benefited from higher production, as compared to the prior year’s quarter. After drilling only three wells in early 2012, Equal initiated a one-rig program in January 2013 which was originally budgeted to drill 10 wells during the year. Better than anticipated efficiencies allowed the rig to drill 12 wells during the year. Nine of these wells were completed in 2013 and the final three wells were completed in January 2014. All 12 wells proved very successful, and with several being drilled in oilier parts of the play, we saw a significant jump in oil production as compared to the first quarter of 2013.
Oil Sales
Oil revenue was $2.1 million for the first quarter of 2014 as compared to $1.3 million for the same period last year. The $0.8 million increase was primarily a result of a 54% increase in daily production attributable to successful drilling in 2013.
Gas Sales
Gas revenue for the first quarter of 2014 was $7.6 million as compared to $4.4 million for the same period last year. The $3.2 million increase was primarily due to a 60% increase in average price, excluding commodity contracts, in addition to a 9% increase in daily production attributable to successful drilling in 2013. Price increases were largely consistent with the broad improvement of gas prices in the North American market.
NGL Sales
NGL revenue for the first quarter of 2014 was $12.5 million as compared to $9.1 million for the same period last year. The $3.3 million increase was a result of a 23% increase in average price, excluding commodity contracts, and an 11% increase in daily production. The higher realized prices were largely due to increases in NGL index prices at the Conway, KS hub. The increase in NGL production was attributable to successful drilling in 2013.
Production Expenses
Production expenses were $4.1 million for the first quarter of 2014 compared to $3.5 million for the same period last year. The $0.6 million increase was due primarily to an increase in workover expenses attributable, in part, to weather-related costs. On a per unit-of-production basis, production expenses per boe increased from $6.12 in the first quarter of 2013 to $6.47 in the first quarter of 2014.
Production Taxes
The company normally pays a base rate of 7% in production taxes based on realized oil, NGL and natural gas sales. Production taxes were $0.8 million for the first quarter of 2014 compared to $0.9 million for the same period last year. As a percentage of net sales, our production tax rates averaged 3.4% and 6.3% in the first quarter of 2014 and 2013, respectively. The average production tax rate for the first quarter of 2014 was lower than the same period last year due to new horizontal wells drilled in 2013 qualifying for a 48-month six percent Oklahoma production tax rate reduction. During the three months ended December 31, 2013, prior period errors were identified relating to the recording of tax rebates from the Oklahoma Tax Commission for production activities in 2009, 2010 and 2011, together with the related recognition of deferred income tax assets and expenses. The estimate for the impact related to the prior period tax rebates was decreased by $0.4 million in the first quarter of 2014, which reduced first quarter 2014 production tax expense. Excluding this $0.4 million adjustment, production taxes would have been 5.2% of realized oil, NGL and natural gas sales.
Page 18 of 28
Table of Contents
Commodity Contracts
For the first quarter of 2014, Equal had a net loss on commodity contracts of $2.1 million as compared to a net loss of $3.3 million for the same period last year. Equal made cash payments on settled derivatives of $1.2 million in the first quarter of 2014, as compared to cash receipts of $0.5 million for the same period last year. At March 31, 2014, all the derivative contracts were recorded at their fair value, which was a net liability of $1.2 million, an increase of $0.9 million from the $0.3 million of net liability recorded at December 31, 2013.
General and Administrative Expense
General and administrative expense was $3.3 million for the first quarter of 2014 as compared to $3.2 million for the same period last year, excluding discontinued operations. The $0.1 million increase was due to increases in professional fees of $0.4 million, offset partially by a decrease in compensation costs of $0.3 million. On a per unit-of production basis, the general and administrative expense per boe was $5.28 for the first quarter of 2014 compared to $5.58 for the first quarter of 2013. This reduction in costs per boe is due to increased production, more than offsetting higher costs associated with the arrangement agreement with Petroflow, as disclosed in Part 1, in Form 10-K for the year ended December 31, 2013, filed with the SEC on March 17, 2014. The extension of this agreement is discussed earlier in Item 2 of this quarterly report on Form 10-Q.
Depletion of Oil and Gas Properties
Depletion was $4.5 million, in the first quarter of 2014 as compared to $4.8 million for the same period last year. The $0.3 million decrease in depletion expense was attributable to the proved reserves increasing at a higher rate as compared to costs in the depletion base. On a per unit-of production basis, the depletion expense per boe was $7.18 for the first quarter of 2014 compared to $8.48 for the first quarter of 2013.
Interest Expense
Interest expense was $0.9 million for the first quarter of 2014 and for the same period last year, and is comprised of interest on the CAD $45 million, 6.75% convertible debentures and fees associated with the unused CAD $125 million credit facility.
Income Tax Provision
The provision for income tax expense was $1.8 million in the first quarter of 2014 as compared to a $0.8 million income tax benefit for the same period last year. The increase in income tax expense relates primarily to increased earnings during the current period compared to the same period in the previous year. The effective income tax rate differs from the statutory rate of 35% due to permanent differences, the change in valuation allowance, and AMT credits.
NON-GAAP FINANCIAL MEASURES
Management uses certain industry benchmarks to analyze financial performance. Management feels that these benchmarks are key measures of profitability and overall sustainability for Equal. These benchmarks as presented do not have any standardized meanings prescribed by GAAP and therefore may not be comparable with the calculation of similar measures presented by other entities.
We believe the use of these non-GAAP financial measures provides useful information to investors to gain an overall understanding of our current financial performance. Specifically, we believe the non-GAAP financial measures included herein provide useful information to both management and investors by excluding certain expenses and gains and losses that our management believes are not indicative of our core operating results. In addition, these non-GAAP financial measures are used by management for budgeting and forecasting as well as subsequently measuring our performance, and we believe that we are providing investors with financial measures that most closely align to our internal measurement processes. We consider these non-GAAP measures to be useful in evaluating our core operating results as they more closely reflect our essential revenue generating activities and direct operating expenses (resulting in cash expenditures) needed to perform these revenue generating activities. Our management also believes, based on feedback provided by the investment community, that the non-GAAP financial measures are necessary to allow the investment community to construct its valuation models to better compare our results with our competitors and market sector.
The non-GAAP financial information is presented using consistent methodology from year to year. These measures should be considered in addition to results prepared in accordance with GAAP. In addition, these non-GAAP financial measures are not based on any comprehensive set of accounting rules or principles. We believe that non-GAAP financial measures have limitations in that they do not reflect all of the amounts associated with our results of operations as determined in accordance with GAAP and that these measures should only be used to evaluate our results of operations and financial position in conjunction with the corresponding GAAP financial measures. The adjustment factors are described more fully in the tables below.
Page 19 of 28
Table of Contents
ADJUSTED WORKING CAPITAL
| (in thousands) |
March 31, 2014 | December 31, 2013 | ||||||
| Cash |
$ | 17,477 | $ | 15,631 | ||||
| Accounts receivable, net |
15,234 | 13,581 | ||||||
| Prepaid expenses, deposits and other |
715 | 1,051 | ||||||
| Accounts payable and accrued liabilities |
(10,841 | ) | (17,134 | ) | ||||
| Asset retirement obligation |
(284 | ) | (278 | ) | ||||
|
|
|
|
|
|||||
| Adjusted working capital |
$ | 22,301 | $ | 12,851 | ||||
|
|
|
|
|
|||||
CASH FLOW BEFORE BALANCE SHEET CHANGES
| Quarter Ended March 31, | ||||||||
| (in thousands) |
2014 | 2013 | ||||||
| Net cash provided by operating activities |
$ | 8,243 | $ | 7,612 | ||||
| Adjustments: |
||||||||
| Changes in assets and liabilities |
3,591 | (3,214 | ) | |||||
| Net cash used in operating activities - discontinued operations |
328 | 2,716 | ||||||
|
|
|
|
|
|||||
| Cash flow from continuing operations before balance sheet changes |
$ | 12,162 | $ | 7,114 | ||||
|
|
|
|
|
|||||
LIQUIDITY & CAPITAL RESOURCES
Development activities and acquisitions may be funded internally through cash flow from operations or through external sources such as debt or the issuance of equity. The Company finances its operations and capital activities primarily with funds generated from operating activities, but also through the issuance of shares, debentures and borrowing from its credit facility. The Company believes its sources of cash, including bank debt and funds from operations, will be sufficient to fund its operations and capital expenditure program as projected for 2014. However, Equal’s ability to fund its operations will also depend upon operating performance and is subject to commodity prices and other economic conditions which may be beyond its control. Therefore, the Company will closely monitor commodity prices and adjust the 2014 capital expenditure program accordingly. The Company operates substantially all of its drilling programs and as a result, can control the pace and targets of its capital spending to react quickly to changes in cash flow to ensure ongoing financial flexibility.
Equal’s capital structure at March 31, 2014, was as follows:
| March 31, 2014 | ||||||||
| Capitalization (in thousands, except percentages) |
Amount | % | ||||||
| Working capital surplus (1) |
$ | (22,301 | ) | -12 | % | |||
| Convertible debentures |
40,707 | 22 | % | |||||
| Shares issued, at market (2) |
165,342 | 90 | % | |||||
|
|
|
|
|
|||||
| Total capitalization |
$ | 183,748 | 100 | % | ||||
|
|
|
|
|
|||||
| (1) | See working capital discussion below |
| (2) | The market price of Equal’s shares on March 31, 2014 was $4.58 per share. |
Page 20 of 28
Table of Contents
| Cash Flow from Operating, Investing and Financing Activities (in thousands) |
||||||||
| Three months ended March 31, | ||||||||
| 2014 | 2013 | |||||||
| Cash provided by operating activities – continuing operations |
$ | 8,571 | $ | 10,328 | ||||
| Cash used in operating activities – discontinued operations |
(328 | ) | (2,716 | ) | ||||
|
|
|
|
|
|||||
| Cash provided by operating activities |
$ | 8,243 | $ | 7,612 | ||||
|
|
|
|
|
|||||
| Cash used in investing activities |
$ | (6,397 | ) | $ | (7,363 | ) | ||
|
|
|
|
|
|||||
| Cash used in financing activities |
$ | — | $ | (1,805 | ) | |||
|
|
|
|
|
|||||
The $0.6 million increase in cash provided by operating activities was primarily due to a $6.3 million increase in net income from continuing operations and a $2.4 million decrease in losses from discontinued operations. Partially offsetting improvements in net income was a $3.6 million decrease in changes in assets and liabilities compared to a $3.2 million increase in 2013. The $1.0 million decrease in cash used in investing activities was primarily due to the decrease in drilling activity, as compared to the same period last year. The $1.8 million cash used in financing activities during 2013 was for cash dividends paid, for which none were paid during the current quarter.
Long-term Debt
Other than the convertible debentures described below under “Convertible Debentures”, Equal had no outstanding long-term debt at March 31, 2014. The Company’s syndicated bank credit facility is CAD $125.0 million and is comprised of a CAD $105.0 million revolving credit facility and a CAD $20.0 million operating credit facility, all of which are secured against the borrowing base of the Oklahoma assets and can be borrowed against in either Canadian dollars or the United States dollar equivalent.
Working Capital
The adjusted working capital and net debt (debt less adjusted working capital), was $18.4 million and $29.5 million at March 31, 2014 and December 31, 2013, respectively. This increase in adjusted working capital was primarily due to cash provided by operations.
| Adjusted Working Capital (in thousands) |
March 31, 2014 | December 31, 2013 | ||||||
| Current assets |
$ | (33,426 | ) | $ | (30,263 | ) | ||
| Current liabilities |
12,360 | 17,753 | ||||||
| Current liability related to commodity contracts |
(1,235 | ) | (341 | ) | ||||
|
|
|
|
|
|||||
| Adjusted working capital |
(22,301 | ) | (12,851 | ) | ||||
| Convertible debentures |
40,707 | 42,309 | ||||||
|
|
|
|
|
|||||
| Net debt (debt less adjusted working capital) |
$ | 18,406 | $ | 29,458 | ||||
|
|
|
|
|
|||||
Convertible Debentures
As of March 31, 2014, Equal had CAD $45.0 million or US $40.7 million of 6.75% convertible debentures (EQU.DB.B) outstanding. The 6.75% convertible debentures are convertible into common shares of Equal and had a conversion price of CAD $8.55 per common share as of March 31, 2014. Each CAD $1,000 principal amount of EQU.DB.B debentures is convertible into Equal common shares. The total outstanding amount is convertible into approximately 5.3 million Equal common shares and matures on March 31, 2016.
Page 21 of 28
Table of Contents
Stockholders’ Equity
Equal’s capital structure is comprised of common shares and convertible debt. Equal also has common shares outstanding under its stock option plan and restricted share plan. The following table outlines the outstanding equity instruments:
| Outstanding Equity Data (in thousands) |
March 31, 2014 | December 31, 2013 | ||||||
| Shares |
36,101 | 35,806 | ||||||
| Share options |
289 | 289 | ||||||
| Restricted shares |
670 | 981 | ||||||
| 6.75% convertible debentures (CAD$1,000 per debenture) |
$ | 40,707 | $ | 42,309 | ||||
As a result of voting at the Company’s shareholders meeting in May 2013, no shares are currently available for future grants under the Company’s equity plans for its employees.
OUTLOOK
Equal expects to complete the Arrangement with Petroflow; however, the completion of the Arrangement remains subject to a number of conditions that must be met or waived, including approval by 66 2/3 of the votes cast by Equal’s shareholders and “minority approval” (as that term is defined in Multilateral Instrument 61-101 Protection of Minority Security Holders in Special Transactions) at a special meeting. Among the other conditions to closing of the Arrangement, is the requirement that Petroflow obtain financing for the transaction, which is subject to meeting certain customary closing conditions. Although Petroflow has secured debt financing commitment letters, this financing is subject to the satisfaction or waiver of the conditions set forth in the applicable commitment letters. As a result, there is no guarantee that the Arrangement will be completed, or that if completed, it will be completed on or prior to July 31, 2014, the outside date contemplated in the Arrangement Agreement, as amended.
In certain circumstances, either Equal or Petroflow may be required to pay a termination fee of two million dollars to the other party.
Pursuant to the terms of the original Arrangement Agreement, Equal agreed to reduce its capital budget through April 2014. Pursuant to the Amendment, Equal will increase its capital program in mid-May and incur incremental general and administrative costs in accordance with the Arrangement Agreement through July 31, 2014. Although Equal will pursue selective drilling during this period, we plan to maintain cost discipline and a strong balance sheet. We believe our sources of cash, including cash on hand, cash flow and our undrawn credit facility will be sufficient to fund our operations and capital expenditures until the Arrangement is completed. In the event the proposed transaction with Petroflow does not occur, Equal will formalize a plan to continue to actively exploit our proven play in the Hunton in Central Oklahoma.
Commitments and Contingencies
For a discussion of our commitments and contingencies, please refer to Note 11 — Contingencies under Item 1 in this Quarterly Report, which is incorporated herein by reference.
Off Balance Sheet Arrangements
The Company did not have any off balance sheet arrangements, as defined in Item 303(a)(4)(ii) of Regulation S-K at March 31, 2014, and December 31, 2013.
Critical Accounting Policies and Estimates
The preparation of financial statements in accordance with U.S. generally accepted accounting principles (U.S. GAAP) requires management to make estimates and judgments that affect the reported amounts of assets, liabilities, revenues and expenses. Certain of the Company’s accounting policies are considered critical, as these policies are the most important to the depiction of the Company’s financial statements and require significant, difficult or complex judgments, often employing the use of estimates about the effects of matters that are inherently uncertain. A summary of the Company’s significant accounting policies is included in Note 2 to the Company’s consolidated financial statements included in our annual report on Form 10-K for the year ended December 31, 2013, as well as in the Management’s Discussion and Analysis of Financial Condition and Results of Operations section in such Form 10-K, which summary is qualified by the updates set forth below. The updated disclosures set forth below have been included solely to clarify our actual treatment with respect to the applicable topics and do not reflect any change in accounting treatment relating thereto.
Impairment of Oil and Gas Properties
Under the full cost method of accounting, capitalized oil and gas property costs less accumulated depletion and net of deferred income taxes, may not exceed an amount equal to the present value, discounted at 10%, of estimated future net revenues from proved oil and gas reserves plus the cost of unproved properties not subject to amortization. Should capitalized costs exceed this ceiling, impairment is recognized. If natural gas or NGL prices decrease from current levels, we may incur full-cost ceiling write-downs, or additional DD&A, related to our oil and gas properties in future periods
Wells in Progress
Wells in progress represent the costs associated with wells that have not reached total depth or been completed as of period end. These costs are related to wells that are classified as both proved and unproved. Costs related to wells that are classified as proved are included in the depletion base. Costs associated with wells that are classified as unproved are excluded from the depletion base. The costs for unproved wells are then transferred to proved property when proved reserves are determined. Such costs then become subject to depletion.
Page 22 of 28
Table of Contents
ITEM 3. QUANTITATIVE AND QUALITATIVE DISCLOSURES ABOUT MARKET RISK
Commodity Price Risk
Our primary market risk is the volatility of oil, NGL and natural gas prices. The market prices for oil, NGL and natural gas have been highly volatile and are likely to continue to be highly volatile in the future, which will impact our prospective revenues from the sale of products or properties. We manage this commodity price risk exposure through the use of derivative financial instruments entered into with third-parties. Currently, we utilize swaps to reduce the effect of price changes on a portion of our future oil production. We do not enter into derivative instruments for trading purposes.
Equal’s most significant market risk relates to the prices it receives for its natural gas and NGL production. Oil represents only 3% of total production so volatility of oil prices has a small effect. Due to the historical price volatility of these commodities, Equal periodically has entered into natural gas and oil derivative arrangements, and expects in the future to enter into derivative arrangements, for the purpose of reducing the variability of natural gas and NGL prices Equal receives for its production. The Company’s credit facility limits its ability to enter into derivative transactions for a maximum term of 3 years and up to 65% of expected production volumes. At March 31, 2014, commodity contracts with various counterparties equaled approximately 44% of the Company’s production.
The Company uses, and may continue to use, a variety of commodity-based derivative contracts, including fixed price swaps, collars and basis swaps. At March 31, 2014, the Company’s commodity derivative contracts consisted of fixed price swaps for natural gas and fixed price swaps for oil and natural gas liquids, which are described below:
| Fixed price swaps | The Company receives a fixed price for the contract and pays a floating market price to the counterparty over a specified period for a contracted volume. |
The Company’s natural gas fixed price swap transactions are settled based upon NYMEX prices, and the Company’s natural gas basis swap transactions are settled based upon the index price of natural gas at the Southern Star pipeline delivery point in Oklahoma compared to NYMEX prices. The Company’s natural gas contracts are settled based upon the NYMEX prices on the last commodity business day for the relevant contract period. Settlement for oil derivative contracts occurs in the succeeding month or quarter and natural gas derivative contracts are settled in the production month or quarter.
The Company records all derivative contracts at fair value, which reflects changes in commodity prices. Changes in fair values of the Company’s derivative contracts are recognized as unrealized gains or losses in current period earnings. As a result, the Company’s current period earnings may be significantly affected by changes in the fair value of its commodity derivative contracts. Changes in fair value are principally measured based on period-end prices compared to the contract price. For further details regarding our derivative contracts please refer to Note 9 — Commodity Contracts under Item 1 in this Quarterly Report.
The following sensitivities show the result to pre-tax net income for three months ended March 31, 2014, related to commodity contracts of the respective changes in crude oil, liquids, natural gas and fixed basis differential.
| Increase (decrease) to pre-tax net income | ||||||||
| Decrease in market price | Increase in market price | |||||||
| ($1.00 per bbl and | ($1.00 per bbl and | |||||||
| (in thousands of dollars) |
$0.50 per mcf) | $0.50 per mcf) | ||||||
| Crude oil and NGL derivative contracts |
92 | (92 | ) | |||||
| Natural gas derivative contracts |
2,200 | (2,200 | ) | |||||
Page 23 of 28
Table of Contents
Credit Risk
All of the Company’s commodity contract transactions have been carried out in the over-the-counter market. The use of derivative transactions in over-the-counter markets involves the risk that the counterparties may be unable to meet the financial terms of the transactions. The counterparties for all of the Company’s derivative transactions have an “investment grade” credit rating. The Company monitors on an ongoing basis the credit ratings of its derivative counterparties. The Company’s derivative contracts are primarily with its lead bank for its credit facility.
A default by the Company under its credit facility constitutes a default under its derivative contracts with counterparties that are lenders under the senior credit facility. The Company does not require collateral or other security from counterparties to support derivative instruments. The Company has master netting agreements with all of its derivative contract counterparties, which allows the Company to net its derivative assets and liabilities with the same counterparty. As a result of the netting provisions, the Company’s maximum amount of loss under derivative transactions due to credit risk is limited to the net amounts due from the counterparties under the derivatives. The Company’s loss is further limited as any amounts due from a defaulting counterparty that is a lender under the senior credit facility can be offset against amounts owed to such counterparty under the Company’s senior credit facility. As of March 31, 2014, the counterparties to the Company’s open derivative contracts consisted of three financial institutions, two of which are also lenders under the Company’s senior credit facility. The Company is not required to post additional collateral under derivative contracts.
Interest Rate Risk
The Company is subject to interest rate risk on its long-term fixed and variable interest rate borrowings. Fixed rate debt, where the interest rate is fixed over the life of the instrument, exposes the Company to (i) changes in market interest rates reflected in the fair value of the debt and (ii) the risk that the Company may need to refinance maturing debt with new debt at a higher rate. Variable rate debt, where the interest rate fluctuates, exposes the Company to short-term interest rate fluctuations as its interest obligations on these instruments are periodically re-determined based on prevailing market interest rates, primarily the LIBOR rate. The Company had neither variable rate debt nor interest rate derivative contracts outstanding at March 31, 2014.
| ITEM 4. | CONTROLS AND PROCEDURES |
Disclosure Controls and Procedures
The Company maintains a set of disclosure controls and procedures designed to ensure that information required to be disclosed by the Company in reports that it files or submits under the Securities Exchange Act of 1934 (the “Exchange Act”) is recorded, processed, summarized and reported within the time periods specified in SEC rules and forms. The disclosure controls and procedures are also designed with the objective of ensuring such information is accumulated and communicated to the Company’s management, including the Chief Executive Officer (“CEO”) and Chief Financial Officer (“CFO”), as appropriate, to allow timely decisions regarding required disclosures. In designing and evaluating the disclosure controls and procedures, management recognized that disclosure controls and procedures, no matter how well conceived and operated, can provide only reasonable, not absolute, assurance that the objectives of the disclosure controls and procedures are met. Additionally, in designing the disclosure controls and procedures, the Company’s management was required to apply its judgment in evaluating the cost-benefit relationship of possible disclosure controls and procedures.
As required by SEC Rule 13a-15(b), the Company carries out an evaluation, under the supervision and with the participation of the Company’s management, including the CEO and CFO, of the effectiveness of the design and operation of the Company’s disclosure controls and procedures as of the end of each quarter. Based on the quarterly evaluation, the CEO and CFO have concluded that the Company’s disclosure controls and procedures were not effective at the reasonable assurance level as of the end of the quarter covered by this report due to the existence of the following material weaknesses. A material weakness is a deficiency, or a combination of deficiencies, in internal control over financial reporting, such that there is a reasonable possibility that a material misstatement of our annual or interim financial statements will not be prevented or detected on a timely basis.
| • | The Company did not maintain a sufficient complement of qualified personnel with U.S. GAAP knowledge necessary to ensure appropriate accounting for share-based compensation (including modification of awards and timely recognition of expense), calculation and recognition of changes in the asset retirement obligations and evaluation of information related to a production tax incentive program. In addition, the Company did not design and implement appropriate review controls related to recognition and measurement of share-based compensation and asset retirement obligations. |
| • | The Company did not design and implement appropriate controls over the completeness, existence and accuracy of accrued liabilities and accounts receivable related to its ownership interests in wells being drilled. |
| • | The Company did not maintain effective internal controls over information technology systems to properly restrict access to record manual journal entries, including the review and approval of manual journal entries. |
Page 24 of 28
Table of Contents
Changes in Internal Control over Financial Reporting
There were no changes in our internal control over financial reporting, other than as described below, that occurred during the three months ended March 31, 2014, that have materially affected, or are reasonably likely to materially affect, our internal control over financial reporting.
During the three months ended March 31, 2014, we took steps to remediate the material internal control weaknesses described above and previously identified in our 2013 Form 10-K including:
| • | Developing or updating accounting policies, schedules and procedures related to share-based compensation, asset retirement obligations, production tax and accrued liabilities and accounts receivables related to ownership in wells being drilled. |
| • | Engaging additional professional accounting resources on a consulting basis to assist with the review of certain complex accounting policies and procedures. |
| • | Implementing internal controls over information technology systems to restrict access to manual journal entries. |
Plan of Remediation of Material weaknesses
In addition to the changes in internal controls over financial reporting discussed above, management believes the following corrective actions are reasonably likely to materially improve our controls and procedures as they are designed to remediate the material weaknesses as discussed above:
| • | We have enhanced the supervisory procedures that include additional levels of analysis and quality control reviews within the accounting and financial reporting functions specifically related to the areas where material weaknesses in internal control were identified for the year ended December 31, 2013. |
| • | We have undertaken a recruiting initiative to add two senior supervisory personnel with the responsibility for, among other things, review of all critical accounting processes. |
| ITEM 1. | LEGAL PROCEEDINGS |
Equal is party to various legal actions arising in the normal course of business. Matters that are probable of unfavorable outcome to Equal and which can be reasonably estimated are accrued. Such accruals are based on information known about the matters, Equal’s estimates of the outcomes, and its experience in contesting, litigating and settling similar matters. To management’s knowledge, there were no pending legal proceedings which would result in amounts material to Equal’s financial position or results of operations. Actual amounts could differ materially from management’s estimates.
For a detailed description of certain legal proceedings, see Item 1, Note 11 in this Form 10-Q and Part I, Item 3 – Legal Proceedings in the Company’s Annual Report on Form 10-K for the year ended December 31, 2013.
| ITEM 1A. | RISK FACTORS |
There have been no material changes to the risk factors set forth in Item 1A “Risk Factors” in our 2013 Annual Report on Form 10-K for the year ended December 31, 2013, as filed with the SEC on March 17, 2014. The risk factors in our Annual Report on Form 10-K for the year ended December 31, 2013, in addition to the other information set forth in this quarterly report, could materially affect our business, financial condition or results of operations. Additional risks and uncertainties not currently known to us or that we deem to be immaterial could also materially adversely affect our business, financial condition or results of operations.
ITEM 2. UNREGISTERED SALES OF EQUITY SECURITIES AND USE OF PROCEEDS
None.
| ITEM 3. | DEFAULTS UPON SENIOR SECURITIES |
None.
Page 25 of 28
Table of Contents
| ITEM 4. | MINE SAFETY DISCLOSURES |
None.
| ITEM 5. | OTHER INFORMATION |
None.
| ITEM 6. | EXHIBITS |
| Exhibit Number |
Description | |
| 31.1 | Certification of the Principal Executive Officer pursuant to §302 of the Sarbanes-Oxley Act of 2002 | |
| 31.2 | Certification of the Principal Financial Officer pursuant to §302 of the Sarbanes-Oxley Act of 2002 | |
| 32.1 | Certification of the Principal Executive Officer pursuant to 18 U.S.C. Section 1350 | |
| 32.2 | Certification of the Principal Financial Officer pursuant to 18 U.S.C. Section 1350 | |
| 10.1 | Arrangement Amending Agreement, dated May 1, 2014 (incorporated by reference to the Current Report on Form 8-K filed by Equal Energy Ltd. on May 2, 2014 (File No. 001-34759). | |
| 101 | The following materials are filed herewith: (i) XBRL Instance, (ii) XBRL Taxonomy Extension Schema, (iii) XBRL Taxonomy Extension Calculation, (iv) XBRL Taxonomy Extension Labels, (v) XBRL Taxonomy Extension Presentation, and (vi) XBRL Taxonomy Extension Definition. In accordance with Rule 406T of Regulation S-T, the information in these exhibits is furnished and deemed not filed or a part of a registration statement or prospectus for purposes of Sections 11 or 12 of the Securities Act of 1933, is deemed not filed for purposes of section 18 of the Exchange Act of 1934, and otherwise is not subject to liability under these sections and shall not be incorporated by reference into any registration statement or other document filed under the Securities Act of 1933, as amended, except as expressly set forth by the specific reference in such filing. | |
Page 26 of 28
Table of Contents
Pursuant to the requirements of the Securities Exchange Act of 1934, the registrant has duly caused this report to be signed on its behalf by the undersigned thereunto duly authorized.
| EQUAL ENERGY LTD. | ||||
| May 8, 2014 | By: | /s/ DON KLAPKO | ||
| Don Klapko President and Chief Executive Officer | ||||
| May 8, 2014 | By: | /s/ SCOTT SMALLING | ||
| Scott Smalling Senior Vice President, Finance and CFO | ||||
Page 27 of 28