Attached files
| file | filename |
|---|---|
| EX-31.1 - EX-31.1 - EQUAL ENERGY LTD. | d513037dex311.htm |
| EX-32.1 - EX-32.1 - EQUAL ENERGY LTD. | d513037dex321.htm |
| EX-32.2 - EX-32.2 - EQUAL ENERGY LTD. | d513037dex322.htm |
| EX-31.2 - EX-31.2 - EQUAL ENERGY LTD. | d513037dex312.htm |
| EXCEL - IDEA: XBRL DOCUMENT - EQUAL ENERGY LTD. | Financial_Report.xls |
Table of Contents
UNITED STATES
SECURITIES AND EXCHANGE COMMISSION
Washington, D.C. 20549
Form 10-Q
(Mark One)
| x | QUARTERLY REPORT UNDER SECTION 13 OR 15(d) OF THE SECURITIES EXCHANGE ACT OF 1934 |
For the quarterly period ended March 31, 2013
or
| ¨ | TRANSITION REPORT PURSUANT TO SECTION 13 OR 15(d) OF THE SECURITIES EXCHANGE ACT OF 1934 |
Commission File Number 001-34759
EQUAL ENERGY LTD.
(Exact name of registrant as specified in its charter)
| Oklahoma City, OK | 98-0533758 | |
| (State of other jurisdiction of incorporation or organization) |
(I.R.S. Employer identification No.) | |
| 4801 Gaillardia Pkwy, Ste 325 | 73142 | |
| (Address of principal executive offices) | (Zip code) | |
Registrant’s telephone number, including area code: (405) 242-6000
Indicate by check mark whether the registrant (1) has filed all reports required to be filed by Section 13 or 15(d) of the Securities Exchange Act of 1934 during the preceding 12 months (or for such shorter period that the registrant was required to file such reports), and (2) has been subject to such filing requirements for the past 90 days. Yes x No ¨
Indicate by check mark whether the registrant has submitted electronically and posted on its corporate Web site, if any, every Interactive Data File required to be submitted and posted pursuant to Rule 405 of Regulation S-T during the preceding 12 months (or for such shorter period that the registrant was required to submit and post such files). Yes x No ¨
Indicate by check mark whether the registrant is a large accelerated filer, an accelerated filer, a non-accelerated filer, or a smaller reporting company. See the definitions of “large accelerated filer,” “accelerated filer” and “smaller reporting company” in Rule 12b-2 of the Exchange Act. (Check one):
| Large accelerated filer | ¨ | Accelerated filer | x | |||
| Non-accelerated filer | ¨ (Do not check if a smaller reporting company) | Smaller reporting company | ¨ | |||
Indicate by check mark whether the registrant is a shell company (as defined in Rule 12b-2 of the Exchange Act). Yes ¨ No x
As of May 03, 2013, there were 35,602,367 shares of our common stock, par value $0.01, outstanding.
Table of Contents
EQUAL ENERGY LTD.
| Part I Financial Information |
||||
| Item 1. Consolidated Financial Statements |
||||
| 4 | ||||
| 5 | ||||
| 6 | ||||
| 7 | ||||
| 8 | ||||
| Item 2. Management’s Discussion and Analysis of Financial Condition and Results of Operations |
16 | |||
| Item 3. Quantitative and Qualitative Disclosures About Market Risk |
25 | |||
| 27 | ||||
| 28 | ||||
| 28 | ||||
| 28 | ||||
| Item 2. Unregistered Sales of Equity Securities and Use of Proceeds |
28 | |||
| 28 | ||||
| 28 | ||||
| 28 | ||||
| 29 | ||||
| 30 | ||||
2
Table of Contents
EQUAL ENERGY LTD.
GLOSSARY
| AECO | a storage and pricing hub for Canadian natural gas market | mcf | thousand cubic feet of natural gas | |||
| bbl or bbls | barrels of oil | mcf per day | thousands of cubic feet of natural gas per day | |||
| bbls per day | barrels of oil per day | mmbtu | millions of British Thermal Units | |||
| boe | barrels of oil equivalent (6 mcf equivalent to 1 bbl) | mmbtu per day | millions of British Thermal Units per day | |||
| boe per day | barrels of oil equivalent per day | mmcf | millions of cubic feet of natural gas | |||
| FD&A | Finding Development & Acquisition Costs | Mwh | megawatt-hour | |||
| FDC | Future Development Costs | NGL | natural gas liquids (ethane, propane, butane and condensate) | |||
| GAAP | Generally Accepted Accounting Principles (United States) | NI 51-101 | National Instrument 51-101 | |||
| GORR | Gross overriding royalty | NYMEX | New York Mercantile Exchange | |||
| WTI | West Texas Intermediate (oil reference price) | Q1 | first quarter of the year—January 1 to March 31 | |||
| LNG | Liquefied Natural Gas | Q2 | second quarter of the year—April 1 to June 30 | |||
| mbbl | thousand barrels of oil | Q4 | third quarter of the year—July 1 to September 30 | |||
| mboe | thousands of barrels of oil equivalent | Q4 | fourth quarter of the year—October 1 to December 31 | |||
3
Table of Contents
EQUAL ENERGY LTD.
| (unaudited) ( in thousands) |
March 31, 2013 | (restated)(a) December 31, 2012 |
||||||
| Assets |
||||||||
| Current assets |
||||||||
| Cash and cash equivalents |
$ | 21,530 | $ | 23,086 | ||||
| Accounts receivable |
15,374 | 15,603 | ||||||
| Prepaid expenses, deposits and other |
908 | 931 | ||||||
| Commodity contracts |
— | 1,453 | ||||||
| Assets of discontinued operations |
— | 2,179 | ||||||
|
|
|
|
|
|||||
| Total current assets |
37,812 | 43,252 | ||||||
| Oil and natural gas properties, full cost method of accounting: |
||||||||
| Proved, net of accumulated depletion of $52.2 million and $47.4 million, respectively |
150,018 | 146,184 | ||||||
| Unproved |
2,541 | 2,091 | ||||||
|
|
|
|
|
|||||
| Total oil and natural gas properties |
152,559 | 148,275 | ||||||
| Other capital assets, net of accumulated depreciation of $1 million and $0.9 million, respectively |
684 | 487 | ||||||
|
|
|
|
|
|||||
| Total property, plant and equipment |
153,243 | 148,762 | ||||||
| Other assets |
1,319 | 1,429 | ||||||
| Commodity contracts |
— | 160 | ||||||
| Deferred income tax asset |
34,573 | 33,772 | ||||||
|
|
|
|
|
|||||
| Total assets |
$ | 226,947 | $ | 227,375 | ||||
|
|
|
|
|
|||||
| Liabilities |
||||||||
| Current liabilities |
||||||||
| Accounts payable and accrued liabilities |
$ | 13,394 | $ | 8,644 | ||||
| Commodity contracts |
1,825 | — | ||||||
| Liabilities of discontinued operations |
— | 5,870 | ||||||
|
|
|
|
|
|||||
| Total current liabilities |
15,219 | 14,514 | ||||||
| Convertible debentures |
44,294 | 45,230 | ||||||
| Asset retirement obligation |
4,918 | 4,746 | ||||||
| Commodity contracts |
319 | — | ||||||
| Liabilities of discontinued operations |
— | 787 | ||||||
|
|
|
|
|
|||||
| Total liabilities |
64,750 | 65,277 | ||||||
|
|
|
|
|
|||||
| Shareholders’ equity |
||||||||
| Common shares, $.01 par value Unlimited authorized shares and 35,563,467 and 35,226,526 shares issued and Outstanding, respectively |
356 | 352 | ||||||
| Additional capital |
228,473 | 228,166 | ||||||
| Accumulated other comprehensive loss |
(102,102 | ) | (102,163 | ) | ||||
| Retained earnings |
35,470 | 35,743 | ||||||
|
|
|
|
|
|||||
| Total shareholders’ equity |
162,197 | 162,098 | ||||||
|
|
|
|
|
|||||
| Total liabilities and shareholders’ equity |
$ | 226,947 | $ | 227,375 | ||||
|
|
|
|
|
|||||
See accompanying notes to the consolidated financial statements.
| (a) | Restated in U.S. dollars, see Note 1 for further details. |
4
Table of Contents
EQUAL ENERGY LTD.
CONSOLIDATED STATEMENTS OF INCOME AND COMPREHENSIVE INCOME /(LOSS)
| (unaudited) (in thousands, except per share data) |
Three months ended March 31, | |||||||
| 2013 | 2012 (restated)(a) | |||||||
| Revenues |
||||||||
| NGL, natural gas and oil revenues |
$ | 14,805 | $ | 17,776 | ||||
| Gain (loss) on commodity contracts |
(3,271 | ) | 809 | |||||
|
|
|
|
|
|||||
| Total revenues |
11,534 | 18,585 | ||||||
| Expenses |
||||||||
| Production |
3,455 | 5,984 | ||||||
| Production taxes |
926 | 998 | ||||||
| General and administrative, including share-based compensation |
3,154 | 2,293 | ||||||
| Interest expense |
949 | 1,843 | ||||||
| Depletion and depreciation |
4,867 | 5,998 | ||||||
| Amortization of deferred charges |
110 | 109 | ||||||
| Accretion of asset retirement obligation |
101 | 106 | ||||||
| Gain on sale of assets |
(28 | ) | — | |||||
| Foreign exchange gain |
(969 | ) | (2,768 | ) | ||||
|
|
|
|
|
|||||
| 12,565 | 14,563 | |||||||
|
|
|
|
|
|||||
| Income (loss) from continuing operations before taxes |
$ | (1,031 | ) | $ | 4,022 | |||
| Taxes |
||||||||
| Deferred tax (expense) benefit |
801 | (948 | ) | |||||
|
|
|
|
|
|||||
| Income/(loss) from continuing operations |
(230 | ) | 3,074 | |||||
| Discontinued operations: |
||||||||
| Income from discontinued operations |
1,762 | 878 | ||||||
|
|
|
|
|
|||||
| Net income |
$ | 1,532 | $ | 3,952 | ||||
| Other comprehensive income/(loss) |
||||||||
| Foreign currency translation adjustment |
61 | (3,641 | ) | |||||
|
|
|
|
|
|||||
| Comprehensive income |
$ | 1,593 | $ | 311 | ||||
| Earnings per share information : |
||||||||
| Basic earnings (loss) per share from continuing operations |
(0.01 | ) | 0.09 | |||||
| Basic earnings per share from discontinued operations |
0.05 | 0.02 | ||||||
|
|
|
|
|
|||||
| Basic earnings per share |
0.04 | 0.11 | ||||||
| Diluted earnings (loss) per share from continuing operations |
(0.01 | ) | 0.09 | |||||
| Diluted earnings per share from discontinued operations |
0.05 | 0.02 | ||||||
|
|
|
|
|
|||||
| Diluted earnings per share |
0.04 | 0.11 | ||||||
See accompanying notes to the consolidated financial statements.
| (a) | Restated in U.S. dollars, see Note 1 for further details. |
5
Table of Contents
EQUAL ENERGY LTD.
CONSOLIDATED STATEMENTS OF STOCKHOLDERS’ EQUITY
| Accumulated | ||||||||||||||||||||||||
| Additional | Other | Total | ||||||||||||||||||||||
| Common Stock | Paid-In | Retained | Comprehensive | Stockholders’ | ||||||||||||||||||||
| (unaudited) (in thousands) | Shares | Amount | Capital | Earnings | Loss | Equity | ||||||||||||||||||
| Balances at December 31, 2011 (restated)(a) |
34,779 | $ | 348 | $ | 223,845 | $ | (26,579 | ) | $ | (99,054 | ) | $ | 98,560 | |||||||||||
| Issue of common shares under restricted share plan |
212 | 2 | — | 2 | ||||||||||||||||||||
| Share-based compensation before capitalization |
1,372 | 1,372 | ||||||||||||||||||||||
| Net income and comprehensive loss for the period |
3,952 | (3,641 | ) | 311 | ||||||||||||||||||||
|
|
|
|
|
|
|
|
|
|
|
|
|
|||||||||||||
| Balances at March 31, 2012 (restated)(a) |
34,991 | $ | 350 | $ | 225,217 | $ | (22,627 | ) | $ | (102,695 | ) | $ | 100,245 | |||||||||||
|
|
|
|
|
|
|
|
|
|
|
|
|
|||||||||||||
| Balances at December 31, 2012 (restated)(a) |
35,227 | $ | 352 | $ | 228,166 | $ | 35,743 | $ | (102,163 | ) | $ | 162,098 | ||||||||||||
| Issue of common shares under restricted share plan |
336 | 4 | — | 4 | ||||||||||||||||||||
| Share-based compensation before capitalization |
307 | 307 | ||||||||||||||||||||||
| Dividend |
(1,805 | ) | (1,805 | ) | ||||||||||||||||||||
| Income and comprehensive income for the period |
1,532 | 61 | 1,593 | |||||||||||||||||||||
|
|
|
|
|
|
|
|
|
|
|
|
|
|||||||||||||
| Balances at March 31, 2013 |
35,563 | $ | 356 | $ | 228,473 | $ | 35,470 | $ | (102,102 | ) | $ | 162,197 | ||||||||||||
|
|
|
|
|
|
|
|
|
|
|
|
|
|||||||||||||
See accompanying notes to the consolidated financial statements.
| (a) | Restated in U.S. dollars, see Note 1 for further details. |
6
Table of Contents
EQUAL ENERGY LTD.
CONSOLIDATED STATEMENTS OF CASH FLOWS
| Three months
ended March 31, |
||||||||
| (unaudited) (in thousands) | 2013 | 2012(restated)(a) | ||||||
| Operating Activities |
||||||||
| Net income |
$ | 1,532 | $ | 3,952 | ||||
| Net income from discontinued operations |
(1,762 | ) | (878 | ) | ||||
| Depletion and depreciation |
4,867 | 5,998 | ||||||
| Accretion of asset retirement obligation |
101 | 106 | ||||||
| Share-based compensation |
307 | 925 | ||||||
| Amortization of deferred charges |
110 | 109 | ||||||
| Unrealized commodity contracts loss |
3,757 | 1,178 | ||||||
| Gain on sale of assets |
(28 | ) | — | |||||
| Deferred tax (benefit) / expense |
(801 | ) | 948 | |||||
| Foreign exchange gain |
(969 | ) | (2,612 | ) | ||||
| Change in assets and liabilities: |
||||||||
| Accounts receivable |
218 | 3,600 | ||||||
| Prepaid expenses and other current assets |
22 | (253 | ) | |||||
| Accounts payable and accrued liabilities |
2,974 | 867 | ||||||
|
|
|
|
|
|||||
| Net cash provided by operating activities – continuing operations |
10,328 | 13,940 | ||||||
| Net cash used in operating activities – discontinued operations |
(2,716 | ) | (1,219 | ) | ||||
|
|
|
|
|
|||||
| Net cash provided by operating activities |
7,612 | 12,721 | ||||||
|
|
|
|
|
|||||
| Investing Activities |
||||||||
| Property, plant and equipment additions |
(7,399 | ) | (10,618 | ) | ||||
| Proceeds on sale of property, plant and equipment |
36 | 1,383 | ||||||
|
|
|
|
|
|||||
| Net cash used in investing activities – continuing operations |
(7,363 | ) | (9,240 | ) | ||||
| Net cash provided by investing activities – discontinued operations |
— | 7,402 | ||||||
|
|
|
|
|
|||||
| Net cash used in investing activities |
(7,363 | ) | (1,838 | ) | ||||
|
|
|
|
|
|||||
| Financing Activities |
||||||||
| Decrease in long-term debt |
— | (13,000 | ) | |||||
| Dividend |
(1,805 | ) | — | |||||
|
|
|
|
|
|||||
| Net cash used in financing activities |
(1,805 | ) | (13,000 | ) | ||||
|
|
|
|
|
|||||
| Foreign exchange on financial balances |
— | (74 | ) | |||||
|
|
|
|
|
|||||
| Change in cash and cash equivalents |
(1,556 | ) | (2,191 | ) | ||||
| Cash and cash equivalents, beginning of period |
23,086 | 5,460 | ||||||
|
|
|
|
|
|||||
| Cash and cash equivalents, end of period |
$ | 21,530 | $ | 3,269 | ||||
|
|
|
|
|
|||||
| Supplementary Cash Flow Information |
||||||||
| Interest paid |
1,518 | 2,601 | ||||||
| Income tax paid |
— | — | ||||||
See accompanying notes to the consolidated financial statements
| (a) | Restated in U.S. dollars, see Note 1 for further details. |
7
Table of Contents
EQUAL ENERGY LTD.
NOTES TO CONSOLIDATED FINANCIAL STATEMENTS
(unaudited)
| 1. | Basis of Presentation and Significant Accounting Policies |
Equal Energy Ltd. (“Equal” or the “Company”) is a publicly listed company whose common shares trade on both the Toronto Stock Exchange (“TSX”) and the New York Stock Exchange (“NYSE”) under the symbol EQU. Equal is engaged in the exploration, development and production of NGLs, natural gas and oil in the United States and conducts many of its activities jointly with others. These financial statements reflect only the Company’s proportionate interest in such activities.
As required by Rule 3b-4(c) of the United States Securities Exchange Act of 1934, as amended, and Rule 405 of the United States Securities Act of 1933, as amended, Equal has adopted generally accepted accounting principles in the United States of America (“U.S. GAAP”) for financial reporting.
The accompanying unaudited financial statements have been prepared pursuant to the rules and regulations of the United States Securities and Exchange Commission (“SEC”). Pursuant to such rules and regulations, certain disclosures normally included in financial statements prepared in accordance with accounting principles generally accepted in the United States of America have been omitted. The accompanying financial statements should be read in conjunction with the Company’s financial statements included in Equal’s Annual Report on Form 10-K for the year ended December 31, 2012, filed with the SEC on March 14, 2013. The accompanying unaudited interim financial statements reflect all adjustments that are, in the opinion of management, necessary for a fair presentation of the Company’s financial statements for the three-month periods ended March 31, 2013 and 2012.
Foreign Currency Transactions
As a result of the 2012 strategic review all of Equal’s Canadian oil and gas assets were sold in Q4 2012. Starting in January 2013, the Company changed its functional currency from the Canadian dollar to the U.S. dollar, as the Company primarily generates revenue and expends cash in U.S. dollars now. In addition, effective January 1, 2013, the Company changed its reporting currency from the Canadian dollar to the U.S. dollar. All prior periods presented have been restated to reflect the U.S. dollar as the reporting currency.
Effective January 1, 2013, transactions completed in Canadian dollars (“CAD”) are remeasured in U.S. dollars (“USD”) and resulting gains and losses are included earnings.
| 2. | Accounts Receivable |
The components of account receivable include the following:
| (in thousands of dollars) |
March 31, 2013 | December 31, 2012 | ||||||
| Accounts receivable – trade |
$ | 11,129 | $ | 10,731 | ||||
| Accounts receivable – other |
4,445 | 5,045 | ||||||
| Allowance for doubtful accounts |
(200 | ) | (173 | ) | ||||
|
|
|
|
|
|||||
| $ | 15,374 | $ | 15,603 | |||||
|
|
|
|
|
|||||
| 3. | Long-Term Debt |
At March 31, 2013, the Company had a syndicated bank credit facility of CAD $125 million comprised of a CAD $105 million revolving credit facility and a CAD $20 million operating credit facility and can be drawn against in either CAD or USD. As of May 2013, the borrowing base has been reviewed and the banks have approved a renewal of CAD $125 million. The revolving and operating credit facilities are secured with a first priority charge over the assets of Equal. The maturity date of the revolving and operating credit facilities is June 2014 and should the lenders decide not to renew the facility, the debt must be repaid by June 2015.
Interest rates and standby fees for the credit facilities are set quarterly according to a grid based on the ratio of bank debt to cash flow with the interest rates based on Canadian dollar BA (“Bankers Acceptance”) or U.S. dollar LIBOR rate plus 2.0% to 3.5%, depending on the ratio of bank debt to cash flow. For any unused balance of the credit facility, between 0.50% to 0.88% is charged as a standby fee which is recorded in interest expense. At March 31, 2013, the marginal interest rate and standby fee were 2.50% and 0.625%, respectively.
8
Table of Contents
EQUAL ENERGY LTD.
NOTES TO CONSOLIDATED FINANCIAL STATEMENTS
(unaudited)
Equal is required to maintain several financial and non-financial covenants. The primary financial covenant is an interest coverage ratio of 3:1 as calculated pursuant to the terms of the credit agreement. For the three months ended March 31, 2013, the interest coverage ratio was 14:1. Equal is in compliance with the terms and covenants of the credit facilities as at March 31, 2013. At March 31, 2013, no amount was borrowed against the credit facility and the entire balance of CAD $125 million was available.
| 4. | Convertible Debentures |
On February 9, 2011, Equal issued CAD $45 million of convertible unsecured junior subordinated debentures with a face value of CAD $1,000 per debenture that mature on March 31, 2016, and bear interest at 6.75% per annum paid semi-annually on March 31 and September 30 of each year. The 6.75% convertible debentures are convertible at the option of the holder into shares at any time prior to the maturity date at a conversion price of CAD $8.85 per share.
At March 31, 2013, the Company had CAD $45 million (US $44.3 million) in face value of 6.75% convertible debentures outstanding with an estimated fair value of US $44.6 million.
| 5. | Asset Retirement Obligation |
The following table reconciles the asset retirement obligation:
| Three Months Ended March 31, |
||||||||
| (in thousands of dollars) |
2013 | 2012 | ||||||
| Asset retirement obligations as of beginning of period |
$ | 4,746 | $ | 5,182 | ||||
| Liabilities added |
36 | 54 | ||||||
| Liabilities settled |
— | (23 | ) | |||||
| Revision of estimated obligation |
35 | — | ||||||
| Accretion expense on discounted obligation |
101 | 106 | ||||||
|
|
|
|
|
|||||
| Asset retirement obligations as of end of period |
$ | 4,918 | $ | 5,319 | ||||
|
|
|
|
|
|||||
| 6. | Share-Based Compensation |
The Company is authorized to issue up to 10% of its issued and outstanding shares under the employee equity plan. The Company has 1.7 million shares available for future awards at March 31, 2013, after reserving for the maximum potential shares that could be awarded under existing grants. The Company issues new shares from remaining authorized common stock to satisfy awards.
Compensation cost for non-qualified option rights and restricted stock awards is recognized based on the fair value of the awards granted at the grant-date and is amortized to compensation expense on a straight-line basis over the requisite service periods of the stock awards, which are generally the vesting periods. The Company recognized compensation costs of $0.3 million and $0.9 million during the three months ended March 31, 2013 and March 31, 2012, respectively, for such awards. At March 31, 2013, the total compensation cost related to nonvested grants not yet recognized is approximately $4.6 million, which is expected to be recognized on a straight-line basis over the vesting period of approximately three years.
Share options
Equal has an employee equity plan where the Company may grant share options to its directors, officers and employees. Each share option permits the holder to purchase one share at the stated exercise price. All options vest over a 1 to 3 year period and have a term of 3 to 5 years. The exercise price is equal to the market price at the time of the grant. The forfeiture rate is estimated to be 16%. The Black-Scholes option valuation model was used to estimate the fair value of the options at the date of the grant. The assumptions used to calculate compensation expense relating to the stock option awards granted during the three months ended March 31, 2013, were as follows: weighted-average expected life of the awards of four years, volatility factor of 50%, risk-free rate of 0.625% and dividend yield of 6.67%. The weighted average grant-date fair value of these options was $.71 per option. The options vest evenly over a three year period.
9
Table of Contents
EQUAL ENERGY LTD.
NOTES TO CONSOLIDATED FINANCIAL STATEMENTS
(unaudited)
There is no intrinsic value of vested and exercisable options at March 31, 2013, as the exercise prices of these options are higher than the Company’s closing stock price of $3.81 at March 31, 2013.
The following table sets forth the non-qualified option rights activity for the three months ended March 31, 2013:
| Number of Options (in thousands) |
Weighted Average Exercise Price |
Weighted- Average Remaining Contractual Term |
||||||||||
| Options outstanding at December 31, 2012 |
735 | $ | 6.45 | 1.52 | ||||||||
| Options granted |
34 | 2.95 | ||||||||||
| Options vested |
— | — | ||||||||||
| Options forfeited/expired |
(175 | ) | 6.75 | |||||||||
|
|
|
|
|
|
|
|||||||
| Options outstanding at March 31, 2013 |
594 | $ | 6.18 | 1.53 | ||||||||
|
|
|
|
|
|
|
|||||||
| Vested and exercisable options at: March 31, 2013 |
359 | $ | 6.47 | 1.23 | ||||||||
|
|
|
|
|
|
|
|||||||
Restricted shares
Equal has granted restricted shares to directors, officers, and employees. Restricted shares vest over a contracted period ranging from vesting on grant to three years and provide the holder with shares on the vesting dates of the restricted shares. Upon vesting of the restricted shares, the plan administrator automatically sells a portion of the common shares on a public stock exchange for the estimated income tax. The forfeiture rate is estimated to be 16%. The estimated value of the restricted shares is based on the trading price of the shares on the grant date.
The aggregate intrinsic value of restricted shares outstanding at March 31, 2013, is $4.8 million based on the Company’s closing stock price of $3.81.
The following table presents the status of the Company’s nonvested restricted shares as of March 31, 2013, and changes during the three months ended March 31, 2013:
| Number
of Restricted Shares (in thousands) |
Weighted Average Grant Date Fair Value |
Vest Date Intrinsic Value |
||||||||||
| Restricted shares outstanding at December 31, 2012 |
1,221 | $ | 4.77 | — | ||||||||
| Restricted shares granted |
585 | 3.27 | — | |||||||||
| Restricted shares vested and exercised |
(361 | ) | 5.17 | $ | 1,116 | |||||||
| Restricted shares forfeited/expired |
(173 | ) | 4.11 | — | ||||||||
|
|
|
|
|
|
|
|||||||
| Restricted shares outstanding at March 31, 2013 |
1,272 | $ | 4.05 | — | ||||||||
|
|
|
|
|
|
|
|||||||
| 7. | Earnings Per Share |
Basic earnings per share (“EPS”) is computed by dividing net income by the weighted-average number of common shares outstanding during the period. Diluted EPS is based on the combined weighted-average number of common shares and dilutive potential common shares outstanding which include, where appropriate, the assumed exercise of options. In computing diluted EPS, the Company utilizes the treasury stock method.
10
Table of Contents
EQUAL ENERGY LTD.
NOTES TO CONSOLIDATED FINANCIAL STATEMENTS
(unaudited)
The computation of weighted-average common and common equivalent shares used in the calculation of basic and diluted EPS is shown in the following table (in thousands, except share and per share data):
| Three Months | ||||||||
| Ended March 31, | ||||||||
| 2013 | 2012 | |||||||
| Net income (loss) – Continuing Operations |
$ | (230 | ) | $ | 3,074 | |||
| Net income – Discontinued Operations |
1,762 | 878 | ||||||
|
|
|
|
|
|||||
| Total Net income |
$ | 1,532 | $ | 3,952 | ||||
|
|
|
|
|
|||||
| Basic EPS: |
||||||||
| Weighted-average common shares |
35,453,248 | 34,969,794 | ||||||
| Basic EPS – Continuing Operations |
$ | (0.01 | ) | $ | 0.09 | |||
| Basic EPS – Discontinued Operations |
0.05 | 0.02 | ||||||
|
|
|
|
|
|||||
| Basic—Combined |
$ | 0.04 | $ | 0.11 | ||||
|
|
|
|
|
|||||
| Net income (loss) – Continuing Operations |
$ | (230 | ) | $ | 3,074 | |||
| Net income – Discontinued Operations |
1,762 | 878 | ||||||
|
|
|
|
|
|||||
| Total Net income |
$ | 1,532 | $ | 3,952 | ||||
|
|
|
|
|
|||||
| Diluted EPS: |
||||||||
| Weighted-average common shares |
35,453,248 | 34,969,794 | ||||||
| Shares contingently issuable: |
||||||||
| Stock options |
1,712 | — | ||||||
| Restricted shares |
824,108 | 1,159,661 | ||||||
|
|
|
|
|
|||||
| Shares applicable to diluted |
36,279,068 | 36,129,455 | ||||||
|
|
|
|
|
|||||
| Diluted EPS – Continuing Operations |
$ | (0.01 | ) | $ | 0.09 | |||
| Diluted EPS – Discontinued Operations |
0.05 | 0.02 | ||||||
|
|
|
|
|
|||||
| Diluted EPS – Combined |
$ | 0.04 | $ | 0.11 | ||||
|
|
|
|
|
|||||
11
Table of Contents
EQUAL ENERGY LTD.
NOTES TO CONSOLIDATED FINANCIAL STATEMENTS
(unaudited)
For the calculation of the weighted average number of diluted shares outstanding for the three months ended March 31, 2013, all restricted shares were included as they were dilutive to the calculation and convertible debentures and all options, except for the 34,500 options granted in February 2013, were excluded as they were anti-dilutive.
For the calculation of the weighted average number of diluted shares outstanding for the three months ended March 31, 2012, all restricted shares were included as they were dilutive to the calculation and all options and convertible debentures were excluded as they were anti-dilutive.
| 8. | Fair Value Measurements |
Financial instruments are presented at fair value in the Company’s balance sheets. Fair value is defined as the price that would be received to sell an asset or paid to transfer a liability in an orderly transaction between market participants at the measurement date. Assets and liabilities recorded at fair value in the balance sheets are categorized based upon the level of judgment associated with the inputs used to measure their fair values. These categories include (in descending order of priority): Level 1, defined as observable inputs for identical instruments such as quoted prices in active markets; Level 2, defined as inputs, other than quoted prices in active markets, that are either directly or indirectly observable; and Level 3, defined as unobservable inputs in which little or no market data exists, therefore requiring an entity to develop its own assumptions.
The carrying values of cash, accounts receivable, other current receivables, accounts payable, other payables and accrued expenses included in the accompanying balance sheets approximated fair value at March 31, 2013, and December 31, 2012. The fair value of the convertible debentures is disclosed in Note 4 and is based on the trading price of the debentures at the reporting date (Level 1). These assets and liabilities are not presented in the following tables.
As at March 31, 2013 and 2012, the only asset or liability measured at fair value on a recurring basis was the commodity contracts. The following tables provide fair value measurement information for such assets and liabilities as of March 31, 2013 and 2012.
| Total | Fair Value Measurements Using: | |||||||||||||||||||
| Carrying Amount |
Fair Value |
Level
1 Inputs |
Level
2 Inputs |
Level
3 Inputs |
||||||||||||||||
| (In thousands) | ||||||||||||||||||||
| March 31, 2013 assets (liabilities): |
||||||||||||||||||||
|
|
|
|
|
|
|
|
|
|
|
|||||||||||
| Commodity derivatives |
$ | (2,144 | ) | $ | (2,144 | ) | $ | — | $ | (2,144 | ) | $ | — | |||||||
|
|
|
|
|
|
|
|
|
|
|
|||||||||||
| Fair Value Measurements Using: | ||||||||||||||||||||
| Carrying Amount |
Total Fair Value |
Level
1 Inputs |
Level
2 Inputs |
Level
3 Inputs |
||||||||||||||||
| (In thousands) | ||||||||||||||||||||
| December 31, 2012 assets (liabilities): |
||||||||||||||||||||
|
|
|
|
|
|
|
|
|
|
|
|||||||||||
| Commodity contracts |
$ | 1,613 | $ | 1,613 | $ | — | $ | 1,613 | $ | — | ||||||||||
|
|
|
|
|
|
|
|
|
|
|
|||||||||||
The following methods and assumptions were used to estimate the fair values in the tables above.
In determining the fair values of fixed price swaps, a discounted cash flow method is used due to the unavailability of relevant comparable market data for the Company’s exact contracts. The discounted cash flow method estimates future cash flows based on quoted forward prices for commodities and a risk-adjusted discount rate. The fair values of fixed price swaps are calculated mainly using significant observable inputs (Level 2). The Company’s calculation for each of its derivative positions is compared to the counterparty valuation for reasonableness. Equal’s convertible debentures actively trade in an established market. There were no transfers into or out of Level 1 or Level 2 measurements for the three months ended March 31, 2013, or the 12 months ended December 31, 2012. The Company’s policy is to recognize transfers between levels as of the beginning of the period in which the event or change in circumstances triggering the transfer occurs. The Company had no Level 3 financial instruments at any time during the three months ended March 31, 2013 or 2012.
12
Table of Contents
EQUAL ENERGY LTD.
NOTES TO CONSOLIDATED FINANCIAL STATEMENTS
(unaudited)
| 9. | Commodity Contracts |
Equal has entered into commodity contracts to minimize the exposure to fluctuations in crude oil and natural gas prices. These commodity contracts do not qualify for hedge accounting treatment and thus are not designated as hedging instruments. At March 31, 2013, the following financial derivative contracts were outstanding:
| Derivative Instrument |
Commodity |
Price (2) | Volume per day (2) | Period | ||||
| Fixed |
Gas | 3.45 (US$/mmbtu) (3.57 US$/mcf) |
2,000 mmbtu (1,932 mcf) |
April 1, 2013 – December 31, 2013 | ||||
| Fixed |
Gas | 3.60 (US$/mmbtu) (3.73 US$/mcf) |
3,000 mmbtu (2,899 mcf) |
April 1, 2013 – December 31, 2013 | ||||
| Fixed |
Gas | 3.61 (US$/mmbtu) (3.74 US$/mcf) |
2,000 mmbtu (1,932 mcf) |
April 1, 2013 – December 31, 2013 | ||||
| Fixed |
Gas | 3.65 (US$/mmbtu) (3.78 US$/mcf) |
2,000 mmbtu (1,932 mcf) |
April 1, 2013 – December 31, 2013 | ||||
| Fixed |
Gas | 3.70 (US$/mmbtu) (3.83 US$/mcf) |
2,000 mmbtu (1,932 mcf) |
April 1, 2013 – December 31, 2013 | ||||
| Fixed |
Gas | 4.05 (US$/mmbtu) (4.19 US$/mcf) |
2,000 mmbtu (1,932 mcf) |
April 1, 2013 – December 31, 2013 | ||||
| Fixed |
Gas | 3.94 (US$/mmbtu) (4.08 US$/mcf) |
2,000 mmbtu (1,932 mcf) |
April 1, 2013 – October 31, 2013 | ||||
| Fixed |
Gas | 3.99 (US$/mmbtu) (4.13 US$/mcf) |
1,000 mmbtu (966 mcf) |
April 1, 2013 – December 31, 2013 | ||||
| Fixed Basis Differential (1) |
Gas | Differential Fixed @ $0.20 US$/mmbtu ($0.21 US$/mcf) |
7,000 mmbtu (6,763 mcf) |
April 1, 2013 – December 31, 2013 | ||||
| Fixed Basis Differential (1) |
Gas | Differential Fixed @ $0.205 US$/mmbtu ($0.212 US$/mcf) |
5,000 mmbtu (4,831 mcf) |
April 1, 2013 – December 31, 2013 | ||||
| Fixed |
Oil | 101.50 ($/bbl) | 200 bbl | April 1, 2013 – December 31, 2013 | ||||
| Fixed (3) |
Propane | 38.22 ($/bbl) | 300 bbl | April 1, 2013 – December 31, 2013 | ||||
| Fixed |
Gas | 4.25 (US$/mmbtu) (4.40 US$/mcf) |
2,000 mmbtu (1,932 mcf) |
January 1, 2014 – December 31, 2014 | ||||
| Fixed |
Gas | 4.055 (US$/mmbtu) (4.20 US$/mcf) |
2,000 mmbtu (1,932 mcf) |
January 1, 2014 – 31- Dec-14 | ||||
| Fixed |
Gas | 4.10 (US$/mmbtu) (4.24 US$/mcf) |
2,000 mmbtu (1,932 mcf) |
January 1, 2014 – December 31, 2014 | ||||
| Fixed |
Gas | 4.06 (US$/mmbtu) (4.20 US$/mcf) |
2,000 mmbtu (1,932 mcf) |
January 1, 2014 – December 31, 2014 | ||||
| Fixed |
Gas | 4.05 (US$/mmbtu) (4.19 US$/mcf) |
4,000 mmbtu (3,864 mcf) |
January 1, 2014 – December 31, 2014 | ||||
| (1) | NYMEX / Southern Star (Oklahoma) basis differential. |
| (2) | Conversion rate of 1.0350 mmbtu per mcf. |
| (3) | Conway, Propane (in-well) OPIS |
The gains (losses) during the periods from the commodity contracts are summarized in the table below.
13
Table of Contents
EQUAL ENERGY LTD.
NOTES TO CONSOLIDATED FINANCIAL STATEMENTS
(unaudited)
| Three Months | ||||||||
| Ended March 31, | ||||||||
| (in thousands of dollars) |
2013 | 2012 | ||||||
| Realized gain on commodity contracts |
$ | 486 | $ | 1,987 | ||||
| Unrealized loss on commodity contracts |
(3,757 | ) | (1,178 | ) | ||||
|
|
|
|
|
|||||
| Net gain/(loss) on commodity contracts |
$ | (3,271 | ) | $ | 809 | |||
|
|
|
|
|
|||||
| 10. | Accumulated Other Comprehensive Loss |
| Three Months | ||||||||
| Ended March 31, | ||||||||
| (in thousands of dollars) |
2013 | 2012 | ||||||
| Foreign currency translation: |
||||||||
| Beginning accumulated foreign currency translation |
$ | (102,163 | ) | $ | (99,054 | ) | ||
| Change in cumulative translation adjustment |
61 | (3,641 | ) | |||||
|
|
|
|
|
|||||
| Ending accumulated foreign currency translation |
$ | (102,102 | ) | $ | (102,695 | ) | ||
|
|
|
|
|
|||||
Accumulated other comprehensive income/(loss) is comprised entirely of currency translation adjustments on the U.S. operations.
| 11. | Cash Dividends |
On November 27, 2012, Equal announced the initiation of a $0.20 per share annual dividend beginning January 1, 2013, payable at the end of each calendar quarter. A cash dividend of $0.05 per share of outstanding common stock was paid on March 31, 2013, to shareholders of record at the close of business on March 1, 2013. Future declaration of dividends and the establishment of future record and payment dates are subject to the final determination of the Company’s Board of Directors.
| 12. | Discontinued Operations |
In 2012, Equal announced that its Board of Directors initiated a strategic review process to identify, examine and consider alternatives with the view to enhance shareholder value. As a result of the strategic review process, the Company sold all of its Canadian assets and certain of its Oklahoman assets.
The Canadian asset sales in late 2012 totaling CAD $89.6 million resulted in the discontinuation of operations in Canada. Prior to the initiation of the strategic review, there was a Canadian asset sale for proceeds of CAD $8.3 million which included heavy oil properties in Saskatchewan. Certain Northern Oklahoma assets were sold for total cash consideration of US $58.0 million to its Mississippian joint venture partner, which are not included in discontinued operations.
The income of US $1.8 million from discontinued operations for the period ended March 31, 2013, primarily relates to post-closing adjustments and finalization of the responsible party for asset retirement obligations related to 2012 dispositions and accrual to actual adjustments related to sold properties.
| 13. | Contingencies |
Equal is party to various legal actions arising in the normal course of business. Matters that are probable of unfavorable outcome to Equal and which can be reasonably estimated are accrued. Such accruals are based on information known about the matters, Equal’s estimates of the outcomes of such matters and its experience in contesting, litigating and settling similar matters. None of the actions are believed by management to involve future amounts that would be material to Equal’s financial position or results of operations after consideration of recorded accruals. Actual amounts could differ materially from management’s estimates.
14
Table of Contents
EQUAL ENERGY LTD.
NOTES TO CONSOLIDATED FINANCIAL STATEMENTS
(unaudited)
| 14. | Subsequent Events |
In preparing the accompanying condensed consolidated financial statements, the Company has reviewed events that have occurred after March 31, 2013, through the issuance of the financial statements. The Company did not note any reportable subsequent events.
15
Table of Contents
ITEM 2. MANAGEMENT’S DISCUSSION AND ANALYSIS OF FINANCIAL CONDITION AND RESULTS OF OPERATIONS
Forward-Looking Statements
The information discussed in this quarterly report on Form 10-Q includes “forward-looking statements” within the meaning of Section 27A of the Securities Act of 1933 (the “Securities Act”) and Section 21E of the Securities Exchange Act of 1934 (the “Exchange Act”). All statements, other than statements of historical facts, included herein concerning, among other things, planned capital expenditures, changes in oil and gas production, the number of anticipated wells to be drilled after the date hereof, future cash flows and borrowings, pursuit of potential acquisition opportunities, our financial position, business strategy and other plans and objectives for future operations, are forward-looking statements. These forward-looking statements are identified by their use of terms and phrases such as “may,” “expect,” “estimate,” “project,” “plan,” “believe,” “intend,” “achievable,” “anticipate,” “will,” “continue,” “potential,” “should,” “could,” and similar terms and phrases. Although we believe that the expectations reflected in these forward-looking statements are reasonable, they do involve certain assumptions, risks and uncertainties. Our results could differ materially from those anticipated in these forward-looking statements as a result of certain factors, including, among others:
| • | risks associated with drilling oil and natural gas wells; |
| • | the volatility of oil and natural gas prices; |
| • | uncertainties in estimating oil and natural gas reserves; |
| • | the need to replace the oil and natural gas the Company produces; |
| • | the Company’s ability to execute its growth strategy by drilling wells as planned; |
| • | risks and liabilities associated with acquired properties and risks related to the integration of acquired businesses; |
| • | amount, nature and timing of capital expenditures, including future development costs, required to develop the Company’s undeveloped areas; |
| • | concentration of operations in Central Oklahoma; |
| • | inability to retain drilling rigs and other services; |
| • | risk of currency fluctuations; |
| • | the potential adverse effect of commodity price declines on the carrying value of the Company’s oil and natural gas properties; |
| • | severe or unseasonable weather that may adversely affect production and drilling; |
| • | availability of satisfactory oil and natural gas marketing and transportation; |
| • | availability and terms of capital to fund capital expenditures; |
| • | amount and timing of proceeds of asset sales and asset monetizations; |
| • | ability to fund ongoing dividends; |
| • | limitations on operations resulting from debt restrictions and financial covenants; |
| • | potential financial losses or earnings reductions from commodity derivatives; |
| • | potential elimination or limitation of tax incentives; |
| • | competition in the oil and natural gas industry; |
| • | risks associated with consent solicitations and proxy contests conducted by dissident stockholders; |
| • | general economic conditions, either internationally or domestically or in the areas where the Company operates; |
16
Table of Contents
| • | inability to obtain required regulatory approvals for development activities; |
| • | costs to comply with current and future governmental regulation of the oil and natural gas industry, including environmental, health and safety laws and regulations, and regulations with respect to hydraulic fracturing; and |
| • | the need to maintain adequate internal control over financial reporting. |
Finally, our future results will depend upon various other risks and uncertainties, including, but not limited to, those detailed in the section entitled “Risk Factors” included in our Annual Report on Form 10-K. All forward-looking statements attributable to us or persons acting on our behalf are expressly qualified in their entirety by the cautionary statements in this section and elsewhere in this report. Other than as required under securities laws, we do not assume a duty to update these forward-looking statements, whether as a result of new information, subsequent events or circumstances, changes in expectations or otherwise.
The following discussion and analysis addresses material changes in our results of operations and capital resources and uses for the three-month ended March 31, 2013, compared to the three-month ended March 31, 2012, and in our financial condition and liquidity since December 31, 2012, and should be read in conjunction with “Item 1. Consolidated Financial Statements” of this report and “Item 7. Management’s Discussion and Analysis of Financial Condition and Results of Operations” in our 2012 Annual Report on Form 10-K.
In addition, the following discussion is for our continuing operations (U.S. operations) and thus does not include the results of our Canadian operations for the three-month ended March 31, 2012.
Overview
Equal Energy Ltd. is an Oklahoma City, Oklahoma based exploration and production oil and gas company engaged in the exploration for, and acquisition development and production of, petroleum and natural gas with operations in Oklahoma. The Company also reviews new drilling opportunities and potential acquisitions in Oklahoma to supplement its exploration and development activities.
Production for the period ending March 31, 2013, averaged 6,280 boe/d and was comprised of approximately 48% natural gas, 49% NGLs and 3% crude oil. At March 31, 2013, the Company had 132 gross (106 net) producing wells, virtually all of which it operates, and approximately 80,948 gross (52,193 net) acres under lease or held by production.
Our Properties
The Company’s production comes from its Oklahoma based operations. The core area assets are located in Lincoln and Logan Counties of Oklahoma. The Corporation also has an inventory of minor producing assets, minor royalty interests and various exploration and exploitation prospects on undeveloped lands in Oklahoma.
17
Table of Contents
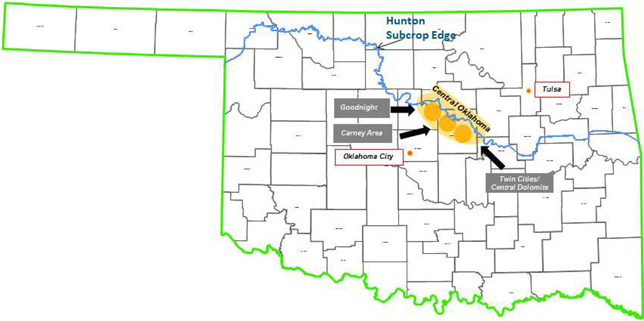
In Oklahoma, the key producing horizon is the Hunton formation. The Hunton is a carbonate rock formation which has been largely ignored by the industry in areas with high water/hydrocarbon production ratios. Over the last decade, new drilling and production techniques have enabled profitable development of the Hunton formation. Extensive dewatering lowers reservoir pressure allowing the liberation and mobilization of oil, natural gas and NGLs from smaller rock pores. Typical peak wellhead hydrocarbon production rates average 120 boe/d per horizontal well and are generally observed within six months of production commencement.
Average Hunton production for the period ended March 31, 2013, was 18,232 Mmcf/d of natural gas, 3,084 bbl/d of NGLs and 157 bbl/d of oil from a total of 106 net producing wells. At December 31, 2012, the Haas Report (third party petroleum engineers) has attributed total proved reserves of 268.0 Mbbl of crude oil, and 63.4 Bcf of natural gas and 8,894.0 mbbl of NGLs to the Company.
In Oklahoma, there are approximately 8,795 net undeveloped acres of land, at March 31, 2013, primarily located in Lincoln and Logan Counties.
Market Conditions
Prices of natural gas, NGLs, and oil that we produce can vary significantly which impacts our revenues and cash flows. The following table lists average New York Mercantile Exchange (“NYMEX”) prices for natural gas, West Texas Intermediate (“WTI”) prices for crude oil, and Propane, Conway, KS for NGLs for the three months ended March 31, 2013 and 2012.
| Three Months Ended March 31, |
||||||||
| 2013 | 2012 | |||||||
| Propane, Conway, KS (US$ per bbl) |
$ | 34.32 | $ | 43.30 | ||||
| NYMEX natural gas (US$ per mcf) (1) |
$ | 3.61 | 2.53 | |||||
| WTI (US$ per bbl) |
$ | 94.34 | 102.88 | |||||
Based on average monthly closing prices.
| (1) | Conversion rate of 1.0350 mmbtu per mcf. |
18
Table of Contents
Results of Operations for the three month periods ended March 31, 2013 and March 31, 2012
For the first quarter of 2013, Equal Energy’s production was from the central Oklahoma properties. In September 2012, the Company sold all of its Northern Oklahoma assets (K-9 properties). For comparability purposes, certain results of operations for the period ending March 31, 2012, are adjusted to reflect sales of these assets as if it had occurred at January 1, 2012.
The following table sets forth selected operating data for the periods indicated.
| Three Months Ended March 31, | ||||||||||||||||||||
| (in thousands, except for boe/d) | ||||||||||||||||||||
| Central Oklahoma | ||||||||||||||||||||
| Q1 2013 | Q1 2012 | Change | % Change | Q1 2012 as Reported | ||||||||||||||||
| Net Production per Day: |
||||||||||||||||||||
| Oil (Bbl) |
157 | 190 | (33 | ) | (17.2 | %) | 206 | |||||||||||||
| NGL (Bbl) |
3,084 | 2,847 | 237 | 8.3 | % | 3,112 | ||||||||||||||
| Natural Gas (Mcf) |
18,232 | 18,018 | 214 | 1.2 | % | 23,479 | ||||||||||||||
|
|
|
|
|
|
|
|
|
|
|
|||||||||||
| Total (Boe/d) |
6,280 | 6,040 | 240 | 4.0 | % | 7,231 | ||||||||||||||
| Net Production: |
||||||||||||||||||||
| Oil (mBbl) |
14 | 17 | (3 | ) | (18.1 | %) | 19 | |||||||||||||
| NGL (mBbl) |
278 | 259 | 18 | 7.1 | % | 283 | ||||||||||||||
| Natural Gas (mMcf) |
1,641 | 1,640 | 1 | 0.1 | % | 2,137 | ||||||||||||||
|
|
|
|
|
|
|
|
|
|
|
|||||||||||
| Total (mBoe) |
565 | 550 | 16 | 2.8 | % | 658 | ||||||||||||||
| Net Sales: |
||||||||||||||||||||
| Oil Sales |
$ | 1,305 | $ | 1,756 | $ | (450 | ) | (25.7 | %) | $ | 1,899 | |||||||||
| NGL Sales |
9,146 | 10,055 | (909 | ) | (9.0 | %) | 11,144 | |||||||||||||
| Natural Gas Sales |
4,354 | 3,536 | 817 | 23.1 | % | 4,733 | ||||||||||||||
|
|
|
|
|
|
|
|
|
|
|
|||||||||||
| $ | 14,805 | $ | 15,347 | $ | (542 | ) | (3.5 | %) | $ | 17,776 | ||||||||||
| Average Sales Prices: |
||||||||||||||||||||
| Oil (per Bbl) |
$ | 92.12 | $ | 101.43 | $ | (9.31 | ) | (9.2 | %) | $ | 101.45 | |||||||||
| Natural Gas (per Mcf) |
2.65 | 2.16 | 0.50 | 23.0 | % | 2.22 | ||||||||||||||
| NGL (per Bbl) |
32.95 | 38.81 | (5.86 | ) | (15.1 | %) | 39.35 | |||||||||||||
|
|
|
|
|
|
|
|
|
|
|
|||||||||||
| Boe |
26.19 | 27.92 | (1.73 | ) | (6.2 | %) | 27.01 | |||||||||||||
| Operating Expenses: |
||||||||||||||||||||
| Production Expenses |
$ | 3,455 | $ | 4,530 | $ | (1,075 | ) | (23.7 | %) | $ | 5,984 | |||||||||
| Production Taxes |
926 | 827 | 99 | 12.0 | % | 998 | ||||||||||||||
| Expenses (per Boe): |
||||||||||||||||||||
| Production Expenses |
$ | 6.11 | $ | 8.24 | $ | (2.13 | ) | (25.8 | %) | $ | 9.09 | |||||||||
| Production Taxes |
1.64 | 1.51 | 0.13 | 8.9 | % | 1.52 | ||||||||||||||
| Producing Wells at Period End |
132 | 129 | 3 | 2.3 | % | 149 | ||||||||||||||
19
Table of Contents
The following table sets forth selected operating data as reported for the periods indicated.
| Q1 2013 | Q1 2012 as reported |
Change | % Change | |||||||||||||
| Operating Expenses: | ||||||||||||||||
| General and Administrative Expense (Including Share Based Compensation) |
$ | 3,154 | $ | 2,293 | $ | 861 | 37.5 | % | ||||||||
| Interest |
$ | 949 | $ | 1,843 | $ | (894 | ) | (48.5 | %) | |||||||
| Depletion of Oil and Gas Properties |
$ | 4,793 | $ | 5,955 | $ | (1,162 | ) | (19.5 | %) | |||||||
| Costs and Expenses (per Boe): | ||||||||||||||||
| General and Administrative Expense (Including Share Based Compensation) |
$ | 5.58 | $ | 3.48 | $ | 2.10 | 60.1 | % | ||||||||
| Interest |
$ | 1.68 | $ | 2.80 | $ | (1.12 | ) | (40.1 | %) | |||||||
| Depletion of Oil and Gas Properties |
$ | 8.48 | $ | 9.05 | $ | (0.57 | ) | (6.3 | %) | |||||||
| Producing Wells at Period End |
132 | 149 | (17 | ) | (11.4 | %) | ||||||||||
Oil Sales
Oil revenue for Central Oklahoma properties decreased $0.5 million during the first quarter of 2013, as a result of 17% and 9% decrease in daily production and average prices, respectively. The decrease in production was primarily due to normal production decline. The price decrease is consistent with the decrease in NYMEX West Texas Intermediate index price. Actual oil sales, including K-9 properties, decreased $0.6 million from the first quarter of 2012, as a result of 24% and 9% decrease in daily production and average prices, respectively.
Gas Sales
Gas revenue for Central Oklahoma properties increased $0.8 million in the first quarter of 2013, primarily due to a 23% increase in average prices without hedges and a slight increase in daily production. Price increases are largely consistent with the broad improvement of gas prices in the North American market. Actual gas sales, including K-9 properties, decreased $0.4 million from the first quarter of 2012, as a result of 22% decrease in daily production, which was partially offset by a 20% increase in average price.
NGL Sales
NGL revenue for Central Oklahoma properties decreased $0.9 million in the first quarter of 2013, as a result of 15% decrease in our realized price, partially offset by an 8% increase in daily production. The lower prices were largely due to decreases in NGL prices at Conway, KS hub. The increase in NGL production is mainly due to the consistent trend of an increase in btu content of existing wells. Actual NGL sales, including K-9 properties, decreased $2 million from the first quarter of 2012, as a result of 1% and 16% decrease in daily production and average prices, respectively.
Production Expenses
Production expenses for Central Oklahoma properties were $3.5 million in the first quarter of 2013 compared to $4.5 million in the first quarter of 2012. On a per unit basis, production expenses per Boe decreased from $8.24 per Boe in the first quarter of 2012 to $6.11 in first quarter of 2013. This decrease was due to various factors such as purchasing sub-pumps, instead of renting them, and a decrease in repair costs. Actual production expenses, including K-9 properties, decreased $2.5 million from the first quarter of 2012, as a result of a 13% decrease in daily production.
20
Table of Contents
Production Taxes
We pay production taxes based on realized oil, NGL and natural gas sales. These costs for Oklahoma properties were $0.9 million in the first quarter of 2013 compared to $0.8 million in the first quarter of 2012. As a percent of sales, our production taxes were 6.3% and 5.4% in the first quarter of 2013 and 2012, respectively. The first quarter of 2013 average production tax rate was higher than the first quarter average of 2012 primarily due to 21 older horizontal wells coming off their 48 month six percent production tax incentive, and only three new horizontal wells drilled in 2012 qualified for this tax incentive. Actual production taxes, including K-9 properties, decreased $0.07 million from the first quarter of 2012, as a result of a 14% decrease in daily production, which was partially offset by the impact of the higher average production tax rate in 2013.
Commodity Contracts
For the first quarter of 2013, we incurred a gain on settled derivatives of $0.5 million, compared to $2 million gain for the first quarter of 2012, primarily due to higher average NYMEX prices in the first quarter of 2013 compared to the first quarter of 2012.
We had an unrealized loss on derivative instruments of $3.8 million in the first quarter of 2013 compared to a $1.2 million loss in the first quarter of 2012, primarily due to higher average NYMEX prices in the first quarter of 2013 compared to the first quarter of 2012. At March 31, 2013, all of our derivative contracts were recorded at their fair value, which was a net liability of $2.1 million, a decrease of $3.6 million from the $1.5 million net asset recorded as of December 31, 2012.
General and Administrative Expense
General and administrative expense was $3.2 million for the first quarter of 2013 compared to $2.3 million for the first quarter of 2012. The first quarter of 2013 increase of $0.9 million when compared to first quarter of 2012 was primarily due to higher base salaries, bonuses and benefits ($0.4 million) and higher legal and professional expenses ($.5 million). As a result of relocation of our corporate headquarter to the US, we increased staffing in the finance, and geology departments.
Depletion of Oil and Gas Properties
Depletion was $4.8 million, or $8.48 per Boe, in the first quarter of 2013 compared to $6.0 million or $ 9.05 per Boe in the first quarter of 2012. The aggregate decrease in depletion expense for first quarter of 2013 compared to the first quarter of 2012 was due to the sale of K-9 properties that were included in the depletion calculation for the period ending March 31, 2012, and a decrease in our future development and operating cost estimates to reflect the cost incurred and K-9 sale.
Interest Expense
Interest expense was $1 million in the first quarter of 2013 compared to $1.8 million in the first quarter of 2012. The decrease of $0.8 million in interest expense primarily relates to decrease in average debt outstanding.
Income Tax Provision
The provision for income tax benefit was $.8 million in the first quarter of 2013 compared to income tax expense of $.9 million in the first quarter of 2012. The effective tax rate differs from the statutory rate of 35% due to permanent differences and state taxes.
NON-GAAP FINANCIAL MEASURES
Management uses certain key performance indicators (“KPIs”) and industry benchmarks such as cash flow netback, funds from operations and working capital including long-term debt to analyze financial performance. Management feels that these KPIs and benchmarks are key measures of profitability and overall sustainability for Equal. These KPIs and benchmarks as presented do not have any standardized meanings prescribed by U.S. GAAP and therefore may not be comparable with the calculation of similar measures presented by other entities.
21
Table of Contents
We believe the use of these non-GAAP financial measures provides useful information to investors to gain an overall understanding of our current financial performance. Specifically, we believe the non-GAAP financial measures included herein provide useful information to both management and investors by excluding certain expenses and unrealized commodity gains and losses that our management believes are not indicative of our core operating results. In addition, these non-GAAP financial measures are used by management for budgeting and forecasting as well as subsequently measuring our performance, and we believe that we are providing investors with financial measures that most closely align to our internal measurement processes. We consider these non-GAAP measures to be useful in evaluating our core operating results as they more closely reflect our essential revenue generating activities. Our management also believes, based on feedback provided by the investment community, that the non-GAAP financial measures are necessary to allow the investment community to construct its valuation models to better compare our results with our competitors and market sector.
The non-GAAP financial information is presented using consistent methodology from year to year. These measures should be considered in addition to results prepared in accordance with GAAP. In addition, these non-GAAP financial measures are not based on any comprehensive set of accounting rules or principles. We believe that non-GAAP financial measures have limitations in that they do not reflect all of the amounts associated with our results of operations as determined in accordance with GAAP and that these measures should only be used to evaluate our results of operations in conjunction with the corresponding GAAP financial measures.
Reconciliation of adjusted earnings:
Management believes adjusted earnings may be useful to certain investors and analysts who adjust reported earnings for items that obscure underlying funadamentals of the Company. Adjusted earnings exclude certain items that management believes affect the comparability of operating results.
| For the Quarter Ended March 31, |
||||||||
| 2013 | 2012 | |||||||
| Net Income |
$ | 1,532 | $ | 3,952 | ||||
| Adjustments: |
||||||||
| Unrealized loss on commodity contracts |
2,329 | 730 | ||||||
| Gain on sale of assets |
(28 | ) | — | |||||
| Unrealized gain on foreign exchange |
(601 | ) | (1,619 | ) | ||||
| Discontinued operations |
(1,762 | ) | (878 | ) | ||||
|
|
|
|
|
|||||
| Adjusted Earnings (Non-GAAP) |
$ | 1,470 | $ | 2,185 | ||||
|
|
|
|
|
|||||
| Net Income per Common Share - Diluted (GAAP) |
$ | 0.04 | $ | 0.11 | ||||
| Adjustments: |
||||||||
| Unrealized loss on commodity contracts |
0.06 | 0.02 | ||||||
| Gain on sale of assets |
— | — | ||||||
| Unrealized gain on foreign exchange |
(0.01 | ) | (0.05 | ) | ||||
| Discontinued operations |
(0.05 | ) | (0.02 | ) | ||||
|
|
|
|
|
|||||
| Adjusted Earnings Per Share - Diluted (Non-GAAP) |
$ | 0.04 | $ | 0.06 | ||||
|
|
|
|
|
|||||
22
Table of Contents
LIQUIDITY & CAPITAL RESOURCES
Development activities and acquisitions may be funded internally through cash flow or through external sources such as debt or the issuance of equity. The Company finances its operations and capital activities primarily with funds generated from operating activities, but also through the issuance of shares, debentures and borrowing from its credit facility. The Company believes its sources of cash, including bank debt and funds from operations, will be sufficient to fund its operations and anticipated capital expenditure program in 2013. Equal’s ability to fund its operations will also depend on operating performance and is subject to commodity prices and other economic conditions which may be beyond its control. The Company will monitor commodity prices and adjust the 2013 capital expenditure program to stay within its means. The Company operates all of its drilling programs and as a result, can control the pace and targets of its capital spending to react quickly to changes in cash flow to ensure ongoing financial flexibility.
Equal’s capital structure at March 31, 2013, is as follows:
| Capitalization (in thousands of dollars, except percentages) |
March 31, 2013 | |||||||
| Amount | % | |||||||
| Working capital surplus (1) |
$ | 24,418 | 12 | % | ||||
| Convertible debentures |
44,294 | 22 | % | |||||
| Shares issued, at market (2) |
135,497 | 66 | % | |||||
|
|
|
|
|
|||||
| Total capitalization |
$ | 204,209 | 100 | % | ||||
|
|
|
|
|
|||||
| (1) | See working capital discussion below |
| (2) | The market price of Equal’s shares on March 31, 2013 was $3.81 per share. |
| 2013 | 2012 | |||||||
| Cash provided by operating activities – continuing operations |
$ | 10,328 | $ | 13,940 | ||||
| Cash used in operating activities – discontinued operations |
(2,716 | ) | (1,219 | ) | ||||
|
|
|
|
|
|||||
| Cash provided by operating activities |
$ | 7,612 | $ | 12,721 | ||||
|
|
|
|
|
|||||
| Cash used in investing activities – continuing operations |
$ | (7,363 | ) | $ | (9,240 | ) | ||
| Cash provided by investing activities – discontinued operations |
— | 7,402 | ||||||
|
|
|
|
|
|||||
| Cash used in investing activities |
$ | (7,363 | ) | $ | (1,838 | ) | ||
|
|
|
|
|
|||||
| Cash used in financing activities |
$ | (1,805 | ) | $ | (13,000 | ) | ||
|
|
|
|
|
|||||
At March 31, 2013, cash provided by continuing operating activities has decreased to $10.3 million from $13.9 million for the period ended March 31, 2012, primarily due to lower income from continuing operations, mainly driven by lower NGL prices. Cash used in investing activities was $7.4 million for March 31, 2013 compared to $9.2 million at March 31, 2012, primarily due to decrease in numbers of wells drilled in first quarter of 2013 compared to the first quarter of 2012. At March 31, 2013, the cash used in financing activities was $1.8 million due to the payment of dividends compared to cash used in financing activities of $13 million at March 31, 2012, due to payments on the bank credit facility.
Long-term Debt
Other than the convertible debentures, at March 31, 2013, Equal did not have any outstanding long-term debt. The Company‘s syndicated bank credit facility was CAD $125.0 million and is comprised of a CAD $105.0 million revolving credit facility and a CAD $20.0 million operating credit facility which is secured against the borrowing base of the Oklahoma assets and can be borrowed against in either USD or CAD.
Working Capital
The adjusted working capital and net debt, debt less adjusted working capital, was $24.4 million and $19.9 million at March 31, 2013, respectively, and $31.0 million and $14.3 million at December 31, 2012, respectively. This decrease in adjusted working capital was primarily due to discontinued operations and commodity contracts.
23
Table of Contents
| Working Capital (in thousands of dollars) |
March 31, 2013 | December 31, 2012 | ||||||
| Current assets |
(37,812 | ) | (43,252 | ) | ||||
| Current liabilities |
15,219 | 14,514 | ||||||
| Current (asset)/liability related to commodity contracts |
(1,825 | ) | 1,453 | |||||
| Discontinued operations |
— | (3,691 | ) | |||||
|
|
|
|
|
|||||
| Adjusted working capital |
(24,418 | ) | (30,976 | ) | ||||
| Convertible debentures |
44,294 | 45,230 | ||||||
|
|
|
|
|
|||||
| Net debt (debt less adjusted working capital) |
19,876 | 14,254 | ||||||
|
|
|
|
|
|||||
Convertible Debentures
As at March 31, 2013 and 2012, Equal had CAD $45.0 million of 6.75% convertible debentures (EQU.DB.B) outstanding. The 6.75% convertible debentures have the conversion price of CAD $8.85 per share. Each CAD $1,000 principal amount of EQU.DB.B debentures is convertible into approximately 5.1 million Equal shares and mature on March 31, 2016.
Equity Information
Equal is capitalized through a combination of shares and convertible debt. Equal also has a share option plan and restricted share plan. The following table outlines the outstanding equity instruments:
| Outstanding Equity Data as at (in thousands of dollars) |
March 13, 2013 | December 31, 2012 | ||||||
| Shares |
35,563 | 35,227 | ||||||
| Share options |
594 | 735 | ||||||
| Restricted shares |
1,272 | 1,221 | ||||||
| 6.75% convertible debentures ($1,000 per debenture) CAD |
45,000 | 45,000 | ||||||
OUTLOOK
For the remainder of 2013, the Company plans to maintain a balanced and prudent approach by:
| • | Maintaining Equal’s strong balance sheet (net debt to cash flow less than 1:1) and protecting the dividend |
| • | Staying focused on cost management and efficient execution of the drilling program |
| • | Evaluating drilling plan at mid-year to ensure optimal allocation of capital |
| • | Management estimates six wells will replace produced reserves, eight wells will keep production flat and 10 wells will result in an approximate 4% rate of production growth |
| • | Initial results of first three wells are encouraging and indicate 25% to 35% rates of return, based on May 2, 2013 strip commodity prices |
| • | Testing one or two oil play concepts on our held by production acreage |
| • | Increasing the acreage acquisition program in our Central Oklahoma area of focus |
Commitments and Contingencies
For a discussion of our commitments and contingencies, please refer to Note 13— Contingencies under item 1 in this Quarterly Report, which is incorporated herein by reference.
Off Balance Sheet Arrangements
The Company did not have any off balance sheet arrangements, as such term is defined in Item 303(a)(4)(ii) of Regulation S-K, at March 31, 2013 and December 31, 2012.
24
Table of Contents
Critical Accounting Policies and Estimates
The preparation of financial statements in accordance with generally accepted accounting principles requires management to make estimates and judgments that affect the reported amounts of assets, liabilities, revenues and expenses. Certain of the Company’s accounting policies are considered critical, as these policies are the most important to the depiction of the Company’s financial statements and require significant, difficult or complex judgments, often employing the use of estimates about the effects of matters that are inherently uncertain. A summary of the Company’s significant accounting policies is included in Note 2 to the Company’s consolidated financial statements included in our annual report on Form 10-K for the year ended December 31, 2012, as well as in the Management’s Discussion and Analysis of Financial Condition and Results of Operations section in such Form 10-K, which summary is qualified by the updates set forth below. The updated disclosures set forth below have been included solely to clarify our actual treatment with respect to the applicable topics and do not reflect any change in accounting treatment relating thereto.
Impairment of Oil and Gas Properties
Under the full cost method of accounting, capitalized oil and gas property costs less accumulated depletion and net of deferred income taxes may not exceed an amount equal to the present value, discounted at 10%, of estimated future net revenues from proved oil and gas reserves plus the cost of unproved properties not subject to amortization (without regard to estimates of fair value), or estimated fair value, if lower, of unproved properties that are subject to amortization. Should capitalized costs exceed this ceiling, an impairment is recognized. If natural gas or NGL prices decrease from levels used in our reserve report at March 31, 2013, we may incur full-cost ceiling write-downs, or additional DD&A, related to our oil and gas properties in future periods.
Wells in Progress
Wells in progress represent the costs associated with wells that have not reached total depth or been completed as of period end. These costs are related to wells that are classified as both proved and unproved. Costs related to wells that are classified as proved are included in the depletion base. Costs associated with wells that are classified as unproved are excluded from the depletion base. The costs for unproved wells are then transferred to proved property when proved reserves are determined. The costs then become subject to depletion.
ITEM 3. QUANTITATIVE AND QUALITATIVE DISCLOSURES ABOUT MARKET RISK
Commodity Price Risk
Our primary market risk is the volatility of oil, NGL and natural gas prices. The market prices for oil, NGL and natural gas have been highly volatile and are likely to continue to be highly volatile in the future, which will impact our prospective revenues from the sale of products or properties. We manage this commodity price risk exposure through the use of derivative financial instruments entered into with third-party counterparties. Currently, we utilize swaps to reduce the effect of price changes on a portion of our future oil production. We do not enter into derivative instruments for trading purposes.
Equal’s most significant market risk relates to the prices it receives for its natural gas and NGL production. Oil represents only 2% of total production so volatility of oil prices has a small effect. Due to the historical price volatility of these commodities, Equal periodically has entered into natural gas and oil derivative arrangements, and expects in the future to enter into, derivative arrangements for the purpose of reducing the variability of natural gas and NGL prices Equal receives for its production. The Company’s credit facility limits its ability to enter into derivative transactions for a maximum term of 3 years and up to 65% of expected production volumes.
25
Table of Contents
The Company uses, and may continue to use, a variety of commodity-based derivative contracts, including fixed price swaps, collars and basis swaps. At March 31, 2013, the Company’s commodity derivative contracts consisted of fixed price swaps and basis swaps for natural gas and a fixed price swap for oil, which are described below:
| Fixed price swaps | The Company receives a fixed price for the contract and pays a floating market price to the counterparty over a specified period for a contracted volume. | |
| Basis swaps | The Company receives a payment from the counterparty if the settled price differential is greater than the stated terms of the contract and pays the counterparty if the settled price differential is less than the stated terms of the contract, which guarantees the Company a price differential for oil and natural gas from a specified delivery point. | |
The Company’s natural gas fixed price swap transactions are settled based upon NYMEX prices, and the Company’s natural gas basis swap transactions are settled based upon the index price of natural gas at the Southern Star pipeline delivery point in Oklahoma compared to NYMEX prices. The Company’s natural gas contracts are settled based upon the NYMEX prices on the penultimate commodity business day for the relevant contract. Settlement for oil derivative contracts occurs in the succeeding month or quarter and natural gas derivative contracts are settled in the production month or quarter.
The Company records all derivative contracts at fair value, which reflects changes in commodity prices. Changes in fair values of the Company’s derivative contracts are recognized as unrealized gains and losses in current period earnings. As a result, the Company’s current period earnings may be significantly affected by changes in the fair value of its commodity derivative contracts. Changes in fair value are principally measured based on period-end prices compared to the contract price. For further details regarding our derivative contracts please refer to Note 9 —Commodity Contracts under Item 1 in this Quarterly Report.
In addition to the derivative contracts disclosed in Note 9, the following are contracts entered into subsequent to March 31, 2013.
| Derivative Instrument |
Commodity | Price (1) |
Volume per day (1) | Period | ||||
| Fixed |
Gas | 4.34 (US$/mmbtu) | 2,000 mmbtu | January 1, 2014 – | ||||
| (4.49 US$/mcf) | (1,932 mcf) | December 31, 2014 | ||||||
| Fixed |
Natural Gasoline |
84.00 (US$/bbl) | 200 bbl | May 1, 2013 – | ||||
| December 31, 2013 |
| (1) | Conversion rate of 1.0350 mmbtu per mcf |
The following sensitivities show the result to pre-tax net income for three months ended March 31, 2013 related to commodity contracts of the respective changes in crude oil, natural gas and fixed basis differential.
|
Increase (decrease) to pre-tax net income | ||||
| (in thousands of dollars) |
Decrease in market price ($1.00 per bbl and $0.50 per mcf) |
Increase in market price ($1.00 per bbl and $0.50 per mcf) | ||
| Crude oil derivative contracts |
73 | (73) | ||
| Natural gas derivative contracts |
7,132 | (7,132) | ||
| Decrease in differential price ($0.02 per mcf) |
Increase in differential price ($0.02 per mcf) | |||
| Fixed basis differential contracts |
(88) | 88 | ||
Credit Risk
All of the Company’s hedging transactions have been carried out in the over-the-counter market. The use of hedging transactions in over-the-counter markets involves the risk that the counterparties may be unable to meet the financial terms of the transactions. The counterparties for all of the Company’s hedging transactions have an “investment grade” credit rating. The Company monitors on an ongoing basis the credit ratings of its hedging counterparties. The Company’s derivative contracts are primarily with its lead bank for its credit facility.
26
Table of Contents
A default by the Company under its credit facility constitutes a default under its derivative contracts with counterparties that are lenders under the senior credit facility. The Company does not require collateral or other security from counterparties to support derivative instruments. The Company has master netting agreements with all of its derivative contract counterparties, which allows the Company to net its derivative assets and liabilities with the same counterparty. As a result of the netting provisions, the Company’s maximum amount of loss under derivative transactions due to credit risk is limited to the net amounts due from the counterparties under the derivatives. The Company’s loss is further limited as any amounts due from a defaulting counterparty that is a lender under the senior credit facility can be offset against amounts owed to such counterparty under the Company’s senior credit facility. As of March 31, 2013, the counterparties to the Company’s open derivative contracts consisted of 3 financial institutions, 2 of which are also lenders under the Company’s senior credit facility. The Company is not required to post additional collateral under derivative contracts.
Interest Rate Risk
The Company is subject to interest rate risk on its long-term fixed and variable interest rate borrowings. Fixed rate debt, where the interest rate is fixed over the life of the instrument, exposes the Company to (i) changes in market interest rates reflected in the fair value of the debt and (ii) the risk that the Company may need to refinance maturing debt with new debt at a higher rate. Variable rate debt, where the interest rate fluctuates, exposes the Company to short-term changes in market interest rates as its interest obligations on these instruments are periodically redetermined based on prevailing market interest rates, primarily the LIBOR rate. The Company had no outstanding variable rate debt as of March 31, 2013. Equal has no interest rate derivative contracts outstanding at March 31, 2013.
ITEM 4. CONTROLS AND PROCEDURES
Disclosure Controls and Procedures
The Company maintains a set of disclosure controls and procedures designed to ensure that information required to be disclosed by the Company in reports that it files or submits under the Securities Exchange Act of 1934 (the “Exchange Act”) is recorded, processed, summarized and reported within the time periods specified in SEC rules and forms. The disclosure controls and procedures are also designed with the objective of ensuring such information is accumulated and communicated to the Company’s management, including the Chief Executive Officer (“CEO”) and Chief Financial Officer (“CFO”), as appropriate, to allow timely decisions regarding required disclosures. In designing and evaluating the disclosure controls and procedures, management recognized that disclosure controls and procedures, no matter how well conceived and operated, can provide only reasonable, not absolute, assurance that the objectives of the disclosure controls and procedures are met. Additionally, in designing the disclosure controls and procedures, the Company’s management was required to apply its judgment in evaluating the cost-benefit relationship of possible disclosure controls and procedures.
As required by SEC Rule 13a-15(b), the Company carried out an evaluation, under the supervision and with the participation of the Company’s management, including the CEO and CFO, of the effectiveness of the design and operation of the Company’s disclosure controls and procedures as of the end of the quarter covered by this report. Based on that evaluation, the CEO and CFO have concluded that the Company’s disclosure controls and procedures are effective at the reasonable assurance level as of the end of the quarter covered by this report.
Changes in Internal Control Over Financial Reporting
There has been no change in the Company’s internal control over financial reporting as defined in Rules 13a–15(f) and 15d–15(f) under the Exchange Act, identified in connection with the evaluation of the Company’s internal control performed during the fiscal quarter ended September 30, 2012, that has materially affected, or is reasonably likely to materially affect, the Company’s internal control over financial reporting.
27
Table of Contents
From time to time, the Company is a party to routine litigation and proceedings that are considered part of the ordinary course of its business. The Company is not aware of any material current, pending, or threatened litigation.
For a detailed description of certain legal proceedings, see Part I, Item 3 – Legal Proceedings in the Company’s Annual Report on Form 10-K for the year ended December 31, 2012.
There have been no material changes to the risk factors set forth in our Annual Report on Form 10-K for the year ended December 31, 2012, as filed with the SEC on March 14, 2013. The risk factors in our Annual Report on Form 10-K for the year ended December 31, 2012, in addition to the other information set forth in this quarterly report, could materially affect our business, financial condition or results of operations. Additional risks and uncertainties not currently known to us or that we deem to be immaterial could also materially adversely affect our business, financial condition or results of operations.
ITEM 2. UNREGISTERED SALES OF EQUITY SECURITIES AND USE OF PROCEEDS
None.
ITEM 3. DEFAULTS UPON SENIOR SECURITIES
None.
ITEM 4. MINE SAFETY DISCLOSURES
None.
None.
28
Table of Contents
| Exhibit Number |
Description | |||
| 31.1 | Certification of the Principal Executive Officer pursuant to §302 of the Sarbanes-Oxley Act of 2002 | |||
| 31.2 | Certification of the Principal Financial Officer pursuant to §302 of the Sarbanes-Oxley Act of 2002 | |||
| 32.1 | Certification of the Principal Executive Officer pursuant to 18 U.S.C. Section 1350 | |||
| 32.2 | Certification of the Principal Financial Officer pursuant to 18 U.S.C. Section 1350 | |||
| 101 | The following materials are filed herewith: (i) XBRL Instance, (ii) XBRL Taxonomy Extension Schema, (iii) XBRL Taxonomy Extension Calculation, (iv) XBRL Taxonomy Extension Labels, (v) XBRL Taxonomy Extension Presentation, and (vi) XBRL Taxonomy Extension Definition. In accordance with Rule 406T of Regulation S-T, the information in these exhibits is furnished and deemed not filed or a part of a registration statement or prospectus for purposes of Sections 11 or 12 of the Securities Act of 1933, is deemed not filed for purposes of section 18 of the Exchange Act of 1934, and otherwise is not subject to liability under these sections and shall not be incorporated by reference into any registration statement or other document filed under the Securities Act of 1933, as amended, except as expressly set forth by the specific reference in such filing. | |||
29
Table of Contents
Pursuant to the requirements of the Securities Exchange Act of 1934, the registrant has duly caused this report to be signed on its behalf by the undersigned thereunto duly authorized.
| EQUAL ENERGY LTD. | ||||||
| May 9, 2013 | By: | /s/ DON KLAPKO | ||||
| Don Klapko President and Chief Executive Officer | ||||||
| May 9, 2013 | By: | /s/ WENDELL CHAPMAN | ||||
| Wendell Chapman Senior Vice President, Finance | ||||||
30