Attached files
| file | filename |
|---|---|
| EXCEL - IDEA: XBRL DOCUMENT - EQUAL ENERGY LTD. | Financial_Report.xls |
| EX-32.1 - EX-32.1 - EQUAL ENERGY LTD. | d733918dex321.htm |
| EX-32.2 - EX-32.2 - EQUAL ENERGY LTD. | d733918dex322.htm |
| EX-31.2 - EX-31.2 - EQUAL ENERGY LTD. | d733918dex312.htm |
| EX-31.1 - EX-31.1 - EQUAL ENERGY LTD. | d733918dex311.htm |
Table of Contents
UNITED STATES
SECURITIES AND EXCHANGE COMMISSION
Washington, D.C. 20549
Form 10-Q
(Mark One)
| x | QUARTERLY REPORT UNDER SECTION 13 OR 15(d) OF THE SECURITIES EXCHANGE ACT OF 1934 |
For the quarterly period ended June 30, 2014
or
| ¨ | TRANSITION REPORT PURSUANT TO SECTION 13 OR 15(d) OF THE SECURITIES EXCHANGE ACT OF 1934 |
Commission File Number 001-34759
EQUAL ENERGY LTD.
(Exact name of registrant as specified in its charter)
| Alberta, Canada | 98-0533758 | |
| (State of other jurisdiction of incorporation or organization) |
(I.R.S. Employer identification No.) |
| 4801 Gaillardia Pkwy, Suite 325 Oklahoma City, OK |
73142 | |
| (Address of principal executive offices) | (Zip code) |
Registrant’s telephone number, including area code:
(405) 242-6000
Indicate by check mark whether the registrant (1) has filed all reports required to be filed by Section 13 or 15(d) of the Securities Exchange Act of 1934 during the preceding 12 months (or for such shorter period that the registrant was required to file such reports), and (2) has been subject to such filing requirements for the past 90 days. Yes x No ¨
Indicate by check mark whether the registrant has submitted electronically and posted on its corporate Web site, if any, every Interactive Data File required to be submitted and posted pursuant to Rule 405 of Regulation S-T during the preceding 12 months (or for such shorter period that the registrant was required to submit and post such files). Yes x No ¨
Indicate by check mark whether the registrant is a large accelerated filer, an accelerated filer, a non-accelerated filer, or a smaller reporting company. See the definitions of “large accelerated filer,” “accelerated filer” and “smaller reporting company” in Rule 12b-2 of the Exchange Act. (Check one):
| Large accelerated filer | ¨ | Accelerated filer | x | |||||
| Non-accelerated filer | ¨ | (Do not check if a smaller reporting company) | Smaller reporting company | ¨ | ||||
Indicate by check mark whether the registrant is a shell company (as defined in Rule 12b-2 of the Exchange Act). Yes ¨ No x
As of July 31, 2014, prior to being acquired by Petroflow Energy Corporation, there were 36,775,467 shares of our common stock, par value $0.01, outstanding. As further described in Note 13, Subsequent Events, on July 31, 2014, the Company was acquired by and became a wholly owned subsidiary of Petroflow Energy Corporation. See Note 13, Subsequent Events, for further discussion.
Table of Contents
EQUAL ENERGY LTD.
| Part I Financial Information |
||||
| Item 1. Consolidated Financial Statements |
||||
| 3 | ||||
| 4 | ||||
| 5 | ||||
| 6 | ||||
| 7 | ||||
| Item 2. Management’s Discussion and Analysis of Financial Condition and Results of Operations |
16 | |||
| Item 3. Quantitative and Qualitative Disclosures About Market Risk |
27 | |||
| 28 | ||||
| 29 | ||||
| 29 | ||||
| Item 2. Unregistered Sales of Equity Securities and Use of Proceeds |
37 | |||
| 38 | ||||
| 38 | ||||
| 38 | ||||
| 38 | ||||
| 39 | ||||
Page 1 of 39
Table of Contents
EQUAL ENERGY LTD.
GLOSSARY
| Oil and Natural Gas Liquids | Natural Gas | |||||
| NGLs | natural gas liquids | mcf | thousand cubic feet of natural gas | |||
| bbls | barrels | MMcf | million cubic feet of natural gas | |||
| Mbbl | thousand barrels | Bcf | Billion cubic feet of natural gas | |||
| MMbbl | millions of barrels of oil | mcf/d | thousand cubic feet of natural gas per day | |||
| bbls/d | barrels per day | MMcf/d | million cubic feet of natural gas per day | |||
| mmbtu | millions of British Thermal Units | |||||
| Oil Equivalents (6 mcf:1 boe) | ||||||
| boe |
barrels of oil equivalent | |||||
| Mboe |
thousands of barrels of oil equivalent | |||||
| MMboe |
millions of barrels of oil equivalent | |||||
| boe/d |
barrels of oil equivalent per day | |||||
| Mboe/d |
thousands of barrels of oil equivalent per day | |||||
In this Form 10-Q, all currency amounts are in United States dollars unless otherwise indicated. References to “CAD $” refer to Canadian dollars.
Page 2 of 39
Table of Contents
EQUAL ENERGY LTD.
| (unaudited) ( in thousands) |
June 30, 2014 | December 31, 2013 | ||||||
| Assets |
||||||||
| Current assets |
||||||||
| Cash and cash equivalents |
$ | 25,583 | $ | 15,631 | ||||
| Accounts receivable, net |
12,715 | 13,581 | ||||||
| Prepaid expenses, deposits and other |
488 | 1,051 | ||||||
|
|
|
|
|
|||||
| Total current assets |
38,786 | 30,263 | ||||||
| Oil and natural gas properties, full cost method of accounting: |
||||||||
| Proved, net of accumulated depletion of $252 million and $243 million, respectively |
160,565 | 162,061 | ||||||
| Unproved |
4,364 | 4,014 | ||||||
|
|
|
|
|
|||||
| Total oil and natural gas properties |
164,929 | 166,075 | ||||||
| Other capital assets, net of accumulated depreciation of $0.9 million and $0.8 million, respectively |
437 | 152 | ||||||
|
|
|
|
|
|||||
| Total property, plant and equipment, net |
165,366 | 166,227 | ||||||
| Other assets |
772 | 989 | ||||||
| Deferred income tax asset |
27,575 | 30,906 | ||||||
|
|
|
|
|
|||||
| Total assets |
$ | 232,499 | $ | 228,385 | ||||
|
|
|
|
|
|||||
| Liabilities |
||||||||
| Current liabilities |
||||||||
| Accounts payable and accrued liabilities |
$ | 13,253 | $ | 17,134 | ||||
| Asset retirement obligation |
290 | 278 | ||||||
| Commodity contracts |
1,094 | 341 | ||||||
|
|
|
|
|
|||||
| Total current liabilities |
14,637 | 17,753 | ||||||
| Convertible debentures |
42,174 | 42,309 | ||||||
| Asset retirement obligation |
4,526 | 4,362 | ||||||
|
|
|
|
|
|||||
| Total liabilities |
61,337 | 64,424 | ||||||
|
|
|
|
|
|||||
| Shareholders’ Equity |
||||||||
| Common shares, $0.01 par value unlimited authorized shares, and 36,095,117 and 35,806,337 shares issued and outstanding, respectively |
361 | 358 | ||||||
| Additional paid-in capital |
231,119 | 230,574 | ||||||
| Accumulated other comprehensive loss |
(102,102 | ) | (102,102 | ) | ||||
| Retained earnings |
41,784 | 35,131 | ||||||
|
|
|
|
|
|||||
| Total shareholders’ equity |
171,162 | 163,961 | ||||||
|
|
|
|
|
|||||
| Total liabilities and shareholders’ equity |
$ | 232,499 | $ | 228,385 | ||||
|
|
|
|
|
|||||
See accompanying notes to the unaudited consolidated financial statements.
Page 3 of 39
Table of Contents
EQUAL ENERGY LTD.
CONSOLIDATED STATEMENTS OF INCOME and COMPREHENSIVE INCOME
| (unaudited) (in thousands, except per share data) |
Three months ended June 30, |
Six months ended June 30, |
||||||||||||||
| 2014 | 2013 | 2014 | 2013 | |||||||||||||
| Revenues |
||||||||||||||||
| NGL, natural gas and oil revenues |
$ | 20,061 | $ | 14,748 | $ | 42,207 | $ | 29,553 | ||||||||
| (Loss) gain on commodity contracts |
(510 | ) | 3,491 | (2,572 | ) | 220 | ||||||||||
|
|
|
|
|
|
|
|
|
|||||||||
| Total revenues |
19,551 | 18,239 | 39,635 | 29,773 | ||||||||||||
| Expenses |
||||||||||||||||
| Production |
4,205 | 3,529 | 8,266 | 6,984 | ||||||||||||
| Production taxes |
683 | 923 | 1,436 | 1,849 | ||||||||||||
| General and administrative including share-based compensation |
3,242 | 3,857 | 6,554 | 7,010 | ||||||||||||
| Interest expense |
865 | 926 | 1,744 | 1,875 | ||||||||||||
| Depletion and depreciation |
4,663 | 4,160 | 9,181 | 9,027 | ||||||||||||
| Amortization of deferred charges |
111 | 110 | 221 | 221 | ||||||||||||
| Accretion of asset retirement obligation |
95 | 99 | 190 | 200 | ||||||||||||
| Gain on sale of assets |
0 | (90 | ) | (23 | ) | (118 | ) | |||||||||
| Foreign exchange loss (gain) |
1,444 | (1,510 | ) | (83 | ) | (2,480 | ) | |||||||||
|
|
|
|
|
|
|
|
|
|||||||||
| 15,308 | 12,004 | 27,486 | 24,568 | |||||||||||||
|
|
|
|
|
|
|
|
|
|||||||||
| Income from continuing operations before taxes |
4,243 | 6,235 | 12,149 | 5,205 | ||||||||||||
| Taxes |
||||||||||||||||
| Current tax benefit (expense) |
52 | 0 | (11 | ) | 0 | |||||||||||
| Deferred tax expense |
(1,575 | ) | (1,450 | ) | (3,331 | ) | (650 | ) | ||||||||
|
|
|
|
|
|
|
|
|
|||||||||
| Income from continuing operations |
2,720 | 4,785 | 8,807 | 4,555 | ||||||||||||
| Discontinued operations: |
||||||||||||||||
| Income (loss) from discontinued operations |
41 | (39 | ) | (287 | ) | 1,722 | ||||||||||
|
|
|
|
|
|
|
|
|
|||||||||
| Net income |
$ | 2,761 | 4,746 | $ | 8,520 | $ | 6,277 | |||||||||
| Other comprehensive income |
||||||||||||||||
| Foreign currency translation adjustment |
0 | 0 | 0 | 61 | ||||||||||||
|
|
|
|
|
|
|
|
|
|||||||||
| Comprehensive income |
$ | 2,761 | $ | 4,746 | $ | 8,520 | $ | 6,338 | ||||||||
|
|
|
|
|
|
|
|
|
|||||||||
| Earnings per share information: |
||||||||||||||||
| Basic earnings per share from continuing operations |
$ | 0.08 | $ | 0.13 | $ | 0.24 | $ | 0.13 | ||||||||
| Basic earnings (loss) per share from discontinued operations |
$ | 0.00 | $ | 0.00 | $ | (0.01 | ) | $ | 0.05 | |||||||
|
|
|
|
|
|
|
|
|
|||||||||
| Basic earnings per share |
$ | 0.08 | $ | 0.13 | $ | 0.23 | $ | 0.18 | ||||||||
| Diluted earnings per share from continuing operations |
$ | 0.07 | $ | 0.13 | $ | 0.23 | $ | 0.12 | ||||||||
| Diluted earnings (loss) per share from discontinued operations |
$ | 0.00 | $ | 0.00 | $ | (0.01 | ) | $ | 0.05 | |||||||
|
|
|
|
|
|
|
|
|
|||||||||
| Diluted earnings per share |
$ | 0.07 | $ | 0.13 | $ | 0.22 | $ | 0.17 | ||||||||
See accompanying notes to the unaudited consolidated financial statements.
Page 4 of 39
Table of Contents
EQUAL ENERGY LTD.
CONSOLIDATED STATEMENTS OF CHANGES IN SHAREHOLDERS’ EQUITY
|
Common Stock |
Additional Paid-In Capital |
Retained Earnings |
Accumulated Other Comprehensive Loss |
Total Stockholders’ Equity |
||||||||||||||||||||
| (unaudited) ( in thousands) | Shares | Amount | ||||||||||||||||||||||
| Balances at December 31, 2013 |
35,806 | $ | 358 | $ | 230,574 | $ | 35,131 | $ | (102,102 | ) | $ | 163,961 | ||||||||||||
| Issue of common shares under restricted share plan |
277 | 3 | (3 | ) | — | — | — | |||||||||||||||||
| Share-based compensation |
— | — | 486 | — | — | 486 | ||||||||||||||||||
| Cash Dividends |
— | — | — | (1,805 | ) | — | (1,805 | ) | ||||||||||||||||
| Stock Dividends |
12 | — | 62 | (62 | ) | — | — | |||||||||||||||||
| Income and comprehensive income for the period |
— | — | — | 8,520 | — | 8,520 | ||||||||||||||||||
|
|
|
|
|
|
|
|
|
|
|
|
|
|||||||||||||
| Balances at June 30, 2014 |
36,095 | $ | 361 | $ | 231,119 | $ | 41,784 | $ | (102,102 | ) | $ | 171,162 | ||||||||||||
|
|
|
|
|
|
|
|
|
|
|
|
|
|||||||||||||
See accompanying notes to the unaudited consolidated financial statements.
Page 5 of 39
Table of Contents
EQUAL ENERGY LTD.
CONSOLIDATED STATEMENTS OF CASH FLOWS
| Six months ended June 30, |
||||||||
| (unaudited) (in thousands) |
2014 | 2013 | ||||||
| Operating Activities |
||||||||
| Net income |
$ | 8,520 | $ | 6,277 | ||||
| Net (income) loss from discontinued operations |
287 | (1,722 | ) | |||||
| Adjustments to reconcile net income to net cash provided by operating activities: |
||||||||
| Depletion and depreciation |
9,181 | 9,027 | ||||||
| Accretion of asset retirement obligation |
190 | 200 | ||||||
| Share-based compensation |
486 | 1,122 | ||||||
| Amortization of deferred charges |
221 | 221 | ||||||
| Commodity derivative fair value losses (gains) |
2,572 | (220 | ) | |||||
| Cash (payments) receipts from settled derivatives |
(1,819 | ) | 95 | |||||
| Gain on sale of assets |
(23 | ) | (118 | ) | ||||
| Deferred tax expense |
3,331 | 650 | ||||||
| Cash payment for asset retirement obligation |
(36 | ) | — | |||||
| Unrealized foreign exchange gain |
(83 | ) | (2,480 | ) | ||||
| Change in assets and liabilities: |
||||||||
| Accounts receivable |
866 | 1,041 | ||||||
| Prepaid expenses and other current assets |
563 | 247 | ||||||
| Accounts payable and accrued liabilities |
(1,883 | ) | 3,961 | |||||
|
|
|
|
|
|||||
| Net cash provided by operating activities – continuing operations |
22,373 | 18,301 | ||||||
| Net cash used in operating activities – discontinued operations |
(287 | ) | (2,756 | ) | ||||
|
|
|
|
|
|||||
| Net cash provided by operating activities |
22,086 | 15,545 | ||||||
| Investing Activities |
||||||||
| Property, plant and equipment additions |
(10,352 | ) | (14,790 | ) | ||||
| Proceeds on sale of property, plant and equipment |
23 | 146 | ||||||
|
|
|
|
|
|||||
| Net cash used in investing activities |
(10,329 | ) | (14,644 | ) | ||||
|
|
|
|
|
|||||
| Financing Activities |
||||||||
| Dividends |
(1,805 | ) | (3,559 | ) | ||||
|
|
|
|
|
|||||
| Net cash used in financing activities |
(1,805 | ) | (3,559 | ) | ||||
|
|
|
|
|
|||||
| Change in cash and cash equivalents |
9,952 | (2,658 | ) | |||||
| Cash and cash equivalents, beginning of period |
15,631 | 23,086 | ||||||
|
|
|
|
|
|||||
| Cash and cash equivalents, end of period |
$ | 25,583 | $ | 20,428 | ||||
|
|
|
|
|
|||||
| Supplementary Cash Flow Information |
||||||||
| Interest paid |
$ | 1,373 | $ | 1,494 | ||||
| Income tax paid |
— | — | ||||||
|
|
|
|
|
|||||
See accompanying notes to the unaudited consolidated financial statements.
Page 6 of 39
Table of Contents
EQUAL ENERGY LTD.
NOTES TO CONSOLIDATED FINANCIAL STATEMENTS
(unaudited)
| 1. | Basis of Presentation and Significant Accounting Policies |
Prior to its acquisition by Petroflow Energy Corporation on July 31, 2014, Equal Energy Ltd. (“Equal” or the “Company”) was a publicly listed company whose common shares trade on both the Toronto Stock Exchange (“TSX”) and the New York Stock Exchange (“NYSE”) under the symbol EQU. As further described in Note 13, Subsequent Events, on July 31, 2014, the Company was acquired by and became a wholly owned subsidiary of Petroflow Energy Corporation. See Note 13, Subsequent Events, for further information. Equal is engaged in the exploration, development and production of Natural Gas Liquids (“NGLs”), natural gas and oil in the United States and conducts many of its activities jointly with others. These consolidated financial statements reflect only the Company’s proportionate interest in such activities. See Note 13, Subsequent Events, for discussion regarding the acquisition of all of the Company’s issued and outstanding common shares on July 31, 2014.
As required by Rule 3b-4(c) of the United States Securities Exchange Act of 1934, as amended, and Rule 405 of the United States Securities Act of 1933, as amended, Equal has adopted generally accepted accounting principles in the United States of America (“U.S. GAAP”) for financial reporting.
The accompanying unaudited consolidated financial statements have been prepared pursuant to the rules and regulations of the United States Securities and Exchange Commission (“SEC”). Pursuant to such rules and regulations, certain disclosures normally included in financial statements prepared in accordance with U.S. GAAP have been omitted. The accompanying unaudited consolidated financial statements should be read in conjunction with the Company’s consolidated financial statements included in Equal’s Annual Report on Form 10-K for the year ended December 31, 2013, filed with the SEC on March 17, 2014. The accompanying unaudited consolidated financial statements reflect all adjustments that are, in the opinion of management, necessary for a fair presentation of the Company’s financial position as of June 30, 2014, and the Company’s results of operations and cash flows for the three and six month periods ended June 30, 2014 and 2013.
Foreign Currency Transactions
As a result of the 2012 strategic review, all of Equal’s Canadian oil and gas assets were sold in Q4 2012. Starting in January 2013, the Company changed its functional currency from the Canadian dollar to the U.S. dollar, as the Company primarily generates revenue and expends cash in U.S. dollars. In addition, effective January 1, 2013, the Company changed its reporting currency from the Canadian dollar to the U.S. dollar.
RECENT ACCOUNTING STANDARDS
As of January 1, 2017, Equal will be required to adopt Accounting Standards Update (“ASU”) 2014-09, “Revenue from Contracts with Customers” under Topic 606, which was the result of a joint project by the FASB and International Accounting Standards Board. The new standard replaces Topic 605, “Revenue Recognition”, and other industry-specific guidance in the Accounting Standards Codification. The new standard is based on the principle that revenue is recognized on the transfer of promised goods or services to customers in an amount that reflects the consideration the Company expects to be entitled to in exchange for those goods or services. The standard can be applied using either the full retrospective approach or a modified retrospective approach at the date of adoption. Equal is currently assessing the potential impact of the standard on the Company’s consolidated financial statements.
In April 2014, the FASB issued ASU No. 2014-08, “Reporting Discontinued Operations and Disclosures of Disposals of Components of an Entity.” This ASU relates to discontinued operations reporting for disposals of components of an entity that represent strategic shifts that have, or will have, a major effect on an entity’s operations and financial results. The standard expands the disclosures for discontinued operations and requires new disclosures related to individually material disposals that do not meet the definition of a discontinued operation. The provisions of this ASU are effective for interim and annual periods beginning after December 15, 2014. The Company does not anticipate that the adoption of this standard will have an impact on its consolidated financial statements or disclosures.
Effective January 1, 2014, Equal adopted ASU No. 2013-11, “Presentation of an Unrecognized Tax Benefit When a Net Operating Loss Carryforward, a Similar Tax Loss, or a Tax Credit Carryforward Exists” issued by the Financial Accounting Standards Board (“FASB”). This update requires the netting of unrecognized tax benefits against a deferred tax asset for a loss or other carryforward that would apply in settlement of the uncertain tax positions. Under the amended guidance, unrecognized tax benefits are netted against all available same-jurisdiction loss or other tax carryforwards that would be utilized, rather than only against carryforwards that are created by the unrecognized tax benefits. The updated guidance is applied prospectively, effective January 1, 2014. The adoption of this update concerns presentation and disclosure only as it relates to Equal’s consolidated financial statements and had no impact to the Company at June 30, 2014.
Page 7 of 39
Table of Contents
In March 2013, the FASB issued ASU 2013-05, “Foreign Currency Matters: Parent’s Accounting for the Cumulative Translation Adjustment upon Derecognition of Certain Subsidiaries or Groups of Assets within a Foreign Entity or of an Investment in a Foreign Entity.” This ASU provides guidance for transactions that require the entire amount of a cumulative translation adjustment related to an entity’s investment in a foreign entity to be released. This guidance is effective for annual and interim periods beginning after December 15, 2013, and had no impact to the Company at June 30, 2014.
| 2. | Accounts Receivable |
The components of account receivable include the following:
| (in thousands) |
June 30, 2014 | December 31, 2013 | ||||||
| Accounts receivable – trade |
$ | 11,910 | $ | 12,211 | ||||
| Accounts receivable – other |
1,038 | 1,733 | ||||||
| Allowance for doubtful accounts |
(233 | ) | (363 | ) | ||||
|
|
|
|
|
|||||
| $ | 12,715 | $ | 13,581 | |||||
|
|
|
|
|
|||||
| 3. | Long-Term Debt |
In June 2014, the Company updated its syndicated bank credit facility of CAD $125 million comprised of a CAD $105 million revolving credit facility and a CAD $20 million operating credit facility and can be drawn against in either Canadian dollars or the United States dollar equivalent. The revolving and operating credit facilities are secured with a first priority charge over the assets of Equal. The maturity date of the revolving and operating credit facilities is June 2015.
Interest rates and standby fees for the credit facilities are set quarterly according to a grid based on the ratio of bank debt to cash flow with the interest rates based on Canadian dollar BA (“Bankers Acceptance”) or U.S. dollar LIBOR rate plus 2.0% to 3.5%, depending on the ratio of bank debt to cash flow. For any unused balance of the credit facility, 0.50% to 0.88% is charged as a standby fee which is recorded in interest expense. At June 30, 2014, the marginal interest rate and standby fee were 2.0% and 0.5%, respectively.
Equal is required to maintain several financial and non-financial covenants. The primary financial covenant is an interest coverage ratio of 3:1 as calculated pursuant to the terms of the credit agreement. For the three months ended June 30, 2014, the interest coverage ratio was 11.64:1. At June 30, 2014, Equal was in compliance with the terms and covenants of the credit facilities. At June 30, 2014, no amount was borrowed against the credit facility and the entire balance of CAD $125 million was available. See Note 13, Subsequent Events, for discussion regarding the acquisition of all of the Company’s issued and outstanding common shares on July 31, 2014, which cancels the bank credit facility under the existing terms and imposed new terms under a new credit facility.
| 4. | Convertible Debentures |
On February 9, 2011, Equal issued CAD $45 million of convertible unsecured junior subordinated debentures with a face value of CAD $1,000 per debenture that mature on March 31, 2016, and bear interest at 6.75% per annum paid semi-annually on March 31 and September 30 of each year (“Debentures”). The Debentures are convertible at the option of the holder into shares at any time prior to the maturity date. Under the terms of the indenture, the common stock dividend payment on May 28, 2014 (See Note 12) resulted in a reduction of the conversion price of each debenture from CAD $8.55 to $8.47 per share and convertible into 118.06 common shares of Equal at June 30, 2014.
At June 30, 2014, the Company had CAD $45 million (US $42.2 million) in face value of Debentures outstanding with an estimated fair value of US $42.4 million.
See Note 13, Subsequent Events, for discussion regarding the acquisition of all of the Company’s issued and outstanding common shares on July 31, 2014, which, as part of the consideration, included a US$0.05 cash dividend payment resulting in an additional reduction of the conversion price of each debenture from CAD$8.47 to $8.39 per share and convertible into 119.19 common shares of Equal.
Page 8 of 39
Table of Contents
| 5. | Asset Retirement Obligation |
The following table reconciles the asset retirement obligation:
| (in thousands) |
June 30, 2014 | December 31, 2013 | ||||||
| Balance, beginning of period |
$ | 4,640 | $ | 4,746 | ||||
| Liabilities added |
20 | 140 | ||||||
| Liabilities settled |
(36 | ) | (43 | ) | ||||
| Revision of estimated obligation |
2 | (614 | ) | |||||
| Accretion of expense on discounted obligation |
190 | 411 | ||||||
|
|
|
|
|
|||||
| Balance, end of period |
$ | 4,816 | $ | 4,640 | ||||
|
|
|
|
|
|||||
| Current portion of Obligation |
$ | 290 | $ | 278 | ||||
|
|
|
|
|
|||||
| 6. | Share-Based Compensation |
As a result of voting at the Company’s shareholders meeting in May 2013, no shares are currently available for future grants under either of the Company’s equity plans. The Company uses the ratable method for calculating compensation expense pursuant to ASC Topic 718, and recognized share-based compensation for share options and restricted shares in General and Administrative expense for the three and six months ended June 30, 2014 and 2013.
Share Options
The Company records compensation expense for share options based on the estimated fair value of the options on the date of grant using the Black-Scholes option-pricing model. Total compensation expense recognized for stock options during the three and six months ended June 30, 2014 was $0 and $14,000, and during the three and six months ended June 30, 2013 was $147,000 and ($124,000), respectively. At June 30, 2014, there was $10,000 of unrecognized compensation expense related to share options, and that cost is expected to be recognized over a weighted-average period of 1.6 years. The amount of unrecognized compensation expense noted above does not necessarily represent the amount that will ultimately be realized by the Company in its unaudited consolidated statement of operations. See Note 13, Subsequent Events, for discussion regarding the acquisition of all of the Company’s issued and outstanding common shares on July 31, 2014, which affects all outstanding share options as of that date.
The following table summarizes Company’s stock option activities for the six months ended June 30, 2014:
| Number of Options (000’s) |
Weighted Average Exercise Price Per Share |
Weighted Average Remaining Contractual Term |
Aggregate Intrinsic Value (000’s) |
|||||||||||||
| Options outstanding at December 31, 2013 |
289 | $ | 6.57 | |||||||||||||
| Options granted |
— | $ | — | |||||||||||||
| Options exercised |
— | $ | — | |||||||||||||
| Options forfeited |
— | $ | — | |||||||||||||
|
|
|
|
|
|
|
|
|
|||||||||
| Options outstanding at June 30, 2014 |
289 | $ | 6.57 | 1.6 | $ | 129 | ||||||||||
| Options exercisable at June 30, 2014 |
48 | $ | 4.21 | 0.8 | $ | 129 | ||||||||||
|
|
|
|
|
|
|
|
|
|||||||||
| Vested and expected to vest in the future at June 30, 2014 |
289 | $ | 6.57 | 1.6 | $ | 129 | ||||||||||
Restricted Shares
Total compensation expense recognized for restricted shares during the three and six months ended June 30, 2014 was $232,000 and $472,000, and during the three and six months ended June 30, 2013 was $692,000 and $1,275,000, respectively. At June 30, 2014, there was $1.0 million of unrecognized compensation expense related to restricted shares, and that cost is expected to be recognized over a weighted-average period of 1.3 years. The amount of unrecognized compensation expense noted above does not necessarily represent the amount that will ultimately be realized by the Company in its consolidated statements of operations. See Note 13, Subsequent Events, for discussion regarding the acquisition of all of the Company’s issued and outstanding common shares on July 31, 2014, which affects all outstanding restricted shares as of that date.
Page 9 of 39
Table of Contents
The following table summarizes Company’s non-vested restricted share activities for the quarter ended June 30, 2014:
| Number of Restricted Shares (in thousands) |
Weighted Average Grant Date Fair Value |
|||||||
| Restricted shares outstanding at December 31, 2013 |
981 | $ | 3.90 | |||||
| Restricted shares granted |
6 | $ | 3.57 | |||||
| Restricted shares vested and issued |
(296 | ) | $ | 4.70 | ||||
| Restricted shares forfeited |
(17 | ) | $ | 3.07 | ||||
|
|
|
|
|
|||||
| Restricted shares outstanding at June 30, 2014 |
674 | $ | 3.75 | |||||
|
|
|
|
|
|||||
Page 10 of 39
Table of Contents
| 7. | Earnings per Share |
Basic earnings per share (“EPS”) is computed by dividing net income by the weighted-average number of common shares outstanding during the period. Diluted EPS is based on the combined weighted-average number of common shares and dilutive potential common shares outstanding which include, where appropriate, the assumed exercise of options. In computing diluted EPS, the Company utilizes the treasury stock method.
The computation of weighted-average common and common equivalent shares used in the calculation of basic and diluted EPS is shown in the following table (in thousands, except share and per share data):
| Three Months Ended June 30, |
Six Months Ended June 30, |
|||||||||||||||
| 2014 | 2013 | 2014 | 2013 | |||||||||||||
| Net income – Continuing Operations |
$ | 2,720 | $ | 4,785 | $ | 8,807 | $ | 4,555 | ||||||||
| Net income (loss) – Discontinued Operations |
41 | (39 | ) | (287 | ) | 1,722 | ||||||||||
|
|
|
|
|
|
|
|
|
|||||||||
| Total Net income |
$ | 2,761 | $ | 4,746 | $ | 8,520 | $ | 6,277 | ||||||||
|
|
|
|
|
|
|
|
|
|||||||||
| Basic EPS: |
||||||||||||||||
| Weighted-average common shares |
36,098,877 | 35,592,904 | 36,080,963 | 35,560,373 | ||||||||||||
|
|
|
|
|
|
|
|
|
|||||||||
| Basic EPS – Continuing Operations |
$ | 0.08 | $ | 0.13 | $ | 0.24 | $ | 0.13 | ||||||||
|
|
|
|
|
|
|
|
|
|||||||||
| Basic EPS – Discontinued Operations |
$ | 0.00 | $ | 0.00 | $ | (0.01 | ) | $ | 0.05 | |||||||
|
|
|
|
|
|
|
|
|
|||||||||
| Basic - Combined |
$ | 0.08 | $ | 0.13 | $ | 0.23 | $ | 0.18 | ||||||||
|
|
|
|
|
|
|
|
|
|||||||||
| Net Income – Continuing Operations |
$ | 2,720 | $ | 4,785 | $ | 8,807 | $ | 4,555 | ||||||||
| Plus: Income impact of assumed conversion: |
||||||||||||||||
| Interest on 6.75% convertible debentures |
— | — | 1,039 | — | ||||||||||||
|
|
|
|
|
|
|
|
|
|||||||||
| Income after effect of assumed conversion |
$ | 2,720 | $ | 4,785 | $ | 9,846 | $ | 4,555 | ||||||||
|
|
|
|
|
|
|
|
|
|||||||||
| Weighted-average common shares, basic |
36,098,877 | 35,592,904 | 36,080,963 | 35,560,373 | ||||||||||||
| Shares issuable pursuant to restricted shares |
448,462 | 1,197,137 | 477,452 | 974,459 | ||||||||||||
| Shares issuable pursuant to dividend equivalent rights |
29,884 | — | 29,913 | — | ||||||||||||
| Shares issuable pursuant to stock options |
19,037 | 6,627 | 19,987 | 4,447 | ||||||||||||
| Shares issuable pursuant to convertible debentures |
— | — | 5,312,869 | — | ||||||||||||
|
|
|
|
|
|
|
|
|
|||||||||
| Weighted average shares outstanding, diluted |
36,596,260 | 36,796,668 | 41,921,184 | 36,539,279 | ||||||||||||
|
|
|
|
|
|
|
|
|
|||||||||
| Diluted EPS – Continuing Operations |
$ | 0.07 | $ | 0.13 | $ | 0.23 | $ | 0.12 | ||||||||
| Diluted EPS – Discontinued Operations |
$ | 0.00 | $ | 0.00 | $ | (0.01 | ) | $ | 0.05 | |||||||
|
|
|
|
|
|
|
|
|
|||||||||
| Diluted EPS – Combined |
$ | 0.07 | $ | 0.13 | $ | 0.22 | $ | 0.17 | ||||||||
|
|
|
|
|
|
|
|
|
|||||||||
For the calculation of the weighted average number of diluted shares outstanding for the three and six months ended June 30, 2014, the restricted shares and dividend equivalent rights shares were included as they were dilutive to the calculation. For the three months ended June 30, 2014, the convertible debenture shares were excluded from the calculation as they were anti-dilutive, and for the six months ended June 30, 2014, were included as they were dilutive to the calculation. Stock options totaling 217,295 were excluded from the calculation for the three and six months ended June 30, 2014, respectively, as they were anti-dilutive because their exercise prices were higher than the average share price during the quarter.
For the calculation of the weighted average number of diluted shares outstanding for the three and six months ended June 30, 2013, the restricted shares were included as they were dilutive to the calculation, and the Debentures and all options, except for the 34,500 options granted in February 2013, were excluded from the calculation as they were anti-dilutive.
As further described in Note 13, Subsequent Events, on July 31, 2014, the Company was acquired by and became a wholly owned subsidiary of Petroflow Energy Corporation. See Note 13, Subsequent Events, for further information.
| 8. | Fair Value Measurements |
Financial instruments are presented at fair value in the Company’s balance sheets. To estimate fair values of financial instruments, the Company utilizes three levels of input: Level 1, defined as observable inputs for identical instruments such as quoted prices in active markets; Level 2, defined as inputs, other than quoted prices in active markets, that are either directly or indirectly observable; and Level 3, defined as unobservable inputs in which little or no market data exists, therefore requiring an entity to develop its own assumptions. Due to the unavailability of relevant comparable market data for the Company’s fixed price swaps, the discounted cash flow method is used to estimate fair values by discounting future cash flows based on quoted forward prices for commodities and a risk-adjusted discount rate. Such fair value calculation is then compared to the counterparty valuation for reasonableness.
Page 11 of 39
Table of Contents
The carrying values of cash, accounts receivable, accounts payable and accrued liabilities included in the accompanying unaudited consolidated balance sheets approximated fair value at June 30, 2014, and December 31, 2013. The fair value of the Debentures is disclosed in Note 4 and is based on the trading price of the Debentures at the reporting date (Level 1). These assets and liabilities are not presented in the following tables.
The only asset or liability measured at fair value on a recurring basis is the commodity contracts. The fair values of these contracts are based on a market approach and are estimated using inputs which are either directly or indirectly observable at the reporting date, such as exchange and other published prices, broker quotes and observable trading activity. The following tables provide fair value measurement information for commodity derivatives as of June 30, 2014 and December 31, 2013.
| As of June 30, 2014 |
||||||||||||||||||||
| Fair Value Measurements Using: | ||||||||||||||||||||
| (in thousands of dollars) |
Carrying Amount |
Fair Value | Level 1 | Level 2 | Level 3 | |||||||||||||||
| Commodity contracts liability |
1,094 | 1,094 | — | 1,094 | — | |||||||||||||||
| As of December 31, 2013 |
||||||||||||||||||||
| Fair Value Measurements Using: | ||||||||||||||||||||
| (in thousands of dollars) |
Carrying Amount |
Fair Value | Level 1 | Level 2 | Level 3 | |||||||||||||||
| Commodity contracts liability |
341 | 341 | — | 341 | — | |||||||||||||||
Equal’s Debentures actively trade in an established market. There were no transfers in or out of Level 1 or Level 2 measurements for the six months ended June 30, 2014, or the 12 months ended December 31, 2013. The Company’s policy is to recognize transfers between levels as of the beginning of the period in which the event triggering the transfer occurs. The Company had no Level 3 financial instruments at any time during the six months ended June 30, 2014 or 2013.
| 9. | Commodity Contracts |
To minimize the exposure to fluctuations in crude oil and natural gas prices, Equal periodically enters into commodity contracts including fixed price swaps, which currently equal approximately 80% of Equal’s natural gas production and approximately 71% and 6% of the Company’s oil and NGL production, respectively. Such commodity contracts do not qualify for hedge accounting treatment and thus are not designated as hedging instruments. As of June 30, 2014, Equal had financial derivative contracts outstanding with four counterparties. Equal’s commodity contracts are summarized in the table below. See Note 13, Subsequent Events, for discussion regarding the acquisition of all of the Company’s issued and outstanding common shares on July 31, 2014, which cancels all crude oil and natural gas commodity contracts, as of that date.
Page 12 of 39
Table of Contents
| Derivative Instrument |
Commodity | Price | Volume per day | Period | ||||
| Fixed | Gas | 4.25 ($/mmbtu) | 2,000 mmbtu | January 1, 2014 – December 31, 2014 | ||||
| Fixed | Gas | 4.05 ($/mmbtu) | 2,000 mmbtu | January 1, 2014 – December 31, 2014 | ||||
| Fixed | Gas | 4.10 ($/mmbtu) | 2,000 mmbtu | January 1, 2014 – December 31, 2014 | ||||
| Fixed | Gas | 4.06 ($/mmbtu) | 2,000 mmbtu | January 1, 2014 – December 31, 2014 | ||||
| Fixed | Gas | 4.05 ($/mmbtu) | 4,000 mmbtu | January 1, 2014 – December 31, 2014 | ||||
| Fixed | Gas | 4.34 ($/mmbtu) | 2,000 mmbtu | January 1, 2014 – December 31, 2014 | ||||
| Fixed | Gas | 4.55 ($/mmbtu) | 2,000 mmbtu | March 1, 2014 – December 31, 2014 | ||||
| Fixed | Oil | 95.00 ($/bbl) | 200 bbl | March 1, 2014 – December 31, 2014 | ||||
| Fixed | Normal Butane (1) | 54.60 ($/bbl) | 200 bbl | April 1, 2014 – September 30, 2014 |
| (1) | Conway, Propane (in-well) OPIS |
| 10. | Discontinued Operations |
In 2012, Equal announced that its Board of Directors initiated a strategic review process to identify, examine and consider alternatives with the view to enhance shareholder value. As a result of the strategic review process, the Company sold all of its Canadian assets and certain of its Oklahoma assets.
The Canadian asset sales in late 2012 resulted in the discontinuation of operations in Canada. Prior to the initiation of the strategic review, there was a Canadian asset sale which included heavy oil properties in Saskatchewan. Certain Northern Oklahoma assets, which were not included in discontinued operations, were sold in 2012.
The gain of $41,000 and loss of $287,000 from discontinued operations for the three and six months ended June 30, 2014, respectively, primarily relates to equipment sales and abandonment costs. Income of $1.7 million from discontinued operations for the six months ended June 30, 2013 primarily relates to post-closing adjustments.
| 11. | Contingencies |
Equal is party to various legal actions arising in the normal course of business. Matters that are probable of unfavorable outcome to Equal and which can be reasonably estimated are accrued. Such accruals are based on information known about the matters, Equal’s estimates of the outcomes, and its experience in contesting, litigating and settling similar matters. To management’s knowledge, there were no pending legal proceedings which would result in amounts material to Equal’s financial position or results of operations. Actual amounts could differ materially from management’s estimates.
On December 12, 2013, Equal shareholder Andrew Cooke filed a putative class action lawsuit in the District Court of Oklahoma County for the State of Oklahoma against Equal, its directors, Petroflow Energy Corporation and Petroflow Canada Acquisition Corp. (collectively, “Petroflow”): Cooke v. Equal Energy, et al., CJ-2013-6817. Subsequently, three additional putative class actions were also filed by shareholders in the same state court: Olsen v. Equal Energy, et al., CJ-2013-6873; Solak v. Equal Energy, et al., CJ-2013-6959; and Grinberger v. Equal Energy, et al., CJ-2013-7055. These cases alleged that in connection with the proposed Arrangement Agreement (“Arrangement”), the members of the Board breached their fiduciary duties to Equal. The complaints further claimed that Equal and Petroflow aided and abetted those alleged breaches of fiduciary duties. The complaints generally alleged that the Arrangement involves an unfair price, unfair sales process, self-dealing and unfairly preclusive deal protection devices. The plaintiffs in the action sought injunctive relief, including to enjoin the Arrangement, and an award of attorneys’ and other fees and costs. One of these four matters was voluntarily dismissed, while the other three were consolidated into one case: In re Equal Energy Shareholder Litigation, CJ-2013-6873.
Equal and its directors filed a motion to dismiss the state actions on January 23, 2014. Petroflow subsequently filed a similar motion to dismiss. Both motions are fully briefed and remain pending.
Page 13 of 39
Table of Contents
On January 14, 2014, Equal shareholder Johan Van Weelden brought a separate lawsuit in the U.S. District Court for Western District of Oklahoma against Equal, its directors and Petroflow: Van Weelden v. Equal Energy Ltd., et al., No. 14-cv-0047-C. Subsequently three putative class actions were also filed by shareholders in the same federal court: Montemarano et al. v. Equal Energy Ltd., et al., No. 14-cv-0058-C; Cooke v. Equal Energy, Ltd., et al., No. 14-CV-0087-C; Scripture v. Equal Energy Ltd., et al., No. 14-cv-0114-C. These cases allege that disclosures relevant to the proposed Arrangement Agreement with Petroflow violate Section 14(a) and 20(a) of the Securities Exchange Act, that the Equal directors breached their fiduciary duties to Equal shareholders, and that Equal and Petroflow aided and abetted those alleged breaches of fiduciary duties. On May 8, 2014, Judge Cauthron of the U.S. District Court for the Western District of Oklahoma ordered that the cases should be consolidated and appointed Cooke as lead plaintiff and Robbins Gellar Rudman & Dowd LLP as lead counsel.
Equal and its directors filed a motion to dismiss the federal actions on May 15, 2014. Petroflow subsequently filed a similar motion to dismiss. Both motions are fully briefed and remain pending.
Contemporaneous with motion to dismiss briefing, lead counsel in both the state and federal actions and counsel for defendants engaged in arm’s-length negotiations concerning the terms and conditions of a potential resolution of the state and federal actions in which Equal would disclose certain additional information to Equal’s shareholders. On June 12, 2014, Equal filed a revised Definitive Proxy with the SEC containing, among other things, the additional disclosures agreed to in connection with the parties’ agreement. On or around July 10, 2014, counsel for the parties reached an agreement in principle in the federal actions providing for the binding settlement of all claims that all shareholders might have regarding the actions of Equal or its Board while considering or entering into the Petroflow Arrangement Agreement, and while making any disclosures to the marketplace. In exchange Equal agreed to include additional disclosures in its proxy materials, and entered into a memorandum of understanding setting forth the material terms of the settlement. The parties are in the process of drafting the settlement agreement, which will then be submitted to the federal court for review during a final approval hearing.
| 12. | Cash Dividends |
On May 1, 2014, the Petroflow Arrangement Agreement was amended (the “Amendment,” see Item 2 Arrangement to Sell all Issued and Outstanding Shares of the Company) which permitted Equal to declare and pay on or after May 1, 2014, and prior to
the effective date of the Arrangement, a cash dividend of $0.05 per common share, and to declare and pay to its common shareholders who were entitled to receive Arrangement consideration upon completion of the Arrangement a cash dividend of $0.05 cents per common share (the “Arrangement Dividend”). A cash dividend of $1.8 million was paid on May 28, 2014.
Pursuant to the November 27, 2012 announcement of a $0.20 per share annual dividend payable at the end of each calendar quarter of 2013, a $0.05 per share cash dividend was paid during the first two quarters of the 2013 totaling $3.6 million for the six months ended June 30, 2013.
| 13. | Subsequent Events |
In preparing the accompanying unaudited consolidated financial statements, the Company has reviewed events that have occurred after June 30, 2014, through the issuance of the financial statements.
On December 6, 2013, the Company, Petroflow Energy Corporation, a Delaware corporation (“Petroflow”), and Petroflow Canada Acquisition Corp., an Alberta, Canada corporation and wholly-owned subsidiary of Petroflow (“PetroflowSub”), entered into an Arrangement Agreement, pursuant to which Petroflow agreed to acquire, indirectly through PetroflowSub, all of the outstanding common shares of Equal for $5.43 per share in cash, without interest (the “Arrangement”), pursuant to which Equal would become an indirect wholly-owned subsidiary of Petroflow. The Arrangement was completed on July 31, 2014, and the following events were a result of the Arrangement:
| — | Common shareholders of Equal who are entitled to receive Arrangement consideration upon completion of the Arrangement are entitled to receive a cash dividend of $0.05 cents per common share (the “Arrangement Dividend”) following completion of the Arrangement. The $1.8 million cash dividend was paid on July 31, 2014. |
| — | Pursuant to the statutory plan of arrangement, Equal and Petroflow Sub were amalgamated with the combined entity retaining the name Equal Energy Ltd. (herein also referred to as “Equal”). |
| — | Pursuant to the statutory plan of arrangement, each option outstanding immediately prior to the effective time of the Arrangement (whether vested or unvested) was transferred from the holder thereof to Equal in consideration for a cash payment by Equal equal to the amount, if any, by which the Canadian equivalent of the Arrangement consideration, in respect of each option, exceeded the exercise price per share of such option (see Note 6). |
Page 14 of 39
Table of Contents
| — | Pursuant to the statutory plan of arrangement, at the effective time of the Arrangement, all Equal common shares issuable pursuant to Equal’s restricted share and performance share incentive plan were issued and those Equal common shares were converted into the right to receive the Arrangement consideration, less any applicable withholding taxes (see Note 6). |
| — | In connection with the closing of the Arrangement, pursuant to a request submitted by Equal on July 31, 2014, Equal notified the New York Stock Exchange (“NYSE”) and the Toronto Stock Exchange (“TSX”) of the completion of the Arrangement and requested that the NYSE and TSX cease trading of Equal’s common stock and suspend the listing of the common stock prior to the opening of market on July 31, 2014, and that the NYSE file with the SEC an application on Form 25 to delist and deregister the common stock under Section 12(b) of the Exchange Act. |
| — | In connection with the completion of the Arrangement, Equal’s syndicated bank credit facility was cancelled (see Note 3). |
| — | In connection with the Arrangement, on July 31, 2014, Petroflow and Texoak Energy-Project 1C, LLC, as borrowers, entered into a new $250 million first lien credit agreement (the “First Lien Credit Agreement”) and a new $103 million second lien credit agreement (the “Second Lien Credit Agreement” and, together with the First Lien Credit Agreement, the “Credit Agreements” and each a “Credit Agreement”). |
The First Lien Credit Agreement matures on July 31, 2017. The Second Lien Credit Agreement matures on January 31, 2018. There is no scheduled amortization during the term of either Credit Agreement. Loans outstanding under the First Lien Credit Agreement may be voluntarily prepaid at the option of the borrowers, subject to any applicable premium, and, subject to the limitations set forth in the First Lien Credit Agreement and the intercreditor agreement, loans under the Second Lien Credit Agreement may be voluntarily prepaid at the option of the borrowers, subject to any applicable premium. The Credit Agreements contain customary mandatory prepayments, including as a result of asset sales and an annual free cash flow sweep.
Interest rates under the First Lien Credit Agreement are determined, to the extent paid in cash, based on the floating LIBOR rate plus 8% per annum (subject to a LIBOR floor of 1%). Interest rates under the Second Lien Credit Agreement are based on a fixed rate of 12% per annum to extent paid in cash. Each of the First Lien Credit Agreement and Second Lien Credit Agreement provides for an additional 3% of interest per annum for interest that is paid-in-kind.
All domestic subsidiaries of Petroflow, including Equal at such time as it becomes a domestic subsidiary, are required to guarantee the obligations of the borrowers under each of the First Lien Credit Agreement and Second Lien Credit Agreement. Equal is expected to be domesticated as a U.S. subsidiary within thirty days from the effective day of the Arrangement. Substantially all of the borrowers’ and the guarantors’ assets, including their respective interests in oil and gas properties, are pledged as security on a first or second lien basis, as applicable, for the First Lien Credit Agreement and Second Lien Credit Agreement.
Each of the First Lien Credit Agreement and Second Lien Credit Agreement contains customary representations and warranties, affirmative covenants, negative (including financial) covenants and events of default for financings of this type.
| — | In connection with the completion of the Arrangement, Equal has defeased all of the Debentures by depositing cash, in trust with the trustee under the indenture governing the Debentures (the “Indenture”), sufficient to fully pay, satisfy and discharge all obligations under the Debentures. The completion of the Arrangement constitutes a change of control under the Indenture. As a result, pursuant to its obligations under the Indenture, Equal will be offering to repurchase Debentures at a purchase price equal to 101% of the principal amount thereof plus accrued interest, subject to the terms and conditions set out in the Indenture (the “Change of Control Purchase Offer”). Holders that do not accept the Change of Control Purchase Offer shall be entitled to continue to receive interest on the Debentures until they are redeemed at par on March 31, 2016 in accordance with the provisions of the Indenture. The Debentures remain listed for trading on the TSX under the symbol EQU.DB.B. |
Pursuant to the Indenture, following the Arrangement, each debentureholder no longer has the right to receive common shares on conversion of Debentures, but has the right to receive, in lieu of such shares, the US$5.43 in cash per share which such debentureholder would have been entitled to receive had it been the holder of such number of shares at the effective time of the Arrangement that it was entitled to acquire pursuant to its conversion right. The Debentures currently have a conversion price that is significantly greater than the Arrangement consideration.
Equal has filed an application with the Alberta and Ontario securities commissions for relief from the requirements of continuous disclosure in all provinces and territories in Canada, including its obligations under National Instrument 51-102—Continuous Disclosure Obligations. If the relief is granted, Equal will be exempt from its continuous disclosure filing obligations, but will be required (i) to provide annual alternative disclosure that will state the principal amount of Debentures that remain outstanding and (ii) upon the occurrence of a change in the affairs of Equal or the trustee under the Indenture that would reasonably be expected to have a significant effect upon the market price or value of any of the Debentures, to forthwith, upon becoming aware of such a change, issue and file a news release disclosing the nature and substance of the change.
Page 15 of 39
Table of Contents
| — | In connection with the completion of the Arrangement, all of Equal’s crude oil and natural gas commodity contracts were cancelled (see Note 9). |
| — | Pursuant to the terms of the statutory plan of arrangement, the articles of amalgamation filed, on the effective date with the Registrar of Corporations for the Province of Alberta, were deemed to be articles of incorporation of the corporation continuing from the amalgamation, and the certificate of amalgamation issued by the Registrar of Corporations for the Province of Alberta was deemed to be the certificate of incorporation of the corporation continuing from the amalgamation. In addition, pursuant to the terms of the statutory plan of arrangement, at the effective time of the Arrangement, the bylaws of Equal were deemed to be the same as the bylaws of Petroflow Sub. |
| ITEM 2. | MANAGEMENT’S DISCUSSION AND ANALYSIS OF FINANCIAL CONDITION AND RESULTS OF OPERATIONS |
Forward-Looking Statements
The information discussed in this quarterly report on Form 10-Q includes “forward-looking statements” within the meaning of Section 27A of the Securities Act of 1933 (the “Securities Act”) and Section 21E of the Securities Exchange Act of 1934 (the “Exchange Act”). All statements, other than statements of historical facts, included herein concerning, among other things, planned capital expenditures, changes in oil and gas production, the number of anticipated wells to be drilled after the date hereof, future cash flows and borrowings, pursuit of potential acquisition opportunities, our financial position, business strategy and other plans and objectives for future operations, are forward-looking statements. These forward-looking statements are identified by their use of terms and phrases such as “may,” “expect,” “estimate,” “project,” “plan,” “believe,” “intend,” “achievable,” “anticipate,” “will,” “continue,” “potential,” “should,” “could,” and similar terms and phrases. Although we believe that the expectations reflected in these forward-looking statements are reasonable, they do involve certain assumptions, risks and uncertainties. Our results could differ materially from those anticipated in these forward-looking statements as a result of certain factors, including, among others:
| — | risks and uncertainties associated with the intended offer to repurchase convertible debentures; |
| — | risks associated with drilling oil and natural gas wells; |
| — | the volatility of oil and natural gas prices; |
| — | uncertainties in estimating oil and natural gas reserves; |
| — | the need to replace the oil and natural gas the Company produces; |
| — | the Company’s ability to execute its growth strategy by drilling wells as planned; |
| — | risks and liabilities associated with acquired properties and risks related to the integration of acquired businesses; |
| — | amount, nature and timing of capital expenditures, including future development costs, required to develop the Company’s undeveloped areas; |
| — | concentration of operations in Central Oklahoma; |
| — | inability to retain drilling rigs and other services; |
| — | risk of currency fluctuations; |
| — | the potential adverse effect of commodity price declines on the carrying value of the Company’s oil and natural gas properties; |
| — | severe or unseasonable weather that may adversely affect production and drilling; |
| — | availability of satisfactory oil and natural gas marketing and transportation; |
| — | availability and terms of capital to fund capital expenditures; |
| — | amount and timing of proceeds of asset sales and asset monetization; |
| — | limitations on operations resulting from debt restrictions and financial covenants; |
| — | potential financial losses or earnings reductions from commodity derivatives; |
| — | potential elimination or limitation of tax incentives; |
| — | competition in the oil and natural gas industry; |
Page 16 of 39
Table of Contents
| — | general economic conditions, either internationally or domestically or in the areas where the Company operates; |
| — | inability to obtain required regulatory approvals for development activities; |
| — | costs to comply with current and future governmental regulation of the oil and natural gas industry, including environmental, health and safety laws and regulations, and regulations with respect to water disposal and hydraulic fracturing; |
| — | the need to maintain adequate internal control over financial reporting. |
Finally, our future results will depend upon various other risks and uncertainties, including, but not limited to, those detailed in the section entitled “Risk Factors” included in our 2013 Annual Report on Form 10-K. All forward-looking statements attributable to us or persons acting on our behalf are expressly qualified in their entirety by the cautionary statements in this section and elsewhere in this report. Other than as required under securities laws, we do not assume a duty to update these forward-looking statements, whether as a result of new information, subsequent events or circumstances, changes in expectations or otherwise.
The following discussion and analysis addresses material changes in our results of operations and capital resources and uses for the three and six months ended June 30, 2014, compared to the three and six months ended June 30, 2013, and in our financial condition and liquidity since December 31, 2013, and should be read in conjunction with “Item 1. Consolidated Financial Statements” of this report and “Item 7. Management’s Discussion and Analysis of Financial Condition and Results of Operations” in our 2013 Annual Report on Form 10-K.
In addition, the following discussion is for our continuing operations (U.S. operations) for the three and six months ended June 30, 2014.
Overview
Equal Energy Ltd. is a Calgary, Alberta based company headquartered in Oklahoma City, Oklahoma, engaged in the exploration, acquisition, development and production of petroleum and natural gas in Oklahoma. The Company also reviews new drilling opportunities and potential acquisitions in Oklahoma to supplement its exploration and development activities.
The Company averaged approximately 7,125 and 7,049 boe/d of production for the three and six months ended June 30, 2014, respectively, which was comprised of approximately 48% natural gas, 48% NGLs and 4% crude oil. At June 30, 2014, the Company had 146 gross (120 net) producing wells, virtually all of which it operates, and approximately 85,500 gross (58,600 net) acres under lease or held by production.
On December 6, 2013, Equal, Petroflow Energy Corporation, a Delaware corporation (“Petroflow”), and Petroflow Canada Acquisition Corp., an Alberta, Canada corporation and wholly-owned subsidiary of Petroflow (“PetroflowSub”), entered into an Arrangement Agreement, pursuant to which Petroflow agreed to acquire, indirectly through PetroflowSub, all of the outstanding common shares of Equal for $5.43 per share in cash, without interest (the “Arrangement”), pursuant to which Equal would become an indirect wholly-owned subsidiary of Petroflow. The Arrangement was completed on July 31, 2014. Common shareholders of Equal who are entitled to receive Arrangement consideration upon completion of the Arrangement will also receive a cash dividend of $0.05 cents per common share (the “Arrangement Dividend”) following completion of the Arrangement.
In connection with the completion of the Arrangement, Equal entered into option cancellation agreements (“Option Agreements”) with each option holder in respect of all options.
In addition, at the effective time of the Arrangement, all Equal common shares issuable pursuant to Equal’s restricted share and performance share incentive plan were issued and those Equal common shares were converted into the right to receive the Arrangement consideration, less any applicable withholding taxes.
Petroflow has agreed that following the effective date of the Arrangement, Petroflow will satisfy or cause Equal to satisfy, all of Equal’s obligations regarding its convertible debentures, including that Petroflow will cause Equal to make an offer to purchase all of Equal’s outstanding CAD $45 million of convertible debentures within 30 days. In accordance with the terms of the indenture governing the convertible debentures, cash consideration equal to 101% of the face value, plus accrued and unpaid interest, will be offered to holders of the convertible debentures.
Page 17 of 39
Table of Contents
Equal’s Properties
The Company’s production comes from its Oklahoma based operations. The core area assets are located in Lincoln and Logan counties of Oklahoma. The Company also has an inventory of minor producing assets, minor royalty interests and various exploration and exploitation prospects on undeveloped lands in Oklahoma.
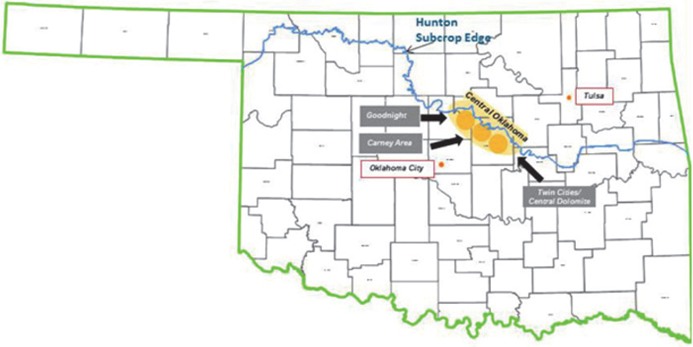
In Oklahoma, the key producing horizon is the Hunton formation. The Hunton is a carbonate rock formation which has been largely ignored by the industry in areas with high water/hydrocarbon production ratios. Over the last decade, new drilling and production techniques have enabled profitable development of the Hunton formation. Extensive dewatering lowers reservoir pressure, allowing the liberation and mobilization of oil, natural gas and NGLs from smaller rock pores. Typical peak wellhead hydrocarbon production rates average 150 boe/d per horizontal well and are generally observed within six months of production commencement.
Average Hunton production for the three months ended June 30, 2014, was approximately 20.2 MMcf/d of natural gas, 3.4 Mbbl/d of NGLs and 0.3 Mbbl/d of oil and for the six months ended June 30, 2014 was approximately 20.1 MMcf/d of natural gas, 3.4 Mbbl/d of NGLs and 0.3 Mbbl/d of oil. At December 31, 2013, the reserve report attributed proved reserves of 280 Mbbl of crude oil, 66 Bcf of natural gas and 12,993 Mbbl of NGLs.
As of June 30, 2014, the Company had approximately 27,000 gross (11,000 net) undeveloped acres of land under leasehold, primarily located in Lincoln and Logan counties of Oklahoma comprising of interests in 84 sections.
Market Conditions
Prices of natural gas, NGLs, and oil that we produce can vary significantly, which impacts our revenues and cash flows. The following table lists average New York Mercantile Exchange (“NYMEX”) prices for natural gas, West Texas Intermediate (“WTI”) prices for crude oil, and propane prices at Conway, KS for the three and six months ended June 30, 2014 and 2013.
| Three months ended June 30, | ||||||||
| 2014 | 2013 | |||||||
| Propane, Conway, KS (US$ per bbl) |
$ | 43.80 | $ | 35.88 | ||||
| NYMEX natural gas (US$ per mcf) |
$ | 4.67 | $ | 3.88 | ||||
| WTI (US$ per bbl) |
$ | 103.07 | $ | 94.10 | ||||
| Six months ended June 30, | ||||||||
| 2014 | 2013 | |||||||
| Propane, Conway, KS (US$ per bbl) |
$ | 55.01 | $ | 35.15 | ||||
| NYMEX natural gas (US$ per mcf) |
$ | 4.70 | $ | 3.63 | ||||
| WTI (US$ per bbl) |
$ | 100.88 | $ | 94.26 | ||||
Page 18 of 39
Table of Contents
Results of Operations for the three months ended June 30, 2014, and June 30, 2013
For the three months ended June 30, 2014, Equal Energy’s production was from the Central Oklahoma properties.
The following table sets forth selected operating data for the periods indicated.
| (in thousands, except for boe/d) | Three months ended Central Oklahoma |
|||||||||||||||
| June 30, 2014 | June 30, 2013 | Change | % Change | |||||||||||||
| Net Production per Day: |
||||||||||||||||
| Oil (Bbl) |
323 | 136 | 187 | 137 | % | |||||||||||
| NGL (Bbl) |
3,434 | 3,079 | 355 | 12 | % | |||||||||||
| Natural Gas (Mcf) |
20,207 | 18,429 | 1,778 | 10 | % | |||||||||||
|
|
|
|
|
|
|
|
|
|||||||||
| Total (Boe/d) |
7,125 | 6,287 | 838 | 13 | % | |||||||||||
| Net Production: |
||||||||||||||||
| Oil (MBbl) |
29 | 12 | 17 | 142 | % | |||||||||||
| NGL (MBbl) |
313 | 280 | 33 | 12 | % | |||||||||||
| Natural Gas (MMcf) |
1,839 | 1,677 | 162 | 10 | % | |||||||||||
|
|
|
|
|
|
|
|
|
|||||||||
| Total (MBoe) |
649 | 572 | 77 | 13 | % | |||||||||||
| Net Sales: |
||||||||||||||||
| Oil Sales |
$ | 2,938 | $ | 1,127 | $ | 1,811 | 161 | % | ||||||||
| NGL Sales |
10,484 | 8,249 | 2,235 | 27 | % | |||||||||||
| Natural Gas Sales |
6,639 | 5,372 | 1,267 | 24 | % | |||||||||||
|
|
|
|
|
|
|
|
|
|||||||||
| $ | 20,061 | $ | 14,748 | $ | 5,313 | 36 | % | |||||||||
| Average Sales Prices: |
||||||||||||||||
| Oil (per Bbl) |
$ | 101.30 | $ | 90.96 | $ | 10.34 | 11 | % | ||||||||
| NGL (per Bbl) |
33.49 | 29.44 | 4.05 | 14 | % | |||||||||||
| Natural Gas (per Mcf) |
3.61 | 3.20 | 0.41 | 13 | % | |||||||||||
|
|
|
|
|
|
|
|
|
|||||||||
| Per Boe |
$ | 30.93 | $ | 25.78 | $ | 5.15 | 20 | % | ||||||||
| Operating Expenses: |
||||||||||||||||
| Production Expenses |
$ | 4,205 | $ | 3,529 | $ | 676 | 19 | % | ||||||||
| Production Taxes |
683 | 923 | (240 | ) | -26 | % | ||||||||||
| Expenses (per Boe): |
||||||||||||||||
| Production Expenses |
$ | 6.48 | $ | 6.17 | $ | 0.31 | 5 | % | ||||||||
| Production Taxes |
1.05 | 1.61 | (0.56 | ) | -35 | % | ||||||||||
| Net Producing Wells at Period End |
120 | 110 | 10 | 9 | % | |||||||||||
The following table sets forth selected operating data as reported for the three months ending:
| June 30, 2014 | June 30, 2013 | Change | % Change | |||||||||||||
| Operating Expenses: |
||||||||||||||||
| General and Administrative Expense |
||||||||||||||||
| (Including Share Based Compensation) |
$ | 3,242 | $ | 3,857 | $ | (615 | ) | -16 | % | |||||||
| Interest Expense |
865 | 926 | (61 | ) | -7 | % | ||||||||||
| Depletion of Oil and Gas Properties |
4,641 | 4,117 | 524 | 13 | % | |||||||||||
| Costs and Expenses (per Boe): |
||||||||||||||||
| General and Administrative Expense |
||||||||||||||||
| (Including Share Based Compensation) |
$ | 5.00 | $ | 6.74 | $ | (1.74 | ) | -26 | % | |||||||
| Interest Expense |
1.33 | 1.62 | (0.29 | ) | -18 | % | ||||||||||
| Depletion of Oil and Gas Properties |
7.16 | 7.20 | (0.04 | ) | -1 | % | ||||||||||
Page 19 of 39
Table of Contents
Oil, Natural Gas and NGL Sales:
Sales in all categories benefited from higher production, as compared to the prior year’s quarter. Equal initiated a one-rig program in January 2013 which was originally budgeted to drill 10 wells during the year. Better than anticipated efficiencies allowed the rig to drill 12 wells during the year. Nine of these wells were completed in 2013 and the final three wells were completed in January 2014. All 12 wells proved very successful, and with several being drilled in oilier parts of the play, we saw a significant jump in oil production as compared to the first quarter of 2013.
Oil Sales
Oil revenue was $2.9 million for the second quarter of 2014 as compared to $1.1 million for the same period last year. The $1.8 million increase was primarily a result of a 137% increase in daily production attributable to successful drilling in 2013, in addition to an 11% increase in average price, excluding commodity contracts.
Gas Sales
Gas revenue for the second quarter of 2014 was $6.6 million as compared to $5.4 million for the same period last year. The $1.2 million increase was primarily due to a 13% increase in average price, excluding commodity contracts, in addition to a 10% increase in daily production attributable to successful drilling in 2013. Price increases were largely consistent with the broad improvement of gas prices in the North American market.
NGL Sales
NGL revenue for the second quarter of 2014 was $10.5 million as compared to $8.2 million for the same period last year. The $2.3 million increase was a result of a 14% increase in average price, excluding commodity contracts, and a 12% increase in daily production. The higher realized prices were largely due to increases in NGL index prices at the Conway, KS hub. The increase in NGL production was attributable to successful drilling in 2013.
Production Expenses
Production expenses were $4.2 million for the second quarter of 2014 compared to $3.5 million for the same period last year. The $0.7 million increase was primarily attributable to the increase in daily production in the current quarter as compared to the same period last year. On a per unit-of-production basis, production expenses per boe increased from $6.17 in the second quarter of 2013 to $6.48 in the second quarter of 2014 primarily due to increased workover expenses.
Production Taxes
The company normally pays a base rate of 7% in production taxes based on realized oil, NGL and natural gas sales. Production taxes were $0.7 million for the second quarter of 2014 compared to $0.9 million for the same period last year. As a percentage of net sales, our production tax rates averaged 3.4% and 6.3% in the second quarter of 2014 and 2013, respectively. The average production tax rate for the second quarter of 2014 was lower than the same period last year due to new horizontal wells drilled in 2013 qualifying for a 48-month six percent Oklahoma production tax rate reduction. During the three months ended December 31, 2013, prior period errors were identified relating to the recording of tax rebates from the Oklahoma Tax Commission (“OTC”) for production activities in 2009, 2010 and 2011, together with the related recognition of deferred income tax assets and expenses. The final settlement with the OTC related to the prior period tax rebates resulted in a $0.4 million decrease of the estimated liability in the second quarter of 2014, which reduced second quarter 2014 production tax expense. Excluding this $0.4 million adjustment, production taxes would have been 5.2% of realized oil, NGL and natural gas sales.
Page 20 of 39
Table of Contents
Commodity Contracts
For the second quarter of 2014, Equal had a net loss on commodity contracts of $0.5 million as compared to a net gain of $3.5 million for the same period last year. The significant decrease in profit is due to higher commodity prices relative to contracted hedges. Equal made cash payments on settled derivatives of $0.7 million in the second quarter of 2014, as compared to $0.1 million for the same period last year. At June 30, 2014, all the derivative contracts were recorded at their fair value, which was a net liability of $1.1 million, an increase of $0.8 million from the $0.3 million of net liability recorded at December 31, 2013.
General and Administrative Expense
General and administrative expense was $3.2 million for the second quarter of 2014 as compared to $3.9 million for the same period last year, excluding discontinued operations. The $0.7 million decrease was due to the decrease in share-based compensation costs due primarily to 2013 forfeitures. On a per unit-of production basis, the general and administrative expense per boe was favorable at $5.00 for the second quarter of 2014 compared to $6.74 for the second quarter of 2013. This reduction in costs per boe is due to increased production and lower costs.
Depletion of Oil and Gas Properties
Depletion of oil and gas properties was $4.6 million, in the second quarter of 2014 as compared to $4.1 million for the same period last year. The $0.5 million increase in expense was attributable to increased production. On a per unit-of production basis, the depletion expense per boe was $7.16 for the second quarter of 2014 compared to $7.20 for the second quarter of 2013.
Interest Expense
Interest expense was $0.9 million for the second quarter of 2014 and for the same period last year, and is comprised of interest on the CAD $45 million, 6.75% convertible debentures and fees associated with the unused CAD $125 million credit facility.
Income Tax Provision
The provision for income tax expense was $1.5 million in the second quarter of 2014 and for the same period last year. The effective income tax rate differs from the statutory rate of 35% due to permanent differences, the change in valuation allowance, and AMT credits.
Page 21 of 39
Table of Contents
Results of Operations for the six months ended June 30, 2014, and June 30, 2013
For the six months ended June 30, 2014, Equal Energy’s production was from the Central Oklahoma properties.
The following table sets forth selected operating data for the periods indicated:
| (in thousands, except for boe/d) | Six months ended Central Oklahoma |
|||||||||||||||
| June 30, 2014 | June 30, 2013 | Change | % Change | |||||||||||||
| Net Production per Day: |
||||||||||||||||
| Oil (Bbl) |
282 | 147 | 135 | 92 | % | |||||||||||
| NGL (Bbl) |
3,423 | 3,083 | 340 | 11 | % | |||||||||||
| Natural Gas (Mcf) |
20,067 | 18,339 | 1,728 | 9 | % | |||||||||||
|
|
|
|
|
|
|
|
|
|||||||||
| Total (Boe/d) |
7,049 | 6,286 | 763 | 12 | % | |||||||||||
| Net Production: |
||||||||||||||||
| Oil (MBbl) |
51 | 27 | 24 | 89 | % | |||||||||||
| NGL (MBbl) |
620 | 558 | 62 | 11 | % | |||||||||||
| Natural Gas (MMcf) |
3,632 | 3,319 | 313 | 9 | % | |||||||||||
|
|
|
|
|
|
|
|
|
|||||||||
| Total (MBoe) |
1,276 | 1,139 | 137 | 12 | % | |||||||||||
| Net Sales: |
||||||||||||||||
| Oil Sales |
$ | 5,028 | $ | 2,433 | $ | 2,595 | 107 | % | ||||||||
| NGL Sales |
22,961 | 17,391 | 5,570 | 32 | % | |||||||||||
| Natural Gas Sales |
14,218 | 9,729 | 4,489 | 46 | % | |||||||||||
|
|
|
|
|
|
|
|
|
|||||||||
| $ | 42,207 | $ | 29,553 | $ | 12,654 | 43 | % | |||||||||
| Average Sales Prices: |
||||||||||||||||
| Oil (per Bbl) |
$ | 98.58 | $ | 91.58 | $ | 7.00 | 8 | % | ||||||||
| NGL (per Bbl) |
37.03 | 31.17 | 5.86 | 19 | % | |||||||||||
| Natural Gas (per Mcf) |
3.91 | 2.93 | 0.98 | 34 | % | |||||||||||
|
|
|
|
|
|
|
|
|
|||||||||
| Per Boe |
$ | 33.07 | $ | 25.98 | $ | 7.09 | 27 | % | ||||||||
| Operating Expenses: |
||||||||||||||||
| Production Expenses |
$ | 8,266 | $ | 6,984 | $ | 1,282 | 18 | % | ||||||||
| Production Taxes |
1,436 | 1,849 | (413 | ) | -22 | % | ||||||||||
| Expenses (per Boe): |
||||||||||||||||
| Production Expenses |
$ | 6.48 | $ | 6.14 | $ | 0.34 | 5 | % | ||||||||
| Production Taxes |
1.13 | 1.63 | (0.50 | ) | -31 | % | ||||||||||
| Net Producing Wells at Period End |
120 | 110 | 10 | 9 | % | |||||||||||
The following table sets forth selected operating data as reported for the six months ended:
| June 30, 2014 | June 30, 2013 | Change | % Change | |||||||||||||
| Operating Expenses: |
||||||||||||||||
| General and Administrative Expense |
||||||||||||||||
| (Including Share Based Compensation) |
$ | 6,554 | $ | 7,010 | $ | (456 | ) | -7 | % | |||||||
| Interest Expense |
1,744 | 1,875 | (131 | ) | -7 | % | ||||||||||
| Depletion of Oil and Gas Properties |
9,150 | 8,910 | 240 | 3 | % | |||||||||||
| Costs and Expenses (per Boe): |
||||||||||||||||
| General and Administrative Expense |
||||||||||||||||
| (Including Share Based Compensation) |
$ | 5.13 | $ | 6.16 | $ | (1.03 | ) | -17 | % | |||||||
| Interest Expense |
1.37 | 1.65 | (0.28 | ) | -17 | % | ||||||||||
| Depletion of Oil and Gas Properties |
7.17 | 7.83 | (0.66 | ) | -8 | % | ||||||||||
Page 22 of 39
Table of Contents
Oil, Natural Gas and NGL Sales:
Sales in all categories benefited from higher production, as compared to the prior year’s quarters. Equal initiated a one-rig program in January 2013 which was originally budgeted to drill 10 wells during the year. Better than anticipated efficiencies allowed the rig to drill 12 wells during the year. Nine of these wells were completed in 2013 and the final three wells were completed in January 2014. All 12 wells proved very successful, and with several being drilled in oilier parts of the play, we saw a significant jump in oil production as compared to the first half of 2013.
Oil Sales
Oil revenue was $5.0 million for the first half of 2014 as compared to $2.4 million for the same period last year. The $2.6 million increase was primarily a result of a 92% increase in daily production attributable to successful drilling in 2013, in addition to an 8% increase in average price, excluding commodity contracts.
Gas Sales
Gas revenue for the first half of 2014 was $14.2 million as compared to $9.7 million for the same period last year. The $4.5 million increase was primarily due to a 34% increase in average price, excluding commodity contracts, in addition to a 9% increase in daily production attributable to successful drilling in 2013. Price increases were largely consistent with the broad improvement of gas prices in the North American market.
NGL Sales
NGL revenue for the first half of 2014 was $23.0 million as compared to $17.4 million for the same period last year. The $5.6 million increase was a result of a 19% increase in average price, excluding commodity contracts, in addition to an 11% increase in daily production. The higher realized prices were largely due to increases in NGL index prices at the Conway, KS hub. The increase in NGL production was attributable to successful drilling in 2013.
Production Expenses
Production expenses were $8.3 million for the first half of 2014 compared to $7.0 million for the same period last year. The $1.3 million increase was due primarily to a 12% increase in daily production in the current year as compared to the same period last year. On a per unit-of-production basis, production expenses per boe increased from $6.14 in the first half of 2013 to $6.48 in the first half of 2014 primarily due to increased workover expenses.
Production Taxes
The company normally pays a base rate of 7% in production taxes based on realized oil, NGL and natural gas sales. Production taxes were $1.4 million for the first half of 2014 compared to $1.8 million for the same period last year. As a percentage of net sales, our production tax rates averaged 3.4% and 6.3% in the first half of 2014 and 2013, respectively. The average production tax rate for the first half of 2014 was lower than the same period last year due to new horizontal wells drilled in 2013 qualifying for a 48-month six percent Oklahoma production tax rate reduction. During the three months ended December 31, 2013, prior period errors were identified relating to the recording of tax rebates from the Oklahoma Tax Commission for production activities in 2009, 2010 and 2011, together with the related recognition of deferred income tax assets and expenses. The final settlement with the OTC related to the prior period tax rebates resulted in a $0.8 million decrease of the estimated liability in the first half of 2014, which reduced 2014 production tax expense. Excluding this $0.8 million adjustment, production taxes would have been 5.2% of realized oil, NGL and natural gas sales.
Commodity Contracts
For the first half of 2014, Equal had a net loss on commodity contracts of $2.6 million as compared to a net gain of $0.2 million for the same period last year. The significant decrease in profit is due to higher commodity prices relative to contracted hedges. Equal made cash payments on settled derivatives of $1.8 million in the first half of 2014, as compared to $0.1 million for the same period last year. At June 30, 2014, all the derivative contracts were recorded at their fair value, which was a net liability of $1.1 million, an increase of $0.8 million from the $0.3 million of net liability recorded at December 31, 2013.
General and Administrative Expense
General and administrative expense was $6.6 million for the first half of 2014 as compared to $7.0 million for the same period last year, excluding discontinued operations. The $0.4 million decrease was due primarily to the decrease in share-based compensation costs due to 2013 forfeitures. On a per unit-of production basis, the general and administrative expense per boe was favorable at $5.13 for the first half of 2014 compared to $6.16 for the first half of 2013. This reduction in costs per boe is due to increased production and lower costs.
Page 23 of 39
Table of Contents
Depletion of Oil and Gas Properties
Depletion of oil and gas properties was $9.2 million, in the first half of 2014 as compared to $8.9 million for the same period last year. The $0.3 million decrease in depletion expense was attributable to increased production. On a per unit-of production basis, the depletion expense per boe was $7.17 for the first half of 2014 compared to $7.83 for the same period last year.
Interest Expense
Interest expense was $1.7 million for the first half of 2014 as compared to $1.9 million for the same period last year, and is comprised of interest on the CAD $45 million, 6.75% convertible debentures and fees associated with the unused CAD $125 million credit facility.
Income Tax Provision
The provision for income tax expense was $3.3 million in the first half of 2014 as compared to $0.7 million for the same period last year. The increase in income tax expense relates primarily to increased earnings during the current period compared to the same period in the previous year. The effective income tax rate differs from the statutory rate of 35% due to permanent differences, the change in valuation allowance, and AMT credits.
LIQUIDITY & CAPITAL RESOURCES
Development activities and acquisitions may be funded internally through cash flow from operations or through external sources such as debt or the issuance of equity. The Company finances its operations and capital activities primarily with funds generated from operating activities, but also through the issuance of shares, debentures and borrowing from its credit facility. The Company believes its sources of cash, including bank debt and funds from operations, will be sufficient to fund its operations and capital expenditure program as projected for 2014. However, Equal’s ability to fund its operations will also depend upon operating performance and is subject to commodity prices and other economic conditions which may be beyond its control. Therefore, the Company will closely monitor commodity prices and adjust the 2014 capital expenditure program accordingly. The Company operates substantially all of its drilling programs and as a result, can control the pace and targets of its capital spending to react quickly to changes in cash flow to ensure ongoing financial flexibility. See Note 13, Subsequent Events, for discussion regarding the acquisition of all of the Company’s issued and outstanding common shares on July 31, 2014, which also resulted in the cancellation of the bank credit facility and unwinding of all of the company’s crude oil and natural gas commodity derivative contracts, among other significant changes.
Equal’s capital structure at June 30, 2014, was as follows:
| June 30, 2014 | ||||||||
| Capitalization (in thousands, except percentages) |
Amount | % | ||||||
| Adjusted working capital surplus (1) |
$ | (25,243 | ) | -12 | % | |||
| Convertible debentures |
42,174 | 20 | % | |||||
| Shares issued, at market (2) |
195,636 | 92 | % | |||||
|
|
|
|
|
|||||
| Total capitalization |
$ | 212,568 | 100 | % | ||||
|
|
|
|
|
|||||
| (1) | See working capital discussion below |
| (2) | The market price of Equal’s shares on June 30, 2014 was $5.42 per share. |
Page 24 of 39
Table of Contents
| Cash Flow from Operating, Investing and Financing Activities (in thousands) |
Six months ended June 30, | |||||||
| 2014 | 2013 | |||||||
| Cash provided by operating activities – continuing operations |
$ | 22,373 | $ | 18,301 | ||||
| Cash used in operating activities – discontinued operations |
(287 | ) | (2,756 | ) | ||||
|
|
|
|
|
|||||
| Cash provided by operating activities |
$ | 22,086 | $ | 15,545 | ||||
|
|
|
|
|
|||||
| Cash used in investing activities |
$ | (10,329 | ) | $ | (14,644 | ) | ||
|
|
|
|
|
|||||
| Cash used in financing activities |
$ | (1,805 | ) | $ | (3,559 | ) | ||
|
|
|
|
|
|||||
The $6.5 million increase in cash provided by operating activities was primarily due to a $4.3 million increase in net income from continuing operations. The $4.3 million decrease in cash used in investing activities was primarily due to the decrease in drilling activity, as compared to the same period last year. The $1.8 million decrease in cash used in financing activities was due to cash dividends paid in each of the first two quarters of 2013, for which there was only one dividend payment during the current year.
Long-term Debt
Other than the convertible debentures described below under “Convertible Debentures,” Equal had no outstanding long-term debt at June 30, 2014. The Company’s syndicated bank credit facility is CAD $125.0 million and is comprised of a CAD $105.0 million revolving credit facility and a CAD $20.0 million operating credit facility, all of which are secured against the borrowing base of the Oklahoma assets and can be borrowed against in either Canadian dollars or the United States dollar equivalent.
As further described in Note 13, Subsequent Events, on July 31, 2014, the Company was acquired by and became a wholly owned subsidiary of Petroflow Energy Corporation. See Note 13, Subsequent Events, for further information.
Working Capital
The adjusted working capital and net debt (debt less adjusted working capital), was $16.9 million and $29.5 million at June 30, 2014 and December 31, 2013, respectively. This increase in adjusted working capital was primarily due to cash provided by operations.
| Adjusted Working Capital (in thousands) |
June 30, 2014 | December 31, 2013 | ||||||
| Current assets |
$ | (38,786 | ) | $ | (30,263 | ) | ||
| Current liabilities |
14,637 | 17,753 | ||||||
| Current liability related to commodity contracts |
(1,094 | ) | (341 | ) | ||||
|
|
|
|
|
|||||
| Adjusted working capital |
(25,243 | ) | (12,851 | ) | ||||
| Convertible debentures |
42,174 | 42,309 | ||||||
|
|
|
|
|
|||||
| Net debt (debt less adjusted working capital) |
$ | 16,931 | $ | 29,458 | ||||
|
|
|
|
|
|||||
Convertible Debentures
As of June 30, 2014, Equal had CAD $45.0 million or US $42.2 million of 6.75% convertible debentures (EQU.DB.B) outstanding. The 6.75% convertible debentures are convertible into common shares of Equal and had a conversion price of CAD $8.47 per common share as of June 30, 2014. Each CAD $1,000 principal amount of EQU.DB.B debentures is convertible into Equal common shares. The total outstanding amount is convertible into approximately 5.3 million Equal common shares and matures on March 31, 2016.
Page 25 of 39
Table of Contents
Stockholders’ Equity
Equal’s capital structure is comprised of common shares and convertible debt. Equal also has common shares outstanding under its stock option plan and restricted share plan. The following table outlines the outstanding equity instruments:
| Outstanding Equity Data (in thousands) |
June 30, 2014 | December 31, 2013 | ||||||
| Shares |
36,095 | 35,806 | ||||||
| Share options |
289 | 289 | ||||||
| Restricted shares |
674 | 981 | ||||||
| 6.75% convertible debentures (CAD$1,000 per debenture) |
$ | 42,174 | $ | 42,309 | ||||
As a result of voting at the Company’s shareholders meeting in May 2013, no shares are currently available for future grants under the Company’s equity plans for its employees.
As further described in Note 13, Subsequent Events, on July 31, 2014, the Company was acquired by and became a wholly owned subsidiary of Petroflow Energy Corporation. See Note 13, Subsequent Events, for further information.
OUTLOOK
Equal increased its capital program in mid-May and incurred incremental general and administrative costs in accordance with the Arrangement Agreement through July 31, 2014. Although Equal has pursued selective drilling during this period, we have maintained cost discipline and a strong balance sheet. We believe our sources of cash, including cash on hand, cash flow and our undrawn credit facility will be sufficient to fund our operations and capital expenditures for at least the next 12 months.
Commitments and Contingencies
For a discussion of our commitments and contingencies, please refer to Note 11 — Contingencies under Item 1 in this Quarterly Report, which is incorporated herein by reference.
Off Balance Sheet Arrangements
The Company did not have any off balance sheet arrangements, as defined in Item 303(a)(4)(ii) of Regulation S-K at June 30, 2014, and December 31, 2013.
Critical Accounting Policies and Estimates
The preparation of financial statements in accordance with U.S. generally accepted accounting principles (U.S. GAAP) requires management to make estimates and judgments that affect the reported amounts of assets, liabilities, revenues and expenses. Certain of the Company’s accounting policies are considered critical, as these policies are the most important to the depiction of the Company’s financial statements and require significant, difficult or complex judgments, often employing the use of estimates about the effects of matters that are inherently uncertain. A summary of the Company’s significant accounting policies is included in Note 2 to the Company’s consolidated financial statements included in our annual report on Form 10-K for the year ended December 31, 2013, as well as in the Management’s Discussion and Analysis of Financial Condition and Results of Operations section in such Form 10-K, which summary is qualified by the updates set forth below. The updated disclosures set forth below have been included solely to clarify our actual treatment with respect to the applicable topics and do not reflect any change in accounting treatment relating thereto.
Impairment of Oil and Gas Properties
Under the full cost method of accounting, capitalized oil and gas property costs less accumulated depletion and net of deferred income taxes, may not exceed an amount equal to the present value, discounted at 10%, of estimated future net revenues from proved oil and gas reserves plus the cost of unproved properties not subject to amortization. Should capitalized costs exceed this ceiling, impairment is recognized. If natural gas or NGL prices decrease from current levels, we may incur full-cost ceiling write-downs, or additional DD&A, related to our oil and gas properties in future periods
Wells in Progress
Wells in progress represent the costs associated with wells that have not reached total depth or been completed as of period end. These costs are related to wells that are classified as both proved and unproved. Costs related to wells that are classified as proved are included in the depletion base. Costs associated with wells that are classified as unproved are excluded from the depletion base. The costs for unproved wells are then transferred to proved property when proved reserves are determined. Such costs then become subject to depletion.
Page 26 of 39
Table of Contents
| ITEM 3. | QUANTITATIVE AND QUALITATIVE DISCLOSURES ABOUT MARKET RISK |
Commodity Price Risk
Our primary market risk is the volatility of oil, NGL and natural gas prices. The market prices for oil, NGL and natural gas have been highly volatile and are likely to continue to be highly volatile in the future, which will impact our prospective revenues from the sale of products or properties. We manage this commodity price risk exposure through the use of derivative financial instruments entered into with third-parties. Currently, we utilize swaps to reduce the effect of price changes on a portion of our future oil production. We do not enter into derivative instruments for trading purposes.
Equal’s most significant market risk relates to the prices it receives for its natural gas and NGL production. Oil represents only 4% of total production so volatility of oil prices has a small effect. Due to the historical price volatility of these commodities, Equal periodically has entered into natural gas and oil derivative arrangements, and expects in the future to enter into derivative arrangements, for the purpose of reducing the variability of natural gas and NGL prices Equal receives for its production. The Company’s credit facility limits its ability to enter into derivative transactions for a maximum term of 3 years and up to 65% of expected production volumes. At June 30, 2014, commodity contracts with various counterparties equaled approximately 69% of the Company’s production.
The Company uses, and may continue to use, a variety of commodity-based derivative contracts, including fixed price swaps, collars and basis swaps. At June 30, 2014, the Company’s commodity derivative contracts consisted of fixed price swaps for natural gas and fixed price swaps for oil and natural gas liquids, which are described below:
| Fixed price swaps |
The Company receives a fixed price for the contract and pays a floating market price to the counterparty over a specified period for a contracted volume. |
The Company’s natural gas fixed price swap transactions are settled based upon NYMEX prices, and the Company’s natural gas basis swap transactions are settled based upon the index price of natural gas at the Southern Star pipeline delivery point in Oklahoma compared to NYMEX prices. The Company’s natural gas contracts are settled based upon the NYMEX prices on the last commodity business day for the relevant contract period. Settlement for oil derivative contracts occurs in the succeeding month or quarter and natural gas derivative contracts are settled in the production month or quarter.
The Company records all derivative contracts at fair value, which reflects changes in commodity prices. Changes in fair values of the Company’s derivative contracts are recognized as unrealized gains or losses in current period earnings. As a result, the Company’s current period earnings may be significantly affected by changes in the fair value of its commodity derivative contracts. Changes in fair value are principally measured based on period-end prices compared to the contract price. For further details regarding our derivative contracts please refer to Note 9 — Commodity Contracts under Item 1 in this Quarterly Report.
The following sensitivities show the result to pre-tax net income for three months ended June 30, 2014, related to commodity contracts of the respective changes in crude oil, liquids, natural gas and fixed basis differential.
| Increase (decrease) to pre-tax income | ||||||||
| Decrease in market price | Increase in market price | |||||||
| ($1.00 per bbl and | ($1.00 per bbl and | |||||||
| (in thousands of dollars) |
$0.50 per mcf) | $0.50 per mcf) | ||||||
| Crude oil and NGL derivative contracts |
92 | (92 | ) | |||||
| Natural gas derivative contracts |
2,200 | (2,200 | ) | |||||
Credit Risk
All of the Company’s commodity contract transactions have been carried out in the over-the-counter market. The use of derivative transactions in over-the-counter markets involves the risk that the counterparties may be unable to meet the financial terms of the transactions. The counterparties for all of the Company’s derivative transactions have an “investment grade” credit rating. The Company monitors on an ongoing basis the credit ratings of its derivative counterparties. The Company’s derivative contracts are primarily with its lead bank for its credit facility.
Page 27 of 39
Table of Contents
A default by the Company under its credit facility constitutes a default under its derivative contracts with counterparties that are lenders under the senior credit facility. The Company does not require collateral or other security from counterparties to support derivative instruments. The Company has master netting agreements with all of its derivative contract counterparties, which allows the Company to net its derivative assets and liabilities with the same counterparty. As a result of the netting provisions, the Company’s maximum amount of loss under derivative transactions due to credit risk is limited to the net amounts due from the counterparties under the derivatives. The Company’s loss is further limited as any amounts due from a defaulting counterparty that is a lender under the senior credit facility can be offset against amounts owed to such counterparty under the Company’s senior credit facility. As of June 30, 2014, the counterparties to the Company’s open derivative contracts consisted of three financial institutions, two of which are also lenders under the Company’s senior credit facility. The Company is not required to post additional collateral under derivative contracts.
As further described in Note 13, Subsequent Events, on July 31, 2014, the Company was acquired by and became a wholly owned subsidiary of Petroflow Energy Corporation. See Note 13, Subsequent Events, for further information.
Interest Rate Risk
The Company is subject to interest rate risk on its long-term fixed and variable interest rate borrowings. Fixed rate debt, where the interest rate is fixed over the life of the instrument, exposes the Company to (i) changes in market interest rates reflected in the fair value of the debt and (ii) the risk that the Company may need to refinance maturing debt with new debt at a higher rate. Variable rate debt, where the interest rate fluctuates, exposes the Company to short-term interest rate fluctuations as its interest obligations on these instruments are periodically re-determined based on prevailing market interest rates, primarily the LIBOR rate. The Company had neither variable rate debt nor interest rate derivative contracts outstanding at June 30, 2014.
As further described in Note 13, Subsequent Events, on July 31, 2014, the Company was acquired by and became a wholly owned subsidiary of Petroflow Energy Corporation. See Note 13, Subsequent Events, for further information.
| ITEM 4. | CONTROLS AND PROCEDURES |
Disclosure Controls and Procedures
The Company maintains a set of disclosure controls and procedures designed to ensure that information required to be disclosed by the Company in reports that it files or submits under the Securities Exchange Act of 1934 (the “Exchange Act”) is recorded, processed, summarized and reported within the time periods specified in SEC rules and forms. The disclosure controls and procedures are also designed with the objective of ensuring such information is accumulated and communicated to the Company’s management, including the Chief Executive Officer (“CEO”) and Chief Financial Officer (“CFO”), as appropriate, to allow timely decisions regarding required disclosures. In designing and evaluating the disclosure controls and procedures, management recognized that disclosure controls and procedures, no matter how well conceived and operated, can provide only reasonable, not absolute, assurance that the objectives of the disclosure controls and procedures are met. Additionally, in designing the disclosure controls and procedures, the Company’s management was required to apply its judgment in evaluating the cost-benefit relationship of possible disclosure controls and procedures.
As required by SEC Rule 13a-15(b), the Company carries out an evaluation, under the supervision and with the participation of the Company’s management, including the CEO and CFO, of the effectiveness of the design and operation of the Company’s disclosure controls and procedures as of the end of each quarter. Based on the quarterly evaluation, the CEO and CFO have concluded that the Company’s disclosure controls and procedures were not effective at the reasonable assurance level as of the end of the quarter covered by this report due to the existence of the following material weaknesses. A material weakness is a deficiency, or a combination of deficiencies, in internal control over financial reporting, such that there is a reasonable possibility that a material misstatement of our annual or interim financial statements will not be prevented or detected on a timely basis.
| — | The Company did not maintain a sufficient complement of qualified personnel with U.S. GAAP knowledge necessary to ensure appropriate accounting for share-based compensation (including modification of awards and timely recognition of expense), calculation and recognition of changes in the asset retirement obligations and evaluation of information related to a production tax incentive program. In addition, the Company did not design and implement appropriate review controls related to recognition and measurement of share-based compensation and asset retirement obligations. |
| — | The Company did not design and implement appropriate controls over the completeness, existence and accuracy of accrued liabilities and accounts receivable related to its ownership interests in wells being drilled. |
| — | The Company did not maintain effective internal controls over information technology systems to properly restrict access to record manual journal entries, including the review and approval of manual journal entries. |
Changes in Internal Control over Financial Reporting
There were no changes in our internal control over financial reporting, other than as described below, that occurred during the three months ended June 30, 2014, that have materially affected, or are reasonably likely to materially affect, our internal control over financial reporting.
Page 28 of 39
Table of Contents
During the three months ended June 30, 2014, we continued to take steps to remediate the material internal control weaknesses described above and previously identified in our 2013 Form 10-K including:
| — | Developing or updating accounting policies, schedules and procedures related to share-based compensation, asset retirement obligations, production tax and accrued liabilities and accounts receivables related to ownership in wells being drilled. |
| — | Engaging additional professional accounting resources on a consulting basis to assist with the review of certain complex accounting policies and procedures. |
| — | Implementing internal controls over information technology systems to restrict access to manual journal entries. |
Plan of Remediation of Material weaknesses
In addition to the changes in internal controls over financial reporting discussed above, management believes the following corrective actions are reasonably likely to materially improve our controls and procedures as they are designed to remediate the material weaknesses as discussed above:
| — | We have enhanced the supervisory procedures that include additional levels of analysis and quality control reviews within the accounting and financial reporting functions specifically related to the areas where material weaknesses in internal control were identified for the year ended December 31, 2013. |
| — | We have undertaken a recruiting initiative to add two senior supervisory personnel with the responsibility for, among other things, review of all critical accounting processes. |
| ITEM 1. | LEGAL PROCEEDINGS |
Equal is party to various legal actions arising in the normal course of business. Matters that are probable of unfavorable outcome to Equal and which can be reasonably estimated are accrued. Such accruals are based on information known about the matters, Equal’s estimates of the outcomes, and its experience in contesting, litigating and settling similar matters. To management’s knowledge, there were no pending legal proceedings which would result in amounts material to Equal’s financial position or results of operations. Actual amounts could differ materially from management’s estimates.
For a detailed description of certain legal proceedings, see Item 1, Note 11 in this Form 10-Q and Part I, Item 3 – Legal Proceedings in the Company’s Annual Report on Form 10-K for the year ended December 31, 2013.
| ITEM 1A. | RISK FACTORS |
An investment in a company engaged in oil and gas exploration involves a high amount of risk, unknown and known, present and potential, including the risks enumerated below. An investment in our securities is speculative and subject to a number of known and unknown risks. Only those persons who can bear the risk of the entire loss of their investment should purchase our securities. An investor should carefully consider the risks described below and the other information that we file with the SEC and with Canadian securities regulators before investing in our common shares. The risks described below are not the only ones we face, as additional risks that we are not currently aware of or that we currently believe are immaterial may become important factors that affect our business. The risk factors set forth below and elsewhere in this Form 10-Q, and the risks discussed in our other filings with the SEC and Canadian securities regulators, may have a significant effect on our business, financial condition and/or results of operations and could cause our actual results to differ materially from those projected in any forward-looking statements. See “Forward-Looking Statements” in this Form 10-Q.
Our failure to successfully address the risks and uncertainties described below would have a material adverse effect on our business, financial condition and/or results of operations, and the trading price of our common shares may decline and investors may lose all or part of their investment. We cannot assure you that we will successfully address these risks or other unknown risks that may affect our business.
Page 29 of 39
Table of Contents
If we are unable to find, acquire, develop and commercially produce oil and natural gas reserves, our reserves and production will decline, which will adversely affect our business, financial results and stock price and could eventually result in us having to cease operations.
The long-term commercial success of Equal depends on our ability to find, acquire, develop and commercially produce oil and natural gas reserves. Without the continual addition of new reserves, our production will decline over time as existing reserves are exploited. A future increase in our reserves will depend not only on our ability to explore and develop any properties we may have from time to time, but also on our ability to select and acquire suitable producing properties or prospects on satisfactory terms. If we are unable to discover additional commercial quantities of oil and natural gas, if we are unable to locate satisfactory properties for acquisition or participation, or if we determine that current markets, terms of acquisition or pricing conditions make such acquisitions or participations uneconomic, we will be unable to replace our reserves and our production will decline over time, which would affect our business, financial results and stock price, and could eventually result in our company ceasing operations.
Oil and gas exploration, development and production operations have a high degree of risk, and realization of the associated risks could adversely affect our business or result in increased costs or liability.
Oil and natural gas exploration, development and production operations are subject to all the risks and hazards typically associated with such operations, including hazards such as fire, explosion, blowouts, cratering, sour gas releases and spills, each of which could result in substantial damage to oil and natural gas wells, production facilities, other property and the environment or personal injury. In particular, Equal could explore for and produce sour natural gas in certain areas. An unintentional leak of sour natural gas could result in personal injury, loss of life or damage to property and may necessitate an evacuation of populated areas, all of which could result in liability to the Company.
In accordance with industry practice, Equal is not fully insured against all of these risks, as not all such risks are insurable. The nature of these risks is such that liabilities, if insured against, could exceed insurance policy limits in which event Equal could incur significant costs that could have a material adverse effect upon our financial condition. Oil and natural gas production operations are also subject to all the risks typically associated with such operations, including encountering unexpected formations or pressures, premature decline of reservoirs and the invasion of water into producing formations, the occurrence of any of which could result in significant costs for Equal.
Future oil and natural gas exploration may involve unprofitable efforts, not only from dry wells, but also from wells that are productive but do not produce sufficient petroleum substances to return a profit after drilling, operating and other costs. Completion of a well does not assure a profit on the investment or recovery of drilling, completion and operating costs. In addition, drilling hazards or environmental damage could greatly increase the cost of operations, and various field operating conditions may adversely affect the production from successful wells. These conditions include delays in obtaining governmental approvals or consents, shut-ins of connected wells resulting from extreme weather conditions, insufficient storage or transportation capacity or other geological and mechanical conditions. Production delays and declines from normal field operating conditions cannot be eliminated and can be expected to adversely affect revenue and cash flow levels to varying degrees.
While we currently operate approximately 99% of our production, we do not operate all of the assets in which we have an interest and could enter into material non-operator positions in the future, and we therefore cannot ensure that those assets, or potential assets, will be operated in a manner favorable to us.
Other companies operate a small portion of the assets in which we have an interest. As a result, Equal has limited ability to exercise influence over the operation of these assets or their associated costs. The limited scope of these assets makes it unlikely they could adversely affect our financial performance. Equal’s return on assets operated by others depends upon a number of factors that may be outside of our control, including the timing and amount of capital expenditures, the operator’s expertise and financial resources, the approval of other participants, the selection of technology and risk management practices.
Our ability to successfully execute projects and market oil and natural gas depends upon factors beyond our control, and as a result of these factors we might not be able to execute projects on time, on budget or at all, and we might not be able to effectively market our oil and natural gas.
Equal manages a variety of small and large projects in the conduct of our business. Project delays may delay expected revenues from operations. Significant project cost over-runs could make a project uneconomic. Our ability to execute projects and market oil and natural gas depends upon numerous factors beyond the Company’s control, including:
| — | the availability of processing capacity; |
| — | the availability and proximity of pipeline capacity; |
Page 30 of 39
Table of Contents
| — | operational risks associated with pipelines and processing facilities; |
| — | the availability of storage capacity; |
| — | the supply of and demand for oil and natural gas; |
| — | the availability of alternative fuel sources; |
| — | the effects of inclement weather and natural disasters; |
| — | the availability of drilling and related equipment; |
| — | unexpected cost increases; |
| — | accidental events; |
| — | currency fluctuations; |
| — | changes in regulations; |
| — | the availability and productivity of skilled labor; and |
| — | the regulation of the oil and natural gas industry by various levels of government and governmental agencies. |
| — | Because of these factors, Equal might not be able to execute projects on time, on budget or at all, and may not be able to effectively market the oil and natural gas that we produce. |
Oil, Natural Gas and NGL prices are volatile, and a sustained price drop would have an adverse effect on the carrying value of our proved reserves, and our borrowing capacity, revenues, profitability and cash flows from operations.
The marketability and price of oil and natural gas that may be acquired or discovered by Equal is and will continue to be affected by numerous factors beyond our control. Equal’s ability to market our oil and natural gas may depend upon our ability to acquire space on pipelines that deliver natural gas to commercial markets. Equal may also be affected by deliverability uncertainties related to the proximity of our reserves to pipelines and processing and storage facilities and operational problems affecting such pipelines and facilities as well as extensive government regulation relating to price, taxes, royalties, allowable production, the export of oil and natural gas and many other aspects of the oil and natural gas business.
Equal’s revenues, profitability and future growth and the carrying value of our oil and gas properties are substantially dependent upon prevailing prices of oil and gas. Our ability to borrow and to obtain additional capital on attractive terms is also substantially dependent upon oil and gas prices. Prices for oil and gas are subject to large fluctuations in response to relatively minor changes in the supply of and demand for oil and gas, market uncertainty and a variety of additional factors beyond the control of the Company. These factors include economic conditions in the United States, Canada, the actions of the OPEC and Russia, governmental regulation, political stability in the Middle East and elsewhere, the foreign supply of oil and gas, the price of foreign imports and the availability of alternative fuel sources.
Volatile oil and gas prices make it difficult to estimate the value of producing properties for acquisition and often cause disruption in the market for oil and gas producing properties, as buyers and sellers have difficulty agreeing on such value. Price volatility also makes it difficult to budget for and project the return on acquisitions and development and exploitation projects.
In addition, bank borrowings available to Equal are in part determined by our borrowing base. A sustained material decline in prices from historical average prices could reduce Equal’s borrowing base, therefore reducing the bank credit available to us which could require that a portion, or all, of our bank debt be repaid.
Any substantial and extended decline in the price of oil and gas would have an adverse effect on Equal’s carrying value of our proved reserves, borrowing capacity, revenues, profitability and cash flows from operations.
We anticipate making substantial capital expenditures for future acquisition, exploration, development and production projects. We might not be able to obtain capital or financing necessary to support these projects on satisfactory terms, or at all.
Equal anticipates making substantial capital expenditures for the acquisition, exploration, development and production of oil and natural gas reserves in the future. If our revenues or reserves decline, it may limit our ability to expend or access the capital necessary to undertake or complete future drilling programs. Debt or equity financing, or cash generated by operations, might not be available to us or might not be sufficient to meet our requirements for capital expenditures or for other corporate purposes. Even if debt or equity
Page 31 of 39
Table of Contents
financing is available, it might not be available on terms acceptable to us. The inability of Equal to access sufficient capital for our operations could have a material adverse effect on our financial condition, results of operations and prospects. The market events and conditions witnessed over the past several years, including disruptions in the international credit markets and other financial systems and the deterioration of global economic conditions, have caused significant volatility in commodity prices. Equal could face restricted access to capital and increased borrowing costs, which would have an adverse effect on the Company, as our ability to make future capital expenditures is dependent upon, among other factors, the overall state of the capital markets and investor appetite for investments in the energy industry generally and Equal’s securities in particular.
We could be required to raise capital in order to fund our operations. We might not be able to obtain capital or financing on satisfactory terms, or at all.
Equal’s cash flow from our producing reserves might not be sufficient to fund our ongoing activities at all times. From time to time, we might require additional financing in order to carry out our acquisition, exploration and development activities. Failure to obtain such financing on a timely basis could cause the Company to forfeit our interest in certain properties, miss certain acquisition opportunities and reduce or terminate our operations. If revenues from our reserves decrease as a result of lower oil and natural gas prices or otherwise, it will affect Equal’s ability to expend the necessary capital to replace our reserves or to maintain our production. If our cash flow from operations is not sufficient to satisfy our capital expenditure requirements, additional debt or equity financing might not be available to meet these requirements or be available on satisfactory terms.
Our substantial level of indebtedness could have a material adverse effect on our financial condition.
We will have a substantial amount of indebtedness. We are expected to be domesticated as a U.S. subsidiary of Petroflow within thirty days from the effective day of the Arrangement. Concurrently with this domestication, we will become guarantors of $353 million of total indebtedness of Petroflow Energy Corporation and TexOak Energy-Project 1C, LLC under a $250 million first lien credit agreement (the “First Lien Credit Agreement”) and a $103 million second lien credit agreement (the “Second Lien Credit Agreement” and, together with the First Lien Credit Agreement, the “Credit Agreements” and each a “Credit Agreement”). Our high level of indebtedness could have important consequences to you, including the following:
| — | our ability to obtain additional financing for working capital, capital expenditures, acquisitions or general corporate purposes may be impaired; |
| — | we must use a substantial portion of our cash flow from operations to pay interest on our indebtedness, which will reduce the funds available to us for other purposes such as capital expenditures; |
| — | we may be limited in our ability to borrow additional funds; |
| — | we may have a higher level of indebtedness than some of our competitors, which may put us at a competitive disadvantage and reduce our flexibility in planning for, or responding to, changing conditions in our industry, including increased competition; and |
| — | we may be more vulnerable to economic downturns and adverse developments in our business. |
In addition, we may incur more debt. The Credit Agreements do not completely prohibit us from incurring additional debt. Incurring such additional debt could increase the risks associated with our substantial indebtedness described above.
We expect to utilize borrowings under the Credit Agreements and other financing arrangements and cash flow from operations, if any, to pay our expenses. Our ability to pay our expenses thus depends, in part, on our future performance, which will be affected by financial, business, economic and other factors. We will not be able to control many of these factors, such as economic conditions in the markets where we operate and pressure from competitors. We cannot be certain that our borrowing capacity or future cash flows will be sufficient to allow us to pay interest on our indebtedness and meet our other obligations. If we fail to generate cash flow in the future and do not have enough liquidity to pay our obligations, we may be required to refinance all or part of our existing debt, sell assets or borrow more money. We cannot guarantee that we will be able to do so on terms acceptable to us, or at all. In addition, the terms of our existing or future debt agreements, including the Credit Agreements, may restrict us from pursuing any of these alternatives.
Page 32 of 39
Table of Contents
The Credit Agreements impose significant operating and financial restrictions, which may prevent us from capitalizing on business opportunities and taking certain corporate actions.
The Credit Agreements impose, and any future financing agreements that we may enter into will likely impose, significant operating and financial restrictions on us, including certain limitations on capital expenditures. These restrictions may limit our ability to finance future operations or capital needs or to engage in additional business activities or expand or pursue our existing business activities, including our ability to:
| — | incur additional indebtedness; |
| — | create liens or other encumbrances; |
| — | pay dividends or make certain other payments, investments, loans and guarantees; and |
| — | sell or otherwise dispose of assets and merge or consolidate with another entity. |
In addition, the Credit Agreements require us and our affiliates to meet certain financial ratios and financial condition tests. Events beyond our control could affect our ability to meet these financial ratios and financial condition tests. Failure to comply with these obligations could cause an event of default under the Credit Agreements. If an event of default occurs, our lenders could elect to declare all amounts outstanding under the Credit Agreements, including accrued and unpaid interest and applicable prepayment premiums, to be immediately due and payable; the lenders could foreclose upon the assets securing the Credit Agreements, which could have a material adverse effect on our business and prospects.
Our exploration and development activities could be delayed if drilling and related equipment is unavailable or if access to drilling locations is restricted. These events could have an adverse effect on our business and profitability.
Oil and natural gas exploration and development activities depend upon the availability of drilling and related equipment (typically leased from third parties) in the particular areas where such activities will be conducted. Demand for such limited equipment or access restrictions may affect the availability of such equipment to the Company and may delay exploration and development activities. To the extent we are not the operator of our oil and gas properties, the Company will be dependent on such operators for the timing of activities related to such properties and will be largely unable to direct or control the activities of the operators.
We are exposed to potential liabilities that may not be covered, in whole or in part, by insurance.
Equal’s involvement in the exploration for and development of oil and natural gas properties may result in the Company becoming subject to liability for pollution, blow-outs, property damage, personal injury or other hazards. Although prior to conducting drilling and other field activities the Company will obtain insurance in accordance with industry standards to address such risks, such insurance has limitations on liability that may not be sufficient to cover the full extent of such liabilities. In addition, all such risks may not be insurable or, in certain circumstances, the Company may elect not to obtain insurance to deal with specific risks due to the high premiums associated with such insurance or other reasons. The payment of such uninsured liabilities would reduce the funds available to us. The occurrence of a significant event that Equal is not fully insured against, or the insolvency of the insurer of such event, could have a material adverse effect on our financial position, results of operations or prospects.
Our operation of oil and natural gas wells, and our participation in oil and natural gas wells operated by others, could subject us to environmental claims and liability and/or increased compliance costs, all of which could affect the market price of our common shares and reduce the amount of cash available to run our business.
All phases of the oil and natural gas business present environmental risks and hazards and are subject to environmental regulation pursuant to a variety of international conventions and international, national, provincial, state and local law and regulation. Environmental legislation provides for, among other things, restrictions and prohibitions on spills, releases or emissions of various substances produced in association with oil and gas operations. The legislation also requires that wells and facility sites be operated, maintained, abandoned and reclaimed to the satisfaction of applicable regulatory authorities. Compliance with such legislation can require significant expenditures and a breach of same can result in the imposition of clean-up orders, civil liability for pollution damage, and the imposition of fines and/or penalties, some of which may be material, as well as possible forfeiture of requisite approval obtained from the various governmental authorities.
Environmental legislation is evolving in a manner expected to result in stricter standards and enforcement, larger fines and legal liability, and potentially increased capital expenditures and operating costs. Our exploration and production facilities and other operations and activities emit greenhouse gases and require us to comply with greenhouse gas emissions legislation. The direct or indirect costs of these regulations may have a material adverse effect on our business, financial condition, results of operations and prospects. The discharge of greenhouse gas (“GHG”) emissions, oil, natural gas or other pollutants into the air, soil or water may give
Page 33 of 39
Table of Contents
rise to liabilities to governments and third parties and may require us to incur costs to remedy such discharge. If we are not in material compliance with applicable environmental regulations, it could result in a curtailment of production or a material increase in the costs of production, development or exploration activities or otherwise have a material adverse effect on our business, financial condition, results of operations and prospects.
Equal’s current Hunton production, and future development, depends on our ability to dispose of produced water by injection into water disposal wells. Regulatory actions that would limit our ability to economically dispose of produced water would have a material adverse effect on our production and cash flow.
We could incur material expenses complying with new or amended laws and regulations governing climate change.
The future implementation or modification of greenhouse gases or other environmental regulations could have a material impact on the nature of oil and natural gas operations, including those conducted by us, and could result in increased direct and indirect costs for us. Given the evolving nature of the debate related to climate change and the control of greenhouse gases and resulting requirements, it is not currently possible to predict either the nature of those requirements or the impact on us and our operations and financial condition.
Fluctuations in foreign currency exchange rates and interest rates could adversely affect our business.
Equal conducts business and operations in the United States and is therefore also exposed to foreign currency risk on any costs incurred in Canadian dollars to the extent the value of the Canadian dollar increases relative to the United States dollar.
An increase in interest rates could result in a significant increase in the amount we pay to refinance or service future borrowings, resulting in a decrease in the cash available to fund our operations.
We may be unable to successfully compete with other companies in our industry.
The oil and gas industry is highly competitive. Equal actively competes for reserve acquisitions, exploration leases, licenses and concessions, access to equipment, markets, transportation capacity, drilling, service rigs and processing facilities, production and development of oil and natural gas properties, skilled industry personnel, and the capital to finance such activities, with a substantial number of other oil and gas companies, many of which have significantly greater financial and personnel resources than we have. Equal’s competitors include major integrated oil and natural gas companies and numerous other independent oil and natural gas companies and individual producers and operators.
Certain of our customers and potential customers could directly, or indirectly, be exploring for oil and gas, and the results of such exploration efforts could affect the Company’s ability to sell or supply oil or gas to these customers in the future. The Company’s ability to successfully bid on and acquire additional property rights, to discover reserves, to participate in drilling opportunities and to identify and enter into commercial arrangements with customers depends upon developing and maintaining close working relationships with our future industry partners and joint operators and our ability to select and evaluate suitable properties and to consummate transactions in a highly competitive environment.
As a result of increasing competition, it has become (and the Company expects it to continue to be) more difficult to acquire producing assets and reserves on accretive terms.
Our production is sold to a limited number of customers, and their inability to accept our production would have an adverse effect on our profitability.
Our production of oil and natural gas is sold to a limited number of customers and the inability to accept our production due to capacity constraints, or a credit default of one of these customers, could have a temporary adverse effect on us. Our revenues are generated under contracts with a limited number of customers. In 2013, approximately 90% of Equal’s revenues were derived from Scissortail Energy, LLC (a subsidiary of Kinder Morgan). Other customers include DCP Midstream, LP and Phillips 66 Company. Our operations and cash flow would be adversely affected as a result of non-performance or payment default by any of our customers, but Equal’s operations and cash flows are especially reliant upon Scissortail’s ability to process and pay for the contracted production.
Page 34 of 39
Table of Contents
We have disclosed material weaknesses in our internal control over financial reporting that could adversely affect our ability to report our financial condition and results of operations accurately and on a timely basis.
Management has concluded that as of December 31, 2013, we had not maintained effective internal control over financial reporting. We have taken and continue to take steps to remediate the material weaknesses related to the fact that we did not maintain sufficient accounting resources with adequate training and relevant experience commensurate with our financial reporting requirements. There is also an inherent risk that we may not be able to hire qualified accounting and financial reporting personnel. While considerable actions will be undertaken to improve our internal controls in response to the material weaknesses identified, if we are unsuccessful in implementing or following our remediation plan, we may not be able to timely or accurately report our financial condition, results of operations or cash flows or maintain effective disclosure controls and procedures. Any failure to remedy our material weaknesses or any additional errors or delays in our financial reporting, whether or not resulting from a failure to remedy our identified material weaknesses and deficiencies that resulted in the prior period financial statement revisions, could have a material adverse effect on our business and results of operations.
Our operations require permits from various governmental authorities. There can be no assurance that we will be able to obtain all of the necessary leases and permits that might be required to carry out exploration and development at our projects.
Equal’s properties are held in the form of working interests in leases. If the Company or the holder of the lease fails to meet the specific requirements, the lease may terminate or expire. There can be no assurance that any of the obligations required to maintain each lease will be met. The termination or expiration of the Company’s leases or the working interests relating to a lease, or the inability of the Company to obtain or maintain necessary permits, could have an adverse effect on our results of operations and the ability to conduct our business.
Our profitability depends upon the level of royalties and production taxes that we pay, and the availability to us of incentives provided by the State of Oklahoma and the federal government
In addition to federal regulations, Oklahoma has legislation and regulations which govern production taxes, production rates, environmental protection and other matters. Royalties payable on production are determined by negotiations between the mineral owner and the lessee. If production taxes are increased, or if Oklahoma does not make available to us current production tax credits, our profitability will be negatively affected.
If we are unable to renew our land leases on satisfactory terms, our operations will be adversely affected.
Oil and natural gas lands located in Oklahoma are generally privately owned and rights to explore for and produce such oil and natural gas are granted by lease on such terms and conditions as may be negotiated. In general, the term of most leases is three years. Once a productive well is established on the lands the land is held by production for as long as the subject well is consistently producing. If we are unable to renew our land leases, we will be unable to operate our business as it is currently being conducted.
The ability of residents of the United States to enforce civil remedies against us and our directors and officers may be limited.
Equal is incorporated under the ABCA and the chief executive officer and one of the Company’s directors are residents of Canada. Consequently, it may be difficult for United States investors to effect service of process within the United States upon the Company or upon our directors or officers who are not residents of the United States, or to realize in the United States upon judgments against the Company’s current or future non-U.S. resident executive officers or directors of United States courts predicated upon civil liabilities under United States federal or state securities laws. Furthermore, it may be difficult for investors to enforce judgments of the U.S. courts based on civil liability provisions of the U.S. federal or state securities laws in a Canadian court against the Company or any of the Company’s non-U.S. resident executive officers or directors. There is substantial doubt whether an original lawsuit could be brought successfully in Canada against any of such persons or the Company predicated solely upon such civil liabilities.
Actual reserves will vary from reserve estimates and those variations could be material and negatively affect the market price of our common shares
There are numerous uncertainties inherent in estimating quantities of oil, natural gas and NGL reserves and cash flow to be derived therefrom, including many factors beyond our control. The reserve, recovery and associated revenue information contained in the Haas Report are only estimates and the actual production and ultimate reserves from our properties may be greater or less than the estimates prepared in such reports. The Reserve Reports have been prepared using certain commodity price assumptions which are described in the notes to the reserve tables in this Form 10-K. If lower prices for crude oil, NGLs and natural gas are realized by the
Page 35 of 39
Table of Contents
Company and substituted for the price assumptions utilized in the Reserve Reports, the present value of estimated future net cash flows for the Company’s reserves would be reduced and the reduction could be significant, particularly to those cases which are based on a constant price assumption. Exploration for oil and natural gas involves many risks, which even a combination of experience and careful evaluation may not be able to overcome. There is no assurance that further commercial quantities of oil and natural gas will be discovered by the Company.
In general, estimates of economically recoverable oil and natural gas reserves and the future net revenue therefrom are based up a number of variable factors and assumptions, such as:
| — | historical production from the properties; |
| — | estimated production decline rates; |
| — | estimated ultimate reserve recovery; |
| — | timing and amount and effectiveness of future capital expenditures; |
| — | marketability and price of oil and natural gas; |
| — | production tax rates; |
| — | the assumed effects of regulation by governmental agencies; and |
| — | future operating costs; |
all of which may vary from actual results. As a result, estimates of the economically recoverable oil and natural gas reserves attributable to any particular group of properties, classification of such reserves based on risk of recovery and estimates of future net revenues expected therefrom prepared by different engineers, or by the same engineers at different times, may vary. Our actual production, revenues and development and operating expenditures will vary from reserve estimates thereof and such variations could be material.
Estimates of proved reserves that may be developed and produced in the future are sometimes based upon volumetric calculations and upon analogy to similar types of reserves rather than actual production history. Estimates based on these methods are generally less reliable than those based on actual production history. Subsequent evaluation of the same reserves based upon production history and production practices will result in variations in the estimated reserves and such variations could be material.
In accordance with applicable securities laws, Haas, a third party engineering firm, has used constant price and cost estimates in calculating reserve quantities included herein. Actual future net revenue will be affected by other factors including but not limited to actual production levels, supply and demand for oil and natural gas, curtailments or increases in consumption by oil and natural gas purchasers, changes in governmental regulation or taxation and the impact of inflation on costs.
Actual production and revenue derived from reserves will vary from the reserve estimates contained in the Haas Report, and such variations could be material. The Haas Report is based in part upon the assumption that certain activities will be undertaken by us in future years and the further assumption that such activities will be successful. The reserves and estimated revenue to be derived therefrom contained in the Haas Report will be reduced in future years to the extent that such activities are not undertaken or, if undertaken, do not achieve the level of success assumed in the Haas Report.
The failure of third parties to meet their contractual obligations to us may have a material adverse effect on our financial condition.
Equal is exposed to third party credit risk through our contractual arrangements with our current or future joint venture partners, third party operators, marketers of our petroleum and natural gas production and other parties. In the event such entities fail to meet their contractual obligations to the Company, such failures could have a material adverse effect on the Company and our cash flow from operations. In addition, poor credit conditions in the industry and of joint venture partners may impact a joint venture partner’s willingness to participate in our ongoing capital program, potentially delaying the program and the results of such program until we find a suitable alternative partner.
Page 36 of 39
Table of Contents
We may not be able to achieve the anticipated benefits of future potential acquisitions and the integration of any acquisitions might result in the loss of key employees and the disruption of on-going business relationships.
Equal makes acquisitions and dispositions of businesses and assets in the ordinary course of business. Achieving the benefits of acquisitions depends in part on successfully consolidating functions and integrating operations and procedures in a timely and efficient manner, as well as our ability to realize the anticipated growth opportunities and synergies from combining the acquired businesses and operations with those of the Company. The integration of an acquired business may require substantial management effort, time and resources and may divert management’s focus from other strategic opportunities and operational matters, and may also result in the loss of key employees, the disruption of on-going business, supplier, customer and employee relationships and deficiencies in internal controls or information technology controls. We continually assess the value and mix of our assets in light of our business plans and strategic objectives. In this regard, non-core assets are periodically disposed of, so that the Company can focus our efforts and resources more efficiently. Depending on the state of the market for such non-core assets, certain non-core assets of the Company, if disposed of, could realize less than their carrying value on the financial statements of the Company.
Our hedging program could result in us not realizing the full benefit of oil and natural gas price increases.
From time to time Equal enters into agreements to receive fixed prices on our oil and natural gas production to offset the risk of revenue losses if commodity prices decline; however, if commodity prices increase beyond the levels set in such agreements, we will not benefit from such increases and we may nevertheless be obligated to pay royalties on such higher prices, even though not received by us, after giving effect to such agreements. Similarly, from time to time the Company might enter into agreements to fix the exchange rate of Canadian to United States dollars in order to offset the risk of revenue losses if the Canadian dollar increases in value compared to the United States dollar; however, if the Canadian dollar declines in value compared to the United States dollar, the Company will not benefit from the fluctuating exchange rate. To the extent that we engage in risk management activities, there are potential credit risks associated with the counterparties with which we contract.
Our directors could have conflicts of interest that create incentives for them to act contrary to or in competition with the interests of our shareholders.
Certain of the directors of Equal are also directors and officers of other oil and gas companies involved in natural resource exploration and development, and conflicts of interest may arise between their duties as directors of Equal and as officers and directors of such other companies. Such conflicts must be disclosed in accordance with, and are subject to such other procedures and remedies as apply under the ABCA and under our Code of Business Conduct.
There may be substantially less information available about the Company as a result of the delisting of our common shares and the relief from and suspension of our continuous disclosure obligations.
At the request of the Company, the New York Stock Exchange (“NYSE”) and the Toronto Stock Exchange ceased trading of the Company’s common stock and suspend the listing of the common stock prior to the opening of market on July 31, 2014. The NYSE also filed with the Securities and Exchange Commission (the “SEC”) an application on Form 25 to delist and deregister the common stock under Section 12(b) of the Securities Exchange Act of 1934, as amended (the “Exchange Act”).
The Company has filed an application with the Alberta and Ontario securities commissions for relief from the requirements of continuous disclosure in all provinces and territories in Canada, including its obligations under National Instrument 51-102—Continuous Disclosure Obligations. If the relief is granted, the Company will be exempt from its continuous disclosure filing obligations, but will be required (i) to provide annual alternative disclosure that will state the principal amount of its 6.75% convertible unsecured junior subordinated debentures due March 31, 2016 that remain outstanding and (ii) upon the occurrence of a change in the affairs of the Company or the trustee under the indenture governing the Debentures that would reasonably be expected to have a significant effect upon the market price or value of any of the debentures, to forthwith, upon becoming aware of such a change, issue and file a news release disclosing the nature and substance of the change.
The Company also intends to file a Form 15 with the SEC requesting the deregistration of the common stock under Section 12(g) of the Exchange Act and the suspension of the Company’s reporting obligations under Section 15(d) of the Exchange Act.
| ITEM 2. | UNREGISTERED SALES OF EQUITY SECURITIES AND USE OF PROCEEDS |
None.
Page 37 of 39
Table of Contents
| ITEM 3. | DEFAULTS UPON SENIOR SECURITIES |
None.
| ITEM 4. | MINE SAFETY DISCLOSURES |
None.
| ITEM 5. | OTHER INFORMATION |
None.
| ITEM 6. | EXHIBITS |
| Exhibit Number |
Description | |
| 31.1 | Certification of the Principal Executive Officer pursuant to §302 of the Sarbanes-Oxley Act of 2002 | |
| 31.2 | Certification of the Principal Financial Officer pursuant to §302 of the Sarbanes-Oxley Act of 2002 | |
| 32.1 | Certification of the Principal Executive Officer pursuant to 18 U.S.C. Section 1350 | |
| 32.2 | Certification of the Principal Financial Officer pursuant to 18 U.S.C. Section 1350 | |
| 10.1 | Arrangement Amending Agreement, dated May 1, 2014 (incorporated by reference to the Current Report on Form 8-K filed by Equal Energy Ltd. on May 2, 2014 (File No. 001-34759). | |
| 101 | The following materials are filed herewith: (i) XBRL Instance, (ii) XBRL Taxonomy Extension Schema, (iii) XBRL Taxonomy Extension Calculation, (iv) XBRL Taxonomy Extension Labels, (v) XBRL Taxonomy Extension Presentation, and (vi) XBRL Taxonomy Extension Definition. In accordance with Rule 406T of Regulation S-T, the information in these exhibits is furnished and deemed not filed or a part of a registration statement or prospectus for purposes of Sections 11 or 12 of the Securities Act of 1933, is deemed not filed for purposes of section 18 of the Exchange Act of 1934, and otherwise is not subject to liability under these sections and shall not be incorporated by reference into any registration statement or other document filed under the Securities Act of 1933, as amended, except as expressly set forth by the specific reference in such filing. | |
Page 38 of 39
Table of Contents
Pursuant to the requirements of the Securities Exchange Act of 1934, the registrant has duly caused this report to be signed on its behalf by the undersigned thereunto duly authorized.
| EQUAL ENERGY LTD. | ||||
| August 7, 2014 | By: | /s/ DON KLAPKO | ||
| Don Klapko Chief Executive Officer | ||||
| August 7, 2014 | By: | /s/ SCOTT SMALLING | ||
| Scott Smalling Chief Financial Officer | ||||
Page 39 of 39