Attached files
| file | filename |
|---|---|
| 8-K - FORM 8-K - CYS Investments, Inc. | d627198d8k.htm |
| Exhibit 99.1
|
Investment Outlook - November 2013
Kevin E. Grant, CFA Chief Executive Officer
2013 Banking and Financial Services Conference
November 12, 2013
|
|
Forward-Looking Statements This presentation contains forward-looking statements, within the meaning of Section 27A of the Securities Act of 1933, as amended, and Section 21E of the Securities Exchange Act of 1934, as amended, that are based on management’s beliefs and assumptions, current expectations, estimates and projections. Such statements, including information relating to the Company’s expectations for distributions, market conditions, refinance activity, mortgage origination activity, affordability of housing, movements in interest rates, governmental actions, the performance of certain government backed bonds, the investment strategies of financial institutions, the impact of the election of a new Chair on certain policies of the Federal Reserve, size of the mortgage market and the Company’s or the Federal Reserve’s projections regarding economic indicators such as gross domestic product or unemployment, are not considered historical facts and are considered forward-looking information under the federal securities laws. This information may contain words such as believes,” plans,” expects,” intends,” estimates” or similar expressions. This information is not a guarantee of the Company’s future performance and is subject to risks, uncertainties and other important factors that could cause the Company’s actual performance or achievements to differ materially from those expressed or implied by this forward-looking information and include, without limitation, changes in the market value and yield of our assets, changes in interest rates and the yield curve, net interest margin, return on equity, availability and terms of financing and hedging, the likelihood that proposed legislation is made law and the anticipated impact thereof, actions by the U.S. government or any agency thereof, including the Federal Reserve, and the effects of such actions and various other risks and uncertainties related to our business and the economy, some of which are described in our filings with the SEC. Given these uncertainties, you should not rely on forward-looking information. The Company undertakes no obligations to update any forward-looking information, whether as a result of new information, future events or otherwise. 2
|
|
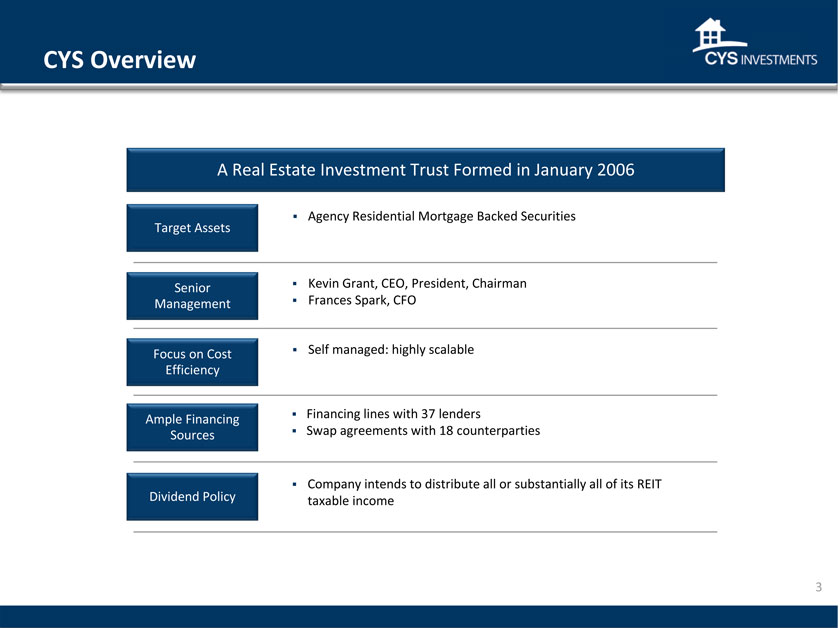
CYS Overview A Real Estate Investment Trust Formed in January 2006 Agency Residential Mortgage Backed Securities Target Assets Senior Kevin Grant, CEO, President, Chairman Management Frances Spark, CFO Focus on Cost Self managed: highly scalable Efficiency Financing lines with 37 lenders Ample Financing Sources Swap agreements with 18 counterparties Company intends to distribute all or substantially all of its REIT Dividend Policy taxable income 3
|
|
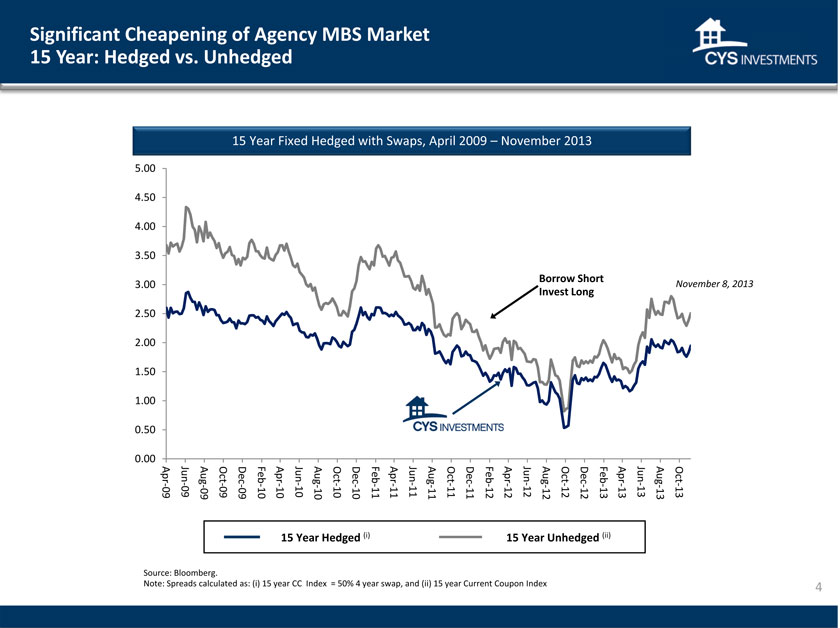
Significant Cheapening of Agency MBS Market 15 Year: Hedged vs. Unhedged 15 Year Fixed Hedged with Swaps, April 2009 – November 2013 2013 8, November Nov-13 Oct-13 Aug-13 Jun-13 Apr-13 Feb-13 Short Dec-12 Long Oct-12 Borrow Invest Aug-12 Jun-12 Apr-12 Feb-12 Dec-11 Oct-11 Aug-11 Jun-11 Apr-11 Feb-11 Dec-10 Oct-10 Aug-10 Jun-10 Apr-10 Feb-10 Dec-09 Oct-09 Aug-09 Jun-09 Apr-09 00 . 50 . . 00 50 . 00 . 50 . . 00 50 . 00 . 50 . . 00
5 4 4 3 3 2 2 1 1 0 0 Source: Bloomberg. Note: Spreads calculated as: (i) 15 year CC Index = 50% 4 year swap, and (ii) 15 year Current Coupon Index
|
|
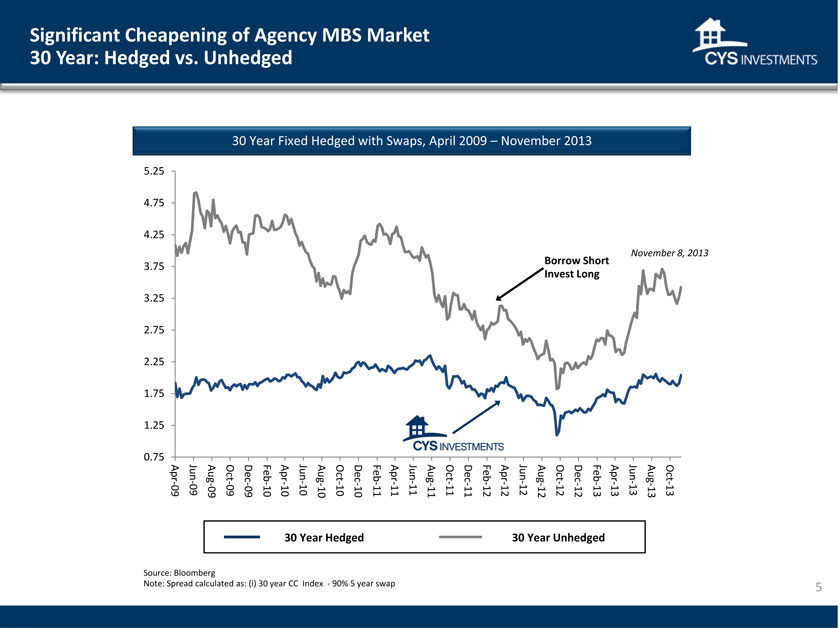
Significant Cheapening of Agency MBS Market 30 Year: Hedged vs. Unhedged 30 Year Fixed Hedged with Swaps, April 2009 – November 2013 2013 8, Nov-13 Oct-13 November Aug-13 Jun-13 Apr-13 Short Feb-13 Long Dec-12 Borrow Invest Oct-12 Aug-12 Jun-12 Apr-12 Feb-12 Dec-11 Oct-11 Aug-11 Jun-11 Apr-11 Feb-11 Dec-10 Oct-10 Aug-10 Jun-10 Apr-10 Feb-10 Dec-09 Oct-09 Aug-09 Jun-09 Apr-09 25 . 75 . 25 . 75 . 25 . . 75 25 . 75 . . 25 75 . 5 4 4 3 3 2 2 1 1 0 30 Year Hedged 30 Year Unhedged Source: Bloomberg Note: Spread calculated as: (i) 30 year CC Index -90% 5 year swap 5
|
|
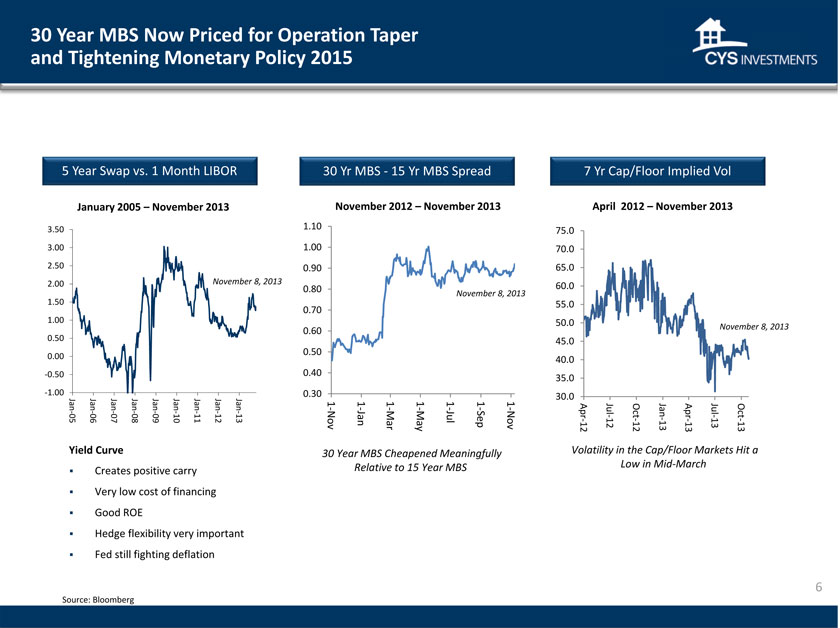
30 Year MBS Now Priced for Operation Taper and Tightening Monetary Policy 2015 5 Year Swap vs. 1 Month LIBOR 30 Yr MBS -15 Yr MBS Spread 7 Yr Cap/Floor Implied Vol January 2005 – November 2013 November 2012 – November 2013 April 2012 – November 2013 3.50 1.10 75.0 3.00 1.00 70.0 2.50 0.90 65.0 2.00 November 8, 2013 0.80 November 8, 2013 60.0 1.50 0.70 55.0 1.00 50.0 November 8, 2013 0.50 0.60 45.0 0.50 0.00 40.0 -0.50 0.40 35.0 -1.00 0.30 30.0 Jan Jan Jan Jan Jan Jan Jan Jan Jan 1 - 1 - 1 1 - 1 1 - 1 Jul Jan Jul Apr - Oct - Apr - Oct 05 06 07 08 09 10 11 12 13 Nov Jan Mar Jul Sep Nov - 12 - 13 May 12 12 13 13 13 Jan-14 1-Jan Jan-14 Yield Curve 30 Year MBS Cheapened Meaningfully Volatility in the Cap/Floor Markets Hit a Relative to 15 Year MBS Low in Mid-March Creates positive carry Very low cost of financing Good ROE Hedge flexibility very important Fed still fighting deflation Source: Bloomberg 6
|
|
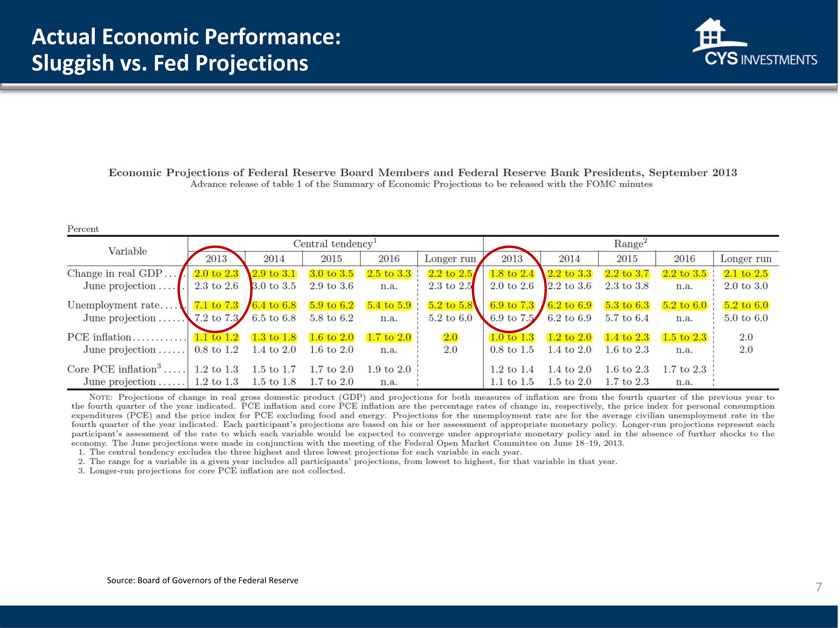
Actual Economic Performance: Sluggish vs. Fed Projections Source: Board of Governors of the Federal Reserve 7
|
|
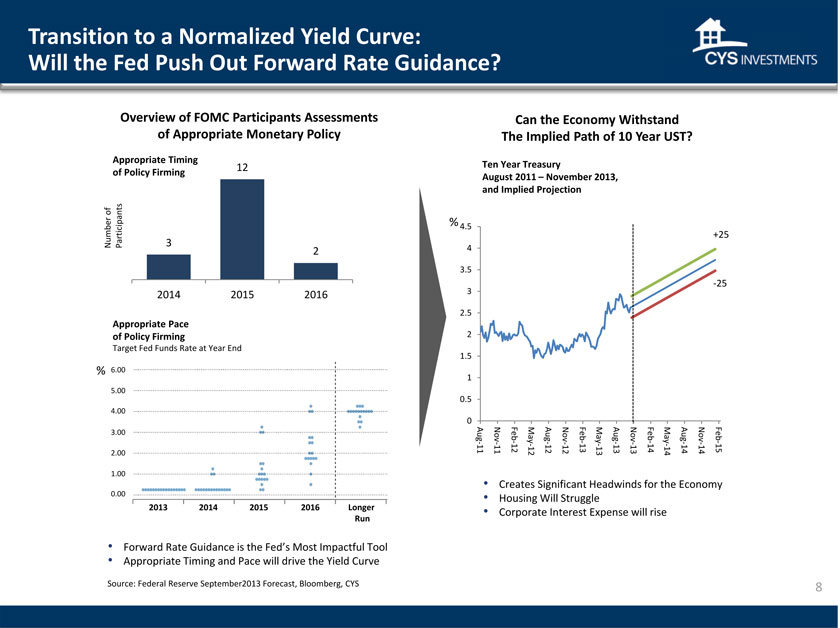
Transition to a Normalized Yield Curve: Will the Fed Push Out Forward Rate Guidance? Overview of FOMC Participants Assessments of Appropriate Monetary Policy Appropriate Timing 12 of Policy Firming of Number Participants 3 2 2014 2015 2016 Appropriate Pace of Policy Firming Target Fed Funds Rate at Year End % 6.00 5.00 4.00 3.00 2.00 1.00 0.00 2013 2014 2015 2016 Longer Run Forward Rate Guidance is the Fed’s Most Impactful Tool Appropriate Timing and Pace will drive the Yield Curve Source: Federal Reserve September 2013 Forecast, Bloomberg, CYS Can the Economy Withstand The Implied Path of 10 Year UST? Ten Year Treasury August 2011 – November 2013, and Implied Projection %4.5 +25 4 3.5 3 -25 2.5 2 1.5 1 0.5 0 Aug Nov - Feb May Aug Nov - Feb May Aug Nov Feb - May Aug Nov - Feb 11 11 12 12 - 12 12 13 - 13 13 13 14 - 14 14 14 15 Creates Significant Headwinds for the Economy Housing Will Struggle Corporate Interest Expense will rise 8
|
|
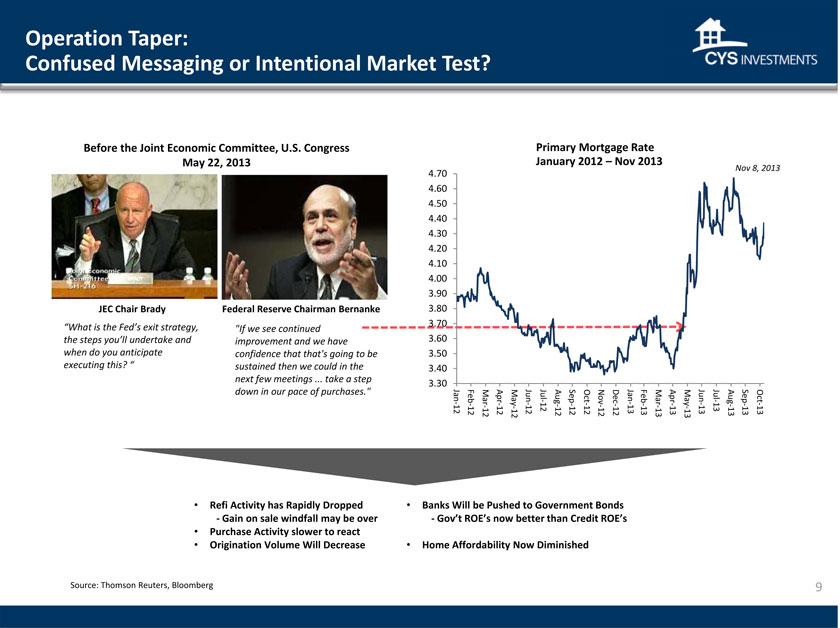
Operation Taper: Confused Messaging or Intentional Market Test? Before the Joint Economic Committee, U.S. Congress May 22, 2013 JEC Chair Brady Federal Reserve Chairman Bernanke “What is the Fed’s exit strategy, “If we see continued the steps you’ll undertake and improvement and we have when do you anticipate confidence that that’s going to be executing this? “ sustained then we could in the next few meetings ... take a step down in our pace of purchases.” 2013 Oct-13 8, Nov Sep-13 Aug-13 Jul-13 Jun-13 May-13 Apr-13 Mar-13 2013 Feb-13 Rate Nov Jan-13 Dec-12 – Nov-12 Mortgage 2012 Oct-12 Sep-12 Aug-12 Primary January Jul-12 Jun-12 May-12 Apr-12 Mar-12 Feb-12 Jan-12 Nov-13 70 . 60 . 50 40 . . 30 20 . 10 . 00 . . 90 80 . . 70 60 . . 50 40 . . 30 4 4 4 4 4 4 4 4 3 3 3 3 3 3 3 Refi Activity has Rapidly Dropped -Gain on sale windfall may be over Purchase Activity slower to react Origination Volume Will Decrease Banks Will be Pushed to Government Bonds -Gov’t ROE’s now better than Credit ROE’s Home Affordability Now Diminished Source: Thomson Reuters, Bloomberg 9
|
|
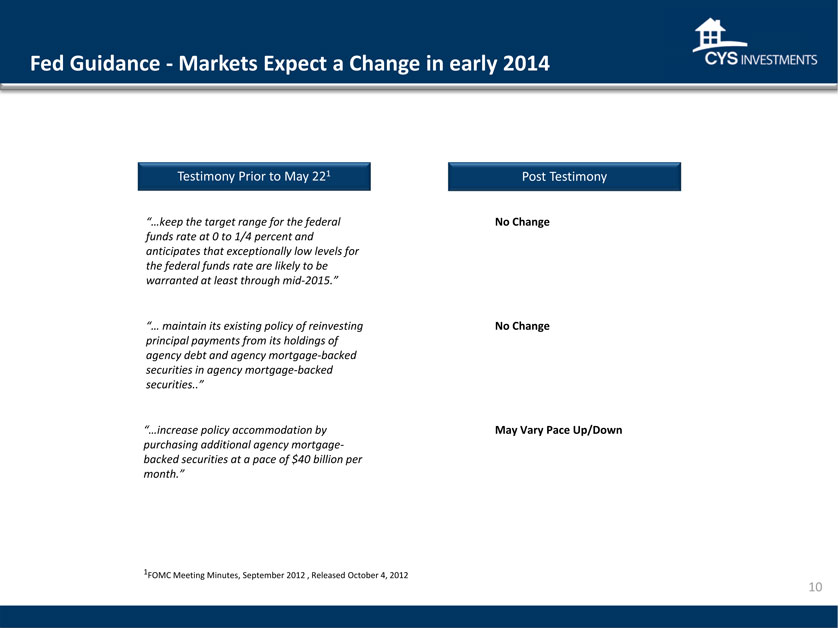
Fed Guidance -Markets Expect a Change in early 2014 Testimony Prior to May 221 Post Testimony keep the target range for the federal No Change funds rate at 0 to 1/4 percent and anticipates that exceptionally low levels for the federal funds rate are likely to be warranted at least through mid-2015.” maintain its existing policy of reinvesting No Change principal payments from its holdings of agency debt and agency mortgage-backed securities in agency mortgage-backed securities..” increase policy accommodation by May Vary Pace Up/Down purchasing additional agency mortgage-backed securities at a pace of $40 billion per month.” 1FOMC Meeting Minutes, September 2012 , Released October 4, 2012 10
|
|
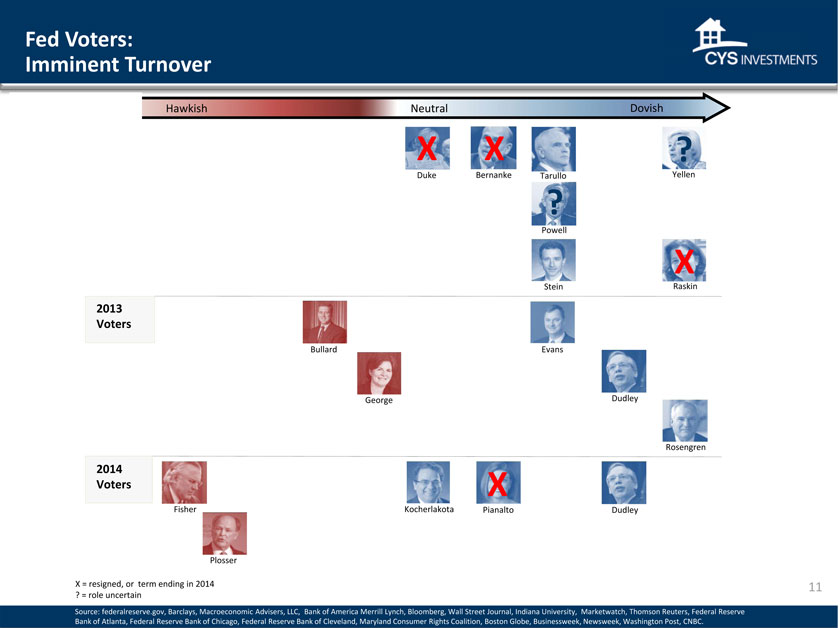
Fed Voters: Imminent Turnover Hawkish Neutral Dovish XX Duke Bernanke Tarullo Yellen Powell X Stein Raskin 2013 Voters Bullard Evans George Dudley Rosengren 2014 Voters X Fisher Kocherlakota Pianalto Dudley Plosser X = resigned, or term ending in 2014 ? = role uncertain Source: federalreserve.gov, Barclays, Macroeconomic Advisers, LLC, Bank of America Merrill Lynch, Bloomberg, Wall Street Journal, Indiana University, Marketwatch, Thomson Reuters, Federal Reserve Bank of Atlanta, Federal Reserve Bank of Chicago, Federal Reserve Bank of Cleveland, Maryland Consumer Rights Coalition, oston Globe, Businesswee k, Newsweek, Washington Post, CNBC. 11
|
|
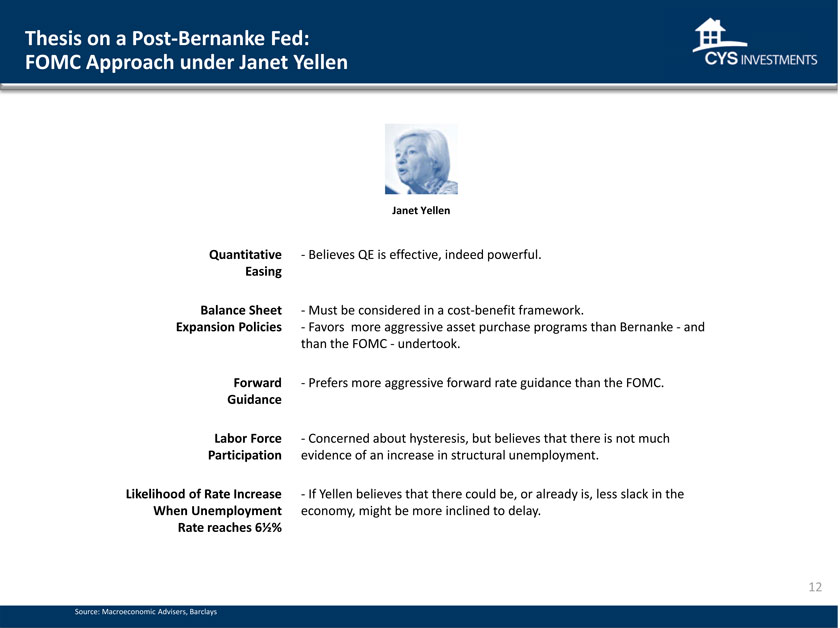
Thesis on a Post-Bernanke Fed: FOMC Approach under Janet Yellen Janet Yellen Quantitative -Believes QE is effective, indeed powerful. Easing Balance Sheet -Must be considered in a cost-benefit framework. Expansion Policies -Favors more aggressive asset purchase programs than Bernanke -and than the FOMC -undertook. Forward -Prefers more aggressive forward rate guidance than the FOMC. Guidance Labor Force -Concerned about hysteresis, but believes that there is not much Participation evidence of an increase in structural unemployment. Likelihood of Rate Increase -If Yellen believes that there could be, or already is, less slack in the When Unemployment economy, might be more inclined to delay. Rate reaches 6% Source: Macroeconomic Advisers, Barclays 12
|
|
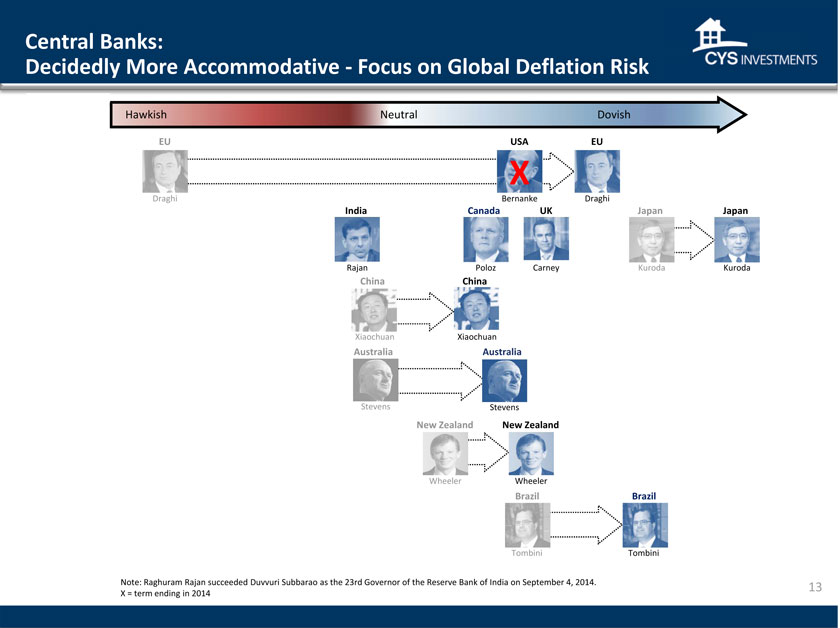
Central Banks: Decidedly More Accommodative -Focus on Global Deflation Risk Hawkish Neutral Dovish EU USA EU X Draghi Bernanke Draghi India Canada UK Japan Japan Rajan Poloz Carney Kuroda Kuroda China China Xiaochuan Xiaochuan Australia Australia Stevens Stevens New Zealand New Zealand Wheeler Wheeler Brazil Brazil Tombini Tombini Note: Raghuram Rajan succeeded Duvvuri Subbarao as the 23rd Governor of the Reserve Bank of India on September 4, 2014. X = term ending in 2014 13
|
|
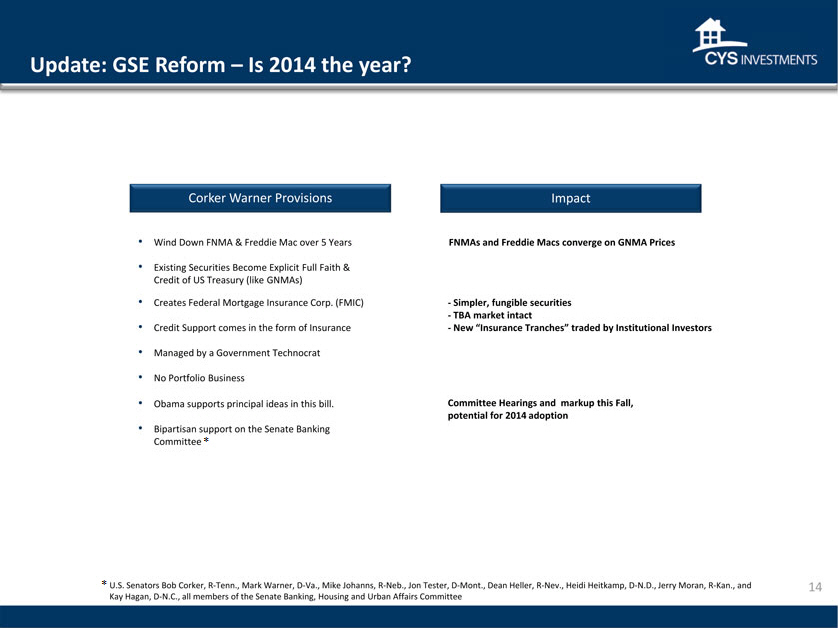
Update: GSE Reform – Is 2014 the year Corker Warner Provisions Impact Wind Down FNMA & Freddie Mac over 5 Years FNMAs and Freddie Macs converge on GNMA Prices Existing Securities Become Explicit Full Faith & Credit of US Treasury (like GNMAs) Creates Federal Mortgage Insurance Corp. (FMIC) -Simpler, fungible securities -TBA market intact Credit Support comes in the form of Insurance -New Insurance Tranches” traded by Institutional Investors Managed by a Government Technocrat No Portfolio Business Obama supports principal ideas in this bill. Committee Hearings and markup this Fall, potential for 2014 adoption Bipartisan support on the Senate Banking Committee * * U.S. Senators Bob Corker, R-Tenn., Mark Warner, D-Va., Mike Johanns, R-Neb., Jon Tester, D-Mont., Dean Heller, R Nev., Heidi Heitkamp, D-N.D., Jerry Moran, R-Kan., and Kay Hagan, D-N.C., all members of the Senate Banking, Housing and Urban Affairs Committee 14
|
|
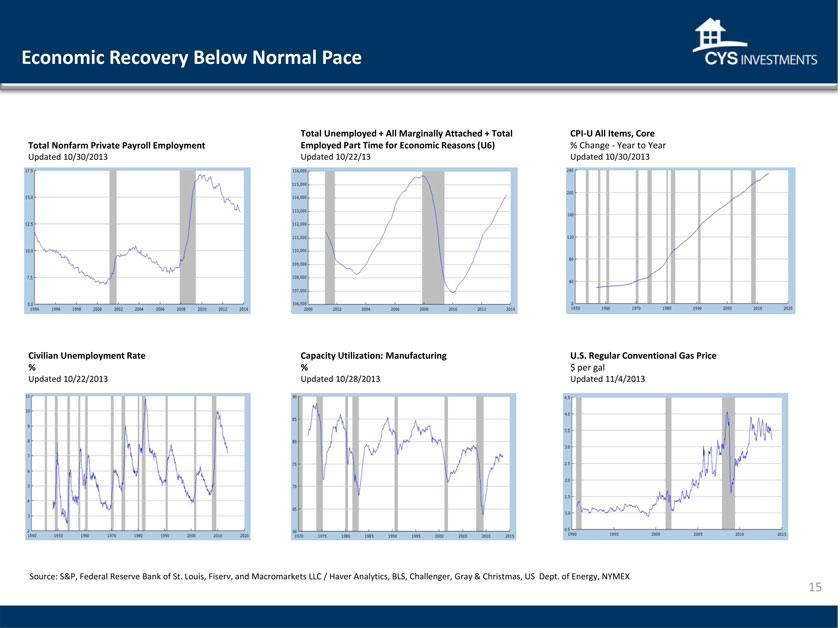
Economic Recovery Below Normal Pace Total Unemployed + All Marginally Attached + Total CPI-U All Items, Core Total Nonfarm Private Payroll Employment Employed Part Time for Economic Reasons (U6) % Change -Year to Year Updated 10/30/2013 Updated 10/22/13 Updated 10/30/2013 Civilian Unemployment Rate Capacity Utilization: Manufacturing U.S. Regular Conventional Gas Price % % $ per gal Updated 10/22/2013 Updated 10/28/2013 Updated 11/4/2013 Source: S&P, Federal Reserve Bank of St. Louis, Fiserv, and Macromarkets LLC Haver Analytics, BLS, Challenger, Gray & Christmas, US Dept. of Energy, NYMEX 15
|
|
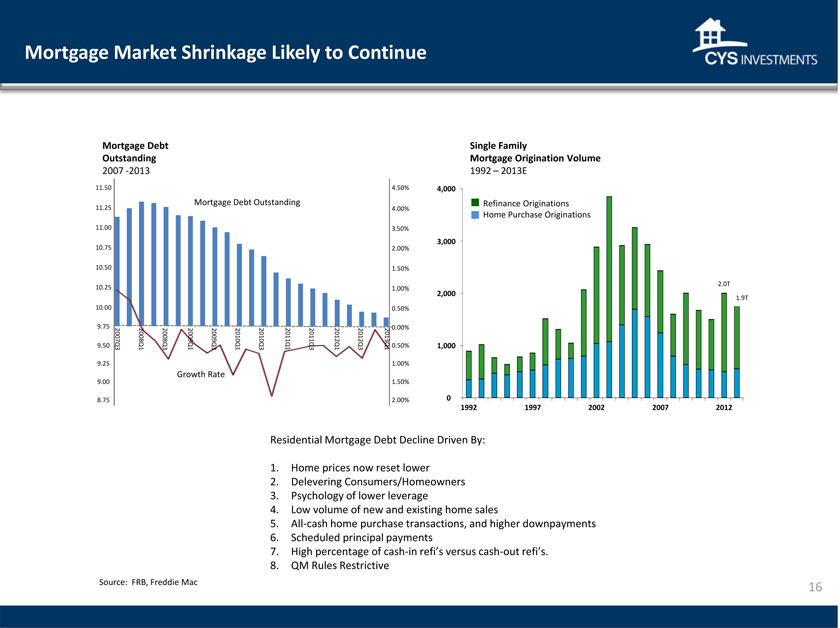
Mortgage Market Shrinkage Likely to Continue Mortgage Debt Single Family Outstanding Mortgage Origination Volume 2007 -2013 1992 – 2013E 11.50 4.50% 4,000 11.25 Mortgage Debt Outstanding 4.00% Refinance Originations Home Purchase Originations 11.00 3.50% 10.75 3,000 2.00% 10.50 1.50% 2.0T 10.25 1.00% 2,000 1.9T 10.00 0.50% 9.75 0.00% 9.50 2007Q3 2008Q1 2008Q3 2009Q1 2009Q3 2010Q1 2010Q3 2011Q1 2011Q3 2012Q1 2012Q3 2013Q1 0.50% 1,000 9.25 1.00% Growth Rate 00 1.50% 8.75 2.00% 0 1992 1997 2002 2007 2012 Residential Mortgage Debt Decline Driven By: 1. Home prices now reset lower 2. Delevering Consumers/Homeowners 3. Psychology of lower leverage 4. Low volume of new and existing home sales 5. All-cash home purchase transactions, and higher downpayments 6. Scheduled principal payments 7. High percentage of cash-in refi’s versus cash-out refi’s. 8. QM Rules Restrictive Source: FRB, Freddie Mac 16
|
|
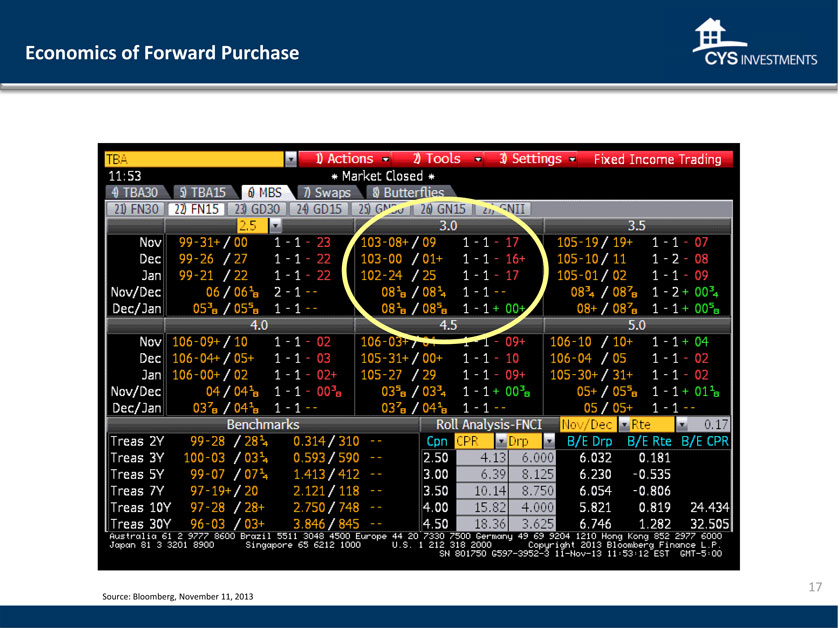
Economics of Forward Purchase 17 Source: Bloomberg, November 11, 2013 17
|
|
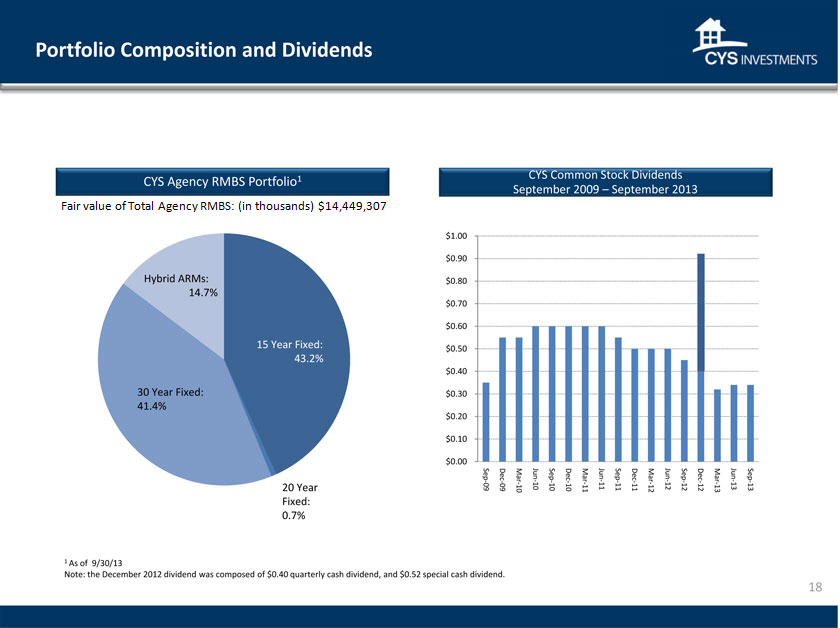
Portfolio Composition and Dividends 1 CYS Common Stock Dividends CYS Agency RMBS Portfolio September 2009 – September 2013 Fair value of Total Agency RMBS: (in thousands) $14,449,307 $1.00 $0.90 Hybrid ARMs: $0.80 14.7% $0.70 $0.60 15 Year Fixed: $0.50 43.2% $0.40 $0.20 $0.10 $0.00 Sep Dec Mar Jun - Sep Dec Mar - Jun Sep Dec Mar - Jun Sep Dec Mar Jun - Sep - - - - - - - - - 20 Year 09 - 10 10 - 11 11 - 12 12 - 13 13 09 10 10 11 11 12 12 13 Fixed: 0.7% 1 As of 9/30/13 Note: the December 2012 dividend was composed of $0.40 quarterly cash dividend, and $0.52 special cash dividend. 18
|
|
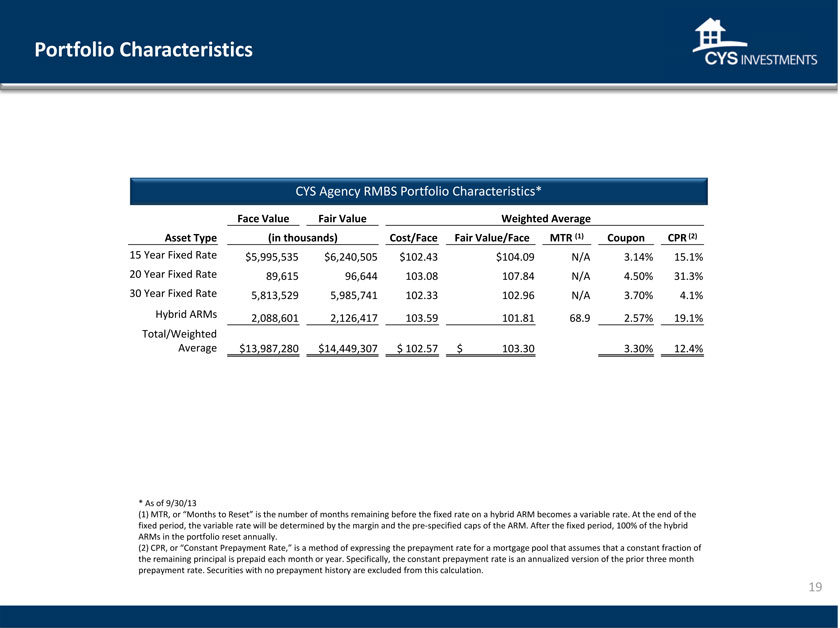
Portfolio Characteristics CYS Agency RMBS Portfolio Characteristics* Face Value Fair Value Weighted Average Asset Type (in thousands) Cost/Face Fair Value/Face MTR (1) Coupon CPR (2) 15 Year Fixed Rate $5,995,535 $6,240,505 $102.43 $104.09 N/A 3.14% 15.1% 20 Year Fixed Rate 89,615 96,644 103.08 107.84 N/A 4.50% 31.3% 30 Year Fixed Rate 5,813,529 5,985,741 102.33 102.96 N/A 3.70% 4.1% Hybrid ARMs 2,088,601 2,126,417 103.59 101.81 68.9 2.57% 19.1% Total/Weighted Average $13,987,280 $14,449,307 $ 102.57 $ 103.30 3.30% 12.4% * As of 9/30/13 (1) MTR, or “Months to Reset” is the number of months remaining before the fixed rate on a hybrid ARM becomes a variable rate. At the end of the fixed period, the variable rate will be determined by the margin and the pre-specified caps of the ARM. After the fixed period, 100% of the hybrid ARMs in the portfolio reset annually. (2) CPR, or Constant Prepayment Rate,” is a method of expressing the prepayment rate for a mortgage pool that assumes that a constant fraction of the remaining principal is prepaid each month or year. Specifically, the constant prepayment rate is an annualized version of the prior three month prepayment rate. Securities with no prepayment history are excluded from this calculation. 19
|
|
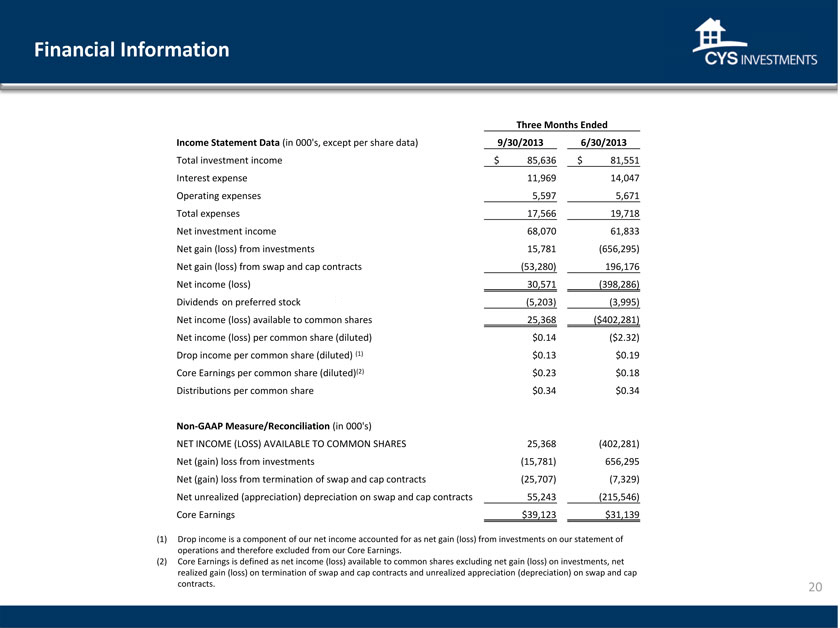
Financial Information Three Months Ended Income Statement Data (in 000’s, except per share data) 9/30/2013 6/30/2013 Total investment income $ 85,636 $ 81,551 Interest expense 11,969 14,047 Operating expenses 5,597 5,671 Total expenses 17,566 19,718 Net investment income 68,070 61,833 Net gain (loss) from investments 15,781 (656,295) Net gain (loss) from swap and cap contracts (53,280) 196,176 Net income (loss) 30,571 (398,286) Dividends on preferred stock (5,203) (3,995) Net income (loss) available to common shares 25,368 ($402,281) Net income (loss) per common share (diluted) $0.14 ($2.32) Drop income per common share (diluted) (1) $0.13 $0.19 Core Earnings per common share (diluted)(2) $0.23 $0.18 Distributions per common share $0.34 $0.34 Non-GAAP Measure/Reconciliation (in 000’s) NET INCOME (LOSS) AVAILABLE TO COMMON SHARES 25,368 (402,281) Net (gain) loss from investments (15,781) 656,295 Net (gain) loss from termination of swap and cap contracts (25,707) (7,329) Net unrealized (appreciation) depreciation on swap and cap contracts 55,243 (215,546) Core Earnings $39,123 $31,139 (1) Drop income is a component of our net income accounted for as net gain (loss) from investments on our statement of operations and therefore excluded from our Core Earnings. (2) Core Earnings is defined as net income (loss) available to common shares excluding net gain (loss) on investments, net realized gain (loss) on termination of swap and cap contracts and unrealized appreciation (depreciation) on swap and cap contracts. 20
|
|
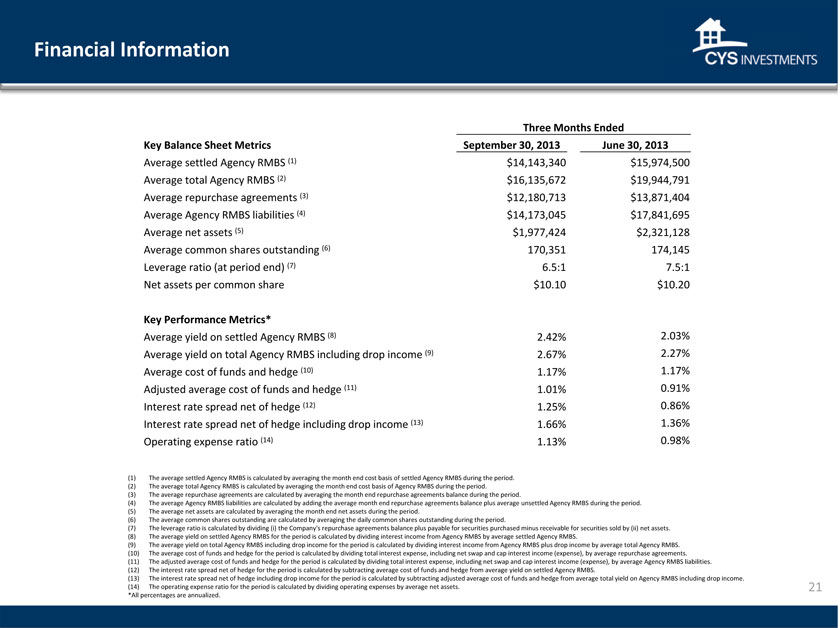
Financial Information
Three Months Ended
Key Balance Sheet Metrics September 30, 2013 June 30, 2013
Average settled Agency RMBS (1) $14,143,340 $15,974,500 Average total Agency RMBS (2) $16,135,672 $19,944,791 Average repurchase agreements (3) $12,180,713 $13,871,404 Average Agency RMBS liabilities (4) $14,173,045 $17,841,695 Average net assets (5) $1,977,424 $2,321,128 Average common shares outstanding (6) 170,351 174,145 Leverage ratio (at period end) (7) 6.5:1 7.5:1 Net assets per common share $10.10 $10.20 Key Performance Metrics* Average yield on settled Agency RMBS (8) 2.42% 2.03% Average yield on total Agency RMBS including drop income (9) 2.67% 2.27% Average cost of funds and hedge (10) 1.17% 1.17% Adjusted average cost of funds and hedge (11) 1.01% 0.91% Interest rate spread net of hedge (12) 1.25% 0.86% Interest rate spread net of hedge including drop income (13) 1.66% 1.36% Operating expense ratio (14) 1.13% 0.98% (1) The average settled Agency RMBS is calculated by averaging the month end cost basis of settled Agency RMBS during the period. (2) The average total Agency RMBS is calculated by averaging the month end cost basis of Agency RMBS during the period. (3) The average repurchase agreements are calculated by averaging the month end repurchase agreements balance during the period. (4) The average Agency RMBS liabilities are calculated by adding the average month end repurchase agreements balance plus average unsettled Agency RMBS during the period. (5) The average net assets are calculated by averaging the month end net assets during the period. (6) The average common shares outstanding are calculated by averaging the daily common shares outstanding during the period. (7) The leverage ratio is calculated by dividing (i) the Company’s repurchase agreements balance plus payable for securities purchased minus receivable for securities sold by (ii) net assets. (8) The average yield on settled Agency RMBS for the period is calculated by dividing interest income from Agency RMBS by average settled Agency RMBS. (9) The average yield on total Agency RMBS including drop income for the period is calculated by dividing interest income from Agency RMBS plus drop income by average total Agency RMBS. (10) The average cost of funds and hedge for the period is calculated by dividing total interest expense, including net swap and cap interest income (expense), by average repurchase agreements. (11) The adjusted average cost of funds and hedge for the period is calculated by dividing total interest expense, including net swap and cap interest income (expense), by average Agency RMBS liabilities. (12) The interest rate spread net of hedge for the period is calculated by subtracting average cost of funds and hedge from average yield on settled Agency RMBS. (13) The interest rate spread net of hedge including drop income for the period is calculated by subtracting adjusted average cost of funds and hedge from average total yield on Agency RMBS including drop income. (14) The operating expense ratio for the period is calculated by dividing operating expenses by average net assets. 21 *All percentages are annualized. 21
|
|
History of Transparent and Consistent Financial Reporting CYS uses Financial Reporting for Investment Companies CYS Financial Reporting – Transparent and Best in Class Schedule of investments NAVs have reflected mark-to-market accounting since inception Realized and unrealized losses taken through income statement in period incurred No OCI account on balance sheet 22
|
|
Investment Outlook -November 2013 Kevin E. Grant, CFA Chief Executive Officer 2013 Banking and Financial Services Conference November 12, 2013 23