Attached files
| file | filename |
|---|---|
| 8-K - FORM 8-K - SHORE BANCSHARES INC | v355561_8k.htm |

Lloyd L. “Scott” Beatty, Jr. President & CEO George S. Rapp Vice President & CFO FIG Partners’ 9 th Annual Bank CEO Forum September 16 - 17, 2013
Forward - Looking Statement This presentation includes forward - looking statements, including statements about future results. These statements are subject to uncertainties and risks, including but not limited to our ability to integrate acquisitions; the strength of the U.S. economy and the local economies where we conduct operations; harsh weather conditions; fluctuations in inflation, interest rates, or monetary policies; changes in the stock market and other capital and real estate markets; legislative or regulatory changes; customer acceptance of third - party products and services; increased competition and its effect on pricing; technological changes; security breaches and computer viruses that may affect our computer systems; changes in consumer spending and savings habits; our growth and profitability; changes in accounting; and our ability to manage the risks involved in the foregoing. These factors, as well as additional factors, can be found in our Annual Report on Form 10 - K for the fiscal year ended December 31, 2012 along with our other filings with the SEC, which are available at the SEC’s internet site ( www.sec.gov ). Actual results may differ materially from projections and could be affected by a variety of factors, including factors beyond our control. Forward - looking statements in this presentation speak only as of the date of these materials, and we assume no obligation to update forward - looking statements or the reasons why actual results could differ. In addition, this presentation includes certain non - GAAP financial measures. 2
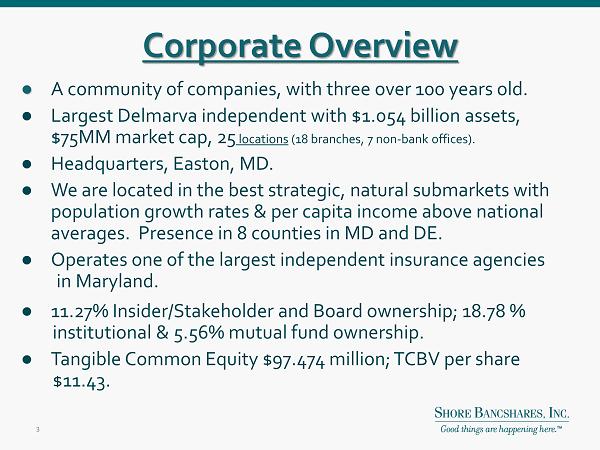
● A community of companies, with three over 100 years old. ● Largest Delmarva independent with $1.054 billion assets, $75MM market cap, 25 locations (18 branches, 7 non - bank offices). ● Headquarters, Easton, MD. ● We are located in the best strategic, natural submarkets with population growth rates & per capita income above national averages. Presence in 8 counties in MD and DE. ● Operates one of the largest independent insurance agencies in Maryland. ● 11.27% Insider/Stakeholder and Board ownership; 18.78 % institutional & 5.56% mutual fund ownership. ● Tangible Common Equity $97.474 million; TCBV per share $11.43. Corporate Overview 3
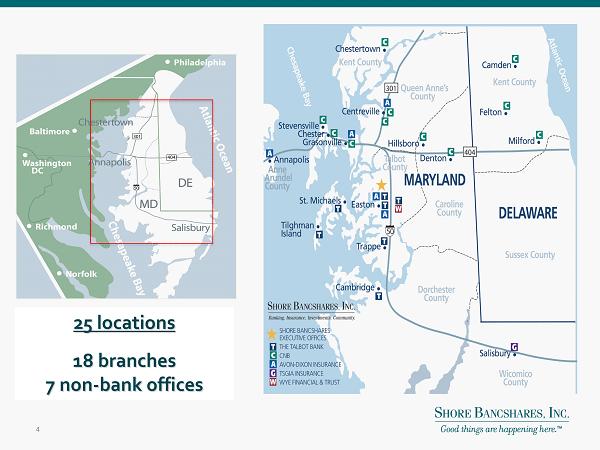
25 locations 18 branches 7 non - bank offices 4

Selected SHBI Market Highlights • Projected 5 - year population growth (2010 - 2015) in DE market exceeds 10%; growth rates in two leading MD counties (Talbot & Queen Anne’s) to exceed 4% combined. • Current median age across market is ~40 years old. • Household income for entire 2 - state franchise is $67,000 vs. $53,000 for the U.S. • 8 - county footprint has strong small business base with >7,000 business establishments; 10% employ more than 100 workers. • SHBI deposit market share by county: – Maryland Delaware – Talbot -- #1 Kent -- #7 – Queen Anne’s -- #2 – Caroline -- #3 – Kent -- #5 – Dorchester -- #6 – Anne Arundel & Wicomico * * Non - Bank subsidiaries only Data sources: SNL Financial, Inc . 5

Shore Bancshares, Inc. Bank Branch Competitors Report Within 1 Mile Within 5 Miles Company Name Competing Branches Deposits in Competing Branches Competing Branches Deposits in Competing Branches Shore Bancshares, Inc . 18 1,034,121 Money Centers 25 1,001,128 41 1,842,106 Community Banks 23 982,376 34 1,457,890 TOTALS 48 1,983,504 75 3,299,996 6
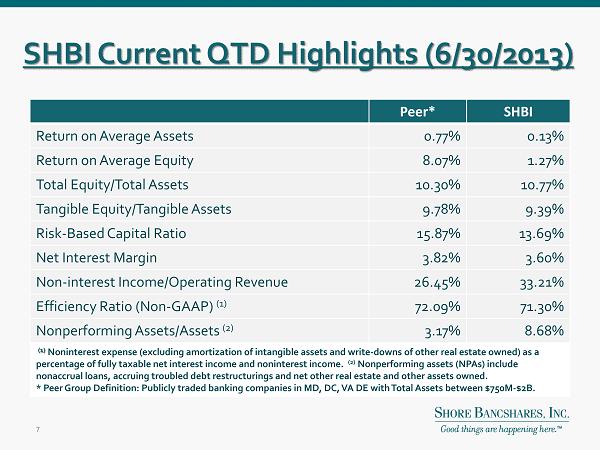
SHBI Current QTD Highlights (6/30/2013) Peer* SHBI Return on Average Assets 0.77% 0.13% Return on Average Equity 8.07% 1.27% Total Equity/Total Assets 10.30% 10.77% Tangible Equity/Tangible Assets 9.78% 9.39% Risk - Based Capital Ratio 15.87% 13.69% Net Interest Margin 3.82% 3.60% Non - interest Income/Operating Revenue 26.45% 33.21% Efficiency Ratio (Non - GAAP) (1) 72.09% 71.30% Nonperforming Assets/Assets (2) 3.17% 8.68% (1) Noninterest expense (excluding amortization of intangible assets and write - downs of other real estate owned) as a percentage of fully taxable net interest income and noninterest income. (2) Nonperforming assets (NPAs) include nonaccrual loans, accruing troubled debt restructurings and net other real estate and other assets owned. * Peer Group Definition: Publicly traded banking companies in MD, DC, VA DE with Total Assets between $750M - $2B. 7
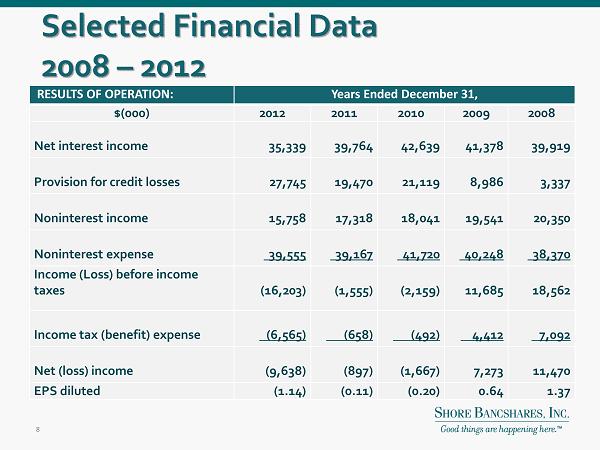
Selected Financial Data 2008 – 2012 RESULTS OF OPERATION: Years Ended December 31, $(000) 2012 2011 2010 2009 2008 Net interest income 35,339 39,764 42,639 41,378 39,919 Provision for credit losses 27,745 19,470 21,119 8,986 3,337 Noninterest income 15,758 17,318 18,041 19,541 20,350 Noninterest expense 39,555 39,167 41,720 40,248 38,370 Income (Loss) before income taxes (16,203) ( 1,555) ( 2,159) 11,685 18,562 Income tax (benefit) expense (6,565) (658) (492) 4,412 7,092 Net (loss) income (9,638) ( 897) ( 1,667) 7,273 11,470 EPS diluted (1.14) (0.11) (0.20) 0.64 1.37 8

Pre Tax Pre Provision ROA 1.36 1.02 0.44 0.89 1.19 0.00% 0.20% 0.40% 0.60% 0.80% 1.00% 1.20% 1.40% 1.60% 2Q12 3Q12 4Q12 1Q13 2Q13 9

• Loan Composition • Deposit Composition Loans and Deposits (As of 6/30/2013) Construction 13.4% Residential Real Estate 24.9% Commercial Real Estate 36.3% Farmland 4.7% Multi - Family 3.7% Commercial and Industrial 7.2% Consumer 9.8 % Noninterest - bearing demand 17.2% Interest - bearing demand 17.3% Money market and savings 22.8% Certificates of deposit $100,000 or more 21.5% Other time 21.2% 10

Loan Composition (Dollar Value in Thousands) As of June 30, 2012 As of December 31, 2012 As of June 30, 2013 Annu al Growth Loan Type Balance % of Total Balance % of Total Balance % of Total % Construction – 1 - 4 Family $ 8,793 1.1% $ 11,309 1.4% $ 10,825 1.4% 23.1% Construction – Other 102,274 12.6 96,742 12.3 93,691 12.0 (8.4) Residential Real Estate 203,186 25.1 193,496 24.7 194,634 24.8 (4.2) Commercial Real Estate – Owner Occupied 167,203 20.6 166,886 21.3 170,256 21.8 1.8 Commercial Real Estate - Other 109,460 13.5 111,883 14.3 114,319 14.6 4.4 Farmland 38,981 4.8 36,172 4.6 36,616 4.7 (6.1) Multi - Family 30,399 3.8 26,187 3.3 28,582 3.7 (6.0) Commercial & Industrial 63,004 7.8 60,786 7.7 56,448 7.2 (10.4) Home Equity 72,508 9.0 68,328 8.7 65,278 8.3 (10.0) Other Consumer 14,150 1.7 13,293 1.7 11,539 1.5 (18.5) Total $ 809,958 100% $ 785,082 100% $ 782,188 100% (3.4%) 11

Deposit Composition (Dollar Value in Thousands) As of June 30, 2012 As of December 31, 2012 As of June 30, 2013 A nn ual Growth Deposit Type Balance % of Total Balance % of Total Balance % of Total % Noninterest Bearing Demand $ 149,472 14.5% $ 153,992 14.7% $ 158,562 17.2% 6.1% 1 Interest Bearing Demand 147,159 14.2 187,843 17.9 159,925 17.3 8.7 Money Market & Savings 281,003 27.2 278,653 26.6 210,500 22.8 (25.1) 3 CDs $100,000 or more 246,405 23.9 225,052 21.4 198,089 21.5 (19.6) 2 Other Time 208,664 20.2 203,733 19.4 195,031 21.2 (6.5) Total Deposits $ 1,032,703 100% $ 1,049,273 100% $ 922,107 100% (10.7%) 1 Commercial focus drives growth of Noninterest Bearing Demand accounts 2 De - emphasis of Time Deposits as funding source 3 Money Market and Savings declined due to termination of Promontory IND Funding Program of $90 million 12

Credit Composition & Quality ● Historically, SHBI’s asset quality has been strong 2008 2009 2010 2011 2012 6/30/2013 NPAs / Assets (1) 0.81% 1.78% 5.74% 7.42% 8.14% 8.68% Non accrual Loans/Loans 0.91% 1.78% 4.05% 6.11% 4.65% 4.45% Accruing Troubled Debt Restructurings/Loans 0.03% 0.19% 2.79% 3.00% 6.67% 6.43% Allowance / Average Loans 1.11% 1.19% 1.57% 1.64% 1.96% 2.00% Allowance / Nonaccrual Loans 1.15 x 0.67 x 0.39 x 0.28 x 0.44 x 0.45 x Net Charge - offs / Average Loans 0.19% 0.81% 1.96% 2.22% 3.20% 1.38% 1) Nonperforming assets include nonaccrual loans, accruing troubled debt restructurings and net other real estate and other a sse ts owned. 13

Credit Quality Trends (Dollars in Thousands) As of 6/30/2011 As of 12/31/2011 As of 6/30/2012 As of 12/31/2012 As of 6/30/2013 Nonaccrual Loans $ 48,476 $ 51,370 $ 47,958 $ 36,474 $ 34,818 Accruing Troubled Debt Restructurings 22,659 25,208 37,231 52,353 50,278 Total Nonperforming Loans 71,135 76,578 85,189 88,827 85,096 Other Real Estate Owned 7,877 9,385 11,449 7,659 6,408 Total Nonperforming Assets 79,012 85,963 96,688 96,486 91,504 Loans 90 Days or More Past Due & Still Accruing 990 2,723 3,519 460 3 NPA’s+ Loans 90 Days Past Due/Assets $ 80,002 $ 88,686 $ 100,207 $ 96,946 $ 91,507 Allowance for Credit Losses $ 16,358 $ 14,288 $ 12,990 $ 15,991 $ 15,723 Allowance for Credit Losses/Loans 1.86% 1.70% 1.60% 2.04% 2.01% Allowance for Credit Losses/NPLs 23.00% 18.66% 15.25% 18.00% 18.48% QTD Net Charge - Offs $ 6,508 $ 3,287 $ 4,079 $ 6,614 $ 2,712 Annualized NCOs/Average Loans 2.96% 1.53% 2.01% 3.29% 1.38% 14

Overview of TDRs ● 57 performing restructured loans currently outstanding with $50.3 million in aggregate balances ● 49% of TDRs were performing prior to restructuring ● Restructurings by type: – Reduction of interest rate = 9 loans – Extension of term = 2 loans – Reduction of interest rate and extension of term = 14 loans – Deferment of interest or principal = 1 loan – Consolidation = 3 loans – Combination of the above = 28 loans 15

Revenue Composition Revenue Breakdown 2013 Noninterest Income Detail (1) ( 1) Noninterest income excludes investment securities gains and loss on termination of cash flow hedge. Dollars in thousands 24% 25% 26% 34% 32% 31% 66% 68% 70% 70% 70% 67% 34% 32% 30% 30% 30% 33% $0 $10,000 $20,000 $30,000 $40,000 $50,000 $60,000 $70,000 2008 2009 2010 2011 2012 6/30/2013 Net Interest income % Noninterest Income % Service charges on deposit accounts 13.3% Trust and Investment fee income 8.9% Insurance agency commissions income 61.5% Other 16.3% 16

Capital Adequacy 10.32% 9.38% 9.35% 9.16% 8.36% 9.39% 12.74% 12.59% 13.07% 13.80% 13.32% 13.69% 11.65% 11.45% 11.81% 12.55% 12.05% 12.43% 0.00% 2.00% 4.00% 6.00% 8.00% 10.00% 12.00% 14.00% 16.00% 2008 2009 2010 2011 2012 6/30/2013 Tangible Equity/Tangible Assets Total Risk-Based Capital Ratio Tier 1 Risk-Based Capital Ratio 17

What Makes SHBI Unique? ● Track record of consistent financial performance ▪ Capital Position Remains Solid ▪ Respectable Net Interest Margin ▪ Diversity of Revenue Sources ▪ Strong Control of Operating Expenses ● Dominant independent financial services company in all markets within footprint 18

Looking Ahead Strategically Strategic Direction ● Capitalize on investments in infrastructure and dominant market position ● Restore consistent profitability - Credit discipline along with refining risk tolerance with emphasis on credit quality - Continued emphasis on fee revenue growth - Diligent expense control redeploying to revenue generating businesses - Improve core Efficiency Ratio ● Emphasize sustainable organic growth - Instill a true sales culture across all business lines - Grow customer base by taking share from local/national competitors ($3.6 billion available) - Focus on relationships to increase deposit penetration & multi - product usage ● Exploit significant cross sell opportunity across lines of business 19

Compelling Investment Considerations ● We are a very different Company now x Reduced emphasis on R/E as collateral x Strengthened noninterest revenue sources x Continuing to build organizational depth x Forge a sales culture with new branding thrust x Revamped strategic plan positions for growth x Instilled a new sense of urgency ● Focused on creating sustainable competitive advantages ● Scarcity of investment opportunities in our market ● Current valuation is attractive (trade at 75% of TBV) 20
SHBI – Price Change (%) 21
ADDENDUM 22

Peer Group Definition Publically traded banking companies in MD, DC, VA, DE with total assets between $750M - $2B. 23
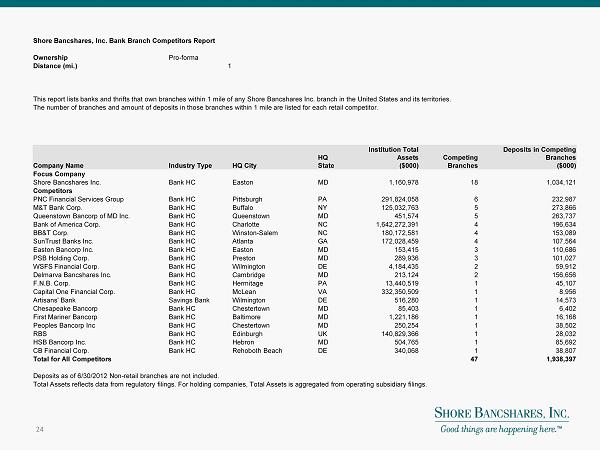
Shore Bancshares, Inc. Bank Branch Competitors Report Ownership Pro - forma Distance (mi.) 1 This report lists banks and thrifts that own branches within 1 mile of any Shore Bancshares Inc. branch in the United States and its territories. The number of branches and amount of deposits in those branches within 1 mile are listed for each retail competitor. Company Name Industry Type HQ City HQ State Institution Total Assets ($000) Competing Branches Deposits in Competing Branches ($000) Focus Company Shore Bancshares Inc. Bank HC Easton MD 1,160,978 18 1,034,121 Competitors PNC Financial Services Group Bank HC Pittsburgh PA 291,824,058 6 232,987 M&T Bank Corp. Bank HC Buffalo NY 125,032,763 5 273,866 Queenstown Bancorp of MD Inc. Bank HC Queenstown MD 451,574 5 263,737 Bank of America Corp. Bank HC Charlotte NC 1,642,272,391 4 196,634 BB&T Corp. Bank HC Winston - Salem NC 180,172,581 4 153,089 SunTrust Banks Inc. Bank HC Atlanta GA 172,028,459 4 107,564 Easton Bancorp Inc. Bank HC Easton MD 153,415 3 110,686 PSB Holding Corp. Bank HC Preston MD 289,936 3 101,027 WSFS Financial Corp. Bank HC Wilmington DE 4,184,435 2 59,912 Delmarva Bancshares Inc. Bank HC Cambridge MD 213,124 2 156,656 F.N.B. Corp. Bank HC Hermitage PA 13,440,519 1 45,107 Capital One Financial Corp. Bank HC McLean VA 332,350,509 1 8,956 Artisans' Bank Savings Bank Wilmington DE 516,280 1 14,573 Chesapeake Bancorp Bank HC Chestertown MD 85,403 1 6,402 First Mariner Bancorp Bank HC Baltimore MD 1,221,186 1 16,168 Peoples Bancorp Inc Bank HC Chestertown MD 250,254 1 38,502 RBS Bank HC Edinburgh UK 140,829,366 1 28,032 HSB Bancorp Inc. Bank HC Hebron MD 504,765 1 85,692 CB Financial Corp. Bank HC Rehoboth Beach DE 340,068 1 38,807 Total for All Competitors 47 1,938,397 Deposits as of 6/30/2012 Non - retail branches are not included. Total Assets reflects data from regulatory filings. For holding companies, Total Assets is aggregated from operating subsidia ry filings. 24

Shore Bancshares, Inc. Bank Branch Competitors Report Ownership Pro - forma Distance (mi.) 5 This report lists banks, thrifts and credit unions that own branches within 5 miles of any Shore Bancshares Inc. branch in th e U nited States and its territories. The number of branches and amount of deposits in those branches within 5 miles are listed for each retail competitor. Company Name SNL Institution Key Industry Type HQ City HQ State/C ountry Institution Total Assets ($000) Competing Branches Deposits in Competing Branches ($000) Focus Company Shore Bancshares Inc. 1027751 Bank HC Easton MD 1,160,978 18 1,034,121 Competitors PNC Financial Services Group 100406 Bank HC Pittsburgh PA 291,824,058 13 498,108 M&T Bank Corp. 100253 Bank HC Buffalo NY 125,032,763 8 539,549 Queenstown Bancorp of MD Inc. 1974087 Bank HC Queenstown MD 451,574 7 401,022 Bank of America Corp. 100369 Bank HC Charlotte NC 1,642,272,391 4 196,634 BB&T Corp. 100438 Bank HC Winston - Salem NC 180,172,581 4 153,089 SunTrust Banks Inc. 100449 Bank HC Atlanta GA 172,028,459 4 107,564 WSFS Financial Corp. 101999 Bank HC Wilmington DE 4,184,435 4 112,307 PSB Holding Corp. 1027834 Bank HC Preston MD 289,936 4 114,403 Easton Bancorp Inc. 1024016 Bank HC Easton MD 153,415 3 110,686 RBS 3001937 Bank HC Edinburgh United Kingdo m 140,829,366 3 155,726 First Wyoming Financial Corp. 4143149 Bank HC Wyoming DE 290,298 3 156,291 Wells Fargo & Co. 100382 Bank HC San Francisco CA 1,235,655,818 2 147,152 Capital One Financial Corp. 103239 Bank HC McLean VA 332,350,509 2 27,951 Artisans' Bank 1005062 Savings Bank Wilmington DE 516,280 2 60,983 Chesapeake Bancorp 1023344 Bank HC Chestertown MD 85,403 2 61,978 Peoples Bancorp Inc 1032860 Bank HC Chestertown MD 250,254 2 112,835 Delmarva Bancshares Inc. 4045515 Bank HC Cambridge MD 213,124 2 156,656 JRMB II Inc. 4275416 Bank HC Lawton OK 686,303 2 1,981 F.N.B. Corp. 100237 Bank HC Hermitage PA 13,440,519 1 45,107 Toronto - Dominion Bank 100519 Bank HC Toronto Canada 208,514,765 1 16,333 First Mariner Bancorp 1024706 Bank HC Baltimore MD 1,221,186 1 16,168 HSB Bancorp Inc. 4056109 Bank HC Hebron MD 504,765 1 85,692 CB Financial Corp. 4199286 Bank HC Rehoboth Beach DE 340,068 1 38,807 Total for All Competitors 89 3,948,212 Deposits as of 6/30/2012. Non - retail branches are not included. Total Assets reflects data from regulatory filings. For holding companies, Total Assets is aggregated from operating subsidia ry filings. 25

Company Name State Total Assets ($000) ROAA (%) ROAE (%) Total Equity/ Total Assets (%) Tangible Equity/ Tangible Assets (%) Risk Based Capital Ratio (%) Net Interest Margin (%) Noninterest Inc/ Operating Rev (%) Efficiency Ratio (%) NPAs/ Assets (%) MRQ 2013Q2 2013Q2 2013Q2 2013Q2 2013Q2 2013Q2 2013Q2 2013Q2 2013Q2 Access National Corporation VA 841,683 1.66 14.88 11.24 11.24 15.16 3.89 49.91 65.52 NA American National Bankshares Inc. VA 1,294,017 1.29 10.14 12.59 9.60 17.57 4.16 18.67 52.29 NA C&F Financial Corporation VA 992,681 1.69 15.65 10.66 9.68 17.70 7.64 28.55 57.80 1.43 Community Bankers Trust Corporation VA 1,124,567 0.58 5.46 10.03 9.29 16.90 4.31 10.53 76.75 3.02 Eastern Virginia Bankshares , Inc. VA 1,115,804 0.25 2.46 12.11 10.84 19.65 3.21 15.11 85.10 1.34 First Mariner Bancorp MD 1,216,090 (0.47) NM (1.09) (1.09) (1.40) 2.92 53.65 124.49 6.42 First United Corporation MD 1,329,206 0.56 7.38 7.36 6.58 14.84 3.07 25.64 77.17 3.79 Franklin Financial Corporation VA 1,050,630 0.63 2.76 22.76 22.76 28.23 2.58 9.66 65.00 5.12 Middleburg Financial Corporation VA 1,217,200 0.78 8.13 9.50 9.06 15.41 3.39 41.96 78.65 2.74 Monarch Financial Holdings, Inc. VA 1,021,399 1.35 15.26 9.28 9.19 13.46 4.10 68.86 82.82 0.30 National Bankshares , Inc. VA 1,091,086 1.61 11.54 13.34 12.63 22.90 4.24 17.95 43.63 1.76 Old Line Bancshares, Inc. MD 1,147,085 (0.04) (0.40) 9.39 8.39 NA 4.25 11.48 68.15 2.03 Old Point Financial Corporation VA 866,881 0.46 4.60 9.52 9.52 16.50 3.20 34.41 82.46 2.72 Severn Bancorp, Inc. MD 839,053 0.11 0.85 13.03 12.99 NA 3.29 23.25 76.41 11.52 Tri - County Financial Corporation MD 980,102 0.66 7.74 8.27 8.27 13.08 3.47 12.15 69.38 2.43 Valley Financial Corporation VA 806,339 0.96 12.41 7.49 7.49 14.33 3.73 16.21 62.47 3.80 Virginia Heritage Bank VA 847,753 1.21 12.40 10.61 10.61 15.60 3.56 31.98 62.73 0.64 Washington First Bankshares , Inc. VA 1,125,059 0.57 5.94 9.27 8.95 13.92 3.73 6.13 66.75 1.65 AVERAGES For Above Peer Group 1,050,369 0.77 8.07 10.30 9.78 15.87 3.82 26.45 72.09 3.17 Shore Bancshares, Inc. MD 1,054,277 0.13 1.27 10.77 9.39 13.69 3.60 33.21 71.30 8.68

SHBI Management Team Talent, depth, unique skills • Lloyd L. Beatty, Jr., 60, CPA, President & CEO of SHBI since June 2013, Director of SHBI since December 2000, Director of Talbot Bank since 1992. From October 2005, President & COO of SHBI. Formerly COO, private equity firm Darby Overseas Investments. Formerly Managing Partner of public accounting firm. • George S. Rapp , 60, CPA, Vice President and Chief Financial Officer of SHBI since February 2013. From 2010 to 2012 , Chief Financial Officer and one of the four executive founders of World Currency USA. From 2005 and 2010, Chief Financial Officer of Harleysville National Corporation . Prior to 2005, held various financial positions including CFO, SVP & Chief Accounting Officer, COO and Controller . • F. Winfield Trice , Jr ., 58, Director of SHBI and President & CEO of CNB (formerly Centreville National Bank of Maryland), since June 2007. From 1997 to June 2007, EVP & Senior Loan Officer Mercantile Peninsula Bank. From 1977 to 1997 served in various capacities with The First National Bank of Maryland (now M&T), ending as President & CEO of York Bank and Trust, a subsidiary bank of First Maryland . • Patrick M. Bilbrough , 48 , President and CEO of the Talbot Bank since December 2012. He joined Talbot Bank in May of 2011 as an Executive Vice President. Prior to his employment with Talbot Bank and since 2007, Mr. Bilbrough served as the Market Executive of PNC Bank, N.A . From 1995 to 2004, Mr. Bilbrough was with the Peoples Bank of Maryland, of Denton, where he had most recently been President and CEO after beginning as its Chief F inancial O fficer and comptroller. He was a small business owner from 1985 to 1995 . • Richard C. Trippe, Jr., 50 , President and CEO of Avon Dixon since 2011. After graduating from St. Mary’s College of Maryland with a Bachelor of Arts in Economics in 1985, he joined The Hartford Insurance Group, where he stayed for seventeen years. After leaving Hartford, worked for an independent agency in Baltimore County and subsequently ran a branch office for a national insurance wholesaler. • Christopher F. Spurry, 65, Chairman of the Board of SHBI since April 2006. Director of SHBI since April 2004 and Director of Talbot Bank since 1995. Owner and President of Spurry & Associates, Inc., a regional Manufacturer’s Representative firm serving the foodservice equipment industry. 27