Attached files
| file | filename |
|---|---|
| 8-K - FORM 8-K - HERITAGE FINANCIAL CORP /WA/ | d500587d8k.htm |
| EX-2.1 - EX-2.1 - HERITAGE FINANCIAL CORP /WA/ | d500587dex21.htm |
| EX-99.1 - EX-99.1 - HERITAGE FINANCIAL CORP /WA/ | d500587dex991.htm |
 Acquisition of
Valley Community Bancshares, Inc.
March 12, 2013
INVESTOR PRESENTATION
Heritage Financial Corporation |
 Forward-Looking Statements
This presentation includes forward-looking statements within the meaning of
the Private Securities Litigation Reform Act of 1995, which can
be
identified
by
words
such
as
“may,”
“expected,”
“anticipate,”
“continue,”
or
other
comparable
words.
In
addition,
all
statements
other than statements of historical facts that address activities that Heritage
Financial Corporation (“HFWA”) expects or anticipates will or
may occur in the future are forward-looking statements. Readers are
encouraged to read the Securities and Exchange Commission (“SEC”)
reports of HFWA, particularly its Form 10-K for the fiscal year ended
December 31, 2012, for meaningful cautionary language discussing why
actual results may vary materially from those anticipated by management.
Specific risks in this presentation include whether Valley
Community
Bancshares,
Inc.
(“Valley”)
shareholders
approve
the
merger,
whether
the
companies
receive
regulatory
approval
for
the
merger, whether the conditions to closing are satisfied, the timing of the
closing and management’s ability to effectively integrate the
companies, whether the companies have accurately predicted acquisition and
consolidation expenses, the timing and amount of savings from
consolidation, and the expected earnings contributions of both companies.
HFWA will file a registration statement and other relevant documents concerning
the transaction with the SEC and appropriate state and federal banking
authorities as soon as practical. HFWA and Valley will prepare a proxy statement/prospectus and other relevant
documents concerning the proposed transaction for the Valley shareholders.
Investors are urged to read such proxy statement/prospectus and
registration statements regarding the proposed transaction as they become available and any other relevant documents filed with the
SEC,
as
well
as
any
amendments
or
supplements
to
those
documents
because
they
will
contain
important
information.
You
will
be
able
to
obtain a free copy of the registration statement, as well as other filings
including the proxy statement/prospectus at the SEC’s internet site
(http://sec.gov). The documents can also be obtained, without charge, by
directing a written request to either Heritage Financial
Corporation,
P.O.
Box
1578,
Olympia,
WA,
98501,
Attention:
Brian
Vance,
or
Valley
Community
Bancshares,
Inc.,
1307
East
Main,
Puyallup WA 98372, Attention: David Brown. HFWA and Valley and their respective
directors and executive officers may be deemed to be participants in the
solicitation of proxies from the Valley shareholders in connection with the merger. Information about the directors and
executive officers of Valley and the interests of these participants may be
obtained by reading the proxy statement/prospectus regarding the
proposed transaction when it becomes available. 2
|
 •
Effective use of capital
•
In line with 2013 strategic objective to seek acquisitions within the current
footprint •
Further
enhances
the
franchise
branch
network
in
the
Puget
Sound
Region
–
Complements recent Northwest Commercial Bank acquisition
–
Notable increase in Pierce and King County deposit market share
•
Attractive loan and deposit portfolio mix
–
87% commercial real estate and commercial & industrial loans
–
77% in non-maturity deposits
•
Valley Bank has a consistent and proven track record
–
Asset quality metrics among the strongest in the Pacific Northwest
–
Sustained and strong earnings
•
Financially attractive deal pricing and structure with conservative modeling
assumptions –
Accretive to earnings in first full year following close
–
Significant cost savings to be realized
•
This
transaction
marks
HFWA’s
4
th
acquisition
in
the
past
3
years
Source: Company documents & SNL Financial
3
Transaction Highlights |
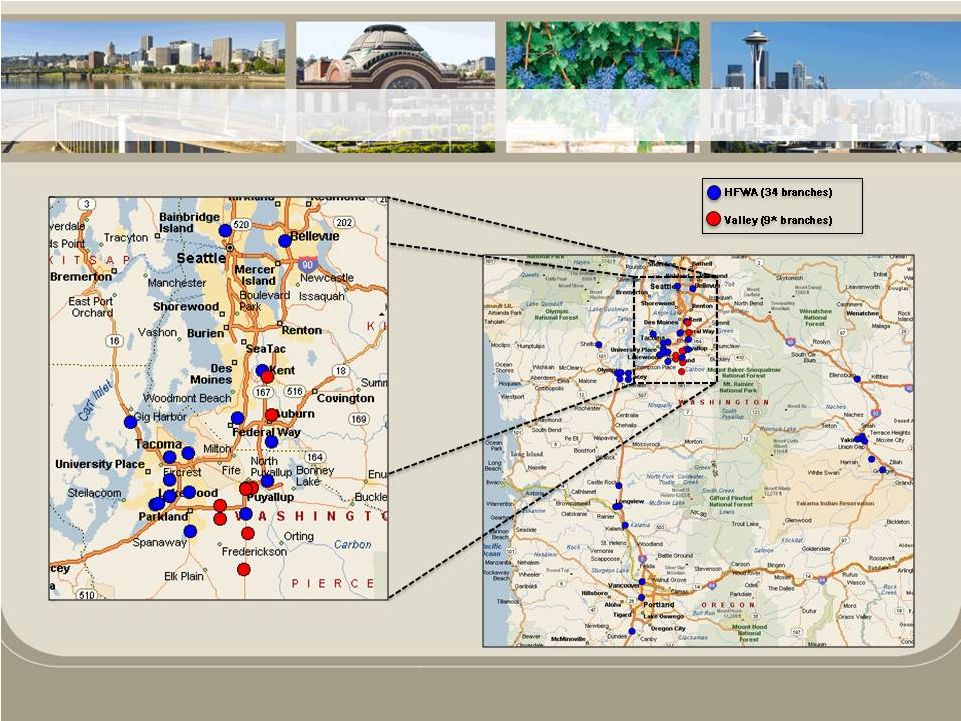 *1 location is a drive-up facility only
Source: Company documents, SNL Financial & Microsoft MapPoint.
4
Expanding Pacific Northwest Franchise |
 Transaction Value:
Approximately $44.2 million (including cash out of stock options)
Offer Price Per Share:
$39.00
Consideration Mix:
50% of Valley shares exchanged for $19.50 cash
50% of Valley shares exchanged for 1.3611 HFWA shares
Stock Option Treatment:
In-the-money stock options cashed out (approximately $232
thousand) Board Representation:
One Valley Board member will join the Board of HFWA
Exchange Ratio:
Fixed exchange ratio
Collars:
A 20% collar above and below HFWA’s stock price of $14.33
Walk-away Provision:
If HFWA’s stock price drops below $11.46 HFWA has the option to fill with
cash or stock or walk-away Termination Fee:
$1.76 million
Required Approvals:
Customary regulatory approvals and Valley shareholder approval
Expected
Closing
:
Q3 2013
Source: Company documents, SNL Financial & Microsoft MapPoint.
5
Transaction Overview |
 Purchase
Accounting
Adjustments
(pre-tax):
•
Estimated credit mark of 2.0% or ~$279 thousand
•
Estimated $1.5 million mark-up on real estate and other assets
•
Estimated core deposit intangible equaling 1.0% of Valley’s core deposits
(1)
Other Financial Impacts:
•
Estimated cost savings of between 45% and 50%
–
Phased-in 50% in 2013 and 100% in 2014
–
Assumes consolidation of four branches
•
Estimated after-tax deal related expenses of $2.0 million
(1)
Core deposits represent total deposits less total certificates
of deposit.
6
Transaction Financial Impact |
 •
Valley Bank has a history of strong and stable profitability with an average
ROAA of 0.97% over the past 5 years
•
Strong
asset
quality
has
been
maintained
throughout
the
economic
recession
•
Attractive low-cost funding mix (total cost of funds was 0.17% as of
12/31/2012) Note: Consolidated Valley Community Bancshares, Inc.
financials not publicly available. *1 location is a drive-up facility
only FTE = Full-time employees
Source: SNL Financial & Valley Bank call report data.
Overview:
Headquarters:
Year Established (BHC / Bank):
Number of Branches:
FTE:
Assets / FTE ($000s):
Puyallup, WA
1998 / 1972
9*
67
$3,615
Balance Sheet & Capital
Assets ($000s):
Deposits ($000s):
Gross Loans:
Loans / Deposits:
Securities / Assets:
TCE / TA:
Tier 1 Leverage Ratio:
$242,220
$212,501
$125,085
58.9%
25.9%
11.7%
11.2%
Profitability (FYE 2012)
ROAA:
ROAE:
Net Interest Margin:
Cost of Interest-Bearing Deposits:
Efficiency Ratio:
0.78%
6.57%
3.68%
0.25%
69.82%
Asset Quality
NPAs / Assets:
NPAs / (Loans + OREO):
Reserves / Loans:
Reserves / NPAs:
NCOs / Avg. Loans:
1.00%
1.93%
1.78%
91.94%
0.04%
7
Overview of Valley Bank |
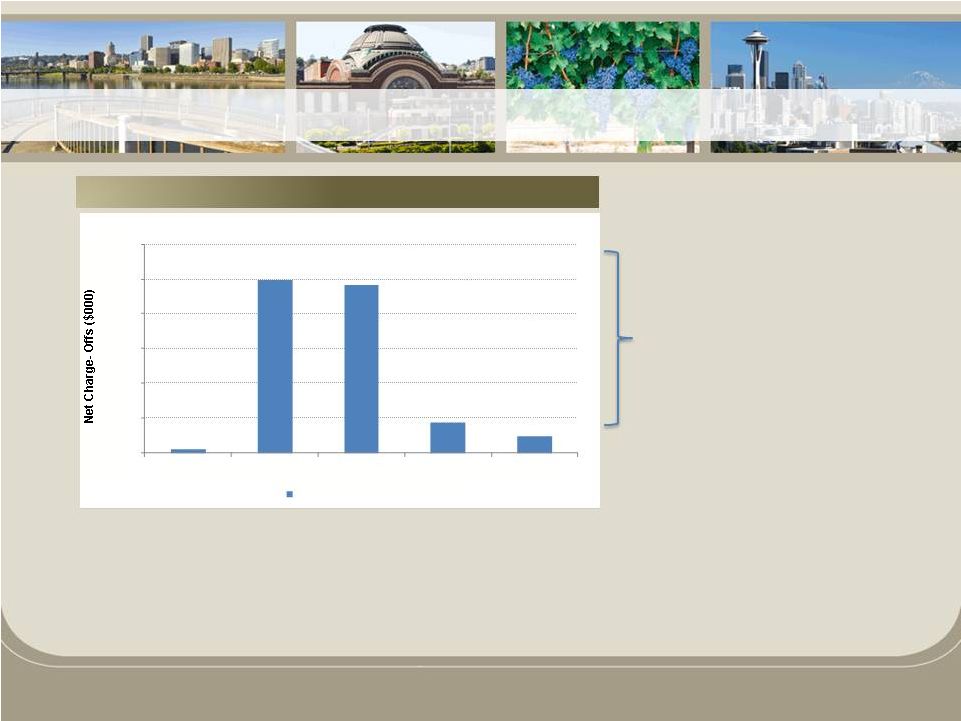 8
Strong Asset Quality
•
Valley has maintained strong asset quality throughout the economic downturn,
despite being located in a region that was not immune to the
recession Valley Net Charge-Off History
Cumulative net charge-offs since 2008
total $1.1 million
$0
$100
$200
$300
$400
$500
$600
2008
2009
2010
2011
2012
Net Charge-Offs per Year |
   9
Note: Pro forma deposit market share assumes no branch consolidations
Source: SNL Financial; deposit data as of 6/30/2012.
Pierce County
King County
2012
Rank
Institution (ST)
2012
Number of
Branches
2012
Total
Deposits in
Market
($000)
2012
Total
Market
Share
(%)
1
Columbia Banking System Inc. (WA)
22
1,541,409
17.65
2
KeyCorp (OH)
28
1,295,122
14.83
3
Bank of America Corp. (NC)
19
1,285,820
14.73
4
Wells Fargo & Co. (CA)
14
1,183,766
13.56
5
JPMorgan Chase & Co. (NY)
19
629,834
7.21
Pro Forma
17
574,316
6.58
6
U.S. Bancorp (MN)
23
493,981
5.66
7
Heritage Financial Corp. (WA)
10
403,116
4.62
8
Umpqua Holdings Corp. (OR)
11
313,600
3.59
9
Mitsubishi UFJ Finl Grp Inc
8
190,715
2.18
10
Valley Community Bcshs Inc (WA)
7
171,200
1.96
11
Timberland Bancorp Inc. (WA)
5
158,660
1.82
12
HomeStreet Inc. (WA)
2
120,214
1.38
13
Commencement Bank (WA)
1
115,369
1.32
14
Washington Federal Inc. (WA)
4
103,533
1.19
15
Sunwest Bank (CA)
2
101,708
1.16
Total For Institutions In Market
199
8,731,311
2012
Rank
Institution (ST)
2012
Number of
Branches
2012
Total
Deposits in
Market
($000)
2012
Total
Market
Share
(%)
1
Bank of America Corp. (NC)
92
17,079,370
29.76
2
Wells Fargo & Co. (CA)
62
7,642,973
13.32
3
U.S. Bancorp (MN)
57
7,171,379
12.49
4
JPMorgan Chase & Co. (NY)
83
5,559,521
9.69
5
KeyCorp (OH)
66
5,110,206
8.90
6
Washington Federal Inc. (WA)
30
2,592,770
4.52
7
Mitsubishi UFJ Finl Grp Inc
14
1,462,637
2.55
8
HomeStreet Inc. (WA)
11
1,059,585
1.85
9
HSBC
4
864,531
1.51
10
East West Bancorp Inc. (CA)
4
857,261
1.49
11
W.T.B. Financial Corp. (WA)
2
829,135
1.44
12
Sterling Financial Corp. (WA)
18
790,448
1.38
13
First Financial Northwest Inc (WA)
1
748,600
1.30
14
Zions Bancorp. (UT)
1
725,563
1.26
15
Columbia Banking System Inc. (WA)
14
683,910
1.19
25
Pro Forma
7
135,162
0.34
30
Heritage Financial Corp. (WA)
5
96,060
0.17
41
Valley Community Bcshs Inc (WA)
2
39,102
0.07
Total For Institutions In Market
557
57,396,911
In-Market Deposit Franchise Expansion |
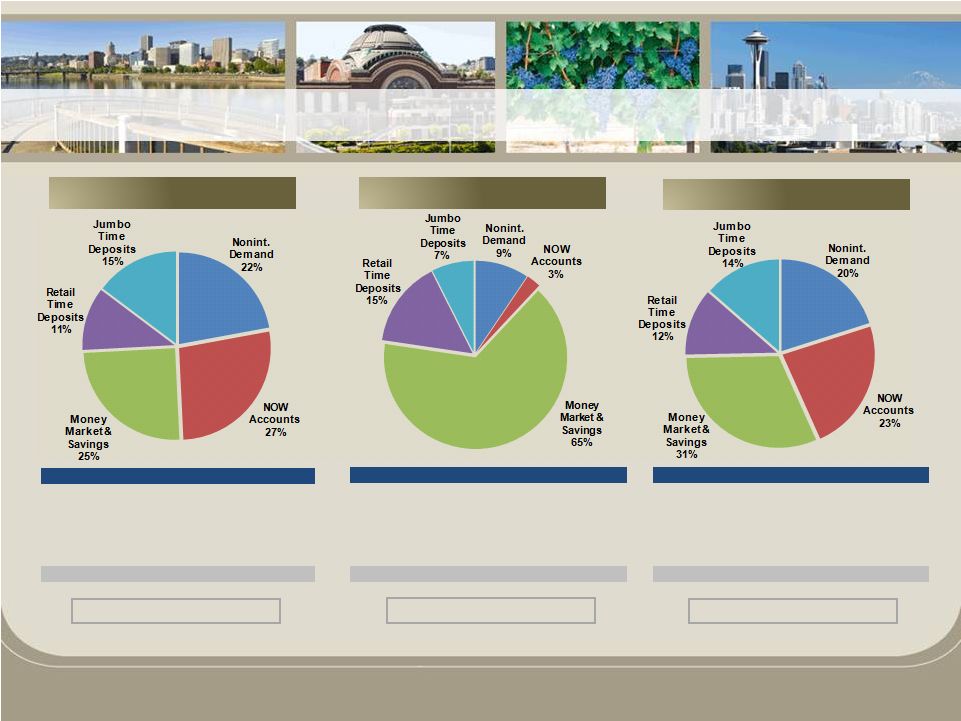 Note: Excludes pro forma impact of Northwest Commercial Bank on 1/9/2013.
(1)
Service utilized by Valley internally reclassifies certain money market
accounts to demand accounts (demand deposits ~25% of total deposits)
Source: Company filings & SNL Financial; data for the quarter ended
12/31/2012. HFWA
Valley
Pro Forma
Cost of Total Deposits: 0.34%
Cost of Total Deposits : 0.17%
Cost of Total Deposits : 0.31%
10
Pro Forma Deposit Composition
Deposit Composition ($000)
Amount
% of Total
Noninterest Demand
$247,048
22.1
%
NOW Accounts
303,487
27.1
Money Market & Savings
278,509
24.9
Retail Time Deposits
124,039
11.1
Jumbo Time Deposits
164,888
14.7
Total Deposits
$1,117,971
100.0
%
Deposit Composition ($000)
Amount
% of Total
Noninterest Demand
$20,104
9.5
%
NOW Accounts
5,371
2.5
Money Market & Savings
138,866
65.3
Retail Time Deposits
32,379
15.2
Jumbo Time Deposits
15,781
7.4
Total Deposits
$212,501
100.0
%
Deposit Composition ($000)
Amount
% of Total
Noninterest Demand
$267,152
20.1
%
NOW Accounts
308,858
23.2
Money Market & Savings
417,375
31.4
Retail Time Deposits
156,418
11.8
Jumbo Time Deposits
180,669
13.6
Total Deposits
$1,330,472
100.0
%
(1) |
 Note: Excludes pro forma impact of Northwest Commercial Bank on 1/9/2013.
*Loans acquired in FDIC-assisted transactions
Source: Company filings & SNL Financial; data for the quarter ended
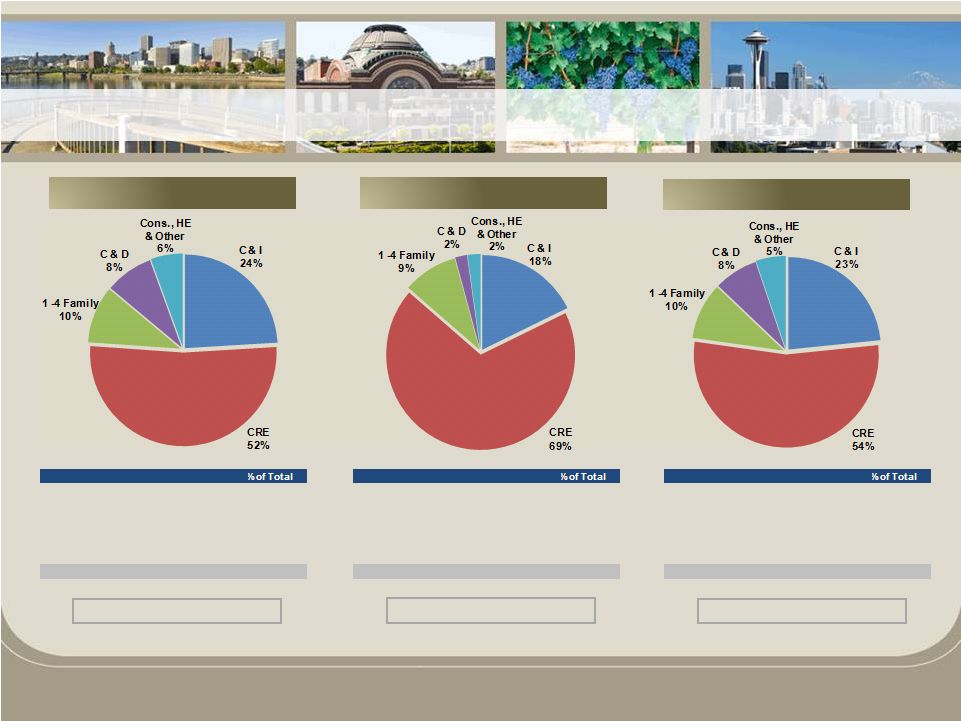
12/31/2012. HFWA
Valley
Pro Forma
Yield on Loans and Leases: 6.22%
Yield on Loans and Leases: 5.40%
Yield on Loans and Leases: 6.13%
11
Loan Composition ($000)
Amount
Commercial & Industrial
$247,429
24.1
%
Commercial Real Estate
535,397
52.1
1-4 Family Residential
102,298
9.9
C&D
86,246
8.4
Cons, HE & Other
57,244
5.6
Gross Loans & Leases
$1,028,614
100.0
%
Loan Composition ($000)
Amount
Commercial & Industrial
$22,239
17.8
%
Commercial Real Estate
85,912
68.6
1-4 Family Residential
11,753
9.4
C&D
2,538
2.0
Cons, HE & Other
2,758
2.2
Gross Loans & Leases
$125,200
100.0
%
Loan Composition ($000)
Amount
Commercial & Industrial
$269,668
23.4
%
Commercial Real Estate
621,309
53.8
1-4 Family Residential
114,051
9.9
C&D
88,784
7.7
Cons, HE & Other
60,002
5.2
Gross Loans & Leases
$1,153,814
100.0
%
Pro Forma Loan Composition |
 Note:
Impact includes completed acquisition of Northwest Commercial Bank on 1/9/2013.
(1)
Based on internal earnings estimates
(2)
Incremental
tangible
book
value
earnback
represents
the
number
of
years
to
eliminate
tangible
book
value
dilution
at
closing
utilizing
just
the
incremental
earnings
realized
through
the
merger
(it
ignores
HFWA
stand
alone
earnings)
(3)
Static tangible book value earnback represents the number of years to eliminate
tangible book value dilution at closing utilizing combined pro forma earnings
Earnings Accretion & Return
(1)
:
2014 EPS Accretion:
2015 EPS Accretion:
IRR:
Tangible Book Value Earnback Period:
> 19%
> 24%
> 16%
<4.5 years, using incremental earnings
(2)
<1.5 years, on static basis
(3)
Capital Ratios:
TCE / TA:
Leverage Ratio:
Tier 1 Ratio:
Total Risk-Based Capital Ratio:
13.9%
13.6%
18.7%
19.9%
11.7%
11.2%
20.3%
21.6%
11.7%
11.7%
16.4%
17.7%
Pro
Forma
12
Pro Forma Financial Impact |
 •
Accretive to earnings in the first full year after closing
•
A continuing and consistent execution of our growth and
acquisition strategies within existing geographic footprint
•
Drives growth, efficiency and scale strategies
•
A continuation of our capital leveraging strategies
•
Expected cost saves complements our strategic branch
efficiency plans
•
Increased size and scale favorably positions the
company for further acquisitions and growth strategies
13
Investment Value |
 Heritage Financial Corporation |