Attached files
| file | filename |
|---|---|
| 8-K - FORM 8-K - CAPSTEAD MORTGAGE CORP | d496856d8k.htm |
| EX-99.1 - EX-99.1 - CAPSTEAD MORTGAGE CORP | d496856dex991.htm |
Exhibit 99.2
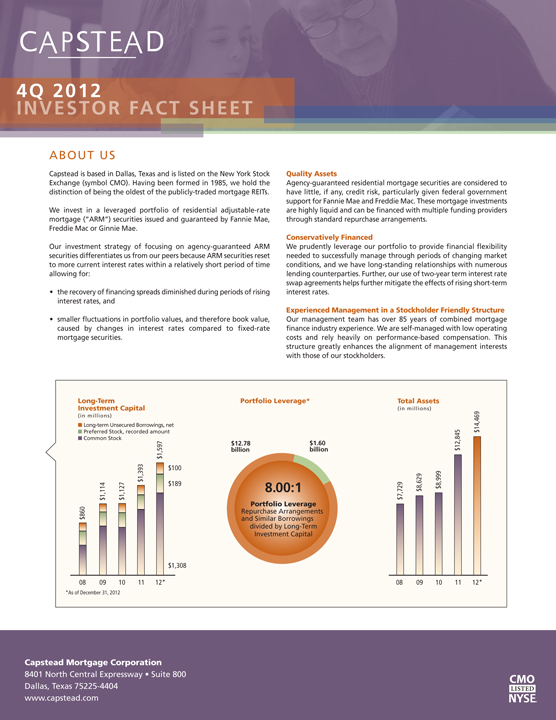
Portfolio Leverage*
Capstead Mortgage Corporation
8401 North Central Expressway Suite 800
Dallas,
$1.60
billion
$12.78
billion
Portfolio Leverage
Repurchase Arrangements
and Similar Borrowings
divided by Long-Term
Investment Capital
8.00:1
Long-Term
Investment Capital
(in millions)
Long-termUnsecured Borrowings, net
Preferred Stock, recorded amount
Common Stock
08 09 10 11 12*
$860
$1,114
Total Assets
(in millions)
08 09 10 11 12* $7,729 $8,629 $8,999 $1,127 $12,845 $14,469 $1,393 $1,597 $100
$189 $1,308
Capstead is based in Dallas, Texas and is listed on the New York Stock
Exchange (symbol CMO). Having been formed in 1985, we hold the
distinction of being the oldest of the publicly-traded mortgage REITs.
We invest in a leveraged portfolio of residential adjustable-rate
mortgage (“ARM”) securities issued and guaranteed by Fannie Mae,
Freddie Mac or Ginnie Mae.
Our investment strategy of focusing on agency-guaranteed ARM
securities differentiates us fromour peers because ARMsecurities reset
to more current interest rates within a relatively short period of time
allowing for:
the recovery of financing spreads diminished during periods of rising
interest rates, and
smaller fluctuations in portfolio values, and therefore book value,
caused by changes in interest rates compared to fixed-rate
mortgage securities.
Quality Assets
Agency-guaranteed residential mortgage securities are considered to
have little, if any, credit risk, particularly given federal government
support for FannieMae and FreddieMac. Thesemortgage investments
are highly liquid and can be financed with multiple funding providers
through standard repurchase arrangements.
Conservatively Financed
We prudently leverage our portfolio to provide financial flexibility
needed to successfully manage through periods of changing market
conditions, and we have long-standing relationships with numerous
lending counterparties. Further, our use of two-year term interest rate
swap agreements helps furthermitigate the effects of rising short-term
interest rates.
Experienced Management in a Stockholder Friendly Structure
Our management team has over 85 years of combined mortgage
finance industry experience.We are self-managed with low operating
costs and rely heavily on performance-based compensation. This
structure greatly enhances the alignment of management interests
with those of our stockholders.
ABOUT US
*As of December 31, 2012
Capstead Mortgage Corporation
8401 2012
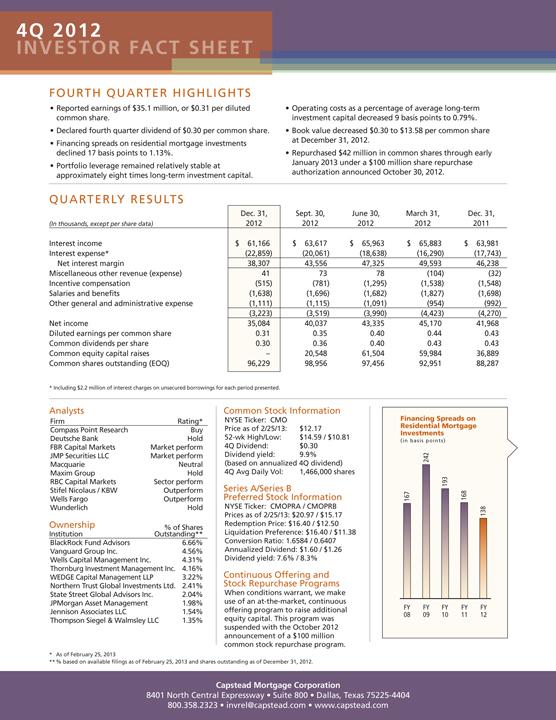
Financing Spreads on
Residential Mortgage
Investments
(in basis points)
FY FY FY FY FY
08 09 10 11 12
138167168
Analysts
Firm Rating*Compass Point Research BuyDeutsche Bank Hold
FBR Capital Markets Market performJMP Securities LLC Market performMacquarie NeutralMaxim Group HoldRBC Capital Markets Sector performStifel Nicolaus / KBW OutperformWells Fargo Outperform
Wunderlich HoldOwnership %of SharesInstitution Outstanding**BlackRock Fund Advisors 6.66%Vanguard Group Inc. 4.56%Wells Capital Management Inc. 4.31%Thornburg Investment Management Inc. 4.16%WEDGE Capital Management LLP 3.22%Northern Trust Global Investments Ltd. 2.41%State Street Global Advisors Inc. 2.04%JPMorgan Asset Management 1.98%Jennison Associates LLC 1.54%
Thompson Siegel &Walmsley LLC 1.35%
Common Stock Information
NYSE Ticker: CMOPrice as of 2/25/13: $12.1752-wk High/Low: $14.59 / $10.814Q Dividend: $0.30
Dividend yield: 9.9%(based on annualized 4Q dividend)
4Q Avg Daily Vol: 1,466,000 shares
Series A/Series B
Preferred Stock Information
NYSE Ticker: CMOPRA / CMOPRBPrices as of 2/25/13: $20.97 / $15.17Redemption Price: $16.40 / $12.50
Liquidation Preference: $16.40 / $11.38Conversion Ratio: 1.6584 / 0.6407Annualized Dividend: $1.60 / $1.26
Dividend yield: 7.6% / 8.3%
Continuous Offering and
Stock Repurchase Programs
When conditions warrant, we makeuse of an at-the-market, continuousoffering program to raise additional
equity capital. This program wassuspended with the October 2012
announcement of a $100 millioncommon stock repurchase program.
* As of February 25, 2013**% based on available filings as of February 25, 2013 and shares outstanding as of December 31, 2012.
242193 Reported earnings of $35.1 million, or $0.31 per dilutedcommon share.
Declared fourth quarter dividend of $0.30 per common share.
Financing spreads on residential mortgage investmentsdeclined 17 basis points to 1.13%.
Portfolio leverage remained relatively stable atapproximately eight times long-term investment capital.
Operating costs as a percentage of average long-terminvestment capital decreased 9 basis points to 0.79%.
Book value decreased $0.30 to $13.58 per common shareat December 31, 2012.
Repurchased $42 million in common shares through earlyJanuary 2013 under a $100 million share repurchaseauthorization announced October 30, 2012.
FOURTH QUARTER HIGHLIGHTS
QUARTERLY RESULTS
Dec. 31, Sept. 30, June 30, March 31, Dec. 31,(In thousands, except per share data) 2012 2012 2012 2012 2011
Interest income $ 61,166 $ 63,617 $ 65,963 $ 65,883 $ 63,981Interest expense* (22,859) (20,061) (18,638) (16,290) (17,743)Net interest margin 38,307 43,556 47,325 49,593 46,238Miscellaneous other revenue (expense) 41 73 78 (104) (32)Incentive compensation (515) (781) (1,295) (1,538) (1,548)Salaries and benefits (1,638) (1,696) (1,682) (1,827) (1,698)Other general and administrative expense (1,111) (1,115) (1,091) (954) (992)(3,223) (3,519) (3,990) (4,423) (4,270)Net income 35,084 40,037 43,335 45,170 41,968Diluted earnings per common share 0.31 0.35 0.40 0.44 0.43Common dividends per share 0.30 0.36 0.40 0.43 0.43
Common equity capital raises – 20,548 61,504 59,984 36,889Common shares outstanding (EOQ) 96,229 98,956 97,456 92,951 88,287* Including $2.2 million of interest charges on unsecured borrowings for each period presented.