Attached files
| file | filename |
|---|---|
| 8-K - CURRENT REPORT OF MATERIAL EVENTS OR CORPORATE CHANGES - HANGER, INC. | a13-6015_18k.htm |
Exhibit 99.1
|
|
150 YEARS Investor Presentation of Empowering Human Potential. February 2013 |
|
|
SAFE HARBOR Except for the historical information contained herein, the matters discussed in this presentation constitute forward-looking statements that involve risks and uncertainties that could cause actual results to differ materially from those projected. These include the rate at which Hanger grows same-center net sales, competitive pressures within the industry, government regulation and reimbursement, and other factors discussed from time to time in the reports filed by the company with the Securities and Exchange Commission. The company assumes no obligation to update information contained in this presentation. 1 |

|
|
VISION Be the partner of choice for products and services that enhance human physical capability. 2 |
|
|
OVERVIEW 3 $986million in revenues Adjusted EBITDA $165 million |
|
|
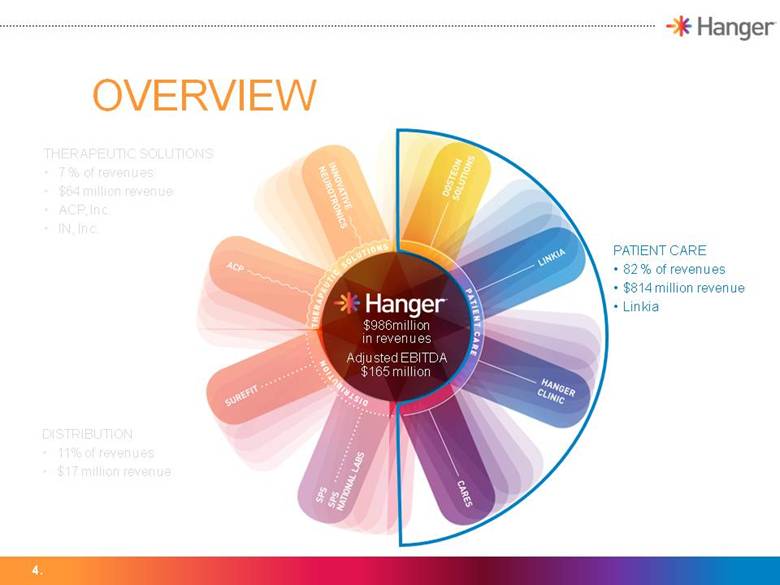
OVERVIEW 4 DISTRIBUTION 11% of revenues $17 million revenue THERAPEUTIC SOLUTIONS 7 % of revenues $64 million revenue ACP, Inc. IN, Inc. PATIENT CARE 82 % of revenues $814 million revenue Linkia $986million in revenues Adjusted EBITDA $165 million |
|
|
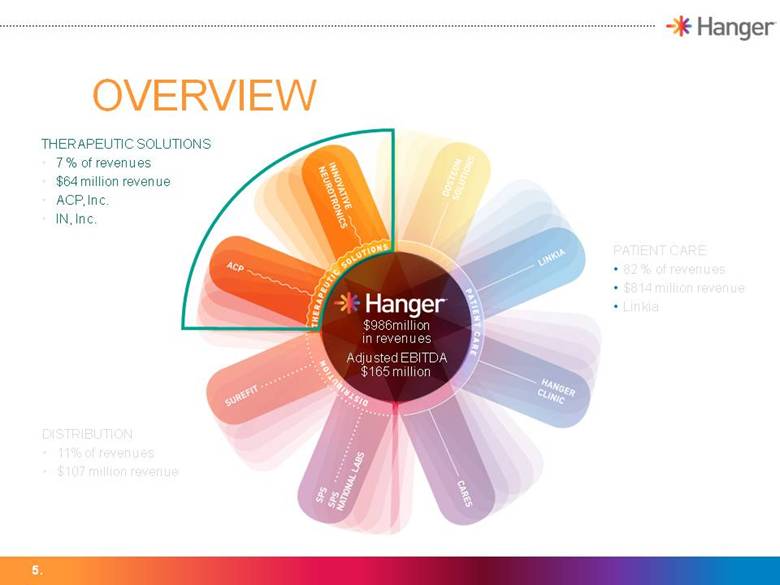
OVERVIEW 5 THERAPEUTIC SOLUTIONS 7 % of revenues $64 million revenue ACP, Inc. IN, Inc. DISTRIBUTION 11% of revenues $107 million revenue PATIENT CARE 82 % of revenues $814 million revenue Linkia $986million in revenues Adjusted EBITDA $165 million |
|
|
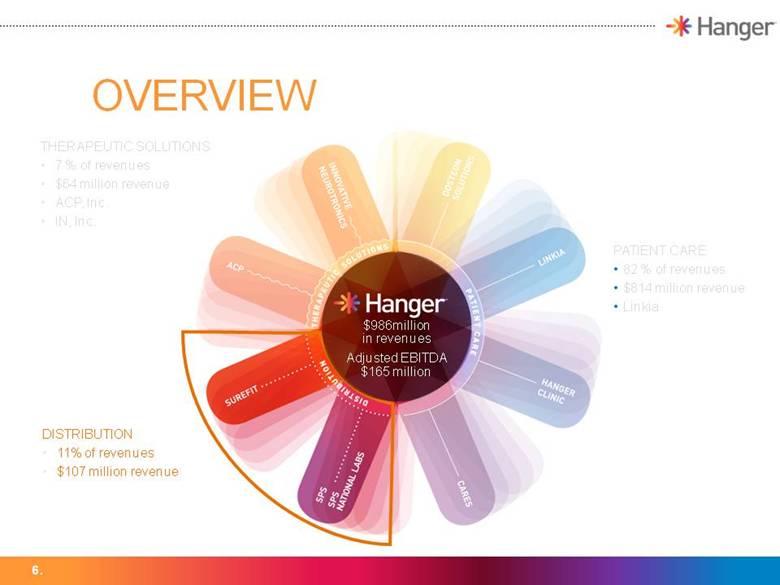
OVERVIEW 6 THERAPEUTIC SOLUTIONS 7 % of revenues $64 million revenue ACP, Inc. IN, Inc. DISTRIBUTION 11% of revenues $107 million revenue PATIENT CARE 82 % of revenues $814 million revenue Linkia $986million in revenues Adjusted EBITDA $165 million |
|
|
PATIENT CARE 7 |

|
|
8 PROFILE PATIENT CARE One or more certified clinicians Technical personnel Office administrators Line of site incentives to grow revenues and collect receivables CAGR up 6.7% (2009–2012) Business Overview Center Overview Over 740 O&P patient-care centers Over 1,300 O&P certified and licensed clinicians Stand alone—design, fabricate and fit Treat more than 1,000,000 patients annually |
|
|
9 MARKET POSITION PATIENT CARE Only national or regional provider No other provider has more than 2% market share $4.3 Billion Total Addressable Market |
|
|
PATIENT CARE REIMBURSEMENT SOURCES 10 |
|
|
COMPELLING GROWTH DRIVERS 11 Sources: Company estimates; Wall Street Research; 2003–2006 National Health and Nutrition Examination Survey; National Institutes of Health; Amputee Coalition of America. Aging Population (U.S.) (%) Diabetes – Prevalence By Age Group Disease and aging population Advancing technology Regulatory reform Increased focus on lowering costs |
|
|
PATIENT CARE First to market with new technologies and products Linkia Network Management Diversification into new adjacent businesses CARES Dosteon Solutions Small O&P acquisitions Sales synergies with ACP 12 GROWTH OPPORTUNITIES |
|
|
LINKIA First and only O&P network management company Insurers’ exclusive or preferred provider of their network Hanger network of approximately 1,120 O&P centers 55 contracts; 1–3 years; auto renew Value proposition to large name companies through expanded services 14.8% CAGR of contracted revenues (2009–2012) 13 NETWORK MANAGEMENT |
|
|
DISTRIBUTION 14 |
|
|
DISTRIBUTION Largest dedicated distributor of O&P devices and components Over 33,000 O&P related items 6 strategically located distribution facilities Comprehensive Customer Service Manufacture and distribute therapeutic footwear Net sales $107 million and CAGR of 6.8% (2009–2012) Inter-company sales $191 million 15 PROFILE |
|
|
DISTRIBUTION Increase depth and breadth of product line Increase penetration of existing customer base Expand customer base Expand market presence geographically Apply core competencies to adjacent businesses Expand O&P fabrication operation to Independent O&P Providers 16 OPPORTUNITIES |
|
|
THERAPEUTIC SOLUTIONS 17 |

|
|
THERAPEUTIC SOLUTIONS Innovative Neurotronics Development and commercialization of products V-Hold and WalkAid Accelerated Care Plus (ACP) Value proposition to rehabilitation providers Technology, clinical modalities, training and education 18 DIVERSIFICATION OF REVENUE |
|
|
ACP OVERVIEW 19 ACP enables post-acute providers with 24 evidence-based clinical therapy programs including: Physical Agent Modality Basics Wound Healing Fall Prevention Continence Improvement Contracture Management Pain Management Physical Agent Modality Basics Osteoarthritis of the Knee Orthotic Therapy Hemiplegic Gait Chronic Obstructive Pulmonary Disease Electrode Application & Safety Rheumatoid Arthritis of Wrist & Hand Stroke – Hand Edema Stroke Recovery Herpes Zoster (Shingles) Sports & Orthopedic Rehabilitation PRE’s with Elastic Bands Aerobic Exercise for Aging Adults PAM Documentation Recommendations Clients facility’s standard equipment package OMNISTIM® 500 AND OMNISTIM® FX2 ELECTRICAL STIMULATION OMNISOUND® 300 ULTRASOUND MEGAPULSE® SHORTWAVE DIATHERMY OMNICYCLE® MOTOR ASSISTED CYCLE Monthly Supplies |
|
|
FINANCIAL OVERVIEW 20 |

|
|
SOLID FINANCIAL POSITION Earnings and margin growth Substantial cash flow generation Strong balance sheet management Moderate leverage post ACP acquisition Consistent reduction of leverage 21 |
|
|
2012 IN REVIEW 4% growth in Same Stores Sales 11.1% growth in Adjusted EBITDA 13.8% increase in adjusted diluted earnings per share Leverage ratio to 2.78X Total liquidity at 12/31/2012 was $118.7 Million including $19.2 Million of cash Total Debt $520.60 Million 22 |
|
|
REVENUE GROWTH 23 ($ in millions) |
|
|
ADJUSTED EBITDA GROWTH AND MARGINS* 24 CAGR 15.9% Excludes relocation expenses and cost related to acquisitions. Adjusted EBITDA Adjusted EBITDA Margins % ($ in millions) 16.3% |
|
|
GROWTH IN ADJUSTED DILUTED EPS* 25 * Excludes relocation expenses, cost related acquisitions and the accelerated non-cash preferred dividend in 2008. ($ in millions) |
|
|
STEADY COMPARABLE QUARTER GROWTH 26 2009 2010 2011 2012 Adjusted EBITDA* ($ in millions) * Excludes relocation expenses and cost related to the ACP acquisition. Revenues ($ in millions) Adjusted Earnings Per Diluted Share* * Excludes relocation expenses, cost related to the ACP acquisition and accelerated non-cash preferred dividend. $0.10 $0.20 $0.30 $0.40 $0.50 $0.60 Q1 Q2 Q3 Q4 $160 $180 $200 $220 $240 $260 $280 Q1 Q2 Q3 Q4 $15 $25 $35 $45 $55 Q1 Q2 Q3 Q4 |
|
|
KEY INVESTMENT POINTS Compelling industry growth drivers Dominant market position Attractive organic growth opportunities Adjacent continuum of care opportunities Proven acquisition capabilities Solid financial position 27 |
|
|
(NYSE: HGR) 28 |