Attached files
| file | filename |
|---|---|
| EX-99.1 - EX-99.1 - AXIALL CORP/DE/ | a13-5132_1ex99d1.htm |
| EX-99.2 - EX-99.2 - AXIALL CORP/DE/ | a13-5132_1ex99d2.htm |
| 8-K - 8-K - AXIALL CORP/DE/ | a13-5132_18k.htm |
Exhibit 99.3
|
|
4th Quarter 2012 Earnings Presentation February 13, 2013 |
|
|
2 Safe Harbor This presentation contains certain statements relating to future events and our intentions, beliefs, expectations, and predictions for the future. Any such statements other than statements of historical fact are forward-looking statements within the meaning of the Securities Act and the Securities Exchange Act of 1934, as amended. Words or phrases such as “is expected,” may,” “will,” or “intend,” (including the negative or variations thereof) or similar terminology used in connection with any discussion of future plans, actions, or events generally identify forward-looking statements. These forward-looking statements are based on the current expectations of the management of Axiall, and include, but are not limited to the expected benefits of the Company’s merger with the chlor-alkali and derivatives business of PPG Industries, Inc., the expected cost advantage of natural gas in North America and the expected global demand for our products. There are a number of risks and uncertainties that could cause Axiall’s actual results to differ materially from the forward-looking statements included in this press release. These risks and uncertainties include risks relating to (i) a material adverse change, event or occurrence affecting Axiall or the newly acquired commodity chemicals business, (ii) the ability of Axiall to successfully integrate the businesses of PPG's commodity chemicals business and Axiall, which may result in the combined company not operating as effectively and efficiently as expected, (iii) the possibility that the merger and related transactions may involve other unexpected costs, liabilities or delays, and (iv) uncertainties regarding future prices, industry capacity levels and demand for Axiall’s products, raw materials and energy costs and availability, feedstock availability and prices, changes in governmental and environmental regulations, the adoption of new laws or regulations that may make it more difficult or expensive to operate Axiall’s businesses or manufacture its products after the merger, Axiall’s ability to generate sufficient cash flows from its business after the merger, future economic conditions in the specific industries to which its products are sold, and global economic conditions. In light of these risks, uncertainties, assumptions, and factors, the forward-looking events discussed in this press release may not occur. Other unknown or unpredictable factors could also have a material adverse effect on Axiall’s actual future results, performance, or achievements. For a further discussion of these and other risks and uncertainties applicable to Axiall and its business, see Axiall’s Annual Report on Form 10-K for the fiscal year ended December 31, 2011 and subsequent filings with the SEC. As a result of the foregoing, readers are cautioned not to place undue reliance on these forward-looking statements, which speak only as of the date of this press release. Axiall does not undertake, and expressly disclaims, any duty to update any forward-looking statement whether as a result of new information, future events, or changes in its expectations, except as required by law. |
|
|
3 Non-GAAP Measures Axiall supplements its financial statements prepared in accordance with U.S. Generally Accepted Accounting Principles (GAAP) with Adjusted EBITDA (Earnings Before Interest, Taxes, Depreciation, and Amortization, cash and non-cash restructuring charges and certain other charges, if any, related to financial restructuring and business improvement initiatives, gains or losses on substantial modification of debt and sales of certain assets, certain purchase accounting and certain non-income tax reserve adjustments, professional fees related to a previously disclosed and withdrawn unsolicited offer and our merger with PPG’s commodity chemicals business, goodwill, intangibles, and other long-lived asset impairments, and interest expense related to the OMERS lease-financing transaction) because investors commonly use Adjusted EBITDA as a main component of valuation analysis of cyclical companies such as Axiall. Adjusted EBITDA is not a measurement of financial performance under U.S. GAAP and should not be considered as an alternative to net income (loss) as a measure of performance or to cash provided by operating activities as a measure of liquidity. In addition, our calculation of Adjusted EBITDA may be different from the calculation used by other companies and, therefore, comparability may be limited. A reconciliation of net income (loss) determined in accordance with U.S. GAAP to Adjusted EBITDA is included in this presentation. |
|
|
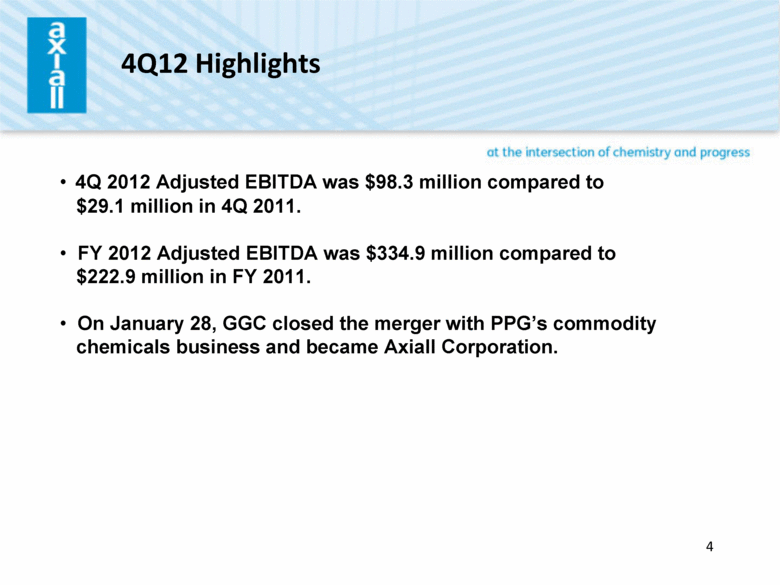
4 4Q12 Highlights 4Q 2012 Adjusted EBITDA was $98.3 million compared to $29.1 million in 4Q 2011. FY 2012 Adjusted EBITDA was $334.9 million compared to $222.9 million in FY 2011. On January 28, GGC closed the merger with PPG’s commodity chemicals business and became Axiall Corporation. |
|
|
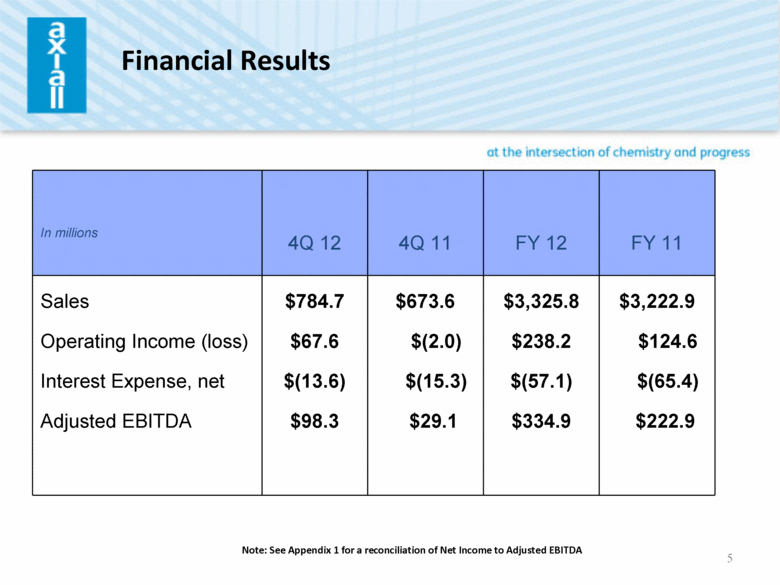
5 Financial Results In millions 4Q 12 4Q 11 FY 12 FY 11 Sales Operating Income (loss) Interest Expense, net Adjusted EBITDA $784.7 $67.6 $(13.6) $98.3 $673.6 $(2.0) $(15.3) $29.1 $3,325.8 $238.2 $(57.1) $334.9 $3,222.9 $124.6 $(65.4) $222.9 Note: See Appendix 1 for a reconciliation of Net Income to Adjusted EBITDA |
|
|
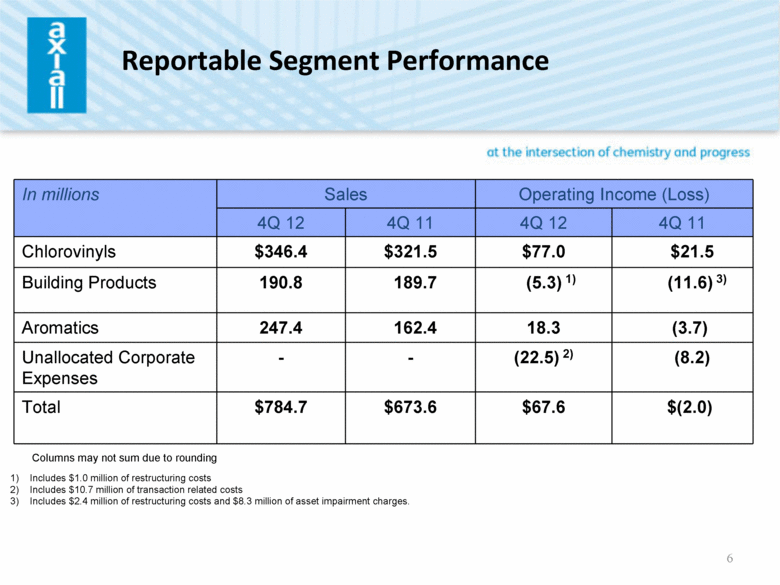
6 Reportable Segment Performance In millions Sales Operating Income (Loss) 4Q 12 4Q 11 4Q 12 4Q 11 Chlorovinyls $346.4 $321.5 $77.0 $21.5 Building Products 190.8 189.7 (5.3) 1) (11.6) 3) Aromatics 247.4 162.4 18.3 (3.7) Unallocated Corporate Expenses - - (22.5) 2) (8.2) Total $784.7 $673.6 $67.6 $(2.0) Includes $1.0 million of restructuring costs Includes $10.7 million of transaction related costs Includes $2.4 million of restructuring costs and $8.3 million of asset impairment charges. Columns may not sum due to rounding |
|
|
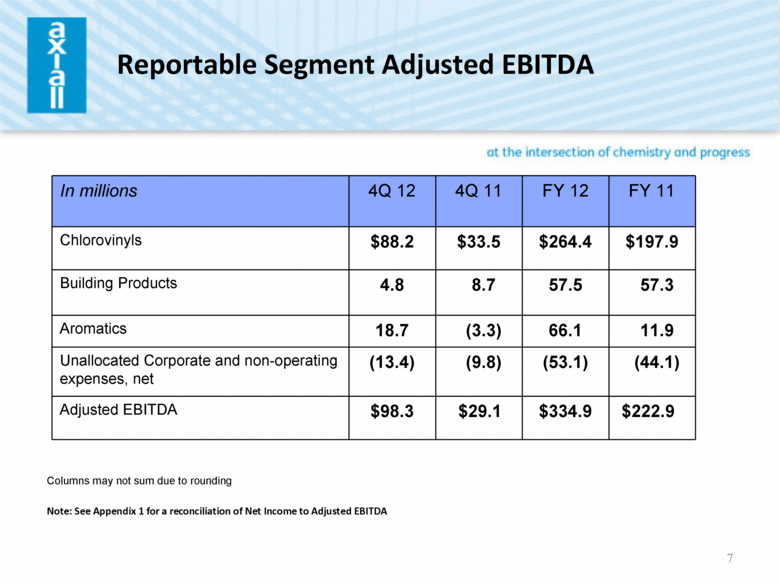
7 Reportable Segment Adjusted EBITDA In millions 4Q 12 4Q 11 FY 12 FY 11 Chlorovinyls $88.2 $33.5 $264.4 $197.9 Building Products 4.8 8.7 57.5 57.3 Aromatics 18.7 (3.3) 66.1 11.9 Unallocated Corporate and non-operating expenses, net (13.4) (9.8) (53.1) (44.1) Adjusted EBITDA $98.3 $29.1 $334.9 $222.9 Note: See Appendix 1 for a reconciliation of Net Income to Adjusted EBITDA Columns may not sum due to rounding |
|
|
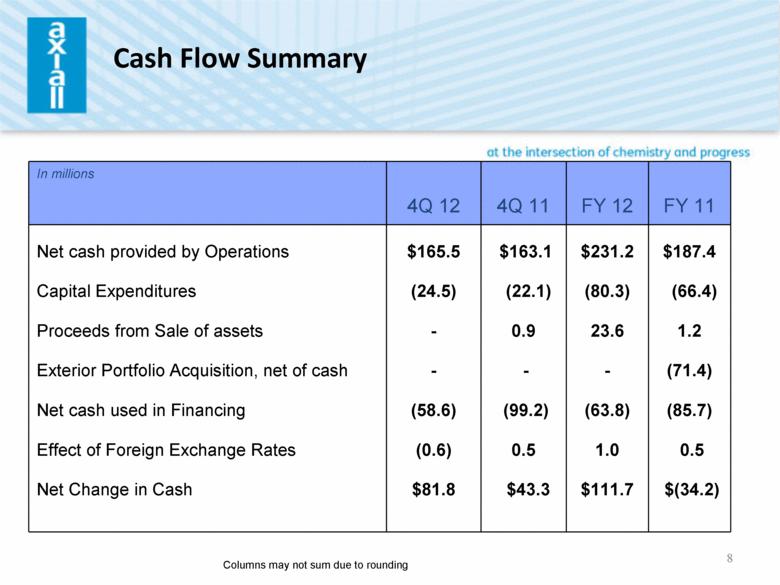
8 Cash Flow Summary In millions 4Q 12 4Q 11 FY 12 FY 11 Net cash provided by Operations Capital Expenditures Proceeds from Sale of assets Exterior Portfolio Acquisition, net of cash Net cash used in Financing Effect of Foreign Exchange Rates Net Change in Cash $165.5 (24.5) - - (58.6) (0.6) $81.8 $163.1 (22.1) 0.9 - (99.2) 0.5 $43.3 $231.2 (80.3) 23.6 - (63.8) 1.0 $111.7 $187.4 (66.4) 1.2 (71.4) (85.7) 0.5 $(34.2) Columns may not sum due to rounding |
|
|
9 Appendix Reconciliation of Non-GAAP Measures |
|
|
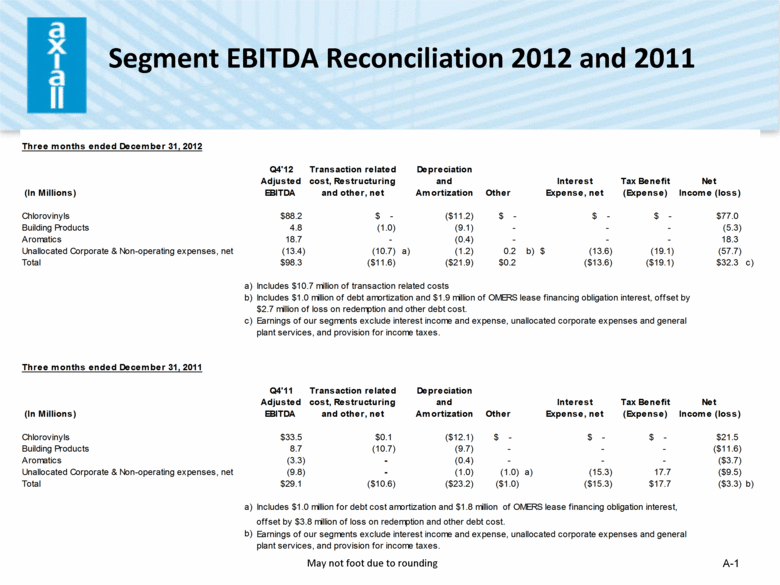
Segment EBITDA Reconciliation 2012 and 2011 A-1 May not foot due to rounding Three months ended December 31, 2012 Q4'12 Transaction related Depreciation Adjusted cost, Restructuring and Interest Tax Benefit Net (In Millions) EBITDA and other, net Amortization Other Expense, net (Expense) Income (loss) Chlorovinyls $88.2 $ - ($11.2) $ - $ - $ - $77.0 Building Products 4.8 (1.0) (9.1) - - - (5.3) Aromatics 18.7 - (0.4) - - - 18.3 Unallocated Corporate & Non-operating expenses, net (13.4) (10.7) a) (1.2) 0.2 b) (13.6) $ (19.1) (57.7) Total $98.3 ($11.6) ($21.9) $0.2 ($13.6) ($19.1) $32.3 c) a) Includes $10.7 million of transaction related costs b) Includes $1.0 million of debt amortization and $1.9 million of OMERS lease financing obligation interest, offset by $2.7 million of loss on redemption and other debt cost. c) Earnings of our segments exclude interest income and expense, unallocated corporate expenses and general plant services, and provision for income taxes. Three months ended December 31, 2011 Q4'11 Transaction related Depreciation Adjusted cost, Restructuring and Interest Tax Benefit Net (In Millions) EBITDA and other, net Amortization Other Expense, net (Expense) Income (loss) Chlorovinyls $33.5 $0.1 ($12.1) $ - $ - $ - $21.5 Building Products 8.7 (10.7) (9.7) - - - ($11.6) Aromatics (3.3) - (0.4) - - - ($3.7) Unallocated Corporate & Non-operating expenses, net (9.8) - (1.0) (1.0) a) (15.3) 17.7 ($9.5) Total $29.1 ($10.6) ($23.2) ($1.0) ($15.3) $17.7 ($3.3) b) a) Includes $1.0 million for debt cost amortization and $1.8 million of OMERS lease financing obligation interest, offset by $3.8 million of loss on redemption and other debt cost. b) Earnings of our segments exclude interest income and expense, unallocated corporate expenses and general plant services, and provision for income taxes. |
|
|
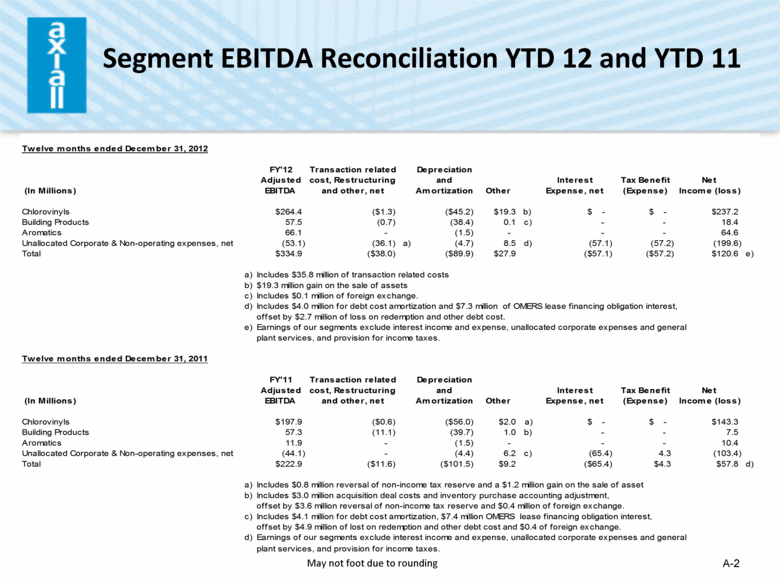
Segment EBITDA Reconciliation YTD 12 and YTD 11 A-2 May not foot due to rounding Twelve months ended December 31, 2012 FY'12 Transaction related Depreciation Adjusted cost, Restructuring and Interest Tax Benefit Net (In Millions) EBITDA and other, net Amortization Other Expense, net (Expense) Income (loss) Chlorovinyls $264.4 ($1.3) ($45.2) $19.3 b) $ - $ - $237.2 Building Products 57.5 (0.7) (38.4) 0.1 c) - - 18.4 Aromatics 66.1 - (1.5) - - - 64.6 Unallocated Corporate & Non-operating expenses, net (53.1) (36.1) a) (4.7) 8.5 d) (57.1) (57.2) (199.6) Total $334.9 ($38.0) ($89.9) $27.9 ($57.1) ($57.2) $120.6 e) a) Includes $35.8 million of transaction related costs b) $19.3 million gain on the sale of assets c) Includes $0.1 million of foreign exchange. d) Includes $4.0 million for debt cost amortization and $7.3 million of OMERS lease financing obligation interest, offset by $2.7 million of loss on redemption and other debt cost. e) Earnings of our segments exclude interest income and expense, unallocated corporate expenses and general plant services, and provision for income taxes. Twelve months ended December 31, 2011 FY'11 Transaction related Depreciation Adjusted cost, Restructuring and Interest Tax Benefit Net (In Millions) EBITDA and other, net Amortization Other Expense, net (Expense) Income (loss) Chlorovinyls $197.9 ($0.6) ($56.0) $2.0 a) $ - $ - $143.3 Building Products 57.3 (11.1) (39.7) 1.0 b) - - 7.5 Aromatics 11.9 - (1.5) - - - 10.4 Unallocated Corporate & Non-operating expenses, net (44.1) - (4.4) 6.2 c) (65.4) 4.3 (103.4) Total $222.9 ($11.6) ($101.5) $9.2 ($65.4) $4.3 $57.8 d) a) Includes $0.8 million reversal of non-income tax reserve and a $1.2 million gain on the sale of asset b) Includes $3.0 million acquisition deal costs and inventory purchase accounting adjustment, offset by $3.6 million reversal of non-income tax reserve and $0.4 million of foreign exchange. c) Includes $4.1 million for debt cost amortization, $7.4 million OMERS lease financing obligation interest, offset by $4.9 million of lost on redemption and other debt cost and $0.4 of foreign exchange. d) Earnings of our segments exclude interest income and expense, unallocated corporate expenses and general plant services, and provision for income taxes. |

