Attached files
| file | filename |
|---|---|
| EX-21 - EX-21 - AXIALL CORP/DE/ | d82062dex21.htm |
| EX-10.32 - EX-10.32 - AXIALL CORP/DE/ | d82062dex1032.htm |
| EX-10.22 - EX-10.22 - AXIALL CORP/DE/ | d82062dex1022.htm |
| EX-10.33 - EX-10.33 - AXIALL CORP/DE/ | d82062dex1033.htm |
| EX-23.1 - EX-23.1 - AXIALL CORP/DE/ | d82062dex231.htm |
| EX-32 - EX-32 - AXIALL CORP/DE/ | d82062dex32.htm |
| EX-31 - EX-31 - AXIALL CORP/DE/ | d82062dex31.htm |
| EX-10.3 - EX-10.3 - AXIALL CORP/DE/ | d82062dex103.htm |
Table of Contents
UNITED STATES
SECURITIES AND EXCHANGE COMMISSION
WASHINGTON, D.C. 20549
FORM 10-K
x ANNUAL REPORT PURSUANT TO SECTION 13 OR 15(d) OF
THE SECURITIES EXCHANGE ACT OF 1934
For the fiscal year ended December 31, 2015
OR
¨ TRANSITION REPORT PURSUANT TO SECTION 13 OR 15(d) OF THE SECURITIES EXCHANGE ACT OF 1934
For the transition period from to
Commission file number 1-9753

AXIALL CORPORATION
(Exact name of registrant as specified in its charter)
| DELAWARE (State or other jurisdiction of incorporation or organization) |
58-1563799 (I.R.S. Employer Identification No.) | |
| 1000 Abernathy Road, Suite 1200, Atlanta, Georgia (Address of principal executive offices) |
30328 (Zip Code) |
Registrant’s telephone number, including area code: (770) 395-4500
Securities registered pursuant to Section 12(b) of the Act:
| Title of each class |
Name of each exchange on which registered | |
| Common Stock, $0.01 par value | New York Stock Exchange, Inc. |
Securities registered pursuant to Section 12(g) of the Act: None
Indicate by check mark if the registrant is a well-known seasoned issuer, as defined in Rule 405 of the Securities Act. Yes x No ¨
Indicate by check mark if the registrant is not required to file reports pursuant to Section 13 or Section 15(d) of the Act. Yes ¨ No x
Indicate by check mark whether the registrant (1) has filed all reports required to be filed by Section 13 or 15(d) of the Securities Exchange Act of 1934 during the preceding 12 months (or for such shorter period that the registrant was required to file such reports), and (2) has been subject to such filing requirements for the past 90 days. Yes x No ¨
Indicate by check mark whether the registrant has submitted electronically and posted on its corporate Website, if any, every Interactive Data File required to be submitted and posted pursuant to Rule 405 of Regulation S-T (§ 232.405 of this chapter) during the preceding 12 months (or for such shorter period that the registrant was required to submit and post such files). Yes x No ¨
Indicate by check mark if disclosure of delinquent filers pursuant to Item 405 of Regulation S-K (§ 229.405 of this chapter) is not contained herein, and will not be contained, to the best of the registrant’s knowledge, in definitive proxy or information statements incorporated by reference in Part III of this Form 10-K or any amendment to this Form 10-K. x
Indicate by check mark whether the registrant is a large accelerated filer, an accelerated filer, a non-accelerated filer or a smaller reporting company. See definition of “large accelerated filer,” “accelerated filer,” and “smaller reporting company” in Rule 12b-2 of the Exchange Act. (Check one):
Large accelerated filer x Accelerated filer ¨ Non-accelerated filer ¨ Smaller reporting company ¨
Indicate by check mark whether the registrant is a shell company (as defined in Rule 12b-2 of the Act). Yes ¨ No x
As of June 30, 2015, the aggregate market value of the voting common stock held by non-affiliates computed by reference to the price at which the common stock was last sold on the New York Stock Exchange, as of the last business day of the registrant’s most recently completed second fiscal quarter was $2,509,551,678.
Indicate the number of shares outstanding of the registrant’s common stock as of the latest practicable date.
| Class |
Outstanding at February 22, 2016 | |
| Common Stock, $0.01 par value | 70,586,126 shares |
DOCUMENTS INCORPORATED BY REFERENCE
Part III of this Annual Report on Form 10-K incorporates by reference to the registrant’s definitive Proxy Statement, to be filed with the Securities and Exchange Commission within 120 days of the close of the fiscal year ended December 31, 2015.
Table of Contents
2
Table of Contents
PART I
General
Axiall Corporation (together with its consolidated subsidiaries, herein referred to as “Axiall,” the “Company,” “we,” “us,” or “our”), a Delaware corporation incorporated in 1984, is a leading North American manufacturer and international marketer of chemicals and building products. We operate through two reportable segments: (i) chlorovinyls and (ii) building products. These two reportable segments reflect the organization used by our management for purposes of allocating resources and assessing performance. The chart below depicts each of our reportable segments and the primary products manufactured and sold by each of those segments.
| Reportable Segments |
Key Products | |
| Chlorovinyls |
Chlor-alkali and derivative products: | |
| Chlorine | ||
| Caustic soda | ||
| Vinyl chloride monomer | ||
| Vinyl resins | ||
| Other chlor-alkali and derivative products | ||
| Chlorinated ethylene | ||
| Calcium hypochlorite | ||
| Hydrochloric acid | ||
| Compound products: | ||
| Vinyl compounds | ||
| Compound additives and plasticizers | ||
| Building Products |
Window and door profiles and mouldings products: | |
| Window and door profiles | ||
| Trim, mouldings and deck | ||
| Outdoor building products: | ||
| Siding and exterior accessories | ||
| Pipe and pipe fittings |
For selected financial information concerning our two reportable segments and our domestic and international sales, see Note 18 of the Notes to the Consolidated Financial Statements included in Item 8.
Portfolio Initiatives
Sale of Aromatics Business: Discontinued Operations
On September 30, 2015, Axiall entered into and consummated the transactions contemplated by an asset purchase agreement (the “Asset Purchase Agreement”) between INEOS Americas LLC (“INEOS”) and Axiall LLC, a wholly-owned subsidiary of the Company. Pursuant to the Asset Purchase Agreement, INEOS acquired certain assets used in the Company’s aromatics business, including but not limited to, its cumene production facility located in Pasadena, Texas. The Company retained the land and plant at its phenol, acetone and alpha-methylstyrene production facility located in Plaquemine, Louisiana (the “Plaquemine Phenol Facility”), which is part of a broader set of other Axiall
3
Table of Contents
chemical manufacturing facilities located in Plaquemine. In addition, the Company retained the following assets associated with its aromatics business: (i) cash and cash equivalents; (ii) accounts receivable; and (iii) inventory, other than certain raw materials and work-in-process inventory at its Pasadena facility. The Company has discontinued the manufacture of products at its Plaquemine Phenol Facility, and expects to dismantle and shutdown that facility.
The aromatics segment has been classified as discontinued operations as of and for the year ended December 31, 2015 and all operations of the segment have been excluded from our General Business discussion and the segment results for all periods presented. As a result, our manufacturing operations are concentrated in two reportable segments: chlorovinyls and building products.
Ethane Cracker Project with Lotte Chemical
On June 17, 2015, Eagle US 2 LLC (“Eagle”), a wholly-owned subsidiary of the Company, entered into an amended and restated limited liability company agreement with Lotte Chemical USA Corporation (“Lotte”) related to the formation of LACC, LLC (“LACC”), which is an entity formed by Eagle and Lotte to design, build and operate a state-of-the-art 1.0 million metric tons per annum ethane cracker (ethylene manufacturing plant) in Lake Charles, Louisiana (the “Plant”). The Plant will provide partial backward integration for Axiall’s vinyls business and will supply a new monoethylene glycol (“MEG”) facility being built by Lotte. Pursuant to a contribution and subscription agreement, dated as of June 17, 2015, between the Company, Eagle and LACC, Eagle has agreed to make a maximum capital commitment to LACC of up to $225 million to fund the construction costs of the Plant. Eagle’s investment is expected to represent approximately 10 percent of the interests of LACC. Eagle and Lotte also entered into a call option agreement, dated as of June 17, 2015, pursuant to which Eagle has the right, but not the obligation, until the third anniversary of the substantial completion of the Plant, to acquire up to a 50 percent ownership interest in LACC from Lotte.
On December 17, 2015, Axiall and Lotte announced that the companies reached a final investment decision to construct the Plant and LACC entered into the engineering, procurement and construction agreement with CB&I Inc., the construction contractor.
The Plant is being built adjacent to Axiall’s largest chlor-alkali chemical facility, located in Lake Charles, Louisiana, to take advantage of Axiall’s existing infrastructure, access to competitive feedstock resources, and ethylene distribution infrastructure. The anticipated start-up for the Plant is expected to be the beginning of 2019.
Building Products
The Company has engaged financial advisors to assist the Company with the sale of its building products segment. A sale process for the entire building products segment is ongoing. We expect to complete the sale of two non-core business units during the first quarter of 2016, and are targeting the sale of the remainder of the building products businesses by the end of the second quarter of 2016.
Chlorovinyls Segment
Products and Markets
Our chlorovinyls segment produces a highly integrated chain of products, including chlor-alkali and derivative products (chlorine, caustic soda, vinyl chloride monomer (“VCM”), vinyl resins, ethylene dichloride (or 1, 2 dichloroethane) (“EDC”), chlorinated solvents, calcium hypochlorite, hydrochloric acid (also known as muriatic acid) (“HCL”)) and compound products (vinyl compounds and compound additives and plasticizers). Based on 2015 industry data from IHS, Inc. (“IHS”), we are: (i) the third
4
Table of Contents
largest chlorine producer in North America; (ii) the third largest VCM producer in North America; (iii) the fourth largest polyvinyl chloride (“PVC”) producer in North America; and (iv) one of the lowest-cost producers of chlor-alkali and derivative products in the world.
Chlor-Alkali and Derivative Products
Our chlor-alkali and derivative products are primarily commodity chemical products produced to meet globally accepted standards for product grades and classifications. Our chlor-alkali and derivative products are as follows:
Chlorine. In 2015 and 2014, approximately 72 percent and 73 percent, respectively, of the chlorine that we produced was used to satisfy our internal chlorine-based production requirements. We sold our remaining chlorine production into the North American merchant chlorine market.
Caustic Soda. Caustic soda is a co-product of chlorine. We sell caustic soda to both domestic and international customers in numerous industries, with the chemical manufacturing, pulp and paper, soap and detergent, petrochemical refining, water treatment and alumina industries constituting our largest markets. In 2015 and 2014, we sold approximately 94 percent and 95 percent, respectively, of the caustic soda that we produced into these markets, and we used internally, approximately 6 percent and 5 percent, respectively, to satisfy our production needs. In 2015 and 2014, approximately 13 percent and 12 percent, respectively, of the caustic soda we produced was exported to markets outside the United States and Canada.
VCM. During 2015 and 2014, we used approximately 86 percent and 89 percent, respectively, of our VCM production in the manufacture of vinyl resins in our PVC manufacturing operations. VCM production not used internally is sold to other vinyl resins producers in domestic and international markets. In 2015 and 2014, approximately 6 percent and 5 percent, respectively, of our VCM production was exported to markets outside the United States and Canada.
Vinyl Resins. Vinyl resins are among the most widely used plastics in the world. We supply numerous grades of vinyl resins to a broad number of end-user markets. During both 2015 and 2014, approximately 54 percent of our vinyl resins production was sold into the United States and Canadian merchant markets, where our vinyl resins were used in a wide variety of flexible and rigid vinyl end-use applications. In both 2015 and 2014, the largest end-users of our products were for pipe and pipe fittings, siding, extruded sheet and film and window profiles. In 2015 and 2014, approximately 13 percent and 12 percent, respectively, of our production was exported to markets outside the United States and Canada, and approximately 33 percent and 34 percent, respectively, of our vinyl resins were used internally in the manufacture of our vinyl compounds and vinyl building products.
Chlorinated Ethylene. Chlorinated ethylene products include ethyl chloride, EDC, perchloroethylene, trichloroethylene, tri-ethane® solvents and VersaTRANS® solvents. Ethyl chloride serves as a base or intermediate in various coatings, flavorants, films, plastics and gasoline additives. EDC is primarily used as an intermediate for making VCM. Perchloroethylene is a chlorinated solvent that is used extensively by the dry cleaning industry, and is a building block used in refrigerants. Trichloroethylene is a chlorinated solvent that is a degreaser and an essential component for refrigerants. Our specialty solvents are also used for high performance polymers, electronics cleaning, precision cleaning and certain metal cleaning applications. In 2015 and 2014, approximately 94 percent and 91 percent, respectively, of our chlorinated ethylene production was sold to external customers, with 7 percent and 15 percent, respectively, exported to markets outside the United States and Canada. In 2015 and 2014, approximately 6 percent and 9 percent, respectively, of our chlorinated ethylene production was used in our internal operations.
5
Table of Contents
Calcium Hypochlorite. Calcium hypochlorite is a general purpose sanitizer that is used in a range of water treatment applications, including swimming pools, drinking water, wastewater and irrigation. Our calcium hypochlorite products include the Accu-Tab® chlorination system, which combines patented erosion feeder chlorinator technology with proprietary calcium hypochlorite tablets, offering a chlorination solution for industrial and swimming pool applications. In 2015 and 2014, the majority of our calcium hypochlorite production was sold to external customers, which are primarily located in the United States and Canada.
HCL. HCL is used in chemicals and pharmaceutical production, food processing, steel pickling and natural gas and oil production. In 2015 and 2014, all of our HCL production was sold to external customers in the United States and Canada.
Compound Products
Our compound products are as follows:
Vinyl Compounds. Vinyl compounds are highly customized formulations that offer specific end-use properties based on customer-determined manufacturing specifications that enable our customers to utilize them directly in their manufacturing processes to fabricate their finished products. We produce flexible and rigid compounds, which are used in many different applications, including wire and cable insulation and jacketing, electrical outlet boxes and pipe fittings, window and furniture profiles and food-grade and general-purpose bottles. We also supply chlorinated vinyl compounds to the extrusion and injection molding markets, mainly for the production of hot water pipe and pipe fittings. In both 2015 and 2014, 84 percent of our vinyl compound production was sold to external customers, which are primarily located in the United States and Canada.
Compound Additives and Plasticizers. The primary additives that we produce are stabilizers, impact modifiers, plasticizers and process aids used in the production of compounds, and which are part of the typical compound formulations. The majority of our additives and plasticizers are consumed internally. In 2015 and 2014, 16 percent and 20 percent, respectively, of our compound additive and plasticizers production was sold to external customers, which are primarily located in the United States and Canada.
Production, Raw Materials and Facilities
Production
In our chlorovinyls segment, we produce chlorine and its co-product caustic soda by subjecting salt brine (sodium chloride) to an electric current creating a chemical reaction that results in chlorine gas, hydrogen gas and caustic soda (sodium hydroxide). We produce VCM by reacting purchased ethylene with chlorine.
We produce vinyl resins by polymerization of VCM in a batch reactor process. We formulate our vinyl compounds to specific customer needs by blending our vinyl resins with various additives such as plasticizers, impact modifiers, stabilizers and pigments, most of which are purchased. We also have the capacity to produce EDC, an intermediate in the manufacture of VCM, for external sales.
Raw Materials
The significant raw materials we purchase from third parties include ethylene, compound additives, salt and natural gas. We extract salt brine from wells on land that we own and lease. During 2015 and 2014, we purchased approximately $245 million and $385 million, respectively, of certain raw
6
Table of Contents
materials, primarily natural gas and ethylene, from a single supplier. We purchase ethylene and natural gas in both the open market and under long-term contracts. We believe we have reliable sources of supply for our raw materials under normal market conditions. However, we cannot predict the likelihood or impact of any future raw material shortages. Any shortages could have a material adverse impact on our results of operations.
Facilities
Our primary chlorovinyls segment operating facilities include:
Lake Charles, Louisiana Facilities. We have two operating sites in the Lake Charles, Louisiana area—the “Lake Charles North Facility” and the “Lake Charles South Facility”, each of which is described below.
The Lake Charles North Facility produces VCM, which is then supplied to our Aberdeen, Mississippi facility. The chlorine needs of our Lake Charles North Facility are primarily supplied by pipeline from our Lake Charles South Facility. Our ethylene needs for the Lake Charles North Facility are also provided by pipeline from a variety of third party sources. Power for this facility is purchased from third parties.
Our Lake Charles South Facility primarily produces caustic soda, chlorine and VCM along with a variety of other chlor-alkali and derivative products. Power and steam for the Lake Charles South Facility are produced by both on-site power plant assets and toll produced for the Lake Charles South Facility by RS Cogen, LLC (“RS Cogen”), a joint venture in which we own a 50 percent interest. RS Cogen operates a process steam, natural gas-fired cogeneration facility adjacent to the Lake Charles South Facility. We have long-term leases on nearby salt domes from which we supply our salt brine requirements by pipeline for the Lake Charles South Facility. Chlorine produced at the Lake Charles South Facility is used on-site in the manufacture of VCM and the production of a variety of chlorinated ethylene products, supplied via pipeline to our Lake Charles North Facility for the manufacture of VCM and sold to third parties. Caustic soda and other chlor-alkali and derivative products produced at our Lake Charles South Facility are generally sold externally. VCM produced at this facility is sold externally and supplied internally for our production of PVC.
Plaquemine, Louisiana Facility. The operations of our chlorovinyls segment at this facility include the production of chlorine, caustic soda, EDC, VCM and vinyl resins. Our salt brine requirements for this facility are supplied via pipeline. We use all of our chlorine production at this facility in the manufacture of VCM at this facility, and we sell substantially all of our caustic soda production externally. The ethylene requirements for our VCM production are generally supplied by pipeline. Most of our Plaquemine, Louisiana VCM production is consumed on-site in our vinyl resins production or shipped to our other vinyl resins facilities, with the remainder sold to third parties. Our on-site cogeneration facility supplies all of the electricity and steam needs of this facility. In connection with the sale of certain of our aromatics business assets, the Company has discontinued the manufacture of products at the Plaquemine Phenol Facility and has shutdown and expects to dismantle that facility.
Other Facilities. We produce chlorine, caustic soda, hydrogen, calcium hypochlorite and HCL at our Natrium, West Virginia facility. We produce chlorine, caustic soda, hydrogen and HCL at our Longview, Washington and Beauharnois, Quebec facilities. We produce chlorine, caustic soda, hydrogen, HCL and sodium hypochlorite (bleach) at our Kaohsiung, Taiwan facility. The Kaohsiung, Taiwan facility is operated by Taiwan Chlorine Industries, Ltd. (“TCI”), a joint venture in which we own a 60 percent interest. In addition, we have six vinyl compound facilities located in Aberdeen, Gallman, Madison and Prairie, Mississippi and Vaughan and Bradford, Ontario. These vinyl compound facilities are supplied from our vinyl resins facilities by railcar, truck or, in the case of Aberdeen, pipeline. We also have a
7
Table of Contents
compound additive manufacturing facility located in Bradford, Ontario and a compound plasticizer manufacturing facility in Aberdeen, Mississippi. Products produced at these facilities are generally sold externally, with the exception of compound additives and plasticizers, most of which are consumed internally.
Seasonality
Operating income for our chlorovinyls segment is affected by the cyclicality of the economy, the seasonality of the construction industry, which experiences its highest level of activity during the spring and summer months, and seasonal weather conditions. As a result of this sensitivity, this segment’s second and third quarter operating results are typically the strongest. This segment’s first and fourth quarter operating results usually reflect a decrease in construction and water treatment activity due to colder climatic conditions and the holidays.
In addition, the market for the products of our chlorovinyls segment is cyclical, both as a result of changes in demand for each of the co-products and as a result of changes in manufacturing capacity. Chlorine and caustic soda are co-products and are produced by a continuous chemical reaction in a fixed ratio of approximately 1 unit of chlorine to 1.1 units of caustic soda, commonly referred to as an electro-chemical unit (“ECU”). The production of one co-product can be constrained both by manufacturing capacity and/or by the ability to sell the co-product because chlorine is a gas and difficult to store. Therefore, prices for both products respond rapidly to changes in supply and demand conditions in the industry. Historically, the results of operations of this segment have been impacted by the changing level of sales pricing and sales volume of chlorine and caustic soda resulting from the changes in supply and demand from the co-products in the industry. The changes in the balance of supply and demand in the market for chlorine and caustic soda and the resultant impacts on chlorine and caustic soda pricing and our production operating rate are important factors in explaining the variation in this segment’s sales and earnings.
Inventory Practices and Product Returns
In our chlorovinyls segment, we do not maintain significant inventories relative to the volumes produced and sold. Product returns are insignificant.
Sales and Marketing
The sales and marketing program of our chlorovinyls segment is aimed at supporting our existing customers and expanding and diversifying our customer base. We have a dedicated sales force for our chemicals businesses, organized by product line and region. In addition, we rely on distributors to market products to smaller customers. We have a product development and technical service staff that primarily supports our vinyl resins and vinyl compounds businesses. This staff works closely with customers to qualify existing Axiall products for use by our customers. Our primary customers are major chemical companies, industrial end-users and distributors. The majority of our products are shipped from a production facility directly to the customer via pipeline, truck, rail, barge and/or ship. The remaining products are shipped from production facilities to third party chemical terminals and warehouses until being sold to customers.
Competition
Our chlorovinyls segment faces competition from numerous manufacturers, including, Formosa Plastics Corporation, USA; Occidental Chemical Corporation; Olin Corporation; Mexichem, S.A.B. de C.V.; Braskem, S.A.; Shintech, Inc.; and Westlake Chemical Corporation. This segment competes on a variety of factors, including price, products, quality, delivery and technical services.
8
Table of Contents
Building Products Segment
Products and Markets
Our building products segment consists of two primary product groups: (i) window and door profiles and trim, mouldings and deck products; and (ii) outdoor building products, which includes siding and exterior accessories, pipe and pipe fittings. Our vinyl-based home improvement and building products are marketed under the Royal Building Products®, Celect®—a Cellular Siding Collection, Zuri Premium Decking®, Kor Flo®, Overture® patio doors, Genesis Cellular Window System®, Royal S4S Trim Board® and Exterior Portfolio® brand names. Our window and door profiles and mouldings products are customized based on customer specifications. The demand and pricing for our window and door profiles and mouldings products generally trend in similar patterns based on the product features and relative benefits of customized vinyl products when compared to alternative products, such as wood. Our outdoor building products are produced largely in accordance with industry standards, thereby providing for compatibility within the construction and renovation systems in which they are used. The demand and pricing for our outdoor building products generally trend in similar patterns primarily based on the cost of the underlying raw materials.
Window and Door Profiles and Trim, Mouldings and Deck Products
Our window and door profiles and trim, mouldings and deck products are as follows:
Window and Door Profiles. We manufacture and extrude vinyl window profiles including frames, sashes, trim and other components, as well as vinyl patio door components and fabricated patio doors, which are sold primarily to window and door fabricators. Our sales are primarily to the custom segment of the vinyl window profile market with the profile design customized to a window fabricator’s specific requirements.
Trim, Mouldings and Deck. We manufacture and market extruded decorative trim, mouldings, millwork and deck products. Our decorative trim products are used for interior mouldings, such as crown, base and chair rail. For exterior mouldings, our products are used in applications such as brick mouldings and as components used in the fabrication of doors and windows. This product line includes a series of offerings, such as bendable trim and paintable/stainable trim. Our vinyl deck products are sold by distributors and used primarily in professionally installed market segments. Our deck product lines are positioned as a lower maintenance alternative to conventional wood products.
Outdoor Building Products
Our outdoor building products are as follows:
Siding and Exterior Accessories. We manufacture vinyl siding, including cellular siding, and we also offer a wide range of complementary exterior accessories including vinyl soffit, aluminum soffit, fascia and trim and molded vent mounts and exterior shutters. These additional product offerings complement our existing offerings and include rich, dark, color-fast shades as well as a siding system which enables siding panels to withstand harsh wind conditions.
Pipe and Pipe Fittings. We manufacture pipe and pipe fittings for the municipal and electrical markets, as well as pipe for plumbing applications. Our municipal pipe and pipe fittings product lines are used in potable water applications as well as in storm and sewer applications. Our plumbing product lines are used in residential and industrial applications to move storm and sanitary wastewater from the building to the municipal sewer at the property line. This product line is primarily targeted at drain, waste and
9
Table of Contents
vent applications. Our pipe, electrical conduit and fittings products are available in a wide variety of sizes and configurations, to meet the needs of both commercial and residential applications.
Production, Raw Materials and Facilities
Production
We produce the majority of our building products through the extrusion of vinyl products. Extrusion is a process by which vinyl compounds are heated until they melt and then forced through a uniquely shaped opening, referred to as a die, to form various shapes and thickness. Various designs may be embossed on the products, for example, when producing siding and decking products. Variations in extrusion are used to give products other desired qualities. For example, in producing siding, trim, mouldings and some deck products, we use cellular extrusion, which involves the process of encapsulating air bubbles in the vinyl extrusion, which reduces weight and cost. As the extruded product leaves the die, it is immediately cooled resulting in re-solidification of the vinyl into a product matching the die pattern. Cooling is accomplished by using water and/or air.
We also produce some pipe fittings through injection molding. These products are produced by heating vinyl compounds until they melt and then injecting them under pressure into a hollow mold to create three dimensional parts.
Raw Materials
The principal raw material we use in the production of our building products is vinyl resin, which is blended with other compound additives to form vinyl compounds, which are then extruded or injection molded. Substantially all of our vinyl resin is sourced internally. We believe the internal production of vinyl resins, compounds and most compound additives by our chlorovinyls segment assures quality and facilitates efficient production of our vinyl-based building products. Additives assist in processing vinyl resins efficiently and can be used to make the resulting product flexible or rigid, to add color or texture or other desired properties. We also purchase additives from various sources at market prices.
Facilities
In our building products segment, we currently operate 20 manufacturing facilities located in Canada and the United States, as well as distribution centers. Vinyl resins and vinyl compounds, as well as compound additives from the plants operated by our chlorovinyls segment, are supplied to our building products facilities by truck or rail. In addition to raw materials cost, the other principal costs to produce our products are labor and electricity to power our equipment.
The operation of numerous manufacturing facilities located strategically near customers accommodates marketing and customer support and minimizes transportation costs. Our building products are delivered primarily by truck.
Seasonality
Operating income for our building products segment is affected by the cyclicality of the economy, the seasonality of the construction industry, which experiences its highest level of activity during the spring and summer months, and seasonal weather patterns. As a result of this sensitivity, this segment’s second and third quarter operating results are typically the strongest. This segment’s first and fourth quarter operating results usually reflect a decrease in housing and industrial construction activity due to colder climatic conditions and the holidays.
10
Table of Contents
Inventory Practices and Product Returns
We maintain stocks of inventories across most of the product lines of our building products segment. We generally build inventory in advance of the peak construction season to assure product availability. Generally, our home improvement and building products may be returned only if defective.
Sales and Marketing
Our building products segment sales and marketing activities vary by product line and distribution channel. Our window and door profiles are primarily sold by our dedicated sales force and supported by marketing activities that include brochure development for window fabricators, as well as technical advisory and design services for fabricators. Our trim, mouldings and deck products are sold primarily by our dedicated sales force to independent dealers, fabricators, distributors and retail home improvement centers, who resell the products directly to builders, installers or homeowners. The majority of our vinyl siding and accessories sales are in North America, where products are distributed through independent building product distributors who are solicited primarily by our dedicated sales force. In Canada, vinyl siding and accessories are distributed through company-owned, as well as independent, building product distributors. These distributors generally sell to professional building product installers in North America.
Our pipe and pipe fittings are generally sold through municipal and electrical distributors to contractors. Our sales and technical staff work with end-use customers to provide technical information to promote the use of our PVC pipe and fitting products.
The sales force for our building products is primarily company employees. Our building products segment engages in advertising programs primarily directed at trade professionals that are intended to develop awareness and interest in our products. In addition, our building products business displays our products at trade shows.
In Canada, we operate 18 company-owned distribution branches that sell our vinyl siding and accessories, trim moulding and deck products, as well as pipe and pipe fittings. These branches also sell other products related to the exterior of the house that are not manufactured by our building products segment.
Competition
Our building products segment faces competition for each of its products from numerous manufacturers of vinyl products and traditional building materials. This segment’s competitors include Ply Gem Holdings, Inc., VEKA Inc., CertainTeed Corporation, Vision Group, IPEX Inc., Associated Materials LLC, Quanex Building Products Corporation, Deceuninck North America, CPG International, LLC and Bow Plumbing Group. This segment competes on a variety of factors including price, products, quality, delivery and technical services.
Environmental Matters
Environmental Remediation
Our operations and assets are subject to extensive environmental, health and safety regulations, including laws and regulations related to air emissions, water discharges, waste disposal and remediation of contaminated sites, at both the national and local levels in the United States. We are also subject to similar laws and regulations in Canada and other jurisdictions in which we operate. The nature of the chemical and building products industries exposes us to risks of liability under these laws and regulations due to the
11
Table of Contents
production, storage, use, transportation and sale of materials that can cause contamination or personal injury, including, in the case of chemicals, potential releases into the environment. Environmental laws may have a significant effect on the costs of use, transportation and storage of raw materials and finished products, as well as the costs of the storage and disposal of wastes. We have incurred and will continue to incur substantial operating and capital costs to comply with environmental laws and regulations. In addition, we may incur substantial costs, including fines, damages, criminal or civil sanctions and remediation costs, or experience interruptions in our operations for violations arising under these laws and regulations.
As of December 31, 2015 and 2014, we had reserves for environmental contingencies totaling approximately $41 million and $54 million, respectively, of which approximately $1 million and $12 million, respectively, were classified as current liabilities. Our assessment of the potential impact of these environmental contingencies is subject to considerable uncertainty due to the complex, ongoing and evolving process of investigation and remediation, if necessary, of such environmental contingencies, and the potential for technological and regulatory developments.
Some of our significant environmental contingencies include the following matters:
| • | We have entered into a Cooperative Agreement with the Louisiana Department of Environmental Quality (“LDEQ”) and various other parties for the environmental remediation of a portion of the Bayou d’Inde area of the Calcasieu River Estuary in Lake Charles, Louisiana. Remedy implementation began in the fourth quarter of 2014 and is expected to be completed during 2016, with a period of monitoring for remedy effectiveness to follow remediation. As of December 31, 2015 and 2014, we have reserved approximately $4 million and $18 million, respectively, for the costs associated with this matter. The decrease in the amount of this reserve is primarily due to spending against the reserve. |
| • | As of December 31, 2015 and 2014, we had reserved approximately $12 million and $15 million, respectively, for environmental contingencies related to on-site remediation at the Lake Charles South Facility, principally for ongoing remediation of groundwater and soil in connection with our corrective action permit issued pursuant to the Hazardous and Solid Waste Amendments of the Resource Conservation and Recovery Act. The remedial activity is primarily related to the operation of a series of well water treatment systems across the Lake Charles South Facility. In addition, remediation of possible soil contamination will be conducted in certain areas. These remedial activities are expected to continue for an extended period of time. The reduction in the amount of this reserve is due to our assessment, during the year ended December 31, 2015, of the estimated costs to be incurred after December 31, 2015 to conduct this on-going remedial activity, and in particular, our assessment of the portion of the future operating costs of certain water treatment assets at our Lake Charles South Facility that should be allocated to this remediation project, as opposed to other non-remediation uses of those water treatment assets. |
| • | As of December 31, 2015 and 2014, we had reserved approximately $18 million and $15 million, respectively, for environmental contingencies related to remediation activities at our Natrium, West Virginia facility (the “Natrium Facility”). The remedial actions address National Pollutant Discharge Elimination System permit requirements related primarily to hexachlorocyclohexane (commonly referred to as BHC) and mercury. We expect that these remedial actions will be in place for an extended period of time. The increase in the amount of this reserve is due to our assessment, during the year ended December 31, 2015, of the estimated costs that will be incurred after December 31, 2015 to conduct this on-going remedial activity, and in particular, due to an increase in the estimated duration of the remediation period. |
12
Table of Contents
Environmental Laws and Regulations
Due to the nature of environmental laws, regulations and liabilities, it is possible that we may not have identified all potentially adverse conditions. Such conditions may not currently exist or be detectable through reasonable methods, or may not be estimable. For example, our Natrium Facility and Lake Charles South Facility have both been in operation for over 65 years. There may be significant latent liabilities or future claims arising from the operation of facilities of this age, and we may be required to incur material future remediation or other costs in connection with future actions or developments at these or other facilities.
We expect to be continually subjected to increasingly stringent environmental and health and safety laws and regulations, and that continued compliance will require increased capital expenditures and increased operating costs or may impose restrictions on our present or future operations. It is difficult to predict the future interpretation and development of these laws and regulations or their impact on our future earnings and operations. Any increase in these costs, or any material restrictions on our ability to operate or the manner in which we operate, could materially adversely affect our liquidity, financial condition and results of operations. However, estimated costs for future environmental compliance and remediation may be materially lower than actual costs, or we may not be able to quantify potential costs in advance. Actual costs related to any environmental compliance in excess of estimated costs could have a material adverse effect on our financial condition in one or more future periods.
Heightened interest in environmental regulation, such as climate change issues, has the potential to materially impact our costs and present and future operations. We, and other chemical companies, are currently required to file certain governmental reports relating to greenhouse gas (“GHG”) emissions. The U.S. Government has considered, and may in the future implement, restrictions or other controls on GHG emissions, any of which could require us to incur significant capital expenditures or further restrict our present or future operations.
In addition to GHG regulations, the United States Environmental Protection Agency (the “EPA”) has recently taken certain actions to limit or control certain pollutants created by companies such as ours. For example:
| • | In January 2013, the EPA issued Clean Air Act emission standards for boilers and incinerators (the “Boiler MACT regulations”), which are aimed at controlling emissions of toxic air contaminants at covered facilities. The coal fired power plant at our Natrium Facility is our source most significantly impacted by the Boiler MACT regulations. Pursuant to an extension granted by the West Virginia Department of Environmental Protection (WVDEP), we expect to comply with the requirements of the Boiler MACT regulations on or before December 2016. |
| • | In April 2012, the EPA issued final regulations to update emissions limits for polyvinyl chloride (“PVC”) and copolymer production (the “PVC MACT regulation”). The PVC MACT regulation sets standards for major sources of PVC production and establishes certain working practices, as well as monitoring, reporting and record-keeping requirements. Following the issuance of the PVC MACT regulation, a variety of legal challenges were filed by the vinyl industry’s trade organization, several vinyl manufacturers and several environmental groups. Most of these challenges have been resolved; however, there are several petitions to reconsider certain provisions in the rule that are still pending. We anticipate that some of these provisions will likely be changed as a result of these petitions, and there could be significant changes from the currently existing PVC MACT regulation after all legal challenges have been exhausted. These changes could require us to incur further capital expenditures, or increase our operating costs, to levels significantly higher than what we have previously estimated. |
| • | In March 2011, the EPA proposed amendments to the emission standards for hazardous air pollutants for mercury emissions from mercury cell chlor-alkali plants. These proposed |
13
Table of Contents
| amendments would require improvements in work practices to reduce fugitive mercury emissions and would result in reduced levels of mercury emissions while still allowing the mercury cell facilities to continue to operate. We operate a mercury cell production unit at our Natrium Facility. No assurances as to the timing or content of the final regulation, or its ultimate cost to, or impact on us, can be provided. |
The potential impact of these and/or unrelated future, legislative or regulatory actions on our current or future operations cannot be predicted at this time but could be significant. Such impacts could include the potential for significant compliance costs, including capital expenditures, which could result in operating restrictions or could require us to incur significant legal or other costs related to compliance or other activities. For example, a recent revision to ambient air quality standards for ozone may, in the future, result in significant operating costs, compliance costs, and capital expenditures at some of our facilities. Any increase in the costs related to these initiatives, or restrictions on our operations, could materially adversely affect our liquidity, financial condition or results of operations.
Environmental Remediation: Reasonably Possible Matters
Our assessment of the potential impact of environmental contingencies is subject to considerable uncertainty due to the complex, ongoing and evolving process of investigation and remediation, if necessary, of such environmental contingencies, and the potential for technological and regulatory developments. As such, in addition to the amounts currently reserved, we may be subject to reasonably possible loss contingencies related to environmental matters in the range of $40 million to $80 million.
For more information about our environmental policy and regulation, see Notes 1 and 12 of the Notes to the Consolidated Financial Statements included in Item 8.
Employees
As of December 31, 2015, we had approximately 5,830 full-time employees. We employ approximately 1,580 employees, representing 27 percent of our workforce, under collective bargaining agreements that expire at various times through 2018. We believe our relationships with our employees and their representative organizations are good.
Available Information
We make available, free of charge on our website at www.axiall.com, our Annual Reports on Form 10-K, Quarterly Reports on Form 10-Q, Current Reports on Form 8-K and amendments to those reports filed or furnished pursuant to Section 13(a) of the Securities Exchange Act of 1934 as soon as reasonably practicable after we electronically file such materials with, or furnish them to, the Securities and Exchange Commission (“SEC”). The information contained on our website is not a part of, or incorporated by reference into, this Annual Report on Form 10-K.
The risks described below could materially and adversely affect our business, results of operations, financial condition and liquidity. These risks are not the only risks that we face. Our business operations could also be affected by additional factors that apply to all companies operating in the United States and globally, as well as other risks that are not presently known to us or that we currently consider to be immaterial to our operations.
14
Table of Contents
| (1) | The chemicals industry is cyclical, seasonal and volatile, experiencing alternating periods of tight supply and overcapacity, and the building products industry is also cyclical and seasonal. This cyclicality adversely impacts our capacity utilization and causes fluctuations in our results of operations. |
The historical operating results for our chlorovinyls chemical business have tended to reflect the cyclical and volatile nature of the chemicals industry. Historically, periods of tight supply have resulted in increased prices and profit margins and have been followed by periods of substantial capacity increase, resulting in oversupply and declining prices and profit margins for those products. A number of the products of our chlorovinyls segment are highly dependent on markets that are particularly cyclical, such as the building and construction, paper and pulp and automotive markets. As a result of changes in demand for our products, our operating rates and earnings fluctuate significantly, not only from year to year, but also from quarter to quarter, depending on factors such as feedstock costs, transportation costs and supply and demand for the products produced during that period. In order to compensate for changes in demand, we have historically operated individual facilities below or above rated capacities in any period, and we expect to continue this practice in the future. We may idle a facility for an extended period of time because an oversupply of a certain product or a lack of demand for that product makes production uneconomical. Facility shutdown and subsequent restart expenses may adversely affect periodic results when these events occur. In addition, a temporary shutdown may become permanent, resulting in a write-down or write-off of the related assets. Industry-wide capacity expansions or the announcement of such expansions have generally led to a decline in the pricing of our chemical products in the affected product line. We cannot provide any assurances that future growth in product demand will be sufficient to utilize any additional capacity.
In addition, the cyclical and seasonal nature of the building products industry, which is significantly affected by changes in national and local economic and other conditions such as employment levels, demographic trends, availability of financing, interest rates and consumer confidence, could negatively affect the demand for and pricing of our building products. For example, if interest rates increase, the ability of prospective buyers to finance purchases of home improvement products and invest in new real estate could be adversely affected, which, in turn, could adversely affect our financial performance. The levels of home repair and remodeling and new construction spending declined significantly in the 2009 through 2011 period as compared to 2008, recovering moderately in the 2012 through 2015 period, as compared to historical levels. In response to these significant market declines and moderate recovery, we closed facilities and sold certain businesses and assets, and we may be required to do so again in the future.
| (2) | Our operations and assets are subject to extensive environmental, health and safety laws and regulations; the costs associated with compliance with these regulations could materially adversely affect our financial condition and results of operations, and the failure to comply could expose us to material liabilities. |
Our operations and assets are subject to extensive environmental, health and safety regulations, including laws and regulations related to air emissions, water discharges, waste disposal and remediation of contaminated sites, at both the national and local levels in the United States. We are also subject to similar laws and regulations in Canada and other jurisdictions in which we operate. The nature of the chemical and building products industries exposes us to risks of liability under these laws and regulations due to the production, storage, use, transportation and sale of materials that can cause contamination or personal injury, including, in the case of chemicals, potential releases into the environment. Environmental laws may have a significant effect on the costs of use, transportation and storage of raw materials and finished products, as well as the costs of the storage and disposal of wastes. We have incurred and will continue to incur substantial operating and capital costs to comply with environmental laws and regulations. In addition, we may incur substantial costs, including fines, damages, criminal or civil sanctions and remediation costs, or experience interruptions in our operations for violations arising under these laws and regulations.
15
Table of Contents
As of December 31, 2015 and 2014, we had reserves for environmental contingencies totaling approximately $41 million and $54 million, respectively, of which approximately $1 million and $12 million, respectively, were classified as current liabilities. Our assessment of the potential impact of these environmental contingencies is subject to considerable uncertainty due to the complex, ongoing and evolving process of investigation and remediation, if necessary, of such environmental contingencies, and the potential for technological and regulatory developments.
Some of our significant environmental contingencies include the following matters:
| • | We have entered into a Cooperative Agreement with LDEQ and various other parties for the environmental remediation of a portion of the Bayou d’Inde area of the Calcasieu River Estuary in Lake Charles, Louisiana. Remedy implementation began in the fourth quarter of 2014 and is expected to be completed during 2016, with a period of monitoring for remedy effectiveness to follow remediation. As of December 31, 2015 and 2014, we have reserved approximately $4 million and $18 million, respectively, for the costs associated with this matter. The decrease in the amount of this reserve is primarily due to spending against the reserve. |
| • | As of December 31, 2015 and 2014, we had reserved approximately $12 million and $15 million, respectively, for environmental contingencies related to on-site remediation at the Lake Charles South Facility, principally for ongoing remediation of groundwater and soil in connection with our corrective action permit issued pursuant to the Hazardous and Solid Waste Amendments of the Resource Conservation and Recovery Act. The remedial activity is primarily related to the operation of a series of well water treatment systems across the Lake Charles South Facility. In addition, remediation of possible soil contamination will be conducted in certain areas. These remedial activities are expected to continue for an extended period of time. The reduction in the amount of this reserve is due to our assessment, during the year ended December 31, 2015, of the estimated costs to be incurred after December 31, 2015 to conduct this on-going remedial activity, and in particular, our assessment of the portion of the future operating costs of certain water treatment assets at our Lake Charles South Facility that should be allocated to this remediation project, as opposed to other non-remediation uses of those water treatment assets. |
| • | As of December 31, 2015 and 2014, we had reserved approximately $18 million and $15 million, respectively, for environmental contingencies related to remediation activities at our Natrium Facility. The remedial actions address National Pollutant Discharge Elimination System permit requirements related primarily to hexachlorocyclohexane (commonly referred to as BHC) and mercury. We expect that these remedial actions will be in place for an extended period of time. The increase in the amount of this reserve is due to our assessment, during the year ended December 31, 2015, of the estimated costs that will be incurred after December 31, 2015 to conduct this on-going remedial activity, and in particular, due to an increase in the estimated duration of the remediation period. |
Environmental Laws and Regulations
Due to the nature of environmental laws, regulations and liabilities, it is possible that we may not have identified all potentially adverse conditions. Such conditions may not currently exist or be detectable through reasonable methods, or may not be estimable. For example, our Natrium Facility and Lake Charles South Facility have both been in operation for over 65 years. There may be significant latent liabilities or future claims arising from the operation of facilities of this age, and we may be required to incur material future remediation or other costs in connection with future actions or developments at these or other facilities.
16
Table of Contents
We expect to be continually subjected to increasingly stringent environmental and health and safety laws and regulations, and that continued compliance will require increased capital expenditures and increased operating costs or may impose restrictions on our present or future operations. It is difficult to predict the future interpretation and development of these laws and regulations or their impact on our future earnings and operations. Any increase in these costs, or any material restrictions on our ability to operate or the manner in which we operate, could materially adversely affect our liquidity, financial condition and results of operations. However, estimated costs for future environmental compliance and remediation may be materially lower than actual costs, or we may not be able to quantify potential costs in advance. Actual costs related to any environmental compliance in excess of estimated costs could have a material adverse effect on our financial condition in one or more future periods.
Heightened interest in environmental regulation, such as climate change issues, has the potential to materially impact our costs and present and future operations. We, and other chemical companies, are currently required to file certain governmental reports relating to GHG emissions. The U.S. Government has considered, and may in the future implement restrictions or other controls on GHG emissions, any of which could require us to incur significant capital expenditures or further restrict our present or future operations.
In addition to GHG regulations, the United States Environmental Protection Agency (the “EPA”) has recently taken certain actions to limit or control certain pollutants created by companies such as ours. For example:
| • | In January 2013, the EPA issued the Boiler MACT regulations, which are aimed at controlling emissions of toxic air contaminants at covered facilities. The coal fired power plant at our Natrium Facility is our source most significantly impacted by the Boiler MACT regulations. Pursuant to an extension granted by the West Virginia Department of Environmental Protection (WVDEP), we expect to comply with the requirements of the Boiler MACT regulations on or before December 2016. |
| • | In April 2012, the EPA issued the final PVC MACT regulation. The PVC MACT regulation sets standards for major sources of PVC production and establishes certain working practices, as well as monitoring, reporting and record-keeping requirements. Following the issuance of the PVC MACT regulation, a variety of legal challenges were filed by the vinyl industry’s trade organization, several vinyl manufacturers and several environmental groups. Most of these challenges have been resolved; however, there are several petitions to reconsider certain provisions in the rule that are still pending. We anticipate that some of these provisions will likely be changed as a result of these petitions, and there could be significant changes from the currently existing PVC MACT regulation after all legal challenges have been exhausted. These changes could require us to incur further capital expenditures, or increase our operating costs, to levels significantly higher than what we have previously estimated. |
| • | In March 2011, the EPA proposed amendments to the emission standards for hazardous air pollutants for mercury emissions from mercury cell chlor-alkali plants. These proposed amendments would require improvements in work practices to reduce fugitive mercury emissions and would result in reduced levels of mercury emissions while still allowing the mercury cell facilities to continue to operate. We operate a mercury cell production unit at our Natrium Facility. No assurances as to the timing or content of the final regulation, or its ultimate cost to, or impact on us, can be provided. |
The potential impact of these and/or unrelated future, legislative or regulatory actions on our current or future operations cannot be predicted at this time but could be significant. Such impacts could include
17
Table of Contents
the potential for significant compliance costs, including capital expenditures, which could result in operating restrictions or could require us to incur significant legal or other costs related to compliance or other activities. For example, a recent revision to ambient air quality standards for ozone may, in the future, result in significant operating costs, compliance costs, and capital expenditures at some of our facilities. Any increase in the costs related to these initiatives, or restrictions on our operations, could materially adversely affect our liquidity, financial condition or results of operations.
| (3) | Natural gas, ethylene, electricity, fuel and raw materials costs, and other external factors beyond our control, as well as changes in the level of activity in the home repair and remodeling and new home construction sectors of the economy, can cause wide fluctuations in our margins. |
The cost of our natural gas, ethylene, electricity, fuel, raw materials and other costs may not correlate with changes in the prices we receive for our products, either in the direction of the price change or in absolute magnitude. Natural gas, ethylene and other raw materials costs represent a substantial part of our manufacturing costs, and energy costs, in particular electricity and fuel, represent a component of the costs to manufacture building products. Most of the raw materials we use, including ethylene, are commodities and the price of each can fluctuate widely for a variety of reasons, including changes in availability because of capacity additions or facility operating problems. Other external factors beyond our control can cause volatility in raw materials prices, demand for our products, product prices, sales volumes and margins. These factors include general economic conditions, the level of business activity in the industries that use our products, competitors’ actions, international events and circumstances and governmental regulation in the United States and abroad. These factors can also magnify the impact of economic cycles on our business. While we attempt to pass through price increases in energy costs and raw materials, we have been unsuccessful in doing so in some circumstances in the past and there can be no assurance that we will be able to successfully do so in the future.
Additionally, the businesses of each of our reportable segments are impacted by changes in the North American home repair and remodeling sectors, as well as the new construction sector, which may be significantly affected by changes in economic and other conditions such as gross domestic product levels, employment levels, demographic trends, consumer confidence, increases in interest rates and availability of consumer financing for home repair and remodeling projects as well as availability of financing for new home purchases. These factors can lower the demand for and pricing of our products, while we may not be able to reduce our costs by an equivalent amount, which alone or in combination could cause our net sales and net income to materially decrease and, among other things, could require us to recognize impairments of our assets.
| (4) | Hazards and other risks associated with manufacturing and transporting our products may materially adversely affect our business or results of operations. |
There are a number of hazards and other risks associated with chlorovinyls chemical manufacturing and building products manufacturing in our current operations, as well as in the use, storage and transportation of related raw materials, products and wastes. The occurrence of any such hazardous or other risk-related events could lead to an interruption or suspension of operations and have a material adverse effect on the productivity and profitability of a particular manufacturing facility or on our operations as a whole. Some of the hazards and other risks associated with our current operations include:
| • | pipeline and storage tank leaks and ruptures; |
| • | explosions and fires; |
| • | inclement weather and natural disasters; |
18
Table of Contents
| • | mechanical failure; |
| • | unscheduled downtime; |
| • | labor difficulties with workforce under collective bargaining agreements; |
| • | transportation interruptions; |
| • | transportation accidents involving our chemical products; |
| • | remediation complications; |
| • | terrorist acts; and |
| • | chemical spills and other discharges or releases of toxic or hazardous substances or gases. |
These hazards and other risks may cause personal injury and loss of life, severe damage to or destruction of property and equipment and environmental damage, any of which could lead to claims or material liability under environmental or other laws. Although we maintain property, business interruption and casualty insurance of the types and in the amounts that we believe are customary for the industry, we are not fully insured against all potential hazards incident to our business. In addition, such insurance could become more expensive and difficult to maintain and, may not be available to us on commercially reasonable terms or at all.
We are exposed to significant losses from product liability, personal injury and other claims relating to the products we manufacture in each of our reportable segments. Additionally, individuals currently seek, and likely will continue to seek, damages for alleged personal injury or property damage due to alleged exposure to chemicals at our facilities or to chemicals otherwise owned, controlled or manufactured by us. We are also subject to present and future claims with respect to workplace exposure, workers’ compensation and other matters. Any such claims, whether with or without merit, could be time consuming, expensive to defend and could divert management’s attention and resources. We maintain and expect to continue to maintain insurance for products liability, workplace exposure, workers’ compensation and other claims, but the amount and scope of such insurance may not be adequate or available to cover a claim that is successfully asserted against us. In addition, such insurance could become more expensive and difficult to maintain and, may not be available to us on commercially reasonable terms or at all. The results of any future litigation or claims are inherently unpredictable, but such outcomes could have a material adverse effect on our liquidity, financial condition or results of operations.
| (5) | Our level of indebtedness could adversely affect our ability to operate our business. |
Our level of indebtedness could have important consequences. For example, it:
| • | requires us to dedicate a portion of our cash flow from operations to payments on our debt, reducing the amount of cash flow available for other purposes, such as capital expenditures, acquisitions, dividends and working capital; |
| • | could limit our flexibility in planning for, or reacting to, changes in our business and the industries in which we operate; |
| • | could place us at a disadvantage compared to our competitors that have less debt and, thus, may have greater flexibility to use their cash flows to pursue business opportunities that may improve their businesses and financial performance; |
19
Table of Contents
| • | could expose us to fluctuations in the interest rate environment because the interest rates on borrowings under our asset-based revolving credit facility (the “ABL Revolver”) and our new term loan facility (the “New Term Loan Facility”) are variable; |
| • | could increase our cost of borrowing; and |
| • | could limit the amount of additional debt we could borrow. |
While we believe we should be able to meet the requirements of the agreements governing our and our subsidiaries’ existing debt, our ability to do so depends on many factors beyond our control, including general economic, financial, competitive, legislative and regulatory factors, and the impact any one or more of those factors may have on our business at any given time or over any period of time. In addition, if and when we attempt to refinance our debt, it is possible that the debt markets could be less favorable at that time, which could result in higher interest rates on any debt that we refinance, more restrictive covenants in the agreements governing our and our subsidiaries’ existing debt for any debt we refinance and other factors that could be less favorable to our business.
| (6) | The ABL Revolver, the New Term Loan Facility and the indentures governing our 4.875 percent senior unsecured notes due 2023 (the “4.875 Notes”) and the 4.625 percent senior unsecured notes due 2021 issued by Eagle Spinco Inc. (the “4.625 Notes”) impose significant operating and financial restrictions on us and our subsidiaries, which may prevent us from capitalizing on business opportunities and taking some actions. |
The agreements that govern the terms of our and our subsidiaries’ existing debt, including the ABL Revolver, the New Term Loan Facility and the indentures governing the 4.875 Notes and the 4.625 Notes, impose significant operating and financial restrictions on us. These restrictions limit our ability to, among other things: incur additional indebtedness; incur liens; make investments and sell assets, including the stock of subsidiaries; pay dividends and make other distributions; purchase our stock; engage in business activities unrelated to our current business; enter into transactions with affiliates; or consolidate, merge or sell all or substantially all of our assets.
We are limited in how we conduct our business, and we may be unable to raise additional debt or equity financing to compete effectively or to take advantage of new business opportunities as a result of these covenants. The terms of any future indebtedness we may incur could include more restrictive covenants. A breach of any of these covenants could result in a default in respect of the related indebtedness. If a default occurs, the relevant lenders could elect to declare the indebtedness, together with accrued interest and other fees, to be due and payable immediately and proceed against any collateral securing that indebtedness.
Furthermore, there are limitations on our ability to borrow the full amount of commitments under the ABL Revolver. Borrowings under the ABL Revolver are limited by a specified borrowing base consisting of a percentage of eligible accounts receivable and inventory, less customary reserves. In addition, (i) if our availability under the ABL Revolver falls below a certain amount, we will be subject to compliance with a covenant requiring us to maintain a consolidated fixed charge coverage ratio of at least 1.1 to 1.0; and (ii) we are subject to a consolidated secured debt ratio of 3.50 to 1.00 under the New Term Loan Facility. Our ability to comply with any required fixed charge coverage ratio and consolidated secured debt ratio can be affected by events beyond our control, and we cannot assure you we will be able to comply with these ratios. A breach of the covenants requiring compliance with these ratios, or with any other covenants in these debt agreements, could result in a default under the ABL Revolver or the New Term Loan Facility, as the case may be.
20
Table of Contents
| (7) | We rely on a limited number of outside suppliers for specified feedstocks and services. |
We obtain a significant portion of our raw materials from a few key suppliers. If any of these suppliers are unable to meet their obligations under present or any future supply agreements, we may be forced to pay higher prices to obtain the necessary raw materials. Any interruption of supply or any price increase of raw materials could have a material adverse effect on our business and results of operations. In connection with our acquisition of the vinyls business of Sasol Limited in 1999, we entered into agreements with Sasol Limited to provide specified feedstocks for our Lake Charles North Facility. These facilities are dependent upon Sasol Limited’s infrastructure for services such as wastewater and ground water treatment, site remediation and fire water supply. Any failure of Sasol Limited to perform its obligations under those agreements could adversely affect the operation of the affected facilities and our liquidity and results of operations. The agreements relating to these feedstocks and services had initial terms of one to 10 years. Most of these agreements have been automatically renewed, but may be terminated by Sasol Limited after specified notice periods. If we are required to obtain an alternate source for these feedstocks or services, we may not be able to obtain pricing on as favorable terms. Additionally, we may be forced to pay additional transportation costs or to invest in capital projects for pipelines or alternate facilities to accommodate railcar or other delivery methods or to replace other services.
A vendor may choose, subject to existing contracts, to modify its relationship due to general economic concerns or concerns relating to the vendor or us, at any time. Any significant change in the terms that we have with our key suppliers could materially adversely affect our financial condition and liquidity, as could significant additional requirements from our suppliers that we provide them additional security in the form of prepayments or with letters of credit.
| (8) | We have certain material pension and other postretirement employment benefit (“OPEB”) obligations. Future funding obligations related to these liabilities could restrict cash available for our operations, capital expenditures or other requirements or require us to borrow additional funds. |
We have certain substantial U.S. tax-qualified and non-tax-qualified pension obligations, as well as OPEB obligations, related to employees and retirees.
With respect to the tax-qualified pension obligations, the transfer of legally required pension assets from the tax-qualified pension plans of PPG Industries, Inc. (“PPG”) to the pension plans established by us in respect of those liabilities was completed during 2014 following our merger with PPG’s chlor-alkali and derivatives business (the “Merged Business”). In addition to the standard minimum funding requirements, the Pension Protection Act of 2006 (the “Pension Act”) (as amended by the Worker, Retiree and Employer Recovery Act of 2008) requires companies with tax-qualified defined benefit pension plans to make contributions to such plans as frequently as quarterly in order to meet the “funding target” for such plans, as defined in the Pension Act. The failure to meet the funding target could result in the imposition of fines or penalties. Funding obligations with respect to tax-qualified pension plans change due to, among other things, the actual investment return on plan assets. Volatility in the capital markets may have a further negative impact on the funded status of tax-qualified pension plans, which may in turn increase attendant funding obligations. In addition to funded tax-qualified pension obligations, we also have nonqualified pension liabilities that are unfunded, and OPEB obligations to provide retiree health benefits, which are also unfunded.
The fair value of pension investment assets was $594.8 million as of December 31, 2015. As of the same date, our projected benefit obligation with respect to these assets was $737.0 million. The underfunded status of the U.S., Canadian, and Taiwanese pension obligations calculated on a projected benefit obligation basis as of December 31, 2015, was approximately $142.2 million. The unfunded OPEB obligations as of December 31, 2015, were approximately $69.3 million. We funded
21
Table of Contents
approximately $9.8 million to the pension and OPEB plans for the year ended December 31, 2015 and expect to fund an additional $9.3 million in the year ending December 31, 2016.
With respect to key assumptions of the pension and OPEB obligations, the weighted average discount rates as of December 31, 2015 are estimated to be 4.34 percent and 3.61 percent, respectively. The weighted average initial healthcare trend rates for our OPEB plans are assumed to be 7.47 percent declining to 4.50 percent over the next 12 years. A 25 basis point increase to the December 31, 2015 discount rates would decrease the estimated benefit obligations for the U.S. and Canadian pension plans by $20.2 million, whereas a 25 basis point decrease would increase the estimated benefit obligations by $21.2 million. A 25 basis point increase to the December 31, 2015 discount rates would decrease the estimated OPEB obligations for the U.S. and Canadian pension plans by $1.1 million, whereas a 25 basis point decrease would increase the estimated benefit obligations by $1.1 million. If the assumed healthcare trend rates were 1 percent higher or 1 percent lower, the estimated OPEB benefit obligations for the U.S. and Canadian OPEB plans would increase by $0.1 million or decrease the obligations by $0.1 million, respectively.
Mortality is another key assumption used to determine the benefit obligations for our defined benefit pension and OPEB plans. The Company continues to measure year-end benefit obligations using the Society of Actuaries’ (“SOA”) base mortality table (“RP-2014”), with adjustments by plan. The Company selected the generational improvement scale published by the SOA (“BB-2D”) to reflect mortality improvement rates as published by the SOA for purposes of measuring pension and OPEB benefit obligations at year-end.
Given the pension assets and obligations, and subject to the foregoing variables and the uncertainties associated therewith, it is possible that we could be required to make substantial contributions in future years to the pension plans. These contributions could restrict available cash for our operations, capital expenditures and other requirements and may materially adversely affect our financial condition and liquidity.
As for OPEB benefits and nonqualified pension liabilities, the obligations to make payments with respect to these liabilities in the future may increase for several reasons. For example, with respect to OPEB, healthcare costs may escalate. These obligations will require annual funding that could restrict cash available to us for use for other purposes.
While we intend to comply with any future funding obligations for our pension and OPEB plans through the use of cash from operations, there can be no assurance that we will generate enough cash to do so and also meet our other required or intended cash uses. Our inability to fund these obligations through cash from operations could require us to seek funding from other sources, including through additional borrowings, which could materially increase our outstanding debt or debt service requirements.
| (9) | The industries in which we compete are highly competitive, and some of our competitors have greater financial and other resources than we have, which may materially adversely affect our business and results of operations. |
The chemicals industry is highly competitive. Many of the competitors of our chlorovinyls chemicals business are larger and have greater financial and other resources and less debt than us. Moreover, barriers to entry are low in most product lines of our chlorovinyls chemicals business. Capacity additions or technological advances by existing or future competitors could also create greater competition, particularly in pricing. We cannot provide assurance that we will have access to the financing necessary to upgrade our facilities in response to technological advances or other competitive developments.
22
Table of Contents
In addition, we compete with national and international manufacturers of vinyl-based building and home improvement products. Some of these companies are larger and have greater financial resources and less debt than we have. Accordingly, these competitors may be better able to withstand changes in conditions within the industries in which we operate and may have significantly greater operating and financial flexibility than we have. Some of these competitors, who compete with our building product lines, may also be able to compete more aggressively in pricing and could take a greater share of sales and cause us to lose business from our customers. Many of the competitors of our building products business have operated in the industry longer than we have. Additionally, our building products face competition from alternative materials, such as wood, metal, fiber cement and masonry in siding, wood and aluminum in windows and iron and cement in pipe and fittings. An increase in competition from other vinyl exterior building products manufacturers or alternative building materials could cause us to lose customers and lead to decreases in net sales and profitability. To the extent we lose customers in the renovation and remodeling markets, we would likely have to market to the new home construction market, which historically has experienced more significant fluctuations in demand.
| (10) | We rely heavily on third party transportation, which subjects us to risks and costs that we cannot control, and which risks and costs may materially adversely affect our operations. |
We rely heavily on railroads, barges and other shipping companies to transport raw materials to the manufacturing facilities used by each of our businesses and to ship finished products to customers. These transport operations are subject to various hazards and risks, including extreme weather conditions, work stoppages and operating hazards, as well as interstate transportation regulations. In addition, the methods of transportation we utilize, including shipping chlorine and other chemicals by railroad, may be subject to additional, more stringent and more costly regulations in the future. If we are delayed or unable to ship finished products or unable to obtain raw materials as a result of any such new regulations or public policy changes related to transportation safety, or these transportation companies’ failure to operate properly, or if there were significant changes in the cost of these services due to new or additional regulations, or otherwise, we may not be able to arrange efficient alternatives and timely means to obtain raw materials or ship goods, which could result in a material adverse effect on our revenues and costs of operations. For example, our costs of transporting our chlor-alkali products, particularly railroad shipment costs, are a significant portion of our cost of sales, and have been increasing over the past several years. If these cost increases continue, and we are unable to control them or pass the increased costs onto customers, our profitability in our chlor-alkali segment would be negatively impacted.
| (11) | Operation on multiple Enterprise Resource Planning (“ERP”) information systems, and the conversion from multiple ERP systems to a fewer number of ERP systems, may negatively impact our operations. |
We are highly dependent on our information systems infrastructure in order to process orders, track inventory, ship products in a timely manner, prepare invoices to our customers, maintain regulatory compliance and otherwise carry on our business in the ordinary course. We operate on multiple ERP information systems, which complicate our processing, reporting and analysis of business transactions and other information. Since we must process and reconcile our information from multiple systems, the chance of errors is increased, and we may incur significant additional costs related thereto. Inconsistencies in the information from multiple ERP systems could adversely impact our ability to manage our business efficiently and may result in heightened risk to our ability to maintain our books and records and comply with regulatory requirements. Further, from time to time we may transition a portion of our operations from one of our ERP systems to another. For example, we are in the process of transitioning our chemicals division from operating on multiple ERP systems to a single ERP system.
23
Table of Contents
The transition to a different ERP system or to a single ERP system from multiple ERP systems involves numerous risks, including:
| • | diversion of management’s attention away from normal daily business operations; |
| • | loss of or delays in accessing data; |
| • | increased demand on our operations support personnel; |
| • | initial dependence on unfamiliar systems while training personnel to use new systems; and |
| • | increased operating expenses resulting from training, conversion and transition support activities. |
Any of the foregoing could result in a material increase in information technology compliance or other related costs and could materially negatively impact our operations. In addition, any failures or delays in the transition to a single ERP system in our chemicals division, or any other division, could delay and/or impede our ability to order materials and services, manufacture products, fill and ship customer orders, invoice customers, generate management reports and timely prepare consolidated financial statements and maintain appropriate internal control over financial reporting, and thus, could unfavorably impact our net sales, profitability, business operations and regulatory compliance in a significant manner.
| (12) | A significant portion of our hourly workers are represented by labor unions and therefore subject to collective bargaining agreements; if we are unable to enter into new agreements or renew existing agreements before they expire, our workers subject to collective bargaining agreements could engage in strikes or other labor actions that could materially disrupt our ability to conduct our operations. |
As of December 31, 2015, we had approximately 5,830 active employees. Approximately 1,580, or 27 percent, of these employees are represented by labor unions and are therefore subject to collective bargaining agreements that will expire by the end of 2018, and 190 employees are currently in the process of negotiating their first collective bargaining agreements. At our Lake Charles South Facility and Natrium, West Virginia facility, two of our largest facilities, approximately 62 percent and 68 percent, respectively, of the workforce operate under collective bargaining agreements.
If we are unable to reach new collective bargaining agreements or renew existing agreements, employees subject to collective bargaining agreements may engage in strikes, work slowdowns or other labor actions, which could materially disrupt our ability to conduct our operations. New collective bargaining agreements or the renewal of existing agreements may impose significant new costs on us, which could adversely affect our results of operations or financial condition in the future.
| (13) | If our goodwill, indefinite-lived intangible assets, or other intangible assets become further impaired in the future, we may be required to record additional non-cash charges to earnings, which could be significant. |
Under U.S. generally accepted accounting principles (“GAAP”), we review goodwill and indefinite-lived intangible assets for impairment on an annual basis or more frequently if events or circumstances indicate that their carrying value may not be recoverable. Other intangible assets are reviewed if events or circumstances indicate that their carrying value may not be recoverable. During the year ended December 31, 2015, we recorded a non-cash impairment charge of $864.1 million related to goodwill in our chlor-alkali and derivatives reporting unit. While this charge had no impact on our
24
Table of Contents
business operations, cash balances or operating cash flows, it resulted in a significant loss from operations during the period. In the future, we could experience additional impairment charges related to goodwill in our chlor-alkali and derivatives reporting unit or other reporting units, including those of our building products business and our other intangible assets. The process of impairment testing for our goodwill and intangible assets involves a number of judgments and estimates made by management including the fair values of assets and liabilities, future cash flows, our interpretation of current economic indicators and market conditions, overall economic conditions and our strategic operational plans with regards to our business units. If the judgments and estimates used in our analysis are not realized or change due to external factors, then actual results may not be consistent with these judgments and estimates, and our goodwill and intangible assets may become impaired in future periods. If our goodwill, indefinite-lived intangible assets, or other intangible assets are determined to be impaired in the future, we may be required to record further non-cash charges to earnings during the period in which the impairment is determined, which could be significant and have an adverse effect on our financial position and results of operations.
| (14) | We may evaluate asset dispositions, asset acquisitions, investments in joint ventures and other transactions that may impact our results of operations, and we may not achieve the expected results from these transactions. |
From time to time, and subject to the agreements governing our existing debt or otherwise, we may enter into agreements to dispose of certain assets. However, we cannot assure you that we will be able to dispose of any such assets at any anticipated prices, or at all, or that any such sale will occur during any anticipated time frame. In addition, subject to the agreements governing our existing debt or otherwise, we may engage in business combinations, purchases of assets or contractual arrangements or joint ventures. Subject to the agreements governing our existing debt or otherwise, some of these transactions may be financed with our additional borrowings. The integration of any business we may acquire may be disruptive to us and may result in a significant diversion of management attention and operational resources. Additionally, we may suffer a loss of key employees, customers or suppliers, loss of revenues, increases in costs or other difficulties. If the expected efficiencies and synergies from any such transactions are not fully realized, our results of operations could be adversely affected, because of the costs associated with such transactions or otherwise. Other transactions may advance future cash flows from some of our businesses, thereby yielding increased short-term liquidity, but consequently resulting in lower cash flows from these operations over the longer term. The failure to realize the expected long-term benefits of any one or more of these transactions could have a material adverse effect on our financial condition or results of operations.
| (15) | Our participation in joint ventures and similar arrangements exposes us to a number of risks, including risks of shared control. |
From time to time we enter into joint ventures and similar arrangements, such as our building products strategic joint venture arrangements with several customers, our ownership of a 60 percent interest in the TCI joint venture and our joint venture in RS Cogen. In December 2015, we announced the final investment decision with Lotte with respect to our investment in LACC to build the Plant next to our Lake Charles South facility. We expect that we will evaluate opportunities to enter into additional joint ventures and similar arrangements in the future, subject to any applicable restrictions arising in connection with the agreements governing our existing debt. Our participation in joint ventures and similar arrangements, by their nature, requires us to share control with unaffiliated third parties. In particular, with respect to our investment in LACC, we are a 10 percent holder and, therefore, our partner Lotte will have primary control over operations, including management of the contractors responsible for constructing the Plant. If there are differences in views among joint venture participants in how to operate the joint venture that result in delayed decisions or the failure to make decisions, or our joint venture partners do not fulfill their obligations, the affected joint venture may not be able to
25
Table of Contents
operate according to its business plan and fulfill its obligations. In that case, we may be required to write down the value of our investment in a joint venture, increase the level of financial or other commitments to the joint venture or, if we have contractual agreements with the joint venture, our operations may be materially adversely affected. Any of the foregoing could have a material adverse effect on our financial condition, results of operations or cash flows.
| (16) | LACC may incur additional costs or delays in the construction of the Plant. |
The Company has committed to contribute up to $225 million toward the construction of the Plant, which equates to approximately 10 percent of the equity in LACC. If there are cost overruns, the Company’s investment could be diluted below 10 percent if the Company does not make additional contributions to maintain its ownership position. The construction of the Plant without delays or significant cost overruns is subject to substantial risks, including:
| • | shortages and inconsistent quality of equipment, materials, and labor; |
| • | labor costs and productivity; |
| • | work stoppages; |
| • | contractor or supplier delay or non-performance under construction or other agreements or non-performance by other major participants in construction projects; |
| • | delays in or failure to receive necessary permits, approvals, tax credits, and other regulatory authorizations; |
| • | delays associated with start-up activities, including major equipment failure, system integration, and operations, and/or unforeseen engineering problems; |
| • | impacts of new and existing laws and regulations, including environmental laws and regulations; |
| • | the outcome of legal challenges to projects, including legal challenges to regulatory approvals; |
| • | failure to construct in accordance with licensing requirements; |
| • | continued public and policymaker support for such projects; |
| • | adverse weather conditions or natural disasters; |
| • | other unforeseen engineering problems; |
| • | changes in project design or scope; |
| • | environmental and geological conditions; |
| • | delays or increased costs to interconnect facilities; and |
| • | other unanticipated cost increases. |
If LACC decides to delay or cancel construction of the Plant, the Company may not be able to recover its investment in LACC. LACC may incur substantial cancellation payments under equipment purchase orders or construction contracts. Even if the construction project is completed, the total costs may be higher than estimated. Additionally, if the cost of the construction of the Plant increases, the cost of the Company’s right to purchase up to 50 percent of the interests in LACC will increase as the purchase price under the related call option agreement is directly related to construction costs. In addition, construction delays and contractor performance shortfalls could result in the loss of revenues and, in turn, adversely affect the net income and financial position of the Company.
| (17) | Fluctuations in foreign currency exchange and interest rates could affect our consolidated financial results. |
We earn revenues, pay expenses, own assets and incur liabilities in countries using currencies other than the U.S. dollar. Because our consolidated financial statements are presented in U.S. dollars, we must translate revenues and expenses into U.S. dollars at the average exchange rate during each reporting period, as well as assets and liabilities into U.S. dollars at exchange rates in effect at the end of each reporting period. Therefore, increases or decreases in the value of the U.S. dollar against other major currencies will affect our net revenues, operating income and the value of balance sheet items denominated
26
Table of Contents
in foreign currencies. Because of the geographic diversity of our operations, weaknesses in various currencies might occur in one or many of such currencies over time. From time to time, we may use derivative financial instruments to further reduce our net exposure to currency exchange rate fluctuations. However, we cannot assure you that fluctuations in foreign currency exchange rates, such as the recent strengthening of the U.S. dollar against major currencies, including, in particular, the Canadian dollar, would not materially adversely affect our financial results.
In addition, we are exposed to volatility in interest rates. When appropriate, we may use derivative financial instruments to reduce our exposure to interest rate risks. We cannot assure you, however, that our financial risk management program will be successful in reducing the risks inherent in exposures to interest rate fluctuations.
| (18) | Failure to adequately protect critical data and technology systems could materially affect our operations. |
Information technology system failures, network disruptions and breaches of data security could disrupt our operations by causing delays or cancellation of customer orders, impede the manufacture or shipment of products or cause standard business processes to become ineffective, resulting in the unintentional disclosure of information or damage to our reputation. While we have taken steps to address these concerns by implementing network security and internal control measures, there can be no assurance that a system failure, network disruption or data security breach will not have a material adverse effect on our business, financial condition, operating results or cash flow.
Forward-Looking Statements
This Annual Report on Form 10-K contains certain statements relating to future events and our intentions, beliefs, expectations and predictions for the future. Any such statements other than statements of historical fact are forward-looking statements within the meaning of the Securities Act of 1933 and the Securities Exchange Act of 1934. Words or phrases such as “anticipate,” “believe,” “plan,” “estimate,” “project,” “may,” “will,” “intend,” “target,” “expect,” “would” or “could” (including the negative variations thereof) or similar terminology used in connection with any discussion of future plans, actions or events generally identify forward-looking statements. These statements relate to, among other things, our outlook for future periods and our expectations regarding demand for our products and the seasonality of that demand, product mix and margin impacts related thereto, expected growth of our businesses and products, our results of operations, our financial and operational performance, our business prospects and opportunities, product pricing and sales volumes, planned outages and the impact of those outages on our financial and operational performance, natural gas and ethylene costs, the components of our ethylene supply portfolio, natural gas hedging and the impacts thereof on our financial performance, corporate overhead, supply and demand, pricing trends and market forces within the chemical and building industries, cost reduction strategies and their results, planned capital expenditures, long-term objectives of management, expected benefits of acquisitions, divestitures, joint ventures and other transactions, and other statements of expectations concerning matters that are not historical facts. These statements are based on the current expectations of our management. There are a number of risks and uncertainties that could cause our actual results to differ materially from the forward-looking statements included in this Annual Report on Form 10-K. These risks and uncertainties include, among other things:
| • | changes, seasonality and/or cyclicality in the industries in which our products are sold and changes in demand for our products or increases in overall industry capacity that could affect production volumes and/or pricing; |
| • | the costs and operating restrictions associated with compliance with current and future environmental, health and safety laws and regulations; |
27
Table of Contents
| • | the availability and pricing of energy and raw materials; |
| • | risks, hazards and potential liabilities associated with manufacturing and transporting chemicals and building products, including, among others, explosions and fires, mechanical failures unscheduled downtime and related litigation; |
| • | legislative and regulatory developments; |
| • | changes in the general economy, including the impacts of the current, and any potential future, economic uncertainties in the housing and construction markets; |
| • | our level of indebtedness and debt service obligations and ability to continue to comply with the covenants in the credit agreement governing the ABL Revolver, the agreement governing the New Term Loan Facility and the indentures governing the 4.875 Notes and the 4.625 Notes; |
| • | our reliance on a limited number of suppliers for specified feedstock and services and our reliance on third-party transportation; |
| • | risks, costs and liabilities associated with pension and OPEB plans; |
| • | competition within our industry; |
| • | complications resulting from our multiple ERP systems and the implementation of our new ERP systems; |
| • | strikes and work stoppages relating to the workforce under collective bargaining agreements; |
| • | any impairment of goodwill, indefinite-lived intangible assets or other intangible assets; |
| • | the failure to realize the benefits of, and/or disruptions resulting from, any asset dispositions, asset acquisitions, joint ventures, business combinations or other transactions; |
| • | shared control of our joint ventures and similar arrangements with unaffiliated third parties, including the ability of such joint venture partners and other counterparties to fulfill their obligations; |
| • | costs resulting from complications or delays relating to the Plant; |
| • | fluctuations in foreign currency exchange and interest rates; |
| • | the failure to adequately protect our data and technology systems; |
| • | uncertainties regarding future actions that may be taken by Westlake Chemical Corporation (“Westlake”) in furtherance of its unsolicited proposal to acquire the company or Westlake’s intent to nominate director candidates for election at the Company’s 2016 annual meeting of stockholders; |
| • | potential operational disruption caused by Westlake’s future actions that may make it more difficult to maintain relationships with customers, employees or suppliers; and |
| • | our ability to successfully implement and administer our cost-saving initiatives (including our restructuring programs) and produce the desired results (including projected savings). |
In light of these risks, uncertainties, assumptions and other factors, the forward-looking statements discussed in this Annual Report on Form 10-K may not occur. Other unknown or unpredictable factors could also have a material adverse effect on our actual future results, performance or achievements.
28
Table of Contents
For a further discussion of these and other risks and uncertainties applicable to us and our business, see the section of this Annual Report on Form 10-K entitled “Risk Factors” and in our subsequent periodic filings with the SEC. As a result of the foregoing, readers are cautioned not to place undue reliance on these forward-looking statements, which speak only as of the date of this report. We do not undertake, and expressly disclaim, any duty to update any forward-looking statement whether as a result of new information, future events or changes in our expectations, except as required by law.
Item 1B. UNRESOLVED STAFF COMMENTS.
None.
Executive Officers of Axiall Corporation
The following is additional information regarding our executive officers as of February 22, 2016:
Dean Adelman, 50, has served as the Vice President of Human Resources since February 2013. Before then, he was the Senior Vice President of Human Resources and Chief Administration Officer of BlueLinx Corporation from 2005 to 2013.
Simon Bates, 49, has served as Senior Vice President, Building Products since September 2015. Prior to that role, he served as Vice President and General Manager, Royal Building Products’ Exteriors business unit from 2009 to September 2015.
William Doherty, 61, has served as Senior Vice President, Chemicals since July 2015. Prior to that role, he was Vice President, Specialties business unit since April 2015 and also served as Vice President, Compounds & Additives from January 2013 to April 2015 and Vice President PVC Compounds from December 2008 to January 2013.
Daniel Fishbein, 42, has served as Vice President and General Counsel since July 2015. Prior to that role, he was Associate General Counsel and Chief Mergers and Acquisitions Counsel from 2014 to July 2015. For almost seven years prior to joining us, he was an attorney at the international law firm of Jones Day, where his practice focused primarily on public and private merger and acquisition activities and corporate governance, including general corporate counseling.
Timothy Mann, Jr., 50, has served as our President and Chief Executive Officer since November 17, 2015. Mr. Mann had been serving as Interim President and Chief Executive Officer of the Company since July 6, 2015, and, prior to that, as Executive Vice President, General Counsel and Corporate Secretary from July 23, 2012. For more than five years prior to joining us, he was a partner at the international law firm of Jones Day, where his practice focused primarily on public and private merger and acquisition activities and corporate governance, including executive compensation and general corporate counseling.
Gregory C. Thompson, 60, has served as Executive Vice President and Chief Financial Officer since February 2008. Before then, he was the Senior Vice President and Chief Financial Officer of Invacare Corporation, a medical equipment manufacturer, since 2002.
Executive officers are elected by, and serve at the pleasure of, the board of directors.
Information concerning our properties is set forth in Item 1 under the captions “Chlorovinyls Segment—Production, Raw Materials and Facilities—Facilities,” and “Building Products Segment—Production, Raw Materials and Facilities—Facilities.”
29
Table of Contents
We lease office space for our principal executive offices in Atlanta, Georgia, for other administrative functions in Pittsburgh, Pennsylvania, for research and development functions in Monroeville, Pennsylvania and for certain legal and information services in Baton Rouge, Louisiana. Additionally, space is leased for our procurement, sales and marketing offices in Houston, Texas and for numerous storage terminals throughout the United States.
Substantially all of our owned facilities are pledged as security for indebtedness under the ABL Revolver and the New Term Loan Facility.
We believe our current facilities are adequate to meet the requirements of our present operations.
We are involved in a number of contingencies incidental to the normal conduct of our business, including lawsuits, claims and environmental contingencies. The outcome of these contingencies is inherently unpredictable. We believe that, in the aggregate, the outcome of all known contingencies, including lawsuits, claims and environmental contingencies, will not have a material adverse effect on our consolidated financial statements; however, specific outcomes with respect to such contingencies may be material to the consolidated financial statements of any particular period in which costs, if any, are recognized. Our assessment of the potential impact of environmental contingencies is subject to uncertainty due to the complex, ongoing and evolving process of investigation and remediation of such environmental contingencies, and the potential for technological and regulatory developments. In addition, the impact of evolving programs, such as natural resource damage claims, industrial site reuse initiatives and state remediation programs creates further uncertainty of the ultimate resolution of these environmental contingencies. We anticipate that the resolution of many contingencies, and in particular environmental contingencies, will occur over an extended period of time.
During September 2010, our Lake Charles North and Plaquemine, Louisiana facilities each received a Consolidated Compliance Order and Notice of Potential Penalty, alleging violations of various requirements of those facilities’ air permits, based largely on self-reported permit deviations related to record-keeping violations. The Company has been negotiating a possible settlement of these matters with LDEQ. Based upon a communication from LDEQ in September 2014, the Company now believes this matter may require the payment of a monetary sanction in excess of $100,000, but it does not expect that the resolution of this matter will have a material adverse effect on its consolidated financial statements for any period.
On December 20, 2013, a fire occurred at our PHH Monomers, LLC, (“PHH”) vinyl chloride monomer (“VCM”) manufacturing plant in Lake Charles, Louisiana. As of December 31, 2015, approximately 2,607 individuals have lawsuits against the Company alleging personal injury or property damage related to the incident. We do not expect any other individuals to file lawsuits regarding this matter, as the prescribed deadline for doing so has expired. We have not recorded an accrual in connection with any of these lawsuits because, at this time, we are unable to reasonably determine whether any potential loss is probable or reasonably possible. In addition, we currently are unable to provide a reasonable estimate of the potential loss or range of loss, if any, expected to result from this contingency. We are unable to make these determinations due to a number of variables, including without limitation, uncertainties related to: (i) the fact that no written or oral discovery has been conducted by the Company in any of these lawsuits; (ii) the parties’ respective litigation strategies; (iii) the fact that none of the complaints have alleged specific injuries or a specific amount of damages; (iv) any symptoms experienced by any of the plaintiffs, and whether there will be any reliable information, documentation or other discovery related thereto; (v) the pre-and-post fire medical or physical condition of the plaintiffs, and whether there will be any reliable information, documentation or other discovery related thereto; and (vi) the location of any plaintiff at the time of the fire, and the
30
Table of Contents
duration of any exposure related thereto, and whether there will be any reliable information, documentation or other discovery related thereto.
In April 2015, the Company received a communication from the EPA related to, among other things, the EPA’s investigation of the December 2012 and December 2013 fires that occurred at the Company’s PHH VCM plant in Lake Charles, Louisiana. In November 2015, the Company settled this matter with the EPA, with such settlement including supplemental environmental projects and a payment of $0.9 million, which was paid in early December 2015.
Item 4. MINE SAFETY DISCLOSURES.
Not applicable.
31
Table of Contents
PART II
Item 5. MARKET FOR REGISTRANT’S COMMON EQUITY, RELATED STOCKHOLDER MATTERS AND ISSUER PURCHASES OF EQUITY SECURITIES.
Axiall Corporation’s common stock is listed on the New York Stock Exchange under the symbol “AXLL.” At February 22, 2016, there were 433 stockholders of record.
Market Price of Common Stock
The high and low market price per share, as well as the dividends paid per share for the Company’s common stock in 2015 and 2014, were as follows:
| 2015 | 2014 | |||||||||||||||||||||||
| High | Low | Dividends Paid Per Share |
High | Low | Dividends Paid Per Share |
|||||||||||||||||||
| First quarter |
$ | 51.35 | $ | 39.78 | $ | 0.16 | $ | 47.30 | $ | 37.86 | $ | 0.16 | ||||||||||||
| Second quarter |
$ | 47.47 | $ | 34.88 | $ | 0.16 | $ | 49.27 | $ | 41.79 | $ | 0.16 | ||||||||||||
| Third quarter |
$ | 36.51 | $ | 15.26 | $ | 0.16 | $ | 48.88 | $ | 35.67 | $ | 0.16 | ||||||||||||
| Fourth quarter |
$ | 23.73 | $ | 12.83 | $ | 0.16 | $ | 45.94 | $ | 34.32 | $ | 0.16 | ||||||||||||
Ability to Pay Dividends Under the ABL Revolver
Under the ABL Revolver, cash dividend payments in an aggregate amount not to exceed $150 million in any fiscal year may be made if both borrowing availability under the ABL Revolver would have exceeded $75 million at all times during the thirty days immediately preceding the dividend payment and our consolidated fixed charge coverage ratio (as defined in the definitive documentation governing the ABL Revolver) is equal to or exceeds 1.00 to 1.00, each on a pro forma basis after giving effect to the proposed dividend payment. In addition, under the ABL Revolver, additional cash dividend payments may be made if both borrowing availability under the ABL Revolver then exceeds $100 million and our consolidated fixed charge coverage ratio (as defined in the definitive documentation governing the ABL Revolver) is equal to or exceeds 1.10 to 1.00, each on a pro forma basis after giving effect to the proposed cash dividend payment. Additionally, under the ABL Revolver, cash dividend payments in an aggregate amount not to exceed $50 million in any fiscal year may be made if both borrowing availability under the ABL Revolver would have exceeded $250 million at all times during the 45 days immediately preceding the dividend payment declaration and exceeds $250 million on the day of declaration of such dividend payment, and is reasonably expected to exceed $250 million on the last day of the calendar month during which such dividend payment is declared, and on the last day of the next two succeeding calendar months.
PERFORMANCE GRAPH
The graph below presents a comparison of the five-year cumulative total returns of an investment in our common stock, the Standard & Poor’s (“S&P”) 400 MidCap Index (the “400 Index”) and the Standard & Poor’s Chemical MidCap Index (the “Chemical Index”). We believe these indices provide the closest comparison to our line of business.
The graph assumes that on December 31, 2010, $100 was invested in our common stock (at the closing price on that day or the nearest previous trading day) and in each of the indices presented. Stock performances, including our stock performance, were calculated using the assumption that all
32
Table of Contents
dividends, including distributions of cash, were reinvested in common stock. The graph indicates the dollar value of each hypothetical $100 investment as of December 31 in each of the five years presented.
Total Shareholder Returns (Indexed)
Axiall versus the 400 Index and the Chemical Index
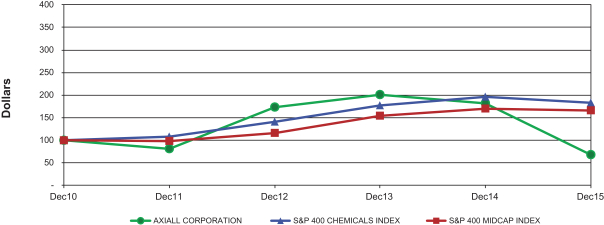
| Company \ Index Name |
12/31/2010 | 12/31/2011 | 12/31/2012 | 12/31/2013 | 12/31/2014 | 12/31/2015 | ||||||
| Axiall Corporation |
100 | 81 | 173 | 201 | 182 | 68 | ||||||
| The Chemical Index |
100 | 108 | 141 | 177 | 196 | 183 | ||||||
| The 400 Index |
100 | 98 | 116 | 154 | 170 | 166 |
Pursuant to SEC rules, this “Performance Graph” section of this Annual Report on Form 10-K is not deemed “filed” with the SEC and shall not be deemed incorporated by reference in any filing under the Securities Act of 1933 or the Securities Exchange Act of 1934.
33
Table of Contents
Item 6. SELECTED FINANCIAL DATA.
The following table provides selected financial data for the Company and should be read in conjunction with management’s discussion and analysis of financial condition and results of operations and our audited consolidated financial statements and related notes included elsewhere in this Annual Report on Form 10-K.
| Year Ended December 31, | ||||||||||||||||||||||
| (In millions, except per share data, percentages |
2015 | 2014 | 2013 (1) | 2012 | 2011 | |||||||||||||||||
| Results of Operations: |
||||||||||||||||||||||
| Net sales |
$ | 3,361.1 | $ | 3,808.8 | $ | 3,767.2 | $ | 2,221.5 | $ | 2,202.6 | ||||||||||||
| Cost of sales |
2,968.9 | 3,292.3 | 3,059.4 | 1,830.8 | 1,913.5 | |||||||||||||||||
| Selling, general and administrative expenses |
299.7 | 305.6 | 294.5 | 198.4 | 164.4 | |||||||||||||||||
| Restructuring and divestiture costs |
23.3 | 19.8 | 20.8 | 2.2 | 11.6 | |||||||||||||||||
| Integration-related costs and other, net |
16.0 | 32.2 | 32.6 | 35.9 | - | |||||||||||||||||
| Goodwill impairment charges |
864.1 | 4.1 | 18.2 | - | - | |||||||||||||||||
| Gain on sale of assets, net |
- | - | - | (19.3) | (1.1) | |||||||||||||||||
|
|
|
|
|
|
|
|
|
|
|
|||||||||||||
| Operating income (loss) |
(810.9) | 154.8 | 341.7 | 173.5 | 114.2 | |||||||||||||||||
| Interest expense |
(78.1) | (76.5) | (77.6) | (57.5) | (65.6) | |||||||||||||||||
| Debt refinancing costs |
(3.2) | - | (78.5) | (2.7) | (4.9) | |||||||||||||||||
| Gain on acquisition of controlling interest |
- | - | 25.9 | - | - | |||||||||||||||||
| Foreign exchange loss |
(1.2) | (0.6) | - | (0.6) | (0.9) | |||||||||||||||||
| Interest income |
0.4 | 0.7 | 1.0 | 0.4 | 0.3 | |||||||||||||||||
|
|
|
|
|
|
|
|
|
|
|
|||||||||||||
| Income (loss) from continuing operations before income taxes |
(893.0) | 78.4 | 212.5 | 113.1 | 43.1 | |||||||||||||||||
| Provision for (benefit from) income taxes |
(43.9) | 14.3 | 62.9 | 34.5 | (8.0) | |||||||||||||||||
|
|
|
|
|
|
|
|
|
|
|
|||||||||||||
| Net income (loss) from continuing operations |
(849.1) | 64.1 | 149.6 | 78.6 | 51.1 | |||||||||||||||||
| Discontinued operations: |
||||||||||||||||||||||
| Income (loss) from discontinued operations | 14.7 | (20.7) | 29.1 | 64.6 | 10.4 | |||||||||||||||||
| Less: Provision for (benefit from) income taxes of |
2.7 | (6.8) | 10.7 | 22.7 | 3.8 | |||||||||||||||||
|
|
|
|
|
|
|
|
|
|
|
|||||||||||||
| Net income (loss) from discontinued operations |
12.0 | (13.9) | 18.4 | 41.9 | 6.6 | |||||||||||||||||
|
|
|
|
|
|
|
|
|
|
|
|||||||||||||
| Consolidated net income (loss) |
(837.1) | 50.2 | 168.0 | 120.5 | 57.7 | |||||||||||||||||
| Less: net income (loss) attributable to noncontrolling interest |
(20.7) | 3.9 | 2.7 | - | - | |||||||||||||||||
|
|
|
|
|
|
|
|
|
|
|
|||||||||||||
| Net income (loss) attributable to Axiall |
$ | (816.4) | $ | 46.3 | $ | 165.3 | $ | 120.5 | $ | 57.7 | ||||||||||||
|
|
|
|
|
|
|
|
|
|
|
|||||||||||||
| Basic earnings (loss) per share attributable to Axiall |
$ | (11.59) | $ | 0.66 | $ | 2.46 | $ | 3.47 | $ | 1.66 | ||||||||||||
| Diluted earnings (loss) per share attributable to Axiall |
$ | (11.59) | $ | 0.65 | $ | 2.44 | $ | 3.45 | $ | 1.66 | ||||||||||||
| Weighted average common shares outstanding—basic |
70.4 | 70.1 | 67.3 | 34.5 | 34.1 | |||||||||||||||||
| Weighted average common shares outstanding—diluted |
70.4 | 70.6 | 67.8 | 34.8 | 34.1 | |||||||||||||||||
| Dividends per common share (2) |
$ | 0.64 | $ | 0.64 | $ | 0.48 | $ | 0.24 | $ | - | ||||||||||||
| Common shares outstanding |
70.6 | 70.2 | 69.9 | 34.6 | 34.3 | |||||||||||||||||
| Adjusted EBITDA (3) |
$ | 330.3 | $ | 454.8 | $ | 641.7 | $ | 268.8 | $ | 211.0 | ||||||||||||
| Balance Sheet Data: |
||||||||||||||||||||||
| Net working capital |
$ | 573.9 | $ | 621.1 | $ | 625.4 | $ | 488.3 | $ | 384.7 | ||||||||||||
| Property, plant and equipment, net |
1,617.6 | 1,636.1 | 1,633.0 | 620.0 | 624.4 | |||||||||||||||||
| Total assets |
4,539.4 | 5,656.0 | 5,857.1 | 1,790.5 | 1,632.8 | |||||||||||||||||
| Total debt |
1,367.0 | 1,312.3 | 1,312.7 | 437.3 | 486.1 | |||||||||||||||||
| Lease financing obligation |
79.6 | 94.2 | 104.7 | 112.3 | 109.9 | |||||||||||||||||
| Cash Flow Data: |
||||||||||||||||||||||
| Net cash provided by operating activities |
$ | 267.1 | $ | 291.1 | $ | 325.7 | $ | 231.2 | $ | 187.4 | ||||||||||||
| Net cash used in investing activities |
(141.7) | (208.5) | (139.6) | (56.7) | (136.4) | |||||||||||||||||
| Net cash used in financing activities |
(23.1) | (75.3) | (216.2) | (63.8) | (85.7) | |||||||||||||||||
| Depreciation |
175.3 | 169.7 | 147.1 | 80.5 | 89.9 | |||||||||||||||||
| Amortization |
73.2 | 74.8 | 69.7 | 7.8 | 10.1 | |||||||||||||||||
| Capital expenditures |
(196.7) | (202.5) | (189.0) | (77.6) | (64.6) | |||||||||||||||||
| Acquisitions, net of cash acquired |
- | (6.1) | 45.1 | - | (71.4) | |||||||||||||||||
| Other Selected Data: |
||||||||||||||||||||||
| Return on sales |
(25.3%) | 1.7% | 4.0% | 3.5% | 2.3% | |||||||||||||||||
34
Table of Contents
| (1) | Includes the Merged Business financial data as of December 31, 2013 and from January 28, 2013 (date of acquisition). |
| (2) | Dividends per share reflect $0.16 per share declared for each quarter in 2015 and 2014; $0.08 per share declared in the first and second quarters of 2013 and $0.16 per share declared in the third and fourth quarters of 2013; and $0.08 per share declared for three of the four quarters in 2012. There were no dividend declarations in 2011. |
| (3) | Adjusted EBITDA is defined as Earnings (Loss) Before Interest, Taxes, Depreciation and Amortization, restructuring and certain other charges, if any, related to discontinued operations, financial restructuring and business improvement initiatives, gains or losses on sales of certain assets, debt refinancing costs, certain acquisition accounting and non-income tax reserve adjustments, certain professional fees associated with various potential and completed mergers and acquisitions, divestitures, joint ventures and other transactions, costs to attain synergies related to the integration of the Merged Business, impairment charges for goodwill, intangible assets, and other long-lived assets, certain pension and other post-retirement plan curtailment gains and settlement losses and interest expense related to the lease-financing transaction discussed in Note 10 of the Notes to the Consolidated Financial Statements in Item 8 to this Annual Report on Form 10-K. |
Axiall has supplemented the consolidated financial statements with Adjusted EBITDA because investors commonly use Adjusted EBITDA as a main component of valuation analysis of cyclical companies such as ours. A reconciliation of Adjusted EBITDA to consolidated net income (loss) determined in accordance with GAAP is provided below:
| Year Ended December 31, | ||||||||||||||||||||
| 2015 | 2014 | 2013 | 2012 | 2011 | ||||||||||||||||
| Consolidated net income (loss) from continuing operations |
$ | (849.1) | $ | 64.1 | $ | 149.6 | $ | 78.6 | $ | 51.1 | ||||||||||
| Provision for (benefit from) income taxes |
(43.9) | 14.3 | 62.9 | 34.5 | (8.0) | |||||||||||||||
| Interest income |
(0.4) | (0.7) | (1.0) | (0.4) | (0.3) | |||||||||||||||
| Depreciation and amortization |
248.5 | 244.5 | 216.8 | 88.3 | 100.0 | |||||||||||||||
| Gain on acquisition of controlling interest |
- | - | (25.9) | - | - | |||||||||||||||
| Debt refinancing costs |
3.2 | - | 78.5 | 2.7 | 4.9 | |||||||||||||||
| Interest expense |
78.1 | 76.5 | 77.6 | 57.5 | 65.6 | |||||||||||||||
| Gain on sale of assets |
- | - | - | (19.3) | (1.1) | |||||||||||||||
| Goodwill impairment charges |
864.1 | 4.1 | 18.2 | - | - | |||||||||||||||
| Restructuring and divestiture costs |
23.3 | 19.8 | 20.8 | 2.2 | 11.6 | |||||||||||||||
| Integration-related costs and other, net(1) |
16.6 | 43.9 | 56.4 | 35.9 | (1.3) | |||||||||||||||
| OMERS lease financing obligations and debt amortization costs |
(10.1) | (11.7) | (12.2) | (11.2) | (11.5) | |||||||||||||||
|
|
|
|
|
|
|
|
|
|
|
|||||||||||
| Adjusted EBITDA |
$ | 330.3 | $ | 454.8 | $ | 641.7 | $ | 268.8 | $ | 211.0 | ||||||||||
|
|
|
|
|
|
|
|
|
|
|
|||||||||||
| (1) | Includes $0.6 million, $11.7 million, $10.4 million of costs relating to plant reliability improvement initiatives that are included in cost of sales on our consolidated statements of operations for the years ended December 31, 2015, 2014 and 2013, respectively. The year ended December 31, 2013 also included $13.4 million of inventory fair value acquisition accounting adjustment in the cost of sales in our consolidated statements of operations. There were no such costs during the year ended December 31, 2012. |
Item 7. MANAGEMENT’S DISCUSSION AND ANALYSIS OF FINANCIAL CONDITION AND RESULTS OF OPERATIONS.
We are a leading North American manufacturer and international marketer of chemicals and building products. Our chlorovinyls chemical products are sold for further processing into a wide variety of end-use applications, including plastic pipe and pipe fittings, siding and window frames, high-quality plastics, and coatings for wire and cable, paper, minerals, metals and water treatment industries. Our building products segment manufactures window and door profiles, trim, mouldings, deck, siding, pipe and pipe fittings products.
Portfolio Initiatives
Sale of Aromatics Business: Discontinued Operations
On September 30, 2015, the Company entered into and consummated the transactions contemplated by an asset purchase agreement (the “Asset Purchase Agreement”) between INEOS Americas LLC (“INEOS”) and Axiall LLC, a wholly-owned subsidiary of the Company. Pursuant to the Asset Purchase
35
Table of Contents
Agreement, INEOS acquired certain assets used in the Company’s aromatics business, including but not limited to, its cumene production facility located in Pasadena, Texas. The Company retained the land and plant at its phenol, acetone and alpha-methylstyrene production facility located in Plaquemine, Louisiana (the “Plaquemine Phenol Facility”), which is part of a broader set of other Axiall chemical manufacturing facilities located in Plaquemine. In addition, the Company retained the following assets associated with its aromatics business: (i) cash and cash equivalents; (ii) accounts receivable; and (iii) inventory, other than certain raw materials and work-in-process inventory at its Pasadena facility. The Company has discontinued the manufacture of products at its Plaquemine Phenol Facility and expects to dismantle and shutdown that facility.
At closing, the Company received $52.4 million in cash, which consisted of: (i) the selling price of $47.4 million; and (ii) a $5.0 million advance toward the cost of decommissioning and dismantling our Plaquemine Phenol Facility. That advance was recorded as a liability in our consolidated balance sheets. During the fourth quarter of 2015, the Company met certain terms and conditions set forth in the Asset Purchase Agreement that entitled us to receive $5.5 million of contingent consideration, pursuant to which we recorded $5.3 million, as a gain, net of a $0.2 million working capital adjustment, related to the sale. Further, the Company may receive an additional $5.0 million from INEOS to help defray the costs of decommissioning and dismantling the Plaquemine Phenol Facility. The Company’s receipt of all or any portion of the remaining $5.0 million that INEOS may be required to pay and our right to retain the $5.0 million advance payment will depend on the amount of costs incurred by us to decommission and dismantle the Plaquemine Phenol Facility. During 2015, the Company incurred $0.8 million of such costs and our remaining liability is $4.6 million as of December 31, 2015. For the year ended December 31, 2015, the Company recorded a pre-tax gain of $21.5 million on the sale of our aromatics business assets as described above, the net effect of which is reflected in income (loss) from discontinued operations on our consolidated statements of operations. During the fourth quarter, the Company also received net cash from retained working capital totaling $33.0 million.
We expect cash flows attributable to discontinued operations in future periods to be primarily related to the cost of decommissioning the Plaquemine Phenol Facility, partially offset by the related contingent consideration we expect to receive from INEOS if certain other conditions are satisfied. Changes to the estimates and liabilities related to discontinued operations as of December 31, 2015, including the estimated post-closing purchase price adjustment or accrued expenses related to the sale transaction, may result in an adjustment to our gain on the sale transaction.
The aromatics segment has been classified as discontinued operations for all periods presented. As a result, our manufacturing operations are concentrated in two reportable segments: chlorovinyls and building products.
Ethane Cracker Project with Lotte Chemical
On June 17, 2015, Eagle US 2 LLC (“Eagle”), a wholly-owned subsidiary of the Company, entered into an amended and restated limited liability company agreement with Lotte Chemical USA Corporation (“Lotte”) related to the formation of LACC, LLC (“LACC”), which is an entity formed by Eagle and Lotte to design, build and operate a state-of-the-art 1.0 million metric tons per annum ethane cracker (ethylene manufacturing plant) in Lake Charles, Louisiana (the “Plant”). The Plant will provide partial backward integration for Axiall’s vinyls business and will supply a new monoethylene glycol (“MEG”) facility being built by Lotte. Pursuant to a contribution and subscription agreement, dated as of June 17, 2015, between the Company, Eagle and LACC, Eagle has agreed to make a maximum capital commitment to LACC of up to $225 million to fund the construction costs of the Plant. Eagle’s investment is expected to represent approximately 10 percent of the interests of LACC. Eagle and Lotte also entered into a call option agreement, dated as of June 17, 2015, pursuant to which Eagle has the right, but not the obligation, until the third anniversary of the substantial completion of the Plant, to acquire up to a 50 percent ownership interest in LACC from Lotte.
36
Table of Contents
On December 17, 2015, Axiall and Lotte announced that the companies reached a final investment decision to construct the Plant.
The Plant is being built adjacent to Axiall’s largest chlor-alkali chemical facility, located in Lake Charles, Louisiana, to take advantage of Axiall’s existing infrastructure, access to competitive feedstock resources, and ethylene distribution infrastructure. The anticipated start-up for the Plant is expected to be the beginning of 2019.
Building Products
The Company has engaged financial advisors to assist the Company with the sale of its building products segment. A sale process for the entire building products segment is ongoing. We expect to complete the sale of two non-core business units during the first quarter of 2016, and are targeting the sale of the remainder of the building products businesses by the end of the second quarter of 2016.
Results of Operations Overview
Consolidated Overview
| • | For the year ended December 31, 2015, net sales totaled $3,361.1 million, decreasing 12 percent compared to $3,808.8 million for the year ended December 31, 2014. For the year ended December 31, 2014, net sales increased $41.6 million from $3,767.2 million for the year ended December 31, in 2013. |
| • | Operating loss was $810.9 million for the year ended December 31, 2015 compared to operating income of $154.8 million and $341.7 million for the years ended December 31, 2014 and 2013, respectively. Adjusted EBITDA was $330.3 million, $454.8 million and $641.7 million for the years ended December 31, 2015, 2014, and 2013, respectively. |
| • | The Company reported net loss attributable to Axiall of $816.4 million, or a loss of $11.59 per diluted share, for the year ended December 31, 2015, compared to net income attributable to Axiall of $46.3 million, or $0.65 per diluted share, for the year ended December 31, 2014. For the year ended December 31, 2013, the Company reported net income attributable to Axiall of $165.3 million or $2.44 per diluted share. |
| • | Adjusted Net Income was $83.5 million and Adjusted Earnings Per Share was $1.18 for the year ended December 31, 2015, compared to Adjusted Net Income of $139.9 million and Adjusted Earnings Per Share of $1.98 for the year ended December 31, 2014. Adjusted Net Income was $312.0 million and Adjusted Earnings Per Share was $4.60 for the year ended December 31, 2013. See Reconciliation of Non-GAAP Financial Measures in this Annual Report on Form 10-K. |
Chlorovinyls Business Overview
Our chlorovinyls segment produces a highly integrated chain of chlor-alkali and derivative products (chlorine, caustic soda, VCM, vinyl resins, ethylene dichloride, chlorinated solvents, calcium hypochlorite, and HCL) and compound products (vinyl compounds and compound additives and plasticizers). As discussed further below, certain highlights from our chlorovinyls segment results of operations for the years ended December 31, 2015, 2014 and 2013 were as follows:
| • | Net sales totaled $2,506.1 million and $2,930.2 million for the years ended December 31, 2015 and 2014, respectively, decreasing approximately $424.1 million. For the year ended |
37
Table of Contents
| December 2014, net sales increased $12.9 million when compared to net sales of $2,917.3 million for the year ended December 31, 2013. |
| • | Operating loss was $768.5 million and Adjusted EBITDA $301.1 million during the year ended December 31, 2015 versus operating income of $213.9 million and Adjusted EBITDA of $448.1 million for the year ended December 31, 2014. For the year ended December 31, 2014, operating income and Adjusted EBITDA decreased $221.0 million and $176.4 million, respectively, when compared to operating income and Adjusted EBITDA of $434.9 million and $624.5 million, respectively, for the year ended December 31, 2013. |
Our chlorovinyls segment is cyclical in nature and is affected by domestic and worldwide economic conditions. Cyclical price swings, driven by changes in supply and demand, can lead to significant changes in the overall profitability of our chlorovinyls segment. The demand for our chlorovinyls products tends to reflect fluctuations in downstream markets that are affected by consumer spending for durable and non-durable goods as well as construction. Global capacity also materially affects the prices of chlorovinyls products. Historically, in periods of high operating rates, prices rise and margins increase and, as a result, new capacity is announced. Since world scale size plants are generally the most cost-competitive, new increases in capacity tend to be on a large scale and are often undertaken by existing industry participants. Usually, as new capacity is added, prices decline until increases in demand improve operating rates and the new capacity is absorbed or, in some instances, until less efficient producers withdraw capacity from the market. As the additional supply is absorbed, operating rates rise, prices increase and the cycle repeats.
In addition, purchased raw materials and natural gas costs account for the majority of our cost of sales and can also have a material effect on our profitability and margins. Some of the primary raw materials used in our chlorovinyls products are ethylene, crude oil and natural gas derivatives and therefore follow the oil and gas industry price trends.
Building Products Business Overview
Our building products segment consists of two primary product groups: (i) window and door profiles and trim, mouldings and deck products, which include extruded vinyl window and door profiles, interior and exterior trim and mouldings products, as well as deck products; and (ii) outdoor building products, which includes siding, pipe and pipe fittings. As discussed further below, certain highlights from our building products segment results of operations for the years ended December 31, 2015, 2014 and 2013 were as follows:
| • | Net sales totaled $855.0 million and $878.6 million for the years ended December 31, 2015 and 2014, respectively, decreasing 3 percent. On a constant currency basis, net sales for the year ended December 31, 2015 increased by 3 percent. During the year ended December 31, 2014, net sales increased 3 percent from $849.9 million for the year ended December 31, 2013. On a constant currency basis, net sales for the year ended December 31, 2014 increased by 7 percent when compared to the year ended December 31, 2013. |
| • | For the year ended December 31, 2015, our building products segment’s geographical sales to the United States and Canada were 59 percent and 40 percent respectively, compared with 54 percent and 45 percent for the year ended December 31, 2014. For the year ended December 31, 2013, our building products segment’s geographical sales to the United States and Canada were 50 percent and 49 percent, respectively. |
38
Table of Contents
| • | Operating income was $35.0 million and Adjusted EBITDA was $77.8 million for the year ended December 31, 2015 compared to operating income of $25.8 million and Adjusted EBITDA of $67.7 million for the year ended December 31, 2014. For the year ended December 31, 2014, operating income increased $22.8 million and Adjusted EBITDA decreased $3.0 million when compared to operating income of $3.0 million and Adjusted EBITDA of $70.7 million for the year ended December 31, 2013. |
The building products segment is impacted by changes in the North American home repair and remodeling sectors, as well as the new construction industry, which may be significantly affected by changes in economic and other conditions such as gross domestic product levels, employment levels, demographic trends, consumer confidence, increases in interest rates and availability of consumer financing for home repair and remodeling projects as well as the availability of financing for new home purchases. These factors can lower the demand for, and pricing of our products, while we may not be able to reduce our costs by an equivalent amount.
The following table sets forth our consolidated statements of operations data for each of the years ended December 31, 2015, 2014 and 2013, and the percentage of net sales of each line item for the years presented.
| Year Ended December 31, | ||||||||||||||||||||||||
| (Dollars in millions) |
2015 | 2014 | 2013 | |||||||||||||||||||||
| Net sales |
$ | 3,361.1 | 100.0% | $ | 3,808.8 | 100.0% | $ | 3,767.2 | 100.0% | |||||||||||||||
| Cost of sales |
2,968.9 | 88.3% | 3,292.3 | 86.4% | 3,059.4 | 81.2% | ||||||||||||||||||
|
|
|
|
|
|
|
|
|
|
|
|
|
|||||||||||||
| Gross margin |
392.2 | 11.7% | 516.5 | 13.6% | 707.8 | 18.8% | ||||||||||||||||||
| Selling, general and administrative expenses |
299.7 | 8.9% | 305.6 | 8.0% | 294.5 | 7.8% | ||||||||||||||||||
| Restructuring and divestiture costs |
23.3 | 0.7% | 19.8 | 0.5% | 20.8 | 0.6% | ||||||||||||||||||
| Integration-related costs and other, net |
16.0 | 0.5% | 32.2 | 0.8% | 32.6 | 0.9% | ||||||||||||||||||
| Goodwill impairment charges |
864.1 | 25.7% | 4.1 | 0.1% | 18.2 | 0.5% | ||||||||||||||||||
|
|
|
|
|
|
|
|
|
|
|
|
|
|||||||||||||
| Operating income (loss) |
(810.9) | (24.1%) | 154.8 | 4.1% | 341.7 | 9.1% | ||||||||||||||||||
| Interest expense |
(78.1) | (2.3%) | (76.5) | (2.0%) | (77.6) | (2.1%) | ||||||||||||||||||
| Debt refinancing costs |
(3.2) | (0.1%) | - | -% | (78.5) | (2.1%) | ||||||||||||||||||
| Gain on acquisition of controlling interest |
- | -% | - | -% | 25.9 | 0.7% | ||||||||||||||||||
| Foreign exchange loss |
(1.2) | -% | (0.6) | -% | - | -% | ||||||||||||||||||
| Interest income |
0.4 | -% | 0.7 | -% | 1.0 | -% | ||||||||||||||||||
|
|
|
|
|
|
|
|
|
|
|
|
|
|||||||||||||
| Income (loss) from continuing |
(893.0) | (26.5%) | 78.4 | 2.1% | 212.5 | 5.6% | ||||||||||||||||||
| Provision for (benefit from) income taxes |
(43.9) | (1.3%) | 14.3 | 0.4% | 62.9 | 1.7% | ||||||||||||||||||
|
|
|
|
|
|
|
|
|
|
|
|
|
|||||||||||||
| Net income (loss) from continuing operations |
(849.1) | (25.3%) | 64.1 | 1.7% | 149.6 | 4.0% | ||||||||||||||||||
|
|
|
|
|
|
|
|
|
|
|
|
|
|||||||||||||
| Discontinued operations: |
||||||||||||||||||||||||
| Income (loss) from discontinued operations |
14.7 | 0.4% | (20.7) | (0.5%) | 29.1 | 0.8% | ||||||||||||||||||
| Less: Provision for (benefit from) income taxes of discontinued operations |
2.7 | 0.1% | (6.8) | (0.2%) | 10.7 | 0.3% | ||||||||||||||||||
|
|
|
|
|
|
|
|
|
|
|
|
|
|||||||||||||
| Net income (loss) from discontinued operations |
12.0 | 0.4% | (13.9) | (0.4%) | 18.4 | 0.5% | ||||||||||||||||||
|
|
|
|
|
|
|
|
|
|
|
|
|
|||||||||||||
| Consolidated net income (loss) |
(837.1) | (24.9%) | 50.2 | 1.3% | 168.0 | 4.5% | ||||||||||||||||||
| Less: net income (loss) attributable to noncontrolling interest |
(20.7) | (0.6%) | 3.9 | 0.1% | 2.7 | 0.1% | ||||||||||||||||||
|
|
|
|
|
|
|
|
|
|
|
|
|
|||||||||||||
| Net income (loss) attributable to Axiall |
$ | (816.4) | (24.3%) | $ | 46.3 | 1.2% | $ | 165.3 | 4.4% | |||||||||||||||
|
|
|
|
|
|
|
|
|
|
|
|
|
|||||||||||||
39
Table of Contents
The following table sets forth certain financial data, by reportable segment, for each of the years ended December 31, 2015, 2014 and 2013.
| Year Ended December 31, | ||||||||||||||||||||||||
| (Dollars in millions) |
2015 | 2014 | 2013 | |||||||||||||||||||||
| Sales: |
||||||||||||||||||||||||
| Chlorovinyls |
$ | 2,506.1 | 74.6% | $ | 2,930.2 | 76.9% | $ | 2,917.3 | 77.4% | |||||||||||||||
| Building products |
855.0 | 25.4% | 878.6 | 23.1% | 849.9 | 22.6% | ||||||||||||||||||
|
|
|
|
|
|
|
|
|
|
|
|
|
|||||||||||||
| Net sales |
$ | 3,361.1 | 100.0% | $ | 3,808.8 | 100.0% | $ | 3,767.2 | 100.0% | |||||||||||||||
|
|
|
|
|
|
|
|
|
|
|
|
|
|||||||||||||
| Operating income (loss): |
||||||||||||||||||||||||
| Chlorovinyls |
$ | (768.5) | $ | 213.9 | $ | 434.9 | ||||||||||||||||||
| Building products |
35.0 | 25.8 | 3.0 | |||||||||||||||||||||
| Unallocated corporate |
(77.4) | (84.9) | (96.2) | |||||||||||||||||||||
|
|
|
|
|
|
|
|||||||||||||||||||
| Total operating income (loss) |
$ | (810.9) | $ | 154.8 | $ | 341.7 | ||||||||||||||||||
|
|
|
|
|
|
|
|||||||||||||||||||
Year Ended December 31, 2015 Compared With Year Ended December 31, 2014
Consolidated Results
Net sales. For the year ended December 31, 2015, net sales totaled $3,361.1 million, decreasing 12 percent compared to $3,808.8 million for the year ended December 31, 2014. The decrease in net sales for the year ended December 31, 2015 as compared to the year ended December 31, 2014 was primarily attributable to: (i) a $424.1 million decrease in the net sales of our chlorovinyls segment due to lower PVC, VCM and chlorinated derivatives sales prices; (ii) lower ECU values, especially with respect to caustic soda pricing; and (iii) lower ECU volumes driven by weaker demand. These unfavorable factors were partially offset by higher operating rates and related sales volumes for PVC during the year ended December 31, 2015 compared to the year ended December 31, 2014.
The lower sales prices for PVC, VCM and chlorinated derivatives were driven by: (i) an oversupply of PVC in North America and globally, relative to slower demand; (ii) a significant reduction in global oil prices making many foreign producers of PVC and chlorinated derivatives more competitive (i.e., a reduction in the natural-gas-based cost advantage enjoyed by North American producers), which has reduced pricing and margins on North American-produced PVC and chlorinated derivatives; and (iii) lower average industry costs for natural gas and ethylene. The lower ECU values, especially with respect to caustic soda pricing, have been caused primarily by: (i) the addition of new production capacity in North America since 2014, coupled with slower growth in the demand needed to absorb that capacity; and (ii) a significant reduction in global energy prices, primarily oil and coal, making many foreign ECU producers more competitive.
The decrease in net sales was also attributable to the decrease in the net sales of our building products segment primarily due to the impact of a stronger United States dollar against a weaker Canadian dollar, partially offset by higher overall sales volumes.
Gross margin percentage. Total gross margin percentage was 12 percent and 14 percent, respectively, for the years ended December 31, 2015 and 2014. The decrease in gross margin was primarily due to the decreases in net sales, which were only partially offset by decreases in the cost of raw materials, primarily natural gas and ethylene.
Selling, general and administrative expenses. Selling, general and administrative expenses decreased 2 percent to $299.7 million as of December 31, 2015 compared to $305.6 million for the year ended
40
Table of Contents
December 31, 2014. This reduction is a result of actions taken to-date in the Company’s announced plan to reduce annualized selling, general and administrative expenses by $25 million by the end of 2016.
Integration-related costs and other, net. Integration-related costs and other, net, decreased approximately 50 percent to $16.0 million for the year ended December 31, 2015 from $32.2 million for the year ended December 31, 2014. The decrease for the year ended December 31, 2015 was primarily due to less integration activity associated with the Merged Business compared to the year ended December 31, 2014. During 2014, our pension plans covering our United States (“U.S. Pension Plans) employees were amended to provide a one-time voluntary lump-sum distribution offer to terminated vested participants and we recorded a settlement charge of $5.8 million related to these costs. In addition, during the year ended December 31, 2014, we incurred higher costs for merger-related and other integration activities pertaining to our merger (the “Merger”) with the Merged Business.
Restructuring and divestiture costs. Restructuring and divestiture costs consist of three components: (i) costs associated with restructuring activities; (ii) costs associated with divestiture activities; and (iii) impairment charges related to restructuring and divestiture activities. During the year ended December 31, 2015, restructuring costs totaled $14.1 million, of which $8.9 million and $5.1 million pertained to severance costs in our corporate unallocated and building products segment, respectively. During the year ended December 31, 2014, our building products segment incurred restructuring costs of $4.5 million. During the years ended December 31, 2015 and 2014, management incurred $6.5 million and $1.8 million, respectively, pertaining to divestiture activities primarily due to divestitures in our building products segment and the sale of certain of our aromatics business assets. During the years ended December 31, 2015 and 2014, the company impaired long-lived assets totaling $2.8 million and $13.5 million, respectively. During the year ended December 31, 2014, the Company impaired $12.5 million in assets pertaining to an immaterial phosgene derivatives product line that was classified as held-for-sale in 2014 and was subsequently sold in 2015.
Goodwill impairment charges. During the year ended December 31, 2015, the Company determined that the estimated fair value of its chlor-alkali and derivatives reporting unit was lower than the carrying value of that reporting unit, and consequently, we proceeded with the second step (“Step-2”) of the goodwill impairment test in order to measure the magnitude of impairment, if any. That Step-2 considered management’s revised projections for our operating results and cash flows of the chlor-alkali and derivatives reporting unit, and the sustained deterioration of market conditions in the chlor-alkali and derivatives industries, as well as the decline in our market capitalization below book value. Based on the results of the Step-2 impairment test, we recorded an $864.1 million goodwill impairment charge related to our chlor-alkali and derivatives reporting unit during the year ended December 31, 2015. During the year ended December 31, 2014, we recorded a $4.1 million in goodwill impairment charge related to the write-down of an immaterial phosgene derivatives product line that was classified as held-for-sale in 2014 and was subsequently sold in 2015. Further reductions in our future projections of operating results and cash flows from our chlor-alkali and derivatives reporting unit, or certain reporting units in our building products business, or a further deterioration of market conditions in the chlor-alkali and derivatives or building products industries in which we operate, among other factors, could result in the Company incurring additional goodwill impairment charges for one or more of those reporting units.
Operating income (loss). Operating loss was $810.9 million and operating income was $154.8 million, for the years ended December 31, 2015 and 2014, respectively. The operating loss was partly attributable to: (i) a $768.5 million operating loss in our chlorovinyls segment which included a goodwill impairment charge of $864.1 million resulting from the impairment test performed in our chlor-alkali and derivatives reporting unit during the year ended December 31, 2015; (ii) lower PVC, VCM and chlorinated derivatives sales prices and margins, driven by an oversupply of PVC in North America and globally, relative to slower
41
Table of Contents
demand; a significant reduction in global oil prices making many foreign producers of PVC and chlorinated derivatives more competitive (i.e., a reduction in the natural-gas-based cost advantage enjoyed by North American producers), which has reduced pricing and margins on North American-produced PVC and chlorinated derivatives; and (iii) lower ECU values, especially with respect to caustic soda pricing, caused primarily by the addition of new production capacity in North America since 2014, coupled with slower growth in the demand needed to absorb that capacity, as well as a significant reduction in global energy prices, primarily oil and coal, making many foreign ECU producers more competitive. These unfavorable factors were partially offset by decreases in our average cost of ethylene and natural gas, higher operating rates and sales volume increases for PVC for the year ended December 31, 2015 compared to the year ended December 31, 2014. Average industry natural gas prices decreased 39 percent and average industry ethylene prices decreased 27 percent for the year ended December 31, 2015, compared to the year ended December 31, 2014, according to the January 2016 IHS report.
Debt refinancing costs. During the year ended December 31, 2015, the Company refinanced its existing term loan facility and increased the principal balance to $250 million and incurred $3.2 million in fees related to the transaction. There were no similar activities during the year ended December 31, 2014.
Interest expense. Interest expense totaled $78.1 million and $76.5 million for the years ended December 31, 2015 and 2014, respectively.
Foreign currency exchange loss. Foreign currency exchange loss totaled $1.2 million and $0.6 million during the years ended December 31, 2015 and 2014, respectively.
Interest income. Interest income totaled $0.4 million and $0.7 million for the years ended December 31, 2015 and 2014, respectively.
Provision for (benefit from) income taxes. The benefit from income taxes from continuing operations was $43.9 million for the year ended December 31, 2015 and the provision for income taxes was $14.3 million for the year ended December 31, 2014. The decrease in income tax to a benefit in 2015 from a provision in 2014 was primarily due to: (i) a loss from continuing operations before income taxes during the year ended December 31, 2015, primarily caused by the $864.1 million goodwill impairment charge, compared to the income from continuing operations for the year ended December 31, 2014; (ii) the tax benefit from our domestic manufacturing activities and depletion deductions; and (iii) the impact to our deferred tax liability recorded for our outside basis differences in foreign subsidiaries resulting from the goodwill impairment charge that was recorded for the year ended December 31, 2015. During the years ended December 31, 2015 and 2014, the Company also recorded a tax provision of $2.7 million and an income tax benefit of $6.8 million, respectively, pertaining to the discontinued operations of our aromatics business.
Our effective income tax rate for the year ended December 31, 2015 was 4.9 percent, resulting from a benefit from income taxes on a loss from continuing operations. The difference in the effective income tax rate as compared to the United States statutory federal income tax rate in 2015 was primarily due to the unfavorable permanent difference for the goodwill impairment charge related to our chlor-alkali and derivatives reporting unit during the year ended December 31, 2015. Our effective tax rate for the year ended December 31, 2014 was 18.2 percent, resulting from a provision for income taxes on income from continuing operations. The difference in the effective income tax rate as compared to the United States statutory federal income tax rate in 2014 was primarily due to various permanent differences including deductions for manufacturing activities, as well as the favorable impact of changes in uncertain tax positions of approximately $9.2 million.
Net income (loss) from discontinued operations. On September 30, 2015 we entered into the Asset Purchase Agreement with, and sold to, INEOS certain assets in our aromatics business, including our
42
Table of Contents
cumene plant located in Pasadena, Texas. In conjunction with the sale of those assets, we recorded a pre-tax gain on sale of $21.5 million, which is included in the results of operations for the year ended December 31, 2015. Net income from discontinued operations for the year ended December 31, 2015 was $12.0 million compared to a net loss from discontinued operations of $13.9 million for the year ended December 31, 2014.
Chlorovinyls Segment
Net sales. Net sales totaled $2,506.1 million for the year ended December 31, 2015, a decrease of 14 percent versus net sales of $2,930.2 million for the year ended December 31, 2014. This net sales decrease was primarily due to: (i) lower PVC, VCM and chlorinated derivatives sales prices; (ii) lower ECU values, especially with respect to caustic soda pricing; and (ii) lower ECU volumes driven by weaker demand. These unfavorable factors were partially offset by higher operating rates and sales volumes for PVC, as the year ended December 31, 2014 was negatively impacted by an extended outage at our PHH VCM manufacturing facility.
The lower sales prices for PVC, VCM and chlorinated derivatives were driven by: (i) an oversupply of PVC in North America and globally, relative to slower demand; (ii) a significant reduction in global oil prices making many foreign producers of PVC and chlorinated derivatives more competitive (i.e., a reduction in the natural-gas-based cost advantage enjoyed by North American producers), which has reduced pricing and margins on North American-produced PVC and chlorinated derivatives; and (iii) lower average industry costs for natural gas and ethylene. Lower ECU values, especially with respect to caustic soda pricing, were caused primarily by: (i) the addition of new production capacity in North America since 2014, coupled with slower growth in the demand needed to absorb that capacity; and (ii) a significant reduction in global energy prices, primarily oil and coal, making many foreign ECU producers more competitive.
Operating income (loss). Operating loss was $768.5 million for the year ended December 31, 2015, a decrease of $982.4 million compared to an operating income of $213.9 million for the year ended December 31, 2014. The decrease was principally due to: (i) a goodwill impairment charge of $864.1 million resulting from the impairment test performed in our chlor-alkali and derivatives reporting unit during the year ended December 31, 2015, based on management’s projections of operating results and cash flows for that reporting unit, and the sustained deterioration of market conditions in the chlor-alkali and derivatives industries, as well as the decline in our market capitalization below book value; (ii) lower PVC, VCM and chlorinated derivatives sales prices and margins, driven by the factors described in the preceding paragraph; (iii) lower ECU values, especially with respect to caustic soda pricing, due to the factors described in the preceding paragraph; and (iv) lower ECU volumes driven by weaker demand. These unfavorable factors were partially offset by decreases in our average cost of ethylene and natural gas, and higher operating rates and sales volumes for PVC for the year ended December 31, 2015 compared to the year ended December 31, 2014. Adjusted EBITDA decreased $147.0 million to $301.1 million for the year ended December 31, 2015 from $448.1 million for the year ended December 31, 2014. That decrease was predominantly due to the factors discussed above in items (ii), (iii) and (iv).
Building Products Segment
Net Sales. Net sales totaled $855.0 million for the year ended December 31, 2015, decreasing 3 percent from $878.6 million compared to the year ended December 31, 2014. The net sales decrease was driven by the impact of a stronger United States dollar relative to a weaker Canadian dollar. On a constant currency basis, net sales increased by 3 percent. Sales volumes increased by 3 percent for the year ended December 31, 2015 compared to the same period of the prior year, with sales volumes in the United States higher by 10 percent and sales volumes in Canada lower by 6 percent. For the
43
Table of Contents
year ended December 31, 2015, our building products segment’s geographical sales to the United States and Canada were 59 percent and 40 percent, respectively, compared with 54 percent and 45 percent, respectively, for the year ended December 31, 2014.
Operating Income. Operating income was $35.0 million and $25.8 million for the years ended December 31, 2015 and 2014, respectively. The increase in operating income was primarily a result of lower raw materials cost and higher sales volumes in the United States, partially offset by the impact of a stronger United States dollar relative to a weaker Canadian dollar and higher costs relating to restructuring activities. Adjusted EBITDA was $77.8 million and $67.7 million for the years ended December 31, 2015 and 2014, respectively. The increase in Adjusted EBITDA was primarily a result of lower raw materials costs and higher sales volumes in the United States, partially offset by the impact of a stronger United States dollar relative to a weaker Canadian dollar.
Year Ended December 31, 2014 Compared With Year Ended December 31, 2013
Consolidated Results
Net sales. For the year ended December 31, 2014, net sales totaled $3,808.8 million, an increase of 1 percent compared to $3,767.2 million for the year ended December 31, 2013. Net sales in our chlorovinyls segment increased by $12.9 million primarily due to the inclusion of twelve months of sales results from the Merged Business for the year ended December 31, 2014 versus the inclusion of only eleven months of sales results from the Merged Business for the year ended December 31, 2013, offset by: (i) lower operating rates and related sales volumes due to several outages within our chlor-alkali operations, the most significant of which included extended outages at our PHH VCM manufacturing facility; and (ii) lower ECU values, for both chlorine and caustic soda pricing, caused primarily by the addition of new production capacity in North America coupled with slower growth in the demand needed to absorb that capacity, partially offset by higher PVC and VCM prices. Net sales in our building products segment increased by $28.7 million primarily driven by a 17 percent increase in sales volumes in the United States, partially offset by the impact of a stronger U.S. dollar against a weaker Canadian dollar.
Gross margin percentage. Total gross margin percentage decreased to 14 percent for the year ended December 31, 2014 from 19 percent for the year ended December 31, 2013. This decrease was principally due to: (i) lower operating rates and higher maintenance and operating costs due to several outages within our chlor-alkali operations, the most significant of which included extended outages at our PHH VCM manufacturing facility; (ii) lower ECU values, for both chlorine and caustic soda pricing, caused primarily by the factors discussed in the preceding paragraph, partially offset by higher pricing for our vinyl resins, VCM and chlorinated derivative products; (iii) higher natural gas and ethylene costs; and (iv) the decrease in domestic and export demand for aromatics products made in North America due to new production capacity in Asia. In January 2015, IHS reported that natural gas prices increased 20 percent and ethylene prices increased by 3 percent for the year ended December 31, 2014 as compared to the year ended December 31, 2013. In 2013, the chlorovinyls segment’s gross margin was negatively impacted by a $13.4 million fair value inventory acquisition accounting adjustment related to the Merged Business.
Selling, general and administrative expenses. Selling, general and administrative expenses totaled $305.6 million for the year ended December 31, 2014, an increase of 4 percent from $294.5 million for the year ended December 31, 2013. This increase was primarily due to the inclusion of twelve months of expenses from the Merged Business during the year ended December 31, 2014, versus only eleven months for the year ended December 31, 2013, as well as increased amortization expense, professional fees and promotional costs.
44
Table of Contents
Integration-related costs and other, net. Integration-related costs and other, net, decreased 1 percent to $32.2 million during the year ended December 31, 2014 from $32.6 million during the year ended December 31, 2013. During 2014, our U.S. Pension Plans were amended to provide a one-time voluntary lump-sum distribution offer to terminated vested participants and we recorded a settlement charge of $5.8 million related to these costs. During the year ended December 31, 2013, the company recorded a curtailment gain of $15.5 million related to certain pension plan amendments, partially offset by higher integration costs, costs to attain Merger-related synergies and deal-related costs when compared to the year ended December 31, 2014.
Restructuring and divestiture costs. Restructuring and divestiture costs consists of three components: (i) costs associated with restructuring activities; (ii) costs associated with divestiture activities; and (iii) impairment charges related to restructuring and divestiture activities. Restructuring and divestiture costs decreased by $1.0 million to $19.8 million during the year ended December 31, 2014 from $20.8 million during the year ended December 31, 2013. During the year ended December 31, 2014, the Company incurred approximately $12.5 million in long-lived and intangible asset impairment charges related to a product line that was classified as held-for-sale in our chlorovinyls segment. Also during the year ended December 31, 2014, the Company recorded $4.5 million and $1.8 million in restructuring and divestiture costs, respectively, in its building products segment. During 2013, the Company recorded $6.7 million in impairment charges to write-down long-lived intangible assets in its window and door reporting units as well as $11.1 million primarily related to certain duplicated assets as a result of the Company’s merger activity and other restructuring transactions. The write-down was due primarily to the prolonged downturn in the North American housing and construction markets, continued pricing declines, and the expected impact of those declines on projected cash flows on the window and door profiles reporting unit.
Goodwill impairment charges: During the year ended December 31, 2014, we recorded $4.1 million in goodwill impairment charges related to the write-down of an immaterial phosgene derivative product line that was classified as held-for-sale. During the year ended December 31, 2013, the Company recorded a goodwill impairment charge of $18.2 million in its window and door profiles reporting unit. The write-down was due primarily to the prolonged downturn in the North American housing and construction markets, pricing declines, and the expected impact of those declines on projected cash flows on the window and door profiles reporting unit during the year ended December 31, 2013.
Operating income. Operating income was $154.8 million for the year ended December 31, 2014 compared to an operating income of $341.7 million for the year ended December 31, 2013. The decrease in operating income was primarily a result of: (i) lower operating rates and increased maintenance and operating costs due to several outages within our chlor-alkali operations, the most significant of which included extended outages at our PHH VCM manufacturing facility; (ii) lower ECU values for both chlorine and caustic soda pricing, partially offset by higher pricing for our vinyl resins, VCM and chlorinated derivative products; and (iii) higher natural gas and ethylene costs.
Interest expense. Interest expense totaled $76.5 million and $77.6 million for the years ended December 31, 2014 and 2013, respectively.
Debt refinancing costs. Debt refinancing costs resulted from the financing of our long-term debt and financing fees associated with the retirement of our higher interest rate notes during the year ended December 31, 2013, which included a $55.4 million make-whole payment. There were no similar transactions or refinancing activities during the year ended December 31, 2014.
Gain on acquisition of controlling interest. In January 2013, we acquired the Merged Business and the remaining 50 percent interest of PHH that we did not previously own. Prior to the Merger, we owned 50 percent of PHH and accounted for our ownership interest as an equity method investment. During the year ended December 31, 2013, we recognized a gain of $25.9 million as a result of remeasuring our
45
Table of Contents
prior equity interest in PHH held before the Merger in accordance with GAAP. We had no such gain during the year ended December 31, 2014.
Foreign currency exchange loss. Foreign currency exchange loss totaled $0.6 million for the year ended December 31, 2014 and was nominal for the year ended December 31, 2013. The foreign currency exchange loss for the year ended December 31, 2014 is primarily due to the impact of a stronger U.S. dollar against a weaker Canadian dollar.
Interest income. Interest income totaled $0.7 million and $1.0 million for the years ended December 31, 2014 and 2013, respectively.
Provision for income taxes. The provision for income taxes was $14.3 million for the year ended December 31, 2014, compared to $62.9 million for the year ended December 31, 2013. The decrease was primarily due to a lower income before income taxes during the year ended December 31, 2014 compared to the year ended December 31, 2013, as well as the release of uncertain tax positions for which the statute of limitations has expired, or effective settlement has occurred. During the years ended December 31, 2014 and 2013, the Company also recorded a tax benefit of $6.8 million and an income tax provision of $10.7 million, respectively, pertaining to the discontinued operations of our aromatics business.
Our effective income tax rates for the years ended December 31, 2014 and 2013 were 18.2 percent and 29.6 percent, respectively. The difference in the effective income tax rate as compared to the United States statutory federal income tax rate in 2014 was primarily due to various permanent differences, including deductions for manufacturing activities, as well as a $9.2 million favorable impact from changes in uncertain tax positions. The difference in the effective income tax rate as compared to the United States statutory federal income tax rate in 2013 was primarily due to various permanent differences including deductions for manufacturing activities and a $2.7 million favorable impact from changes in uncertain tax positions.
Net income (loss) from discontinued operations. On September 30, 2015, we sold certain assets used in our aromatics business to INEOS, pursuant to the terms of the Asset Purchase Agreement, including our cumene plant located in Pasadena, Texas. Net loss from discontinued operations for the years ended December 31, 2014 was $13.9 million compared to net income of $18.4 million for the year ended December 31, 2013. The operating results of our discontinued operation are included in our results of operations for the years ended December 31, 2014 and 2013.
Chlorovinyls Segment
Net sales. Net sales totaled $2,930.2 million for the year ended December 31, 2014, an increase of $12.9 million versus net sales of $2,917.3 million for the year ended December 31, 2013. Our overall net sales increase was primarily due to the inclusion of twelve months of sales results from the Merged Business for the year ended December 31, 2014 versus the inclusion of only eleven months of sales results from the Merged Business for the year ended December 31, 2013, offset by: (i) lower operating rates and related sales volumes due to several outages in our chlor-alkali operations, the most significant of which included extended outages at our PHH VCM manufacturing facility; and (ii) lower ECU values for both chlorine and caustic soda pricing, caused primarily by the addition of new production capacity in North America coupled with slower growth in the demand needed to absorb that capacity, partially offset by higher pricing for our vinyl resins, VCM and chlorinated derivative products.
Operating income. Operating income decreased by $221.0 million to $213.9 million for the year ended December 31, 2014 from $434.9 million for the year ended December 31, 2013. The decrease was principally due to: (i) lower operating rates and increased maintenance and operating costs from several outages within our chlor-alkali operations, the most significant of which included extended
46
Table of Contents
outages at our PHH VCM manufacturing facility; (ii) lower ECU values resulting primarily from the reasons discussed above, partially offset by higher pricing for our vinyl resins, VCM and chlorinated derivative products; and (iii) increases in our cost of natural gas and ethylene. In January 2015, IHS reported that industry natural gas prices increased 20 percent and ethylene prices increased 3 percent for the year ended December 31, 2014 compared to the year ended December 31, 2013. During the year ended December 31, 2013, the segment’s operating income was negatively impacted by a $13.4 million fair value inventory acquisition accounting adjustment related to the Merged Business and by $13.8 million of costs to attain Merger-related synergies, which included $10.3 million of plant reliability improvement initiatives. Adjusted EBITDA decreased $176.4 million to $448.1 million for the year ended December 31, 2014 from $624.5 million for the year ended December 31, 2013. That decrease was predominantly due to the same factors discussed above with respect to operating income, partially offset by the twelve full months of Adjusted EBITDA contributed by the Merged Business in 2014 compared to eleven months in 2013.
Building Products Segment
Net sales. Net sales totaled $878.6 million for the year ended December 31, 2014, increasing 3 percent, versus $849.9 million for the year ended December 31, 2013. The net sales increase was primarily driven by a 17 percent increase in sales volumes in the United States, partially offset by the impact of a stronger U.S. dollar against a weaker Canadian dollar. On a constant currency basis, net sales increased by 7 percent. For the year ended December 31, 2014, our building products segment’s geographical sales to the United States and Canada were 54 percent and 45 percent respectively, compared with 50 percent and 49 percent for the year ended December 31, 2013.
Operating income. Operating income was $25.8 million and $3.0 million for the years ended December 31, 2014, and 2013, respectively. The increase in operating income was primarily a result of $24.4 million in lower impairment and restructuring charges in the year ended December 31, 2014 compared to the year ended December 31, 2013. The year ended December 31, 2013 included a $24.9 million impairment charge to write down goodwill and other intangible assets as a result of our evaluation of the window and door profiles reporting unit’s fair value. There were no such impairment charges related to goodwill and other intangible assets for the year ended December 31, 2014. Adjusted EBITDA was $67.7 million for the year ended December 31, 2014 compared to Adjusted EBITDA of $70.7 million for the year ended December 31, 2013. The $3.0 million decrease in Adjusted EBITDA was primarily a result of higher material costs, the impact of a stronger U.S. dollar against a weaker Canadian dollar and higher distribution and selling expenses, offset in part by lower conversion costs, higher sales volumes and lower general and administrative expenses.
Reconciliation of Non-GAAP Financial Measures
Axiall supplements its consolidated financial statements prepared in accordance with GAAP that are set forth in this Annual Report on Form 10-K (the “Financial Statements”) with four non-GAAP financial measures: (i) Adjusted Net Income (Loss); (ii) Adjusted Earnings (Loss) Per Share; (iii) Adjusted EBITDA; and (iv) building products net sales on a constant currency basis.
Adjusted Earnings (Loss) Per Share is calculated using Adjusted Net Income (Loss) rather than consolidated net income (loss) attributable to Axiall calculated in accordance with GAAP.
Adjusted Net Income (Loss) is defined as consolidated net income (loss) attributable to Axiall excluding adjustments for tax-effected restructuring and certain other charges, if any, related to discontinued operations, financial restructuring and business improvement initiatives, gains or losses on sales of certain assets, debt refinancing costs, certain acquisition accounting and non-income tax reserve adjustments, certain professional fees associated with various potential and completed mergers and
47
Table of Contents
acquisitions, joint ventures and other transactions, costs to attain synergies related to the integration of the Merged Business, amortization of definite-lived intangible assets, impairment charges for goodwill, intangible assets, and other long-lived assets. For the year ended December 31, 2015 we have excluded amortization of definite-lived intangible assets from our calculation of Adjusted Net Income (Loss) and intend to do so in future periods. We believe excluding this item from our calculation of Adjusted Net Income is helpful to investors because the amortization of our intangible assets is a non-cash charge that does not impact our liquidity or our operational performance.
Adjusted EBITDA is defined as Earnings (Loss) Before Interest, Taxes, Depreciation and Amortization, restructuring and certain other charges, if any, related to discontinued operations, financial restructuring and business improvement initiatives, gains or losses on sales of certain assets, debt refinancing costs, certain acquisition accounting and non-income tax reserve adjustments, certain professional fees associated with various potential and completed mergers and acquisitions, divestitures, joint ventures and other transactions, costs to attain synergies related to the integration of the Merged Business, impairment charges for goodwill, intangible assets, and other long-lived assets, certain pension and other post-retirement plan curtailment gains and settlement losses and interest expense related to the lease-financing transaction discussed in Note 10 of the Notes to the Consolidated Financial Statements in Item 8.
Axiall supplements its consolidated financial statements with Adjusted Net Income (Loss) and Adjusted Earnings (Loss) Per Share because investors commonly use financial measures such as Adjusted Net Income (Loss) and Adjusted Earnings (Loss) Per Share as a component of performance and valuation analysis for companies, such as Axiall, that recently have engaged in transactions and have incurred expenses such as professional fees related to potential transactions, that result in non-recurring pre-tax charges or benefits that have a significant impact on the calculation of consolidated net income (loss) attributable to Axiall pursuant to GAAP, in order to approximate the amount of net income (loss) that such a company would have achieved absent those non-recurring, integration-related charges or benefits. In addition, Axiall supplements the consolidated financial statements with Adjusted Net Income (Loss) and Adjusted Earnings (Loss) Per Share because we believe these financial measures will be helpful to investors in approximating what our net income (loss) would have been absent the impact of certain non-recurring, pre-tax charges and benefits. We have supplemented the consolidated financial statements with Adjusted EBITDA because investors commonly use Adjusted EBITDA as a main component of valuation analysis of cyclical companies such as Axiall.
In addition, we may compare certain financial information, including building products net sales on a constant currency basis. We present such information to provide a framework for investors to assess how our underlying businesses performed, excluding the effect of foreign currency rate fluctuations, primarily fluctuations in the Canadian dollar. To present this information, current and comparative prior period financial information for certain businesses reporting in currencies other than United States dollars are converted into United States dollars at the average exchange rate in effect during the base period, rather than the average exchange rates in effect during the respective periods.
Adjusted Earnings (Loss) Per Share, Adjusted Net Income (Loss), Adjusted EBITDA and building products net sales on a constant currency basis, are not measurements of financial performance under GAAP and should not be considered as an alternative to net income (loss), GAAP diluted earnings (loss) per share or net sales, as a measure of performance or as an alternative to cash provided by (used in) operating activities as a measure of liquidity. In addition, our calculation of these various non-GAAP measurements may be different from the calculations used by other companies and, therefore, comparability may be limited.
48
Table of Contents
Reconciliations of our non-GAAP financial measures to the most comparable GAAP measures are presented in the tables set forth below.
Adjusted Earnings Per Share Reconciliation
| Year Ended December 31, | ||||||||||||
| 2015 | 2014 | 2013 | ||||||||||
| Diluted earnings (loss) per share attributable |
$ | (11.59) | $ | 0.65 | $ | 2.44 | ||||||
| Earnings per share related to |
12.77 | 1.33 | 2.16 | |||||||||
|
|
|
|
|
|
|
|||||||
| Adjusted Earnings Per Share |
$ | 1.18 | $ | 1.98 | $ | 4.60 | ||||||
|
|
|
|
|
|
|
|||||||
Adjusted Net Income Reconciliation
| Year Ended December 31, | ||||||||||||
| (In millions) |
2015 | 2014 | 2013 | |||||||||
| Net income (loss) attributable to Axiall |
$ | (816.4) | $ | 46.3 | $ | 165.3 | ||||||
| Pre-tax charges: |
||||||||||||
| Restructuring and divestiture costs |
23.3 | 19.8 | 20.8 | |||||||||
| Integration-related costs and other, net(1) |
16.6 | 43.9 | 56.4 | |||||||||
| Goodwill impairment charges attributable to Axiall |
839.4 | (2) | 4.1 | 18.2 | ||||||||
| Debt refinancing costs |
3.2 | - | 78.5 | |||||||||
| Gain on acquisition of controlling interest |
- | - | (25.9) | |||||||||
| Amortization of intangible assets |
68.4 | 69.3 | 64.2 | |||||||||
| Gain from the sale of aromatics |
(21.5) | - | - | |||||||||
|
|
|
|
|
|
|
|||||||
| Total pre-tax charges |
929.4 | 137.1 | 212.2 | |||||||||
| Provision for taxes related to these items |
29.5 | 43.5 | 65.5 | |||||||||
|
|
|
|
|
|
|
|||||||
| After-tax effect of above items |
899.9 | 93.6 | 146.7 | |||||||||
|
|
|
|
|
|
|
|||||||
| Adjusted Net Income |
$ | 83.5 | $ | 139.9 | $ | 312.0 | ||||||
|
|
|
|
|
|
|
|||||||
| (1) | Includes $0.6 million, $11.7 million and $10.4 million for the years ended December 31, 2015, 2014 and 2013, respectively, of plant reliability improvement initiatives that are included in cost of sales on our consolidated statements of operations. The year ended December 31, 2013 also includes a $13.4 million inventory fair value acquisition accounting adjustment in cost of sales on our consolidated statements of operations. |
| (2) | Goodwill impairment charges of $864.1 recognized during the year ended December 31, 2015, less $24.7 million, the portion attributable to our noncontrolling interest. |
49
Table of Contents
Adjusted EBITDA Reconciliations
Year Ended December 31, 2015
| (In millions) |
Chlorovinyls | Building Products |
Unallocated Corporate & Non-operating expenses, net |
Total | ||||||||||||
| Adjusted EBITDA |
$ | 301.1 | $ | 77.8 | $ | (48.6) | $ | 330.3 | ||||||||
| Restructuring and divestiture costs |
(0.3) | (10.2) | (12.8) | (23.3) | ||||||||||||
| Integration-related costs and other, net(1) |
(0.9) | (0.6) | (15.1) | (16.6) | ||||||||||||
| Goodwill impairment charges |
(864.1) | - | - | (864.1) | ||||||||||||
| Interest expense, net |
- | - | (77.7) | (77.7) | ||||||||||||
| Debt refinancing costs |
- | - | (3.2) | (3.2) | ||||||||||||
| Depreciation and amortization |
(205.8) | (31.9) | (10.8) | (248.5) | ||||||||||||
| Benefit from income taxes |
- | - | 43.9 | 43.9 | ||||||||||||
| Other(2) |
- | - | 10.1 | 10.1 | ||||||||||||
|
|
|
|
|
|
|
|
|
|||||||||
| Net income (loss) from continuing operations(3) |
$ | (770.0) | $ | 35.1 | $ | (114.2) | $ | (849.1) | ||||||||
|
|
|
|
|
|
|
|
|
|||||||||
| (1) | Includes $0.6 million of plant reliability improvement initiatives that are included in cost of sales on our consolidated statements of operations. |
| (2) | Includes $5.7 million of lease financing obligations interest and $4.4 million for debt issuance cost amortization. |
| (3) | Earnings of our segments exclude interest income and expense, unallocated corporate expenses and general plant services, and benefit from income taxes. |
Year Ended December 31, 2014
| (In millions) |
Chlorovinyls | Building Products |
Unallocated Corporate & Non-operating expenses, net |
Total | ||||||||||||
| Adjusted EBITDA |
$ | 448.1 | $ | 67.7 | $ | (61.0) | $ | 454.8 | ||||||||
| Restructuring and divestiture costs |
(12.6) | (7.3) | 0.1 | (19.8) | ||||||||||||
| Integration-related costs and other, net(1) |
(17.9) | - | (26.0) | (43.9) | ||||||||||||
| Goodwill impairment charges |
(4.1) | - | - | (4.1) | ||||||||||||
| Interest expense, net |
- | - | (75.8) | (75.8) | ||||||||||||
| Depreciation and amortization |
(200.3) | (34.5) | (9.7) | (244.5) | ||||||||||||
| Provision for income taxes |
- | - | (14.3) | (14.3) | ||||||||||||
| Other(2) |
- | - | 11.7 | 11.7 | ||||||||||||
|
|
|
|
|
|
|
|
|
|||||||||
| Net income from continuing operations(3) |
$ | 213.2 | $ | 25.9 | $ | (175.0) | $ | 64.1 | ||||||||
|
|
|
|
|
|
|
|
|
|||||||||
| (1) | Includes $11.7 million of plant reliability improvement initiatives that are included in cost of sales on our consolidated statements of operations. |
| (2) | Includes $6.5 million of lease financing obligations interest and $5.2 million for debt issuance cost amortization. |
| (3) | Earnings of our segments exclude interest income and expense, unallocated corporate expenses and general plant services, and provision for income taxes. |
50
Table of Contents
Year Ended December 31, 2013
| (In millions) |
Chlorovinyls | Building Products |
Unallocated Corporate & Non-operating expenses, net |
Total | ||||||||||||
| Adjusted EBITDA |
$ | 624.5 | $ | 70.7 | $ | (53.5) | $ | 641.7 | ||||||||
| Restructuring and divestiture costs |
18.3 | (31.8) | (7.3) | (20.8) | ||||||||||||
| Integration-related costs and other, net(1) |
(15.0) | - | (41.4) | (56.4) | ||||||||||||
| Goodwill impairment charge |
(18.2) | - | - | (18.2) | ||||||||||||
| Interest expense, net |
- | - | (76.6) | (76.6) | ||||||||||||
| Debt refinancing costs |
- | - | (78.5) | (78.5) | ||||||||||||
| Gain on acquisition of controlling interest |
25.9 | - | - | 25.9 | ||||||||||||
| Depreciation and amortization |
(174.2) | (35.7) | (6.9) | (216.8) | ||||||||||||
| Provision for income taxes |
- | - | (62.9) | (62.9) | ||||||||||||
| Other(2) |
- | - | 12.2 | 12.2 | ||||||||||||
|
|
|
|
|
|
|
|
|
|||||||||
| Net income from continuing operations(3) |
$ | 461.3 | $ | 3.2 | $ | (314.9) | $ | 149.6 | ||||||||
|
|
|
|
|
|
|
|
|
|||||||||
| (1) | Includes $13.4 million of inventory fair value acquisition accounting adjustment and $10.4 million of plant reliability improvement initiatives that are included in cost of sales on our consolidated statements of operations. |
| (2) | Includes $7.1 million of lease financing obligations interest and $5.1 million for debt issuance cost amortization. |
| (3) | Earnings of our segments exclude interest income and expense, unallocated corporate expenses and general plant services, and provision for income taxes. |
Building Products Constant Currency Net Sales
| Year Ended December 31, | ||||||||||||
| (In millions) |
2015 | 2014 | 2013 | |||||||||
| Building products net sales |
$ | 855.0 | $ | 878.6 | $ | 849.9 | ||||||
| Impact of currency exchange rates |
54.2 | 26.6 | - | |||||||||
|
|
|
|
|
|
|
|||||||
| Building products constant currency sales |
$ | 909.2 | $ | 905.2 | $ | 849.9 | ||||||
|
|
|
|
|
|
|
|||||||
Liquidity and Capital Resources
Overview
Historically, our primary sources of liquidity and capital resources have included cash provided by operations, proceeds from the sale of assets and other, the issuance of debt, and the use of available borrowing facilities. As of December 31, 2015, we had liquidity of $627.2 million, comprised of approximately $369.2 million of availability under our ABL Revolver and $258.0 million in cash and cash equivalents. The net change in cash and cash equivalents for the years ended December 31, 2015, 2014 and 2013 consisted of the following:
| Year Ended December 31, | ||||||||||||
| (In millions) |
2015 | 2014 | 2013 | |||||||||
| Net cash provided by operating activities |
$ | 267.1 | $ | 291.1 | $ | 325.7 | ||||||
|
|
|
|
|
|
|
|||||||
|
|
|
|
|
|
|
|||||||
| Net cash used in investing activities |
(141.7) | (208.5) | (139.6) | |||||||||
|
|
|
|
|
|
|
|||||||
|
|
|
|
|
|
|
|||||||
| Net cash used in financing activities |
(23.1) | (75.3) | (216.2) | |||||||||
|
|
|
|
|
|
|
|||||||
| Effect of exchange rate changes on cash and cash equivalents |
(11.1) | (7.0) | (3.7) | |||||||||
|
|
|
|
|
|
|
|||||||
| Net change in cash and cash equivalents |
$ | 91.2 | $ | 0.3 | $ | (33.8) | ||||||
|
|
|
|
|
|
|
|||||||
51
Table of Contents
Operating Activities. In the consolidated statements of cash flows, changes in operating assets and liabilities are presented excluding the effects of changes in foreign currency, non-cash transactions and the effects of acquisitions and divestitures. Accordingly, the amounts in the consolidated statements of cash flows differ from changes in the operating assets and liabilities that are presented in the consolidated balance sheets.
Net working capital for the years ended December 31, 2015, 2014 and 2013 was $573.9 million, $621.1 million, and $625.4 million, respectively. The decrease in net working capital during the year ended December 31, 2015 as compared to the year ended December 31, 2014 was primarily due to the reduction of current assets resulting from the reclassification of deferred taxes from current assets to noncurrent assets in our consolidated balance sheets and a decrease in raw material prices. The decrease in net working capital during the year ended December 31, 2014 as compared to the year ended December 31, 2013 was primarily due to a decrease in accounts receivables caused by lower sales, and a reduction in our inventory balances, which resulted from decreased raw material prices.
Operating working capital used in operating activities decreased $82.1 million for the year ended December 31, 2015 when compared to the year ended December 31, 2014, primarily due to: (i) a decrease of $50.3 million in prepaid expenses and other; (ii) a decrease of $38.1 million in accrued compensation; (iii) a decrease of $14.4 million in accounts receivables; and (iv) a decrease of $11.8 million in accrued income taxes; partially offset by an increase of $32.0 million in other accrued liabilities. Operating working capital used in operating activities decreased $68.5 million for the year ended December 31, 2014 when compared to the year ended December 31, 2013, primarily due to: (i) a decrease of $71.0 million in inventories; (ii) a decrease of $66.1 million in accounts receivables; (iii) a decrease of $32.9 million in other accrued liabilities; partially offset by: (iv) an increase of $37.7 million in prepaid expenses; (v) an increase of $37.6 million in accounts payable; and (vi) an increase of $24.4 million in accrued compensation.
Investing Activities. For the year ended December 31, 2015, cash used in investing activities decreased $66.8 million when compared to the year ended December 31, 2014, $53.0 million of which is attributable to the discontinued operations of our aromatics business, $5.8 million due to a reduction in capital expenditures and $6.1 million due to a reduction in cash flows from acquisitions, net of cash acquired. For the year ended December 31, 2014, cash used in investing activities increased $68.9 million when compared to the year ended December 31, 2013. During the year ended December 31, 2014, capital expenditures increased $13.5 million and cash used in connection with acquisitions, net of cash acquired increased $51.2 million compared to the year ended December 31, 2013 which included a $22.0 million payment by PPG to us for the net working capital settlement and $11.4 million in proceeds from the sale of assets.
Financing Activities. Cash used in financing activities decreased $52.2 million in 2015 when compared to the year ended December 31, 2014. The decrease was primarily due to the refinancing of our existing term loan facility in which we increased the principal amount to $250 million. During the year ended December 31, 2015, we repaid $195.2 million in settlement of the existing term loan facility and $2.5 million toward our principal payments on the new term loan facility (the “New Term Loan Facility”). In 2014, our primary financing activities included $45.0 million for dividend payments, $10.0 million related to deferred acquisition payments to PPG and $7.7 million distribution to noncontrolling interest. In 2013, our financing activities included the issuance and redemption of long-term debt, $98.1 million in make-whole and other fees related to financing the Merger with PPG’s chlor-alkali and derivatives business and $22.2 million in dividend payments and a distribution to noncontrolling interest of $13.3 million.
52
Table of Contents
As of December 31, 2015 and 2014, our long-term debt consisted of the following:
| December 31, | ||||||||||
| (In millions) |
Maturity Date | 2015 | 2014 | |||||||
| 4.625 Notes (net of debt issuance costs totaling $9.6 million and $11.3 million |
February 15, 2021 | $ | 678.4 | $ | 676.7 | |||||
| 4.875 Notes (net of debt issuance costs totaling $5.8 million and $6.5 million |
May 15, 2023 | 444.2 | 443.5 | |||||||
| Term Loan Facility (net of debt issuance costs |
January 28, 2017 | - | 192.1 | |||||||
| New Term Loan Facility (net of deferred financing fees |
February 27, 2022 | 244.4 | - | |||||||
| ABL Revolver |
December 17, 2019 | - | - | |||||||
|
|
|
|
|
|||||||
| Total debt |
1,367.0 | 1,312.3 | ||||||||
| Less: current portion of long-term debt |
(2.5) | (2.8) | ||||||||
|
|
|
|
|
|||||||
| Long-term debt, net |
$ | 1,364.5 | $ | 1,309.5 | ||||||
|
|
|
|
|
|||||||
4.625 Notes
Axiall Corporation and certain of its subsidiaries guarantee $688.0 million in aggregate principal amount of 4.625 percent senior unsecured notes due 2021 (the “4.625 Notes”) that were issued by a wholly-owned subsidiary, Eagle Spinco Inc. (“Spinco”) on January 28, 2013. Interest payments on the 4.625 Notes commenced on August 15, 2013 and interest is payable semi-annually in arrears on February 15 and August 15 of each year. The 4.625 Notes are fully and unconditionally guaranteed, jointly and severally, on a senior unsecured basis by Axiall Corporation and by its existing and future domestic subsidiaries, other than certain excluded subsidiaries.
4.875 Notes
On February 1, 2013, Axiall Corporation issued $450.0 million in aggregate principal amount of 4.875 percent senior unsecured notes due 2023 (the “4.875 Notes”). Interest payments on the 4.875 Notes commenced on May 15, 2013 and interest is payable semi-annually in arrears on May 15 and November 15 of each year. The 4.875 Notes are fully and unconditionally guaranteed, jointly and severally, on a senior unsecured basis by each of our existing and future domestic subsidiaries, other than certain excluded subsidiaries.
Term Loan
On February 27, 2015, Axiall Holdco, Inc., a wholly-owned subsidiary of the Company (“Axiall Holdco”), entered into a credit agreement with a syndicate of financial institutions (the “Term Loan Agreement”) for a new $250 million term loan facility (the “New Term Loan Facility”) to refinance the principal amount outstanding under the Company’s existing term loan facility, to pay related fees and expenses, and for general corporate purposes. Obligations under the New Term Loan Facility are fully and unconditionally guaranteed, on a senior secured basis, by Axiall Corporation and by each of its existing and future wholly-owned domestic subsidiaries, other than certain excluded subsidiaries. The obligations under the New Term Loan Facility are secured by substantially all of the assets of Axiall Holdco, Axiall Corporation and the subsidiary guarantors.
The New Term Loan Facility contains an accordion feature that permits Axiall Holdco, subject to certain conditions and to obtaining lender commitments, to incur additional term loans under the New Term Loan
53
Table of Contents
Facility in an amount up to the greater of: (i) $250 million; and (ii) an amount that would not result in the Company’s consolidated secured debt ratio being greater than 2.50 to 1.00.
At the election of Axiall Holdco, the New Term Loan Facility bears interest at a rate equal to: (i) the Base Rate (as defined in the Term Loan Agreement) plus 1.50 percent per annum; or (ii) LIBOR (as defined in the Term Loan Agreement) plus 3.25 percent per annum; provided that at no time will the Base Rate be deemed to be less than 2.00 percent per annum or LIBOR be deemed to be less than 0.75 percent per annum. As of December 31, 2015, outstanding borrowings under the Company’s New Term Loan Facility had a stated interest rate of 4.00 percent per annum.
The Term Loan Agreement contains customary covenants (subject to exceptions), including certain restrictions on the Company and its subsidiaries to pay dividends.
ABL Revolver
The Company’s second amended and restated asset based revolving credit facility (the “ABL Revolver”), which the Company entered into in December 2014, provides for a maximum of $600.0 million of revolving credit, subject to applicable borrowing base limitations and certain other conditions. The credit agreement governing the ABL Revolver (the “ABL Credit Agreement”) contains customary covenants, including certain restrictions on the Company and its subsidiaries to pay dividends and repurchase shares of Company stock. These covenants are subject to certain exceptions and qualifications. Under the ABL Revolver, dividend payments and repurchases of our common stock in an aggregate amount not to exceed $150 million in any fiscal year may be made if both borrowing availability under the ABL Revolver would have exceeded $75 million at all times during the thirty days immediately preceding any such restricted payment and our consolidated fixed charge coverage ratio (as defined in the ABL Revolver) is equal to or exceeds 1.00 to 1.00, each on a pro forma basis after giving effect to any such proposed restricted payment. In addition, under the ABL Revolver, additional cash dividend payments may be made if both borrowing availability under the ABL Revolver then exceeds $100 million and our consolidated fixed charge coverage ratio (as defined in the ABL Revolver) is equal to or exceeds 1.10 to 1.00, each on a pro forma basis after giving effect to the proposed cash dividend payment. In December 2015, we amended our ABL Credit Agreement to, among other things, provide additional flexibility to pay dividends and consummate stock repurchases, modify the definition of consolidated EBITDA to include certain additional add backs and reductions to net income in determining consolidated EBITDA (as defined in the ABL Revolver), revise the definition of consolidated capital expenditures to exclude capital expenditures made in connection with the proposed Plant, and provide for a reduction in the amount of its basket for investments in such a plant by the amount of such capital expenditures that are excluded from the definition of consolidated capital expenditures.
As of December 31, 2015 and 2014, we had no outstanding balance under our ABL Revolver. Our availability under the ABL Revolver at December 31, 2015 was approximately $369.2 million, net of outstanding letters of credit totaling $81.9 million. As of December 31, 2015, depending on the duration of the loan, the applicable rate for borrowings would have been between 2.11 percent to 4.00 percent based on LIBOR or the Prime Rate, plus the applicable margin under the ABL Revolver.
As of December 31, 2015, we were in compliance with the covenants under our ABL Credit Agreement, the Term Loan Agreement and the indentures governing the 4.625 Notes and the 4.875 Notes.
54
Table of Contents
Borrowings under the ABL Revolver, if any, were at variable interest rates.
| (Dollars in millions) |
As of and for the quarter ended December 31, 2015 |
As of and for the year ended December 31, 2015 |
As of and for the year ended December 31, 2014 |
As of and for the year ended December 31, 2013 |
||||||||||||
| Short-term borrowings from banks: |
||||||||||||||||
| Outstanding amount at period ending |
$ | — | $ | — | $ | — | $ | — | ||||||||
| Weighted average interest rate at period ending (1) |
— % | — % | — % | — % | ||||||||||||
| Average daily amount outstanding for the period |
$ | — | $ | — | $ | 2.4 | $ | 49.7 | ||||||||
| Weighted average daily interest rate for the period |
— % | — % | 3.75 % | 2.18 % | ||||||||||||
| Maximum month-end amount outstanding during the period |
$ | — | $ | — | $ | 14.2 | $ | 170.0 | ||||||||
| (1) | As of December 31, 2015, the applicable rate for future borrowings would have been 2.11 percent to 4.00 percent under the ABL Revolver. |
Ability to Pay Dividends Under the ABL Revolver
Under the ABL Revolver, cash dividend payments in an aggregate amount not to exceed $150 million in any fiscal year may be made if both borrowing availability under the ABL Revolver would have exceeded $75 million at all times during the thirty days immediately preceding the dividend payment and our consolidated fixed charge coverage ratio (as defined in the definitive documentation governing the ABL Revolver) is equal to or exceeds 1.00 to 1.00, each on a pro forma basis after giving effect to the proposed dividend payment. In addition, under the ABL Revolver, additional cash dividend payments may be made if both borrowing availability under the ABL Revolver then exceeds $100 million and our consolidated fixed charge coverage ratio (as defined in the definitive documentation governing the ABL Revolver) is equal to or exceeds 1.10 to 1.00, each on a pro forma basis after giving effect to the proposed cash dividend payment. Additionally, under the ABL Revolver, cash dividend payments in an aggregate amount not to exceed $50 million in any fiscal year may be made if both borrowing availability under the ABL Revolver would have exceeded $250 million at all times during the 45 days immediately preceding the dividend payment declaration and exceeds $250 million on the day of declaration of such dividend payment, and is reasonably expected to exceed $250 million on the last day of the calendar month during which such dividend payment is declared, and on the last day of the next two succeeding calendar months.
Cash Interest for Long-term Debt
Cash payments for interest during the years ended December 31, 2015, 2014 and 2013 were $68.7 million, $66.4 million and $69.2 million, respectively.
Lease Financing Obligation
As of December 31, 2015 and 2014, we had a lease financing obligation of $79.6 million and $94.2 million, respectively. The change from the December 31, 2014 balance is due to the change in the Canadian dollar exchange rate as of December 31, 2015. The lease financing obligation is the result of the sale and concurrent leaseback of certain land and buildings in Canada in 2007 for a term of ten years. In connection with this transaction, certain terms and conditions, including the requirement to execute a collateralized letter of credit in favor of the buyer-lessor, resulted in the transaction being recorded as a financing transaction rather than a sale for GAAP purposes. As a result, the land, building and related accounts continue to be recognized in the consolidated balance sheets. The collateralized letter of credit expired on February 2, 2015 and is no longer required. We are not obligated to repay the lease financing obligation amount of $79.6 million. Our obligation is for the future minimum lease payments under the terms of the related lease agreements. The future minimum lease payments under the terms of the related lease agreements as of December 31, 2015 are $4.6 million in 2016, and $1.2 million in 2017, the final year of the lease agreements. The change in the future minimum lease payments from such amounts disclosed as of December 31, 2014 is due to current period payments and the change in the Canadian dollar exchange rate as of December 31, 2015.
55
Table of Contents
Dividends
During the years ended December 31, 2015 and 2014, the Company’s Board of Directors declared dividends of $0.64 per share, in equal installments of $0.16 per share, according to the following record and payment dates:
| Declared Date |
Record Date | Payment Date | Amount Declared | |||||
| 2015 |
| |||||||
| March 3, 2015 |
March 27, 2015 | April 10, 2015 | $ | 0.16 | ||||
| May 19, 2015 |
June 26, 2015 | July 10, 2015 | $ | 0.16 | ||||
| August 11, 2015 |
September 25, 2015 | October 9, 2015 | $ | 0.16 | ||||
| November 18, 2015 |
December 23, 2015 | January 11, 2016 | $ | 0.16 | ||||
| 2014 |
| |||||||
| March 4, 2014 |
March 28, 2014 | April 10, 2014 | $ | 0.16 | ||||
| May 20, 2014 |
June 27, 2014 | July 11, 2014 | $ | 0.16 | ||||
| August 13, 2014 |
September 26, 2014 | October 10, 2014 | $ | 0.16 | ||||
| November 18, 2014 |
December 26, 2014 | January 12, 2015 | $ | 0.16 | ||||
Management believes, based on current and projected levels of operations and conditions in our markets and cash flow from operations, together with our cash and cash equivalents on hand and the availability to borrow under our ABL Revolver, we have adequate funding for the foreseeable future to make required payments of interest on our debt, fund our operating needs, working capital and capital expenditure requirements, comply with the financial ratios in our debt agreements, and make any required prepayments of principal under our debt agreements. As of December 31, 2015, we have no significant required payments of principal on our debt until February 2021. To the extent our cash flow and liquidity exceeds the levels necessary for us to make required payments on our debt, fund our working capital and capital expenditure requirements and comply with our ABL Revolver, we may use the excess liquidity to further grow our business through investments or acquisitions, payment of dividends and/or to reduce our debt.
Contractual Obligations
Our aggregate future payments under contractual obligations by category as of December 31, 2015, were as follows:
| (In millions) |
Total | 2016 | 2017 | 2018 | 2019 | 2020 | 2021 and thereafter |
|||||||||||||||||||||
| Contractual obligations: |
||||||||||||||||||||||||||||
| Purchase obligations |
$1,544.5 | $ | 377.0 | $ | 284.7 | $ | 216.8 | $ | 209.6 | $ | 205.4 | $ | 251.0 | |||||||||||||||
| Long-term debt—principal |
1,385.5 | 2.5 | 2.5 | 2.5 | 2.5 | 2.5 | 1,373.0 | |||||||||||||||||||||
| Long-term debt—interest |
377.3 | 63.8 | 63.7 | 63.5 | 63.4 | 63.4 | 59.5 | |||||||||||||||||||||
| Lease financing obligations |
5.8 | 4.6 | 1.2 | - | - | - | - | |||||||||||||||||||||
| Capital lease obligations |
22.2 | 2.4 | 2.8 | 2.8 | 2.5 | 2.5 | 9.2 | |||||||||||||||||||||
| Operating lease obligations |
172.2 | 42.6 | 35.3 | 26.5 | 20.0 | 15.9 | 31.9 | |||||||||||||||||||||
| Expected pension and OPEB contributions |
229.4 | 9.0 | 8.8 | 8.9 | 20.1 | 20.6 | 162.0 | |||||||||||||||||||||
| Investment in LACC |
210.1 | 50.0 | 50.0 | 50.0 | 60.1 | - | - | |||||||||||||||||||||
| Acquisition purchase price consideration |
30.0 | 15.0 | 15.0 | - | - | - | - | |||||||||||||||||||||
| Asset retirement obligations |
166.3 | 0.9 | 5.1 | - | 2.2 | 1.8 | 156.3 | |||||||||||||||||||||
|
|
|
|
|
|
|
|
|
|
|
|
|
|
|
|||||||||||||||
| Total |
$4,143.3 | $ | 567.8 | $ | 469.1 | $ | 371.0 | $ | 380.4 | $ | 312.1 | $ | 2,042.9 | |||||||||||||||
|
|
|
|
|
|
|
|
|
|
|
|
|
|
|
|||||||||||||||
56
Table of Contents
Purchase obligations. Purchase obligations primarily include agreements to purchase goods or services that are enforceable and legally binding and that specify all significant terms. We have certain long-term raw material supply contracts and energy purchase agreements with various terms extending through 2026. These commitments are designed to assure sources of supply for our normal requirements. Amounts are based upon contractual raw material volumes and market rates as of December 31, 2015.
Long-term debt, principal. Long-term debt principal obligations are listed in the table above based on the contractual due dates.
Long-term debt, interest. Long-term debt interest payments set forth in the table above are based on our contractual rates, or in the case of variable interest rate obligations, the weighted average interest rates as of December 31, 2015.
Lease financing obligations. We lease land and buildings for certain of our Canadian manufacturing facilities under leases with varying maturities through the year 2017.
Capital lease obligations. We lease railcars for our chlorovinyls segment under capital leases with varying maturities through the year 2026.
Operating lease obligations. We lease railcars, storage terminals, computer equipment, automobiles, barges, warehouses and office spaces under non-cancelable operating leases with varying maturities through the year 2025.
Expected pension and other post retirement employment benefit (“OPEB”) contributions. Expected pension contributions for the funded obligations represent the projected minimum required contributions based on assumptions as of December 31, 2015 and determined in accordance with local requirements such as the Employee Retirement Income Security Act. Also included are contributions for the unfunded OPEB plans which are based on the expected benefit payments estimated as of December 31, 2015.
Investment in LACC. On June 17, 2015, Eagle entered into an amended and restated limited liability company agreement with Lotte related to the formation of LACC, which is a joint venture by Eagle and Lotte to design, build and operate a new ethylene Plant. Eagle’s investment is expected to represent approximately 10 percent of the interests of LACC. Eagle and Lotte also entered into a call option agreement, dated as of June 17, 2015, pursuant to which Eagle has the right, but not the obligation, until the third anniversary of the substantial completion of the Plant, to acquire up to a 50 percent ownership interest in LACC from Lotte. On December 17, 2015, Axiall and Lotte announced that the companies reached a final investment decision to construct the Plant, and LACC entered into the engineering, procurement and construction agreement with CB&I Inc., the construction contractor. The Company’s annual commitment will be up to a maximum of $50.0 million per year through 2018 with the remainder due in 2019.
Deferred acquisition payments. Payments of deferred purchase price represent amounts due to PPG based upon the final funding status of the pension plans assumed in the Merger. During the year ended December 31, 2015, we made a $10 million deferred acquisition payment to PPG in connection with the funding status of certain assumed pension plans of the Merged Business. We will make remaining payments in the aggregate amount of $30 million to PPG over the next two years.
Asset retirement obligations. We have recognized a liability for the present value of cost we estimate we will incur to retire certain assets. The amount reported in the Contractual Obligations table above, represents the estimated cost to retire such assets.
57
Table of Contents
Uncertain income tax positions. We have recognized a liability for our uncertain income tax positions of approximately $6.7 million as of December 31, 2015. We do not believe we are likely to pay any amounts during the year ended December 31, 2016. The ultimate resolution and timing of payment for remaining matters continues to be uncertain and are therefore excluded from the Contractual Obligations table above.
Outlook
The Company expects the following factors to impact its first-quarter 2016 and longer term results:
| • | In the chlorovinyls segment, the Company expects increased caustic soda and vinyl resin sales volumes primarily due to fewer planned outages in the first quarter of 2016 as compared to the fourth quarter of 2015. Vinyl resin and caustic soda prices, particularly export caustic soda and export vinyl resin prices, are below the average for the fourth quarter 2015. The impact of these factors on first quarter 2016 results will primarily depend on the timing and magnitude of vinyl resin and caustic soda price changes and ethylene costs. The company does not expect any material changes in the components of its ethylene supply portfolio during the first quarter. |
| • | The Company expects first-quarter 2016 sales volume and Adjusted EBITDA for the building products segment to follow normal seasonal patterns and decrease compared to results for the fourth quarter of 2015 but exceed first quarter 2015 results. |
| • | Over the longer term, Axiall believes ECU values will be driven higher by the strength of domestic demand and improved export volumes for ECU products. The Company believes it is well positioned to take advantage of a number of macro-economic and industry trends. In particular, that North America’s natural gas cost advantage over oil-based economies in other parts of the world will continue to provide a competitive cost advantage to North American producers. This advantage is expected to allow consistent access to growing export markets for both chlorine, in the form of PVC, and caustic soda. In addition, the pace of global capacity growth in our key products has slowed dramatically compared to the beginning of the decade, which the Company believes will improve the supply-demand balance for those products. Moreover, if the gradual improvement in the United States housing market, both in terms of starts and renovation activity continues, Axiall believes this will drive building products volumes higher. The combination of these macro-economic and industry trends is expected to increase demand for ECU and vinyl products. |
Inflation
The most significant component of our cost of sales is raw materials, which include basic oil-based commodities and natural gas or derivatives thereof. The costs of raw materials and natural gas are based primarily on market forces and have not been significantly affected by inflation. Inflation has not had a material impact on our sales or income from operations.
New Accounting Pronouncements
In November 2015, the Financial Accounting Standards Board (“FASB” or the “Board”) issued Accounting Standards Update (“ASU” or “Update”) 2015-17 – Income Taxes (Topic 740)-Balance Sheet Classification of Deferred Taxes. The Board issued this Update as part of its continuing initiative to reduce complexity in accounting standards and further align U.S. GAAP with International Financial Reporting Standards (“IFRS”). Current GAAP requires an entity to separate deferred income tax assets and liabilities into current and noncurrent amounts in a classified balance sheet. To simplify the presentation of deferred income taxes, the amendments in this Update require that deferred tax assets
58
Table of Contents
and liabilities be classified as noncurrent in a classified balance sheet. The current requirement to offset deferred tax assets and liabilities and present the net as a single amount is not affected by the amendments in this Update. The amendments in this Update may be applied either prospectively to all deferred tax assets and liabilities or retrospectively for all periods presented. If an entity applies the guidance prospectively, the entity should disclose in the first interim and first annual period of change, the nature of and reason for the change in accounting principle and a statement that prior periods were not retrospectively adjusted. The amendments in this Update are effective for annual periods, including interim periods, beginning after December 15, 2016. We have adopted the amendments in this Update prospectively.
In July 2015, the FASB issued ASU 2015-11 – Inventory (Topic 330). The amendments in this update apply to entities that measure inventory using the first-in, first-out or average cost methods. Under this guidance, such entities are required to measure inventory at the lower of cost or net realizable value. Net realizable value is the estimated selling price in the ordinary course of business, less the reasonably predictable costs of completion, disposal and transportation. Subsequent measurement is unchanged for inventory valued using the last-in, first-out and the retail inventory methods. The amendments in this Update are effective for annual periods, including interim periods, beginning after December 15, 2016. We have adopted the amendments in this Update and there was no impact on our consolidated financial statements.
In May 2015, the FASB issued ASU 2015-07 – Disclosures for Investments in Certain Entities That Calculate Net Asset Value per Share (or Its Equivalent) (Topic 820). The amendments in this Update remove the requirement to categorize within the fair value hierarchy, all investments for which fair value is measured using the net asset value per share practical expedient. The amendments also remove the requirement to make certain disclosures for all investments that are eligible to be measured at fair value, using the net asset value per share practical expedient. Rather, those disclosures are limited to investments for which the entity has elected to measure the fair value using that practical expedient. This ASU should be applied retrospectively for all periods presented. We have adopted the amendments in this Update retrospectively and there was no impact on our consolidated statements of operations.
In April 2015, the FASB issued ASU 2015-05 – Intangibles-Goodwill and Other-Internal-Use Software (Subtopic 350-40). The amendments in this Update provide explicit guidance to companies about fees paid in cloud-based computing arrangements for various hosting services. Previous GAAP guidance did not include such explicit direction. Specifically, the Update stipulates that if a cloud-based computing arrangement includes a software license, the company should account for the software license element of the arrangement consistent with the acquisition of other software licenses. If a cloud-based computing arrangement does not include a software license, the company should account for the arrangement as a service contract. The guidance does not change the accounting treatment for service contracts. However, all software licenses within the scope of this Update should be accounted for consistent with other licenses of intangible assets. The amendments in this Update are effective for annual periods, including interim periods, beginning after December 15, 2015, and early adoption is permitted. We have adopted the amendments in this Update prospectively and have determined there was no impact on our consolidated financial statements.
In April 2015, the FASB issued ASU 2015-03 – Interest-Imputation of Interest (Subtopic 835-30). The amendments in this Update simplifies the presentation of debt issuance costs by requiring debt issuance costs related to a recognized debt liability to be presented on the balance sheet as a direct deduction from the carrying amount of the related debt liability, similar to the accounting treatment for debt discounts. The amendments in this Update are effective for financial statements issued for fiscal years beginning after December 15, 2015, and early adoption is permitted. We adopted the amendments to the Update which required us to reclassify approximately $15.9 million and $18.3 million of deferred financing fees as of December 31, 2015 and 2014, respectively, from other assets to
59
Table of Contents
long-term debt in our consolidated balance sheets. The Company did not reclassify debt issuance costs of $7.1 million and $7.9 million, for the years ended December 31, 2015 and 2014, respectively, related to the ABL Revolver as there was no outstanding balance for the ABL Revolver as of December 31, 2015 and 2014, and will not reclassify such costs in future periods where a balance exists. The adoption had no impact on our consolidated statements of operations.
In February 2015, the FASB issued ASU 2015-02 – Consolidation (Topic 810)-Amendments to the Consolidation Analysis to assist companies in evaluating whether certain legal entities should be consolidated. The ASU stipulates that all legal entities are subject to reevaluation under the revised consolidation model in the guidance. This Update reduces the number of consolidation models, simplifies the FASB Accounting Standards Codification and improves current GAAP by placing more emphasis on risk of loss when determining a controlling financial interest. A reporting organization may no longer have to consolidate a legal entity under certain circumstances based solely on its fee arrangement when certain criteria are met. This reduces the frequency of the application of related-party guidance when determining a controlling financial interest in a variable interest entity (“VIE”). The Update changes the consolidation conclusions for public and private companies in several industries that typically make use of limited partnerships or VIEs. The amendments in this Update are effective for annual periods, including interim periods, beginning after December 15, 2015. We have adopted the amendments in this Update and have determined there is no impact on our consolidated financial statements.
In June 2014, FASB issued ASU 2014-12 – Compensation-Stock Compensation (Topic 718). Under this Update: Accounting for Share-Based Payments When the Terms of an Award Provide That a Performance Target Could Be Achieved after the Requisite Service Period (a consensus of the FASB Emerging Issues Task Force), a performance target that affects vesting, and that could be achieved after the requisite service period, would be treated as a performance condition. GAAP did not address these issues. The Update states that a reporting entity should apply existing guidance in Topic 718 to account for awards with performance conditions that affect the vesting of such awards. As such, the performance target should not be reflected in estimating the grant-date fair value of the award. Compensation cost should be recognized in the period in which it becomes probable that the performance target will be achieved and should represent the compensation cost attributable to the periods for which the requisite service has already been rendered. If the performance target becomes probable of being achieved before the end of the requisite service period, the remaining unrecognized compensation cost should be recognized prospectively over the remaining requisite service period. The total amount of compensation cost recognized during and after the requisite service period should reflect the number of awards that are expected to vest and should be adjusted to reflect those awards that ultimately vest. The requisite service period ends when the employee can cease rendering service and still be eligible to vest in the award if the performance target is achieved. The stated vesting period (which includes the period in which the performance target could be achieved) may differ from the requisite service period. The amendments in this Update are effective for annual reporting periods beginning after December 15, 2015. We have adopted the amendments in this Update and have determined there was no impact on our consolidated financial statements.
In May 2014, the FASB issued ASU 2014-09 – Revenue from Contracts with Customers. The Update outlines a single, comprehensive model for entities to use in accounting for revenue arising from contracts with customers and supersedes most current revenue recognition guidance issued by the FASB, including industry specific guidance. The Update provides accounting guidance for all revenue arising from contracts with customers and affects all entities that enter into contracts with customers to provide goods and services. The guidance also provides a model for the measurement and recognition of gains and losses on the sale of certain nonfinancial assets, such as property and equipment, including real estate. In August 2015, the FASB issued ASU 2015-14 – Revenue from Contracts with Customers (Topic 606): Deferral of the Effective Date. This Update provides for a one year deferral of the effective date of ASU 2014-09. As a result, the Company expects that it will apply the new revenue
60
Table of Contents
standard to annual and interim reporting periods beginning after December 15, 2017. The new standard must be adopted using either a full retrospective approach for all periods presented in the period of adoption or a modified retrospective approach. The modified retrospective approach requires that the new standard be applied to all new and existing contracts as of the date of adoption, with a cumulative catch-up adjustment recorded to the opening balance of retained earnings at the effective date for existing contracts that still require performance by the entity. Under the modified retrospective approach, amounts reported prior to the date of adoption will be presented under existing guidance. The Update also requires entities to disclose both quantitative and qualitative information to enable users of the financial statements to understand the nature, amount, timing, and uncertainty of revenue and cash flows arising from contracts with customers. We have not yet determined the impact of adopting the standard on our consolidated financial statements, nor have we determined whether we will utilize the full retrospective or modified retrospective approach.
61
Table of Contents
Critical Accounting Policies and Estimates
Our consolidated financial statements are prepared in accordance with accounting principles generally accepted in the United States, which require management to make estimates, judgments and assumptions that affect the amounts reported in our consolidated financial statements and accompanying notes. We believe our most critical accounting policies and estimates relate to the following:
| • | Long-Lived Assets |
| • | Goodwill and Other Intangible Assets |
| • | Pension and OPEB Liabilities |
| • | Environmental Matters |
| • | Income Taxes |
Management has discussed the development, selection and disclosure of critical accounting policies and estimates with the Audit Committee of the Company’s Board of Directors and with our independent registered public accounting firm. Critical accounting policies are those that are important to our financial condition and require management’s most difficult, subjective or complex judgments. While our estimates and assumptions are based on our knowledge of current events and actions we may undertake in the future, actual results may ultimately differ from these estimates and assumptions. For a discussion of the Company’s significant accounting policies, refer to Note 1 of Notes to Consolidated Financial Statements in Item 8.
Long-Lived Assets
Our long-lived assets, such as property, plant and equipment, are reviewed for impairment whenever events or changes in circumstances indicate that the carrying value of an asset may not be recoverable. Recoverability of an asset to be held and used is measured by comparing the carrying value of the asset to the estimated undiscounted future cash flows expected to be generated by the asset. If the carrying value of an asset exceeds its estimated undiscounted future cash flows, an impairment charge is recognized for the amount by which the carrying value of the asset exceeds the fair value of the asset. Our judgments regarding the existence of impairment indicators are based on macro-economic conditions, market conditions and assumptions for operational performance of our businesses. The assumptions used to estimate our future undiscounted cash flows are predominately identified from our financial forecasts. The actual impairment charge incurred could vary significantly from amounts that we estimate. Additionally, future events could cause us to conclude that impairment indicators exist and that associated long-lived assets of our businesses are impaired.
During the year ended December 31, 2015, the Company recognized $2.8 million in long-lived asset impairment charges, primarily in the window and door profiles reporting unit of our building products segment. During the year ended December 31, 2014, the Company incurred approximately $13.5 million in long-lived assets impairment charges of which $12.5 million related to property, plant and equipment for a product line in our chlorovinyls segment that was sold during 2015.
Goodwill and Other Intangible Assets
Our intangible assets consist of goodwill, customer relationships, supply contracts, technology, and trade names. Goodwill is the excess of the cost of an acquired entity over the fair value of tangible and intangible assets (including, but not limited to, customer relationships, supply contracts, technology, and trade names) acquired and liabilities assumed under acquisition accounting for business combinations.
62
Table of Contents
As of December 31, 2015, we have two segments that contain reporting units with goodwill and intangible assets: our chlorovinyls segment includes goodwill in its chlor-alkali and derivatives and compound reporting units and our building products segment includes goodwill primarily in its siding reporting unit.
Valuation of Goodwill and Indefinite-Lived Intangible Assets. The carrying values of our goodwill and indefinite-lived intangible assets are tested for impairment annually in the fourth quarter, using a measurement date of October 1. In addition, we evaluate the carrying values of these assets for impairment between annual impairment tests if an event occurs or circumstances change that would more likely than not reduce the fair value of a reporting unit below its carrying amount. Such events and indicators may include, without limitation, significant declines in the industries in which our products are used, significant changes in the estimated future cash flows of our reporting units, significant changes in capital market conditions and significant changes in our market capitalization.
Impairment testing for goodwill is a two-step test performed at the reporting unit level. The first step (“Step-1”) of the impairment analysis involves comparing the fair value of the reporting unit to its carrying value, including goodwill. If the fair value of the reporting unit exceeds the carrying value, goodwill is not considered impaired. If the carrying value exceeds the fair value, Step-2 of the impairment analysis is performed, in which we determine the fair-value of the underlying net assets of the reporting unit and compare this to the carrying value in order to measure the amount of impairment. Our goodwill evaluations utilize discounted cash flow analyses (the “income approach”) and market multiple analyses (the “market approach”), in estimating fair value. The weighting of the discounted cash flow and market approaches varies by each reporting unit based on factors specific to each reporting unit. Inherent in our fair value determinations are certain judgments and estimates relating to future cash flows, including our interpretation of current economic indicators and market conditions, overall economic conditions and our strategic and operational plans with regard to our business units. In addition, to the extent significant changes occur in market conditions, overall economic conditions or our strategic or operational plans, it is possible that goodwill not currently impaired, may become impaired in the future.
Our other indefinite-lived assets consist only of trade names in our building products segment. Impairment testing for indefinite-lived intangible assets other than goodwill involves comparing the fair value of the intangible asset to its carrying value. The fair values of our trade names are estimated based on the relief from royalty method under the income approach. This approach utilizes a discounted cash flow analysis.
Interim impairment testing: During the third quarter of 2015, we determined there were indicators that required us to perform an interim impairment test in our reporting units that carry goodwill and other indefinite-lived intangible assets. These factors included, but were not limited to, the operating results during the nine months ended September 30, 2015, the sustained deterioration of market conditions in certain of our industries and the resulting decline in our market capitalization. Based on our analysis, we concluded there was no impairment for our other indefinite-lived intangible assets.
During the three months ended September 30, 2015, we concluded that the estimated fair values of our compound, mouldings and siding reporting units exceeded the carrying values in each respective unit by more than 10 percent. We also concluded that the estimated fair value of our chlor-alkali and derivatives reporting unit was lower than its carrying value, and consequently, we proceeded with Step-2 of the goodwill impairment test in order to measure the magnitude of impairment, if any.
Based on the results of the Step-2 test, the Company recorded a goodwill impairment charge of $864.1 million related to our chlor-alkali and derivatives reporting unit during the year ended December 31, 2015. In December 2014, the Company recorded an impairment charge of approximately $4.1 million
63
Table of Contents
of goodwill and $2.6 million of customer relationships relating the sale of a product-line in our chlor-alkali derivatives business. During the year ended December 31, 2013, the Company recorded a goodwill impairment charge of $18.2 million in its window and door profiles reporting unit. The write-down was due primarily to the prolonged downturn in the North American housing and construction markets, pricing declines, and the expected impact of those declines on projected cash flows on the window and door profiles reporting unit during the year ended December 31, 2013.
Annual impairment testing: We tested our reporting units with goodwill and other indefinite-lived intangible assets in the fourth quarter of 2015 in accordance with our annual October 1 impairment testing. Based on our Step-1 analysis, the estimated fair values of our compound and siding reporting units exceeded the carrying values in each respective unit by more than 10 percent. The estimated fair value of our chlor-alkali and derivatives reporting unit exceeded its carrying value at an amount that was less than 10 percent. Based on these results, none of our reporting units had any impairment. However, management will continue to monitor the reporting units for any future indicators of impairment.
Further reductions in our future projections of operating results and cash flows from our chlor-alkali and derivatives reporting unit, or certain reporting units in our building products business, or a further deterioration of market conditions in the chlor-alkali and derivatives or building products industries in which we operate, among other factors, could result in the Company incurring additional goodwill impairment charges for one or more of those reporting units.
Definite-Lived Intangible Assets
We have definite-lived intangible assets that include customer relationships, supply contracts, technology and trade names. We evaluate these assets for impairment if an event occurs or circumstances change that would indicate the carrying value could be impaired. If indicators suggest that the related undiscounted cash flows do not exceed the carrying value of the asset, we recognize an impairment charge to the extent that the carrying value exceeds the fair value of the definite lived intangible asset.
Pension and OPEB Liabilities
Accounting for employee pension and OPEB plans involves estimating the cost of benefits that are to be provided in the future and attempting to match, for each employee, that estimated cost to the period worked. To accomplish this, we make assumptions about discount rates, expected long-term rates of return on plan assets, salary increases, employee turnover and mortality rates, among others. We reevaluate all assumptions annually with our independent actuaries taking into consideration existing and forecasted economic conditions and our investment policy and strategy with regard to managing the plans. We believe our estimates, the most significant of which are stated below, are reasonable.
Assumptions for Benefit Obligations
Mortality is a key assumption used to determine the benefit obligation for our defined benefit pension and OPEB plans. The Company continues to measure year-end benefit obligations using the SOA’s RP-2014, with adjustments by plan. The Company selected the BB-2D scale to reflect mortality improvement rates as published by the SOA for purposes of measuring pension and OPEB benefit obligations at year-end.
The discount rate reflects the rate at which pension benefit obligations could be effectively settled. For the majority of our obligations, we determined our discount rate by matching the expected cash flows of our pension and OPEB obligations to a yield curve generated from a broad portfolio of high-quality
64
Table of Contents
fixed rate debt instruments. The rate of compensation is based on projected salary increases for our plan participants. The healthcare cost trend assumption is based on a number of factors including our actual healthcare cost increases, the design of our benefit programs, the demographics of our active and retiree populations and external expectations of future medical cost inflation rates. The weighted average assumptions used for determining our benefit obligations are as follows:
| Pension Benefits | OPEB | |||||||||||
| 2015 | 2014 | 2013 | 2015 | 2014 | 2013 | |||||||
| Discount rate |
4.34% | 3.98% | 4.81% | 3.61% | 3.90% | 4.65% | ||||||
| Rate of compensation increase |
3.01% | 3.01% | 3.00% | NA | NA | 3.00% | ||||||
| Health care cost trend rate |
||||||||||||
| -- Initial rate |
NA | NA | NA | 7.47% | 7.00% | 7.49% | ||||||
| -- Ultimate rate |
NA | NA | NA | 4.50% | 4.50% | 4.50% | ||||||
| -- Years to ultimate |
NA | NA | NA | 12 | 9 | 10 | ||||||
Assumptions for Annual Projected Expense
The discount rate for determining annual pension and OPEB expense is determined by matching the expected cash flows of our pension and OPEB obligations to a yield curve generated by a broad portfolio of high-quality fixed rate debt instruments. The expected long-term rate of return on plan assets assumption is based on historical and projected rates of return for current and planned asset classes in the plan’s investment portfolio. Our weighted average asset allocation as of December 31, 2015, is 61 percent equity securities, 38 percent debt securities, and 1 percent other. Assumed projected rates of return for each of the plan’s projected asset classes were selected by us after analyzing historical experience and future expectations of the returns and volatility of the various asset classes. The rate of compensation is based on projected salary increases for our plan participants. The weighted average expected discount rate, expected long-term rate of return on plan assets and rate of compensation increase assumptions used for determining annual pension expense for our pension and OPEB plans are as follows:
| Pension Benefits | OPEB | |||||||||||
| 2015 | 2014 | 2013 | 2015 | 2014 | 2013 | |||||||
| Discount rate |
3.97% | 4.81% | 4.16% | 3.60% | 4.65% | 4.39% | ||||||
| Expected long-term rate of return on plan assets |
7.39% | 7.42% | 6.91% | NA | NA | NA | ||||||
| Rate of compensation increase |
3.01% | 3.00% | 3.14% | NA | NA | 3.11% | ||||||
Recently approved amendments to the OPEB plans were made to further deliver retiree medical benefits through health reimbursement account contributions and to further limit life insurance benefits. Effective January 1, 2016, the majority of Medicare and non-Medicare eligible retirees will receive retiree medical benefits through health reimbursement account contributions. In addition, effective January 1, 2016, most life insurance benefits for non-bargained retirees were eliminated and a sunset period was provided for life insurance benefits for the majority of other retirees. These OPEB benefit changes were approved and communicated to participants in August 2015 and the quantitative financial impact is reflected in the year ended December 31, 2015. These changes reduced the OPEB benefit obligation by $29.8 million and the resulting prior service credit will be amortized through 2025.
In the third quarter of 2015, we changed the approach used to estimate the service and interest components of net periodic benefit cost for the U.S. postretirement benefits. This new estimation approach discounts the individual expected cash flows underlying the service cost and interest cost using the applicable spot rates derived from the yield curve used to discount the cash flows used to
65
Table of Contents
measure the benefit obligation. Historically, we estimated these service and interest cost components utilizing a single weighted-average discount rate derived from the yield curve used to measure the benefit obligation at the beginning of the period.
We have made this change to provide a more precise measurement of service and interest costs by improving the correlation between projected benefit cash flows to the corresponding spot yield curve rates. We have accounted for this change as a change in accounting estimate that is inseparable from a change in accounting principle and accordingly have accounted for it prospectively. While the benefit obligation measured under this approach is unchanged, the more granular application of the spot rates reduced the service and interest cost for the OPEB plan for the last four months of fiscal 2015 by $0.2 million. For the OPEB plan, the spot rates used to determine service and interest costs ranged from 0.65 percent to 5.01 percent and 0.65 percent to 5.01 percent, respectively. Under the Company’s prior methodology, these rates would have resulted in weighted-average rates for service and interest costs of 3.59 percent and 3.59 percent, respectively. The new approach will be used to measure the service and interest cost for our other U.S. pension plans in 2016. For the pension plans, the spot rates that will be used to determine 2016 service and interest costs range from 0.92 percent to 4.97 percent and 0.92 percent to 4.97 percent, respectively. Under the Company’s prior methodology, these rates would have resulted in a single weighted-average rate of 4.37 percent for both service and interest costs. Based on current economic conditions, we estimate the service cost and interest cost for the pension plans will be reduced by approximately $7.0 million in 2016 as a result of the change.
Sensitivity for Key Underlying Assumptions
The following table shows the impact of a 25 basis point change in the assumed discount rate and expected long-term rate of return on plan assets for our pension and OPEB plans, and the impact of the increase (decrease) on benefit obligations and expense for the year ended December 31, 2015.
| (In millions) |
25 Basis Point Increase |
25 Basis Point Decrease |
||||||
| Pension Plans | ||||||||
| Discount Rate: |
||||||||
| Effect on ongoing net periodic benefit cost |
$ | 0.2 | $ | (0.2) | ||||
| Effect on projected benefit obligation |
(20.2) | 21.2 | ||||||
| Return on Assets: |
||||||||
| Effect on ongoing net periodic benefit cost |
(1.5) | 1.5 | ||||||
| OPEB Plans | ||||||||
| Discount Rate: |
||||||||
| Effect on ongoing net periodic benefit cost |
0.1 | 0.1 | ||||||
| Effect on projected benefit obligation |
(1.1) | 1.1 | ||||||
For the plan year ended December 31, 2015, if the assumed healthcare inflation trend rates were 1 percent higher or 1 percent lower for the OPEB plans, the benefit obligations would increase by $1.2 million or decrease by $1.1 million respectively. For the plan year ended December 31, 2015, a 1 percent increase in the assumed healthcare inflation trend rates would increase the OPEB plan aggregate service and interest cost by $0.1 million, while a 1 percent decrease would decrease the aggregate service and interest cost by $0.1 million.
Environmental Matters
In our determination of the estimates relating to ongoing environmental costs and legal proceedings (see Note 12 of the Notes to Consolidated Financial Statements included in Item 8), we consult with
66
Table of Contents
our advisors (consultants, engineers and attorneys). Such consultation provides us with the information on which we base our judgments on these matters and under which we accrue an expense when it has been determined that it is probable that a liability has been incurred and the amount is reasonably estimable. While we believe that the amounts recorded in the accompanying consolidated financial statements related to these contingencies are based on the best estimates and judgments available to us, the actual outcomes could differ from our estimates. To the extent that actual outcomes differ from our estimates by 10 percent, our net loss attributable to Axiall would be higher or lower by approximately $4.1 million.
Environmental Remediation
Our operations and assets are subject to extensive environmental, health and safety regulations, including laws and regulations related to air emissions, water discharges, waste disposal and remediation of contaminated sites, at both the national and local levels in the United States. We are also subject to similar laws and regulations in Canada and other jurisdictions in which we operate. The nature of the chemical and building products industries exposes us to risks of liability under these laws and regulations due to the production, storage, use, transportation and sale of materials that can cause contamination or personal injury, including, in the case of chemicals, potential releases into the environment. Environmental laws may have a significant effect on the costs of use, transportation and storage of raw materials and finished products, as well as the costs of the storage and disposal of wastes. We have incurred and will continue to incur substantial operating and capital costs to comply with environmental laws and regulations. In addition, we may incur substantial costs, including fines, damages, criminal or civil sanctions and remediation costs, or experience interruptions in our operations for violations arising under these laws and regulations.
As of December 31, 2015 and 2014, we had reserves for environmental contingencies totaling approximately $41 million and $54 million, respectively, of which approximately $1 million and $12 million, respectively, were classified as current liabilities. Our assessment of the potential impact of these environmental contingencies is subject to considerable uncertainty due to the complex, ongoing and evolving process of investigation and remediation, if necessary, of such environmental contingencies, and the potential for technological and regulatory developments.
Some of our significant environmental contingencies include the following matters:
| • | We have entered into a Cooperative Agreement with the Louisiana Department of Environmental Quality (“LDEQ”) and various other parties for the environmental remediation of a portion of the Bayou d’Inde area of the Calcasieu River Estuary in Lake Charles, Louisiana. Remedy implementation began in the fourth quarter of 2014 and is expected to be completed during 2016, with a period of monitoring for remedy effectiveness to follow remediation. As of December 31, 2015 and 2014, we have reserved approximately $4 million and $18 million, respectively, for the costs associated with this matter. The decrease in the amount of this reserve is primarily due to spending against the reserve. |
| • | As of December 31, 2015 and 2014, we had reserved approximately $12 million and $15 million, respectively, for environmental contingencies related to on-site remediation at the Lake Charles South Facility, principally for ongoing remediation of groundwater and soil in connection with our corrective action permit issued pursuant to the Hazardous and Solid Waste Amendments of the Resource Conservation and Recovery Act. The remedial activity is primarily related to the operation of a series of well water treatment systems across the Lake Charles South Facility. In addition, remediation of possible soil contamination will be conducted in certain areas. These remedial activities are expected to continue for an extended period of time. The reduction in the amount of this reserve is due to our assessment, during the year ended December 31, 2015, of the estimated costs to be incurred after December 31, 2015 to conduct this on-going remedial activity, and in particular, our assessment of the portion of the |
67
Table of Contents
| future operating costs of certain water treatment assets at our Lake Charles South Facility that should be allocated to this remediation project, as opposed to other non-remediation uses of those water treatment assets. |
| • | As of December 31, 2015 and 2014, we had reserved approximately $18 million and $15 million, respectively, for environmental contingencies related to remediation activities at our Natrium, West Virginia facility (the “Natrium Facility”). The remedial actions address National Pollutant Discharge Elimination System permit requirements related primarily to hexachlorocyclohexane (commonly referred to as BHC) and mercury. We expect that these remedial actions will be in place for an extended period of time. The increase in the amount of this reserve is due to our assessment, during the year ended December 31, 2015, of the estimated costs that will be incurred after December 31, 2015 to conduct this on-going remedial activity, and in particular, due to an increase in the estimated duration of the remediation period. |
Environmental Laws and Regulations
Due to the nature of environmental laws, regulations and liabilities, it is possible that we may not have identified all potentially adverse conditions. Such conditions may not currently exist or be detectable through reasonable methods, or may not be estimable. For example, our Natrium Facility and Lake Charles South Facility have both been in operation for over 65 years. There may be significant latent liabilities or future claims arising from the operation of facilities of this age, and we may be required to incur material future remediation or other costs in connection with future actions or developments at these or other facilities.
We expect to be continually subjected to increasingly stringent environmental and health and safety laws and regulations, and that continued compliance will require increased capital expenditures and increased operating costs or may impose restrictions on our present or future operations. It is difficult to predict the future interpretation and development of these laws and regulations or their impact on our future earnings and operations. Any increase in these costs, or any material restrictions on our ability to operate or the manner in which we operate, could materially adversely affect our liquidity, financial condition and results of operations. However, estimated costs for future environmental compliance and remediation may be materially lower than actual costs, or we may not be able to quantify potential costs in advance. Actual costs related to any environmental compliance in excess of estimated costs could have a material adverse effect on our financial condition in one or more future periods.
Heightened interest in environmental regulation, such as climate change issues, has the potential to materially impact our costs and present and future operations. We, and other chemical companies, are currently required to file certain governmental reports relating to greenhouse gas (“GHG”) emissions. The U.S. Government has considered, and may in the future implement, restrictions or other controls on GHG emissions, any of which could require us to incur significant capital expenditures or further restrict our present or future operations.
In addition to GHG regulations, the United States Environmental Protection Agency (the “EPA”) has recently taken certain actions to limit or control certain pollutants created by companies such as ours. For example:
| • | In January 2013, the EPA issued Clean Air Act emission standards for boilers and incinerators (the “Boiler MACT regulations”), which are aimed at controlling emissions of toxic air contaminants at covered facilities. The coal fired power plant at our Natrium Facility is our source most significantly impacted by the Boiler MACT regulations. Pursuant to an extension granted by the West Virginia Department of Environmental Protection (WVDEP), we expect to comply with the requirements of the Boiler MACT regulations on or before December 2016. |
68
Table of Contents
| • | In April 2012, the EPA issued final regulations to update emissions limits for PVC and copolymer production (the “PVC MACT regulation”). The PVC MACT regulation sets standards for major sources of PVC production and establishes certain working practices, as well as monitoring, reporting and record-keeping requirements. Following the issuance of the PVC MACT regulation, a variety of legal challenges were filed by the vinyl industry’s trade organization, several vinyl manufacturers and several environmental groups. Most of these challenges have been resolved; however, there are several petitions to reconsider certain provisions in the rule that are still pending. We anticipate that some of these provisions will likely be changed as a result of these petitions, and there could be significant changes from the currently existing PVC MACT regulation after all legal challenges have been exhausted. These changes, could require us to incur further capital expenditures, or increase our operating costs, to levels significantly higher than what we have previously estimated. |
| • | In March 2011, the EPA proposed amendments to the emission standards for hazardous air pollutants for mercury emissions from mercury cell chlor-alkali plants. These proposed amendments would require improvements in work practices to reduce fugitive mercury emissions and would result in reduced levels of mercury emissions while still allowing the mercury cell facilities to continue to operate. We operate a mercury cell production unit at our Natrium Facility. No assurances as to the timing or content of the final regulation, or its ultimate cost to, or impact on us, can be provided. |
The potential impact of these and/or unrelated future, legislative or regulatory actions on our current or future operations cannot be predicted at this time but could be significant. Such impacts could include the potential for significant compliance costs, including capital expenditures, which could result in operating restrictions or could require us to incur significant legal or other costs related to compliance or other activities. For example, a recent revision to ambient air quality standards for ozone may, in the future, result in significant operating costs, compliance costs, and capital expenditures at some of our facilities. Any increase in the costs related to these initiatives, or restrictions on our operations, could materially adversely affect our liquidity, financial condition or results of operations.
Income Taxes
Income taxes are accounted for under the liability method. Deferred tax assets and liabilities are recognized for the future tax consequences attributable to differences between the financial statement carrying value of existing assets and liabilities and their respective tax bases. Deferred tax assets and liabilities are measured using enacted tax rates expected to apply to taxable income in the years in which those temporary differences are expected to be recovered or settled. The effect on deferred tax assets and liabilities of a change in tax rates is recognized in income in the period that includes the enactment date. We evaluate the realizability of deferred tax assets by assessing whether it is more likely than not that some or all of the deferred tax assets will not be realized. The ultimate realization of deferred tax assets depends on the generation of future taxable income during the periods in which those temporary differences are deductible. Management considers the scheduled reversal of deferred tax liabilities (including the impact of available carryback and carryforward periods), projected taxable income and tax-planning strategies available to us in making this assessment. If it is not more likely than not that we will realize a deferred tax asset, we record a valuation allowance against such asset. As of December 31, 2015, a valuation allowance of $77.5 million has been provided against the deferred taxes in Canada. We use a similar evaluation for determining when to release previously recorded valuation allowances. It is reasonably possible that our valuation allowance may decrease significantly during the next 12 months. We recognize tax benefits for uncertain tax positions as income tax expense when it is more likely than not, based upon the technical merits, that the position will be sustained upon examination.
69
Table of Contents
Item 7A. QUANTITATIVE AND QUALITATIVE DISCLOSURES ABOUT MARKET RISK.
We are subject to certain market risks associated with long-term financing, derivative financial instruments, foreign currency exchange rates, and raw material commodity prices. These financial exposures are managed as an integral part of our risk management program, which seeks to reduce the potentially adverse effect that the volatility of interest rates, exchange rates, raw material commodity and natural gas markets may have on our operating results. We do not engage in speculative transactions, nor do we hold or issue financial instruments for trading purposes.
Interest Rate Risk Management. The following table is “forward-looking” information that provides information about our debt obligations that are sensitive to changes in interest rates. Our policy is to manage interest rates through the combined use of fixed and floating rate debt instruments. At times, we may utilize interest rate swap agreements to help manage our interest rate risk. The table presents principal cash flows and related weighted average interest rates by expected maturity dates for the financial instruments.
| (In millions, except percentages) |
2016 | 2017 | 2018 | 2019 | 2020 | Thereafter | Total | Fair value at 12/31/2015 |
||||||||||||||||||||||||
| Financial instruments: |
||||||||||||||||||||||||||||||||
| Fixed rate instruments: |
||||||||||||||||||||||||||||||||
| Fixed rate principal (4.625 Notes) |
$ | - | $ | - | $ | - | $ | - | $ | - | $ | 678.4 | $ | 678.4 | $ | 635.1 | ||||||||||||||||
| Weighted average interest rate |
- % | - % | - % | - % | - % | 4.625 % | 4.625 % | |||||||||||||||||||||||||
| Fixed rate principal (4.875 Notes) |
$ | - | $ | - | $ | - | $ | - | $ | - | $ | 444.2 | $ | 444.2 | $ | 408.4 | ||||||||||||||||
| Weighted average interest rate |
- % | - % | - % | - % | - % | 4.875 % | 4.875 % | |||||||||||||||||||||||||
| Variable rate instruments: |
||||||||||||||||||||||||||||||||
| Term Loan |
$ | 2.5 | $ | 2.5 | $ | 2.5 | $ | 2.5 | $ | 2.5 | $ | 231.9 | $ | 244.4 | $ | 247.8 | ||||||||||||||||
| Weighted average interest rate |
4.067 % | 4.056 % | 4.056 % | 4.056 % | 4.067 % | 4.056 % | 4.059 % | |||||||||||||||||||||||||
The Company and certain of its subsidiaries guarantee $688.0 million in aggregate principal amount of the 4.625 Notes that were issued by Spinco. Interest payments on the 4.625 Notes commenced on August 15, 2013 and interest is payable semi-annually in arrears on February 15 and August 15 of each year. The 4.625 Notes are fully and unconditionally guaranteed, jointly and severally, on a senior unsecured basis by the Company and by its existing and future domestic subsidiaries, other than certain excluded subsidiaries.
The Company issued $450.0 million in aggregate principal amount of the 4.875 Notes. Interest payments on the 4.875 Notes commenced on May 15, 2013 and interest is payable semi-annually in arrears on May 15 and November 15 of each year. The 4.875 Notes are fully and unconditionally guaranteed, jointly and severally, on a senior unsecured basis by each of our existing and future domestic subsidiaries, other than certain excluded subsidiaries.
On February 27, 2015, Axiall Holdco entered into the Term Loan Agreement for the $250 million New Term Loan Facility to refinance the principal amount outstanding under the Company’s existing term loan facility, to pay related fees and expenses, and for general corporate purposes. Obligations under the New Term Loan Facility are fully and unconditionally guaranteed, on a senior secured basis, by the Company and by each of the Company’s existing and future wholly-owned domestic subsidiaries, other than certain excluded subsidiaries. The obligations under the New Term Loan Facility are secured by substantially all of the assets of Axiall Holdco, the Company and the subsidiary guarantors.
The Company’s ABL Revolver provides for a maximum of $600.0 million of revolving credit, subject to applicable borrowing base limitations and certain other conditions. The ABL Credit Agreement contains customary covenants, including certain restrictions on the Company and its subsidiaries to pay dividends and repurchase shares of Company stock. In December 2015, we amended our ABL Credit Agreement to, among other things, provide additional flexibility to pay dividends and consummate
70
Table of Contents
stock repurchases, modify the definition of consolidated EBITDA to include certain additional add backs and reductions to net income in determining consolidated EBITDA (as defined in the ABL Revolver), revise the definition of consolidated capital expenditures to exclude capital expenditures made in connection with the proposed Plant , and provide for a reduction in the amount of its basket for investments in such a plant by the amount of such capital expenditures that are excluded from the definition of consolidated capital expenditures.
As of December 31, 2015 and 2014, we had no outstanding balance under our ABL Revolver. Our availability under the ABL Revolver at December 31, 2015 was approximately $369.2 million, net of outstanding letters of credit totaling $81.9 million. As of December 31, 2015, depending on the duration of the loan, the applicable rate for borrowings would have been between 2.11 percent to 4.00 percent based on LIBOR or the Prime Rate, plus the applicable margin under the ABL Revolver.
Foreign Currency Exchange Risk Management. We may enter into foreign exchange forward contracts and options and cross-currency swaps to hedge various currency exposures or create desired exposures. As of December 31, 2015 and 2014, we had no outstanding foreign exchange swaps.
Raw Materials and Natural Gas Price Risk Management. The availability and price of our raw materials and natural gas are subject to fluctuations due to unpredictable factors in global supply and demand. To reduce price risk caused by market fluctuations, from time to time, we may enter into forward swap contracts, which are generally less than one year in duration. We generally designate forward swap contracts with financial counter-parties as cash flow hedges. Any outstanding contracts are valued at market with the offset going to other comprehensive income (loss), net of applicable income taxes, and any material hedge ineffectiveness is recognized in cost of goods sold. Any gain or loss is recognized in cost of goods sold in the same period or periods during which the hedged transaction affects earnings. The fair value of our natural gas forward purchase contracts at December 31, 2015 and 2014 was a liability of $0.4 million and $12.9 million, respectively.
We also have other long-term supply contracts for raw materials, which are at prices not in excess of market, designed to assure a source of supply and not expected to be in excess of our normal manufacturing operations requirements. Historically, we have taken physical delivery under these contracts and we intend to take physical delivery in the future.
71
Table of Contents
Item 8. FINANCIAL STATEMENTS AND SUPPLEMENTARY DATA.
72
Table of Contents
Report of Independent Registered Public Accounting Firm
The Board of Directors and Shareholders of Axiall Corporation
We have audited the accompanying consolidated balance sheets of Axiall Corporation and subsidiaries (“the Company”) as of December 31, 2015 and 2014, and the related consolidated statements of operations, comprehensive income (loss), stockholders’ equity, and cash flows for each of the three years in the period ended December 31, 2015. These financial statements are the responsibility of the Company’s management. Our responsibility is to express an opinion on these financial statements based on our audits.
We conducted our audits in accordance with the standards of the Public Company Accounting Oversight Board (United States). Those standards require that we plan and perform the audit to obtain reasonable assurance about whether the financial statements are free of material misstatement. An audit includes examining, on a test basis, evidence supporting the amounts and disclosures in the financial statements. An audit also includes assessing the accounting principles used and significant estimates made by management, as well as evaluating the overall financial statement presentation. We believe that our audits provide a reasonable basis for our opinion.
In our opinion, the financial statements referred to above present fairly, in all material respects, the consolidated financial position of the Company at December 31, 2015 and 2014, and the consolidated results of their operations and their cash flows for the three years in the period ended December 31, 2015, in conformity with U.S. generally accepted accounting principles.
We also have audited, in accordance with the standards of the Public Company Accounting Oversight Board (United States), the Company’s internal control over financial reporting as of December 31, 2015, based on criteria established in Internal Control-Integrated Framework issued by the Committee of Sponsoring Organizations of the Treadway Commission (2013 framework) and our report dated February 26, 2016 expressed an unqualified opinion thereon.
/s/ Ernst & Young LLP
Atlanta, Georgia
February 26, 2016
73
Table of Contents
Axiall Corporation
Consolidated Balance Sheets
| December 31, | ||||||||
| (In millions, except share data) | 2015 | 2014 | ||||||
| Assets: |
||||||||
| Cash and cash equivalents |
$ | 258.0 | $ | 166.8 | ||||
| Receivables, net of allowance for doubtful accounts of $6.9 million at |
365.9 | 430.6 | ||||||
| Inventories |
298.4 | 321.9 | ||||||
| Prepaid expenses and other |
59.7 | 89.7 | ||||||
| Deferred income taxes |
- | 28.0 | ||||||
| Current assets of discontinued operations |
8.0 | 68.2 | ||||||
|
|
|
|
|
|||||
| Total current assets |
990.0 | 1,105.2 | ||||||
| Property, plant and equipment, net |
1,617.6 | 1,636.1 | ||||||
| Goodwill |
852.1 | 1,741.0 | ||||||
| Customer relationships, net |
950.3 | 1,024.5 | ||||||
| Other intangible assets, net |
63.4 | 68.1 | ||||||
| Non-current assets of discontinued operations |
- | 29.6 | ||||||
| Other assets, net |
66.0 | 51.5 | ||||||
|
|
|
|
|
|||||
| Total assets |
$ | 4,539.4 | $ | 5,656.0 | ||||
|
|
|
|
|
|||||
| Liabilities and Equity: |
||||||||
| Current portion of long-term debt |
$ | 2.5 | $ | 2.8 | ||||
| Accounts payable |
247.7 | 264.6 | ||||||
| Interest payable |
15.4 | 15.2 | ||||||
| Income taxes payable |
2.2 | 3.1 | ||||||
| Accrued compensation |
43.0 | 33.3 | ||||||
| Other accrued liabilities |
97.0 | 132.5 | ||||||
| Current liabilities of discontinued operations |
8.3 | 32.6 | ||||||
|
|
|
|
|
|||||
| Total current liabilities |
416.1 | 484.1 | ||||||
| Long-term debt, excluding the current portion of long-term debt |
1,364.5 | 1,309.5 | ||||||
| Lease financing obligation |
79.6 | 94.2 | ||||||
| Deferred income taxes |
683.0 | 767.5 | ||||||
| Pension and other post-retirement benefits |
202.8 | 250.5 | ||||||
| Non-current liabilities of discontinued operations |
- | 3.8 | ||||||
| Other non-current liabilities |
140.3 | 157.4 | ||||||
|
|
|
|
|
|||||
| Total liabilities |
2,886.3 | 3,067.0 | ||||||
|
|
|
|
|
|||||
| Commitments and contingencies |
||||||||
| Equity: |
||||||||
| Preferred stock—$0.01 par value; 75,000,000 shares |
- | - | ||||||
| Common stock—$0.01 par value; shares authorized: |
|
0.7 |
|
|
0.7 |
| ||
| Additional paid-in capital |
2,287.5 | 2,284.3 | ||||||
| Retained earnings (deficit) |
(591.9) | 269.8 | ||||||
| Accumulated other comprehensive loss, net of tax |
(118.0) | (73.7) | ||||||
|
|
|
|
|
|||||
| Total Axiall stockholders’ equity |
1,578.3 | 2,481.1 | ||||||
| Noncontrolling interest |
74.8 | 107.9 | ||||||
|
|
|
|
|
|||||
| Total equity |
1,653.1 | 2,589.0 | ||||||
|
|
|
|
|
|||||
| Total liabilities and equity |
$ | 4,539.4 | $ | 5,656.0 | ||||
|
|
|
|
|
|||||
See accompanying notes to consolidated financial statements.
74
Table of Contents
Axiall Corporation
Consolidated Statements of Operations
| Year Ended December 31, | ||||||||||||
| (In millions, except per share data) |
2015 | 2014 | 2013 | |||||||||
| Net sales |
$ | 3,361.1 | $ | 3,808.8 | $ | 3,767.2 | ||||||
| Operating costs and expenses: |
||||||||||||
| Cost of sales |
2,968.9 | 3,292.3 | 3,059.4 | |||||||||
| Selling, general and administrative expenses |
299.7 | 305.6 | 294.5 | |||||||||
| Restructuring and divestiture costs |
23.3 | 19.8 | 20.8 | |||||||||
| Integration-related costs and other, net |
16.0 | 32.2 | 32.6 | |||||||||
| Goodwill impairment charges |
864.1 | 4.1 | 18.2 | |||||||||
|
|
|
|
|
|
|
|||||||
| Total operating costs and expenses |
4,172.0 | 3,654.0 | 3,425.5 | |||||||||
|
|
|
|
|
|
|
|||||||
| Operating income (loss) |
(810.9) | 154.8 | 341.7 | |||||||||
| Interest expense |
(78.1) | (76.5) | (77.6) | |||||||||
| Debt refinancing costs |
(3.2) | - | (78.5) | |||||||||
| Gain on acquisition of controlling interest |
- | - | 25.9 | |||||||||
| Foreign exchange loss |
(1.2) | (0.6) | - | |||||||||
| Interest income |
0.4 | 0.7 | 1.0 | |||||||||
|
|
|
|
|
|
|
|||||||
| Income (loss) from continuing operations before income taxes |
(893.0) | 78.4 | 212.5 | |||||||||
| Provision for (benefit from) income taxes |
(43.9) | 14.3 | 62.9 | |||||||||
|
|
|
|
|
|
|
|||||||
| Net income (loss) from continuing operations |
(849.1) | 64.1 | 149.6 | |||||||||
| Discontinued operations: |
||||||||||||
| Income (loss) from discontinued operations |
14.7 | (20.7) | 29.1 | |||||||||
| Less: Provision for (benefit from) income taxes of |
2.7 | (6.8) | 10.7 | |||||||||
|
|
|
|
|
|
|
|||||||
| Net income (loss) from discontinued operations |
12.0 | (13.9) | 18.4 | |||||||||
|
|
|
|
|
|
|
|||||||
| Consolidated net income (loss) |
(837.1) | 50.2 | 168.0 | |||||||||
| Less: net income (loss) attributable to noncontrolling interest |
(20.7) | 3.9 | 2.7 | |||||||||
|
|
|
|
|
|
|
|||||||
| Net income (loss) attributable to Axiall |
$ | (816.4) | $ | 46.3 | $ | 165.3 | ||||||
|
|
|
|
|
|
|
|||||||
| Basic earnings (loss) per share attributable to Axiall: |
||||||||||||
| Earnings (loss) per share from continuing operations |
$ | (11.76) | $ | 0.86 | $ | 2.19 | ||||||
| Earnings (loss) per share from discontinued operations |
0.17 | (0.20) | 0.27 | |||||||||
|
|
|
|
|
|
|
|||||||
| Earnings (loss) per share attributable to Axiall |
$ | (11.59) | $ | 0.66 | $ | 2.46 | ||||||
|
|
|
|
|
|
|
|||||||
| Diluted earnings (loss) per share attributable to Axiall: |
||||||||||||
| Earnings (loss) per share from continuing operations |
$ | (11.76) | $ | 0.85 | $ | 2.17 | ||||||
| Earnings (loss) per share from discontinued operations |
0.17 | (0.20) | 0.27 | |||||||||
|
|
|
|
|
|
|
|||||||
| Earnings (loss) per share attributable to Axiall |
$ | (11.59) | $ | 0.65 | $ | 2.44 | ||||||
|
|
|
|
|
|
|
|||||||
| Weighted average common shares outstanding: |
||||||||||||
| Basic |
70.4 | 70.1 | 67.3 | |||||||||
| Diluted |
70.4 | 70.6 | 67.8 | |||||||||
| Dividends per common share |
$ | 0.64 | $ | 0.64 | $ | 0.48 | ||||||
See accompanying notes to consolidated financial statements.
75
Table of Contents
Axiall Corporation
Consolidated Statements of Comprehensive Income (Loss)
| Year Ended December 31, | ||||||||||||
| (In millions) |
2015 | 2014 | 2013 | |||||||||
| Consolidated net income (loss) |
$ | (837.1) | $ | 50.2 | $ | 168.0 | ||||||
| Less: net income (loss) attributable to noncontrolling interest |
(20.7) | 3.9 | 2.7 | |||||||||
|
|
|
|
|
|
|
|||||||
| Net income (loss) attributable to Axiall |
(816.4) | 46.3 | 165.3 | |||||||||
| Other comprehensive income (loss): |
||||||||||||
| Foreign currency translation adjustments |
(82.5) | (57.7) | (34.7) | |||||||||
| Derivative cash flow hedges |
14.1 | (11.8) | (1.4) | |||||||||
| Pension and OPEB plan liability adjustments |
25.1 | (168.6) | 173.4 | |||||||||
|
|
|
|
|
|
|
|||||||
| Other comprehensive income (loss), before income taxes |
(43.3) | (238.1) | 137.3 | |||||||||
| Provision for (benefit from) income taxes related |
5.0 | (90.4) | 49.1 | |||||||||
|
|
|
|
|
|
|
|||||||
| Other comprehensive income (loss), net of tax |
(48.3) | (147.7) | 88.2 | |||||||||
| Other comprehensive loss attributable to noncontrolling interest, net of tax |
(4.0) | (7.7) | - | |||||||||
|
|
|
|
|
|
|
|||||||
| Other comprehensive income (loss) attributable to Axiall, net of tax |
(44.3) | (140.0) | 88.2 | |||||||||
| Comprehensive income (loss), net of income taxes |
(885.4) | (97.5) | 256.2 | |||||||||
| Less: comprehensive income (loss) attributable to noncontrolling interest |
(24.7) | (3.8) | 2.7 | |||||||||
|
|
|
|
|
|
|
|||||||
| Comprehensive income (loss) attributable to Axiall |
$ | (860.7) | $ | (93.7) | $ | 253.5 | ||||||
|
|
|
|
|
|
|
|||||||
See accompanying notes to consolidated financial statements.
76
Table of Contents
Axiall Corporation
Consolidated Statements of Stockholders’ Equity
| (In millions) |
Common Stock Shares |
Common Stock Amount |
Additional Paid-In Capital |
Retained Earnings (Deficit) |
Accumulated Other Comprehensive Income (Loss) |
Total Axiall Shareholders’ Equity |
Noncontrolling Interest |
Total Equity | ||||||||||||||||||||||||
| Balance, January 1, 2013 |
34.6 | $ | 0.3 | $ | 487.1 | $ | 138.0 | $ | (21.9) | $ | 603.5 | $ | - | $ | 603.5 | |||||||||||||||||
| Consolidated net income |
- | - | - | 165.3 | - | 165.3 | 2.7 | 168.0 | ||||||||||||||||||||||||
| Dividends declared ($0.48 per share) |
- | - | - | (34.0) | - | (34.0) | - | (34.0) | ||||||||||||||||||||||||
| Distribution to noncontrolling interest |
- | - | - | - | - | - | (13.3) | (13.3) | ||||||||||||||||||||||||
| Other comprehensive income |
- | - | - | - | 88.2 | 88.2 | - | 88.2 | ||||||||||||||||||||||||
| Issuance of common stock and replacement share-based awards in connection with merger |
35.2 | 0.4 | 1,774.9 | - | - | 1,775.3 | - | 1,775.3 | ||||||||||||||||||||||||
| Noncontrolling interest recognized in connection with the merger |
- | - | - | - | - | - | 130.0 | 130.0 | ||||||||||||||||||||||||
| Employee stock purchase and stock compensation plans, net of forfeitures |
0.1 | - | 11.6 | - | - | 11.6 | - | 11.6 | ||||||||||||||||||||||||
| Other Share-based compensation plan activity |
- | - | (1.0) | - | - | (1.0) | - | (1.0) | ||||||||||||||||||||||||
|
|
|
|
|
|
|
|
|
|
|
|
|
|
|
|
|
|||||||||||||||||
| Balance, December 31, 2013 |
69.9 | 0.7 | 2,272.6 | 269.3 | 66.3 | 2,608.9 | 119.4 | 2,728.3 | ||||||||||||||||||||||||
| Consolidated net income |
- | - | - | 46.3 | - | 46.3 | 3.9 | 50.2 | ||||||||||||||||||||||||
| Dividends declared ($0.64 per share) |
- | - | - | (45.6) | - | (45.6) | - | (45.6) | ||||||||||||||||||||||||
| Distribution to noncontrolling interest |
- | - | - | - | - | - | (7.7) | (7.7) | ||||||||||||||||||||||||
| Other comprehensive loss |
- | - | - | - | (140.0) | (140.0) | (7.7) | (147.7) | ||||||||||||||||||||||||
| Employee stock purchase and stock compensation plans, net of forfeitures |
0.3 | - | 17.0 | - | - | 17.0 | - | 17.0 | ||||||||||||||||||||||||
| Other Share-based compensation plan activity |
- | - | (5.3) | (0.2) | - | (5.5) | - | (5.5) | ||||||||||||||||||||||||
|
|
|
|
|
|
|
|
|
|
|
|
|
|
|
|
|
|||||||||||||||||
| Balance, December 31, 2014 |
70.2 | 0.7 | 2,284.3 | 269.8 | (73.7) | 2,481.1 | 107.9 | 2,589.0 | ||||||||||||||||||||||||
| Consolidated net loss |
- | - | - | (816.4) | - | (816.4) | (20.7) | (837.1) | ||||||||||||||||||||||||
| Dividends declared ($0.64 per share) |
- | - | - | (45.3) | - | (45.3) | - | (45.3) | ||||||||||||||||||||||||
| Distribution to noncontrolling interest |
- | - | - | - | - | - | (8.4) | (8.4) | ||||||||||||||||||||||||
| Other comprehensive loss |
- | - | - | - | (44.3) | (44.3) | (4.0) | (48.3) | ||||||||||||||||||||||||
| Employee stock purchase and stock compensation plans, net of forfeitures |
0.4 | - | 10.2 | - | - | 10.2 | - | 10.2 | ||||||||||||||||||||||||
| Other Share-based compensation plan activity |
- | - | (7.0) | - | - | (7.0) | - | (7.0) | ||||||||||||||||||||||||
|
|
|
|
|
|
|
|
|
|
|
|
|
|
|
|
|
|||||||||||||||||
| Balance, December 31, 2015 |
70.6 | $ | 0.7 | $ | 2,287.5 | $ | (591.9) | $ | (118.0) | $ | 1,578.3 | $ | 74.8 | $ | 1,653.1 | |||||||||||||||||
|
|
|
|
|
|
|
|
|
|
|
|
|
|
|
|
|
|||||||||||||||||
See accompanying notes to consolidated financial statements.
77
Table of Contents
Axiall Corporation
Consolidated Statements of Cash Flows
| Year Ended December 31, | ||||||||||||
| (In millions) |
2015 | 2014 | 2013 | |||||||||
| Cash flows from operating activities: |
||||||||||||
| Consolidated net income (loss) |
$ | (837.1) | $ | 50.2 | $ | 168.0 | ||||||
| Less income (loss) from discontinued operations, net of tax |
12.0 | (13.9) | 18.4 | |||||||||
|
|
|
|
|
|
|
|||||||
| Income (loss) from continuing operations |
(849.1) | 64.1 | 149.6 | |||||||||
|
|
|
|
|
|
|
|||||||
| Adjustments to reconcile consolidated net income (loss) |
||||||||||||
| Depreciation |
175.3 | 169.7 | 147.1 | |||||||||
| Amortization |
73.2 | 74.8 | 69.7 | |||||||||
| Deferred income taxes |
(42.2) | (18.9) | (55.9) | |||||||||
| Gain on acquisition of controlling interest |
- | - | (25.9) | |||||||||
| Loss on debt refinancing costs |
- | - | 78.5 | |||||||||
| Goodwill impairment charges |
864.1 | 4.1 | 18.2 | |||||||||
| Other long-lived asset impairment charges, net |
3.0 | 13.5 | 17.8 | |||||||||
| Other non-cash items |
(3.6) | 13.0 | 5.1 | |||||||||
| Change in operating assets and liabilities: |
||||||||||||
| Receivables |
58.8 | 44.4 | (21.7) | |||||||||
| Inventories |
7.5 | 11.5 | (59.5) | |||||||||
| Prepaid expenses and other |
8.0 | (42.3) | (4.6) | |||||||||
| Accounts payable |
(21.7) | (25.0) | 12.6 | |||||||||
| Interest payable |
0.1 | (0.1) | (3.5) | |||||||||
| Accrued income taxes |
1.2 | (10.6) | (5.4) | |||||||||
| Accrued compensation |
11.0 | (27.1) | (2.7) | |||||||||
| Other accrued liabilities |
(20.3) | 11.7 | (21.2) | |||||||||
| Other |
(12.9) | (6.4) | 4.6 | |||||||||
|
|
|
|
|
|
|
|||||||
| Cash provided by operating activities - continuing operations |
252.4 | 276.4 | 302.8 | |||||||||
| Cash provided by operating activities - discontinued operations |
14.7 | 14.7 | 22.9 | |||||||||
|
|
|
|
|
|
|
|||||||
| Net cash provided by operating activities |
267.1 | 291.1 | 325.7 | |||||||||
|
|
|
|
|
|
|
|||||||
| Cash flows from investing activities: |
||||||||||||
| Capital expenditures |
(196.7) | (202.5) | (189.0) | |||||||||
| Proceeds from sale of assets and other |
8.6 | 6.7 | 11.4 | |||||||||
| Acquisitions, net of cash acquired |
- | (6.1) | 45.1 | |||||||||
|
|
|
|
|
|
|
|||||||
| Cash used in investing activities - continuing operations |
(188.1) | (201.9) | (132.5) | |||||||||
| Cash provided by (used in) investing activities - discontinued operations |
46.4 | (6.6) | (7.1) | |||||||||
|
|
|
|
|
|
|
|||||||
| Net cash used in investing activities |
(141.7) | (208.5) | (139.6) | |||||||||
|
|
|
|
|
|
|
|||||||
| Cash flows from financing activities: |
||||||||||||
| Borrowings on ABL revolver |
- | 148.9 | 402.5 | |||||||||
| Repayments on ABL revolver |
- | (148.9) | (402.5) | |||||||||
| Issuance of long-term debt |
248.8 | - | 450.0 | |||||||||
| Long-term debt payments |
(197.7) | (5.8) | (531.8) | |||||||||
| Deferred acquisition payments |
(10.0) | (10.0) | - | |||||||||
| Fees paid related to financing activities |
(4.1) | (2.2) | (98.1) | |||||||||
| Dividends paid |
(45.7) | (45.0) | (22.2) | |||||||||
| Distribution to noncontrolling interest |
(8.4) | (7.7) | (13.3) | |||||||||
| Share-based compensation plan activity |
(6.0) | (4.6) | (0.8) | |||||||||
|
|
|
|
|
|
|
|||||||
| Net cash used in financing activities |
(23.1) | (75.3) | (216.2) | |||||||||
|
|
|
|
|
|
|
|||||||
| Effect of exchange rate changes on cash and cash equivalents |
(11.1) | (7.0) | (3.7) | |||||||||
|
|
|
|
|
|
|
|||||||
| Net change in cash and cash equivalents |
91.2 | 0.3 | (33.8) | |||||||||
| Cash and cash equivalents at beginning of year |
166.8 | 166.5 | 200.3 | |||||||||
|
|
|
|
|
|
|
|||||||
| Cash and cash equivalents at end of year |
$ | 258.0 | $ | 166.8 | $ | 166.5 | ||||||
|
|
|
|
|
|
|
|||||||
Significant non-cash transaction
On January 28, 2013, we acquired substantially all of the assets and liabilities of PPG Industries, Inc.’s (“PPG”) business relating to the production of chlorine, caustic soda and related chemicals (the “Merged Business” or the “PPG Chlor-alkali and derivatives Business”), through a merger between a subsidiary of PPG and a subsidiary of the Company (the “Merger”). The purchase price for these transactions was approximately $2.8 billion and consisted of: (i) the issuance of approximately 35.2 million shares of our common stock valued at approximately $1.8 billion; (ii) the assumption of $967.0 million of debt; and (iii) the assumption of certain other liabilities including pension and OPEB obligations.
See accompanying notes to consolidated financial statements.
78
Table of Contents
Axiall Corporation
Notes to Consolidated Financial Statements
1. SUMMARY OF SIGNIFICANT ACCOUNTING POLICIES AND NATURE OF BUSINESS
Principles of Consolidation. The consolidated financial statements include the accounts of Axiall Corporation (“Axiall,” the “Company,” “we,” “us” or “our”) and its consolidated subsidiaries. All significant intercompany balances and transactions have been eliminated in consolidation. Investments in unconsolidated affiliates, which are 50 percent owned and do not otherwise meet consolidation requirements, are accounted for using the equity method. Investments in unconsolidated affiliates, which are less than 20 percent owned, are accounted for under the cost method. Certain prior period amounts have been reclassified to conform to the current period’s presentation.
Sale of Aromatics Business-Discontinued Operations. On September 30, 2015, the Company entered into and consummated the transactions contemplated by an asset purchase agreement (the “Asset Purchase Agreement”) between INEOS Americas LLC (“INEOS”) and Axiall LLC, a wholly-owned subsidiary of the Company. Pursuant to the Asset Purchase Agreement, INEOS acquired certain assets used in the Company’s aromatics business, including but not limited to, its cumene production facility located in Pasadena, Texas. The Company retained the land and plant at its phenol, acetone and alpha-methylstyrene production facility located in Plaquemine, Louisiana (the “Plaquemine Phenol Facility”), which is part of a broader set of other Axiall chemical manufacturing facilities located in Plaquemine. In addition, the Company retained the following assets associated with its aromatics business: (i) cash and cash equivalents; (ii) accounts receivable; and (iii) inventory, other than certain raw materials and work-in-process inventory at its Pasadena facility. The Company has discontinued the manufacture of products at its Plaquemine Phenol Facility and expects to dismantle and shutdown that facility. The Company concluded that it met the accounting requirements for reporting the financial position, results of operations and cash flows of its former aromatics business as discontinued operations when the sale was consummated. Refer to Note 3 for additional information relating to this sale of our aromatics business assets.
The accompanying consolidated balance sheets, statements of operations and statements of cash flows as of and for the years ended December 31, 2015, 2014 and 2013, and the related Notes to the Consolidated Financial Statements have been adjusted to reflect the presentation of the financial position, results of operations and cash flows of the former aromatics business as discontinued operations. The adjustments did not impact the Company’s consolidated net income (loss) attributable to Axiall.
Deferred Debt Issuance Costs. During the year ended December 31, 2015, the Company retrospectively adopted the provisions of Accounting Standards (“ASU” or “Update”) 2015-03—Interest-Imputation of Interest. The amendments in this Update simplify the presentation of debt issuance costs by requiring debt issuance costs related to a recognized debt liability to be presented on the balance sheet as a direct deduction from the carrying amount of the related debt liability, similar to the accounting treatment for debt discounts. The Company did not reclassify debt issuance costs related to its asset-based revolving credit facility (the “ABL Revolver”) as there was no outstanding balance for the ABL Revolver as of December 31, 2015 and will not reclassify such costs in future periods if a balance exists. All other debt issuance costs were reclassified from “other assets” in our consolidated balance sheets to a contra account to offset the respective debt instruments. Deferred debt issuance costs are amortized to interest expense using the effective interest rate method over the term of the related debt instruments. Refer to Note 5 for additional information relating to the adoption of this ASU.
79
Table of Contents
Nature of Operations. We are a leading North American manufacturer and international marketer of chemicals and building products. Our chlorovinyls segment produces a highly integrated chain of chlor-alkali and derivative products (chlorine, caustic soda, vinyl chloride monomer (“VCM”), vinyl resins, ethylene dichloride, chlorinated solvents, calcium hypochlorite, and muriatic acid (“HCL”)) and compound products (vinyl compounds and compound additives and plasticizers). Our building products segment manufactures window and door profiles, trim, mouldings, deck products, siding and exterior accessories and pipe and pipe fittings. Our vinyl-based home improvement and building products are marketed under the Royal Building Products®, Celect®—a Cellular Siding Collection, Zuri Premium Decking®, Kor Flo®, Overture® patio doors, Genesis Cellular Window System®, Royal S4S Trim Board® and Exterior Portfolio® brand names.
Use of Estimates. Management is required to make estimates and assumptions that affect amounts reported in the consolidated financial statements and accompanying notes prepared in conformity with generally accepted accounting principles in the United States of America. Actual results could differ from those estimates.
Cash and Cash Equivalents. Marketable securities that are highly liquid with an original maturity of 90 days or less are considered to be the equivalent of cash for the purpose of financial statement presentation.
Accounts Receivable and Allowance for Doubtful Accounts. We grant credit to customers under credit terms that are customary in the industry and based on the creditworthiness of the customer and generally do not require collateral. We also provide allowances for cash discounts and doubtful accounts based on contract terms, historical collection experience, periodic evaluations of the aging of accounts receivable and specific collectability analysis. Individual accounts are written-off once we have determined we have exhausted our collection efforts and the account is deemed not collectable. Activity in our allowance for doubtful accounts during the years ended December 31, 2015, 2014 and 2013 is set forth in the table below:
| (In millions) |
Balance at beginning of period |
Charged to costs and expenses, net of recoveries |
Charged to other accounts(1) |
Deductions(2) | Balance at end of period |
|||||||||||||||
| 2015 |
||||||||||||||||||||
| Allowance for doubtful accounts |
$ | 5.6 | $ | 2.3 | $ | (0.3) | $ | (0.7) | $ | 6.9 | ||||||||||
| 2014 |
||||||||||||||||||||
| Allowance for doubtful accounts |
5.5 | 0.9 | (0.1) | (0.7) | 5.6 | |||||||||||||||
| 2013 |
||||||||||||||||||||
| Allowance for doubtful accounts |
4.5 | 3.4 | (0.1) | (2.3) | 5.5 | |||||||||||||||
| (1) | Represents the foreign currency translation due to the change in exchange rate during the period. |
| (2) | Accounts receivable balances written off during the period, net of recoveries. |
Inventories. Inventories are valued at the lower of cost or net realizable value. Cost is determined using the first-in, first-out method for the majority of inventory and the weighted average cost method for the remainder. Costs include raw materials, direct labor and manufacturing overhead. Net realizable value is based on the estimated sales price in the ordinary course of business, less reasonably predictable cost of completion, disposal, and transportation. At December 31, 2015 and 2014, we had approximately $12.3 million and $17.3 million, respectively, of inventory on consignment.
Property, Plant and Equipment. Property, plant and equipment are stated at cost. Maintenance and repairs are charged to expense as incurred, and major renewals and improvements are capitalized. Interest expense attributable to funds used in financing the construction of major plant and equipment
80
Table of Contents
is capitalized. Interest cost capitalized during the years ended December 31, 2015, 2014 and 2013 was $1.1 million, $1.5 million and $0.7 million, respectively. Depreciation is computed using the straight-line method over the estimated useful lives of the assets. Depreciation expense totaled approximately $175.3 million, $169.7 million and $147.1 million for the years ended December 31, 2015, 2014 and 2013, respectively.
As of December 31, 2015, the estimated useful lives of our assets are as follows:
| Buildings |
27-39 years | |||
| Land improvements |
15-25 years | |||
| Chemical manufacturing plants |
25 years | |||
| Machinery and equipment |
2-25 years | |||
| Dies and moulds |
3-10 years | |||
| Office furniture and equipment |
2-10 years | |||
| Computer equipment and software |
3-10 years |
Long-Lived Assets. Our long-lived assets consist of property, plant and equipment, as well as intangible assets with definite lives. Our intangible assets with definite-lives include customer relationships, supply contracts, technology, and trade names that are identified during acquisitions. Long-lived assets are amortized on a straight-line basis over their estimated useful lives. Our long-lived assets are reviewed for indicators of impairment whenever events or changes in circumstances indicate that the carrying value may not be recoverable. The evaluation is performed at the lowest level of identifiable cash flows. If our undiscounted cash flows do not exceed the carrying value and the carrying value of the asset exceeds its estimated fair value, an impairment charge is recognized for the amount by which the carrying value of the asset exceeds its estimated fair value. Assets held for sale are recorded at the lower of the carrying value or fair value, less costs to sell, and are no longer depreciated.
Indefinite-Lived Intangible Assets. Our indefinite-lived intangible assets consist only of trade names. The fair values of our trade names are estimated based on the relief from royalty method under the income approach, using a discounted cash flow analysis.
Goodwill. Goodwill is the excess of cost of an acquired entity over the amounts specifically assigned to assets acquired and liabilities assumed in acquisition accounting for business combinations.
Valuation of Goodwill and Indefinite-Lived Intangible Assets: The carrying values of our goodwill and indefinite-lived intangible assets are tested for impairment annually in the fourth quarter, using a measurement date of October 1. In addition, we evaluate the carrying value of these assets for impairment between annual impairment tests if an event occurs or circumstances change that would indicate the carrying value may be impaired. Such events and indicators may include, without limitation, significant declines in industries in which our products are used, significant changes in the estimated future cash flows of our reporting units, significant changes in capital market conditions and significant changes in our market capitalization. Certain factors including but not limited to a sustained decline in our market capitalization below our book value or prolonged deterioration in our industry or market conditions could lead us to determine, in a future period, that an impairment test would be required and result in an impairment charge, which could have a negative impact on our result of operations.
Impairment testing for goodwill is a two-step test performed at a reporting unit level. The first step (“Step-1”) of the impairment analysis involves comparing the fair value of the reporting unit to its book value, including goodwill. If the fair value of the reporting unit exceeds the book value, goodwill is not considered impaired. If the book value exceeds the fair value, the second step (“Step-2”) of the impairment analysis is performed, in which we measure the amount of impairment. Our goodwill evaluations utilize discounted cash flow analyses and market multiple analyses in estimating fair value.
81
Table of Contents
The weighting of the discounted cash flow and market approaches varies by each reporting unit based on factors specific to each reporting unit. Inherent in our fair value determinations are certain judgments and estimates relating to future cash flows, including our interpretation of current economic indicators and market conditions, overall economic conditions and our strategic operational plans with regard to our business units. To the extent that significant changes occur in market conditions, overall economic conditions or our strategic operational plan, it is possible that goodwill not currently impaired, may become impaired in the future. Refer to Note 8 of the Notes to the Consolidated Financial Statements.
Other Assets. Other assets primarily consist of deferred income tax assets, investments, and assets held for sale. Our 20-percent to 50-percent owned investments are accounted for under the equity method of accounting and our investments that are less than 20-percent owned are accounted for under the cost method.
Warranty Costs. We provide warranties for certain building products against defects in material, performance and workmanship. We accrue for warranty claims at the time of sale based on historical warranty claims experience. Our warranty liabilities are included in other accrued liabilities and other non-current liabilities in the consolidated balance sheets. Activity in our warranty liabilities for the years ended December 31, 2015, 2014 and 2013 is as follows:
| (In millions) |
2015 | 2014 | 2013 | |||||||||
| Beginning balance, January 1, |
$ | 13.5 | $ | 12.6 | $ | 13.6 | ||||||
| Warranty provisions |
4.7 | 4.8 | 4.6 | |||||||||
| Foreign currency translation loss |
(1.3) | (0.5) | (0.4) | |||||||||
| Warranty claims paid |
(1.7) | (3.4) | (5.2) | |||||||||
|
|
|
|
|
|
|
|||||||
| Ending balance, December 31, |
$ | 15.2 | $ | 13.5 | $ | 12.6 | ||||||
|
|
|
|
|
|
|
|||||||
Self-Insurance Accruals. We are self-insured up to certain limits for costs associated with workers’ compensation and employee group medical coverage, as well as for our general liability and property and casualty coverage. Liabilities for insurance claims and reserves include accruals of estimated settlements for known claims, as well as accruals of estimates of incurred, but not reported claims. These accruals are included in other current liabilities and other non-current liabilities in the accompanying consolidated balance sheets. We also use information provided by independent consultants to assist in the determination of estimated accruals. In estimating these costs, we consider historical loss experience and make judgments about the expected levels of costs per claim.
Loss Contingencies. In the normal course of business, we are involved in legal proceedings and other matters that may result in loss contingencies. We accrue a liability for such matters when it is probable that a loss has been incurred and the amount of loss can be reasonably estimated.
Derivative Financial Instruments. The Company is directly and indirectly affected by changes in certain market conditions and market risks. When deemed appropriate, we use derivatives as a risk management tool to mitigate the potential impact of certain market risks. The primary market risks that may be managed by the Company through the use of derivative instruments are foreign currency exchange rate risk, commodity price risk and interest rate risk. As an integral part of our risk management program, we may manage our financial exposures to reduce the potentially adverse effect that the volatility of the commodity markets may have on our operating results. We do not engage in speculative transactions nor do we hold or issue financial instruments for trading purposes.
All derivative financial instruments are carried at fair value in our consolidated balance sheets. If the derivative financial instrument qualifies for hedge accounting treatment, changes in the fair value are either offset against the change in fair value of assets, liabilities or firm commitments through earnings or recognized in other comprehensive income (loss) until the hedged item is recognized in earnings.
82
Table of Contents
We also enter into derivative financial instruments that are designed to hedge risks but are not designated as hedging instruments. Changes in the fair value of these non-designated hedging instruments are adjusted to fair value through earnings in our consolidated statements of operations.
We formally document hedging instruments and hedging transactions, as well as our risk management objective and strategy for undertaking hedged transactions. This process includes linking derivative financial instruments that are designated as cash flow hedges to specific assets or liabilities on the consolidated balance sheet or linking derivatives to forecasted transactions. We also formally assess, both at inception and on an ongoing basis, whether the derivative financial instruments used in hedging transactions are highly effective in offsetting changes in the fair value or cash flows of hedged transactions. When it is determined that a derivative is not highly effective or the derivative is expired, sold, terminated, exercised, discontinued, or otherwise settled because it is unlikely that a forecasted transaction will occur, we discontinue the use of hedge accounting for that specific hedge derivative financial instrument.
Pension Plans and Other Post-Retirement Employment Benefit (“OPEB”) Plans. Accounting for employee pension and OPEB plans involves estimating the cost of benefits that are to be provided in the future and attempting to match, for each employee, that estimated cost to the period worked. To accomplish this, we make assumptions about discount rates, expected long-term rates of return on plan assets, salary increases, employee turnover and mortality rates, amongst others. We reevaluate all assumptions annually with our independent actuaries taking into consideration existing and forecasted economic conditions and our investment policy and strategy with regard to managing the plans. We believe our estimates, the most significant of which are presented in Note 14 to the Notes to the Consolidated Financial Statements, to be reasonable.
During the year ended December 31, 2015, the Company changed the accounting method used to estimate the interest and service cost components of net periodic cost for its U.S. Pension and OPEB plans. See Note 14 for a discussion of this change.
Asset Retirement Obligations. We account for asset retirement obligations based on the fair value of a liability for an asset retirement obligation and recognize it in the period in which it is incurred and capitalized as part of the carrying value of the long-lived asset. When a liability is initially recorded, we capitalize the cost by increasing the carrying value of the related long-lived asset. The liability is accreted to its future value each period, and the capitalized cost is depreciated over the estimated useful life of the related asset. Upon settlement of the liability, a gain or loss is recorded. As of December 31, 2015, we had $0.3 million and $31.6 million of asset retirement obligations recorded as other current, and other non-current liabilities, respectively, in the consolidated balance sheets and nil and $26.4 million recorded as other current, and other non-current liabilities, respectively, as of December 31, 2014.
Share-Based Compensation. Share-based payments to employees and non-employee directors, including grants of stock options, restricted stock units and director deferred shares, are recognized in the consolidated financial statements based on their respective fair values at the grant date. The Company recognizes the cost of all share-based awards on a straight-line basis over the vesting or service period of the award plus any incremental costs related to specialized vesting periods. Tax benefits relating to excess share-based compensation deductions are presented in the consolidated statements of cash flows as a financing activity cash inflow.
Foreign Currency Translation and Transactions. Our subsidiaries that operate outside the United States use their local currency as the functional currency. The functional currency is translated into United States dollars using the month-end exchange rates in effect as of the balance sheet date for balance sheet accounts and using the month-end average exchange rate of each respective period for revenue and expense accounts. The translation adjustments are deferred as a separate component of
83
Table of Contents
stockholders’ equity, within accumulated other comprehensive income (loss), net of tax where applicable. Gains or losses resulting from transactions denominated in foreign currencies are reported in the same financial statement captions as the underlying transactions in the consolidated statements of operations. The year-over-year fluctuations in foreign currency translation gains and losses are due to both the volume of foreign currency denominated transactions and the volatility in the underlying exchange rates.
Revenue Recognition. We recognize revenue when the following four basic criteria have been met: (i) persuasive evidence of an arrangement exists; (ii) the price is fixed or determinable; (iii) collectability is reasonably assured; and (iv) product delivery has occurred. We recognize revenue as products are shipped based on free on board (“FOB”) terms when title passes to customers, and the customer takes ownership and assumes the risk of loss.
Sales Incentives. We offer sales incentives, primarily in the form of volume rebates and advertising allowances, to our customers which are classified as a reduction of net sales and are calculated based on the contractual terms of customer contracts. We accrue for these sales incentives based on the contractual terms and our historical experience.
Shipping Costs. All amounts billed to a customer in a sale transaction related to shipping are classified as revenue. Shipping costs are included in cost of goods sold.
Selling General and Administrative Expenses. Amounts presented as selling, general and administrative expenses in the accompanying consolidated statements of operations are comprised of selling, customer service and costs of providing functional support in areas such as finance, law, human resources and planning.
Advertising Costs. Advertising costs and promotion expenses generally relate to our vinyl-based building products marketed under the Royal Building Products®, Celect® - a Cellular Siding Collection, Zuri Premium Decking®, Kor Flo®, Overture® patio doors, Genesis Cellular Window System®, Royal S4S Trim Board® and Exterior Portfolio® brand names and are charged to earnings during the period in which they are incurred. Advertising and promotion expenses are included in selling, general and administrative expenses and were $17.4 million, $18.7 million and $14.2 million, in the years ended December 31, 2015, 2014 and 2013, respectively.
Environmental Expenditures. Environmental expenditures related to current operations or future revenues are expensed or capitalized, consistent with our capitalization policy. Expenditures that relate to an existing condition caused by past operations and do not contribute to future revenues are expensed in the period incurred.
We monitor our estimate for reasonably possible environmental contingencies on a quarterly basis to determine if any of the reasonably possible environmental contingencies have become probable and estimable during the current quarter. It is our policy to accrue material expenses for environmental contingencies when management believes losses from the particular contingencies are probable and estimable. Reserves for environmental liabilities do not include any potential offsets related to claims against third parties.
Income Taxes. Income taxes are accounted for under the liability method. Deferred tax assets and liabilities are recognized for the future tax consequences attributable to differences between the financial statement carrying value of existing assets and liabilities and their respective tax bases. Deferred tax assets and liabilities are measured using enacted tax rates expected to apply to taxable income in the years in which those temporary differences are expected to be recovered or settled. The effect on deferred tax assets and liabilities of a change in tax rates is recognized in income in the period that includes the enactment date. We evaluate the realizability of deferred tax assets by
84
Table of Contents
assessing whether it is more likely than not that some or all of the deferred tax assets will not be realized. The ultimate realization of deferred tax assets depends on the generation of future taxable income during the periods in which those temporary differences are deductible. Management considers the scheduled reversal of deferred tax liabilities (including the impact of available carryback and carryforward periods), projected taxable income and tax-planning strategies available to us in making this assessment. If it is not more likely than not that we will realize a deferred tax asset, we record a valuation allowance against such asset. We use a similar evaluation for determining when to release previously recorded valuation allowances. We recognize tax benefits for uncertain tax positions when it is more likely than not, based upon the technical merits, that the position will be sustained upon examination. Uncertain tax positions and any related interest expense and penalties are recorded as a component of income tax expense in the consolidated statements of operations.
Basic earnings (loss) per share from continuing operations attributable to Axiall is based on the weighted-average number of common shares outstanding during the years ended December 31, 2015, 2014 and 2013. Diluted earnings (loss) per share from continuing operations attributable to Axiall is based on the weighted-average number of common shares outstanding during the years ended December 31, 2015, 2014 and 2013, adjusted for the dilutive effect of employee share-based compensation and other share-based compensation awards.
Due to the net loss from continuing operations in the year ended December 31, 2015, common stock equivalents of 0.4 million shares were excluded from the computation of diluted earnings (loss) per share due to their anti-dilutive effect. Certain of our restricted stock units participate in dividend distributions; however, the distributions for these restricted stock units do not have a material impact on our earnings (loss) per share calculation.
The following table provides a reconciliation of the numerators and denominators used to determine basic and diluted earnings (loss) per share from continuing operations attributable to Axiall and discontinued operations for the years ended December 31, 2015, 2014 and 2013:
| Year Ended December 31, | ||||||||||||
| (Amounts in millions) |
2015 | 2014 | 2013 | |||||||||
| Numerator |
||||||||||||
| Income (loss) from continuing operations |
$ | (849.1) | $ | 64.1 | $ | 149.6 | ||||||
| Less net income (loss) attributable to noncontrolling interest |
(20.7) | 3.9 | 2.7 | |||||||||
|
|
|
|
|
|
|
|||||||
| Income (loss) from continuing operations attributable to Axiall |
(828.4) | 60.2 | 146.9 | |||||||||
| Income (loss) from discontinued operations |
12.0 | (13.9) | 18.4 | |||||||||
|
|
|
|
|
|
|
|||||||
| Consolidated net income (loss) attributable to Axiall |
$ | (816.4) | $ | 46.3 | $ | 165.3 | ||||||
|
|
|
|
|
|
|
|||||||
| Denominator |
||||||||||||
| Weighted average common shares outstanding, basic |
70.4 | 70.1 | 67.3 | |||||||||
| Dilutive impact of stock options and other share-based awards |
- | 0.5 | 0.5 | |||||||||
|
|
|
|
|
|
|
|||||||
| Weighted average common shares outstanding, diluted |
70.4 | 70.6 | 67.8 | |||||||||
|
|
|
|
|
|
|
|||||||
| Year Ended December 31, | ||||||||||||
| 2015 | 2014 | 2013 | ||||||||||
| Basic earnings (loss) per share attributable to Axiall: |
||||||||||||
| Basic earnings (loss) per share from continuing operations attributable to Axiall |
$ | (11.76) | $ | 0.86 | $ | 2.19 | ||||||
| Basic earnings (loss) per share from discontinued operations |
0.17 | (0.20) | 0.27 | |||||||||
|
|
|
|
|
|
|
|||||||
| Basic earnings (loss) per share attributable to Axiall |
$ | (11.59) | $ | 0.66 | $ | 2.46 | ||||||
|
|
|
|
|
|
|
|||||||
| Diluted earnings (loss) per share attributable to Axiall: |
||||||||||||
| Diluted earnings (loss) per share from continuing operations attributable to Axiall |
$ | (11.76) | $ | 0.85 | $ | 2.17 | ||||||
| Diluted earnings (loss) per share from discontinued operations |
0.17 | (0.20) | 0.27 | |||||||||
|
|
|
|
|
|
|
|||||||
| Diluted earnings (loss) per share attributable to Axiall |
$ | (11.59) | $ | 0.65 | $ | 2.44 | ||||||
|
|
|
|
|
|
|
|||||||
85
Table of Contents
On September 30, 2015, the Company entered into and consummated the transactions contemplated by the Asset Purchase Agreement between INEOS and Axiall LLC, a wholly-owned subsidiary of the Company. Pursuant to the Asset Purchase Agreement, INEOS acquired certain assets used in the Company’s aromatics business, including but not limited to, its cumene production facility located in Pasadena, Texas. The Company retained the land and plant at its Plaquemine Phenol Facility, which is part of a broader set of other Axiall facilities located in Plaquemine. In addition, the Company retained the following assets associated with its aromatics business: (i) cash and cash equivalents; (ii) accounts receivable; and (iii) inventory, other than certain raw materials and work-in-process inventory at its Pasadena facility. The Company has discontinued the manufacture of products at its Plaquemine Phenol Facility and expects to dismantle and shutdown that facility.
At closing, the Company received $52.4 million in cash, which consisted of: (i) the selling price of $47.4 million; and (ii) a $5.0 million advance toward the cost of decommissioning and dismantling our Plaquemine Phenol Facility. That advance was recorded as a liability in our consolidated balance sheets. During the fourth quarter of 2015, the Company met certain terms and conditions set forth in the Asset Purchase Agreement that entitled us to receive $5.5 million of contingent consideration, pursuant to which we recorded $5.3 million, as a gain, net of a $0.2 million working capital adjustment, related to the sale. Further, the Company may receive an additional $5.0 million from INEOS to help defray the costs of decommissioning and dismantling the Plaquemine Phenol Facility. The Company’s receipt of all or any portion of the remaining $5.0 million that INEOS may be required to pay and our right to retain the $5.0 million advance payment will depend on the amount of costs incurred by us to decommission and dismantle the Plaquemine Phenol Facility. During 2015, the Company incurred $0.8 million of such costs and our remaining liability is $4.6 million as of December 31, 2015. For the year ended December 31, 2015, the Company recorded a pre-tax gain of $21.5 million on the sale of certain of our aromatics business assets, the net effect of which is reflected in income (loss) from discontinued operations on our consolidated statements of operations.
The following represents major classes of assets and liabilities related to the discontinued operations included in our consolidated balance sheets as of the following dates:
| Year Ended December 31, | ||||||||
| (In millions) |
2015 | 2014 | ||||||
| Receivables, net |
$ | 7.0 | $ | 36.4 | ||||
| Inventories |
1.0 | 31.8 | ||||||
| Property, plant and equipment, net |
- | 29.6 | ||||||
|
|
|
|
|
|||||
| Total assets |
$ | 8.0 | $ | 97.8 | ||||
|
|
|
|
|
|||||
| Accounts payable |
$ | 5.9 | $ | 30.9 | ||||
| Accrued compensation |
- | 0.3 | ||||||
| Other accrued liabilities |
2.4 | 1.4 | ||||||
| Non-current liabilities |
- | 3.8 | ||||||
|
|
|
|
|
|||||
| Total liabilities |
$ | 8.3 | $ | 36.4 | ||||
|
|
|
|
|
|||||
| Net assets (liabilities) |
$ | (0.3) | $ | 61.4 | ||||
86
Table of Contents
Operating results of the discontinued operations for the years ended December 31, 2015, 2014 and 2013 are shown below:
| Year Ended December 31, | ||||||||||||
| (In millions) |
2015 | 2014 | 2013 | |||||||||
| Net sales |
$ | 426.2 | $ | 759.9 | $ | 898.8 | ||||||
| Operating costs and expenses: |
||||||||||||
| Cost of sales |
429.4 | 775.8 | 865.0 | |||||||||
| Selling, general and administrative expenses |
3.6 | 4.8 | 4.7 | |||||||||
|
|
|
|
|
|
|
|||||||
| Total operating costs and expenses |
433.0 | 780.6 | 869.7 | |||||||||
|
|
|
|
|
|
|
|||||||
| Operating income (loss) from discontinued operations |
(6.8) | (20.7) | 29.1 | |||||||||
| Net gain from the sale of aromatics |
21.5 | - | - | |||||||||
|
|
|
|
|
|
|
|||||||
| Income (loss) from discontinued operations |
14.7 | (20.7) | 29.1 | |||||||||
| Provision for (benefit from) income taxes of discontinued operations |
2.7 | (6.8) | 10.7 | |||||||||
|
|
|
|
|
|
|
|||||||
| Net income (loss) from discontinued operations |
$ | 12.0 | $ | (13.9) | $ | 18.4 | ||||||
|
|
|
|
|
|
|
|||||||
Certain information pertaining to depreciation and amortization as well as capital expenditures associated with our discontinued operations for the years ended December 31, 2015, 2014 and 2013 are included below:
| Year Ended December 31, | ||||||||||||
| (In millions) |
2015 | 2014 | 2013 | |||||||||
| Depreciation and amortization |
$ | 1.9 | $ | 2.0 | $ | 1.2 | ||||||
| Capital expenditures |
1.0 | 8.0 | 7.1 | |||||||||
4. RESTRUCTURING AND DIVESTITURE COSTS
During the year ended December 31, 2015, the Company initiated restructuring and divestiture activities that included: (i) the sale of certain of our aromatics business assets; (ii) the reorganization of our building products segment, comprising workforce and other expense reduction initiatives to drive cost savings; and (iii) changes to our corporate management team.
Discontinued Operations - Aromatics
As discussed in Note 3, the Company expects to incur additional costs with respect to the decommissioning and dismantling of our Plaquemine Phenol Facility. Such costs, some of which may be capitalized, may exceed $20.0 million for which INEOS is obligated to reimburse the Company up to $10.0 million. The Company received $5.0 million of that amount as an advance upon the closing of the sale of the aromatics business. The Company’s receipt of all or any portion of the remaining $5.0 million that INEOS is required to pay and its right to retain the $5.0 million advance payment will depend on the amount of costs incurred by us in the decommissioning of the Plaquemine Phenol Facility.
Chlorovinyls
During the year ended December 31, 2015 and 2014, our chlorovinyls segment incurred divestiture and long-lived asset impairment charges of $0.4 million and $12.5 million, respectively, related to the exit and disposal activities of immaterial product lines in our chlorovinyls segment.
Building Products
In 2015, the building products segment initiated a formal plan of restructuring consisting of various cost savings initiatives, including the reduction of overhead, plant labor, and the consolidation of various plants, primarily in the outdoor building products group to improve utilization and efficiencies (the “2015 Building Products Restructuring Plan”). During the year ended December 31, 2015, our building
87
Table of Contents
products segment incurred restructuring and divestiture costs of $10.2 million which consisted of: (i) $5.1 million in severance and plant closure costs related to restructuring and workforce reduction charges; (ii) $2.8 million in long-lived asset impairment charges in both window and door profiles and outdoor building products; and (iii) $2.3 million in divestiture costs, primarily related to warranty costs that the Company honored for a previously disposed product line.
In 2013, we initiated a formal plan of restructuring in our building products segment consisting of various cost savings initiatives, including the reduction of overhead and plant labor, and the consolidation of various plants, primarily in the window and door profiles reporting unit, to improve utilization and efficiencies (the “2013 Building Products Restructuring Plan”). During the year ended December 31, 2014, the building products segment incurred: (i) $4.5 million in restructuring costs for severance related and other expense reduction costs to consolidate certain manufacturing operations; (ii) $1.8 million in warranty costs that the Company honored for a previously disposed product line; and (iii) $1.0 million to write-down certain long-lived assets to their estimated fair values associated with the consolidation of certain building product manufacturing facilities.
A synopsis of our charges under both the 2015 Building Products Restructuring Plan and the 2013 Building Products Restructuring Plan are as follows:
Year Ended December 31, 2015
| In millions |
Severance and Plant Closing Costs |
Impairment of Long-Lived Assets |
Divestitures | Total | ||||||||||||
| 2013 Building Products Restructuring Plan |
$ | 0.1 | $ | 0.4 | $ | - | $ | 0.5 | ||||||||
| 2015 Building Products Restructuring Plan |
5.0 | 2.4 | 2.3 | 9.7 | ||||||||||||
|
|
|
|
|
|
|
|
|
|||||||||
| Total |
$ | 5.1 | $ | 2.8 | $ | 2.3 | $ | 10.2 | ||||||||
|
|
|
|
|
|
|
|
|
|||||||||
Year Ended December 31, 2014
| In millions |
Severance and Plant Closing Costs |
Impairment of Long-Lived Assets |
Divestitures | Total | ||||||||||||
| 2013 Building Products Restructuring Plan |
$ | 4.5 | $ | 1.0 | $ | 1.8 | $ | 7.3 | ||||||||
|
|
|
|
|
|
|
|
|
|||||||||
| Total |
$ | 4.5 | $ | 1.0 | $ | 1.8 | $ | 7.3 | ||||||||
|
|
|
|
|
|
|
|
|
|||||||||
Year Ended December 31, 2013
| In millions |
Severance and Plant Closing Costs |
Impairment of Long-Lived Assets |
Divestitures | Total | ||||||||||||
| 2013 Building Products Restructuring Plan |
$ | 3.2 | $ | 3.6 | $ | - | $ | 6.8 | ||||||||
|
|
|
|
|
|
|
|
|
|||||||||
| Total |
$ | 3.2 | $ | 3.6 | $ | - | $ | 6.8 | ||||||||
|
|
|
|
|
|
|
|
|
|||||||||
Corporate
During the year ended December 31, 2015, the Company incurred $10.4 million in restructuring and divestiture costs that were recorded to Corporate Unallocated. These costs included: (i) restructuring charges totaling $8.9 million comprising $5.5 million primarily related to the separation of certain executives under the terms of the Company’s severance plans and policies, of which we paid $0.5 million during the year ended December 31, 2015. The payments under these separation
88
Table of Contents
arrangements are expected to conclude by November 2016. In addition, during the year ended December 31, 2015 the Company incurred $1.5 million in costs associated with the strategic review of our building products segment and related assets.
5. NEW ACCOUNTING PRONOUNCEMENTS
In November 2015, the Financial Accounting Standards Board (“FASB” or the “Board”) issued Accounting Standards Update (“ASU” or “Update”) 2015-17 – Income Taxes (Topic 740)-Balance Sheet Classification of Deferred Taxes. The Board issued this Update as part of its continuing initiative to reduce complexity in accounting standards and further align U.S. GAAP with International Financial Reporting Standards (“IFRS”). Current GAAP requires an entity to separate deferred income tax assets and liabilities into current and noncurrent amounts in a classified balance sheet. To simplify the presentation of deferred income taxes, the amendments in this Update require that deferred tax assets and liabilities be classified as noncurrent in a classified balance sheet. The current requirement to offset deferred tax assets and liabilities and present the net as a single amount is not affected by the amendments in this Update. The amendments in this Update may be applied either prospectively to all deferred tax assets and liabilities or retrospectively for all periods presented. If an entity applies the guidance prospectively, the entity should disclose in the first interim and first annual period of change, the nature of and reason for the change in accounting principle and a statement that prior periods were not retrospectively adjusted. The amendments in this Update are effective for annual periods, including interim periods, beginning after December 15, 2016. We have adopted the amendments in this Update prospectively.
In July 2015, the FASB issued ASU 2015-11 – Inventory (Topic 330). The amendments in this update apply to entities that measure inventory using the first-in, first-out or average cost methods. Under this guidance, such entities are required to measure inventory at the lower of cost or net realizable value. Net realizable value is the estimated selling price in the ordinary course of business, less the reasonably predictable costs of completion, disposal and transportation. Subsequent measurement is unchanged for inventory valued using the last-in, first-out and the retail inventory methods. The amendments in this Update are effective for annual periods, including interim periods, beginning after December 15, 2016. We have adopted the amendments in this Update and there was no impact on our consolidated financial statements.
In May 2015, the FASB issued ASU 2015-07 – Disclosures for Investments in Certain Entities That Calculate Net Asset Value per Share (or Its Equivalent) (Topic 820). The amendments in this Update removes the requirement to categorize within the fair value hierarchy, all investments for which fair value is measured using the net asset value per share practical expedient. The amendments also removes the requirement to make certain disclosures for all investments that are eligible to be measured at fair value, using the net asset value per share practical expedient. Rather, those disclosures are limited to investments for which the entity has elected to measure the fair value using that practical expedient. This ASU should be applied retrospectively for all periods presented. We have adopted the amendments in this Update retrospectively and there was no impact on our consolidated statements of operations.
In April 2015, the FASB issued ASU 2015-05 – Intangibles-Goodwill and Other-Internal-Use Software (Subtopic 350-40). The amendments in this Update provide explicit guidance to companies about fees paid in cloud-based computing arrangements for various hosting services. Previous GAAP guidance did not include such explicit direction. Specifically, the Update stipulates that if a cloud-based computing arrangement includes a software license, the company should account for the software license element of the arrangement consistent with the acquisition of other software licenses. If a cloud-based computing arrangement does not include a software license, the company should account for the arrangement as a service contract. The guidance does not change the accounting treatment for service contracts. However, all software licenses within the scope of this Update should be accounted for consistent with other licenses of intangible assets. The amendments in this Update are effective for
89
Table of Contents
annual periods, including interim periods, beginning after December 15, 2015, and early adoption is permitted. We have adopted the amendments in this Update prospectively and have determined there was no impact on our consolidated financial statements.
In April 2015, the FASB issued ASU 2015-03 –Interest-Imputation of Interest (Subtopic 835-30). The amendments in this Update simplify the presentation of debt issuance costs by requiring debt issuance costs related to a recognized debt liability to be presented on the balance sheet as a direct deduction from the carrying amount of the related debt liability, similar to the accounting treatment for debt discounts. The amendments in this Update are effective for financial statements issued for fiscal years beginning after December 15, 2015, and early adoption is permitted. We adopted the amendments to the Update which required us to reclassify approximately $15.9 million and $18.3 million of deferred financing fees as of December 31, 2015 and 2014, respectively, from other assets to long-term debt in our consolidated balance sheets. The Company did not reclassify debt issuance costs of $7.1 million and $7.9 million, for the years ended December 31, 2015 and 2014, respectively, related to the ABL Revolver as there was no outstanding balance for the ABL Revolver as of December 31, 2015 and 2014, and will not reclassify such costs in future periods where a balance exists. The adoption had no impact on our consolidated statements of operations.
In February 2015, the FASB issued ASU 2015-02 –Consolidation (Topic 810)-Amendments to the Consolidation Analysis to assist companies in evaluating whether certain legal entities should be consolidated. The ASU stipulates that all legal entities are subject to reevaluation under the revised consolidation model in the guidance. This Update reduces the number of consolidation models, simplifies the FASB Accounting Standards Codification and improves current GAAP by placing more emphasis on risk of loss when determining a controlling financial interest. A reporting organization may no longer have to consolidate a legal entity under certain circumstances based solely on its fee arrangement when certain criteria are met. This reduces the frequency of the application of related-party guidance when determining a controlling financial interest in a variable interest entity (“VIE”). The Update changes the consolidation conclusions for public and private companies in several industries that typically make use of limited partnerships or VIEs. The amendments in this Update are effective for annual periods, including interim periods, beginning after December 15, 2015. We have adopted the amendments in this Update and have determined there is no impact on our consolidated financial statements.
In June 2014, FASB issued ASU 2014-12 – Compensation-Stock Compensation (Topic 718). Under this Update: Accounting for Share-Based Payments When the Terms of an Award Provide That a Performance Target Could Be Achieved after the Requisite Service Period (a consensus of the FASB Emerging Issues Task Force), a performance target that affects vesting, and that could be achieved after the requisite service period, would be treated as a performance condition. GAAP did not address these issues. The Update states that a reporting entity should apply existing guidance in Topic 718 to account for awards with performance conditions that affect the vesting of such awards. As such, the performance target should not be reflected in estimating the grant-date fair value of the award. Compensation cost should be recognized in the period in which it becomes probable that the performance target will be achieved and should represent the compensation cost attributable to the periods for which the requisite service has already been rendered. If the performance target becomes probable of being achieved before the end of the requisite service period, the remaining unrecognized compensation cost should be recognized prospectively over the remaining requisite service period. The total amount of compensation cost recognized during and after the requisite service period should reflect the number of awards that are expected to vest and should be adjusted to reflect those awards that ultimately vest. The requisite service period ends when the employee can cease rendering service and still be eligible to vest in the award if the performance target is achieved. The stated vesting period (which includes the period in which the performance target could be achieved) may differ from the requisite service period. The amendments in this Update are effective for annual reporting periods
90
Table of Contents
beginning after December 15, 2015. We have adopted the amendments in this Update and have determined there was no impact on our consolidated financial statements.
In May 2014, the FASB issued ASU 2014-09 – Revenue from Contracts with Customers. The Update outlines a single, comprehensive model for entities to use in accounting for revenue arising from contracts with customers and supersedes most current revenue recognition guidance issued by the FASB, including industry specific guidance. The Update provides accounting guidance for all revenue arising from contracts with customers and affects all entities that enter into contracts with customers to provide goods and services. The guidance also provides a model for the measurement and recognition of gains and losses on the sale of certain nonfinancial assets, such as property and equipment, including real estate. In August 2015, the FASB issued ASU 2015-14 –Revenue from Contracts with Customers (Topic 606): Deferral of the Effective Date. This Update provides for a one year deferral of the effective date of ASU 2014-09. As a result, the Company expects that it will apply the new revenue standard to annual and interim reporting periods beginning after December 15, 2017. The new standard must be adopted using either a full retrospective approach for all periods presented in the period of adoption or a modified retrospective approach. The modified retrospective approach requires that the new standard be applied to all new and existing contracts as of the date of adoption, with a cumulative catch-up adjustment recorded to the opening balance of retained earnings at the effective date for existing contracts that still require performance by the entity. Under the modified retrospective approach, amounts reported prior to the date of adoption will be presented under existing guidance. The Update also requires entities to disclose both quantitative and qualitative information to enable users of the financial statements to understand the nature, amount, timing, and uncertainty of revenue and cash flows arising from contracts with customers. We have not yet determined the impact of adopting the standard on our consolidated financial statements, nor have we determined whether we will utilize the full retrospective or modified retrospective approach.
The major classes of inventories were as follows:
| December 31, | ||||||||
| (In millions) |
2015 | 2014 | ||||||
| Raw materials |
$ | 91.8 | $ | 109.8 | ||||
| Work-in-process |
1.6 | 2.6 | ||||||
| Finished goods |
205.0 | 209.5 | ||||||
|
|
|
|
|
|||||
| Inventories |
$ | 298.4 | $ | 321.9 | ||||
|
|
|
|
|
|||||
7. PROPERTY, PLANT AND EQUIPMENT, NET
As of December 31, 2015 and 2014, property, plant and equipment consisted of the following:
| December 31, | ||||||||
| (In millions) |
2015 | 2014 | ||||||
| Chemical manufacturing plants |
$ | 1,308.8 | $ | 1,299.5 | ||||
| Machinery and equipment |
1,175.1 | 1,080.0 | ||||||
| Buildings |
185.6 | 199.5 | ||||||
| Land and land improvements |
172.6 | 176.5 | ||||||
| Construction-in-progress |
114.1 | 84.6 | ||||||
|
|
|
|
|
|||||
| Property, plant and equipment, at cost |
2,956.2 | 2,840.1 | ||||||
| Less: accumulated depreciation |
1,338.6 | 1,204.0 | ||||||
|
|
|
|
|
|||||
| Property, plant and equipment, net |
$ | 1,617.6 | $ | 1,636.1 | ||||
|
|
|
|
|
|||||
91
Table of Contents
8. GOODWILL AND OTHER INTANGIBLE ASSETS
Our intangible assets consist of goodwill, customer relationships, supply contracts, technology, and trade names. Goodwill is the excess of the cost of an acquired entity over the fair value of tangible and intangible assets (including, but not limited to, customer relationships, supply contracts, technology, and trade names) acquired and liabilities assumed under acquisition accounting for business combinations.
As of December 31, 2015, our chlorovinyls segment includes goodwill in its chlor-alkali and derivatives and compound reporting units and our building products segment includes goodwill primarily in its siding reporting unit.
Valuation of Goodwill and Indefinite-Lived Intangible Assets. The carrying values of our goodwill and indefinite-lived intangible assets are tested for impairment annually in the fourth quarter, using a measurement date of October 1. In addition, we evaluate the carrying values of these assets for impairment between annual impairment tests if an event occurs or circumstances change that would more likely than not reduce the fair value of a reporting unit below its carrying amount. Such events and indicators may include, without limitation, significant declines in the industries in which our products are used, significant changes in the estimated future cash flows of our reporting units, significant changes in capital market conditions and significant changes in our market capitalization.
Impairment testing for goodwill is a two-step test performed at the reporting unit level. Step-1 of the impairment analysis involves comparing the fair value of the reporting unit to its carrying value, including goodwill. If the fair value of the reporting unit exceeds the carrying value, goodwill is not considered impaired. If the carrying value exceeds the fair value, Step-2 of the impairment analysis is performed, in which we measure the amount of impairment. Our goodwill evaluations utilize discounted cash flow analyses (the “income approach”) and market multiple analyses (the “market approach”), in estimating fair value. Inherent in our fair value determinations are certain judgments and estimates relating to future cash flows, including our interpretation of current economic indicators and market conditions, overall economic conditions and our strategic and operational plans with regard to our business units. In addition, to the extent significant changes occur in market conditions, overall economic conditions or our strategic or operational plans, it is possible that goodwill not currently impaired, may become impaired in the future.
Interim impairment testing: During the three months ended September 30, 2015, we determined there were indicators that required us to perform an interim impairment test in our reporting units that carry goodwill and other indefinite-lived intangible assets. These factors included, but were not limited to, the operating results during the nine months ended September 30, 2015, the sustained deterioration of market conditions in certain of our industries and the resulting decline in our market capitalization. Based on our analysis, we concluded there was no impairment for our other indefinite-lived intangible assets.
During the three months ended September 30, 2015, we concluded that the estimated fair values of our compound, mouldings and siding reporting units exceeded the carrying values in each respective unit by more than 10 percent. We also concluded that the estimated fair value of our chlor-alkali and derivatives reporting unit was lower than its carrying value, and consequently, we proceeded with Step-2 of the goodwill impairment test in order to measure the magnitude of impairment, if any.
That Step-2 test considered management’s revised assessment of the operating results and projected cash flows for our chlor-alkali and derivatives reporting unit, the sustained deterioration in market conditions for the chlor-alkali and derivatives industries, and the decline in our market capitalization
92
Table of Contents
below book value. Based on the results of the Step-2 test, the Company recorded a goodwill impairment charge of $864.1 million related to our chlor-alkali and derivatives reporting unit during the year ended December 31, 2015.
Annual impairment testing: We tested our reporting units with goodwill and other indefinite-lived intangible assets in the fourth quarter of 2015 in accordance with our annual October 1 impairment testing. Based on our Step-1 analysis, the estimated fair values of our compound, moulding and siding reporting units exceeded the carrying values in each respective unit by more than 10 percent. The estimated fair value of our chlor-alkali and derivatives reporting unit exceeded its carrying value at an amount that was less than 10 percent. Based on these results, none of our reporting units had any impairment. Consequently, management will continue to monitor the chlor-alkali and derivatives reporting units for any future indicators of impairment.
Further reductions in our future projections of operating results and cash flows from our chlor-alkali and derivatives reporting unit, or certain reporting units in our building products business, or a further deterioration of market conditions in the chlor-alkali and derivatives or building products industries in which we operate, among other factors, could result in the Company incurring additional goodwill impairment charges for one or more of those reporting units.
Goodwill. The following table provides the detail of the changes made to goodwill during the years ended December 31, 2015 and 2014:
| (In millions) |
Chlorovinyls | Building Products |
Total | |||||||||
| Gross goodwill at January 1, 2014 |
$ | 1,808.8 | $ | 160.3 | $ | 1,969.1 | ||||||
| Adjustments |
0.7 | - | 0.7 | |||||||||
| Foreign currency translation adjustment |
(18.7) | (0.1) | (18.8) | |||||||||
|
|
|
|
|
|
|
|||||||
| Gross goodwill at December 31, 2014 |
$ | 1,790.8 | $ | 160.2 | $ | 1,951.0 | ||||||
| Accumulated impairment losses |
(59.6) | (150.4) | (210.0) | |||||||||
|
|
|
|
|
|
|
|||||||
| Net goodwill at December 31, 2014 |
$ | 1,731.2 | $ | 9.8 | $ | 1,741.0 | ||||||
|
|
|
|
|
|
|
|||||||
| Gross goodwill at December 31, 2014 |
$ | 1,790.8 | $ | 160.2 | $ | 1,951.0 | ||||||
| Goodwill impairment charges - current year |
(864.1) | - | (864.1) | |||||||||
| Foreign currency translation adjustment |
(24.8) | - | (24.8) | |||||||||
|
|
|
|
|
|
|
|||||||
| Gross goodwill at December 31, 2015 |
901.9 | 160.2 | 1,062.1 | |||||||||
| Accumulated impairment losses - prior year |
(59.6) | (150.4) | (210.0) | |||||||||
|
|
|
|
|
|
|
|||||||
| Net goodwill at December 31, 2015 |
$ | 842.3 | $ | 9.8 | $ | 852.1 | ||||||
|
|
|
|
|
|
|
|||||||
Indefinite-lived intangible assets. Our indefinite-lived intangible assets consist of trade names with a carrying value of $5.9 million and $6.0 million at December 31, 2015 and 2014, respectively, primarily in our building products segment, net of cumulative translation adjustment.
93
Table of Contents
Definite-lived intangible assets. At December 31, 2015 and 2014, we had definite-lived intangible assets related to: (i) customer relationships, supply contracts, technology and trade names in our chlorovinyls segment; and (ii) customer relationships and technology in our building products segment. The following table provides the definite-lived intangible assets, by reportable segment, as of December 31, 2015 and 2014.
| Chlorovinyls | Building Products | Total | ||||||||||||||||||||||
| (In millions) |
December 31, 2015 |
December 31, 2014 |
December 31, 2015 |
December 31, 2014 |
December 31, 2015 |
December 31, 2014 |
||||||||||||||||||
| Gross carrying amounts: |
||||||||||||||||||||||||
| Customer relationships |
$ | 1,142.3 | $ | 1,142.3 | $ | 32.2 | $ | 32.2 | $ | 1,174.5 | $ | 1,174.5 | ||||||||||||
| Supply contracts |
42.6 | 42.6 | - | - | 42.6 | 42.6 | ||||||||||||||||||
| Technology |
14.9 | 14.9 | 17.4 | 17.4 | 32.3 | 32.3 | ||||||||||||||||||
| Trade names |
6.0 | 6.0 | - | - | 6.0 | 6.0 | ||||||||||||||||||
|
|
|
|
|
|
|
|
|
|
|
|
|
|||||||||||||
| Total |
1,205.8 | 1,205.8 | 49.6 | 49.6 | 1,255.4 | 1,255.4 | ||||||||||||||||||
| Accumulated impairment charges: |
||||||||||||||||||||||||
| Customer relationships |
(2.9) | (2.6) | - | - | (2.9) | (2.6) | ||||||||||||||||||
|
|
|
|
|
|
|
|
|
|
|
|
|
|||||||||||||
| Total |
(2.9) | (2.6) | - | - | (2.9) | (2.6) | ||||||||||||||||||
| Accumulated amortization: |
||||||||||||||||||||||||
| Customer relationships |
(182.9) | (121.1) | (13.7) | (12.1) | (196.6) | (133.2) | ||||||||||||||||||
| Supply contracts |
(6.3) | (4.1) | - | - | (6.3) | (4.1) | ||||||||||||||||||
| Technology |
(2.0) | (1.3) | (14.1) | (12.7) | (16.1) | (14.0) | ||||||||||||||||||
| Trade names |
(1.0) | (0.7) | - | - | (1.0) | (0.7) | ||||||||||||||||||
|
|
|
|
|
|
|
|
|
|
|
|
|
|||||||||||||
| Total |
(192.2) | (127.2) | (27.8) | (24.8) | (220.0) | (152.0) | ||||||||||||||||||
| Foreign currency translation adjustment: |
||||||||||||||||||||||||
| Customer relationships |
(24.6) | (14.2) | (0.1) | - | (24.7) | (14.2) | ||||||||||||||||||
|
|
|
|
|
|
|
|
|
|
|
|
|
|||||||||||||
| Total |
(24.6) | (14.2) | (0.1) | - | (24.7) | (14.2) | ||||||||||||||||||
| Net carrying amounts: |
||||||||||||||||||||||||
| Customer relationships |
931.9 | 1,004.4 | 18.4 | 20.1 | 950.3 | 1,024.5 | ||||||||||||||||||
| Supply contracts |
36.3 | 38.5 | - | - | 36.3 | 38.5 | ||||||||||||||||||
| Technology |
12.9 | 13.6 | 3.3 | 4.7 | 16.2 | 18.3 | ||||||||||||||||||
| Trade names |
5.0 | 5.3 | - | - | 5.0 | 5.3 | ||||||||||||||||||
|
|
|
|
|
|
|
|
|
|
|
|
|
|||||||||||||
| Total |
$ | 986.1 | $ | 1,061.8 | $ | 21.7 | $ | 24.8 | $ | 1,007.8 | $ | 1,086.6 | ||||||||||||
|
|
|
|
|
|
|
|
|
|
|
|
|
|||||||||||||
The weighted average estimated useful lives remaining for customer relationships, supply contracts, technology and definite-lived trade names are approximately 15 years, 17 years, 16 years and 14 years, respectively, as of December 31, 2015. Amortization expense for the definite-lived intangible assets was $68.4 million, $69.3 million and $64.2 million for the years ended December 31, 2015, 2014, and 2013, respectively. The estimated annual amortization expense for definite-lived intangible assets for the next five fiscal years is approximately $66.4 million per year.
As of December 31, 2015 and 2014, other assets, net of accumulated amortization, consisted of the following:
| December 31, | ||||||||
| (In millions) |
2015 | 2014 | ||||||
| Deferred financing costs, net |
$ | 7.1 | $ | 7.9 | ||||
| Deferred income taxes |
17.8 | 21.1 | ||||||
| Advances to and investments in joint ventures, net |
34.2 | 14.7 | ||||||
| Other |
6.9 | 7.8 | ||||||
|
|
|
|
|
|||||
| Total other assets, net |
$ | 66.0 | $ | 51.5 | ||||
|
|
|
|
|
|||||
94
Table of Contents
10. LONG-TERM DEBT AND LEASE FINANCING OBLIGATION
As of December 31, 2015 and 2014, our long-term debt consisted of the following:
| December 31, | ||||||||||
| (In millions) |
Maturity Date | 2015 | 2014 | |||||||
| 4.625 Notes (net of debt issuance costs totaling $9.6 million and $11.3 million |
February 15, 2021 | $ | 678.4 | $ | 676.7 | |||||
| 4.875 Notes (net of debt issuance costs totaling $5.8 million and $6.5 million |
May 15, 2023 | 444.2 | 443.5 | |||||||
| Term Loan Facility (net of debt issuance costs |
January 28, 2017 | - | 192.1 | |||||||
| New Term Loan Facility (net of deferred financing fees |
February 27, 2022 | 244.4 | - | |||||||
| ABL Revolver |
December 17, 2019 | - | - | |||||||
|
|
|
|
|
|||||||
| Total debt |
1,367.0 | 1,312.3 | ||||||||
| Less: current portion of long-term debt |
(2.5) | (2.8) | ||||||||
|
|
|
|
|
|||||||
| Long-term debt, net |
$ | 1,364.5 | $ | 1,309.5 | ||||||
|
|
|
|
|
|||||||
4.625 Notes
Axiall Corporation and certain of its subsidiaries guarantee $688.0 million in aggregate principal amount of 4.625 percent senior unsecured notes due 2021 (the “4.625 Notes”) that were issued by a wholly-owned subsidiary, Eagle Spinco Inc. (“Spinco”) on January 28, 2013. Interest payments on the 4.625 Notes commenced on August 15, 2013 and interest is payable semi-annually in arrears on February 15 and August 15 of each year. The 4.625 Notes are fully and unconditionally guaranteed, jointly and severally, on a senior unsecured basis by Axiall Corporation and by its existing and future domestic subsidiaries, other than certain excluded subsidiaries.
4.875 Notes
On February 1, 2013, Axiall Corporation issued $450.0 million in aggregate principal amount of 4.875 percent senior unsecured notes due 2023 (the “4.875 Notes”). Interest payments on the 4.875 Notes commenced on May 15, 2013 and interest is payable semi-annually in arrears on May 15 and November 15 of each year. The 4.875 Notes are fully and unconditionally guaranteed, jointly and severally, on a senior unsecured basis by each of our existing and future domestic subsidiaries, other than certain excluded subsidiaries.
Term Loan
On February 27, 2015, Axiall Holdco, Inc., a wholly-owned subsidiary of the Company (“Axiall Holdco”), entered into a credit agreement with a syndicate of financial institutions (the “Term Loan Agreement”) for a new $250 million term loan facility (the “New Term Loan Facility”) to refinance the principal amount outstanding under the Company’s existing term loan facility, to pay related fees and expenses, and for general corporate purposes. Obligations under the New Term Loan Facility are fully and unconditionally guaranteed, on a senior secured basis, by the Company and by each of the Company’s existing and future wholly-owned domestic subsidiaries, other than certain excluded subsidiaries. The obligations under the New Term Loan Facility are secured by substantially all of the assets of Axiall Holdco, Axiall Corporation and the subsidiary guarantors.
The New Term Loan Facility contains an accordion feature that permits Axiall Holdco, subject to certain conditions and to obtaining lender commitments, to incur additional term loans under the New Term Loan Facility in an amount up to the greater of: (i) $250 million; and (ii) an amount that would not result in the Company’s consolidated secured debt ratio being greater than 2.50 to 1.00.
At the election of Axiall Holdco, the New Term Loan Facility bears interest at a rate equal to: (i) the Base Rate (as defined in the Term Loan Agreement) plus 1.50 percent per annum; or (ii) LIBOR (as
95
Table of Contents
defined in the Term Loan Agreement) plus 3.25 percent per annum; provided that at no time will the Base Rate be deemed to be less than 2.00 percent per annum or LIBOR be deemed to be less than 0.75 percent per annum. As of December 31, 2015, outstanding borrowings under the Company’s New Term Loan Facility had a stated interest rate of 4.00 percent per annum.
The Term Loan Agreement contains customary covenants (subject to exceptions), including certain restrictions on the Company and its subsidiaries to pay dividends.
ABL Revolver
The Company’s second amended and restated asset based revolving credit facility (the “ABL Revolver”), which the Company entered into in December 2014, provides for a maximum of $600.0 million of revolving credit, subject to applicable borrowing base limitations and certain other conditions. The credit agreement governing the ABL Revolver (the “ABL Credit Agreement”) contains customary covenants, including certain restrictions on the Company and its subsidiaries to pay dividends and repurchase shares of Company stock. These covenants are subject to certain exceptions and qualifications. Under the ABL Revolver, dividend payments and repurchases of our common stock in an aggregate amount not to exceed $150 million in any fiscal year may be made if both borrowing availability under the ABL Revolver would have exceeded $75 million at all times during the thirty days immediately preceding any such restricted payment and our consolidated fixed charge coverage ratio (as defined in the ABL Revolver) is equal to or exceeds 1.00 to 1.00, each on a pro forma basis after giving effect to any such proposed restricted payment. In addition, under the ABL Revolver, additional cash dividend payments may be made if both borrowing availability under the ABL Revolver then exceeds $100 million and our consolidated fixed charge coverage ratio (as defined in the ABL Revolver) is equal to or exceeds 1.10 to 1.00, each on a pro forma basis after giving effect to the proposed cash dividend payment. In December 2015, we amended our ABL Credit Agreement to, among other things, provide additional flexibility to pay dividends and consummate stock repurchases, modify the definition of consolidated EBITDA to include certain additional add backs and reductions to net income in determining consolidated EBITDA (as defined in the ABL Revolver), revise the definition of consolidated capital expenditures to exclude capital expenditures made in connection with the proposed ethane cracker (ethylene manufacturing plant) located in Lake Charles, Louisiana, (the “Plant”) and provide for a reduction in the amount of its basket for investments in such a plant by the amount of such capital expenditures that are excluded from the definition of consolidated capital expenditures.
As of December 31, 2015 and 2014, we had no outstanding balance under our ABL Revolver. Our availability under the ABL Revolver at December 31, 2015 was approximately $369.2 million, net of outstanding letters of credit totaling $81.9 million. As of December 31, 2015, depending on the duration of the loan, the applicable rate for borrowings would have been between 2.11 percent to 4.00 percent based on LIBOR or the Prime Rate, plus the applicable margin under the ABL Revolver.
As of December 31, 2015, we were in compliance with the covenants under our ABL Credit Agreement, the Term Loan Agreement and the indentures governing the 4.625 Notes and the 4.875 Notes.
Ability to Pay Dividends Under the ABL Revolver
Under the ABL Revolver, cash dividend payments in an aggregate amount not to exceed $150 million in any fiscal year may be made if both borrowing availability under the ABL Revolver would have exceeded $75 million at all times during the thirty days immediately preceding the dividend payment and our consolidated fixed charge coverage ratio (as defined in the definitive documentation governing the ABL Revolver) is equal to or exceeds 1.00 to 1.00, each on a pro forma basis after giving effect to
96
Table of Contents
the proposed dividend payment. In addition, under the ABL Revolver, additional cash dividend payments may be made if both borrowing availability under the ABL Revolver then exceeds $100 million and our consolidated fixed charge coverage ratio (as defined in the definitive documentation governing the ABL Revolver) is equal to or exceeds 1.10 to 1.00, each on a pro forma basis after giving effect to the proposed cash dividend payment. Additionally, under the ABL Revolver, cash dividend payments in an aggregate amount not to exceed $50 million in any fiscal year may be made if both borrowing availability under the ABL Revolver would have exceeded $250 million at all times during the 45 days immediately preceding the dividend payment declaration and exceeds $250 million on the day of declaration of such dividend payment, and is reasonably expected to exceed $250 million on the last day of the calendar month during which such dividend payment is declared, and on the last day of the next two succeeding calendar months.
Cash Interest for Long-term Debt
Cash payments for interest during the years ended December 31, 2015, 2014 and 2013 were $68.7 million, $66.4 million and $69.2 million, respectively.
Lease Financing Obligation
As of December 31, 2015 and 2014, we had a lease financing obligation of $79.6 million and $94.2 million, respectively. The change from the December 31, 2014 balance is due to the change in the Canadian dollar exchange rate as of December 31, 2015. The lease financing obligation is the result of the sale and concurrent leaseback of certain land and buildings in Canada in 2007 for a term of ten years. In connection with this transaction, certain terms and conditions, including the requirement to execute a collateralized letter of credit in favor of the buyer-lessor, resulted in the transaction being recorded as a financing transaction rather than a sale for GAAP purposes. As a result, the land, building and related accounts continue to be recognized in the consolidated balance sheets. The collateralized letter of credit expired on February 2, 2015 and is no longer required. We are not obligated to repay the lease financing obligation amount of $79.6 million. Our obligation is for the future minimum lease payments under the terms of the related lease agreements. The future minimum lease payments under the terms of the related lease agreements as of December 31, 2015 are $4.6 million in 2016, and $1.2 million in 2017, the final year of the lease agreements. The change in the future minimum lease payments from such amounts disclosed as of December 31, 2014 is due to current period payments and the change in the Canadian dollar exchange rate as of December 31, 2015.
11. FAIR VALUE OF FINANCIAL INSTRUMENTS
Financial instruments consist primarily of cash and cash equivalents, accounts receivable, accounts payable, accrued expenses, commodity purchase contracts and long-term debt. The carrying amounts of cash and cash equivalents, accounts receivable, accounts payable and accrued expenses approximate their fair values because of the nature of such instruments. The fair values of our outstanding notes and our New Term Loan Facility, as shown in the table below, are based on quoted market values. Our commodity purchase contracts are fair valued with Level 2 inputs based on quoted market values for similar but not identical financial instruments. When computed for the purposes of impairment testing, the fair values of our goodwill and other acquired intangible assets are determined using Level 3 inputs. For further details concerning the fair value of goodwill and other intangible assets, see Note 8 of the Notes to the Consolidated Financial Statements.
97
Table of Contents
The FASB’s ASC 820-10 establishes a fair value hierarchy that prioritizes observable and unobservable inputs to valuation techniques used to measure fair value. These levels, in order of highest to lowest priority are described below:
| Level 1— |
Quoted prices (unadjusted) in active markets for identical assets or liabilities at the measurement date. | |
| Level 2— |
Observable prices that are based on inputs not quoted on active markets, but corroborated by market data. | |
| Level 3— |
Prices that are unobservable for the asset or liability and are developed based on the best information available under the circumstances, which might include the Company’s own data. |
The following is a summary of the carrying values and estimated fair values of our long-term debt and commodity purchase contracts as of December 31, 2015 and 2014:
| December 31, 2015 | December 31, 2014 | |||||||||||||||
| (In millions) |
Carrying Value |
Fair Value |
Carrying Value |
Fair Value |
||||||||||||
| Level 1: |
||||||||||||||||
| Long-term debt: |
||||||||||||||||
| 4.625 Notes (net of debt issuance costs totaling $9.6 million and $11.3 million at December 31, 2015 and 2014, respectively) |
$ | 678.4 | $ | 635.1 | $ | 676.7 | $ | 651.9 | ||||||||
| 4.875 Notes (net of debt issuance costs totaling $5.8 million and $6.5 million at December 31, 2015 and 2014, respectively) |
$ | 444.2 | $ | 408.4 | $ | 443.5 | $ | 426.7 | ||||||||
| Level 2: |
||||||||||||||||
| Long-term debt: |
||||||||||||||||
| Term Loan Facility (net of debt issuance costs |
$ | - | $ | - | $ | 192.1 | $ | 194.4 | ||||||||
| New Term Loan Facility (net of deferred financing fees |
$ | 244.4 | $ | 247.8 | $ | - | $ | - | ||||||||
| Derivative instruments: |
||||||||||||||||
| Commodity purchase contracts |
$ | (0.4 | ) | $ | (0.4 | ) | $ | (12.9 | ) | $ | (12.9 | ) | ||||
12. COMMITMENTS AND CONTINGENCIES
Leases. We lease railcars, storage terminals, computer equipment, automobiles, barges, warehouses and office spaces under non-cancelable operating leases and capital leases with varying maturities through the year 2026. Future minimum payments under these non-cancelable operating leases as of December 31, 2015 are $42.6 million in 2016, $35.3 million in 2017, $26.5 million in 2018, $20.0 million in 2019, $15.9 million in 2020 and $31.9 million thereafter. Total lease expense was approximately $53.6 million, $51.1 million and $52.5 million for the years ended December 31, 2015, 2014 and 2013, respectively. Lease expense is recognized on a straight-line basis over the term of the lease.
Letters of Credit. As of December 31, 2015 and 2014, we had outstanding letters of credit totaling approximately $81.9 million and $82.3 million, respectively. Outstanding letters of credit directly reduce our availability under our ABL Revolver. Letters of credit, which typically have terms from one month to one year, primarily provide additional security for payments to real property lessors, insurance claim administrators and provide financial assurance to states for environmental closures, post-closure costs and potential third party liability awards.
Purchase Commitments. Our long-term raw material purchase agreements with variable and fixed payment obligations expired in 2014. Under the contracts, we were required to prepay a certain portion of the fixed and determinable costs. The aggregate amount of payments made under the fixed and determinable cost component of the agreements for purchases in 2014 was $80.1 million. Additionally,
98
Table of Contents
in the year ended December 31, 2015, we made a significant amount of raw material purchases from one of our suppliers totaling approximately $245.3 million and had accounts payable to this supplier of $12.1 million as of December 31, 2015.
In addition, we have a 50 percent ownership interest in RS Cogen, LLC (“RS Cogen”), which produces electricity and steam that are primarily sold to Axiall and its joint venture partner under take-or-pay contracts with terms that extend to 2022. Axiall’s future commitment to purchase electricity and steam from the joint venture per the take-or-pay contracts approximates $23.5 million per year, subject to contractually defined inflation adjustments. As of December 31, 2015, Axiall’s future commitment under the take-or-pay contract approximates $160.7 million. Purchases in the years ended December 31, 2015 and 2014 approximated $25.8 million and $25.0 million, respectively.
On June 17, 2015, Eagle US 2 LLC (“Eagle”), a wholly-owned subsidiary of the Company, entered into an amended and restated limited liability company agreement with Lotte Chemical USA Corporation (“Lotte”) related to the formation of LACC, LLC (“LACC”), an entity formed by Eagle and Lotte to design, build and operate a state-of-the-art 1.0 million metric tons per annum Plant. The Plant will provide partial backward integration for Axiall’s vinyls business and will supply a new monoethylene glycol (“MEG”) facility being built by Lotte adjacent to the new ethylene plant. Pursuant to a contribution and subscription agreement, dated as of June 17, 2015, between the Company, Eagle and LACC, Eagle has agreed to make a maximum capital commitment to LACC of up to $225 million to fund the construction costs of the Plant. Eagle’s investment is expected to represent approximately 10 percent of the interests of LACC. Eagle and Lotte also entered into a call option agreement, dated as of June 17, 2015, pursuant to which Eagle has the right, but not the obligation, until the third anniversary of the substantial completion of the Plant, to acquire up to a 50 percent ownership interest in LACC from Lotte. On December 17, 2015, Axiall and Lotte announced that the companies reached a final investment decision to construct the Plant and LACC entered into the engineering, procurement and construction agreement with CB&I Inc., the construction contractor. The Company’s annual commitment will be up to a maximum of $50.0 million per year through 2018 with the remainder due in 2019.
Deferred Acquisition Payments. We are obligated to make payments in the total amount of $50.0 million in deferred purchase price acquisition costs to PPG based upon the final funding status of the pension plans acquired in the Merged Business. We paid $10 million of that amount to PPG in each of the years ended December 31, 2015 and 2014. The remaining future payments under the terms of our agreement are $15.0 million in 2016 and $15.0 million in 2017.
Employee matters. As of December 31, 2015, we had approximately 5,830 full-time employees. We employ approximately 1,580 employees, representing 27 percent of our workforce, under collective bargaining agreements that expire at various times through 2018. We believe our relationships with our employees and their representative organizations are good.
Legal Proceedings. We are involved in a number of contingencies incidental to the normal conduct of our business including lawsuits, claims and environmental contingencies. The outcome of these contingencies is inherently unpredictable. We believe that, in the aggregate, the outcome of all known contingencies including lawsuits, claims and environmental contingencies will not have a material adverse effect on our consolidated financial statements; however, specific outcomes with respect to such contingencies may be material to the consolidated financial statements of any particular period in which costs, if any, are recognized. Our assessment of the potential impact of environmental contingencies is subject to uncertainty due to the complex, ongoing and evolving process of investigation and remediation of such environmental contingencies, and the potential for technological and regulatory developments. In addition, the impact of evolving programs, such as natural resource damage claims, industrial site reuse initiatives and state remediation programs creates further
99
Table of Contents
uncertainty of the ultimate resolution of these environmental contingencies. We anticipate that the resolution of many contingencies, and in particular environmental contingencies, will occur over an extended period of time.
On December 20, 2013, a fire occurred at our PHH Monomers, LLC (“PHH”) vinyl chloride monomer (“VCM”) manufacturing plant in Lake Charles, Louisiana. As of December 31, 2015, approximately 2,607 individuals have lawsuits against the Company alleging personal injury or property damage related to the incident. We do not expect any other individuals to file lawsuits regarding this matter, as the prescribed deadline for doing so has expired. We have not recorded an accrual in connection with any of these lawsuits because, at this time, we are unable to reasonably determine whether any potential loss is probable or estimable. In addition, we currently are unable to provide a reasonable estimate of the potential loss or range of loss, if any, expected to result from this contingency. We are unable to make these determinations due to a number of variables, including without limitation, uncertainties related to: (i) the fact that no written or oral discovery has been conducted by the Company in any of these lawsuits; (ii) the parties’ respective litigation strategies; (iii) the fact that none of the complaints have alleged specific injuries or a specific amount of damages; (iv) any symptoms experienced by any of the plaintiffs, and whether there will be any reliable information, documentation or other discovery related thereto; (v) the pre-and-post fire medical or physical condition of the plaintiffs, and whether there will be any reliable information, documentation or other discovery related thereto; and (vi) the location of any plaintiff at the time of the fire, and the duration of any exposure related thereto, and whether there will be any reliable information, documentation or other discovery related thereto.
Environmental Remediation. Our operations and assets are subject to extensive environmental, health and safety regulations, including laws and regulations related to air emissions, water discharges, waste disposal and remediation of contaminated sites, at both the national and local levels in the United States. We are also subject to similar laws and regulations in Canada and other jurisdictions in which we operate. The nature of the chemical and building products industries exposes us to risks of liability under these laws and regulations due to the production, storage, use, transportation and sale of materials that can cause contamination or personal injury, including, in the case of chemicals, potential releases into the environment. Environmental laws may have a significant effect on the costs of use, transportation and storage of raw materials and finished products, as well as the costs of the storage and disposal of wastes. We have incurred and will continue to incur substantial operating and capital costs to comply with environmental laws and regulations. In addition, we may incur substantial costs, including fines, damages, criminal or civil sanctions and remediation costs, or experience interruptions in our operations for violations arising under these laws and regulations.
As of December 31, 2015 and 2014, we had reserves for environmental contingencies totaling approximately $41 million and $54 million, respectively, of which approximately $1 million and $12 million, respectively, were classified as current liabilities. Our assessment of the potential impact of these environmental contingencies is subject to considerable uncertainty due to the complex, ongoing and evolving process of investigation and remediation, if necessary, of such environmental contingencies, and the potential for technological and regulatory developments.
Some of our significant environmental contingencies include the following matters:
| • | We have entered into a Cooperative Agreement with the Louisiana Department of Environmental Quality (“LDEQ”) and various other parties for the environmental remediation of a portion of the Bayou d’Inde area of the Calcasieu River Estuary in Lake Charles, Louisiana. Remedy implementation began in the fourth quarter of 2014 and is expected to be completed during 2016 with a period of monitoring for remedy effectiveness to follow remediation. As of December 31, 2015 and 2014, we have reserved approximately $4 million and $18 million, respectively, for the costs associated with this matter. The decrease in the amount of this reserve is primarily due to spending against the reserve. |
100
Table of Contents
| • | As of December 31, 2015 and 2014 we had reserved approximately $12 million and $15 million, respectively, for environmental contingencies related to on-site remediation at the Lake Charles South Facility, principally for ongoing remediation of groundwater and soil in connection with our corrective action permit issued pursuant to the Hazardous and Solid Waste Amendments of the Resource Conservation and Recovery Act. The remedial activity is primarily related to the operation of a series of well water treatment systems across the Lake Charles South Facility. In addition, remediation of possible soil contamination will be conducted in certain areas. These remedial activities are expected to continue for an extended period of time. The reduction in the amount of this reserve is due to our assessment, during the year ended December 31, 2015, of the estimated costs to be incurred after December 31, 2015 to conduct this on-going remedial activity, and in particular, our assessment of the portion of the future operating costs of certain water treatment assets at our Lake Charles South Facility that should be allocated to this remediation project, as opposed to other non-remediation uses of those water treatment assets. |
| • | As of December 31, 2015 and 2014, we had reserved approximately $18 million and $15 million, respectively, for environmental contingencies related to remediation activities at our Natrium, West Virginia facility (the “Natrium Facility”). The remedial actions address National Pollutant Discharge Elimination System permit requirements related primarily to hexachlorocyclohexane (commonly referred to as BHC) and mercury. We expect that these remedial actions will be in place for an extended period of time. The increase in the amount of this reserve is due to our assessment, during the year ended December 31, 2015, of the estimated costs that will be incurred after December 31, 2015 to conduct this on-going remedial activity, and in particular, due to an increase in the estimated duration of the remediation period. |
Environmental Laws and Regulations. Due to the nature of environmental laws, regulations and liabilities, it is possible that we may not have identified all potentially adverse conditions. Such conditions may not currently exist or be detectable through reasonable methods, or may not be estimable. For example, our Natrium Facility and Lake Charles South Facility have both been in operation for over 65 years. There may be significant latent liabilities or future claims arising from the operation of facilities of this age, and we may be required to incur material future remediation or other costs in connection with future actions or developments at these or other facilities.
We expect to be continually subjected to increasingly stringent environmental and health and safety laws and regulations, and that continued compliance will require increased capital expenditures and increased operating costs or may impose restrictions on our present or future operations. It is difficult to predict the future interpretation and development of these laws and regulations or their impact on our future earnings and operations. Any increase in these costs, or any material restrictions on our ability to operate or the manner in which we operate, could materially adversely affect our liquidity, financial condition and results of operations. However, estimated costs for future environmental compliance and remediation may be materially lower than actual costs, or we may not be able to quantify potential costs in advance. Actual costs related to any environmental compliance in excess of estimated costs could have a material adverse effect on our financial condition in one or more future periods.
Heightened interest in environmental regulation, such as climate change issues, has the potential to materially impact our costs and present and future operations. We, and other chemical companies, are currently required to file certain governmental reports relating to greenhouse gas (“GHG”) emissions. The U.S. Government has considered, and may in the future implement restrictions or other controls on GHG emissions, any of which could require us to incur significant capital expenditures or further restrict our present or future operations.
101
Table of Contents
In addition to GHG regulations, the United States Environmental Protection Agency (the “EPA”) has recently taken certain actions to limit or control certain pollutants created by companies such as ours. For example:
| • | In January 2013, the EPA issued Clean Air Act emission standards for boilers and incinerators (the “Boiler MACT regulations”), which are aimed at controlling emissions of toxic air contaminants at covered facilities. The coal fired power plant at our Natrium Facility is our source most significantly impacted by the Boiler MACT regulations. Pursuant to an extension granted by the West Virginia Department of Environmental Protection (WVDEP), we expect to comply with the requirements of the Boiler MACT regulations on or before December 2016. |
| • | In April 2012, the EPA issued final regulations to update emissions limits for polyvinyl chloride (“PVC”) and copolymer production (the “PVC MACT regulation”). The PVC MACT regulation sets standards for major sources of PVC production and establishes certain working practices, as well as monitoring, reporting and record-keeping requirements. Following the issuance of the PVC MACT regulation, a variety of legal challenges were filed by the vinyl industry’s trade organization, several vinyl manufacturers and several environmental groups. Most of these challenges have been resolved; however, there are several petitions to reconsider certain provision in the rule that are still pending. We anticipate that some of these provisions will likely be changed as a result of these petitions, and there could be significant changes from the currently existing PVC MACT regulation after all legal challenges have been exhausted. These changes could require us to incur further capital expenditures, or increase our operating costs, to levels significantly higher than what we have previously estimated. |
| • | In March 2011, the EPA proposed amendments to the emission standards for hazardous air pollutants for mercury emissions from mercury cell chlor-alkali plants. These proposed amendments would require improvements in work practices to reduce fugitive mercury emissions and would result in reduced levels of mercury emissions while still allowing the mercury cell facilities to continue to operate. We operate a mercury cell production unit at our Natrium Facility. No assurances as to the timing or content of the final regulation, or its ultimate cost to, or impact on us, can be provided. |
The potential impact of these and/or unrelated future, legislative or regulatory actions on our current or future operations cannot be predicted at this time but could be significant. Such impacts could include the potential for significant compliance costs, including capital expenditures, which could result in operating restrictions or could require us to incur significant legal or other costs related to compliance or other activities. For example, a recent revision to ambient air quality standards for ozone may, in the future, result in significant operating costs, compliance costs, and capital expenditures at some of our facilities. Any increase in the costs related to these initiatives, or restrictions on our operations, could materially adversely affect our liquidity, financial condition or results of operations.
Environmental Remediation: Reasonably Possible Matters. Our assessment of the potential impact of environmental contingencies is subject to considerable uncertainty due to the complex, ongoing and evolving process of investigation and remediation, if necessary, of such environmental contingencies, and the potential for technological and regulatory developments. As such, in addition to the amounts currently reserved, we may be subject to reasonably possible loss contingencies related to environmental matters in the range of $40 million to $80 million.
Involuntary Conversion of Property, Plant and Equipment. On December 20, 2013, a fire occurred in what is commonly known as the Company’s PHH VCM manufacturing plant in Lake Charles, Louisiana. The fire impacted several process components of the PHH VCM manufacturing plant. Operations at the plant returned to full service at the end of June 2014. In December 2014, the
102
Table of Contents
Company and its insurers entered into an insurance settlement agreement, whereby the insurers agreed to pay the Company an aggregate of $20.8 million in settlement of the insurance claim for business interruption and property damage relating to the fire. We recognized $17.7 million of insurance recoveries in cost of sales in our consolidated statements of operations for the year ended December 31, 2014, of which $16.9 million related to business interruption. During the year ended December 31, 2014, we received cash proceeds from our insurers totaling $14.3 million of which $10.4 million is reflected in cash flows from operating activities and $3.9 million is reflected in cash flows from investing activities. As of December 31, 2014, we had a $6.5 million receivable for the balance of the payments owed to us by our insurers, which was collected in 2015.
On May 17, 2011, our shareholders approved the Axiall Corporation 2011 Equity and Performance Incentive Plan (the “2011 Plan”). In January 2013, our shareholders approved an amendment to the 2011 Plan to increase the number of shares available under the plan by 1.8 million shares. Under the 2011 Plan as it existed at December 31, 2015, we were authorized to grant various share-based compensation awards for up to 3.6 million shares of our common stock to officers, employees and non-employee directors, among others. We have granted various types of share-based payment awards to participants, including restricted stock unit awards and stock option grants. Our policy is to issue new shares upon the exercise of stock options and the vesting of restricted stock units. As of December 31, 2015, there were approximately 1.9 million shares available for future grant to participants under our 2011 Plan. In connection with our adoption and shareholder approval of the 2011 Plan, we agreed to not grant additional share-based compensation awards under our previously existing equity compensation plans.
A summary of the expense related to share-based compensation cost by type of program is as follows:
| Year Ended December 31, | ||||||||||||
| (In millions) |
2015 | 2014 | 2013 | |||||||||
| Restricted stock units expense |
$ | 10.2 | $ | 16.5 | $ | 10.6 | ||||||
| Stock options expense |
- | 0.5 | 1.0 | |||||||||
|
|
|
|
|
|
|
|||||||
| Before-tax share-based compensation expense |
10.2 | 17.0 | 11.6 | |||||||||
| Income tax benefit |
(3.3 | ) | (6.0 | ) | (3.9 | ) | ||||||
|
|
|
|
|
|
|
|||||||
| After-tax share-based compensation expense |
$ | 6.9 | $ | 11.0 | $ | 7.7 | ||||||
|
|
|
|
|
|
|
|||||||
As of December 31, 2015 and 2014, we had approximately $15.0 million and $23.1 million, respectively, of total unrecognized compensation costs related to unvested share-based compensation, which we will record in our consolidated statements of operations over a weighted average recognition period of approximately one- and one-half years. The total fair value of shares vested during the year ended December 31, 2015, 2014 and 2013 was approximately $22.5 million, $14.6 million and $3.3 million, respectively.
103
Table of Contents
Stock Options. A summary of stock option activity under all plans as of and for the year ended December 31, 2015 is as follows:
| Shares | Weighted Average Remaining Contractual Terms (Years) |
Weighted Average Exercise Price |
Aggregate Intrinsic Value (In millions) |
|||||||||||||
| Outstanding on January 1, 2015 |
289,064 | $ | 116.40 | |||||||||||||
| Granted |
- | - | ||||||||||||||
| Exercised |
(17,324) | 31.72 | ||||||||||||||
| Expired |
(3,129) | 1,183.96 | ||||||||||||||
|
|
|
|
|
|||||||||||||
| Outstanding on December 31, 2015 |
268,611 | 4.4 years | $ | 109.42 | $ | - | ||||||||||
|
|
|
|
|
|||||||||||||
| Vested as of December 31, 2015 |
268,611 | 4.4 years | $ | 109.42 | $ | - | ||||||||||
| Expected to vest as of December 31, 2015 |
- | 0.0 years | $ | - | $ | - | ||||||||||
During the year ended December 31, 2015 and 2014, we granted no options to purchase shares. During the year ended December 31, 2013, we granted options to purchase shares primarily to replace unvested awards of former employees of the Merged Business who became Axiall employees in connection with the Merger (the “Replacement Options”). The fair value of stock options when granted was estimated as of the date of grant using the Black-Scholes option pricing model. With the exception of the Replacement Options, option exercise prices are equal to the closing price of our common stock on the date of grant. The exercise price utilized for the Replacement Options resulted in the Replacement Options having a spread value equal to that of the PPG stock options being replaced, as measured at the closing date of the Merger. Options generally vest over a three year period from the date of grant and expire no more than ten years after the date of grant. As of December 31, 2015 all Replacement Options have vested. The intrinsic value is calculated as the difference between the market value at period-end and the exercise price of the shares. If the market value is less than the exercise price, there is no intrinsic value. As of December 31, 2015, there was no intrinsic value for our stock options primarily due to the lower market price of our shares compared to the exercise price as of that date. There were no significant options exercised during the years ended December 31, 2014 and 2013. The following table summarizes information about stock options outstanding at December 31, 2015:
| Outstanding | Exercisable | |||||||||||||||||||
| Range of Exercise Prices |
Shares | Weighted Average Exercise Price |
Weighted Average Remaining Contractual Life |
Shares | Weighted Average Exercise Price |
|||||||||||||||
| $8.74 to $25.00 |
38,572 | $ | 21.25 | 3.2 years | 38,572 | $ | 21.25 | |||||||||||||
| $25.01 to $41.50 |
173,989 | 33.87 | 5.6 years | 173,989 | 33.87 | |||||||||||||||
| $75.00 to $476.00 |
24,998 | 172.47 | 2.1 years | 24,998 | 172.47 | |||||||||||||||
| $476.01 to $1,334.50 |
31,052 | 591.52 | 0.8 years | 31,052 | 591.52 | |||||||||||||||
|
|
|
|
|
|||||||||||||||||
| $8.74 to $1,344.50 |
268,611 | 109.42 | 4.4 years | 268,611 | 109.42 | |||||||||||||||
|
|
|
|
|
|||||||||||||||||
104
Table of Contents
Restricted Stock Units. We issue restricted stock units in the form of time-based restricted units and performance-based restricted units (“PRSUs”). A summary of restricted stock unit activity under all plans as of and for the year ended December 31, 2015 is as follows:
| Shares | Weighted Average Remaining Contractual Terms (Years) |
Weighted Average Grant Date Fair Value |
Aggregate Intrinsic Value (In millions) |
|||||||||||||
| Outstanding on January 1, 2015 |
972,843 | $ | 41.30 | |||||||||||||
| Granted |
519,852 | 36.15 | ||||||||||||||
| Vested and released |
(495,337) | 37.43 | ||||||||||||||
| Forfeited |
(427,260) | 42.40 | ||||||||||||||
|
|
|
|||||||||||||||
| Outstanding on December 31, 2015 |
570,098 | 1.2 Years | $ | 40.55 | $ | 9.1 | ||||||||||
|
|
|
|||||||||||||||
| Vested or expected to vest as of December 31, 2015 |
596,048 | 1.2 Years | $ | 41.01 | $ | 10.8 | ||||||||||
| Expected to vest as of December 31, 2015 |
576,378 | 1.2 Years | $ | 40.56 | $ | 8.9 | ||||||||||
During the years ended December 31, 2015, 2014 and 2013, we granted 519,852, 447,608 and 450,169 restricted stock units, respectively, to certain key employees and non-employee directors. Our restricted stock units granted during the year ended December 31, 2014, include grants to replace unvested awards of former employees of the Merged Business who became Axiall employees in connection with the Merger and grants in May 2013 to certain of our officers, employees and directors. The restricted stock units normally vest over a one- or three-year period. The weighted average grant date fair value per share of our restricted stock units granted during 2015, 2014 and 2013 was $36.15, $44.38 and $45.20, respectively, which is based on the stock price as of the date of grant or, in the case of certain performance restricted stock units (“PRSUs”), the fair value was estimated using a Monte Carlo simulation model. The total intrinsic value of restricted stock units that vested during the year ended December 31, 2015, 2014 and 2013 was $17.8 million, $19.5 million and $6.1 million, respectively. Restricted stock surrendered in satisfaction of required minimum tax withholding obligations was 226,945, 163,404 and 36,846 shares during 2015, 2014 and 2013, respectively.
In May 2015 and 2014, we granted PRSUs to our executive officers, for which the number of shares ultimately earned depends on our Company’s relative total shareholder return (“TSR”), as compared to a group of peer companies. The number of shares of our common stock to be awarded in connection with the vesting of those PRSUs ranges from 0 percent to 200 percent, with the percentage to be used in such vesting calculation based on the TSR performance metric. All of those PRSUs are expected to vest on the third anniversary of the grant date. Also, in May 2015 and 2014, we granted PRSUs to certain of our executive officers, for which the vesting depends on the Company having a positive Adjusted EBITDA for the prescribed performance period. Those PRSUs are scheduled to vest in three equal installments on each of the first, second and third anniversaries of the grant date. In addition, in May 2015 and 2014, we granted RSUs to certain of our executive officers and non-officer employees, the majority of which are scheduled to vest in three equal installments on each of the first, second and third anniversaries of the grant date, and for which there is no performance metric.
In May 2013, we granted PRSUs to our executive officers, for which the number of shares ultimately earned is contingent on our achievement of certain synergies relating to the Merger. The number of shares of our common stock to be awarded in connection with those PRSUs will be determined by multiplying the target award by a percentage ranging from 0 percent to 200 percent. The percentage to be used in that vesting calculation will be based solely on the amount of Merger-related synergies achieved as of the second anniversary date of the closing of the Merger. One-half of those PRSUs will vest on the second anniversary of the grant date and one-half will vest on the third anniversary of the grant date. Also, in May 2013, we granted PRSUs to certain of our executive officers, for which their
105
Table of Contents
vesting depends on the Company having a positive Adjusted EBITDA for the prescribed performance period. Those PRSUs are scheduled to vest in three equal installments on each of the first, second and third anniversaries of the grant date. In addition, in May 2013, we granted RSUs to certain other of our executive officers and to certain non-officer employees, which are scheduled to vest on each of the first, second and third anniversaries of the grant date, and for which there is no performance metric.
The PRSUs granted in 2015, 2014 and 2013 are included with all restricted stock units in all calculations.
Share-Based Compensation Assumptions Related to PRSUs. We determined the fair value of PRSUs granted in 2013 based on the closing price of our stock on the date of grant as the performance obligations are dependent on the Company achieving a certain level of Merger-related synergies and certain Adjusted EBITDA performance targets. The fair value of our PRSUs granted in the years ended December 31, 2015 and 2014, for which the performance metric is relative total shareholder return, were estimated as of the date of grant using a Monte Carlo simulation model. The use of a valuation model requires us to make certain assumptions with respect to selected model inputs. The use of different assumptions could result in materially different valuations. We use the average of the high and low of the implied and historical volatility for our stock and the expected life of the awards is based on the vesting period. The risk-free interest rate assumption is based on observed interest rates appropriate for the terms of our awards. The dividend yield assumption is based on our dividend paying history and expectation of future dividend payments. The weighted averages for the primary assumptions used in the Monte Carlo simulation model for the 2015 and 2014 grants are as follows:
| PRSU Grants Year Ended December 31, |
||||||||
| 2015 | 2014 | |||||||
| Assumptions: |
||||||||
| Risk-free interest rate |
1.01% | 0.79% | ||||||
| Expected life |
3.0 years | 3.0 years | ||||||
| Expected volatility |
37% | 43% | ||||||
Defined Benefit Plans
The Company sponsors and contributes to pension plans (“Pension Plans”) and OPEB plans covering many of our United States (“U.S.”) employees, in whole or in part based on meeting certain eligibility criteria. In addition, the Company and its subsidiaries have various pension plans and other forms of OPEB arrangements outside the United States, namely in Canada and Taiwan.
The Pension Plans provide benefits to certain employees and retirees and are closed to new hires. Effective January 31, 2014, amendments to the Pension Plans for U.S. non-bargained employees froze all future benefit accruals for non-bargained employees who were not already frozen. The financial impact of these amendments to the Pension Plans was recognized in the fourth quarter of 2013.
During 2014, the U.S. Pension Plans were amended to provide a one-time voluntary lump-sum distribution offer to terminated vested participants. Payments were made during December 2014 and a settlement charge of $5.8 million was recognized at December 31, 2014.
The OPEB Plans are unfunded and provide medical and life insurance benefits for certain employees and their dependents.
106
Table of Contents
Recently approved amendments to the OPEB plans were made to further deliver retiree medical benefits through health reimbursement account contributions and to further limit life insurance benefits. Effective January 1, 2016, the majority of Medicare and non-Medicare eligible retirees will receive retiree medical benefits through health reimbursement account contributions. In addition, effective January 1, 2016, most life insurance benefits for non-bargained retirees were eliminated and a sunset period was provided for life insurance benefits for the majority of other retirees. These OPEB benefit changes were approved and communicated to participants in August 2015 and the quantitative financial impact is reflected in the year ended December 31, 2015. These changes reduced the OPEB benefit obligation by $29.8 million and the resulting prior service credit will be amortized through 2025.
In connection with the OPEB plan amendments, the benefit obligation was remeasured using current assumptions as of that date, including the Society of Actuaries’ (“SOA”) mortality tables “RPH-2014” and an alternative generational improvement scale published by the SOA “BB-2D”. The discount rate used to remeasure the OPEB plan obligation was 3.59 percent at September 1, 2015 compared to 3.90 percent at December 31, 2014.
For the U.S. Pension Plans, benefit obligations continue to be measured using the SOA’s base mortality table (“RP-2014”), with collar adjustments by plan. The generational improvement scale was updated to use the same consistently with the scale used for the OPEB plans.
In the third quarter of 2015, we changed the accounting method used to estimate the service and interest components of net periodic benefit cost for the U.S. postretirement benefits. This new estimation approach discounts the individual expected cash flows underlying the service cost and interest cost using the applicable spot rates derived from the yield curve used to discount the cash flows used to measure the benefit obligation. Historically, we estimated these service and interest cost components utilizing a single weighted-average discount rate derived from the yield curve used to measure the benefit obligation at the beginning of the period.
We have made this change to provide a more precise measurement of service and interest costs by improving the correlation between projected benefit cash flows to the corresponding spot yield curve rates. We have accounted for this change as a change in accounting estimate that is inseparable from a change in accounting principle and accordingly have accounted for it prospectively. While the benefit obligation measured under this approach is unchanged, the more granular application of the spot rates reduced the service and interest cost for the OPEB plan for the last four months of fiscal 2015 by $0.2 million. For the OPEB plan, the spot rates used to determine service and interest costs ranged from 0.65 percent to 5.01 percent and 0.65 percent to 5.01 percent, respectively. Under the Company’s prior methodology, these rates would have resulted in weighted-average rates for service and interest costs of 3.59 percent and 3.59 percent, respectively. The new approach will be used to measure the service and interest cost for our other U.S. pension plans in 2016. For the U.S. OPEB and pension plans, the spot rates that will be used to determine 2016 service and interest costs range from 0.92 percent to 4.97 percent and 0.92 percent to 4.97 percent, respectively. Under the Company’s prior methodology, these rates would have resulted in a single weighted-average rate of 4.37 percent for both service and interest costs. Based on current economic conditions, we estimate the service cost and interest cost for the pension plans will be reduced by approximately $7.0 million in 2016 as a result of the change.
107
Table of Contents
Benefit Obligations. The reconciliation of the beginning and ending balances of the projected benefit obligation for defined benefit plans is as follows:
| Pension Benefits | OPEB | |||||||||||||||
| As of December 31, | ||||||||||||||||
| (In millions) |
2015 | 2014 | 2015 | 2014 | ||||||||||||
| Change in benefit obligation |
||||||||||||||||
| Benefit obligation, beginning of year |
$ | 786.8 | $ | 673.4 | $ | 111.7 | $ | 97.9 | ||||||||
| Service costs |
4.3 | 3.6 | 0.9 | 0.8 | ||||||||||||
| Interest cost |
30.7 | 31.7 | 3.5 | 4.4 | ||||||||||||
| Actuarial loss (gain) |
(44.1) | 141.3 | (8.7) | 16.7 | ||||||||||||
| Foreign currency translation adjustment |
(2.5) | (1.5) | (0.5) | (0.3) | ||||||||||||
| Plan participants’ contributions |
- | - | 1.4 | 1.4 | ||||||||||||
| Gross benefits paid |
(37.7) | (38.2) | (9.2) | (9.2) | ||||||||||||
| Plan amendments |
- | - | (29.8) | - | ||||||||||||
| Settlements |
(0.5) | (24.0) | - | - | ||||||||||||
| Other |
- | 0.5 | - | - | ||||||||||||
|
|
|
|
|
|
|
|
|
|||||||||
| Benefit obligation, end of year |
$ | 737.0 | $ | 786.8 | $ | 69.3 | $ | 111.7 | ||||||||
|
|
|
|
|
|
|
|
|
|||||||||
| Accumulated benefit obligation, end of year |
$ | 734.6 | $ | 784.0 | NA | NA | ||||||||||
|
|
|
|
|
|
|
|
|
|||||||||
The accumulated benefit obligation is defined as the actuarial present value of pension benefits (whether vested or unvested) attributed to employee services rendered before December 31, 2015 and 2014, respectively, and based on employee service and compensation prior to the applicable date.
Plan Assets. The summary and reconciliation of the beginning and ending balances of the fair value of the plans’ assets were as follows:
| Pension Benefits | OPEB | |||||||||||||||
| As of December 31, | ||||||||||||||||
| (In millions) |
2015 | 2014 | 2015 | 2014 | ||||||||||||
| Change in plan assets |
||||||||||||||||
| Fair value of plan assets, beginning of year |
$ | 638.2 | $ | 659.4 | $ | - | $ | - | ||||||||
| Actual return (loss) on plan assets |
(5.3) | 40.1 | - | - | ||||||||||||
| Foreign currency translation adjustment |
(1.9) | (1.1) | - | - | ||||||||||||
| Employer contribution |
2.0 | 2.0 | 7.8 | 7.8 | ||||||||||||
| Plan participants’ contributions |
- | - | 1.4 | 1.4 | ||||||||||||
| Gross benefits paid |
(37.7) | (38.2) | (9.2) | (9.2) | ||||||||||||
| Settlements |
(0.5) | (24.0) | - | - | ||||||||||||
|
|
|
|
|
|
|
|
|
|||||||||
| Fair value of plan assets, end of year |
$ | 594.8 | $ | 638.2 | $ | - | $ | - | ||||||||
|
|
|
|
|
|
|
|
|
|||||||||
108
Table of Contents
Investments are classified based on the lowest level of input that is significant to the fair value measurement. The following table sets forth, by level within the fair value hierarchy, a summary of the investments measured at fair value and the target and current asset allocations.
| Asset Category |
Target Allocation 2016 |
Percentage of Plan Assets, December 31, 2015 |
Total | Quoted Prices in Active Markets for Identical Assets (Level 1) |
Significant Observable Inputs (Level 2) |
|||||||||||
| (In millions, except percentages) |
||||||||||||||||
| Short-term investment fund |
-% | 1% | $ | 8.5 | $ | - | $ | 8.5 | ||||||||
| U.S. equity securities: |
||||||||||||||||
| Consumer discretionary sector |
2.8 | 2.8 | - | |||||||||||||
| Consumer staples sector |
4.3 | 4.3 | - | |||||||||||||
| Energy sector |
0.2 | 0.2 | - | |||||||||||||
| Finance sector |
0.4 | 0.4 | - | |||||||||||||
| Health care sector |
4.6 | 4.6 | - | |||||||||||||
| Index funds |
117.8 | - | 117.8 | |||||||||||||
| Industrials sector |
1.3 | 1.3 | - | |||||||||||||
| Information technology sector |
3.5 | 3.5 | - | |||||||||||||
| Capital appreciation mutual fund |
56.1 | 56.1 | - | |||||||||||||
| Small cap growth mutual fund |
7.0 | 7.0 | - | |||||||||||||
| Pooled equity fund |
55.7 | - | 55.7 | |||||||||||||
|
|
|
|
|
|
|
|||||||||||
| Total U.S. equity securities |
44% | 43% | 253.7 | 80.2 | 173.5 | |||||||||||
| U.S. fixed income securities: |
||||||||||||||||
| Western assets total return funds |
80.6 | - | 80.6 | |||||||||||||
| Blackrock investments, institutional |
68.7 | - | 68.7 | |||||||||||||
| Other fixed income securities |
69.8 | 69.6 | 0.2 | |||||||||||||
|
|
|
|
|
|
|
|||||||||||
| Total fixed income securities |
37% | 37% | 219.1 | 69.6 | 149.5 | |||||||||||
| International securities: |
||||||||||||||||
| Equity securities |
53.6 | 6.7 | 46.9 | |||||||||||||
| Equity securities measured at net asset value(1) |
3.6 | - | - | |||||||||||||
| Euro pacific growth fund |
49.8 | 49.8 | - | |||||||||||||
| Fixed income securities |
1.6 | 1.6 | - | |||||||||||||
| Fixed income securities measured at net asset value(1) |
4.8 | - | - | |||||||||||||
|
|
|
|
|
|
|
|||||||||||
| Total international securities |
19% | 19% | 113.4 | 58.1 | 46.9 | |||||||||||
| Real estate partnership, measured at net asset value(1) |
-% | -% | 0.1 | - | - | |||||||||||
|
|
|
|
|
|
|
|||||||||||
| Total |
$ | 594.8 | $ | 207.9 | $ | 378.4 | ||||||||||
|
|
|
|
|
|
|
|||||||||||
| (1) | In accordance with Subtopic 820-10, certain investments that are measured at fair value using the net asset value per share (or its equivalent) practical expedient have not been classified in the fair value hierarchy. The fair value amounts presented in this table are intended to permit reconciliation of the fair value hierarchy to the amounts presented in the statement of financial position. See Note 5 for more details. |
109
Table of Contents
| Asset Category |
Target Allocation 2015 |
Percentage of Plan Assets, December 31, 2014 |
Total | Quoted Prices in Active Markets for Identical Assets (Level 1) |
Significant Observable Inputs (Level 2) |
|||||||||||||||
| (In millions, except percentages) |
||||||||||||||||||||
| Short-term investment fund |
-% | 2% | $ | 10.2 | $ | - | $ | 10.2 | ||||||||||||
| U.S. equity securities: |
||||||||||||||||||||
| Consumer discretionary sector |
4.3 | 4.3 | - | |||||||||||||||||
| Consumer staples sector |
6.1 | 6.1 | - | |||||||||||||||||
| Energy sector |
1.3 | 1.3 | - | |||||||||||||||||
| Finance sector |
2.3 | 2.3 | - | |||||||||||||||||
| Health care sector |
9.9 | 9.9 | - | |||||||||||||||||
| Index funds |
141.3 | - | 141.3 | |||||||||||||||||
| Industrials sector |
3.5 | 3.5 | - | |||||||||||||||||
| Information technology sector |
3.7 | 3.7 | - | |||||||||||||||||
| Capital appreciation mutual fund |
39.4 | 39.4 | - | |||||||||||||||||
| Small cap growth mutual fund |
7.2 | 7.2 | - | |||||||||||||||||
| Pooled equity fund |
55.5 | - | 55.5 | |||||||||||||||||
| Other |
1.3 | 1.3 | - | |||||||||||||||||
|
|
|
|
|
|
|
|||||||||||||||
| Total U.S. equity securities |
41% | 43% | 275.8 | 79.0 | 196.8 | |||||||||||||||
| U.S. fixed income securities: |
||||||||||||||||||||
| Western assets total return funds |
85.5 | - | 85.5 | |||||||||||||||||
| Blackrock investments, institutional |
70.8 | - | 70.8 | |||||||||||||||||
| Other fixed income securities |
71.4 | - | 71.4 | |||||||||||||||||
|
|
|
|
|
|
|
|||||||||||||||
| Total fixed income securities |
38% | 36% | 227.7 | - | 227.7 | |||||||||||||||
| International securities: |
||||||||||||||||||||
| Equity securities |
12% | 76.5 | 8.0 | 68.5 | ||||||||||||||||
| Equity securities measured at net asset value(1) |
5.0 | - | - | |||||||||||||||||
| Euro pacific growth fund |
6% | 35.4 | 35.4 | - | ||||||||||||||||
| Fixed income securities |
2.0 | 2.0 | - | |||||||||||||||||
| Fixed income securities measured at net asset value(1) |
4.2 | - | - | |||||||||||||||||
|
|
|
|
|
|
|
|||||||||||||||
| Total international securities |
18% | 19% | 123.1 | 45.4 | 68.5 | |||||||||||||||
| Long-biased hedge fund, measured at net asset value(1) |
3% | -% | 0.2 | - | - | |||||||||||||||
| Real estate partnership, measured at net asset value(1) |
-% | -% | 1.2 | - | - | |||||||||||||||
|
|
|
|
|
|
|
|||||||||||||||
| Total |
$ | 638.2 | $ | 124.4 | $ | 503.2 | ||||||||||||||
|
|
|
|
|
|
|
|||||||||||||||
| (1) | In accordance with Subtopic 820-10, certain investments that are measured at fair value using the net asset value per share (or its equivalent) practical expedient have not been classified in the fair value hierarchy. The fair value amounts presented in this table are intended to permit reconciliation of the fair value hierarchy to the amounts presented in the statement of financial position. See Note 5 for more details. |
110
Table of Contents
Funded Status. The following table shows the funded status of the pension and other OPEB benefits, reconciled to the amounts reported on the consolidated balance sheets:
| Pension Benefits | OPEB | |||||||||||||||
| As of December 31, | ||||||||||||||||
| (In millions) |
2015 | 2014 | 2015 | 2014 | ||||||||||||
| Funded status, end of year: |
||||||||||||||||
| Fair value of plan assets |
$ | 594.8 | $ | 638.2 | $ | - | $ | - | ||||||||
| Benefit obligations |
737.0 | 786.8 | 69.3 | 111.7 | ||||||||||||
|
|
|
|
|
|
|
|
|
|||||||||
| Unfunded status |
$ | (142.2) | $ | (148.6) | $ | (69.3) | $ | (111.7) | ||||||||
|
|
|
|
|
|
|
|
|
|||||||||
| Amounts recognized in the balance sheets consist of: |
||||||||||||||||
| Current liability |
$ | (1.5) | $ | (1.5) | $ | (7.2) | $ | (8.7) | ||||||||
| Noncurrent liability |
(140.7) | (147.1) | (62.1) | (103.0) | ||||||||||||
|
|
|
|
|
|
|
|
|
|||||||||
| Amount recognized, end of year |
$ | (142.2) | $ | (148.6) | $ | (69.3) | $ | (111.7) | ||||||||
|
|
|
|
|
|
|
|
|
|||||||||
| Gross amounts recognized in accumulated other comprehensive income (loss) consist of: |
||||||||||||||||
| Net actuarial gain (loss) |
(135.1) | $ | (131.5) | (3.4) | $ | (12.3) | ||||||||||
| Prior service credit (cost) |
(0.1) | (0.1) | 90.7 | 71.2 | ||||||||||||
|
|
|
|
|
|
|
|
|
|||||||||
| Amount recognized, end of year |
$ | (135.2) | $ | (131.6) | $ | 87.3 | $ | 58.9 | ||||||||
|
|
|
|
|
|
|
|
|
|||||||||
Our pension plans have projected benefit obligations in excess of the fair value of plan assets. For these plans, the projected benefit obligations and the fair value of plan assets were as follows:
| Pension Benefits As of December 31, |
||||||||
| (In millions) |
2015 | 2014 | ||||||
| Projected benefit obligation, end of year |
$ | 737.0 | $ | 786.8 | ||||
| Fair value of plan assets, end of year |
594.8 | 638.2 | ||||||
Our pension plans have accumulated benefit obligations in excess of the fair value of plan assets. For these plans, the accumulated benefit obligations and the fair value of plan assets were as follows:
| Pension Benefits As of December 31, |
||||||||
| (In millions) |
2015 | 2014 | ||||||
| Accumulated benefit obligation, end of year |
$ | 725.2 | $ | 784.0 | ||||
| Fair value of plan assets, end of year |
585.2 | 638.2 | ||||||
Changes in Other Comprehensive Income (Loss). The following table summarizes the changes in plan assets and benefit obligations which were recognized in other comprehensive income (loss):
| Pension Benefits | OPEB | |||||||||||||||||||||||
| As of December 31, | ||||||||||||||||||||||||
| End of year (in millions): |
2015 | 2014 | 2013 | 2015 | 2014 | 2013 | ||||||||||||||||||
| Current year actuarial gain (loss) |
$ | (6.2) | $ | (142.5) | $ | 102.2 | $ | 8.8 | $ | (16.6) | $ | 4.2 | ||||||||||||
| Amortization of actuarial loss (gain) |
2.6 | (0.4) | (13.3) | 0.1 | 0.1 | - | ||||||||||||||||||
| Current year prior service credit |
- | - | - | 29.8 | - | 82.6 | ||||||||||||||||||
| Amortization of prior service credit |
- | - | - | (10.2) | (9.2) | (2.3) | ||||||||||||||||||
|
|
|
|
|
|
|
|
|
|
|
|
|
|||||||||||||
| Total recognized in other comprehensive income (loss) |
$ | (3.6) | $ | (142.9) | $ | 88.9 | $ | 28.5 | $ | (25.7) | $ | 84.5 | ||||||||||||
|
|
|
|
|
|
|
|
|
|
|
|
|
|||||||||||||
| Total recognized in net periodic benefit cost and other comprehensive income (loss) |
$ | 4.0 | $ | (137.1) | $ | 106.2 | $ | 34.2 | $ | (21.9) | $ | 78.5 | ||||||||||||
|
|
|
|
|
|
|
|
|
|
|
|
|
|||||||||||||
111
Table of Contents
The following table summarizes the estimated amount that will be amortized from accumulated other comprehensive income (loss) into net periodic benefit cost in 2016:
| (In millions) |
Pension Benefits |
OPEB | ||||||
| Prior service credit |
$ | - | $ | 12.2 | ||||
| Actuarial loss |
(2.8) | (0.1) | ||||||
|
|
|
|
|
|||||
| Total |
$ | (2.8) | $ | 12.1 | ||||
|
|
|
|
|
|||||
Net Periodic Benefit Income (Expense). Net periodic benefit income (expense) for the years ended December 31, 2015, 2014 and 2013 includes the following:
| Pension Benefits Year Ended December 31, |
OPEB Year Ended December 31, |
|||||||||||||||||||||||
| (In millions) |
2015 | 2014 | 2013 | 2015 | 2014 | 2013 | ||||||||||||||||||
| Components of net periodic benefit income (expense): |
|
|||||||||||||||||||||||
| Interest cost |
$ | (30.7) | $ | (31.7) | $ | (28.0) | $ | (3.5) | $ | (4.4) | $ | (6.4) | ||||||||||||
| Service cost |
(4.3) | (3.6) | (6.6) | (0.9) | (0.8) | (2.0) | ||||||||||||||||||
| Expected return on assets |
45.2 | 47.0 | 38.5 | - | - | - | ||||||||||||||||||
| Amortization of: |
||||||||||||||||||||||||
| Prior service credit |
- | - | - | 10.2 | 9.2 | 2.3 | ||||||||||||||||||
| Actuarial gain (loss) |
(2.6) | 0.4 | (2.1) | (0.1) | (0.1) | - | ||||||||||||||||||
|
|
|
|
|
|
|
|
|
|
|
|
|
|||||||||||||
| Total amortization |
(2.6) | 0.4 | (2.1) | 10.1 | 9.1 | 2.3 | ||||||||||||||||||
| Settlement loss |
- | (5.8) | - | - | - | - | ||||||||||||||||||
| Curtailment gain |
- | - | 15.5 | - | - | - | ||||||||||||||||||
| Other components of net periodic pension cost |
- | (0.5) | - | - | - | - | ||||||||||||||||||
|
|
|
|
|
|
|
|
|
|
|
|
|
|||||||||||||
| Total net periodic benefit income (expense) |
$ | 7.6 | $ | 5.8 | $ | 17.3 | $ | 5.7 | $ | 3.9 | $ | (6.1) | ||||||||||||
|
|
|
|
|
|
|
|
|
|
|
|
|
|||||||||||||
Assumptions for Defined Benefit Obligations. Mortality is a key assumption used to determine the benefit obligation for our defined benefit pension and OPEB plans. The Company continues to measure year-end benefit obligations using the SAO’s RP-2014 base mortality table, with adjustments by plan. The Company selected the Scale BB-2D generational mortality projection scale to reflect mortality improvement rates for purposes of measuring pension and OPEB benefit obligations at year-end.
The discount rate reflects the rate at which pension benefit obligations could be effectively settled. For the U.S. and Canadian plans, we determined our discount rate by matching the expected cash flows of our pension and OPEB obligations to a yield curve generated from a broad portfolio of high-quality fixed rate debt instruments. For Taiwan, a government bond yield was used to determine the discount rate. The rate of compensation is based on projected salary increases for our plan participants. The healthcare cost trend assumption is based on a number of factors including our actual healthcare cost increases, the design of our benefit programs, the demographics of our active and retiree populations and external expectations of future medical cost inflation rates. The weighted average assumptions used for determining our benefit obligations as of December 31, 2015, 2014 and 2013 are as follows:
| Pension Benefits | OPEB | |||||||||||||||||||||||
| 2015 | 2014 | 2013 | 2015 | 2014 | 2013 | |||||||||||||||||||
| Discount rate |
4.34% | 3.98% | 4.81% | 3.61% | 3.90% | 4.65% | ||||||||||||||||||
| Rate of compensation increase |
3.01% | 3.01% | 3.00% | NA | NA | 3.00% | ||||||||||||||||||
| Health care cost trend rate |
||||||||||||||||||||||||
| -- Initial rate |
NA | NA | NA | 7.47% | 7.00% | 7.49% | ||||||||||||||||||
| -- Ultimate rate |
NA | NA | NA | 4.50% | 4.50% | 4.50% | ||||||||||||||||||
| -- Years to ultimate |
NA | NA | NA | 12 | 9 | 10 | ||||||||||||||||||
112
Table of Contents
Assumptions for Net Periodic Costs. The rate of compensation increase for our OPEB plans was not applicable in 2014 and 2015 due to benefit changes made to the U.S. OPEB plans, eliminating the salary-based life insurance benefit for future non-bargained retirees, subsequent to 2014. The following weighted average assumptions were used to determine the net periodic costs for the defined benefit pension and OPEB plans for the years presented:
| Pension Benefits | OPEB | |||||||||||||||||||||||
| 2015 | 2014 | 2013 | 2015 | 2014 | 2013 | |||||||||||||||||||
| Discount rate |
3.97% (1) | 4.81% | 4.16% | 3.60% (1) | 4.65% | 4.39% | ||||||||||||||||||
| Expected long-term rate of return on plan assets |
7.39% | 7.42% | 6.91% | NA | NA | NA | ||||||||||||||||||
| Rate of compensation increase |
3.01% | 3.00% | 3.14% | NA | NA | 3.11% | ||||||||||||||||||
| Health care cost trend rate |
||||||||||||||||||||||||
| -- Initial rate |
NA | NA | NA | 7.00% | 7.49% | 6.63% | ||||||||||||||||||
| -- Ultimate rate |
NA | NA | NA | 4.50% | 4.50% | 4.50% | ||||||||||||||||||
| -- Years to ultimate |
NA | NA | NA | 9 | 10 | 11 | ||||||||||||||||||
| (1) | The weighted average spot rate selected for pension benefit and OPEB plans, respectively, in 2015. |
In selecting the rates for our current and long-term healthcare cost assumptions, we take into consideration a number of factors including our actual healthcare cost increases, the design of our benefit programs, the demographics of our active and retiree populations and external expectations of future medical cost inflation rates. If the assumed healthcare cost trend rates were 1 percent higher or 1 percent lower, the estimated OPEB cost for 2015 would increase by $0.1 million or decrease by $0.1 million, respectively.
The expected long-term rate of return on plan assets assumption is based on historical and projected rates of return for current and planned asset classes in the plan’s investment portfolio. Projected rates of return for each of the plans’ projected asset classes were selected after analyzing historical experience and future expectations of the returns and volatility of the various asset classes. Based on the target asset allocation for each asset class, the overall expected rate of return for the portfolio was developed and adjusted for historical and expected experience of active portfolio management results compared to the benchmark returns and for the effect of expenses paid from plan assets.
Our investment committee establishes investment policies and strategies and regularly monitors the performance of the plans’ funds. Our investment strategy with respect to U.S. pension plan assets is to invest the assets in accordance with the “prudent investor” guidelines contained in the Employee Retirement Income Security Act of 1974 and fiduciary standards. Our policy on funding is to contribute an amount within the range of the minimum required and the maximum tax-deductible contribution.
Expected Cash Flows. During 2016, we expect to make contributions of $2.0 million to our pension plans and $7.3 million to our unfunded OPEB plans for benefit payments. We do not expect any federal subsidy with regards to our OPEB plans. Expected benefit payments for all pension and OPEB plans are as follows:
| Pension | OPEB | |||||||
| (In millions) |
Benefits | (Gross) | ||||||
| Expected benefit payments: |
||||||||
| 2016 |
$ | 39.2 | $ | 7.3 | ||||
| 2017 |
40.3 | 7.0 | ||||||
| 2018 |
41.3 | 6.9 | ||||||
| 2019 |
42.4 | 6.9 | ||||||
| 2020 |
43.8 | 6.9 | ||||||
| 2021-2025 |
230.8 | 32.9 | ||||||
113
Table of Contents
Defined Contribution Plans
Most employees are covered by defined contribution plans under which we make contributions to individual employee accounts. Our expense related to our defined contribution plans, which includes the annual company discretionary retirement contribution, was approximately $24.9 million, $21.1 million and $15.7 million for the years ended December 31, 2015, 2014 and 2013, respectively.
15. ACCUMULATED OTHER COMPREHENSIVE INCOME (LOSS) AND OTHER COMPREHENSIVE INCOME (LOSS)
Accumulated other comprehensive income (loss) includes (i) adjustments to pension and OPEB plan liabilities; (ii) foreign currency translation of assets and liabilities of foreign subsidiaries and the effects of exchange rate changes on intercompany balances of a long-term nature; (iii) equity investee’s other comprehensive income or loss items; and (iv) unrealized gains or losses on derivative financial instruments designated as cash flow hedges. Amounts recorded in accumulated other comprehensive income (loss), net of tax, as of December 31, 2015 and 2014, and changes within those periods are as follows:
| (In millions) |
Foreign Currency Items |
Derivative Cash Flow Hedges |
Accrued Pension and OPEB Plan Liabilities |
Accumulated Other Comprehensive Income (Loss) |
||||||||||||
| Balance at January 1, 2014 |
$ | 6.7 | $ | (0.9) | $ | 60.5 | $ | 66.3 | ||||||||
| Other comprehensive loss before reclassifications |
(27.1) | (7.4) | (103.2) | (137.7) | ||||||||||||
| Amounts reclassified from accumulated other |
- | - | (2.3) | (2.3) | ||||||||||||
|
|
|
|
|
|
|
|
|
|||||||||
| Net current period other comprehensive loss |
(27.1) | (7.4) | (105.5) | (140.0) | ||||||||||||
|
|
|
|
|
|
|
|
|
|||||||||
| Balance at December 31, 2014 |
(20.4) | (8.3) | (45.0) | (73.7) | ||||||||||||
| Other comprehensive income (loss) before reclassifications |
(69.0) | 15.7 | 20.6 | (32.7) | ||||||||||||
| Amounts reclassified from accumulated other |
- | (6.9) | (4.7) | (11.6) | ||||||||||||
|
|
|
|
|
|
|
|
|
|||||||||
| Net current period other comprehensive income (loss) |
(69.0) | 8.8 | 15.9 | (44.3) | ||||||||||||
|
|
|
|
|
|
|
|
|
|||||||||
| Balance at December 31, 2015 |
$ | (89.4) | $ | 0.5 | $ | (29.1) | $ | (118.0) | ||||||||
|
|
|
|
|
|
|
|
|
|||||||||
114
Table of Contents
Other Comprehensive Income (Loss)
Other comprehensive income (loss) is derived from adjustments to reflect the unrealized gain or loss on derivatives, changes in pension and OPEB liability adjustments, changes in equity investee’s other comprehensive income or loss and changes in foreign currency translation adjustments. The components of other comprehensive income (loss) for the years ended December 31, 2015, 2014 and 2013 are as follows:
| Year Ended December 31, | ||||||||||||
| (In millions) |
2015 | 2014 | 2013 | |||||||||
| Change in foreign currency translation adjustment: |
||||||||||||
| Foreign currency translation adjustments |
$ | (82.5) | $ | (57.7) | $ | (34.7) | ||||||
| Tax benefit |
(9.7) | (22.9) | (14.7) | |||||||||
|
|
|
|
|
|
|
|||||||
| Foreign currency translation adjustments, net of tax |
$ | (72.8) | $ | (34.8) | $ | (20.0) | ||||||
|
|
|
|
|
|
|
|||||||
| Change in derivative cash flow hedges: |
||||||||||||
| Commodity hedge contracts |
$ | 10.2 | $ | (10.6) | $ | - | ||||||
| Equity interest in investee’s other comprehensive income (loss) |
3.9 | (1.2) | (1.4) | |||||||||
|
|
|
|
|
|
|
|||||||
| Pre-tax amount |
14.1 | (11.8) | (1.4) | |||||||||
| Tax expense (benefit) |
5.3 | (4.4) | (0.5) | |||||||||
|
|
|
|
|
|
|
|||||||
| Derivative cash flow hedges, net of tax |
$ | 8.8 | $ | (7.4) | $ | (0.9) | ||||||
|
|
|
|
|
|
|
|||||||
| Change in pension and OPEB liability adjustments: |
||||||||||||
| Adjustments to pension liabilities |
$ | 32.6 | $ | (164.9) | $ | 189.1 | ||||||
| Curtailment gain |
- | - | (15.5) | |||||||||
| Settlement loss |
- | 5.8 | - | |||||||||
| Amortization of actuarial gain (loss) and prior service credit |
(7.5) | (9.5) | (0.2) | |||||||||
|
|
|
|
|
|
|
|||||||
| Pre-tax amount |
25.1 | (168.6) | 173.4 | |||||||||
| Tax expense (benefit) |
9.4 | (63.1) | 64.3 | |||||||||
|
|
|
|
|
|
|
|||||||
| Pension and OPEB liability adjustments, net of tax |
$ | 15.7 | $ | (105.5) | $ | 109.1 | ||||||
|
|
|
|
|
|
|
|||||||
| Other comprehensive income (loss), before income taxes |
$ | (43.3) | $ | (238.1) | $ | 137.3 | ||||||
| Tax expense (benefit) for the period |
5.0 | (90.4) | 49.1 | |||||||||
|
|
|
|
|
|
|
|||||||
| Other comprehensive income (loss), net of tax |
$ | (48.3) | $ | (147.7) | $ | 88.2 | ||||||
|
|
|
|
|
|
|
|||||||
The components of other comprehensive income (loss) that have been reclassified during the years ended December 31, 2015, 2014 and 2013 are as follows:
| Year Ended December 31, | Affected Line Items on the Unaudited Consolidated Statements of Operations | |||||||||||||
| (In millions) |
2015 | 2014 | 2013 | |||||||||||
| Details about other comprehensive income (loss) components: |
||||||||||||||
| Change in derivative cash flow hedges: |
||||||||||||||
| Loss on derivative cash flow hedges |
$ | (11.1) | $ | - | $ | - | Cost of sales | |||||||
| Tax benefit |
(4.2) | - | - | Provision for (benefit from) income taxes | ||||||||||
|
|
|
|
|
|
|
|||||||||
| Reclassifications for the period, net of tax |
$ | (6.9) | $ | - | $ | - | ||||||||
|
|
|
|
|
|
|
|||||||||
| Change in pension and OPEB liability adjustments: |
||||||||||||||
| Curtailment gain |
$ | - | $ | - | $ | (15.5) | Integration-related costs and other, net | |||||||
| Settlement loss |
- | 5.8 | - | Integration-related costs and other, net | ||||||||||
| Amortization of actuarial gain (loss) and prior service credit |
(7.5) | (9.5) | (0.2) | Cost of sales and selling, general and administrative expenses | ||||||||||
|
|
|
|
|
|
|
|||||||||
| Pre-tax amount |
(7.5) | (3.7) | (15.7) | |||||||||||
| Tax benefit |
(2.8) | (1.4) | (6.0) | Provision for (benefit from) income taxes | ||||||||||
|
|
|
|
|
|
|
|||||||||
| Reclassifications for the period, net of tax |
$ | (4.7) | $ | (2.3) | $ | (9.7) | ||||||||
|
|
|
|
|
|
|
|||||||||
115
Table of Contents
For the years ended December 31, 2015, 2014 and 2013, income (loss) from continuing operations before income taxes consisted of the following:
| Year Ended December 31, | ||||||||||||
| (In millions) |
2015 | 2014 | 2013 | |||||||||
| United States operations |
$ | (837.6) | $ | 62.5 | $ | 181.0 | ||||||
| Foreign operations |
(55.4) | 15.9 | 31.5 | |||||||||
|
|
|
|
|
|
|
|||||||
| Total |
$ | (893.0) | $ | 78.4 | $ | 212.5 | ||||||
|
|
|
|
|
|
|
|||||||
Provision for (benefit from) income taxes from continuing operations consists of the following:
| Year Ended December 31, | ||||||||||||
| (In millions) |
2015 | 2014 | 2013 | |||||||||
| Current income taxes: |
||||||||||||
| Federal |
$ | (5.5) | $ | 28.7 | $ | 98.2 | ||||||
| State |
(1.7) | 4.7 | 12.8 | |||||||||
| Foreign |
5.5 | (0.2) | 7.8 | |||||||||
|
|
|
|
|
|
|
|||||||
| Total current |
(1.7) | 33.2 | 118.8 | |||||||||
|
|
|
|
|
|
|
|||||||
| Deferred income taxes: |
||||||||||||
| Federal |
(35.6) | (16.2) | (49.5) | |||||||||
| State |
(2.7) | (1.1) | (2.1) | |||||||||
| Foreign |
(3.9) | (1.6) | (4.3) | |||||||||
|
|
|
|
|
|
|
|||||||
| Total deferred |
(42.2) | (18.9) | (55.9) | |||||||||
|
|
|
|
|
|
|
|||||||
| Provision for (benefit from) income taxes |
$ | (43.9) | $ | 14.3 | $ | 62.9 | ||||||
|
|
|
|
|
|
|
|||||||
A reconciliation of the statutory federal income tax rate to the effective income tax rate is as follows:
| Year Ended December 31, | ||||||||||||
| 2015 | 2014 | 2013 | ||||||||||
| U.S. statutory federal income tax rate |
35.0 | % | 35.0 | % | 35.0 | % | ||||||
| State and local income taxes, net of federal benefit |
0.3 | 3.1 | 3.3 | |||||||||
| Difference between U.S. and foreign tax rates |
0.6 | (2.2 | ) | 0.1 | ||||||||
| Tax credits |
0.1 | (2.5 | ) | (0.8 | ) | |||||||
| Domestic manufacturing deduction |
- | (6.8 | ) | (4.9 | ) | |||||||
| Percentage depletion |
0.7 | (5.0 | ) | (1.7 | ) | |||||||
| Net change in unrecognized tax benefits |
0.3 | (11.8 | ) | (1.4 | ) | |||||||
| Change in valuation allowance |
(0.6 | ) | 2.1 | (0.4 | ) | |||||||
| Goodwill impairment |
(31.3 | ) | 1.8 | 3.0 | ||||||||
| Non-deductible interest |
- | 1.3 | - | |||||||||
| Other, net |
(0.2 | ) | 3.2 | (2.6 | ) | |||||||
|
|
|
|
|
|
|
|||||||
| Effective income tax rate |
4.9 | % | 18.2 | % | 29.6 | % | ||||||
|
|
|
|
|
|
|
|||||||
Net cash payments for income taxes during the years ended December 31, 2015, 2014 and 2013 were $30.3 million, $63.3 million and $130.9 million, respectively.
116
Table of Contents
Our net deferred tax liability consisted of the following major items:
| As of December 31, | ||||||||
| (In millions) |
2015 | 2014 | ||||||
| Deferred tax assets: |
||||||||
| Net operating loss carryforwards |
$ | 27.8 | $ | 35.1 | ||||
| Employee compensation |
14.9 | 20.2 | ||||||
| Accrued liabilities |
12.1 | 24.2 | ||||||
| Tax credits |
21.7 | 24.9 | ||||||
| Environmental liabilities |
14.5 | 15.4 | ||||||
| Property, plant and equipment |
38.2 | 39.1 | ||||||
| Pension and OPEB liabilities |
77.5 | 96.3 | ||||||
| Other deferred tax assets |
16.6 | 21.2 | ||||||
|
|
|
|
|
|||||
| Total deferred tax assets |
223.3 | 276.4 | ||||||
|
|
|
|
|
|||||
| Valuation allowance |
(77.5 | ) | (86.6 | ) | ||||
|
|
|
|
|
|||||
| Total deferred tax assets |
145.8 | 189.8 | ||||||
| Deferred tax liability: |
||||||||
| Property, plant and equipment |
(362.1 | ) | (391.8 | ) | ||||
| Intangible assets |
(367.9 | ) | (392.6 | ) | ||||
| Inventories |
(3.9 | ) | (11.1 | ) | ||||
| Debt restructuring |
(19.8 | ) | (29.3 | ) | ||||
| Foreign outside basis differences |
(37.5 | ) | (68.2 | ) | ||||
| Other |
(19.7 | ) | (15.2 | ) | ||||
|
|
|
|
|
|||||
| Total deferred tax liability |
(810.9 | ) | (908.2 | ) | ||||
|
|
|
|
|
|||||
| Net deferred tax liability |
$ | (665.1 | ) | $ | (718.4 | ) | ||
|
|
|
|
|
|||||
As of December 31, 2015, we had U.S. state and foreign net operating loss carryforwards (“NOLs”). Our foreign NOLs relate to our operations in Canada and reside in both federal and provincial tax jurisdictions. The jurisdictional amount of NOLs as of December 31, 2015, and the years in which they will expire, are as follows:
| Jurisdiction (in millions) | NOL Amount |
Year of Expiration | ||||
| U.S. State |
$ | 33.4 | 2029-2035 | |||
| Canada federal |
107.6 | 2031 | ||||
| Canada provincial |
178.1 | 2031 | ||||
In assessing the realizability of deferred tax assets, management considers whether it is more likely than not that some or all of the deferred tax assets will not be realized. The ultimate realization of deferred tax assets depends on the generation of future taxable income during the periods in which those temporary differences are deductible. Management considers the scheduled reversal of deferred tax liabilities (including the impact of available carryback and carryforward periods), projected taxable income and tax-planning strategies available to us in making this assessment. Substantially all of our valuation allowance relates to deferred tax assets in the Canadian operations of Royal Group, Inc. Our valuation allowance decreased from $86.6 million at December 31, 2014 to $77.5 million at December 31, 2015 predominantly because of foreign exchange differences. We evaluate the recoverability and realizability of deferred tax assets and the provisions for valuation allowance periodically based on our projections of future taxable earnings, timing of the reversal of future taxable temporary differences (including the impact of available carryback and carryforward periods) and tax planning strategies available to us to
117
Table of Contents
determine the timing for and extent to which we will release our valuation allowance against our net deferred tax assets in Canada in the future.
Subsequently recognized tax benefits related to the valuation allowance for deferred tax assets as of December 31, 2015 and 2014 will result in an income tax benefit if realized in a future year of $77.5 million and $86.6 million, respectively. It is reasonably possible that our valuation allowance may decrease significantly during the next 12 months.
As of December 31, 2015, we had U.S. state and foreign tax credit carryovers. These tax credits expire over varying amounts and periods as follows:
| Jurisdiction (in millions) |
Tax credit Carryover |
Year of Expiration |
||||||
| U.S. state tax credits (gross of federal benefit) |
$ | 19.3 | Indefinite | |||||
| Canadian income tax credits |
9.0 | 2016-2033 | ||||||
We are not permanently reinvested with respect to the outside basis difference for all our foreign subsidiaries. As of December 31, 2015 and 2014, the deferred tax liability recorded on the outside basis difference was $37.5 million and $68.2 million, respectively.
Liability for Unrecognized Income Tax Benefits
We account for uncertain income tax positions in accordance with ASC topic 740, Accounting for Income Taxes. ASC topic 740 prescribes a recognition threshold and measurement attribute for the financial statement recognition and measurement of a tax position taken or expected to be taken in a tax return. Under ASC topic 740, we recognize the financial statement effects of a tax position when it is more likely than not, based upon the technical merits, that the position will be sustained upon examination. Conversely, we derecognize a previously recognized tax position in the first period in which it is no longer more likely than not that the tax position would be sustained upon examination. A tax position that meets the more likely than not recognition threshold will initially and subsequently be measured as the largest amount of tax benefit that is greater than fifty percent likely of being realized upon ultimate settlement with a taxing authority. We also recognize interest expense by applying a rate of interest to the difference between the tax position recognized in accordance with ASC topic 740 and the amount previously taken or expected to be taken in a tax return. We classify interest expense and related penalties, if any, with respect to our uncertain tax positions in the provision for income taxes.
As of December 31, 2015 and 2014, our liability for unrecognized income tax benefits was approximately $6.7 million and $10.0 million, respectively. If recognized, $3.3 million of this amount would affect our effective tax rate. As of December 31, 2015 and 2014, our liability for interest and penalties was approximately $0.8 million and $0.9 million, respectively. For each of the years ended December 31, 2015, 2014 and 2013, we recognized approximately $0.3 million, $0.3 million and $0.7 million, respectively, of additional interest expense in our income tax provision related to our liability for unrecognized income tax benefits. During 2016, it is reasonably possible that uncertain tax positions in the U.S. will be recognized as a result of the lapse of the applicable statute of limitations. The aggregate amount of these positions is approximately $0.5 million. We are under examination by the Canada Revenue Agency for years ended 2012 and 2013. The results of the Canadian Revenue Agency examinations cannot presently be determined.
118
Table of Contents
The following table describes the tax years that remain subject to examination by major tax jurisdiction:
| Tax Jurisdiction |
Open Years | |
| United States Federal |
2012-2015 | |
| Canada |
2011-2015 | |
| Various states |
2011-2015 | |
| Taiwan |
2010-2015 |
Reconciliations of the liability for unrecognized tax benefits for the years ended December 31, 2015, 2014 and 2013 are set forth in the table below:
| Year Ended December 31, | ||||||||||||
| (In millions) |
2015 | 2014 | 2013 | |||||||||
| Balance as of beginning of the year |
$ | 10.0 | $ | 16.3 | $ | 18.5 | ||||||
| Additions for current year tax positions |
1.4 | 0.3 | 0.2 | |||||||||
| Additions for prior year tax positions |
0.9 | 1.0 | 1.2 | |||||||||
| Reductions for prior year tax positions |
(0.2 | ) | (4.0 | ) | (0.2 | ) | ||||||
| Reductions related to expirations of statute of limitations |
(4.3 | ) | (2.8 | ) | (2.5 | ) | ||||||
| Foreign currency translation |
(1.1 | ) | (0.8 | ) | (0.9 | ) | ||||||
|
|
|
|
|
|
|
|||||||
| Balance as of the end of the year |
$ | 6.7 | $ | 10.0 | $ | 16.3 | ||||||
|
|
|
|
|
|
|
|||||||
17. INVESTMENTS AND RELATED PARTY TRANSACTIONS
Chlorovinyls
We have investments that are accounted for using the equity method. In 2015, equity method investments primarily included: (i) $5.8 million, relating to our 50-percent interest in Shriram Vinyl Polytech Private Limited (“SVPP”), a joint venture formed in April 2014 to facilitate the manufacture and sale of certain compound products in India; and (ii) $9.5 million relating to our 50-percent interest in RS Cogen LLC (“RS Cogen”), which we acquired in the Merger; and (iii) $0.5 million relating to our 50-percent interest in Vinyl Solutions, LLC (“Vinyl Solutions”) a compounding manufacturer of specialty compounds. In 2014, our investments in joint ventures primarily included: (i) $5.8 million relating to SVPP; (ii) $4.6 million relating to RS Cogen; and (iii) $0.6 million relating to Vinyl Solutions.
As of December 31, 2015, 2014 and 2013 and for each of the three years ended December 31, 2015, 2014 and 2013, our related party balances for the equity method investments in our chlorovinyls segment consisted of the following:
| (In millions) |
2015 | 2014 | 2013 | Financial Statement Classification | ||||||||||
| Equity method investments |
$ | 15.8 | $ | 11.0 | $ | 11.7 | Other long term assets | |||||||
| Receivables due from affiliates |
4.1 | 5.5 | 5.0 | Accounts receivables | ||||||||||
| Amounts due to affiliates |
0.2 | 0.4 | 1.9 | Accounts payable | ||||||||||
| Sales to affiliates |
17.1 | 16.9 | 10.8 | Sales | ||||||||||
| Equity in earnings from equity method investments |
0.5 | 0.6 | 0.8 | Cost of sales | ||||||||||
RS Cogen produces electricity and steam that are primarily sold to Axiall and its joint venture partner under take-or-pay contracts that extend to 2022. Axiall’s future commitment to purchase electricity and steam from the RS Cogen joint venture per the take-or-pay contracts approximates $23.5 million per year subject to contractually defined inflation adjustments. As of December 31, 2015, our future commitment under the take-or-pay arrangement approximates $160.7 million in the aggregate, with purchases during the years ended December 31, 2015, 2014 and 2013 totaling $25.8 million, $25.0 million and $22.9 million, respectively.
119
Table of Contents
RS Cogen is a variable interest entity. The daily operations of the cogeneration facility are the activities of RS Cogen that most significantly impact its economic performance. These activities are directed by a management team with oversight by a management committee that has equal representation from Axiall and Entergy Corporation. By the terms of the joint venture agreement, all decisions of the management committee require approval by a majority of its members. Accordingly, the power to direct the activities of RS Cogen is equally shared between RS Cogen’s two owners and, thus, Axiall does not consider itself to be the joint venture’s primary beneficiary. Accordingly, Axiall accounts for its investment in RS Cogen under the equity method of accounting. We have recorded our investment in RS Cogen in other assets in the accompanying consolidated balance sheets and our share of investee earnings in cost of goods sold in the consolidated statements of operations.
The following table summarizes our maximum exposure to loss associated with RS Cogen as of December 31, 2015 and 2014.
| December 31, | ||||||||
| (In millions) | 2015 | 2014 | ||||||
| Investment in and net advances to RS Cogen |
$ | 9.5 | $ | 4.6 | ||||
| Supply contracts |
36.3 | 38.5 | ||||||
|
|
|
|
|
|||||
| Maximum exposure to loss |
$ | 45.8 | $ | 43.1 | ||||
|
|
|
|
|
|||||
We produce chlorine, caustic soda, hydrogen, hydrochloric acid (“HCL”) and sodium hypochlorite (bleach) at our Kaohsiung, Taiwan facility. The Kaohsiung, Taiwan facility is operated by Taiwan Chlorine Industries, Ltd. (“TCI”), a joint venture in which we own a 60-percent interest that is consolidated in our financial statements. A reconciliation of our minority partner’s ownership as of December 31, 2015 and 2014, reported as noncontrolling interest is set forth in the table below:
| Year Ended December 31, | ||||||||
| (In millions) |
2015 | 2014 | ||||||
| Noncontrolling interest - beginning of period |
$ | 107.9 | $ | 119.4 | ||||
| Net income (loss) attributable to noncontrolling interest |
(20.7) | 3.9 | ||||||
| Other comprehensive loss attributable to noncontrolling interest |
(4.0) | (7.7) | ||||||
| Distribution to noncontrolling interest |
(8.4) | (7.7) | ||||||
|
|
|
|
|
|||||
| Noncontrolling interest - end of period |
$ | 74.8 | $ | 107.9 | ||||
|
|
|
|
|
|||||
On June 17, 2015, Eagle, a wholly-owned subsidiary of the Company, entered into an amended and restated limited liability company agreement with Lotte related to the formation of LACC, which was formed by Eagle and Lotte to design, build and operate the Plant. The Plant will provide partial backward integration for Axiall’s vinyls business and will supply a new MEG facility being built by Lotte. Pursuant to a contribution and subscription agreement, dated as of June 17, 2015, between the Company, Eagle and LACC, Eagle has agreed to make a maximum capital commitment to LACC of up to $225 million to fund the construction costs of the Plant. Eagle’s investment is expected to represent approximately 10 percent of the interests of LACC. Eagle and Lotte also entered into a call option agreement, dated as of June 17, 2015, pursuant to which Eagle has the right, but not the obligation, until the third anniversary of the substantial completion of the Plant, to acquire up to a 50 percent ownership interest in LACC from Lotte.
On December 17, 2015, Axiall and Lotte announced that the companies have reached a final investment decision to construct the Plant and LACC entered into the engineering, procurement and construction agreement with CB&I Inc., the construction contractor.
120
Table of Contents
The Plant is being built adjacent to Axiall’s largest chlor-alkali chemical facility, located in Lake Charles, to take advantage of Axiall’s existing infrastructure, access to competitive feedstock resources, and ethylene distribution infrastructure. The anticipated start-up for the Plant is expected to be the beginning of 2019.
As of December 31, 2015, our investment in LACC is $14.9 million and is reflected in other assets in our consolidated balance sheets. Our investment in LACC is accounted for under the cost method.
Building Products
We have an investment in the building products segment that we account for under the equity method of accounting. As of December 31, 2015, 2014 and 2013 and for the three years ended December 31, 2015, 2014 and 2013, our related party transactions in our building products segment consisted of the following:
| (In millions) |
2015 | 2014 | 2013 | Financial Statement Classification | ||||||||||
| Equity method investments |
$ | 0.7 | $ | 0.8 | $ | 0.6 | Other long term assets | |||||||
| Receivables due from affiliates |
1.2 | 1.2 | 1.0 | Accounts receivables | ||||||||||
| Sales to affiliates |
8.0 | 8.8 | 11.6 | Sales | ||||||||||
| Equity in earnings from equity method investments |
- | 0.3 | - | Cost of sales | ||||||||||
We manage our operating activities in two reportable segments: (i) chlorovinyls and (ii) building products. These two segments reflect the organization used by our management to allocate resources and for internal reporting purposes. Our chlorovinyls segment produces a highly integrated chain of products, including chlor-alkali and derivative products (chlorine, caustic soda, VCM, vinyl resins, ethylene dichloride (or 1, 2 dichloroethane) (“EDC”), chlorinated solvents, calcium hypochlorite, HCL) and compound products (vinyl compounds, compound additives and plasticizers)). Our building products segment consists of two primary product groups: (i) window and door profiles and trim, mouldings and deck products; and (ii) outdoor building products, which includes siding, exterior accessories, pipe and pipe fittings.
Earnings of our segments exclude interest income and expense, unallocated corporate expenses and general plant services and provision for income taxes. Transactions between operating segments are valued at market based prices. The revenues generated by these transfers for the years ended December 31, 2015, 2014 and 2013 are provided in the tables below.
Identifiable assets consist of property, plant and equipment used in the operations of the segment as well as inventory, receivables and other assets directly related to the segment. Unallocated and other assets include cash, certain corporate receivables, data processing equipment, and the assets of the discontinued operations from the aromatics segment. The accounting policies of the reportable segments are the same as those described in Note 1 of the Notes to the Consolidated Financial Statements.
121
Table of Contents
| (In millions) |
Chlorovinyls | Building Products |
Eliminations, Unallocated and Other |
Total | ||||||||||||
| Year Ended December 31, 2015 |
||||||||||||||||
| Net sales |
$ | 2,506.1 | $ | 855.0 | $ | - | $ | 3,361.1 | ||||||||
| Intersegment revenues |
213.6 | - | (213.6 | ) | - | |||||||||||
|
|
|
|
|
|
|
|
|
|||||||||
| Total net sales |
$ | 2,719.7 | 855.0 | (213.6 | ) | $ | 3,361.1 | |||||||||
| Restructuring and divestiture costs |
$ | 0.3 | 10.2 | 12.8 | $ | 23.3 | ||||||||||
| Integration-related costs and other, net |
$ | 0.3 | 0.6 | 15.1 | $ | 16.0 | ||||||||||
| Goodwill impairment charges |
$ | 864.1 | - | - | $ | 864.1 | ||||||||||
| Depreciation and amortization |
$ | 205.8 | 31.9 | 10.8 | $ | 248.5 | ||||||||||
| Operating income (loss) |
$ | (768.5 | ) | 35.0 | (77.4 | ) (1) | $ | (810.9 | ) | |||||||
| Interest expense, net |
(77.7 | ) | ||||||||||||||
| Debt refinancing costs |
(3.2 | ) | ||||||||||||||
| Foreign exchange loss |
(1.2 | ) | ||||||||||||||
|
|
|
|||||||||||||||
| Loss from continuing operations |
$ | (893.0 | ) | |||||||||||||
|
|
|
|||||||||||||||
| Capital expenditures |
$ | 144.0 | 24.7 | 28.0 | $ | 196.7 | ||||||||||
| Total assets |
$ | 3,909.4 | 557.7 | 72.3 | $ | 4,539.4 | ||||||||||
| Year Ended December 31, 2014 |
||||||||||||||||
| Net sales |
$ | 2,930.2 | $ | 878.6 | $ | - | $ | 3,808.8 | ||||||||
| Intersegment revenues |
255.7 | 0.1 | (255.8 | ) | - | |||||||||||
|
|
|
|
|
|
|
|
|
|||||||||
| Total net sales |
$ | 3,185.9 | 878.7 | (255.8 | ) | $ | 3,808.8 | |||||||||
| Restructuring and divestiture costs |
$ | 12.6 | 7.3 | (0.1 | ) | $ | 19.8 | |||||||||
| Integration-related costs and other, net |
$ | 6.2 | - | 26.0 | $ | 32.2 | ||||||||||
| Goodwill impairment charges |
$ | 4.1 | - | - | $ | 4.1 | ||||||||||
| Depreciation and amortization |
$ | 200.3 | 34.5 | 9.7 | $ | 244.5 | ||||||||||
| Operating income |
$ | 213.9 | 25.8 | (84.9 | ) (1) | $ | 154.8 | |||||||||
| Interest expense, net |
(75.8 | ) | ||||||||||||||
| Foreign exchange loss |
(0.6 | ) | ||||||||||||||
|
|
|
|||||||||||||||
| Income from continuing operations |
$ | 78.4 | ||||||||||||||
|
|
|
|||||||||||||||
| Capital expenditures |
$ | 148.9 | 40.6 | 13.0 | $ | 202.5 | ||||||||||
| Total assets |
$ | 4,872.0 | 581.3 | 202.7 | $ | 5,656.0 | ||||||||||
| Year Ended December 31, 2013 |
||||||||||||||||
| Net sales |
$ | 2,917.3 | $ | 849.9 | $ | - | $ | 3,767.2 | ||||||||
| Intersegment revenues |
$ | 226.2 | 0.1 | (226.3 | ) | $ | - | |||||||||
|
|
|
|
|
|
|
|
|
|||||||||
| Total net sales |
$ | 3,143.5 | 850.0 | (226.3 | ) | $ | 3,767.2 | |||||||||
| Restructuring and divestiture costs |
$ | (18.3 | ) | 31.8 | 7.3 | $ | 20.8 | |||||||||
| Integration-related costs and other, net |
$ | (8.8 | ) | - | 41.4 | $ | 32.6 | |||||||||
| Goodwill impairment charge |
$ | 18.2 | - | - | $ | 18.2 | ||||||||||
| Depreciation and amortization |
$ | 174.2 | 35.7 | 6.9 | $ | 216.8 | ||||||||||
| Operating income |
$ | 434.9 | 3.0 | (96.2 | ) (1) | $ | 341.7 | |||||||||
| Interest expense, net |
(76.6 | ) | ||||||||||||||
| Debt refinancing costs |
(78.5 | ) | ||||||||||||||
| Gain on acquisition of controlling interest |
25.9 | |||||||||||||||
|
|
|
|||||||||||||||
| Income from continuing operations |
$ | 212.5 | ||||||||||||||
|
|
|
|||||||||||||||
| Capital expenditures |
$ | 132.7 | 44.4 | 11.9 | $ | 189.0 | ||||||||||
| Total assets |
$ | 5,074.0 | 577.8 | 205.3 | $ | 5,857.1 | ||||||||||
(1) Includes shared services, administrative and legal expenses.
122
Table of Contents
Net Sales by Product Line
The table below summarizes net sales by product line for the years ended December 31, 2015, 2014 and 2013.
| Year Ended December 31, | ||||||||||||
| (In millions) |
2015 | 2014 | 2013 | |||||||||
| Chlorovinyls |
||||||||||||
| Chlor-alkali and derivative products |
$ | 2,056.3 | $ | 2,435.3 | $ | 2,447.2 | ||||||
| Compound products |
449.8 | 494.9 | 470.1 | |||||||||
|
|
|
|
|
|
|
|||||||
| Total |
2,506.1 | 2,930.2 | 2,917.3 | |||||||||
|
|
|
|
|
|
|
|||||||
| Building Products |
||||||||||||
| Window and door profiles and moulding products |
312.9 | 314.5 | 314.4 | |||||||||
| Outdoor building products |
542.1 | 564.1 | 535.5 | |||||||||
|
|
|
|
|
|
|
|||||||
| Total |
855.0 | 878.6 | 849.9 | |||||||||
|
|
|
|
|
|
|
|||||||
| Net Sales |
$ | 3,361.1 | $ | 3,808.8 | $ | 3,767.2 | ||||||
|
|
|
|
|
|
|
|||||||
Geographic Areas
Sales are attributable to geographic areas based on customer location and were as follows for the years ended December 31, 2015, 2014 and 2013.
| Year Ended December 31, | ||||||||||||
| (In millions) |
2015 | 2014 | 2013 | |||||||||
| Net sales: |
||||||||||||
| United States |
$ | 2,751.8 | $ | 3,129.8 | $ | 3,106.2 | ||||||
| Non-U.S. |
609.3 | 679.0 | 661.0 | |||||||||
|
|
|
|
|
|
|
|||||||
| Net Sales |
$ | 3,361.1 | $ | 3,808.8 | $ | 3,767.2 | ||||||
|
|
|
|
|
|
|
|||||||
Export sales as a percentage of net sales were approximately 18 percent for each of the years ended December 31, 2015, 2014 and 2013. Based on destination, the principal international markets we serve are Canada and Asia. Net sales to Canada in 2015 were 16 percent of net sales as compared to 15 percent of net sales in both 2014 and 2013.
Long-lived assets, excluding intangible assets, are based on asset location. As of December 31, 2015 and 2014, our long-lived assets, excluding intangible assets, by geographic areas were as follows:
| December 31, | ||||||||
| (In millions) |
2015 | 2014 | ||||||
| Long-lived assets (excluding intangible assets): |
||||||||
| United States |
$ | 1,387.3 | $ | 1,350.0 | ||||
| Non-U.S. |
230.3 | 286.1 | ||||||
|
|
|
|
|
|||||
| Total |
$ | 1,617.6 | $ | 1,636.1 | ||||
|
|
|
|
|
|||||
123
Table of Contents
Net assets are attributable to geographic areas based on the location of the legal entity. Net assets by geographic locations as of December 31, 2015 and 2014 were as follows:
| December 31, | ||||||||
| (In millions) |
2015 | 2014 | ||||||
| Net assets: |
||||||||
| United States |
$ | 1,432.9 | $ | 2,255.2 | ||||
| Non-U.S. |
220.2 | 333.8 | ||||||
|
|
|
|
|
|||||
| Total |
$ | 1,653.1 | $ | 2,589.0 | ||||
|
|
|
|
|
|||||
19. QUARTERLY FINANCIAL DATA (UNAUDITED)
The following table sets forth certain quarterly financial data. The quarterly earnings (loss) per share amounts for a year will not add to the earnings per share for that year due to weighting of shares used in calculating per share data.
| Quarter and Year Ended December 31, 2015 | ||||||||||||||||
| (In millions, except per share data) |
Q1 | Q2 | Q3 | Q4 | ||||||||||||
| Net sales |
$ | 814.8 | $ | 916.5 | $ | 874.4 | $ | 755.4 | ||||||||
| Gross margin |
101.8 | 127.3 | 117.5 | 45.6 | ||||||||||||
| Operating income (loss) |
15.4 | 42.4 | (811.3) | (57.4) | ||||||||||||
| Net income (loss) from continuing operations |
(9.0) | 20.8 | (797.5) | (63.4) | ||||||||||||
| Consolidated net income (loss) |
(8.8) | 21.9 | (792.5) | (57.7) | ||||||||||||
| Net income (loss) attributable to Axiall |
(10.6) | 20.6 | (769.6) | (56.8) | ||||||||||||
| Earnings (loss) per share: |
||||||||||||||||
| Basic |
$ | (0.15) | $ | 0.29 | $ | (10.90) | $ | (0.80) | ||||||||
| Diluted |
$ | (0.15) | $ | 0.29 | $ | (10.90) | $ | (0.80) | ||||||||
| Quarter and Year Ended December 31, 2014 | ||||||||||||||||
| Q1 | Q2 | Q3 | Q4 | |||||||||||||
| Net sales |
$ | 836.9 | $ | 1,021.7 | $ | 1,047.2 | $ | 903.0 | ||||||||
| Gross margin |
74.6 | 153.0 | 158.8 | 130.1 | ||||||||||||
| Operating income (loss) |
(4.9) | 65.8 | 72.2 | 21.7 | ||||||||||||
| Net income (loss) from continuing operations |
(13.8) | 33.5 | 43.5 | 0.9 | ||||||||||||
| Consolidated net income (loss) |
(10.6) | 28.1 | 45.1 | (12.4) | ||||||||||||
| Net income (loss) attributable to Axiall |
(11.6) | 27.2 | 44.5 | (13.8) | ||||||||||||
| Earnings (loss) per share: |
||||||||||||||||
| Basic |
$ | (0.17) | $ | 0.39 | $ | 0.64 | $ | (0.20) | ||||||||
| Diluted |
$ | (0.17) | $ | 0.38 | $ | 0.63 | $ | (0.20) | ||||||||
On February 24, 2016, we entered into a definitive agreement to sell our window and door profiles manufacturing business. Included in the transaction are five window profile manufacturing sites, one door manufacturing site and one vinyl compound manufacturing site. The sale is subject to customary closing conditions and is expected to close by the end of the first quarter of 2016. On February 24, 2016, we also entered into a definitive agreement to sell certain assets of our compound additives business located in Bradford, Ontario Canada. The combined proceeds expected in the first quarter of 2016 for these two transactions is approximately $41.1 million.
124
Table of Contents
Axiall Corporation is primarily a holding company for its 100-percent and majority owned subsidiaries. Payment obligations under the indentures for the 4.875 Notes issued by Axiall Corporation, the 4.625 Notes issued by Spinco and the Term Loan Credit Agreement under which Axiall Holdco is the borrower, as described in Note 10 of the Notes to the Consolidated Financial Statements, are guaranteed by each of Axiall Corporation’s 100-percent owned domestic subsidiaries (including Spinco in the case of the 4.875 Notes), other than certain excluded subsidiaries. Axiall Corporation is also a guarantor under the 4.625 Notes issued by Spinco and the Term Loan Credit Agreement.
As of December 31, 2015, payment obligations under the indenture for the 4.875 Notes issued by Axiall Corporation are guaranteed by Axiall Noteco, Inc., Axiall Holdco, Inc., Axiall, LLC, Georgia Gulf Lake Charles, LLC, Royal Building Products (USA) Inc., Royal Window and Door Profiles Plant 13 Inc., Royal Window and Door Profiles Plant 14 Inc., Plastic Trends, Inc., Rome Delaware Corporation, Royal Plastics Group (U.S.A.) Limited, PHH Monomers, LLC, Eagle Holdco 3 LLC, Eagle US 2 LLC, Axiall Ohio, Inc., Eagle Natrium LLC, and Eagle Pipeline, Inc. (collectively, the “Guarantor Subsidiaries”) and Spinco. As of December 31, 2015, payment obligations under the indenture for the 4.625 percent Notes issued by Spinco are guaranteed by Axiall Corporation and each of the Guarantor Subsidiaries. Royal Mouldings Limited, Exterior Portfolio, LLC and Royal Group Sales (USA) Limited, entities that previously were identified as Guarantor Subsidiaries, were merged into Royal Building Products (USA) Inc., another of the Guarantor Subsidiaries, during the year ended December 31, 2015, and Royal Building Products (USA) Inc. was the surviving entity in those mergers.
Each of Spinco and the Guarantor Subsidiaries is a direct or indirect 100-percent owned subsidiary of Axiall Corporation. The guarantees made by each of Axiall Corporation, Spinco and the other Guarantor Subsidiaries are full, unconditional and joint and several. Except as disclosed in Note 10 of the Notes to the Consolidated Financial Statements, there are no restrictions on the ability of Axiall Corporation, Spinco or any other Guarantor Subsidiary to obtain funds from any of its direct or indirect 100-percent owned subsidiaries through dividends, loans or advances as a result of the issuance of the 4.625 Notes or the 4.875 Notes. Separate consolidated financial statements and other disclosures with respect to Spinco or the Guarantor Subsidiaries have not been provided as management believes the following information is sufficient. Investments in subsidiaries in the guarantor consolidated financial statements reflect investments in 100-percent owned entities within Axiall under the equity accounting method. This presentation of Spinco, the Guarantor Subsidiaries and the non-guarantor subsidiaries of Axiall Corporation (the “Non-Guarantor Subsidiaries”) is not included to present the Company’s financial condition, results of operations or cash flows for any purpose other than to comply with the specific requirements for subsidiary issuer and subsidiary guarantor reporting.
The following tables present (i) guarantor consolidating statements of operations and guarantor comprehensive income (loss) for the years ended December 31, 2015, 2014 and 2013, (ii) guarantor consolidating balance sheets as of December 31, 2015 and 2014, and (iii) guarantor consolidating statements of cash flows for the years ended December 31, 2015, 2014 and 2013, of each of Axiall Corporation (as parent issuer), Spinco (as subsidiary issuer), the Guarantor Subsidiaries (excluding Spinco), the Guarantor Subsidiaries (including Spinco and which also includes entries necessary to eliminate Spinco’s investment in such Guarantor Subsidiaries and other intercompany account balances) and the Non-Guarantor Subsidiaries. The Company acquired PHH Monomers, LLC, Eagle Holdco 3 LLC, Eagle US 2 LLC, Axiall Ohio, Inc., Eagle Natrium LLC, and Eagle Pipeline, Inc. (the “Eagle Guarantors”) and Spinco in connection with the consummation of the transactions related to the Company’s merger with the Merged Business on January 28, 2013. Accordingly, the Eagle Guarantors are included in the Guarantor Subsidiary column of the following guarantor consolidating balance sheet, as of December 31, 2015 and 2014, the guarantor statement of operations and comprehensive income for the years ended December 31, 2015 and 2014 and the guarantor consolidating statement of cash flows for the years ended December 31, 2015 and 2014.
125
Table of Contents
Axiall Corporation and Subsidiaries
Guarantor Condensed Consolidating Balance Sheet
December 31, 2015
| (In millions) |
Parent Company (a) |
Eagle Spinco Inc. |
Guarantor Subsidiaries Excluding Eagle Spinco Inc. |
Guarantor Subsidiaries Including Eagle Spinco Inc. (b) |
Non- Guarantor Subsidiaries (c) |
Eliminations (d) |
Consolidated (a)+(b)+(c)+(d) |
|||||||||||||||||||||
| Assets: |
||||||||||||||||||||||||||||
| Cash and cash equivalents |
$ | 0.3 | $ | - | $ | 159.4 | $ | 159.4 | $ | 98.3 | $ | - | $ | 258.0 | ||||||||||||||
| Receivables, net of allowance for doubtful |
27.1 | 5.5 | 384.4 | 384.4 | 54.6 | (100.2 | ) | 365.9 | ||||||||||||||||||||
| Inventories |
- | - | 224.4 | 224.4 | 74.0 | - | 298.4 | |||||||||||||||||||||
| Prepaid expenses and other |
0.7 | - | 56.2 | 56.2 | 3.2 | (0.4 | ) | 59.7 | ||||||||||||||||||||
| Deferred income taxes |
- | - | - | - | - | - | - | |||||||||||||||||||||
| Current assets of discontinued operations |
- | - | 8.0 | 8.0 | - | - | 8.0 | |||||||||||||||||||||
|
|
|
|
|
|
|
|
|
|
|
|
|
|
|
|||||||||||||||
| Total current assets |
28.1 | 5.5 | 832.4 | 832.4 | 230.1 | (100.6 | ) | 990.0 | ||||||||||||||||||||
| Property, plant and equipment, net |
11.0 | - | 1,376.2 | 1,376.2 | 230.4 | - | 1,617.6 | |||||||||||||||||||||
| Long-term receivables—affiliates |
900.0 | - | - | - | - | (900.0 | ) | - | ||||||||||||||||||||
| Goodwill |
- | - | 707.8 | 707.8 | 144.3 | - | 852.1 | |||||||||||||||||||||
| Customer relationships, net |
- | - | 823.1 | 823.1 | 127.2 | - | 950.3 | |||||||||||||||||||||
| Other intangible assets, net |
- | - | 63.1 | 63.1 | 0.3 | - | 63.4 | |||||||||||||||||||||
| Other assets, net |
5.6 | 1.7 | 56.2 | 56.2 | 4.2 | - | 66.0 | |||||||||||||||||||||
| Investment in subsidiaries |
1,235.5 | 1,833.3 | 464.5 | 464.5 | - | (1,700.0 | ) | - | ||||||||||||||||||||
|
|
|
|
|
|
|
|
|
|
|
|
|
|
|
|||||||||||||||
| Total assets |
$ | 2,180.2 | $ | 1,840.5 | $ | 4,323.3 | $ | 4,323.3 | $ | 736.5 | $ | (2,700.6 | ) | $ | 4,539.4 | |||||||||||||
|
|
|
|
|
|
|
|
|
|
|
|
|
|
|
|||||||||||||||
| Liabilities and Equity: |
||||||||||||||||||||||||||||
| Current portion of long-term debt |
$ | - | $ | - | $ | 2.5 | $ | 2.5 | $ | - | $ | - | $ | 2.5 | ||||||||||||||
| Accounts payable |
84.3 | 27.0 | 215.3 | 236.7 | 26.9 | (100.2 | ) | 247.7 | ||||||||||||||||||||
| Interest payable |
3.2 | 12.2 | - | 12.2 | - | - | 15.4 | |||||||||||||||||||||
| Income taxes payable |
- | - | 0.4 | 0.4 | 2.2 | (0.4 | ) | 2.2 | ||||||||||||||||||||
| Accrued compensation |
9.5 | - | 23.9 | 23.9 | 9.6 | - | 43.0 | |||||||||||||||||||||
| Other accrued liabilities |
13.6 | - | 48.3 | 48.3 | 35.1 | - | 97.0 | |||||||||||||||||||||
| Current liabilities of discontinued operations |
- | - | 8.3 | 8.3 | - | - | 8.3 | |||||||||||||||||||||
|
|
|
|
|
|
|
|
|
|
|
|
|
|
|
|||||||||||||||
| Total current liabilities |
110.6 | 39.2 | 298.7 | 332.3 | 73.8 | (100.6 | ) | 416.1 | ||||||||||||||||||||
| Long-term debt, excluding the |
444.2 | 678.4 | 241.8 | 920.3 | - | - | 1,364.5 | |||||||||||||||||||||
| Long-term payables—affiliates |
- | 900.0 | - | 900.0 | - | (900.0 | ) | - | ||||||||||||||||||||
| Lease financing obligation |
- | - | - | - | 79.6 | - | 79.6 | |||||||||||||||||||||
| Deferred income taxes |
18.0 | - | 636.1 | 634.4 | 30.6 | - | 683.0 | |||||||||||||||||||||
| Pension and other post-retirement benefits |
3.6 | - | 189.9 | 189.9 | 9.3 | - | 202.8 | |||||||||||||||||||||
| Other non-current liabilities |
25.5 | - | 113.3 | 113.3 | 8.9 | (7.4 | ) | 140.3 | ||||||||||||||||||||
|
|
|
|
|
|
|
|
|
|
|
|
|
|
|
|||||||||||||||
| Total liabilities |
601.9 | 1,617.6 | 1,479.8 | 3,090.2 | 202.2 | (1,008.0 | ) | 2,886.3 | ||||||||||||||||||||
| Equity: |
||||||||||||||||||||||||||||
| Total Axiall stockholders’ equity |
1,578.3 | 222.9 | 2,843.5 | 1,233.1 | 459.5 | (1,692.6 | ) | 1,578.3 | ||||||||||||||||||||
| Noncontrolling interest |
- | - | - | - | 74.8 | - | 74.8 | |||||||||||||||||||||
|
|
|
|
|
|
|
|
|
|
|
|
|
|
|
|||||||||||||||
| Total equity |
1,578.3 | 222.9 | 2,843.5 | 1,233.1 | 534.3 | (1,692.6 | ) | 1,653.1 | ||||||||||||||||||||
|
|
|
|
|
|
|
|
|
|
|
|
|
|
|
|||||||||||||||
| Total liabilities and equity |
$ | 2,180.2 | $ | 1,840.5 | $ | 4,323.3 | $ | 4,323.3 | $ | 736.5 | $ | (2,700.6 | ) | $ | 4,539.4 | |||||||||||||
|
|
|
|
|
|
|
|
|
|
|
|
|
|
|
|||||||||||||||
126
Table of Contents
Axiall Corporation and Subsidiaries
Guarantor Condensed Consolidating Balance Sheet
December 31, 2014
| (In millions) |
Parent Company (a) |
Eagle Spinco Inc. |
Guarantor Subsidiaries Excluding Eagle Spinco Inc. |
Guarantor Subsidiaries Including Eagle Spinco Inc. (b) |
Non- Guarantor Subsidiaries (c) |
Eliminations (d) |
Consolidated (a)+(b)+(c)+(d) |
|||||||||||||||||||||
| Assets: |
||||||||||||||||||||||||||||
| Cash and cash equivalents |
$ | - | $ | - | $ | 78.2 | $ | 78.2 | $ | 88.6 | $ | - | $ | 166.8 | ||||||||||||||
| Receivables, net of allowance for doubtful |
162.8 | - | 473.3 | 457.5 | 71.4 | (261.1 | ) | 430.6 | ||||||||||||||||||||
| Inventories |
- | - | 225.2 | 225.2 | 96.7 | - | 321.9 | |||||||||||||||||||||
| Prepaid expenses and other |
0.1 | - | 83.0 | 83.0 | 6.6 | - | 89.7 | |||||||||||||||||||||
| Deferred income taxes |
3.1 | - | 24.9 | 24.9 | - | - | 28.0 | |||||||||||||||||||||
| Current assets of discontinued operations |
- | - | 68.2 | 68.2 | - | - | 68.2 | |||||||||||||||||||||
|
|
|
|
|
|
|
|
|
|
|
|
|
|
|
|||||||||||||||
| Total current assets |
166.0 | - | 952.8 | 937.0 | 263.3 | (261.1 | ) | 1,105.2 | ||||||||||||||||||||
| Property, plant and equipment, net |
12.0 | - | 1,338.1 | 1,338.1 | 286.0 | - | 1,636.1 | |||||||||||||||||||||
| Long-term receivables—affiliates |
1,292.9 | - | - | - | - | (1,292.9 | ) | - | ||||||||||||||||||||
| Goodwill |
- | - | 1,493.7 | 1,493.7 | 247.3 | - | 1,741.0 | |||||||||||||||||||||
| Customer relationships, net |
- | - | 877.9 | 877.9 | 146.6 | - | 1,024.5 | |||||||||||||||||||||
| Other intangible assets, net |
- | - | 67.8 | 67.8 | 0.3 | - | 68.1 | |||||||||||||||||||||
| Non-current assets of discontinued operations |
- | - | 29.6 | 29.6 | - | - | 29.6 | |||||||||||||||||||||
| Other assets, net |
10.4 | 0.7 | 31.6 | 31.6 | 9.5 | - | 51.5 | |||||||||||||||||||||
| Investment in subsidiaries |
1,682.7 | 2,831.2 | 290.5 | 290.5 | - | (1,973.2 | ) | - | ||||||||||||||||||||
|
|
|
|
|
|
|
|
|
|
|
|
|
|
|
|||||||||||||||
| Total assets |
$ | 3,164.0 | $ | 2,831.9 | $ | 5,082.0 | $ | 5,066.2 | $ | 953.0 | $ | (3,527.2 | ) | $ | 5,656.0 | |||||||||||||
|
|
|
|
|
|
|
|
|
|
|
|
|
|
|
|||||||||||||||
| Liabilities and Equity: |
||||||||||||||||||||||||||||
| Current portion of long-term debt |
$ | - | $ | 2.8 | $ | - | $ | 2.8 | $ | - | $ | - | $ | 2.8 | ||||||||||||||
| Accounts payable |
97.2 | 178.6 | 218.8 | 381.5 | 47.0 | (261.1 | ) | 264.6 | ||||||||||||||||||||
| Interest payable |
3.0 | 12.2 | - | 12.2 | - | - | 15.2 | |||||||||||||||||||||
| Income taxes payable |
- | - | 0.9 | 0.9 | 2.2 | - | 3.1 | |||||||||||||||||||||
| Accrued compensation |
- | - | 25.0 | 25.0 | 8.3 | - | 33.3 | |||||||||||||||||||||
| Other accrued liabilities |
14.3 | - | 88.9 | 88.9 | 29.3 | - | 132.5 | |||||||||||||||||||||
| Current liabilities of discontinued operations |
- | - | 32.6 | 32.6 | - | - | 32.6 | |||||||||||||||||||||
|
|
|
|
|
|
|
|
|
|
|
|
|
|
|
|||||||||||||||
| Total current liabilities |
114.5 | 193.6 | 366.2 | 543.9 | 86.8 | (261.1 | ) | 484.1 | ||||||||||||||||||||
| Long-term debt, excluding the current |
443.4 | 866.1 | - | 866.1 | - | - | 1,309.5 | |||||||||||||||||||||
| Long-term payables—affiliates |
- | 900.0 | - | 900.0 | 392.9 | (1,292.9 | ) | - | ||||||||||||||||||||
| Lease financing obligation |
- | - | - | - | 94.2 | - | 94.2 | |||||||||||||||||||||
| Deferred income taxes |
10.0 | - | 720.4 | 719.8 | 37.7 | - | 767.5 | |||||||||||||||||||||
| Pension and other post-retirement benefits |
4.4 | - | 235.7 | 235.7 | 10.4 | - | 250.5 | |||||||||||||||||||||
| Non-current liabilities of discontinued |
- | - | 3.8 | 3.8 | - | - | 3.8 | |||||||||||||||||||||
| Other non-current liabilities |
110.6 | - | 114.9 | 114.9 | 9.0 | (77.1 | ) | 157.4 | ||||||||||||||||||||
|
|
|
|
|
|
|
|
|
|
|
|
|
|
|
|||||||||||||||
| Total liabilities |
682.9 | 1,959.7 | 1,441.0 | 3,384.2 | 631.0 | (1,631.1 | ) | 3,067.0 | ||||||||||||||||||||
| Equity: |
||||||||||||||||||||||||||||
| Total Axiall stockholders’ equity |
2,481.1 | 872.2 | 3,641.0 | 1,682.0 | 214.1 | (1,896.1 | ) | 2,481.1 | ||||||||||||||||||||
| Noncontrolling interest |
- | - | - | - | 107.9 | - | 107.9 | |||||||||||||||||||||
|
|
|
|
|
|
|
|
|
|
|
|
|
|
|
|||||||||||||||
| Total equity |
2,481.1 | 872.2 | 3,641.0 | 1,682.0 | 322.0 | (1,896.1 | ) | 2,589.0 | ||||||||||||||||||||
|
|
|
|
|
|
|
|
|
|
|
|
|
|
|
|||||||||||||||
| Total liabilities and equity |
$ | 3,164.0 | $ | 2,831.9 | $ | 5,082.0 | $ | 5,066.2 | $ | 953.0 | $ | (3,527.2 | ) | $ | 5,656.0 | |||||||||||||
|
|
|
|
|
|
|
|
|
|
|
|
|
|
|
|||||||||||||||
127
Table of Contents
Axiall Corporation and Subsidiaries
Guarantor Condensed Consolidating Statement of Operations and Comprehensive Loss
Year Ended December 31, 2015
| (In millions) |
Parent Company (a) |
Eagle Spinco Inc. |
Guarantor Subsidiaries Excluding Eagle Spinco Inc. |
Guarantor Subsidiaries Including Eagle Spinco Inc. (b) |
Non- Guarantor Subsidiaries (c) |
Eliminations (d) |
Consolidated (a)+(b)+(c)+(d) |
|||||||||||||||||||||
| Net sales |
$ | - | $ | - | $ | 2,864.2 | $ | 2,864.2 | $ | 684.7 | $ | (187.8 | ) | $ | 3,361.1 | |||||||||||||
| Operating costs and expenses: |
||||||||||||||||||||||||||||
| Cost of sales |
- | - | 2,587.2 | 2,587.2 | 569.5 | (187.8 | ) | 2,968.9 | ||||||||||||||||||||
| Selling, general and administrative expenses |
47.4 | - | 180.5 | 180.5 | 71.8 | - | 299.7 | |||||||||||||||||||||
| Restructuring and divestiture costs |
12.8 | - | 1.2 | 1.2 | 9.3 | - | 23.3 | |||||||||||||||||||||
| Integration-related costs and other, net |
7.8 | - | 7.5 | 7.5 | 0.7 | - | 16.0 | |||||||||||||||||||||
| Goodwill impairment charges |
- | - | 785.9 | 785.9 | 78.2 | - | 864.1 | |||||||||||||||||||||
|
|
|
|
|
|
|
|
|
|
|
|
|
|
|
|||||||||||||||
| Total operating costs and expenses |
68.0 | - | 3,562.3 | 3,562.3 | 729.5 | (187.8 | ) | 4,172.0 | ||||||||||||||||||||
|
|
|
|
|
|
|
|
|
|
|
|
|
|
|
|||||||||||||||
| Operating loss |
(68.0 | ) | - | (698.1 | ) | (698.1 | ) | (44.8 | ) | - | (810.9 | ) | ||||||||||||||||
| Other expense: |
||||||||||||||||||||||||||||
| Interest income (expense), net |
19.6 | (80.8 | ) | (7.8 | ) | (88.6 | ) | (8.7 | ) | - | (77.7 | ) | ||||||||||||||||
| Debt refinancing costs |
- | (0.1 | ) | (3.1 | ) | (3.2 | ) | - | - | (3.2 | ) | |||||||||||||||||
| Foreign exchange loss |
- | - | (0.2 | ) | (0.2 | ) | (1.0 | ) | - | (1.2 | ) | |||||||||||||||||
| Equity in loss of subsidiaries |
(739.5 | ) | (853.3 | ) | (29.8 | ) | (29.8 | ) | - | 769.3 | - | |||||||||||||||||
|
|
|
|
|
|
|
|
|
|
|
|
|
|
|
|||||||||||||||
| Loss from continuing operations before income taxes |
(787.9 | ) | (934.2 | ) | (739.0 | ) | (819.9 | ) | (54.5 | ) | 769.3 | (893.0 | ) | |||||||||||||||
| Provision for (benefit from) income taxes |
28.5 | (28.1 | ) | (45.8 | ) | (73.9 | ) | 1.5 | - | (43.9 | ) | |||||||||||||||||
|
|
|
|
|
|
|
|
|
|
|
|
|
|
|
|||||||||||||||
| Loss from continuing operations |
(816.4 | ) | (906.1 | ) | (693.2 | ) | (746.0 | ) | (56.0 | ) | 769.3 | (849.1 | ) | |||||||||||||||
| Discontinued operations: |
||||||||||||||||||||||||||||
| Income from discontinued operations |
- | - | 14.7 | 14.7 | - | - | 14.7 | |||||||||||||||||||||
| Provision for income taxes of discontinued operations |
- | - | 2.7 | 2.7 | - | - | 2.7 | |||||||||||||||||||||
|
|
|
|
|
|
|
|
|
|
|
|
|
|
|
|||||||||||||||
| Net income from discontinued operations |
- | - | 12.0 | 12.0 | - | - | 12.0 | |||||||||||||||||||||
|
|
|
|
|
|
|
|
|
|
|
|
|
|
|
|||||||||||||||
| Consolidated net loss |
(816.4 | ) | (906.1 | ) | (681.2 | ) | (734.0 | ) | (56.0 | ) | 769.3 | (837.1 | ) | |||||||||||||||
| Less: net loss attributable to noncontrolling interest |
- | - | - | - | (20.7 | ) | - | (20.7 | ) | |||||||||||||||||||
|
|
|
|
|
|
|
|
|
|
|
|
|
|
|
|||||||||||||||
| Net loss attributable to Axiall |
$ | (816.4 | ) | $ | (906.1 | ) | $ | (681.2 | ) | $ | (734.0 | ) | $ | (35.3 | ) | $ | 769.3 | $ | (816.4 | ) | ||||||||
|
|
|
|
|
|
|
|
|
|
|
|
|
|
|
|||||||||||||||
|
|
|
|
|
|
|
|
|
|
|
|
|
|
|
|||||||||||||||
| Comprehensive loss attributable to Axiall |
$ | (860.7 | ) | $ | (879.0 | ) | $ | (728.0 | ) | $ | (780.8 | ) | $ | (124.2 | ) | $ | 905.0 | $ | (860.7 | ) | ||||||||
|
|
|
|
|
|
|
|
|
|
|
|
|
|
|
|||||||||||||||
128
Table of Contents
Axiall Corporation and Subsidiaries
Guarantor Condensed Consolidating Statement of Operations and Comprehensive Loss
Year Ended December 31, 2014
| (In millions) |
Parent Company (a) |
Eagle Spinco Inc. |
Guarantor Subsidiaries Excluding Eagle Spinco Inc. |
Guarantor Subsidiaries Including Eagle Spinco Inc. (b) |
Non-Guarantor Subsidiaries (c) |
Eliminations (d) |
Consolidated (a)+(b)+(c)+(d) |
|||||||||||||||||||||
| Net sales |
$ | - | $ | - | $ | 3,276.4 | $ | 3,276.4 | $ | 762.7 | $ | (230.3 | ) | $ | 3,808.8 | |||||||||||||
| Operating costs and expenses: |
||||||||||||||||||||||||||||
| Cost of sales |
- | - | 2,882.4 | 2,882.4 | 640.2 | (230.3 | ) | 3,292.3 | ||||||||||||||||||||
| Selling, general and administrative expenses |
45.5 | - | 183.7 | 183.7 | 76.4 | - | 305.6 | |||||||||||||||||||||
| Restructuring and divestiture costs |
- | - | 15.4 | 15.4 | 4.4 | - | 19.8 | |||||||||||||||||||||
| Integration-related costs and other, net |
15.5 | - | 13.3 | 13.3 | 3.4 | - | 32.2 | |||||||||||||||||||||
| Goodwill impairment charges |
- | - | 4.1 | 4.1 | - | - | 4.1 | |||||||||||||||||||||
|
|
|
|
|
|
|
|
|
|
|
|
|
|
|
|||||||||||||||
| Total operating costs and expenses |
61.0 | - | 3,098.9 | 3,098.9 | 724.4 | (230.3 | ) | 3,654.0 | ||||||||||||||||||||
|
|
|
|
|
|
|
|
|
|
|
|
|
|
|
|||||||||||||||
| Operating income (loss) |
(61.0 | ) | - | 177.5 | 177.5 | 38.3 | - | 154.8 | ||||||||||||||||||||
| Other income (expense): |
||||||||||||||||||||||||||||
| Interest income (expense), net |
31.2 | (87.4 | ) | 1.9 | (85.5 | ) | (21.5 | ) | - | (75.8 | ) | |||||||||||||||||
| Foreign exchange loss |
- | - | (0.5 | ) | (0.5 | ) | (0.1 | ) | - | (0.6 | ) | |||||||||||||||||
| Equity in income (loss) of subsidiaries |
55.7 | (19.3 | ) | 11.7 | 11.7 | - | (67.4 | ) | - | |||||||||||||||||||
|
|
|
|
|
|
|
|
|
|
|
|
|
|
|
|||||||||||||||
| Income (loss) from continuing operations before income taxes |
25.9 | (106.7 | ) | 190.6 | 103.2 | 16.7 | (67.4 | ) | 78.4 | |||||||||||||||||||
| Provision for (benefit from) income taxes |
(20.4 | ) | (29.9 | ) | 66.4 | 36.5 | (1.8 | ) | - | 14.3 | ||||||||||||||||||
|
|
|
|
|
|
|
|
|
|
|
|
|
|
|
|||||||||||||||
| Income (loss) from continuing operations |
46.3 | (76.8 | ) | 124.2 | 66.7 | 18.5 | (67.4 | ) | 64.1 | |||||||||||||||||||
| Discontinued operations: |
||||||||||||||||||||||||||||
| Loss from discontinued operations, before tax |
- | - | (20.7 | ) | (20.7 | ) | - | - | (20.7 | ) | ||||||||||||||||||
| Income tax benefit of discontinued operations |
- | - | (6.8 | ) | (6.8 | ) | - | - | (6.8 | ) | ||||||||||||||||||
|
|
|
|
|
|
|
|
|
|
|
|
|
|
|
|||||||||||||||
| Net loss from discontinued operations |
- | - | (13.9 | ) | (13.9 | ) | - | - | (13.9 | ) | ||||||||||||||||||
|
|
|
|
|
|
|
|
|
|
|
|
|
|
|
|||||||||||||||
| Consolidated net income (loss) |
46.3 | (76.8 | ) | 110.3 | 52.8 | 18.5 | (67.4 | ) | 50.2 | |||||||||||||||||||
| Less: net income attributable to noncontrolling interest |
- | - | - | - | 3.9 | - | 3.9 | |||||||||||||||||||||
|
|
|
|
|
|
|
|
|
|
|
|
|
|
|
|||||||||||||||
| Net income (loss) attributable to Axiall |
$ | 46.3 | $ | (76.8 | ) | $ | 110.3 | $ | 52.8 | $ | 14.6 | $ | (67.4 | ) | $ | 46.3 | ||||||||||||
|
|
|
|
|
|
|
|
|
|
|
|
|
|
|
|||||||||||||||
|
|
|
|
|
|
|
|
|
|
|
|
|
|
|
|||||||||||||||
| Comprehensive loss attributable to Axiall |
$ | (93.7) | $ | (193.1) | $ | (50.4 | ) | $ | (107.9 | ) | $ | (0.9 | ) | $ | 108.8 | $ | (93.7 | ) | ||||||||||
|
|
|
|
|
|
|
|
|
|
|
|
|
|
|
|||||||||||||||
129
Table of Contents
Axiall Corporation and Subsidiaries
Guarantor Condensed Consolidating Statement of Operations and Comprehensive Income
Year Ended December 31, 2013
| (In millions) |
Parent Company (a) |
Eagle Spinco Inc. |
Guarantor Subsidiaries Excluding Eagle Spinco Inc. |
Guarantor Subsidiaries Including Eagle Spinco Inc. (b) |
Non-Guarantor Subsidiaries (c) |
Eliminations (d) |
Consolidated (a)+(b)+(c)+(d) |
|||||||||||||||||||||
| Net sales |
$ | - | $ | - | $ | 3,226.3 | $ | 3,226.3 | $ | 734.4 | $ | (193.5) | $ | 3,767.2 | ||||||||||||||
| Operating costs and expenses: |
||||||||||||||||||||||||||||
| Cost of sales |
- | - | 2,655.7 | 2,655.7 | 597.2 | (193.5) | 3,059.4 | |||||||||||||||||||||
| Selling, general and administrative expenses |
41.3 | - | 176.7 | 176.7 | 76.5 | - | 294.5 | |||||||||||||||||||||
| Restructuring and divestiture costs |
7.5 | - | 7.2 | 7.2 | 6.1 | - | 20.8 | |||||||||||||||||||||
| Integration-related costs and other, net |
34.4 | - | (2.1) | (2.1) | 0.3 | - | 32.6 | |||||||||||||||||||||
| Goodwill impairment charges |
- | - | 18.2 | 18.2 | - | - | 18.2 | |||||||||||||||||||||
|
|
|
|
|
|
|
|
|
|
|
|
|
|
|
|||||||||||||||
| Total operating costs and expenses |
83.2 | - | 2,855.7 | 2,855.7 | 680.1 | (193.5) | 3,425.5 | |||||||||||||||||||||
|
|
|
|
|
|
|
|
|
|
|
|
|
|
|
|||||||||||||||
| Operating income (loss) |
(83.2) | - | 370.6 | 370.6 | 54.3 | - | 341.7 | |||||||||||||||||||||
| Other income (expense): |
||||||||||||||||||||||||||||
| Interest income (expense), net |
(45.7) | (45.8) | 37.7 | (8.1) | (22.8) | - | (76.6) | |||||||||||||||||||||
| Loss on debt refinancing costs |
(66.1) | (12.4) | - | (12.4) | - | - | (78.5) | |||||||||||||||||||||
| Gain on acquisition of controlling interest |
- | - | 25.9 | 25.9 | - | - | 25.9 | |||||||||||||||||||||
| Equity in income of subsidiaries |
293.1 | 114.3 | 22.6 | 22.6 | - | (315.7) | - | |||||||||||||||||||||
|
|
|
|
|
|
|
|
|
|
|
|
|
|
|
|||||||||||||||
| Income from continuing operations before income taxes |
98.1 | 56.1 | 456.8 | 398.6 | 31.5 | (315.7) | 212.5 | |||||||||||||||||||||
| Provision for (benefit from) income taxes |
(67.2) | (19.7) | 146.4 | 126.7 | 3.4 | - | 62.9 | |||||||||||||||||||||
|
|
|
|
|
|
|
|
|
|
|
|
|
|
|
|||||||||||||||
| Income from continuing operations |
165.3 | 75.8 | 310.4 | 271.9 | 28.1 | (315.7) | 149.6 | |||||||||||||||||||||
| Discontinued operations: |
||||||||||||||||||||||||||||
| Income from discontinued operations, before tax |
- | - | 29.1 | 29.1 | - | - | 29.1 | |||||||||||||||||||||
| Income tax expense of discontinued operations |
- | - | 10.7 | 10.7 | - | - | 10.7 | |||||||||||||||||||||
|
|
|
|
|
|
|
|
|
|
|
|
|
|
|
|||||||||||||||
| Net income from discontinued operations |
- | - | 18.4 | 18.4 | - | - | 18.4 | |||||||||||||||||||||
|
|
|
|
|
|
|
|
|
|
|
|
|
|
|
|||||||||||||||
| Consolidated net income |
165.3 | 75.8 | 328.8 | 290.3 | 28.1 | (315.7) | 168.0 | |||||||||||||||||||||
| Less: net income attributable to |
- | - | - | - | 2.7 | - | 2.7 | |||||||||||||||||||||
|
|
|
|
|
|
|
|
|
|
|
|
|
|
|
|||||||||||||||
| Net income attributable to Axiall |
$ | 165.3 | $ | 75.8 | $ | 328.8 | $ | 290.3 | $ | 25.4 | $ | (315.7) | $ | 165.3 | ||||||||||||||
|
|
|
|
|
|
|
|
|
|
|
|
|
|
|
|||||||||||||||
|
|
|
|
|
|
|
|
|
|
|
|
|
|
|
|||||||||||||||
| Comprehensive income attributable to Axiall |
$ | 253.5 | $ | 165.7 | $ | 467.3 | $ | 429.0 | $ | 19.8 | $ | (448.8) | $ | 253.5 | ||||||||||||||
|
|
|
|
|
|
|
|
|
|
|
|
|
|
|
|||||||||||||||
130
Table of Contents
Axiall Corporation and Subsidiaries
Guarantor Condensed Consolidating Statement of Cash Flows
Year Ended December 31, 2015
| (In millions) |
Parent Company (a) |
Eagle Spinco Inc. |
Guarantor Subsidiaries Excluding Eagle Spinco Inc. |
Guarantor Subsidiaries Including Eagle Spinco Inc. (b) |
Non-Guarantor Subsidiaries (c) |
Eliminations (d) |
Consolidated (a)+(b)+(c)+(d) |
|||||||||||||||||||||
|
|
|
|
|
|
|
|
|
|
|
|
|
|
|
|||||||||||||||
| Cash provided by operating activities - continuing operations |
$ | 63.8 | $ | 15.4 | $ | 183.1 | $ | 183.1 | $ | 72.7 | $ | (67.2 | ) | $ | 252.4 | |||||||||||||
| Cash provided by operating activities - discontinued operations |
- | - | 14.7 | 14.7 | - | - | 14.7 | |||||||||||||||||||||
|
|
|
|
|
|
|
|
|
|
|
|
|
|
|
|||||||||||||||
| Net cash provided by operating activities |
63.8 | 15.4 | 197.8 | 197.8 | 72.7 | (67.2 | ) | 267.1 | ||||||||||||||||||||
|
|
|
|
|
|
|
|
|
|
|
|
|
|
|
|||||||||||||||
| Cash flows from investing activities: |
||||||||||||||||||||||||||||
| Capital expenditures |
(1.0 | ) | - | (184.0 | ) | (184.0 | ) | (11.7 | ) | - | (196.7 | ) | ||||||||||||||||
| Proceeds from the sale of assets and other |
- | - | 4.6 | 4.6 | 4.0 | - | 8.6 | |||||||||||||||||||||
|
|
|
|
|
|
|
|
|
|
|
|
|
|
|
|||||||||||||||
| Cash used in investing activities of continuing operations |
(1.0 | ) | - | (179.4 | ) | (179.4 | ) | (7.7 | ) | - | (188.1 | ) | ||||||||||||||||
| Cash provided by investing activities of discontinued operations |
- | - | 46.4 | 46.4 | - | - | 46.4 | |||||||||||||||||||||
|
|
|
|
|
|
|
|
|
|
|
|
|
|
|
|||||||||||||||
| Net cash used in investing activities |
(1.0 | ) | - | (133.0 | ) | (133.0 | ) | (7.7 | ) | - | (141.7 | ) | ||||||||||||||||
|
|
|
|
|
|
|
|
|
|
|
|
|
|
|
|||||||||||||||
| Cash flows from financing activities: |
||||||||||||||||||||||||||||
| Issuance of long-term debt |
- | - | 248.8 | 248.8 | - | - | 248.8 | |||||||||||||||||||||
| Long-term debt payments |
- | (194.4 | ) | (3.3 | ) | (197.7 | ) | - | - | (197.7 | ) | |||||||||||||||||
| Intercompany financing |
- | 194.4 | (194.4 | ) | - | - | - | - | ||||||||||||||||||||
| Deferred acquisition payments |
(10.0 | ) | - | - | - | - | - | (10.0 | ) | |||||||||||||||||||
| Fees paid relating to financing activities |
(0.8 | ) | - | (3.3 | ) | (3.3 | ) | - | - | (4.1 | ) | |||||||||||||||||
| Dividends paid |
(45.7 | ) | - | - | - | - | - | (45.7 | ) | |||||||||||||||||||
| Distribution to noncontrolling interest |
- | - | - | - | (8.4 | ) | - | (8.4 | ) | |||||||||||||||||||
| Distribution to affiliate |
- | (15.4 | ) | (31.4 | ) | (31.4 | ) | (35.8 | ) | 67.2 | - | |||||||||||||||||
| Share-based compensation plan activity |
(6.0 | ) | - | - | - | - | - | (6.0 | ) | |||||||||||||||||||
|
|
|
|
|
|
|
|
|
|
|
|
|
|
|
|||||||||||||||
| Net cash provided by (used in) financing activities |
(62.5 | ) | (15.4 | ) | 16.4 | 16.4 | (44.2 | ) | 67.2 | (23.1 | ) | |||||||||||||||||
| Effect of exchange rate changes on cash and cash equivalents |
- | - | - | - | (11.1 | ) | - | (11.1 | ) | |||||||||||||||||||
|
|
|
|
|
|
|
|
|
|
|
|
|
|
|
|||||||||||||||
| Net change in cash and cash equivalents |
0.3 | - | 81.2 | 81.2 | 9.7 | - | 91.2 | |||||||||||||||||||||
| Cash and cash equivalents at beginning of year |
- | - | 78.2 | 78.2 | 88.6 | - | 166.8 | |||||||||||||||||||||
|
|
|
|
|
|
|
|
|
|
|
|
|
|
|
|||||||||||||||
| Cash and cash equivalents at end of year |
$ | 0.3 | $ | — | $ | 159.4 | $ | 159.4 | $ | 98.3 | $ | — | $ | 258.0 | ||||||||||||||
|
|
|
|
|
|
|
|
|
|
|
|
|
|
|
|||||||||||||||
131
Table of Contents
Axiall Corporation and Subsidiaries
Guarantor Condensed Consolidating Statement of Cash Flows
Year Ended December 31, 2014
| (In millions) |
Parent Company (a) |
Eagle Spinco Inc. |
Guarantor Subsidiaries Excluding Eagle Spinco Inc. |
Guarantor Subsidiaries Including Eagle Spinco Inc. (b) |
Non-Guarantor Subsidiaries (c) |
Eliminations (d) |
Consolidated (a)+(b)+(c)+(d) |
|||||||||||||||||||||
| Cash provided by operating activities -continuing operations |
$ | 68.2 | $ | 12.4 | $ | 179.7 | $ | 182.9 | $ | 46.1 | $ | (20.8) | $ | 276.4 | ||||||||||||||
| Cash provided by operating activities -discontinued operations |
- | - | 14.7 | 14.7 | - | - | 14.7 | |||||||||||||||||||||
|
|
|
|
|
|
|
|
|
|
|
|
|
|
|
|||||||||||||||
| Net cash provided by operating activities |
68.2 | 12.4 | 194.4 | 197.6 | 46.1 | (20.8) | 291.1 | |||||||||||||||||||||
|
|
|
|
|
|
|
|
|
|
|
|
|
|
|
|||||||||||||||
| Cash flows from investing activities: |
||||||||||||||||||||||||||||
| Capital expenditures |
(6.8) | - | (177.1) | (177.1) | (18.6) | - | (202.5) | |||||||||||||||||||||
| Proceeds from sale of assets and other |
- | - | 6.3 | 6.3 | 0.4 | - | 6.7 | |||||||||||||||||||||
| Acquisitions, net of cash acquired |
- | - | (5.8) | (5.8) | (0.3) | - | (6.1) | |||||||||||||||||||||
|
|
|
|
|
|
|
|
|
|
|
|
|
|
|
|||||||||||||||
| Cash used in investing activities - continuing operations |
(6.8) | - | (176.6) | (176.6) | (18.5) | - | (201.9) | |||||||||||||||||||||
| Cash used in investing activities - discontinued operations |
- | - | (6.6) | (6.6) | - | - | (6.6) | |||||||||||||||||||||
|
|
|
|
|
|
|
|
|
|
|
|
|
|
|
|||||||||||||||
| Net cash used in investing activities |
(6.8) | - | (183.2) | (183.2) | (18.5) | - | (208.5) | |||||||||||||||||||||
| Cash flows from financing activities: |
||||||||||||||||||||||||||||
| Borrowings under ABL revolver |
148.9 | - | - | - | - | - | 148.9 | |||||||||||||||||||||
| Repayments under ABL revolver |
(148.9) | - | - | - | - | - | (148.9) | |||||||||||||||||||||
| Long-term debt payments |
- | (2.8) | (0.7) | (3.5) | (2.3) | - | (5.8) | |||||||||||||||||||||
| Deferred acquisition payments |
(10.0) | - | - | - | - | - | (10.0) | |||||||||||||||||||||
| Fees paid related to financing activities |
(1.8) | (0.4) | - | (0.4) | - | - | (2.2) | |||||||||||||||||||||
| Dividends paid |
(45.0) | - | - | - | - | - | (45.0) | |||||||||||||||||||||
| Distribution to noncontrolling interest |
- | - | - | - | (7.7) | - | (7.7) | |||||||||||||||||||||
| Distribution to affiliate |
- | (9.2) | (9.2) | (9.2) | (11.6) | 20.8 | - | |||||||||||||||||||||
| Share-based compensation plan activity |
(4.6) | - | - | - | - | - | (4.6) | |||||||||||||||||||||
|
|
|
|
|
|
|
|
|
|
|
|
|
|
|
|||||||||||||||
| Net cash used in financing activities |
(61.4) | (12.4) | (9.9) | (13.1) | (21.6) | 20.8 | (75.3) | |||||||||||||||||||||
| Effect of exchange rate changes on cash and cash equivalents |
- | - | - | - | (7.0) | - | (7.0) | |||||||||||||||||||||
|
|
|
|
|
|
|
|
|
|
|
|
|
|
|
|||||||||||||||
| Net change in cash and cash equivalents |
- | - | 1.3 | 1.3 | (1.0) | - | 0.3 | |||||||||||||||||||||
| Cash and cash equivalents at beginning of year |
- | - | 76.9 | 76.9 | 89.6 | - | 166.5 | |||||||||||||||||||||
|
|
|
|
|
|
|
|
|
|
|
|
|
|
|
|||||||||||||||
| Cash and cash equivalents at end of year |
$ | - | $ | - | $ | 78.2 | $ | 78.2 | $ | 88.6 | $ | - | $ | 166.8 | ||||||||||||||
|
|
|
|
|
|
|
|
|
|
|
|
|
|
|
|||||||||||||||
132
Table of Contents
Axiall Corporation and Subsidiaries
Guarantor Condensed Consolidating Statement of Cash Flows
Year Ended December 31, 2013
| (In millions) |
Parent Company (a) |
Eagle Spinco Inc. |
Subsidiaries Excluding Eagle Spinco Inc. |
Subsidiaries Including Eagle Spinco Inc. (b) |
Non- Guarantor Subsidiaries (c) |
Eliminations (d) |
Consolidated (a)+(b)+(c)+(d) |
|||||||||||||||||||||
| Cash provided by operating activities - continuing operations |
$ | 60.1 | $ | 112.0 | $ | 94.0 | $ | 183.1 | $ | 59.6 | $ | - | $ | 302.8 | ||||||||||||||
| Cash provided by operating activities - discontinued operations |
- | - | - | 22.9 | - | - | 22.9 | |||||||||||||||||||||
|
|
|
|
|
|
|
|
|
|
|
|
|
|
|
|||||||||||||||
| Net cash provided by operating activities |
$ | 60.1 | $ | 112.0 | $ | 94.0 | $ | 206.0 | $ | 59.6 | $ | - | $ | 325.7 | ||||||||||||||
|
|
|
|
|
|
|
|
|
|
|
|
|
|
|
|||||||||||||||
| Cash flows from investing activities: |
||||||||||||||||||||||||||||
| Capital expenditures |
(8.7) | - | (156.5) | (156.5) | (23.8) | - | (189.0) | |||||||||||||||||||||
| Proceeds from sale of assets and other |
- | - | 11.1 | 11.1 | 0.3 | - | 11.4 | |||||||||||||||||||||
| Distribution from affiliate |
15.9 | 15.9 | 19.9 | 19.9 | - | (35.8) | - | |||||||||||||||||||||
| Acquisitions, net of cash acquired |
21.6 | - | - | - | 23.5 | - | 45.1 | |||||||||||||||||||||
|
|
|
|
|
|
|
|
|
|
|
|
|
|
|
|||||||||||||||
| Cash provided by (used in) investing activities - continuing operations |
28.8 | 15.9 | (125.5) | (125.5) | - | (35.8) | (132.5) | |||||||||||||||||||||
| Cash used in investing activities - discontinued operations |
- | - | (7.1) | (7.1) | - | - | (7.1) | |||||||||||||||||||||
|
|
|
|
|
|
|
|
|
|
|
|
|
|
|
|||||||||||||||
| Net cash provided by (used in) investing activities |
28.8 | 15.9 | (132.6) | (132.6) | - | (35.8) | (139.6) | |||||||||||||||||||||
| Cash flows from financing activities: |
||||||||||||||||||||||||||||
| Issuance of long-term debt |
450.0 | - | - | - | - | - | 450.0 | |||||||||||||||||||||
| Long-term debt payments |
(450.0) | (81.8) | - | (81.8) | - | - | (531.8) | |||||||||||||||||||||
| Make-whole and other fees paid related to financing activities |
(65.9) | (30.2) | - | (30.2) | (2.0) | - | (98.1) | |||||||||||||||||||||
| Dividends paid |
(22.2) | - | - | - | - | - | (22.2) | |||||||||||||||||||||
| Distribution to noncontrolling interest |
- | - | - | - | (13.3) | - | (13.3) | |||||||||||||||||||||
| Distribution to affiliate |
- | (15.9) | (15.9) | (15.9) | (19.9) | 35.8 | - | |||||||||||||||||||||
| Stock compensation plan activity |
(0.8) | - | - | - | - | - | (0.8) | |||||||||||||||||||||
|
|
|
|
|
|
|
|
|
|
|
|
|
|
|
|||||||||||||||
| Net cash used in financing activities |
(88.9) | (127.9) | (15.9) | (127.9) | (35.2) | 35.8 | (216.2) | |||||||||||||||||||||
| Effect of exchange rate changes on cash and cash equivalents |
- | - | - | - | (3.7) | - | (3.7) | |||||||||||||||||||||
|
|
|
|
|
|
|
|
|
|
|
|
|
|
|
|||||||||||||||
| Net change in cash and cash equivalents |
- | - | (54.5) | (54.5) | 20.7 | - | (33.8) | |||||||||||||||||||||
| Cash and cash equivalents at beginning of year |
- | - | 131.4 | 131.4 | 68.9 | - | 200.3 | |||||||||||||||||||||
|
|
|
|
|
|
|
|
|
|
|
|
|
|
|
|||||||||||||||
| Cash and cash equivalents at end of year |
$ | - | $ | - | $ | 76.9 | $ | 76.9 | $ | 89.6 | $ | - | $ | 166.5 | ||||||||||||||
|
|
|
|
|
|
|
|
|
|
|
|
|
|
|
|||||||||||||||
133
Table of Contents
Item 9. CHANGES IN AND DISAGREEMENTS WITH ACCOUNTANTS ON ACCOUNTING AND FINANCIAL DISCLOSURES.
None.
Item 9A. CONTROLS AND PROCEDURES.
Disclosure Controls and Procedures. We maintain disclosure controls and procedures as defined in Rules 13a-15(e) of the Exchange Act that are designed to ensure that information required to be disclosed in our reports filed or submitted to the SEC under the Exchange Act is recorded, processed, summarized and reported within the time periods specified by the SEC’s rules and forms, and that information is accumulated and communicated to management, including the chief executive officer (“CEO”) and the chief financial officer (“CFO”) as appropriate, to allow timely decisions regarding required disclosures. The CEO and CFO have evaluated the effectiveness of disclosure controls and procedures as of December 31, 2015, pursuant to Rule 13a-15(b) under the Exchange Act. Based on that evaluation, the CEO and CFO have concluded that, as of the end of the period covered by this report, the Company’s disclosure controls and procedures were effective. A system of controls, regardless of how well designed and operated, cannot provide absolute assurance that the objectives of the system of controls are met, and no evaluation of controls can provide absolute assurance that all control issues and instances of fraud, if any, within a company have been detected.
Changes in Internal Control. There have been no changes to our internal controls over financial reporting that occurred during the three months ended December 31, 2015 that have materially affected, or are reasonably likely to materially affect, the Company’s internal control over financial reporting.
134
Table of Contents
Report of Management on Internal Control Over Financial Reporting
To the Stockholders of Axiall Corporation:
Management of the Company is responsible for establishing and maintaining adequate internal control over financial reporting as defined in Rule 13a-15(f) and 15d-15(f) under the Exchange Act. The Company’s internal control over financial reporting is designed to provide reasonable assurance to the Company’s management and board of directors regarding the preparation and fair presentation of published consolidated financial statements in accordance with U.S. generally accepted accounting principles.
Our management, including our Chief Executive Officer and Chief Financial Officer, does not expect that our internal control over financial reporting will prevent all errors and all fraud. Internal control, no matter how well designed and operated, can provide only reasonable, not absolute, assurance that the objectives of the internal control are met. Because of the inherent limitations of internal control, internal control over financial reporting may not prevent or detect all misstatements or fraud. Therefore, no evaluation of internal control can provide absolute assurance that all control issues or instances of fraud will be prevented or detected.
Management assessed the effectiveness of the Company’s internal control over financial reporting as of December 31, 2015 using the criteria set forth by the Committee of Sponsoring Organizations of the Treadway Commission Internal Control—Integrated Framework (the “2013 COSO Framework”). Based on this assessment, the Company’s management concluded that, as of December 31, 2015, the Company’s internal control over financial reporting was effective based on the COSO criteria.
Ernst & Young LLP, the Company’s independent registered public accounting firm, which also audited the Company’s consolidated financial statements for the year ended December 31, 2015, included in this Annual Report on Form 10-K, has issued an attestation report on the Company’s internal control over financial reporting.
| /s/ Timothy Mann, Jr. |
/s/ Gregory C. Thompson |
|||||
| Timothy Mann, Jr. | Gregory C. Thompson | |||||
|
President and Chief Executive Officer |
Executive Vice President and Chief Financial Officer | |||||
| February 26, 2016 | February 26, 2016 | |||||
135
Table of Contents
Report of Independent Registered Public Accounting Firm
The Board of Directors and Shareholders of Axiall Corporation
We have audited Axiall Corporation and subsidiaries’ (“the Company”) internal control over financial reporting as of December 31, 2015, based on criteria established in Internal Control—Integrated Framework issued by the Committee of Sponsoring Organizations of the Treadway Commission (2013 framework) (the COSO criteria). The Company’s management is responsible for maintaining effective internal control over financial reporting, and for its assessment of the effectiveness of internal control over financial reporting included in the accompanying Report of Management on Internal Control Over Financial Reporting. Our responsibility is to express an opinion on the Company’s internal control over financial reporting based on our audit.
We conducted our audit in accordance with the standards of the Public Company Accounting Oversight Board (United States). Those standards require that we plan and perform the audit to obtain reasonable assurance about whether effective internal control over financial reporting was maintained in all material respects. Our audit included obtaining an understanding of internal control over financial reporting, assessing the risk that a material weakness exists, testing and evaluating the design and operating effectiveness of internal control based on the assessed risk, and performing such other procedures as we considered necessary in the circumstances. We believe that our audit provides a reasonable basis for our opinion.
A company’s internal control over financial reporting is a process designed to provide reasonable assurance regarding the reliability of financial reporting and the preparation of financial statements for external purposes in accordance with generally accepted accounting principles. A company’s internal control over financial reporting includes those policies and procedures that (1) pertain to the maintenance of records that, in reasonable detail, accurately and fairly reflect the transactions and dispositions of the assets of the company; (2) provide reasonable assurance that transactions are recorded as necessary to permit preparation of financial statements in accordance with generally accepted accounting principles, and that receipts and expenditures of the company are being made only in accordance with authorizations of management and directors of the company; and (3) provide reasonable assurance regarding prevention or timely detection of unauthorized acquisition, use or disposition of the company’s assets that could have a material effect on the financial statements.
Because of its inherent limitations, internal control over financial reporting may not prevent or detect misstatements. Also, projections of any evaluation of effectiveness to future periods are subject to the risk that controls may become inadequate because of changes in conditions, or that the degree of compliance with the policies or procedures may deteriorate.
In our opinion, the Company maintained, in all material respects, effective internal control over financial reporting as of December 31, 2015, based on the COSO criteria.
We also have audited, in accordance with the standards of the Public Company Accounting Oversight Board (United States), the consolidated balance sheets of the Company as of December 31, 2015 and 2014 and the related consolidated statements of operations, comprehensive income (loss), stockholders’ equity and cash flows for each of the three years in the period ended December 31, 2015 of the Company and our report dated February 26, 2016 expressed an unqualified opinion thereon.
/s/ Ernst & Young LLP
Atlanta, Georgia
February 26, 2016
136
Table of Contents
None.
137
Table of Contents
PART III
Item 10. DIRECTORS, EXECUTIVE OFFICERS, AND CORPORATE GOVERNANCE.
The information to be set forth under the captions “Proposal 1 Election of Directors—Nomination for Election and Qualifications to Serve as Director,” “Proposal 1 Election of Directors—Audit Committee,” “Proposal 1 Election of Directors—The Nominating and Corporate Governance Committee,” “Section 16(a) Beneficial Ownership Reporting Compliance” and “Audit Committee Report” in our Proxy Statement for the 2016 Annual Meeting of Stockholders, is hereby incorporated by reference in response to this item.
We have adopted the Axiall Code of Business Conduct and Ethics (the “Code of Ethics”), which applies to all of our directors, officers and employees. The Code of Ethics is publicly available on our website at http://www.axiall.com under “Investors—Governance—Company Policies.” If we make any substantive amendments to our Code of Ethics or we grant any waiver, including any implicit waiver, from a provision of the Code of Ethics, which applies to our principal executive officer, principal financial officer, principal accounting officer or controller, we will disclose the nature of the amendment or waiver on our website. Also, we may elect to also disclose the amendment or waiver in a report on Form 8-K filed with the SEC.
In addition, our Corporate Governance Guidelines and the charters for our audit committee, leadership development and compensation committee and nominating and corporate governance committee are available on our website at http://www.axiall.com under “Investors—Governance—Company Policies” and are available in print to any stockholder who requests them from the Corporate Secretary of Axiall Corporation, 1000 Abernathy Road, Suite 1200, Atlanta, GA 30328. The information on our website is not a part of or incorporated by reference into, this Annual Report on Form 10-K.
Item 11. EXECUTIVE COMPENSATION.
The information to be set forth under the captions “Proposal 1 Election of Directors—Compensation of Directors” and “Executive Compensation” in our Proxy Statement for the 2016 Annual Meeting of Stockholders is hereby incorporated by reference in response to this item.
138
Table of Contents
Item 12. SECURITY OWNERSHIP OF CERTAIN BENEFICIAL OWNERS AND MANAGEMENT AND RELATED STOCKHOLDER MATTERS.
The information to be set forth under the caption “Security Ownership of Principal Stockholders and Management” in our Proxy Statement for the 2016 Annual Meeting of Stockholders is hereby incorporated by reference in response to this item.
Securities Authorized for Issuance Under Equity Compensation Plans
The following table provides information with respect to compensation plans under which our equity securities are authorized for issuance to employees as of December 31, 2015:
| Number of securities to be issued upon exercise of outstanding options, warrants and rights |
Weighted-average exercise price of outstanding options, warrants and rights |
Number of securities remaining available for future issuance under equity compensation plans (excluding securities reflected in column (a)) |
||||||||||
| Plan category | (a) | (b) | (c) | |||||||||
| Equity compensation plans approved by security holders |
902,683 | $ | 109.4 | 1,938,902 | ||||||||
| Equity compensation plans not approved by security holders |
- | - | - | |||||||||
|
|
|
|
|
|
|
|||||||
| Total |
902,683 | $ | 109.4 | 1,938,902 | ||||||||
|
|
|
|
|
|
|
|||||||
See Note 13 to the Consolidated Financial Statements in Item 8 of this Annual Report on Form 10-K for information regarding material features of the above compensation plans.
Item 13. CERTAIN RELATIONSHIPS AND RELATED TRANSACTIONS, AND DIRECTOR INDEPENDENCE.
The information to be set forth under the caption “Proposal 1 Election of Directors – Review of Related Party Transactions,” and “Proposal 1 Election of Directors – Independence of Directors; Corporate Governance Guidelines; Code of Business Ethics,” in our Proxy Statement for the 2016 Annual Meeting of Stockholders is hereby incorporated by reference in response to this item.
Item 14. PRINCIPAL ACCOUNTANT FEES AND SERVICES.
The information to be set forth in the section entitled “Proposal V Ratification and Appointment of Independent Registered Public Accounting Firm” in our Proxy Statement for the 2016 Annual Meeting of Stockholders is incorporated herein by reference in response to this item.
139
Table of Contents
PART IV
Item 15. EXHIBITS AND FINANCIAL STATEMENT SCHEDULES.
| (a) | The following documents are filed as a part of this Form 10-K: |
| (1) | Consolidated Balance Sheets as of December 31, 2015 and 2014; |
| Consolidated Statements of Operations for the years ended December 31, 2015, 2014 and 2013; |
| Consolidated Statements of Comprehensive Income (Loss) for the years ended December 31, 2015, 2014 and 2013; |
| Consolidated Statements of Stockholders’ Equity for the years ended December 31, 2015, 2014 and 2013; |
| Consolidated Statements of Cash Flows for the years ended December 31, 2015, 2014 and 2013; |
| Notes to Consolidated Financial Statements; and |
| Report of Independent Registered Public Accounting Firm. |
| (2) | Exhibits. Each management contract or compensatory plan or arrangement is preceded by an asterisk. |
| (b) | Financial Statement Schedules: None |
| (c) | The following exhibits are filed as part of this Form 10-K: |
Exhibit Index
| Exhibit Number |
Description | |
| 2.1 | Agreement and Plan of Merger, dated as of July 18, 2012, by and among Georgia Gulf Corporation (now known as Axiall Corporation), PPG Industries, Inc., Eagle Spinco Inc. and Grizzly Acquisition Sub, Inc. (filed as Exhibit 2.1 to the Company’s Current Report on Form 8-K filed with the SEC on July 19, 2012 and incorporated herein by reference). | |
| 2.2 | Separation Agreement, dated as of July 18, 2012, by and between PPG Industries, Inc. and Eagle Spinco Inc. (filed as Exhibit 10.1 to the Company’s Current Report on Form 8-K filed with the SEC on July 19, 2012 and incorporated herein by reference). | |
| 2.3 | Amendment No. 1 to the Agreement and Plan of Merger, dated as of August 31, 2012, by and among Georgia Gulf Corporation (now known as Axiall Corporation), PPG industries, Inc., Eagle Spinco Inc. and Grizzly Acquisition Sub, Inc. (filed as Exhibit 2.1 to the Company’s Current Report on Form 8-K filed with the SEC on September 5, 2012 and incorporated herein by reference). | |
| 3.1 | Restated Certificate of Incorporation of Georgia Gulf Corporation (now known as Axiall Corporation) (filed as Exhibit 3.1 to the Company’s Quarterly Report on Form 10-Q for the quarter ended June 30, 2011 filed with the SEC on August 5, 2011 and incorporated herein by reference). | |
140
Table of Contents
| 3.1(a) | Amended and Restated Certificate of Designation, Preferences and Rights of Junior Participating Preferred Stock of Georgia Gulf Corporation (now known as Axiall Corporation) (included as Exhibit A to Exhibit 3.1). | |
| 3.2 | Second Amended and Restated Bylaws of Axiall Corporation (filed as Exhibit 3.1 to the Company’s Current Report on Form 8-K filed with the SEC on March 7, 2014 and incorporated herein by reference). | |
| 3.3 | Certificate of Ownership and Merger, as filed with the Secretary of State of the State of Delaware on January 28, 2013 (filed as Exhibit 3.1 to the Company’s Current Report on Form 8-K filed with the SEC on January 30, 2013 and incorporated herein by reference). | |
| 3.4 | Certificate of Amendment, as filed with the Secretary of State of the State of Delaware on January 28, 2013 (filed as Exhibit 3.2 to the Company’s Current Report on Form 8-K filed with the SEC on January 30, 2013 and incorporated herein by reference). | |
| 4.1 | Indenture, dated as of February 1, 2013, among the Company, the initial guarantors party thereto and U.S. Bank National Association, as trustee, relating to the 4.875 percent senior notes due 2023 (filed as Exhibit 4.1 to the Company’s Current Report on Form 8-K filed with the SEC on February 1, 2013 and incorporated herein by reference). | |
| 4.2 | First Supplemental Indenture, dated as of December 30, 2013, to the Indenture, dated as of February 1, 2013, by and among the Company, the additional guarantor party thereto and U.S. Bank National Association, as trustee (filed as Exhibit 4.2 to the Company’s Annual Report on Form 10-K for the year ended December 31, 2013 filed with the SEC on February 28, 2014 and incorporated herein by reference). | |
| 4.3 | Second Supplemental Indenture, dated as of June 27, 2014, to the Indenture, dated as of February 1, 2013, by and among the Company, the additional guarantor party thereto and U.S. Bank National Association, as trustee (filed as Exhibit 4.1 to the Company’s Quarterly Report on Form 10-Q for the quarter ended June 30, 2014 filed with the SEC on August 7, 2014 and incorporated herein by reference). | |
| 4.4 | Third Supplemental Indenture, dated as of January 15, 2015, to the Indenture, dated as of February 1, 2013, by and among the Company, the additional guarantor party thereto and U.S. Bank National Association, as trustee (filed as Exhibit 4.4 to the Company’s Annual Report on Form 10-K for the year ended December 31, 2014 filed with the SEC on February 27, 2015 and incorporated herein by reference). | |
| 4.5 | Indenture, dated as of January 28, 2013, by and among Eagle Spinco Inc., the initial guarantors party thereto and U.S. Bank National Association, as trustee, relating to the 4.625 percent senior notes due 2021 of Eagle Spinco Inc. (filed as Exhibit 4.1 to the Company’s Current Report on Form 8-K filed with the SEC on January 30, 2013 and incorporated herein by reference). | |
| 4.6 | First Supplemental Indenture, dated as of January 28, 2013, to the Indenture, dated as of January 28, 2013, by and among Eagle Spinco Inc., the additional guarantors party thereto and U.S. Bank National Association, as trustee (filed as Exhibit 4.3 to the Company’s Current Report on Form 8-K filed with the SEC on January 30, 2013 and incorporated herein by reference). | |
141
Table of Contents
| 4.7 | Second Supplemental Indenture, dated as of December 30, 2013, to the Indenture, dated as of January 28, 2013, by and among Eagle Spinco Inc., the additional guarantor party thereto and U.S. Bank National Association, as trustee (filed as Exhibit 4.5 to the Company’s Annual Report on Form 10-K for the year ended December 31, 2013 filed with the SEC on February 28, 2014 and incorporated herein by reference). | |
| 4.8 | Third Supplemental Indenture, dated as of June 27, 2014, to the Indenture, dated as of January 28, 2013, by and among Eagle Spinco Inc., the additional guarantor party thereto and U.S. Bank National Association, as trustee (filed as Exhibit 4.2 to the Company’s Quarterly Report on Form 10-Q for the quarter ended June 30, 2014 filed with the SEC on August 7, 2014 and incorporated herein by reference). | |
| 4.9 | Fourth Supplemental Indenture, dated as of January 15, 2015, to the Indenture, dated as of January 28, 2013, by and among Eagle Spinco, Inc., the additional guarantor party thereto and U.S. Bank National Association, as trustee (filed as Exhibit 4.9 to the Company’s Annual Report on Form 10-K for the year ended December 31, 2014 filed with the SEC on February 27, 2015 and incorporated herein by reference). | |
| 4.10 | Form of 4.875 percent Senior Notes due 2023 (included as Exhibit A to Exhibit 4.1). | |
| 4.11 | Form of 4.625 percent Senior Notes due 2021 (included as Exhibit A to Exhibit 4.4). | |
| 10.1 | Second Amended and Restated Credit Agreement, dated as of December 17, 2014, by and among the Company, Eagle Spinco Inc. and Royal Group, Inc. as borrowers, the guarantors party thereto, General Electric Capital Corporation, as Administrative Agent, Wells Fargo Capital Finance, LLC, Barclays Bank PLC, and the other lenders a party thereto (filed as Exhibit 10.1 to the Company’s Current Report on Form 8-K filed with the SEC on December 22, 2014 and incorporated herein by reference). | |
| 10.2 | Amendment No. 1 and Consent, dated as of April 21, 2015, to the Second Amended and Restated Credit Agreement, dated as of December 17, 2014, by and among the Company, Eagle Spinco, Inc., Royal Group, Inc., General Electric Capital Corporation, as administrative agent, and the other parties thereto. (filed as Exhibit 10.2 to the Company’s Quarterly Report on Form 10-Q for the quarter ended March 31, 2015, filed with the SEC on May 7, 2015, and incorporated herein by reference). | |
| 10.3 | Amendment No. 2, dated December 30, 2015, to the Second Amended and Restated Credit Agreement, dated as of December 17, 2014, by and among the Company, Eagle Spinco Inc. and Royal Group, Inc. as borrowers, the other credit parties thereto, General Electric Capital Corporation as a lender, export-related loan lender and swingline lender, administrative agent, co-collateral agent and co-syndication agent, Wells Fargo Capital Finance, LLC as a lender, co-collateral agent and co-syndication agent, Barclays Bank PLC as a lender and documentation agent, and the other lenders a party thereto, and GE Capital Markets, Inc. and Wells Fargo Capital Finance, LLC as co-lead arrangers and joint bookrunners. | |
142
Table of Contents
| 10.4 | Credit Agreement, dated as of February 27, 2015, by and among Axiall Holdco, Inc., as the borrower, Barclays Bank PLC, as administrative agent, Wells Fargo Securities, LLC, as syndication agent, RBC Capital Markets, LLC, as documentation agent, and the other financial institutions party thereto as lenders, and Wells Fargo Securities LLC and RBC Capital Markets, LLC as joint lead arrangers and joint bookrunners, and Citigroup Global Markets, Inc., HSBC Securities (USA) Inc., PNC Capital Markets LLC and SunTrust Robinson Humphrey, Inc. as co-arrangers (filed as Exhibit 10.1 to the Company’s Current Report on Form 8-K, filed with the SEC on March 5, 2015, and incorporated herein by reference). | |
| 10.5 | Amended and Restated Limited Liability Company Agreement of LACC, LLC, dated as of June 17, 2015 (filed as Exhibit 10.1 to the Company’s Current Report on Form 8-K, filed with the SEC on June 23, 2015, and incorporated herein by reference). | |
| 10.6 | Contribution and Subscription Agreement, dated as of June 17, 2015, by and among Eagle US 2 LLC, the Company and LACC, LLC (filed as Exhibit 10.2 to the Company’s Current Report on Form 8-K, filed with the SEC on June 23, 2015, and incorporated herein by reference). | |
| 10.7 | Call Option Agreement, dated as of June 17, 2015, by and between Eagle US 2 LLC and Lotte Chemical USA Corporation (filed as Exhibit 10.3 to the Company’s Current Report on Form 8-K, filed with the SEC on June 23, 2015, and incorporated herein by reference). | |
| 10.8* | Form of Restricted Stock Unit Agreement for Canadian-based officers and employees (filed as Exhibit 10.1 to the Company’s Quarterly Report on Form 10-Q for the quarter ended June 30, 2013 filed with the SEC on August 7, 2013). | |
| 10.9* | Form of Restricted Stock Unit Agreement for United States-based employees (filed as Exhibit 10.2 to the Company’s Quarterly Report on Form 10-Q for the quarter ended June 30, 2013, filed with the SEC on August 7, 2013). | |
| 10.10* | Form of 2006 Nonqualified Stock Option Agreement (filed as Exhibit 10.2 to the Company’s Current Report on Form 8-K filed with the SEC on March 23, 2006 and incorporated herein by reference). | |
| 10.11* | Form of 2006 Nonqualified Stock Option Agreement for Non-Employee Directors (filed as Exhibit 10.3 to the Company’s Current Report on Form 8-K filed with the SEC on March 23, 2006 and incorporated herein by reference). | |
| 10.12* | Form of 2012 Restricted Share Unit Agreement for Timothy Mann, Jr. (filed as Exhibit 10.2 to the Company’s Quarterly Report on Form 10-Q for the quarter ended September 30, 2012 filed with the SEC on November 8, 2012 and incorporated herein by reference). | |
| 10.13* | Form of 2012 Restricted Share Unit Agreement for William L. Mansfield (filed as Exhibit 10.3 to the Company’s Quarterly Report on Form 10-Q for the quarter ended September 30, 2012 filed with the SEC on November 8, 2012 and incorporated herein by reference). | |
| 10.14* | Form of Restricted Share Unit Agreement (filed as Exhibit 10.2 to the Company’s Current Report on Form 8-K filed with the SEC on September 18, 2009 and incorporated herein by reference). | |
143
Table of Contents
| 10.15* | Form of Restricted Share Unit Agreement for Canadian Grantees (filed as Exhibit 10.3 to the Company’s Current Report on Form 8-K filed with the SEC on September 18, 2009 and incorporated herein by reference). | |
| 10.16* | Form of Adjusted EBITDA-Based Performance Restricted Stock Unit Agreement (filed as Exhibit 10.1 to the Company’s Current Report on Form 8-K filed with the SEC on May 22, 2014 and incorporated herein by reference). | |
| 10.17* | Form of TSR-Based Performance Restricted Stock Unit Agreement (filed as Exhibit 10.2 to the Company’s Current Report on Form 8-K filed with the SEC on May 22, 2014 and incorporated herein by reference). | |
| 10.18* | Form of Time-Based Restricted Stock Unit Agreement for Certain Executive Officers (filed as Exhibit 10.3 to the Company’s Current Report on Form 8-K filed with the SEC on May 22, 2014 and incorporated herein by reference). | |
| 10.19* | Georgia Gulf Corporation 2011 Equity and Performance Incentive Plan (filed as Exhibit 10.1 to the Company’s Current Report on Form 8-K filed with the SEC on May 18, 2011 and incorporated herein by reference). | |
| 10.20* | First Amendment to the Company’s 2011 Equity and Performance Incentive Plan (filed as Exhibit 10.4 to the Company’s Current Report on Form 8-K filed with the SEC on January 30, 2013 and incorporated herein by reference). | |
| 10.21* | Georgia Gulf Corporation Deferred Compensation Plan, as amended and restated effective as of January 1, 2012 (filed as Exhibit 10.12 to the Company’s Annual Report on Form 10-K for the year ended December 31, 2011 filed with the SEC on February 24, 2012 and incorporated by reference herein). | |
| 10.22* | First Amendment to the Georgia Gulf Corporation Deferred Compensation Plan, dated February 8, 2013. | |
| 10.23* | Executive Officer and Key Employee Severance Plan (filed as Exhibit 10.1 to the Company’s Current Report on Form 8-K filed with the SEC on December 12, 2013). | |
| 10.24* | Georgia Gulf Corporation Executive and Key Employee Change of Control Severance Plan, effective as of May 15, 2007, as Amended and Restated Effective as of January 1, 2009 (filed as Exhibit 10.11 to the Company’s Annual Report on Form 10-K for the year ended December 31, 2010 filed with the SEC on March 10, 2011 and incorporated herein by reference). | |
| 10.25* | First Amendment to the amended and restated Georgia Gulf Corporation Executive and Key Employee Change of Control Severance Plan, dated May 16, 2011 (filed as Exhibit 10.6 to the Company’s Quarterly Report on Form 10-Q for the quarter ended June 30, 2011 filed with the SEC on August 5, 2011 and incorporated herein by reference). | |
| 10.26* | Description of Gregory C. Thompson’s Compensation Arrangement (filed as Exhibit 10.1 to the Company’s Quarterly Report on Form 10-Q for the quarter ended March 31, 2008 filed with the SEC on May 9, 2008 and incorporated herein by reference). | |
| 10.27* | Letter agreement regarding employment of George Biltz as the Company’s Chief Strategy Officer (filed as Exhibit 10.1 to the Company’s Quarterly Report on Form 10-Q for the quarter ended September 30, 2013 filed with the SEC on November 8, 2013 and incorporated herein by reference). | |
144
Table of Contents
| 10.28* | Letter agreement regarding employment of Dean Adelman, Vice President, Human Resources, dated January 18, 2013 (filed as Exhibit 10.23 on the Company’s Annual Report on Form 10-K for the year ended December 31, 2012, filed with the SEC on February 28, 2013 and incorporated herein by reference). | |
| 10.29* | Separation and Release Agreement by and between Paul D. Carrico and the Company, dated July 5, 2015 (filed as Exhibit 10.1 to the Company’s Current Report on Form 8-K, filed with the SEC on July 6, 2015, and incorporated herein by reference). | |
| 10.30* | Separation Agreement by and between Joseph C. Breunig and the Company, dated August 4, 2015 (filed as Exhibit 10.1 to the Company’s Quarterly Report on Form 10-Q for the quarter ended on September 30, 2015, filed with the SEC on November 5, 2015, and incorporated herein by reference). | |
| 10.31* | Letter agreement regarding the promotion and retention of Simon Bates to the position of Senior Vice President, Building Products, dated September 18, 2015 (filed as Exhibit 10.2 to the Company’s Quarterly Report on Form 10-Q for the quarter ended on September 30, 2015, filed with the SEC on November 5, 2015, and incorporated herein by reference). | |
| 10.32* | Separation Agreement by and between Sharon Piciacchio and the Company, dated December 1, 2015. | |
| 10.33* | Separation Agreement by and between Mark J. Orcutt and the Company, dated November 2, 2015. | |
| 10.34* | Form of Executive Nonqualified Stock Option Agreement (filed as Exhibit 10.2 to the Company’s Quarterly Report on Form 10-Q for the quarter ended September 30, 2004 filed with the SEC on November 1, 2004 and incorporated herein by reference). | |
| 10.35* | Form of Non-Employee Director Nonqualified Stock Option Agreement (filed as Exhibit 10.3 to the Company’s Quarterly Report on Form 10-Q for the quarter ended September 30, 2004 filed with the SEC on November 1, 2004 and incorporated herein by reference). | |
| 10.36* | Form of Forfeiture Notice (filed as Exhibit 10.1 to the Company’s Current Report on Form 8-K on May 27, 2009 and incorporated herein by reference). | |
| 10.37* | Georgia Gulf Corporation 2009 Equity and Performance Incentive Plan (filed as Annex B to the Company’s Proxy Statement filed with the SEC on August 24, 2009 and incorporated herein by reference). | |
| 10.38* | Form of Non-Employee Director Restricted Share Unit Agreement (filed as Exhibit 10.2 to the Company’s Current Report on Form 8-K filed with the SEC on January 19, 2010 and incorporated herein by reference). | |
| 10.39* | Georgia Gulf Corporation Annual Incentive Compensation Plan (filed as Exhibit 10.2 to the Company’s Current Report on Form 8-K filed with the SEC on May 18, 2011 and incorporated herein by reference). | |
| 10.40* | Form of Non-Employee Director Restricted Stock Unit Agreement (filed as Exhibit 10.3 to the Company’s Quarterly Report on Form 10-Q for the quarter ended June 30, 2011 filed with the SEC on August 5, 2011 and incorporated herein by reference). | |
145
Table of Contents
| 10.41* | Form of Performance Restricted Stock Unit Agreement for United States-based employees (filed as Exhibit 10.4 to the Company’s Quarterly Report on Form 10-Q for the quarter ended June 30, 2011 filed with the SEC on August 5, 2011 and incorporated herein by reference). | |
| 10.42* | Form of Performance Restricted Stock Unit Agreement for Canadian-based employees (filed as Exhibit 10.5 to the Company’s Quarterly Report on Form 10-Q for the quarter ended June 30, 2011 filed with the SEC on August 5, 2011 and incorporated herein by reference). | |
| 10.43 | Form of Indemnification Agreement (filed as Exhibit 10.34 to the Company’s Annual Report on Form 10-K for the year ended December 31, 2013 filed with the SEC on February 28, 2014 and incorporated herein by reference). | |
| 21 | Subsidiaries of the Registrant. | |
| 23.1 | Consent of Ernst & Young LLP. | |
| 24 | Power of attorney for Axiall Corporation (included on the signature page of this Annual Report on Form 10-K) | |
| 31 | Rule 13(a)-14(a)/15d-14(a) Certifications. | |
| 32 | Section 1350 Certifications. | |
| 101.INS | XBRL Instance Document. | |
| 101.SCH | XBRL Taxonomy Extension Schema Document. | |
| 101.CAL | XBRL Taxonomy Extension Calculation Linkbase Document. | |
| 101.DEF | XBRL Taxonomy Extension Definition Linkbase Document. | |
| 101.LAB | XBRL Taxonomy Extension Label Linkbase Document. | |
| 101.PRE | XBRL Taxonomy Extension Presentation Linkbase Document. | |
| * | Management contract or compensatory plan or arrangement. |
146
Table of Contents
SIGNATURES
Pursuant to the requirements of Section 13 or 15(d) of the Securities Exchange Act of 1934, the registrant has duly caused this report to be signed on its behalf by the undersigned, thereunto duly authorized.
| AXIALL CORPORATION (Registrant) | ||||||
| February 26, 2016 | By: | /s/ Timothy Mann, Jr. | ||||
| Timothy Mann, Jr. President and Chief Executive Officer | ||||||
147
Table of Contents
POWER OF ATTORNEY
Each person whose signature appears below constitutes and appoints Timothy Mann, Jr., Gregory C. Thompson and Daniel S. Fishbein, and each of them, his or her true and lawful attorneys-in-fact and agents, with full power of substitution and resubstitution, for him or her and in his or her name, place and stead, in any and all capacities, to sign any and all amendments to this Annual Report on Form 10-K, and to file the same, with all exhibits thereto, and other documents in connection therewith, with the Securities and Exchange Commission, granting unto said attorneys-in-fact and agents, and each of them, full power and authority to do and perform each and every act and thing requisite and necessary to be done, as fully to all intents and purposes as he or she might or could do in person, hereby ratifying and confirming all that said attorneys-in-fact and agents or any of them, or their or his or her substitute or substitutes, may lawfully do or cause to be done by virtue hereof.
Pursuant to the requirements of the Securities Exchange Act of 1934, this report has been signed below by the following persons on behalf of the registrant and in the capacities and on the dates indicated.
| Signature |
Title |
Date | ||
| /s/ Timothy Mann, Jr. Timothy Mann, Jr. |
President, Chief Executive Officer and Director (Principal Executive Officer) |
February 26, 2016 | ||
| /s/ Gregory C. Thompson Gregory C. Thompson |
Executive Vice President and Chief Financial Officer (Principal Financial and Principal Accounting Officer) |
February 26, 2016 | ||
| /s/ T. Kevin DeNicola T. Kevin DeNicola |
Director | February 26, 2016 | ||
| /s/ Patrick J. Fleming Patrick J. Fleming |
Director | February 26, 2016 | ||
| /s/ Robert M. Gervis Robert M. Gervis |
Director | February 26, 2016 | ||
| /s/ Victoria F. Haynes Victoria F. Haynes |
Director | February 26, 2016 | ||
| /s/ William L. Mansfield William L. Mansfield |
Director | February 26, 2016 | ||
| /s/ Michael H. McGarry Michael H. McGarry |
Director | February 26, 2016 | ||
| /s/ Mark L. Noetzel Mark L. Noetzel |
Director | February 26, 2016 | ||
148
Table of Contents
| Signature |
Title |
Date | ||
| /s/ Robert Ripp Robert Ripp |
Director | February 26, 2016 | ||
| /s/ David N. Weinstein David N. Weinstein |
Director | February 26, 2016 | ||
149