Attached files
| file | filename |
|---|---|
| EX-23 - EX-23 - AXIALL CORP/DE/ | a2202524zex-23.htm |
| EX-31 - EX-31 - AXIALL CORP/DE/ | a2202524zex-31.htm |
| EX-32 - EX-32 - AXIALL CORP/DE/ | a2202524zex-32.htm |
| EX-10.11 - EX-10.11 - AXIALL CORP/DE/ | a2202524zex-10_11.htm |
Use these links to rapidly review the document
TABLE OF CONTENTS
UNITED STATES
SECURITIES AND EXCHANGE COMMISSION
WASHINGTON, D.C. 20549
FORM 10-K
ý ANNUAL REPORT PURSUANT TO SECTION 13 OR 15(d) OF
THE SECURITIES EXCHANGE ACT OF 1934
For the fiscal year ended December 31, 2010
OR
o TRANSITION REPORT PURSUANT TO SECTION 13 OR 15(d) OF THE SECURITIES EXCHANGE ACT OF 1934
For the transition period from to
Commission file number 1-9753
GEORGIA GULF CORPORATION
(Exact name of registrant as specified in its charter)
| DELAWARE (State or other jurisdiction of incorporation or organization) |
58-1563799 (I.R.S. Employer Identification No.) |
|
115 Perimeter Center Place, Suite 460, Atlanta, Georgia (Address of principal executive offices) |
30346 (Zip Code) |
|
Registrant's telephone number, including area code: (770) 395-4500 |
||
Securities registered pursuant to Section 12(b) of the Act: |
||
Title of each class
|
Name of each exchange on which registered
|
|
|---|---|---|
| Common Stock, $0.01 par value | New York Stock Exchange, Inc. |
Securities registered pursuant to Section 12(g) of the Act: None
Indicate by check mark if the registrant is a well-known seasoned issuer, as defined in Rule 405 of the Securities Act. Yes o No ý
Indicate by check mark if the registrant is not required to file reports pursuant to Section 13 or Section 15(d) of the Act. Yes o No ý
Indicate by check mark whether the registrant (1) has filed all reports required to be filed by Section 13 or 15(d) of the Securities Exchange Act of 1934 during the preceding 12 months (or for such shorter period that the registrant was required to file such reports), and (2) has been subject to such filing requirements for the past 90 days. Yes ý No o
Indicate by check mark whether the registrant has submitted electronically and posted on its corporate Website, if any, every Interactive Data File required to be submitted and posted pursuant to Rule 405 of Regulation S-T during the preceding 12 months (or for such shorter period that the registrant was required to submit and post such files). Yes o No o
Indicate by check mark if disclosure of delinquent filers pursuant to Item 405 of Regulation S-K is not contained herein, and will not be contained, to the best of the registrant's knowledge, in definitive proxy or information statements incorporated by reference in Part III of this Form 10-K or any amendment to this Form 10-K. ý
Indicate by check mark whether the registrant is a large accelerated filer, an accelerated filer, a non-accelerated filer or a smaller reporting company. See definition of "large accelerated filer," "accelerated filer," and "smaller reporting company" in Rule 12b-2 of the Exchange Act. (Check one):
Large accelerated filer o Accelerated filer ý Non-accelerated filer o Smaller reporting company o
Indicate by check mark whether the registrant is a shell company (as defined in Rule 12b-2 of the Act). Yes o No ý
Aggregate market value of the common stock held by non-affiliates of the registrant, computed using the closing price on the New York Stock Exchange for the registrant's common stock on June 30, 2010 was $449,853,614.
Indicate the number of shares outstanding of the registrant's common stock as of the latest practicable date.
Class
|
Outstanding at March 4, 2011
|
|
|---|---|---|
| Common Stock, $0.01 par value | 33,968,489 shares |
DOCUMENTS INCORPORATED BY REFERENCE
(To the Extent Indicated Herein)
General
Georgia Gulf Corporation (a Delaware company incorporated in 1983) is a leading North American manufacturer and international marketer of chemicals and building products. Our Chlorovinyls reportable segment consists of two product groups: i) Electrovinyls products, which are composed of chlorine, caustic soda, ethylene dichloride ("EDC"), vinyl chloride monomer ("VCM"), and vinyl resins; and ii) Compound products, which are composed of vinyl compounds, compound additives and plasticizers. Our Building Products reportable segment consists of two primary product groups: i) Window and Door Profiles and Mouldings; and ii) Outdoor Building Products, which consists of siding, pipe and pipe fittings and deck, fence and rail products. Our Aromatics reportable segment also contains two product groups: i) cumene; and ii) phenol and acetone.
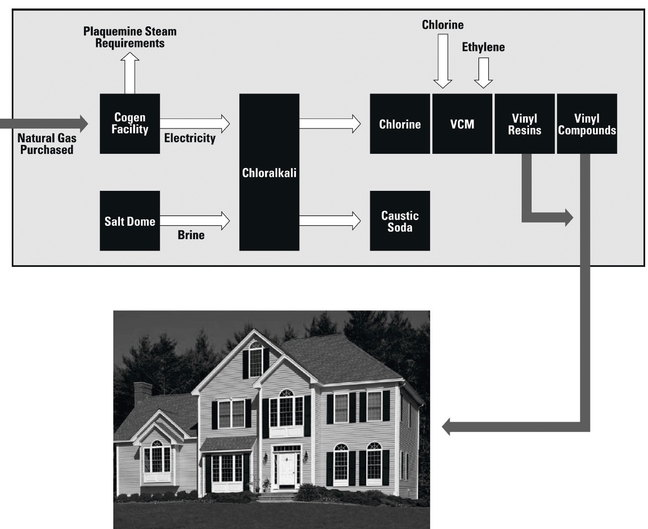
Our building products businesses source a majority of their raw materials from our chlorovinyls chemicals business in the form of vinyl resins, vinyl compounds, and compound additives. The following chart illustrates our chlorovinyls and building and home improvement products integration.
1
Recent Events
On January 14, 2011, we entered into an amendment to our senior secured revolving credit agreement which, among other things, removed the $15 million availability block, reduced certain fees and extended the maturity date to 2016.
On February 9, 2011, we acquired Exterior Portfolio by Crane, a leading U.S. manufacturer and marketer of siding products, for a net purchase price of approximately $72 million.
On February 16, 2011, we announced the redemption, on April 4, 2011, of all of our 7.125% Senior Notes due 2013 and 9.5% Senior Notes due 2014 (together, the "Redemption Notes") that remain outstanding. We expect to fund this redemption using cash on hand or borrowings under our revolving credit facility.
2009 Recapitalization
In 2009, we undertook a significant financial and operational restructuring, which included an exchange of approximately $736.0 million of then outstanding debt for newly issued equity securities (the "debt exchange") and related 1-for-25 reverse stock split. This restructuring, which is described in more detail elsewhere herein, was necessitated by the significant impact of the global recession on our industry and our company and our significant debt, including the approximately $1.5 billion in debt incurred in connection with our 2006 acquisition of Royal Group, a manufacturer of home improvement, building and construction products.
Segment Information
We operate through three reportable segments: chlorovinyls products; building products; and aromatics products. These three reportable segments reflect the organization used by our management for purposes of allocating resources and assessing performance. The chlorovinyls segment consists of a highly integrated chain of products, which includes chlorine, caustic soda, EDC, VCM and vinyl resins, vinyl compounds and compound additives and plasticizers. Our building products segment manufactures window and door profiles, mouldings, siding, pipe and pipe fittings and deck, fence, and rail products and markets vinyl-based building and home improvement products under the Royal Group brand names. The aromatics segment consists of cumene and the co-products phenol and acetone.
Reportable Segments
|
Key Products | |
|---|---|---|
Chlorovinyls |
Electrovinyl products: Chlorine/Caustic Soda EDC VCM Vinyl Resins Compound products: Vinyl Compounds Compound Additives |
|
Building Products |
Window and Door Profiles and Mouldings Products: |
|
Aromatics |
Cumene |
2
For selected financial information concerning our three reportable segments and our domestic and international sales, see Note 19 of the Notes to the Consolidated Financial Statements included in Item 8.
Products and Markets by Reportable Segment
Chlorovinyls Segment
The chlorovinyls segment consists of a highly integrated chain of products, which includes electrovinyl products consisting of chlorine, caustic soda, EDC, VCM, vinyl resins, and compound products consisting of vinyl compounds and compound additives. We have leading market positions in our key chlorovinyls products. In North America, we are one of the largest producers of VCM, vinyl resins, and vinyl compounds. The following table shows our total annual production capacity by product as of December 31, 2010, for our chlorovinyls segment's two primary product lines, Electrovinyls Products and Compound Products:
Product Line
|
Capacity | |
|---|---|---|
Electrovinyl Products: |
||
Vinyl Resins |
2.7 billion pounds | |
VCM |
3.0 billion pounds | |
Caustic Soda |
500,000 tons | |
Chlorine |
450,000 tons | |
Compound Products: |
||
Vinyl Compounds |
1.3 billion pounds | |
Compound Additives and Plasticizers |
184 million pounds |
Electrovinyl Products
Our electrovinyl products are primarily commodity based products produced to meet globally accepted standards for product grades and classifications. As a result, pricing closely follows globally quoted index prices with standard adjustments based on production grades. Electrovinyl products are as follows:
Vinyl Resins. Vinyl resins are among the most widely used plastics in the world today, and we supply numerous grades of vinyl resins to a broad number of end-use markets. During 2010, approximately 44 percent of our vinyl resins production was sold into the U.S. and Canadian merchant market where our vinyl resins were used in a wide variety of flexible and rigid vinyl end-use applications. In 2010, the largest end-uses of our products were for pipe and pipe fittings, siding and window profiles. Approximately 25 percent of our production was sold into the export market, and approximately 31 percent of our vinyl resins are used internally in the manufacture of our vinyl compounds and vinyl building products.
VCM. During 2010, we used about 95 percent of our VCM production in the manufacture of vinyl resins in our PVC manufacturing operations. VCM production not used internally is sold to other vinyl resins producers in domestic and international markets.
Chlorine and Caustic Soda. All of the chlorine we produce is used internally in the production of VCM. As a co-product of chlorine, caustic soda further diversifies our revenue base. We sell substantially all of our caustic soda to customers domestically and overseas in numerous industries, with the pulp and paper, chemical and alumina industries constituting our largest markets. Other markets for our caustic soda include soap and detergents and the water treatment industries.
3
Compound Products
Compound products are as follows:
Vinyl Compounds. Vinyl compounds are highly customized formulations that offer specific end-use properties based upon customer-determined manufacturing specifications that enable our customers to utilize them directly in their manufacturing processes to fabricate their finished products. We produce flexible and rigid compounds, which are used in many different applications, including wire and cable insulation and jacketing, electrical outlet boxes and pipe fittings, window and furniture profiles and food-grade and general-purpose bottles. We also supply chlorinated vinyl compounds, or CPVC, to the extrusion and injection molding markets, mainly for production of hot water pipe and pipe fittings.
Compound Additives and Plasticizers. The primary additives that we produce are lubricants, stabilizers, impact modifiers and process aids used in the production of compounds, and which are part of the typical compound formulations. The majority of our additives and plasticizers are consumed internally.
Building Products Segment
The building products segment consists of two primary product groups: i) Window and Door Profiles and Mouldings Products, which includes extruded vinyl window and door profiles and interior and exterior mouldings products; and ii) Outdoor Building Products, which includes siding, pipe and pipe fittings, deck, fence and rail products. The Window and Door Profiles and Mouldings Products have a higher level of customization based on customer specifications, whereas Outdoor Building Products are based more on industry standards. The demand and pricing for our Window and Door Profiles and Mouldings Products generally trend in similar patterns based on the product features and benefits of customized vinyl products when compared to alternative products, such as wood. Outdoor Building Products are made to precise industry standards, thus providing for a high level of compatibility within the construction and renovation systems in which they are used. The demand and pricing for our Outdoor Building Products generally trend in similar patterns primarily based on the cost of the underlying raw materials.
Window and Door Profiles and Mouldings Products
Window and Door Profiles. Our window and door profiles products represent the largest portion of revenues within our building and home improvement products lines. We manufacture and extrude vinyl window profiles including frames, sashes, trim and other components, as well as vinyl patio door components and fabricated patio doors, which are sold primarily to window and door fabricators. Our sales are primarily to the custom segment of the vinyl window profile market with the profile design customized to a window fabricator's specific requirements.
Mouldings. We manufacture and market extruded decorative mouldings and millwork. Our decorative trim products are used for interior mouldings, such as crown, base and chair rail. For exterior mouldings, our products are used in applications such as brick mouldings, and as components used in the fabrication of doors, windows and spas. This product line includes a series of offerings, such as bendable trim and paintable/stainable trim.
Outdoor Building Products
Our outdoor building products ("OBP") are made to industry standards, thus providing for a high level of compatibility within the construction and renovation systems in which they are used. Our OBP include siding; pipe and pipe fittings; and deck, fence, and rail.
4
Siding. We manufacture vinyl siding, and we also offer a wide range of complementary accessories including vinyl soffit, aluminum soffit, fascia and trim and molded vent mounts and exterior shutters. We have a broad product offering of vinyl siding styles, including a premium vinyl siding that includes rich, dark, color-fast shades as well as a siding system, which enables siding panels to withstand harsh wind conditions.
Pipe and Pipe Fittings. We manufacture pipe and pipe fittings for the municipal and electrical markets, as well as pipe for plumbing applications. Our municipal pipe and pipe fittings product lines are used in potable water applications as well as in storm and sewer applications. Our plumbing lines are used in residential and industrial applications to move storm and sanitary wastewater from the building to the municipal sewer at the property line. This product line is primarily targeted at drain, waste and vent applications. Electrical, pipe, conduit and fittings are available in a wide variety of sizes and configurations, to meet the needs of both commercial and residential applications.
Deck, Fence and Rail. We manufacture vinyl deck, fence and rail products that are used for both the do-it-yourself ("D-I-Y") and professionally installed market segments. Products directed at the D-I-Y segment such as D-I-Y fencing are made in pre-built sections designed for quick and easy installation, and are sold through "big-box" home improvement retail stores. We offer many different fence styles for the professional installer. We also offer decorative columns and rail to complement our fence products. Our deck, fence and rail product lines are positioned as a lower-maintenance alternative to conventional wood and metal products.
Aromatics Segment
The aromatics segment is highly integrated and consists of cumene and phenol/acetone products. Phenol/acetone products are co-products made from cumene in the same production process. Since phenol and acetone are made from cumene, their pricing and sales volume is similarly impacted by industry and global economic conditions and supply and demand fundamentals for the underlying raw materials. Our aromatic products are primarily commodity based products produced to meet globally accepted standards for product grades and classifications. As a result, pricing closely follows raw material prices and capacity utilization. The following table shows our total annual production capacities as of December 31, 2010 for our aromatics segment's primary product groups:
Product Groups
|
Capacity | |
|---|---|---|
Cumene (1) |
2.0 billion pounds | |
Phenol/Acetone (2) |
808 million pounds |
- (1)
- We
operate the world's largest cumene plant, located in Pasadena, Texas.
- (2)
- Our phenol/acetone plant in Plaquemine, LA has the annual capacity to produce 500 million pounds of phenol and 308 million pounds of acetone.
Cumene
Cumene is used as an intermediate to make phenol and acetone and specialty chemicals and can be sold as an additive for gasoline blending. About 34 percent of our cumene was consumed internally during 2010 to produce phenol and acetone. Cumene production not used internally is sold to other phenol and acetone manufacturers in domestic and international markets.
Phenol/Acetone Products
Phenol. Phenol is sold to a broad base of customers who are producers of a variety of phenolic resins, engineering plastics and specialty chemicals. Phenolic resins are used as adhesives for wood
5
products such as plywood and Oriented Strand Board, or OSB. Engineering plastics are used in compact discs, digital video discs, automobiles, household appliances, electronics and protective coating applications. We also sell phenol for use in insulation, electrical parts, oil additives and chemical intermediates. In 2010, the largest sales segment of our phenol was the chemical sector.
Acetone. As a co-product of phenol, acetone further diversifies our revenue base. Acetone is a chemical used primarily in the production of acrylic resins, engineering plastics and industrial solvents. We sell the majority of our acetone into the acrylic resins market, where it is used in the manufacture of various plastics and coatings used for signage, automotive parts, household appliances, paints and industrial coatings. Other uses range from solvents for automotive and industrial applications to pharmaceuticals and cosmetics.
Production, Raw Materials and Facilities
Production
Chlorovinyls and Aromatics Chemical Products. In our chlorovinyls segment, we produce chlorine and its co-product caustic soda by electrolysis of salt brine. We produce VCM by reacting purchased ethylene with chlorine, which is both produced internally and purchased from third parties. Generally, our internal production of VCM slightly exceeds our internal demand requirements. We produce vinyl resins by polymerization of VCM in a batch reactor process. We formulate our vinyl compounds to specific customer needs by blending our vinyl resins with various additives such as plasticizers, impact modifiers, stabilizers and pigments, most of which are purchased. We also have the capacity to produce EDC, an intermediate in the manufacture of VCM, for external sales. In our aromatics segment, we produce cumene utilizing benzene and refinery grade propylene ("propylene") purchased from third parties. Cumene is then oxidized to produce cumene hydroperoxide, which is split into the co-products phenol and acetone.
Building and Home Improvement Products. Extrusion is a process by which vinyl compounds are heated until they melt and then forced through a uniquely shaped opening, referred to as a die, to form various shapes and thickness. For example, when producing decking, a slip resistant design may be embossed onto the planks. Variations in extrusion are used to give products other desired qualities. For example, in producing mouldings and some deck products, we use cellular extrusion, which involves the process of encapsulating air bubbles in the vinyl extrusion, which reduces weight and cost. As the extruded product leaves the die, it is immediately cooled resulting in resolidification of the vinyl into a product matching the die pattern. Cooling is accomplished by using water and/or air.
We also produce some pipe fittings through injection molding. These products are produced by heating vinyl compounds until they melt and then injecting them under pressure into a hollow mold to create three dimensional parts.
Raw Materials
Chlorovinyls and Aromatics Chemical Products. The significant raw materials we purchase from third parties include ethylene, benzene, natural gas, propylene, compound additives and chlorine. The majority of our purchases of ethylene and chlorine are made under long-term supply agreements, and we purchase natural gas, benzene and propylene in both the open market and under long-term contracts. We believe we have reliable sources of supply for our raw materials under normal market conditions. We cannot, however, predict the likelihood or impact of any future raw material shortages. Any shortages could have a material adverse impact on our results of operations.
Building and Home Improvement Products. The principal raw material we use in production of our building and home improvement product lines is vinyl resin, which is blended with other compound additives to form vinyl compounds, which are then extruded or injection molded. We believe internal
6
production of vinyl resins, compounds and most compound additives by our chlorovinyls segment assures quality and facilitates efficient production of our vinyl-based products. Additives assist in processing vinyl resins efficiently and can be used to make the resulting product flexible or rigid, to add color or texture or other desired properties. For example, UV inhibitors may be added to protect an exterior product from sun damage, which could cause fading.
Facilities
Plaquemine, Louisiana Facilities. Our operations at these facilities include the production of chlorine, caustic soda, EDC, VCM, vinyl resins, phenol and acetone. We have a long-term lease on a nearby salt dome with reserves in excess of twenty years from which we supply our salt brine requirements. We use all of our chlorine production in the manufacture of VCM at this facility, and we sell substantially all of our caustic soda production externally. All of the ethylene requirements for our VCM production are supplied by pipeline. Most of our Plaquemine VCM production is consumed on-site in our vinyl resins production or shipped to our other vinyl resins facilities, with the remainder sold to third parties. We produce a significant portion of our vinyl resins at this facility. As part of a modernization project at this facility completed in 2007, we increased our vinyl resins production capacity by approximately 450 million pounds annually. Our cumene requirements for the production of phenol and its co-product acetone are shipped from our Pasadena, Texas facility by dedicated barges.
Our 250-megawatt cogeneration facility supplies all of the electricity and steam needs at our Plaquemine facilities. We also own an on-site air separation unit operated by a third party that provides all of the Plaquemine facilities' nitrogen and oxygen gas requirements.
Lake Charles, Louisiana Facilities. We also produce VCM at our Lake Charles, Louisiana facility and through our manufacturing joint venture, PHH Monomers, LLC, which is in close proximity to our Lake Charles VCM facility. PHH Monomers is a joint venture with PPG Industries, Inc. that entitles us to 50 percent of the VCM production. Virtually all of the chlorine and ethylene needs of our Lake Charles VCM facility and PHH Monomers facility are supplied by pipeline. VCM from these facilities supplies our Aberdeen, Mississippi facility. On occasion, a small portion of VCM produced at the Lake Charles facilities is sold in spot sales to third parties.
Aberdeen, Mississippi Facility. We also produce vinyl resins at our Aberdeen, Mississippi facility from VCM supplied by railcar from our various VCM manufacturing facilities. In addition, the Aberdeen facility produces plasticizers, which are consumed internally for flexible vinyl compound production.
Vinyl Compounds and Compound Additives Facilities. We have six vinyl compound facilities located in Aberdeen, Gallman, Madison and Prairie, Mississippi, Vaughan, Ontario and Bradford, Ontario. These vinyl compound facilities are supplied from our vinyl resins facilities by railcar, truck, or in the case of Aberdeen, pipeline. We also have a compound additive manufacturing facility located in Bradford, Ontario and a compound plasticizer manufacturing facility in Aberdeen Mississippi.
Pasadena, Texas Facilities. At our Pasadena, Texas facilities we have the capability to produce 2.0 billion pounds of cumene, making this facility the world's largest cumene plant. We produce cumene utilizing purchased benzene and propylene. We purchase propylene and benzene at market prices from various suppliers delivered by multiple transportation modes to our cumene facility. Based on current industry capacity, we believe we have adequate access to benzene and propylene under normal conditions.
Building Products Facilities. In our building products segment, we currently operate 24 manufacturing facilities located in Canada and the U.S. In addition we operate distribution centers, some of which are co-located with manufacturing plants. Vinyl resins and vinyl compounds as well as compound additives from the plants operated by our chlorovinyls segment are supplied to our facilities
7
by truck or rail. We also purchase additional additives from various sources at market prices. The other principal cost to produce these products is electricity to power our facilities.
Operation of numerous manufacturing facilities located strategically near customers, such as is the case in our window and door profiles division, facilitates marketing and customer support, and also minimizes transportation costs. Transportation costs limit sales of pipe from our facilities. Because our pipe plants are located in Ontario and British Columbia, sales of our pipe are concentrated within the northeastern and northwestern portions of the U.S. and in Canada. Our building and home improvement products are delivered primarily by truck.
In May 2009, we announced plans to rationalize two window and door profile manufacturing facilities in our Building Products reportable segment. As part of this plan, our window and door profile plant in McCarran, Nevada was closed in November 2009 and one of our three window and door profile manufacturing plants in Vaughan, Ontario was closed in December 2009.
Seasonality
Operating income for all three of our reportable segments is affected by the seasonality of the construction industry, which experiences its highest level of activity during the spring and summer months. Therefore, our second and third quarter operating results are typically the strongest. Our first and fourth quarter operating results usually reflect a decrease in construction activity due to colder weather and holidays.
Inventory Practices and Product Returns
In our chlorovinyls and aromatics businesses, by the nature of our commodity based products, we do not maintain significant inventories and product returns are insignificant.
As is typical for the industry, in our home improvement and building products business, we maintain stocks of inventories across most of our product lines. We generally build additional inventory in advance of the peak construction season to assure product availability.
Generally, our home improvement and building products may be returned only if defective. However, in certain circumstances, we may allow the return of products as a customer accommodation, such as in the case of a change in product lines.
Sales and Marketing
No single customer accounted for more than 10 percent of our consolidated revenues for the years ended December 31, 2010, 2009, or 2008. In addition to our domestic sales, we export some of our products.
Chlorovinyls and Aromatics Chemical Products. Our sales and marketing program is aimed at supporting our existing customers and expanding and diversifying our customer base. In our chemicals business, we have a dedicated sales force organized by product line and region. In addition, we rely on distributors to market products to smaller customers. We have a product development and technical service staff that primarily supports our vinyl resins and vinyl compounds businesses. This staff works closely with customers to qualify existing Georgia Gulf products for use by our customers.
Building and Home Improvement Products. In our building products business, sales and marketing activities vary by product line and distribution channel. Our window and door profiles are primarily sold by our dedicated sales force and supported by marketing support activities that may include brochure development for window fabricators, technical advisory and design services for fabricators and advertising directed at installers suggesting that they look for windows fabricated with Royal Group profiles. Our mouldings products are distributed primarily by our dedicated sales force to independent
8
dealers, fabricators, distributors and home centers, who resell the products directly to builders, installers or homeowners. The majority of our vinyl siding and accessories sales are in North America, where products are distributed through independent building product distributors who are solicited primarily by Royal Group's dedicated sales force. In Canada, vinyl siding and accessories are distributed through company-owned as well as independent building product distributors. These distributors generally sell to professional building product installers in North America. Sales of pipe and pipe fittings are generally sold through municipal and electrical distributors. Our sales and technical staff work with end use customers to provide technical information to promote the use of our PVC pipe and fitting products. The majority of pipe and pipe fitting sales occur in Canada, where products are sold nationally through pipe distributors to contractors. In the United States, we sell our pipe fittings nationally, but sell our pipe principally in the Northeast and Northwest due to close proximity to Canadian manufacturing plants and higher costs associated with shipping to other regions. Deck, fence and rail products are sold through retail home improvement stores, and are also sold to professionals through distributors. The sales force for these products is primarily company employees. Royal Group engages in advertising programs primarily directed at trade professionals that are intended to develop awareness and interest in its products. In addition, Royal Group displays its products at a series of national and regional trade shows.
Competition
We experience competition from numerous manufacturers in our chlorovinyls, aromatics and building and home improvement products businesses. We compete on a variety of factors including price, product quality, delivery and technical service.
In our chemicals business, we face competition from numerous manufacturers of chemicals and vinyl resins and compounds. In our building and home improvement products business, we face competition for each of our products from other manufacturers of vinyl products as well as numerous manufacturers of traditional building materials. We believe that our vinyl building and home improvement products are preferred by builders and homeowners because of their durability and ease of installation and maintenance as compared to traditional building materials. In the window and door profile market, we face competition from manufacturers of wood, aluminum and fiberglass products. In the siding market, we face competition from manufacturers of cement, brick, wood, stucco, stone, concrete and aluminum products. We face competition from manufacturers of concrete and metal products in the pipe and pipe fittings market. Similarly, we face competition from manufacturers of composite materials, wood and metal products in the deck, fence and rail markets. In addition, competition for certain price sensitive products from countries such as China is increasing.
In all businesses, we believe that we are well-positioned to compete as a result of integrated product lines and the operational efficiency of our plants and, in the case of our chemical plants, the proximity of our facilities near major water and/or rail transportation terminals, which offers advantages in terms of pricing and delivery. We also believe that for many of our extruded products, our ability to produce our dies internally is a competitive advantage over producers who must rely on third parties. For example, we believe our ability to produce our own dies generally results in our responding more quickly and efficiently to the customer. Finally, we believe the breadth of our extruded building and home improvement product lines to be a competitive advantage.
Environmental Regulation
Our operations are subject to increasingly stringent federal, state and local laws and regulations relating to environmental quality. These regulations, which are enforced principally by the United States Environmental Protection Agency ("USEPA") and comparable state agencies and Canadian federal and provincial agencies, govern the management of solid hazardous waste, emissions into the air and discharges into surface and underground waters, and the manufacture of chemical substances. In
9
addition to the matters involving environmental regulation above and the matters discussed in Item 3 "Legal Proceedings," we are currently aware of the following potentially material environmental issues. No assurance can be provided that we will not become aware of additional environmental issues in the future that will have a material adverse effect on our business, results of operations or financial condition.
In the first quarter of 2007, the USEPA informed us of possible noncompliance at our Aberdeen, Mississippi facility with certain provisions of the Toxic Substances Control Act. Subsequently, we discovered possible non-compliance involving our Plaquemine, Louisiana and Pasadena, Texas facilities, which were then disclosed. We expect that all of these disclosures will be resolved in one settlement agreement with USEPA. While the penalties, if any, for such noncompliance may exceed $100,000, we do not expect that any penalties will have a material effect on our financial position, results of operations, or cash flows.
There are several serious environmental issues concerning the VCM facility at our Lake Charles, Louisiana production facility we acquired from CONDEA Vista Company ("CONDEA Vista" is now Sasol North America, Inc.) in 1999 and substantial investigation of the groundwater at the site has been conducted. Groundwater contamination was first identified in 1981. Groundwater remediation through the installation of groundwater recovery wells began in 1984. The site currently contains an extensive network of monitoring wells and recovery wells. Investigation to determine the full extent of the contamination is ongoing. It is possible that offsite groundwater recovery will be required, in addition to groundwater monitoring. Soil remediation could also be required.
Investigations are currently underway by federal environmental authorities concerning contamination of an estuary near the Lake Charles VCM facility, known as the Calcasieu Estuary. It is likely that this estuary will be listed as a Superfund site and will be the subject of a natural resource damage recovery claim. It is estimated that there are about 200 potentially responsible parties ("PRPs") associated with the estuary contamination. CONDEA Vista is included among these parties with respect to its Lake Charles facilities, including the VCM facility we acquired. The estimated cost for investigation and remediation of the estuary is unknown and could be quite costly. Also, Superfund statutes may impose joint and several liability for the cost of investigations and remedial actions on any company that generated the waste, arranged for disposal of the waste, transported the waste to the disposal site, selected the disposal site, or presently or formerly owned, leased or operated the disposal site or a site otherwise contaminated by hazardous substances. Any or all of the responsible parties may be required to bear all of the costs of cleanup regardless of fault, legality of the original disposal or ownership of the disposal site. Currently, we discharge our wastewater to CONDEA Vista, which has a permit to discharge treated wastewater into the estuary.
CONDEA Vista has agreed to retain responsibility for substantially all environmental liabilities and remediation activity relating to the vinyls business we acquired from it, including the Lake Charles, Louisiana VCM facility. For all matters of environmental contamination that were known at the time of acquisition (November 1999), we may make a claim for indemnification at any time. For any environmental matters that were then unknown we must generally have made such claims for indemnification before November 12, 2009. No such material claims were made.
At our Lake Charles VCM facility, CONDEA Vista conducted remediation at its expense until November 12, 2009. We are now responsible for remediation costs up to about $150,000 of expense per year, as well as costs in any year in excess of this annual amount, up to an aggregate one-time amount of about $2.3 million. As part of our ongoing assessment of our environmental contingencies, we determined these remediation costs to be probable and estimable and therefore maintained a $1.3 million accrual in non-current liabilities at December 31, 2010.
10
As for employee and independent contractor exposure claims, CONDEA Vista is responsible for exposures before November 12, 2009, and we are responsible for exposures after November 12, 2009, on a pro rata basis determined by years of employment or service before and after November 12, 1999, by any claimant.
In May 2008, we were informed that further efforts to remediate a spill of styrene reducer at our Royal Mouldings facility in Atkins, Virginia would be necessary. The spill was the result of a supply line rupture from an external holding tank. As a result of this spill, the facility entered into a voluntary remediation agreement with the Virginia Department of Environmental Quality ("VDEQ") in August 2003 and began implementing the terms of the voluntary agreement shortly thereafter. In August 2007, the facility submitted a report on the progress of the remediation to the VDEQ. Subsequently, the VDEQ responded by indicating that continued remediation of the area impacted by the spill was required. While the additional remediation costs may exceed $100,000, we do not expect such costs will have a material effect on our financial position, results of operations or cash flows.
We believe that we are in material compliance with all current environmental laws and regulations. We estimate that any expenses incurred in maintaining compliance with these requirements will not materially affect earnings or cause us to exceed our level of anticipated capital expenditures. However, there can be no assurance that regulatory requirements will not change, and it is not possible to accurately predict the aggregate cost of compliance resulting from any such changes.
Employees
As of December 31, 2010, and 2009, we had 3,932 and 3,489 full-time employees respectively. The increase in the number of employees is due to improvements in the economy and global market conditions. We employ approximately 429 employees under collective bargaining agreements that expire at various times from 2011 through 2014. We believe our relationships with our employees are good.
Available Information
We make available free of charge on our website at www.ggc.com our annual report on Form 10-K, quarterly reports on Form 10-Q, current reports on Form 8-K, and amendments to those reports filed or furnished pursuant to Section 13(a) of the Securities Exchange Act of 1934 as soon as reasonably practicable after we electronically file such materials with, or furnish them to, the Securities and Exchange Commission ("SEC").
Our business, financial condition and results from operations may be adversely affected by the risks described below as well as the other risks described in this Annual Report on Form 10-K. In addition, our business financial condition and results from operations may be materially adversely impacted by risks and developments not currently known to us, or that we currently consider immaterial.
The chemical industry is cyclical and volatile, experiencing alternating periods of tight supply and overcapacity, and the building products industry is also cyclical. This cyclicality adversely impacts our capacity utilization and causes fluctuations in our results of operations.
Our historical operating results for our chemical businesses have tended to reflect the cyclical and volatile nature of the chemical industry. Historically, periods of tight supply have resulted in increased prices and profit margins and have been followed by periods of substantial capacity addition, resulting in oversupply and declining prices and profit margins. A number of our chemical products are highly dependent on markets that are particularly cyclical, such as the building and construction, paper and pulp, and automotive markets. As a result of changes in demand for our products, our operating rates
11
and earnings fluctuate significantly, not only from year to year, but also from quarter to quarter, depending on factors such as feedstock costs, transportation costs, and supply and demand for the product produced at the facility during that period. As a result, individual facilities may operate below or above rated capacities in any period. We may idle a facility for an extended period of time because an oversupply of a certain product or a lack of demand for that product makes production uneconomical. Facility shutdown and subsequent restart expenses may adversely affect periodic results when these events occur. In addition, a temporary shutdown may become permanent, resulting in a write-down or write-off of the related assets. Capacity expansions or the announcement of these expansions have generally led to a decline in the pricing of our chemical products in the affected product line. We cannot assure you that future growth in product demand will be sufficient to utilize any additional capacity.
In addition, the building products industry is cyclical and seasonal and is significantly affected by changes in national and local economic and other conditions such as employment levels, demographic trends, availability of financing, interest rates and consumer confidence, which factors could negatively affect the demand for and pricing of our building products. For example, if interest rates increase, the ability of prospective buyers to finance purchases of home improvement products and invest in new real estate could be adversely affected, which, in turn, could adversely affect our financial performance. In response to the recent significant decline in the market for our building and home improvement products, we have closed facilities and sold certain businesses and assets. We are continuing to take further actions and monitor cost control initiatives; however, it is uncertain as to when demand will return, or whether demand for our products will decline, and when these businesses will return to significant and sustained profitability.
Our substantial level of indebtedness could adversely affect our financial condition and prevent us from fulfilling our obligations under our senior secured notes and our other indebtedness or force us to take other actions to satisfy these obligations.
We have substantial indebtedness which requires significant interest payments, including interest payments of approximately $65 million in 2011, based on interest rates in effect at December 31, 2010. As of December 31, 2010, we had total indebtedness of $689.9 million, including $500.0 million outstanding under our 9.0 percent notes, nil million drawn under our ABL Revolver that provides for a maximum of $300 million of revolving credit, subject to borrowing base availability and other terms and conditions, $112.4 million of lease financing obligations, $22.1 million of senior unsecured notes, $41.4 million of senior subordinated notes and $16.9 million of other debt. We plan to early repay the $22.1 million of senior unsecured notes in 2011. As of December 31, 2010, we had $264.8 million of undrawn availability under our ABL Revolver, after giving effect to $20.2 million of outstanding letters of credit. Our high level of indebtedness could have important consequences. For example, it could:
- •
- make it more difficult for us to satisfy our obligations, exposing us to the risk of default, which could result in a
foreclosure on our assets, which, in turn, would negatively affect our ability to operate as a going concern;
- •
- require us to dedicate a substantial portion of our cash flow from operations to interest and principal payments on our
indebtedness, reducing the availability of our cash flow for other purposes, such as capital expenditures, acquisitions, dividends and working capital;
- •
- limit our flexibility in planning for, or reacting to, changes in our business and the industries in which we operate;
- •
- increase our vulnerability to general adverse economic and industry conditions;
- •
- place us at a disadvantage compared to our competitors that have less debt;
12
- •
- expose us to fluctuations in the interest rate environment because the interest rates on borrowings under our ABL Revolver
are variable;
- •
- increase our cost of borrowing; and
- •
- limit our ability to borrow additional funds.
If our cash flows are not sufficient to fund our debt service obligations, we may be forced to sell assets, seek additional capital or restructure or refinance our indebtedness. While we believe that we should be able to meet the requirements of our debt agreements, we may be unable to do so, particularly if business conditions deteriorate to a material degree, or we suffer significant interruption of our operations. We principally operate in the North American chemicals and building products markets, which have suffered a substantial decline as a result of the severe downturn in the U.S. housing industry and the general worldwide recession. Further deteriorating business conditions could result in declines in our accounts receivable and inventories thereby lowering the availability of borrowings under the ABL Revolver. In any of these events, we would need to seek an amendment to, or a waiver or refinancing of, our debt, although there can be no assurance that we could do so, and even if we do, it is likely that such relief would significantly increase our costs through additional fees or increased rates and may only last for a specified period, potentially necessitating additional amendments, waivers or refinancing in the future. In the event we do not maintain compliance with the covenants under the ABL Revolver, our lenders under such facility could cease making loans to us and accelerate and declare due all outstanding loans under the facility. However, if we satisfy the various restrictive conditions in our debt agreements that address our ability to incur additional indebtedness, and we incur additional new debt, the risks associated with our high level of indebtedness could intensify.
Our ABL Revolver and the indenture governing the 9.0 percent notes impose significant operating and financial restrictions on us and our subsidiaries, which may prevent us from capitalizing on business opportunities and taking some actions.
The agreements that govern the terms of our debt, including our ABL Revolver and the indenture that governs the 9.0 percent notes, impose significant operating and financial restrictions on us. These restrictions limit our ability to, among other things:
- •
- incur additional indebtedness;
- •
- incur liens;
- •
- make investments and sell assets, including the stock of subsidiaries;
- •
- pay dividends and make other distributions;
- •
- purchase our stock;
- •
- engage in business activities unrelated to our current business;
- •
- enter into transactions with affiliates; or
- •
- consolidate, merge or sell all or substantially all of our assets.
As a result of these covenants and restrictions, we are limited in how we conduct our business and we may be unable to raise additional debt or equity financing to compete effectively or to take advantage of new business opportunities. The terms of any future indebtedness we may incur could include more restrictive covenants. A breach of any of these covenants could result in a default in respect of the related indebtedness. If a default occurs, the relevant lenders could elect to declare the indebtedness, together with accrued interest and other fees, to be due and payable immediately and proceed against any collateral securing that indebtedness.
13
Furthermore, there are limitations on our ability to incur the full $300.0 million of commitments under our ABL Revolver. Borrowings under our ABL Revolver are limited by a specified borrowing base consisting of a percentage of eligible accounts receivable and inventory, less customary reserves. In addition, if our availability under the ABL Revolver falls below a certain amount, we will be subject to compliance with a minimum fixed charge maintenance covenant, which will require us to maintain a fixed charge coverage ratio of at least 1.1 to 1.0. Our ability to comply with the required fixed charge coverage ratio can be affected by events beyond our control, and we cannot assure you we will meet this ratio. A breach of any of these covenants could result in a default under our ABL Revolver.
Natural gas, electricity, fuel and raw materials costs, and other external factors beyond our control, as well as downturns in the home repair and remodeling and new home construction sectors of the economy, can cause wide fluctuations in our margins.
The cost of our natural gas, electricity, fuel and raw materials, and other costs, may not correlate with changes in the prices we receive for our products, either in the direction of the price change or in absolute magnitude. Natural gas and raw materials costs represent a substantial part of our manufacturing costs, and energy costs, in particular electricity and fuel, represent a component of the costs to manufacture building products. Most of the raw materials we use are commodities and the price of each can fluctuate widely for a variety of reasons, including changes in availability because of major capacity additions or significant facility operating problems. Other external factors beyond our control can cause volatility in raw materials prices, demand for our products, product prices, sales volumes and margins. These factors include general economic conditions, the level of business activity in the industries that use our products, competitors' actions, international events and circumstances, and governmental regulation in the United States and abroad. These factors can also magnify the impact of economic cycles on our business. While we attempt to pass through price increases in energy costs and raw materials, we have been unsuccessful in doing so in some circumstances in the past and there can be no assurance that we can do so in the future.
Additionally, our business is impacted by changes in the North American home repair and remodeling sectors, as well as the new construction sector, which may be significantly affected by changes in economic and other conditions such as gross domestic product levels, employment levels, demographic trends, consumer confidence, increases in interest rates and availability of consumer financing for home repair and remodeling projects as well as availability of financing for new home purchases. These factors can lower the demand for and pricing of our products, which could cause our net sales and net income to decrease and require us to recognize additional impairments of our assets.
The industries in which we compete are highly competitive, with some of our competitors having greater financial and other resources than we have; competition may adversely affect our results of operations.
The commodity chemical industry is highly competitive. Many of our competitors are larger and have greater financial and other resources and less debt than us. Moreover, barriers to entry, other than capital availability, are low in most product segments of our commodity chemical business. Capacity additions or technological advances by existing or future competitors also create greater competition, particularly in pricing. We cannot provide assurance that we will have access to the financing necessary to upgrade our facilities in response to technological advances or other competitive developments.
In addition, we compete with other national and international manufacturers of vinyl-based building and home improvement products. Some of these companies are larger and have greater financial resources and less debt than us. Accordingly, these competitors may be better able to withstand changes in conditions within the industries in which we operate and may have significantly greater operating and financial flexibility than us. Some of these competitors, who compete with our building product lines, may also be able to compete more aggressively in pricing and could take a
14
greater share of sales and cause us to lose business from our customers. Many of our competitors have operated in the building products industry for a long time. Additionally, our building products face competition from alternative materials: wood, metal, fiber cement and masonry in siding, wood and aluminum in windows and iron and cement in pipe and fittings. An increase in competition from other vinyl exterior building products manufacturers and alternative building materials could cause us to lose customers and lead to decreases in net sales. To the extent we lose customers in the renovation and remodeling markets, we must market to the new home construction market, which historically has experienced more fluctuations in demand.
Extensive environmental, health and safety laws and regulations impact our operations and assets; compliance with these regulations could adversely affect our results of operations.
Our operations on and ownership of real property are subject to extensive environmental, health and safety regulation, including laws and regulations related to air emissions, water discharges, waste disposal and remediation of contaminated sites, at both the national and local levels in the U.S. We are also subject to similar regulations in Canada. The nature of the chemical and building products industries exposes us to risks of liability under these laws and regulations due to the production, storage, use, transportation and sale of materials that can cause contamination or personal injury, including, in the case of commodity chemicals, potential releases into the environment. Environmental laws may have a significant effect on the costs of use, transportation and storage of raw materials and finished products, as well as the costs of the storage and disposal of wastes. We have and must continue to incur operating and capital costs to comply with environmental laws and regulations. In addition, we may incur substantial costs, including fines, damages, criminal or civil sanctions and remediation costs, or experience interruptions in our operations for violations arising under these laws.
Also, some environmental laws, such as the federal Superfund statute, may impose joint and several liability for the cost of investigations and remedial actions on any company that generated the waste, arranged for disposal of the waste, transported the waste to the disposal site, selected the disposal site, or presently or formerly owned, leased or operated the disposal site or a site otherwise contaminated by hazardous substances. Any or all of the responsible parties may be required to bear all of the costs of cleanup, regardless of fault, legality of the original disposal or ownership of the disposal site. A number of environmental liabilities have been associated with the facilities at Lake Charles, Louisiana that we acquired as part of the acquisition of the vinyls business of CONDEA Vista Company ("CONDEA Vista," which is now known as Sasol North America, Inc.) and which may be designated as Superfund sites. Although CONDEA Vista retained financial responsibility for certain environmental liabilities that relate to the facilities that we acquired from it and that arose before the closing of our acquisition in November 1999, there can be no assurance that CONDEA Vista will be able to satisfy its obligations in this regard, particularly in light of the long period of time in which environmental liabilities may arise under the environmental laws. If CONDEA Vista fails to fulfill its obligation regarding these environmental liabilities, then we could be held responsible. Furthermore, we severally are responsible for, and do not have indemnification for, any environmental liabilities relating to other acquisitions, including several liabilities resulting from Royal Group's operations prior to our acquisition of the company.
Our policy is to accrue costs relating to environmental matters when it is probable that these costs will be required and can be reasonably estimated. However, estimated costs for future environmental compliance and remediation may be too low or we may not be able to quantify the potential costs. We expect to be continually subjected to increasingly stringent environmental and health and safety laws and regulations. It is difficult to predict the future interpretation and development of these laws and regulations or their impact on our future earnings and operations. We anticipate continued compliance will require increased capital expenditures and increased operating costs. Any increase in these costs could adversely affect our financial condition and performance.
15
Concerns related to climate change are continuing to grow leading to efforts to limit greenhouse gas ("GHG") emissions. In the fourth quarter of 2009, the EPA issued rules requiring reporting of GHG emissions in the U.S. beginning in 2010. In addition, the United States Congress is considering legislation which may require companies such as Georgia Gulf to restrict or control GHG emissions. Also, the United States has recently engaged in discussions under the United Nations Framework Convention on Climate Change at Copenhagen. Such discussions may result in international treaties requiring additional controls on GHG emissions. Our non-U.S. manufacturing facilities are all in Canada, which has adopted the Kyoto Protocol which seeks the reduction of GHG emissions. The cost impact of complying with such legislation, regulation or international negotiations would depend on the specific requirements enacted and cannot be determined at this time. For example, the impact of certain proposed legislation relating to GHG emissions would depend on factors such as the specific GHG limits imposed and the timing of the implementation of these requirements. The EPA regulatory requirement to report GHG emissions may result in the need to install or modify monitoring equipment at certain of our U.S. manufacturing facilities to monitor GHG emissions.
The potential impact of these and related future international, legislative or regulatory actions on our operations cannot be predicted at this time but could be significant. Such impacts would include the potential for significant compliance costs, including capital expenditures, and could result in operating restrictions. Any increase in the costs related to these initiatives could adversely affect our financial condition and performance.
The heightened interest in climate change issues could have the potential to affect business operations. There is a potential for indirect consequences of climate change regulation on business trends. In addition, some have alleged an association with changes in weather patterns on climate change. The Company may, in the future, be required to expend money to defend claims based on the alleged association of climate change with changes in weather patterns.
Hazards associated with manufacturing may occur, which could adversely affect our results of operations.
Hazards associated with chemical manufacturing as well as building products manufacturing, and the related use, storage and transportation of raw materials, products and wastes may occur in our operations. These hazards could lead to an interruption or suspension of operations and have an adverse effect on the productivity and profitability of a particular manufacturing facility or on our operations as a whole. These hazards include:
- •
- pipeline and storage tank leaks and ruptures;
- •
- explosions and fires;
- •
- inclement weather and natural disasters;
- •
- mechanical failure;
- •
- unscheduled downtime;
- •
- labor difficulties;
- •
- transportation interruptions;
- •
- remediation complications;
- •
- terrorist acts; and
- •
- chemical spills and other discharges or releases of toxic or hazardous substances or gases.
These hazards may cause personal injury and loss of life, severe damage to or destruction of property and equipment, and environmental damage, any of which could lead to claims or liability under environmental laws. Additionally, individuals could seek damages for alleged personal injury or
16
property damage due to exposure to chemicals at our facilities or to chemicals otherwise owned, controlled or manufactured by us. We are also subject to present and future claims with respect to workplace exposure, workers' compensation and other matters. Although we maintain property, business interruption and casualty insurance of the types and in the amounts that we believe are customary for the industry, we are not fully insured against all potential hazards incident to our business.
We face potential product liability claims relating to the production and manufacture of building products.
We are exposed to product liability risk and the risk of negative publicity if our building products do not meet customer expectations. Although we maintain insurance for products liability claims, the amount and scope of such insurance may not be adequate to cover a products liability claim that is successfully asserted against us. In addition, product liability insurance could become more expensive and difficult to maintain and, in the future, may not be available to us on commercially reasonable terms or at all. There can be no assurance that we will be able to obtain or maintain adequate insurance coverage against possible products liability claims at commercially reasonable levels, or at all.
We rely heavily on third party transportation, which subjects us to risks that we cannot control; these risks may adversely affect our operations.
We rely heavily on railroads, barges and other shipping companies to transport raw materials to our manufacturing facilities and to ship finished product to customers. These transport operations are subject to various hazards, including extreme weather conditions, work stoppages and operating hazards, as well as interstate transportation regulations. If we are delayed or unable to ship finished product or unable to obtain raw materials as a result of these transportation companies' failure to operate properly, or if there were significant changes in the cost of these services, we may not be able to arrange efficient alternatives and timely means to obtain raw materials or ship our goods, which could result in an adverse effect on our revenues and costs of operations.
We rely on a limited number of outside suppliers for specified feedstocks and services.
We obtain a significant portion of our raw materials from a few key suppliers. If any of these suppliers are unable to meet their obligations under present supply agreements, we may be forced to pay higher prices to obtain the necessary raw materials. Any interruption of supply or any price increase of raw materials could have an adverse effect on our business and results of operations. In connection with our acquisition of the vinyls business of CONDEA Vista in 1999, we entered into agreements with CONDEA Vista to provide specified feedstocks for the Lake Charles facility. This facility is dependent upon CONDEA Vista's infrastructure for services such as wastewater and ground water treatment, site remediation, and fire water supply. Any failure of CONDEA Vista to perform its obligations under those agreements could adversely affect the operation of the affected facilities and our results of operations. The agreements relating to these feedstocks and services had initial terms of one to ten years. Most of these agreements have been automatically renewed, but may be terminated by CONDEA Vista after specified notice periods. If we were required to obtain an alternate source for these feedstocks or services, we may not be able to obtain pricing on as favorable terms. Additionally, we may be forced to pay additional transportation costs or to invest in capital projects for pipelines or alternate facilities to accommodate railcar or other delivery or to replace other services.
While we believe that our relationships with our key suppliers are strong, any vendor may choose, subject to existing contracts, to modify our relationship due to general economic concerns or concerns relating to the vendor or us, at any time. Any significant change in the terms that we have with our key suppliers could adversely affect our financial condition and liquidity, as could significant additional requirements from our suppliers that we provide them additional security in the form of prepayments or with letters of credit.
17
Operation on multiple ERP information systems may negatively impact our operations.
We are highly dependent on our information systems infrastructure in order to process orders, track inventory, ship products in a timely manner, prepare invoices to our customers, maintain regulatory compliance and otherwise carry on our business in the ordinary course. We currently operate on multiple Enterprise Resource Planning, or ERP, information systems, which complicate our processing, reporting and analysis of business transactions and other information. Since we must process and reconcile our information from multiple systems, the chance of errors is increased and we may incur additional costs. Inconsistencies in the information from multiple ERP systems could adversely impact our ability to manage our business efficiently and may result in heightened risk to our ability to maintain our books and records and comply with regulatory requirements.
Further, from time to time we may transition a portion of our operations from one of our ERP systems to another. The transition to a different ERP system involves numerous risks, including:
- •
- diversion of management's attention away from normal daily business operations;
- •
- increased demand on our operations support personnel;
- •
- initial dependence on unfamiliar systems while training personnel to use new systems; and
- •
- increased operating expenses resulting from training, conversion and transition support activities.
We may pursue dispositions, asset acquisitions, and joint ventures, and other transactions that may impact our results of operations, including difficulties in integrating any acquired business operations, which may result in our failure to realize expected cost savings and operational efficiencies.
We may enter into agreements to dispose of certain assets. However, we cannot assure you that we will be able to dispose of these assets at any anticipated prices, or at all, or that any such sale will occur during any anticipated time frame. In addition, we may engage in additional business combinations, purchases or sales of assets, or contractual arrangements or joint ventures. To the extent permitted under our debt agreements, some of these transactions may be financed with additional borrowings by us. The integration of any business we acquire may be disruptive to our business and may result in a significant diversion of management attention and operational resources. Additionally, we may suffer a loss of key employees, customers or suppliers, loss of revenues, increases in costs or other difficulties. If the expected efficiencies and synergies of any transactions are not fully realized, our results of operations could be adversely affected, because of the costs associated with such transactions. Other transactions may advance future cash flows from some of our businesses, thereby yielding increased short-term liquidity, but consequently resulting in lower cash flows from these operations over the longer term.
Our participation in joint ventures exposes us to risks of shared control.
We own a 50 percent interest in a manufacturing joint venture, the remainder of which is controlled by PPG Industries, Inc., which also supplies chlorine to the facility operated by the joint venture. We also have other joint ventures, such as our building products strategic joint venture arrangements with several customers. We may enter into additional joint ventures in the future. The nature of a joint venture requires us to share control with unaffiliated third parties. If our joint venture partners do not fulfill their obligations, the affected joint venture may not be able to operate according to its business plan. In that case, our operations may be adversely affected or we may be required to increase our level of commitment to the joint venture. Also, differences in views among joint venture participants may result in delayed decisions or failure to agree on major issues. Any differences in our views or problems with respect to the operations of our joint ventures could have a material adverse effect on our business, financial condition, results of operations or cash flows.
18
Fluctuations in foreign currency exchange and interest rates could affect our consolidated financial results.
We earn revenues, pay expenses, own assets and incur liabilities in countries using currencies other than the U.S. dollar, principally the Canadian dollar. Because our consolidated financial statements are presented in U.S. dollars, we must translate revenues and expenses into U.S. dollars at the average exchange rate during each reporting period, as well as assets and liabilities into U.S. dollars at exchange rates in effect at the end of each reporting period. Therefore, increases or decreases in the value of the U.S. dollar against other major currencies will affect our net revenues, operating income and the value of balance sheet items denominated in foreign currencies. Because of the geographic diversity of our operations, weaknesses in various currencies might occur in one or many of such currencies over time. From time to time, we may use derivative financial instruments to further reduce our net exposure to currency exchange rate fluctuations. However, we cannot assure you that fluctuations in foreign currency exchange rates, particularly the strengthening of the U.S. dollar against major currencies, would not materially affect our financial results.
In addition, we are exposed to volatility in interest rates. When appropriate, we may use derivative financial instruments to reduce our exposure to interest rate risks. We cannot assure you, however, that our financial risk management program will be successful in reducing the risks inherent in exposures to interest rate fluctuations.
We recently identified a material weakness in the area of accounting for income taxes. If the steps we have taken and expect to take to remediate this material weakness are not successful, the material weakness could result in a number of negative consequences.
As described in more detail in Item 9A., Controls and Procedures, in this Form 10-K and in certain of our other filings with the Securities and Exchange Commission, we recently identified material weakness in our internal control over financial reporting, in the area of accounting for income taxes. Although our management has taken certain measures, and intends to take additional measures, to remediate this material weakness, if these measures are not successful, such material weakness could result in a number of negative consequences, including continued significant management time and attention, additional costs, future misstatements in our financial statements, our inability to timely meet financial statement reporting and filing obligations, a loss of confidence by investors in our reported financial information and a negative effect on the trading price of our common stock.
Forward-Looking Statements
This Form 10-K and other communications to stockholders may contain "forward-looking statements" within the meaning of the Private Securities Litigation Reform Act of 1995. These statements relate to, among other things, our outlook for future periods, our expectations regarding supply and demand, pricing trends and market forces within the chemical industry, cost reduction strategies and their results, planned capital expenditures, long-term objectives of management and other statements of expectations concerning matters that are not historical facts.
Predictions of future results contain a measure of uncertainty. Actual results could differ materially due to various factors. Factors that could cause actual results to differ materially from those in, or implied by, forward-looking statements are, among others, those contained in the "Risk Factors" section above as well as continued compliance with covenants in our ABL Revolver and our indenture for our 9.0 percent notes, changes in the general economy, changes in demand for our products or increases in overall industry capacity that could affect production volumes and/or pricing, changes and/or cyclicality in the industries to which our products are sold, availability and pricing of raw materials, technological changes affecting production, difficulty in plant operations and product transportation, governmental and environmental regulations and other unforeseen circumstances. A number of these factors are discussed in this Form 10-K and in our other periodic filings with the SEC.
19
We undertake no obligation to update any forward-looking statements, whether as a result of a change in circumstances or otherwise.
Item 1B. UNRESOLVED STAFF COMMENTS.
None.
Executive Officers of the Company
The following is additional information regarding our executive officers as of March 10, 2011:
Joel I. Beerman, 60, has served as Vice President, General Counsel and Secretary since February 1994.
Joseph C. Breunig, 49 has served as Executive Vice President, Chemicals, since August 2010. Before then he was employed by BASF Corporation where since 2005, he held the position of Executive Vice President and President of Market and Business Development for North America.
Paul D. Carrico, 60, has been a director and has served as our President and Chief Executive Officer since February, 2008. Before then, he had served as Vice President, Chemicals and Vinyls since October 2006, Vice President, Polymer Group from May 2005 until October 2006, and Business Manager, Resin Division from 1999, when he joined the Company, until May 2005.
Mark J. Orcutt, 55, has served as Executive Vice President, Building Products since December 2008. Before then, he was employed by PPG Industries, Inc., most recently as Vice President Performance Glazing since 2003.
Gregory C. Thompson, 55, has served as Chief Financial Officer since February 2008. Before then, he served as Senior Vice President and Chief Financial Officer of Invacare Corporation, a medical equipment manufacturer, since 2002.
James L. Worrell, 57, has served as Vice President, Human Resources, since September 2006. Before then, Mr. Worrell served as the Director of Human Resources since 1993, prior to which he was a Manager of Human Resources since our inception.
Executive officers are elected by, and serve at the pleasure of, the board of directors.
We believe current capacity will adequately meet anticipated demand requirements.
20
Chemical Production
Our chemical manufacturing sites are located in the U.S. and Canada. During 2010, our chlorovinyls and aromatics production facilities operated at approximately 79 percent of capacity. The following table sets forth the location of each chemical manufacturing facility we own, products manufactured at each facility and the approximate production capacity of each product, assuming normal plant operations, as of December 31, 2010.
| |
Location | Products | |
Annual Capacity | ||||
|---|---|---|---|---|---|---|---|---|
Chlorovinyls |
Electrovinyls: | |||||||
|
Plaquemine, LA | Chlorine | 450,000 tons | |||||
|
Plaquemine, LA | Caustic Soda | 500,000 tons | |||||
|
Plaquemine, LA | VCM | ) | 3.1 billion pounds | ||||
|
Lake Charles, LA (two plants) (1) | VCM | ) | |||||
|
Plaquemine, LA | Vinyl Resins | ) | 2.7 billion pounds | ||||
|
Aberdeen, MS | Vinyl Resins | ) | |||||
|
Compounds: | |||||||
|
Aberdeen, MS | Vinyl Compounds | ) | |||||
|
Gallman, MS | Vinyl Compounds | ) | |||||
|
Madison, MS | Vinyl Compounds | ) | 1.3 billion pounds | ||||
|
Prairie, MS | Vinyl Compounds | ) | |||||
|
Vaughan, ON | Vinyl Compounds | ) | |||||
|
Bradford, ON | Vinyl Compounds | ) | |||||
|
Bradford, ON | Compound Additives | 162 million pounds | |||||
|
Aberdeen, MS | Plasticizers | 22 million pounds | |||||
Aromatics |
||||||||
|
Pasadena, TX | Cumene | 2.0 billion pounds | |||||
|
Plaquemine, LA | Phenol | 500 million pounds | |||||
|
Plaquemine, LA | Acetone | 308 million pounds |
- (1)
- Reflects 100 percent of the production at our owned facility in Lake Charles and our 50 percent share of PHH Monomers' 1.15 billion pounds of total VCM capacity.
Our chemical manufacturing facilities are located near major water and/or rail transportation terminals, facilitating efficient delivery of raw materials and prompt shipment of finished products. In addition, our chemical operations have a fleet of about 3,436 railcars that are leased pursuant to operating leases with varying terms through the year 2018. The total lease expense for these railcars and other transportation equipment was approximately $15.3 million for 2010, $16.3 million for 2009, and $16.4 million for 2008.
21
Home Improvement and Buildings Products
The following table sets forth the location of each home improvement and building products manufacturing facility we own or lease and the principal products manufactured at each facility as of December 31, 2010.
Principal Products
|
Location | |
|---|---|---|
| Window and Door Profiles and Mouldings: | ||
| Custom Extrusion | Vaughan, ON (2 plants) (1) | |
| Laval, QC | ||
| Lachenaie, QC | ||
| St. Laurent, QC | ||
| St. Hubert, QC | ||
| Delmont, PA | ||
| Everett, WA | ||
| Mouldings Products | Marion, VA (2 plants) | |
| Bristol, TN | ||
| Outdoor building products: | ||
| Vinyl Siding | Vaughan, ON | |
| Newbern, TN | ||
| Aluminum Siding Accessories | Concord, ON (1) | |
| Ste. Lambert-de-Lauzon, PC (1) | ||
| Pipe and Pipe Fittings | Shelby Township, MI | |
| Surrey, BC (1) | ||
| Vaughan, ON (4 plants) (2) | ||
| Abbotsford, BC | ||
| Deck, Fence and Rail | Newbern, TN | |
| Milford, IN |
- (1)
- Leased.
- (2)
- One of the four Vaughan facilities is leased.
Certain of the above facilities are also used as distribution centers. In addition, we operate a number of distribution locations, most of which are leased, to serve our home improvement building products customers, primarily in Canada, which represented a total of about 325,000 square feet at December 31, 2010.
Other
We lease office space for our principal executive offices in Atlanta, Georgia, and for information services in Baton Rouge, Louisiana. Additionally, space is leased for sales and marketing offices in Houston, Texas and for numerous storage terminals throughout the United States.
Substantially all of our owned facilities are pledged as security for our senior secured 9.0 percent notes due 2017 and our ABL Revolver maturing in 2016.
In August 2004 and January and February 2005, the USEPA conducted environmental investigations of our manufacturing facilities in Aberdeen, Mississippi and Plaquemine, Louisiana, respectively. The USEPA informed us that it identified several "areas of concern," and indicated that such areas of concern may, in its view, constitute violations of applicable requirements, thus warranting monetary penalties and possible injunctive relief. In lieu of pursuing such relief through its traditional
22
enforcement process, the USEPA proposed that the parties enter into negotiations in an effort to reach a global settlement of the areas of concern and that such a global settlement cover our manufacturing facilities at Lake Charles, Louisiana and Oklahoma City, Oklahoma as well. In 2006, we were informed by the USEPA that its regional office responsible for Oklahoma and Louisiana desired to pursue resolution of these matters on a separate track from the regional office responsible for Mississippi. During 2007, we reached agreement with the USEPA regional office responsible for Mississippi on the terms and conditions of a consent decree that would settle USEPA's pending enforcement action against our Aberdeen, Mississippi facility. The parties have executed a consent decree, which was approved by the federal district court in Atlanta, Georgia. Under the consent decree, we were required to, among other things, pay a $610,000 fine, which was paid in March 2008, and undertake certain other environmental improvement projects. While the cost of such additional projects will likely exceed $1.0 million, we do not believe that the cost of these projects will have a material effect on our financial position, results of operations, or cash flows.
We have not yet reached a settlement with the USEPA regional office responsible for Oklahoma and Louisiana. However, on November 17, 2009, we received a unilateral administrative order ("UAO") from this USEPA regional office relating to our Lake Charles, Louisiana and Oklahoma City, Oklahoma facilities. The UAO, issued pursuant to Section 3013(a) of the Resource Conservation and Recovery Act ("RCRA"), requires us to take and we are undertaking certain monitoring and assessment activities in and around several of our wastewater and storm water conveyance systems at those locations.
We have also received several compliance orders and notices of potential penalties from the Louisiana Department of Environmental Quality (LDEQ). On December 17, 2009, we received a Notice of Potential Penalty (NOPP) from LDEQ containing allegations of violations of Louisiana's hazardous waste management regulations. On October 7, 2010, we received a Consolidated Compliance Order (CCO) from LDEQ addressing the same allegations as were contained in the December 17, 2009 NOPP. On October 1, 2010, we received Consolidated Compliance Orders and Notices of Potential Penalties (CCONPPs) for both the Plaquemine, Louisiana and Lake Charles, Louisiana facilities. These CCONPPs allege violations of reporting, recordkeeping, and other requirements contained in Louisiana's air pollution control regulations.
We believe some of the allegations contained in these compliance orders and notices of potential penalties may potentially be similar to the "areas of concern" raised by USEPA that are discussed above. These compliance orders and notices of potential penalties do not identify specific penalty amounts. It is likely that any settlement, if achieved, will result in the imposition of monetary penalties, capital expenditures for installation of environmental controls and/or other relief. We are not able to forecast the total cost of any monetary penalties, environmental projects, or other relief that would be imposed in any settlement or order. While we expect that such costs will exceed $100,000, we do not expect that such costs will have a material effect on our financial position, results of operations, or cash flows.
In addition, we are currently, and may in the future become, subject to other claims and legal actions that arise in the ordinary course of business. We believe that the ultimate liability, if any, with respect to these other claims and legal actions will not have a material effect on our financial position or on our results of operations.
23
Item 5. MARKET FOR REGISTRANT'S COMMON EQUITY, RELATED STOCKHOLDER MATTERS AND ISSUER PURCHASES OF EQUITY SECURITIES.
Georgia Gulf Corporation's common stock is listed on the New York Stock Exchange under the symbol "GGC." At March 4, 2011, there were 316 stockholders of record. The following table sets forth the New York Stock Exchange high and low stock prices for Georgia Gulf's common stock for the periods indicated. The prices have been adjusted for the 1-for-25 reverse stock split in July 2009.
| |
High | Low | |||||
|---|---|---|---|---|---|---|---|
2010 |
|||||||
First quarter |
$ | 19.08 | $ | 13.91 | |||
Second quarter |
21.79 | 13.26 | |||||
Third quarter |
17.00 | 11.11 | |||||
Fourth quarter |
24.75 | 15.61 | |||||
2009 |
|||||||
First quarter |
$ | 50.00 | $ | 5.50 | |||
Second quarter |
41.50 | 10.50 | |||||
Third quarter |
47.19 | 5.77 | |||||
Fourth quarter |
30.85 | 13.00 | |||||
Since the fourth quarter of 2008, we have suspended any cash dividends on our common stock. Dividends may be paid when and if our board of directors deems appropriate, subject to covenants in our ABL Revolver, the indenture for our 2017 notes and any other agreement which limits our ability to pay cash dividends. Under the ABL Revolver, cash dividend payments may be made if both our ability to borrow under the ABL Revolver then exceeds $100 million and our fixed charge coverage ratio (as defined therein) for the prior month exceeds 1.1 to 1.0, each on a pro forma basis after giving effect to the proposed cash dividend payment (see Note 10 of the Notes to the Consolidated Financial Statements included in Item 8).
24
This graph below presents a comparison of the five-year cumulative total return of an investment in each of Georgia Gulf Corporation ("GGC") common stock, Standard & Poor's SmallCap 600 Index (the "600 Index") and Standard & Poor's Chemical SmallCap Index (the "Chemical Index"). We believe these indices provide the closest comparison to our line of business. Stock performances, including our stock performance, were calculated using the assumption that all dividends, including distributions of cash, were reinvested in common stock. Furthermore, the indicated performance of GGC stock from and after July 29, 2009 includes the impact of our 1-for-25 reverse stock split effected on such date.
Total Shareholder Returns (Indexed)
GGC vs S&P Smallcap 600 Index and S&P 600 Chemicals Index
As described in more detail elsewhere herein, as a result of the significant deterioration of general economic and business conditions and our then-existing capital structure, in 2009 we undertook a number of significant corporate recapitalization activities. These corporate recapitalization activities included our debt exchange resulting in the issuance of common and convertible preferred stock and the 1-for-25 reverse stock split effected on July 29, 2009. As a result of the significant impact of these transactions on our capital structure, we believe that the foregoing graph may not provide a complete presentation of our recent financial results and stock price performance.
The graph below presents a comparison of the cumulative total return of an investment in each of GGC common stock, the 600 Index and the Chemical Index on July 29, 2009, the date we completed our 1-for-25 reverse stock split, until December 31, 2010. We believe this graph, as well as the foregoing graph and the remainder of the information presented in this annual report on Form 10-K, should be considered by investors when evaluating our recent results of operations and stock price performance. Stock performances, including our stock performance, were calculated using the assumption that all dividends, including distributions of cash, were reinvested in common stock.
25
Total Shareholder Returns (Indexed) from July 29, 2009
GGC vs S&P Smallcap 600 Index and S&P 600 Chemicals Index
Pursuant to SEC rules, this "Performance Graph" section of this Annual Report on Form 10-K is not deemed "filed" with the SEC and shall not be deemed incorporated by reference in any filing under the Securities Act of 1933 or the Securities Exchange Act of 1934.
26
Item 6. SELECTED FINANCIAL DATA.
The following table provides selected financial data for the Company, and should be read in conjunction with management's discussion and analysis of financial condition and results of operations and our audited consolidated financial statements and related notes included elsewhere in the Annual Report on Form 10-K.
| |
Year Ended December 31, | ||||||||||||||||
|---|---|---|---|---|---|---|---|---|---|---|---|---|---|---|---|---|---|
(In thousands, except per share data, percentages and employees) |
2010* | 2009* | 2008* | 2007* | 2006* | ||||||||||||
Results of Operations: |
|||||||||||||||||
Net sales |
$ | 2,818,040 | $ | 1,990,091 | $ | 2,916,477 | $ | 3,157,270 | $ | 2,427,843 | |||||||
Cost of sales |
2,543,638 | 1,778,998 | 2,717,409 | 2,851,426 | 2,152,571 | ||||||||||||
Selling, general and administrative expenses |
160,031 | 182,937 | 168,572 | 225,607 | 119,151 | ||||||||||||
Long-lived asset impairment charges |
— | 21,804 | 175,201 | 158,293 | — | ||||||||||||
Restructuring costs |
102 | 6,858 | 21,973 | 3,659 | — | ||||||||||||
Losses (gains) on sale of assets |
— | 62 | (27,282 | ) | 1,304 | — | |||||||||||
Operating income (loss) |
114,269 | (568 | ) | (139,396 | ) | (83,019 | ) | 156,121 | |||||||||
Interest expense |
(69,795 | ) | (131,102 | ) | (134,513 | ) | (134,568 | ) | (51,648 | ) | |||||||
Loss on debt modification and extinguishment, net |
— | (42,797 | ) | — | — | — | |||||||||||
Gain on debt exchange |
— | 400,835 | — | — | — | ||||||||||||
Foreign exchange (loss) gain |
(839 | ) | (1,400 | ) | (4,264 | ) | 6,286 | (21,543 | ) | ||||||||
Interest income |
322 | 583 | 1,308 | 805 | 369 | ||||||||||||
Income (loss) from continuing operations before taxes |
43,957 | 225,551 | (276,865 | ) | (210,496 | ) | 83,299 | ||||||||||
Provision (benefit) for income taxes (1) |
1,279 | 94,492 | (21,695 | ) | 34,188 | 31,497 | |||||||||||
Income (loss) from continuing operations |
42,678 | 131,059 | (255,170 | ) | (244,684 | ) | 51,802 | ||||||||||
Loss from discontinued operations, net of tax |
— | — | — | (10,864 | ) | (3,263 | ) | ||||||||||
Net income (loss) |
$ | 42,678 | $ | 131,059 | $ | (255,170 | ) | $ | (255,548 | ) | $ | 48,539 | |||||
Basic earnings (loss) per share: |
|||||||||||||||||
Income (loss) from continuing operations |
$ | 1.22 | $ | 8.27 | $ | (191.21 | ) | $ | (186.17 | ) | $ | 29.73 | |||||
Loss from discontinued operations |
— | — | — | (7.91 | ) | (2.39 | ) | ||||||||||
Net income (loss) |
$ | 1.22 | $ | 8.27 | $ | (191.21 | ) | $ | (194.08 | ) | $ | 27.34 | |||||
Diluted earnings (loss) per share: |
|||||||||||||||||
Income (loss) from continuing operations |
$ | 1.22 | $ | 8.26 | $ | (191.21 | ) | $ | (186.17 | ) | $ | 29.67 | |||||
Loss from discontinued operations |
— | — | — | (7.91 | ) | (2.37 | ) | ||||||||||
Net income (loss) |
1.22 | 8.26 | (191.21 | ) | (194.08 | ) | 27.30 | ||||||||||
Dividends per common share |
$ | — | $ | — | $ | 6.00 | $ | 8.00 | $ | 8.00 | |||||||
Financial Highlights: |
|||||||||||||||||
Net working capital |
$ | 400,447 | $ | 340,721 | $ | 225,187 | $ | 200,745 | $ | 202,955 | |||||||
Property, plant and equipment, net |
653,137 | 687,570 | 760,760 | 967,188 | 1,023,004 | ||||||||||||
Total assets |
1,665,701 | 1,604,640 | 1,610,401 | 2,201,664 | 2,458,227 | ||||||||||||
Total debt |
689,942 | 739,005 | 1,394,150 | 1,382,008 | 1,498,134 | ||||||||||||
Asset securitization (2) |
— | — | 111,000 | 147,000 | 128,000 | ||||||||||||
Net cash provided by operating activities |
183,799 | 723 | 41,392 | 128,557 | 250,577 | ||||||||||||
Net cash (used in) provided by investing activities |
(44,645 | ) | (26,025 | ) | 24,569 | 21,589 | (1,080,917 | ) | |||||||||
Net cash (used in) provided by financing activities |
(55,719 | ) | (29,099 | ) | 15,402 | (150,906 | ) | 825,022 | |||||||||
Depreciation and amortization |
99,691 | 117,690 | 143,718 | 150,210 | 85,019 | ||||||||||||
Capital expenditures |
45,714 | 30,085 | 62,545 | 83,670 | 90,770 | ||||||||||||
Maintenance expenditures |
137,448 | 104,472 | 109,130 | 111,187 | 80,464 | ||||||||||||
27
| |
Year Ended December 31, | |||||||||||||||
|---|---|---|---|---|---|---|---|---|---|---|---|---|---|---|---|---|
(In thousands, except per share data, percentages and employees) |
2010* | 2009* | 2008* | 2007* | 2006* | |||||||||||
Other Selected Data: |
||||||||||||||||
Adjusted EBITDA (3) |
$ | 208,454 | $ | 161,515 | $ | 163,052 | $ | 230,532 | $ | 219,597 | ||||||
Weighted average shares outstanding—basic |
33,825 | 14,903 | 1,378 | 1,374 | 1,364 | |||||||||||
Weighted average shares outstanding—diluted |
33,825 | 14,908 | 1,378 | 1,374 | 1,375 | |||||||||||
Common shares outstanding |
33,962 | 33,718 | 1,379 | 1,376 | 1,376 | |||||||||||
Return on sales |
1.5 | % | 5.8 | % | (8.7 | )% | (8.1 | )% | 2.0 | |||||||
Employees |
3,932 | 3,489 | 4,463 | 5,249 | 6,654 | |||||||||||
- *
- Includes
Royal Group financial data as of December 31, 2010, 2009, 2008, 2007 and 2006 and from October 3, 2006, the date of the acquisition.
The years ended December 31, 2007 and 2006 include additional cost of sales of $2.0 million and $18.0 million, respectively, as a result of valuing Royal Group's inventory at fair
value as of the date of acquisition in accordance with accounting standards related to business combinations.
- (1)
- Provision
for income taxes for 2007 includes the effect of a $43.4 million valuation allowance on deferred tax assets in Canada.
- (2)
- As
of December 31, 2008, $111.0 million of accounts receivable had been sold through the asset securitization facility. Prior to
December 31, 2009, the asset securitization facility was replaced with the ABL Revolver.
- (3)
- Georgia Gulf supplements its financial statements prepared in accordance with Generally Accepted Accounting Principles (GAAP) with Adjusted EBITDA (Earnings Before Interest, Taxes, Depreciation, and Amortization, cash and non-cash restructuring charges and certain other charges, if any, related to financial restructuring and business improvement initiatives, gain (loss) on substantial modification of debt and sales of assets, and goodwill, intangibles, and other long-lived asset impairments) because investors commonly use Adjusted EBITDA as a main component of valuation analysis of cyclical companies such as Georgia Gulf. Adjusted EBITDA is not a measurement of financial performance under GAAP and should not be considered as an alternative to net income as a measure of performance or to cash provided by operating activities as a measure of liquidity. In addition, our calculation of Adjusted EBITDA may be different from the calculation used by other companies and, therefore, comparability may be limited. A reconciliation of net income (loss) determined in accordance with GAAP to Adjusted EBITDA is provided below.
| |
Year Ended December 31, | |||||||||||||||
|---|---|---|---|---|---|---|---|---|---|---|---|---|---|---|---|---|
| |
2010 | 2009 | 2008 | 2007 | 2006 | |||||||||||
Net income (loss) |
$ | 42,678 | $ | 131,059 | $ | (255,170 | ) | $ | (255,548 | ) | $ | 48,539 | ||||
Loss from discontinued operations, net of tax |
— | — | — | 10,864 | 3,263 | |||||||||||
Provision (benefit) for income taxes |
1,279 | 94,492 | (21,695 | ) | 34,188 | 31,497 | ||||||||||
Interest income |
(322 | ) | (583 | ) | (1,308 | ) | (805 | ) | (369 | ) | ||||||
Gain on debt exchange |
— | (400,835 | ) | — | — | — | ||||||||||
Loss on debt modification and extinguishment, net |
— | 42,797 | — | — | — | |||||||||||
Interest expense |
69,795 | 131,102 | 134,513 | 134,568 | 51,648 | |||||||||||
Depreciation and amortization expense |
99,691 | 117,690 | 143,718 | 150,210 | 85,019 | |||||||||||
Long lived asset impairment charges |
— | 21,804 | 175,201 | 158,293 | — | |||||||||||
Restructuring costs |
102 | 6,858 | 21,973 | 3,659 | — | |||||||||||
Losses (gains) on sale of assets |
— | 62 | (27,282 | ) | 1,304 | — | ||||||||||
Other (a) |
(4,769 | ) | 17,069 | (6,898 | ) | (6,201 | ) | — | ||||||||
Adjusted EBITDA |
$ | 208,454 | $ | 161,515 | $ | 163,052 | $ | 230,532 | $ | 219,597 | ||||||
- (a)
- Other primarily consists of loan cost amortization. Other for the year ended December 31, 2009 includes $13.9 million of equity compensation related to the 2009 equity and performance plan, $13.1 million of operational and financial restructuring consulting fees and partly offset by $9.6 million of loan cost amortization.
28
Item 7. MANAGEMENT'S DISCUSSION AND ANALYSIS OF FINANCIAL CONDITION AND RESULTS OF OPERATIONS.
We are a leading North American manufacturer and an international marketer of chlorovinyl and aromatics chemicals and also manufacture and market vinyl-based building and home improvement products. Our chlorovinyl and aromatic chemicals products are sold for further processing into a wide variety of end-use applications, including plastic pipe and pipe fittings, siding and window frames, bonding agents for wood products, high-quality plastics, acrylic sheeting and coatings for wire and cable. Our building products segment manufactures window and door profiles, mouldings, siding, pipe and pipe fittings and deck, fence, and rail products and markets vinyl-based building and home improvement products under the Royal Group brand names.
Chlorovinyls and Aromatics Chemical Business Overview
Chlorovinyls products are electrovinyls products consisting of chlorine, caustic soda, VCM, and vinyl resins, and our compounds products consisting of compound additives and vinyl compounds. For the year ended December 31, 2010, we consumed all of our chlorine production in making VCM, we consumed 6 percent of our caustic soda production, we consumed 95 percent of our VCM production in manufacturing vinyl resins, we consumed 31 percent of our vinyl resins and 76 percent of our compounds additives in the manufacturing of vinyl compounds and we consumed about 22 percent of our vinyl compounds in the manufacturing of fabricated products. The remainder of our caustic soda, VCM, vinyl resins, vinyl compounds and compounds additives were sold to third parties. Our primary aromatics products are cumene, phenol and acetone. For the year ended December 31, 2010, approximately 66 percent of our cumene was sold to third parties with the remainder used internally to manufacture phenol and acetone. All of our phenol and acetone was sold to third parties. Our products are used primarily by customers as raw materials to manufacture a diverse range of products, which serve numerous consumer markets for durable and non-durable goods and construction.
Our chemical business and the chemical industry in general are cyclical in nature and are affected by domestic and worldwide economic conditions. Cyclical price swings, driven by changes in supply and demand, can lead to significant changes in our overall profitability. The demand for our chemicals tends to reflect fluctuations in downstream markets that are affected by consumer spending for durable and non-durable goods as well as construction.
Global capacity also materially affects the prices of chemical products. Historically, in periods of high operating rates, prices rise and margins increase and, as a result, new capacity is announced. Since world-scale size plants are generally the most cost-competitive, new increases in capacity tend to be on a large scale and are often undertaken by existing industry participants. Usually, as new capacity is added, prices decline until increases in demand improve operating rates and the new capacity is absorbed or, in some instances, until less efficient producers withdraw capacity from the market. As the additional supply is absorbed, operating rates rise, prices increase and the cycle repeats.
Purchased raw materials and natural gas costs account for the majority of our cost of sales and can also have a material effect on our profitability and margins. Some of our primary raw materials, including ethylene, benzene and propylene, are crude oil and natural gas derivatives and therefore follow the oil and gas industry price trends. Chemical Market Associates, Incorporated ("CMAI") reported annual U.S. industry prices for crude oil and natural gas increased 29 percent and 12 percent, respectively, from 2009 to 2010. CMAI reported in December 2010, "In 2009 and 2010, natural gas prices have remained low despite increases in crude oil prices, because of the large amount of supplies available from shale gas. The relatively new technology is still achieving improvements in efficiency and cost, allowing more natural gas to be produced at lower prices. What is also extremely important to the petrochemical industry is the persistently low crude oil to natural gas ratio, which has changed the economics of many petrochemical processes and improved the competitiveness of the U.S.
29
petrochemical industry. One example is the U.S. ethylene market, which has benefited tremendously from the low price of natural gas, since lower natural gas prices have led to both lower raw material costs and higher margins in the industry." From 2008 to 2009, CMAI reported U.S. industry prices for crude oil and natural gas decreased 38 percent and 56 percent, respectively. CMAI reported in December 2009, "The overriding factor affecting the crude oil market in 2009 was the global economic crisis. As demand plunged in late 2008, prices came down as well."
Significant volatility in raw material costs tends to put pressure on product margins as sales price increases can lag behind raw material cost increases. Product margins may also suffer from a sharp decline in raw material costs due to the time lag between the purchase of raw materials and the sale of the finished goods manufactured using those raw materials. As an example, during the fourth quarter of 2008, the aromatics industry experienced a sharp decline in feedstock and product prices. CDI reported U.S. industry prices for benzene and propylene decreased 76 percent and 78 percent, respectively, from September 2008 to December 2008, as a result of which most producers were unable to fully recover previously purchased raw materials costs.
In 2010, our chlorovinyls segment experienced increased domestic demand compared to 2009, primarily as a result of increased domestic contract sales. In addition, our export volumes improved throughout the year to historically high levels, consistent with the North America industry, as a result of the improved domestic natural gas price ratio to crude oil price which has improved the competitiveness of the U.S. petrochemical industry in the global markets. When comparing 2009 to 2010, North American vinyl resin industry sales volume increased 10 percent as a result of an increase in exports of 85 percent offset by a decrease in domestic sales volume of 10 percent, according to American Chemistry Council Plastics Industry Producers Statistics Group ("PIPS") in December 2010. This increase in sales volume caused vinyl resin industry operating rates to increase from 78 percent in 2009 to 84 percent in 2010 according to Chemical Data Inc. ("CDI"). CMAI reported an industry price increase for the feedstocks ethylene of 49 percent, chlorine of 12 percent and natural gas of 12 percent from 2009 to 2010. Vinyl resin industry prices increased 29 percent from 2009 to 2010 due to increased feedstock costs. Caustic soda industry prices decreased 7 percent from 2009 to 2010 due to a decrease in demand caused by an increase in global supply from chlor-alkali capacity additions in Asia during 2009 and the significant global economic downturn during 2009 effectively removing large segments of the demand for caustic through shutdowns and rate reductions by end users. Caustic soda industry sale prices trended upwards 114 percent during 2010 after trending down 77 percent during 2009.
Our aromatics segment demand increased in 2010 compared to 2009 from increased domestic and export sales volume due to industry plant outages and strong demand in Asia. According to CDI, North American operating rates for cumene, phenol and acetone increased from about 61 percent in 2009 to about 81 percent in 2010. CMAI reported industry prices increased during 2010 for the feedstocks benzene by 43 percent and propylene by 42 percent. As a result of the increase in feedstocks costs, industry sales prices also increased during 2010 by 33 percent for phenol and acetone and 40 percent for cumene, according to CMAI. Consequently, most producers were able to more than recover previously purchased raw materials costs in an increasing sales price environment due to the time lag between the purchase of raw materials and the sale of the related finished goods.
Vinyl-Based Building and Home Improvement Products Business Overview
Our vinyl-based building and home improvement products are used primarily in new residential and industrial construction, municipality infrastructure and residential remodeling. Our sales revenue by geographic area for our building and home improvement products for 2010 was about 39 percent in the U.S. and the remainder in Canada. All of our building and home improvement products are ultimately sold to external customers.
30
Annual demand for our building and home improvement products remained stable during 2010 as compared to 2009. We sell approximately 60 percent of our building and home improvement products into Canada, where housing and construction markets improved. Our building and home improvement products experienced increased sales growth in the first half of 2010, fueled by tax law changes and incentives in the U.S. and Canada. However, once the incentives expired in the second half of 2010, the housing market declined from the first half. Housing starts in Canada were up 27 percent from 2009 to 2010 with an average annualized rate in 2010 of about 0.2 million units. In addition, U.S. housing starts increased by about 6 percent from 2009 to 2010 according to a report furnished jointly by the U.S. Census Bureau and the U.S. Department of Housing and Urban Development in January 2011. The continued weakness in the U.S. residential housing and construction market was the primary cause of the North America vinyl-based industry sales decrease for siding of 23 percent, mouldings of 16 percent and rigid pipe of 19 percent, according to PIPS.
Acquisition
On February 9, 2011, we acquired Exterior Portfolio by Crane from the Crane Group. Exterior Portfolio, headquartered in Columbus, Ohio, is a leading U.S. manufacturer and marketer of siding products with 2010 revenues of approximately $100.0 million. Exterior Portfolio markets siding and related accessories under the CraneBoard®, Portsmouth Shake®, Solid Core Siding® and Architectural Essentials™ brand names. The aggregate cash consideration paid, was approximately $72.0 million. The acquisition was funded with cash on hand. The Exterior Portfolio acquisition financial results are not reflected in our results presented herein. In future periods Exterior Portfolio financial results will be reported in the building products segment.
Results of Operations
The following table sets forth our consolidated statement of operations data for each of the three years ended December 31, 2010, 2009 and 2008, and the percentage of net sales of each line item for the years presented.
| |
Year Ended December 31, | ||||||||||||||||||
|---|---|---|---|---|---|---|---|---|---|---|---|---|---|---|---|---|---|---|---|
(Dollars in millions)
|
2010 | 2009 | 2008 | ||||||||||||||||
Net sales |
$ | 2,818.0 | 100.0 | % | $ | 1,990.1 | 100.0 | % | $ | 2,916.5 | 100.0 | % | |||||||
Cost of sales |
2,543.6 | 90.3 | 1,779.0 | 89.4 | 2,717.4 | 93.2 | |||||||||||||
Gross margin |
274.4 | 9.7 | 211.1 | 10.6 | 199.1 | 6.8 | |||||||||||||
Selling, general and administrative expenses |
160.0 | 5.7 | 182.9 | 9.2 | 168.6 | 5.8 | |||||||||||||
Long-lived asset impairment charges |
— | — | 21.8 | 1.1 | 175.2 | 6.0 | |||||||||||||
Restructuring costs |
0.1 | 0.0 | 6.9 | 0.3 | 22.0 | 0.7 | |||||||||||||
Losses (gains) on sale of assets |
— | — | 0.1 | 0.0 | (27.3 | ) | (0.9 | ) | |||||||||||
Operating income (loss) |
114.3 | 4.0 | (0.6 | ) | (0.0 | ) | (139.4 | ) | (4.8 | ) | |||||||||
Interest expense, net |
69.5 | 2.5 | 130.5 | 6.6 | 133.2 | 4.6 | |||||||||||||
Loss on debt modification and extinguishment, net |
— | — | 42.8 | 2.2 | — | — | |||||||||||||
Gain on debt exchange |
— | — | (400.8 | ) | (20.1 | ) | — | — | |||||||||||
Foreign exchange loss |
0.8 | 0.0 | 1.4 | 0.1 | 4.3 | 0.1 | |||||||||||||
Provision for (benefit from) income taxes |
1.3 | 0.0 | 94.5 | 4.7 | (21.7 | ) | (0.7 | ) | |||||||||||
Net income (loss) |
$ | 42.7 | 1.5 | % | $ | 131.1 | 6.6 | % | $ | (255.2 | ) | (8.8 | )% | ||||||
We have identified three reportable segments through which we conduct our operating activities: (i) chlorovinyls; (ii) building products; and (iii) aromatics. These three segments reflect the organization used by our management for internal reporting. The chlorovinyls segment consists of a highly
31
integrated chain of electrovinyl products, which includes chlorine, caustic soda, VCM and vinyl resins, and our compound products consisting of compound additives and vinyl compounds. Our vinyl-based building and home improvement products, including window and door profiles and mouldings products and outdoor building products consisting of siding, pipe and pipe fittings and deck, fence and rail products are marketed under the Royal Group brand names, and are managed within the building products segment. The aromatics segment is also integrated and includes the products cumene and the co-products phenol and acetone.
The following table sets forth certain financial data by reportable segment for each of the three years ended December 31, 2010, 2009 and 2008.
| |
Year Ended December 31, | |||||||||||||||||||
|---|---|---|---|---|---|---|---|---|---|---|---|---|---|---|---|---|---|---|---|---|
(Dollars in millions)
|
2010 | 2009 | 2008 | |||||||||||||||||
Net sales |
||||||||||||||||||||
Chlorovinyls products |
$ | 1,224.7 | 43.4 | % | $ | 940.6 | 47.3 | % | $ | 1,380.0 | 47.3 | % | ||||||||
Building products |
793.6 | 28.2 | 728.2 | 36.6 | 917.7 | 31.5 | ||||||||||||||
Aromatics products |
799.7 | 28.4 | 321.3 | 16.1 | 618.8 | 21.2 | ||||||||||||||
Total net sales |
$ | 2,818.0 | 100.0 | % | $ | 1,990.1 | 100.0 | % | $ | 2,916.5 | 100.0 | % | ||||||||
Operating income (loss) |
||||||||||||||||||||
Chlorovinyls products |
$ | 114.3 | $ | 79.5 | $ | 60.2 | ||||||||||||||
Building products |
14.6 | (26.7 | ) | (163.6 | ) | |||||||||||||||
Aromatics products |
23.3 | 16.9 | (35.0 | ) | ||||||||||||||||
Unallocated Corporate |
(37.9 | ) | (70.2 | ) | (1.0 | ) | ||||||||||||||
Total operating income (loss) |
$ | 114.3 | $ | (0.6 | ) | $ | (139.4 | ) | ||||||||||||
Year Ended December 31, 2010 Compared With Year Ended December 31, 2009
Net Sales. For the year ended December 31, 2010, net sales totaled $2,818.0 million, an increase of 42 percent compared to $1,990.1 million for the prior year. The net sales increase was primarily a result of an increase in our overall sales volumes of 25 percent and sales prices of 12 percent on a constant currency basis. Our overall sales volume increase was mainly attributable to an increase in domestic contract sales, opportunistic export spot sales and the seasonally adjusted annual U.S. and Canadian housing starts of 6 percent and 27 percent, respectively, from 2009 to 2010, according to reports furnished jointly by the U.S. Census Bureau and the U.S. Department of Housing and Urban Development in January 2011 and Canada Mortgage and Housing Corporation in February 2011. Our overall sales price increase was primarily a result of increases in the prices of some of our electrovinyl products and all of our aromatics products and a favorable Canadian dollar currency impact. The sales price increases reflect higher cost for all of our raw materials.
Gross Margin. Total gross margin decreased from 10.6 percent of sales for the year ended December 31, 2009 to 9.7 percent of sales for the year ended December 31, 2010. This decrease in gross margin percentage was primarily due to a greater increase in sales volume of our lower margin aromatics products as compared to the sales volume increase in our higher margin chlorovinyl and building product segments. The $63.3 million gross margin increase was primarily due to an increase in sales volume for most of our products and a favorable Canadian dollar currency impact. Our sales price increases were offset by an increase in our raw material and natural gas costs. Our primary raw materials and natural gas costs in our chlorovinyls and aromatics segments normally track industry prices. CMAI reported a price increase of 43 percent for benzene, 42 percent for propylene, 49 percent for ethylene, 12 percent for chlorine and 12 percent for natural gas from the 2009 to 2010. We implemented numerous cost savings initiatives during 2009 that we continue to execute, with the goal of further improved gross margins.
32
Selling, General and Administrative Expenses. Selling, general and administrative expenses totaled $160.0 million for the year ended December 31, 2010, a 13 percent decrease from the $182.9 million for the year ended December 31, 2009. This selling, general and administrative expense decrease of $22.9 million is primarily due to the favorable impacts of: (i) a decrease in stock compensation expense of $14.2 million related to a July 27, 2009 stock grant as described in Note 10 of the Notes to the Consolidated Financial Statements, (ii) a $15.9 million decrease in fees paid to several consultants engaged in 2009 to assist us in reducing overall indebtedness and related interest expense and continued performance improvement, transportation management and indirect sourcing cost reduction initiatives, among other areas of the business, (iii) a $11.0 million decrease in bad debt expense, of which $6.8 million was attributable to our chlorovinyls segment and $4.1 million was attributable to our building products segment, and (iv) a decrease in the discount on sale of interests in our trade receivables of $11.4 million in our unallocated corporate overhead due to the December 2009 termination of our asset securitization program. These decreases were partially offset by the unfavorable impacts of: (i) a $12.3 million increase in performance based incentive compensation, (ii) $5.6 million in unfavorable currency impact on our costs in Canada in our building products segment, (iii) a $3.8 million gain from litigation settlements in the year ended December 31, 2009 in our chlorovinyls segment, and (iv) $1.8 million of insurance proceeds received in the year ended December 31, 2009 in our chlorovinyls segment.
Long-lived asset impairment charges. In May 2009, we initiated the 2009 Window and Door Consolidation Plan. In connection with this plan, we closed certain manufacturing plants and wrote down the property, plant and equipment, resulting in a $21.8 million charge in the year ended December 31, 2009 in our building products segment. For the year ended December 31, 2010, we did not have any significant write downs of any property, plant and equipment.
Restructuring Costs. For the year ended December 31, 2009, we incurred $4.4 million of severance and other exit costs, which are reflected in the accompanying Consolidated Statements of Operations. Also for the year ended December 31, 2009, we incurred $2.5 million in fees paid to consultants, to assist us in performance improvement, and transportation management and indirect sourcing cost reduction initiatives among other areas of the business with the ultimate goal to improve and sustain profitability for the long-term. For the year ended December 31, 2010, there were no material restructuring costs.
Loss on debt modification and extinguishment, net. On March 16, 2009, we executed the fifth amendment to our senior secured credit facility and accounted for this amendment as an extinguishment of the Term Loan B in accordance with ASC subtopic 470-50 section 40, Modifications and Extinguishments. Accordingly, we recorded the amended Term Loan B at its estimated fair value of $207.1 million at the date of extinguishment. The difference between the fair value of the amended Term Loan B and the carrying value of the original Term Loan B less the related financing cost at the date of debt extinguishment of $121.0 million was recorded as a gain. On December 22, 2009, we refinanced our senior secured credit facility and asset securitization agreement with a four-year term $300.0 million senior secured asset-based revolving credit facility and $500.0 million of senior secured 9.0 percent notes. The full extinguishment of our old senior secured credit facility and asset securitization agreement resulted in the write off of the Term Loan B debt discount and related financing costs of $163.8 million. Both the gain from the fifth amendment to our senior secured credit facility and loss from the refinancing of our senior secured credit facility and asset securitization were netted in the $42.8 million loss on debt modification and extinguishment, net in the consolidated statement of operations for the year ended December 31, 2009.
Gain on debt exchange. On July 29, 2009, we consummated the 2009 debt exchange. In accordance with ASC subtopic 470-60, Troubled Debt Restructuring by Debtors, this debt exchange was a troubled debt restructuring and thus an extinguishment of the notes for which we recognized a net gain
33
of $400.8 million. This gain included $731.5 million of principal debt, net of original issuance discounts, $53.7 million accrued interest, $14.1 million in deferred financing fees written off and $12.4 million of third party fees which was exchanged for the $357.9 million fair value of our common and preferred stock.
Interest Expense, net. Interest expense, net decreased to $69.5 million for the year ended December 31, 2010 from $130.5 million for the year ended December 31, 2009. This decrease in interest expense (net) of $61.0 million was primarily attributable to lower overall debt balance during 2010 compared to 2009. The lower overall debt balance was due primarily to the 2009 debt exchange. This reduction in debt effectively decreased our annual cash interest expense by approximately $69.7 million.
Provision for (benefit from) income taxes. The provision for income taxes was $1.3 million for the year ended December 31, 2010 compared with an income tax provision of $94.5 million for the year ended December 31, 2009. Income before income taxes decreased $181.6 million from $225.6 million in 2009 to $44.0 million in 2010 primarily due to the $400.8 million gain on the 2009 debt exchange. Our effective tax rate for 2010 and 2009 was 2.9 percent and 41.9 percent, respectively. The difference in the effective tax rate as compared to the U.S. statutory federal income tax rate in 2010 was primarily due to the resolution of certain uncertain tax positions, primarily in Canada and arising before the acquisition of the Royal Group, and the release of a portion of the valuation allowance recorded against certain deferred tax assets in Canada. The difference in the effective tax rate as compared to the U.S. statutory federal income tax rate in 2009 was primarily due to federal and state income tax credits, including credits earned from timely repayment of the Mississippi Industrial Development Bond, offset by the valuation allowance recorded against certain deferred tax assets in Canada.
Chlorovinyls Segment
Net Sales. Net sales totaled $1,224.7 million for the year ended December 31, 2010, an increase of 30 percent compared with net sales of $940.6 million for the prior year primarily from our electrovinyls products group. The net sales increase was a result of an increase in our overall sales prices of 16 percent and sales volume of 12 percent as compared to the year ended December 31, 2009. Our overall sales price increases were primarily due to vinyl resins sales price increases of 26 percent. The vinyl resins sales prices increase reflects higher prices for the feedstocks ethylene and chlorine, which price increases were passed through to customers. Our overall chlorovinyls sales volume increase of 12 percent was due to an increase in domestic contract sales in North American markets and opportunistic export spot sales. Our domestic vinyl resin and vinyl compounds sales volume increased 22 percent and 12 percent, respectively. North American vinyl resin industry sales volume increased 10 percent as a result of an increase in exports of 85 percent offset by a decrease in domestic sales volume of 10 percent, according to PIPS in January 2011.
Operating Income. Operating income increased by $34.8 million from $79.5 million for the year ended December 31, 2009 to $114.3 million for the year ended December 31, 2010. This operating income increase was due to an increase in vinyl resins and vinyl compound sales prices, increased North American vinyl resins sales volumes and also several cost saving initiatives implemented during 2009 which were realized in 2010. This increase in operating income was partially offset by higher raw material costs and lower caustic soda sales prices. Although caustic soda prices decreased 7 percent on average year over year, CMAI reported that caustic soda industry sales price trended upward 114 percent during the year of 2010. During 2009, caustic soda prices trended downward 77 percent due to the global supply increasing from new chlor-alkali capacity additions in Asia and the significant global economic downturn during 2009 effectively removing large segments of the demand for caustic through shutdowns and rate reductions by end users. Within the electrovinyls products, the primary driver is vinyl resin. Our overall raw materials and natural gas costs during 2010 increased 19 percent
34
compared to 2009. CMAI reported that industry prices of our primary feedstocks, ethylene and chlorine, increased 49 percent and 12 percent, respectively from the 2009 period. In addition, during the year ended December 31, 2010, we had three scheduled and unscheduled plant turnarounds for maintenance compared to one during the year ended December 31, 2009. Our chlorovinyls operating rate increased from about 75 percent for 2009 to about 82 percent for 2010.
Building Products Segment
Net Sales. Net sales totaled $793.6 million for the twelve months ended December 31, 2010, an increase of 9 percent (or 2 percent on a constant currency basis) compared to $728.2 million for the twelve months of last year. The net sales increase was supported by a favorable currency impact on sales in Canada and, to a lesser extent, improved volumes of 4 percent as demand in the Canadian housing and construction markets remained stable during the first half of the year. Our building and home improvement products business experienced increased sales growth in the first half of 2010, fueled by tax law changes and incentives in the U.S. and Canada. However, once the incentives expired in the second half of 2010, the housing market declined from the first half. In the U.S., volumes declined from 2009 as we were negatively impacted by the loss of a seasonal program with a large retail customer. According to PIPS industry data for our products, North American extruded vinyl resin sales declined 19 percent for the year. For 2010, our building products segment geographical sales continued to show a higher Canadian weighting of 60 percent compared to the U.S. of 39 percent as a result of the stronger demand in Canada, the Canadian currency benefit and the previously mentioned 2009 loss of a U.S.-based seasonal retail customer.
Operating Income (Loss). Operating income increased by $41.3 million from an operating loss of $26.7 million for the twelve months ended December 31, 2009 to operating income of $14.6 million for the twelve months ended December 31, 2010. This increase in operating income was due to an increase in sales volumes, a favorable currency impact, and benefits from numerous cost saving initiatives implemented during 2009 which were realized in 2010. In addition, 2009 results include an asset impairment charge of $21.6 million and restructuring charge of $4.4 million, while 2010 results include $0.4 million of restructuring expense. The building products sales volume increase was primarily due to increased demand in the North American housing and construction markets which was most evident in Canada. Also in May 2009, we implemented a plan to reduce our cost structure with the permanent closure of two window and door profile fabrication plants and moved the production requirements of our customers to our other manufacturing locations, which contributed to the improved gross margin realized by the building products segment for the year ended December 31, 2010 as compared to the prior year.
Aromatics Segment
Net Sales. Net sales were $799.7 million for the year ended December 31, 2010, an increase of 149 percent compared to $321.3 million for the prior year. The net sales increase was primarily a result of an increase in our overall sales volume of 83 percent and sales prices of 36 percent as compared to the year ended December 31, 2009. Our overall aromatics sales volumes increased as a result of increases in the sales volumes of cumene of 79 percent, phenol and acetone of about 92 percent. Our aromatics sales volume increases were due to an increase in opportunistic spot sales in both North America and export markets due to industry operating issues and strong demand in Asia. Our overall average sales prices increased as a result of an increase in the prices of cumene of 46 percent, and phenol and acetone of 23 percent. The sales prices increases reflect higher costs for the feedstocks benzene and propylene.
35
Operating Income. Operating income increased by $6.4 million from $16.9 million for the year ended December 31, 2009 to $23.3 million for the year ended December 31, 2010. This increase in operating income was due primarily to an 83 percent increase in aromatics sales volume. Our aromatics sales volume increases were due to an increase in opportunistic spot sales in both North America and export markets due to industry operating issues and strong demand in Asia. Our aromatics operating rate increased from about 38 percent for 2009 to about 71 percent for 2010. Our sales volumes and price increases for all of our aromatics products were partially offset by a significant increase in our raw materials costs. Overall raw material costs increased 50 percent from 2009 to 2010 primarily as a result of increases in benzene and propylene costs. CMAI reported that industry prices of our primary feedstocks, benzene and propylene, increased 43 percent, and 42 percent, respectively from the 2009 period. In addition, our operating income improvement last year was driven by raw material prices rising throughout 2009 resulting in inventory holding gains. We also incurred two scheduled plant turnaround for maintenance during the 2010.
Year Ended December 31, 2009, Compared With Year Ended December 31, 2008
Net Sales. For the year ended December 31, 2009, net sales totaled $1,990.1 million, a decrease of 32 percent compared to $2,916.5 million for the prior year. This decrease was primarily a result of decreases in our overall sales prices and volumes of 27 percent and 6 percent, respectively. Our overall average sales price decrease is largely a result of decreases in the prices of vinyl resins and all of our aromatics products and an unfavorable currency impact. The sales price decreases reflect lower costs for our raw materials and natural gas. Our overall sales volume decrease is mainly attributable to a decrease in demand in North America for vinyl-based building materials, which, in turn, is attributable to the seasonally adjusted annual U.S housing starts rate decreasing 37 percent from 2008 to 2009. Our North American sales volume decrease was partially offset by an increase in export sales.
Gross Margin. Total gross margin increased from 6.8 percent of sales for the year ended December 31, 2008 to 10.6 percent of sales for the year ended December 31, 2009. This $12.0 million gross margin increase and related increase in gross margin percentage is due to lower feedstock costs and natural gas costs and several cost savings initiatives partially offset by lower sales volumes and sales prices. Also during 2009, we were able to fully recover previously purchased raw materials costs in an increasing feedstock and sales price environment. Conversely during 2008, the chemical industry experienced a sharp decline in feedstock and product prices and we were not able to recover previously purchased feedstock costs due to the time lag between the purchase of raw materials and the sale of the related finished goods. Some of our primary raw materials and natural gas costs in our chemical segments normally track crude oil and natural gas industry prices. Crude oil and natural gas industry prices experienced decreases of 38 percent and 56 percent, respectively, from 2008 to 2009. We implemented several cost savings initiatives during 2008 and 2009 including the permanent closure of our 450 million pound vinyl resin manufacturing plant in Sarnia, Ontario and our 500 million pound vinyl resin manufacturing plant in Oklahoma City, Oklahoma, resulting in a number of cost reductions including a decrease in labor cost related to cost of sales of about $50.5 million during 2009 as compared to 2008.
Selling, General and Administrative Expenses. Selling, general and administrative expenses totaled $182.9 million for the year ended December 31, 2009, an 8 percent increase from the $168.6 million for the year ended December 31, 2008. We have increased selling, general and administrative expenses about $14.4 million for stock compensation expense. This increase in stock compensation expense is primarily related to a July 27, 2009 stock grant in connection with the completion of our 2009 debt exchange, as described in Note 10 of the Notes to the Consolidated Financial Statements. On the date of acceptance of notes in the exchange offers, restricted share units representing 2,274,745 shares in the aggregate were granted. We have also increased our selling, general and administrative expenses primarily from a $12.6 million increase for services of restructuring advisors to assist us in reducing
36
overall indebtedness and related interest expense, performance improvement, and transportation management and indirect sourcing cost reduction initiatives among other areas of the business, with the ultimate goal to improve and sustain profitability for the long-term. In addition, we increased selling, general and administrative expenses by $4.4 million for the amortization of financing fees related to our asset securitization agreement entered into on March 17, 2009, lower costs last year of $5.2 million relating to a change in our vacation policy and accrued incentive compensation of $1.8 million. Our chlorovinyls and aromatics segments collectively increased selling, general, and administrative costs by $1.4 million, primarily as a result of a $4.0 million increase in the bad debt reserve, offset partially by a gain in litigation settlements of $3.8 million. We have reduced selling, general and administrative costs in our building product segment by $26.6 million, including a decrease in payroll related costs of $7.1 million, bad debt expense of $5.5 million, advertising, commission and promotional expense of $4.3 million and depreciation and amortization of $5.1 million. Our Canadian operations' selling, general, and administrative expenses reflect a favorable currency effect of $4.3 million as the Canadian dollar weakened against the U.S. dollar during the year ended December 31, 2009 compared to the prior year.
Long-Lived Asset Impairment Charges. In May 2009, we initiated plans to further consolidate plants in our window and door profiles and mouldings products segment (the "2009 Window and Door Consolidation Plan"). In connection with this plan, we wrote down the plant's property, plant and equipment, resulting in a $21.8 million charge in the year ended December 31, 2009. We recorded non-cash impairment charges of $175.2 million for the year ended December 31, 2008 to write down goodwill, other intangible assets and long-lived assets. The impairment during 2008 is due to the continued deteriorating U.S. housing and construction markets. The Chlorovinyls reportable segment other long-lived assets write down of $61.1 million is primarily due to ceasing all operations and permanent shut down of the Oklahoma City, Oklahoma and Sarnia, Ontario vinyl resin manufacturing plants during 2008.
Restructuring Costs. The expenses associated with the Fourth Quarter 2008 Restructuring Plan, the Outdoor Storage Plan (each as described in Note 4 of the Notes to the Consolidated Financial Statements included in Item 8) and the 2009 Window and Door Consolidation Plan for the year ended December 31, 2009 for severance and exit costs totaled $4.4 million. Also related to these restructuring plans we expensed about $2.5 million for the services of several consultants to assist us in performance improvement, transportation management and indirect sourcing cost reduction initiatives among other areas of the business with the ultimate goal of improving and sustaining profitability for the long-term. For 2008, restructuring costs were $22.0 million primarily due to the closure and disposition costs of our outdoor storage buildings business of $5.8 million and cost related to the permanent shut down of the Oklahoma City, Oklahoma and Sarnia, Ontario vinyl resin manufacturing plants, severance and other exit costs of $6.3 million. See Note 4 of the Notes to the Consolidated Financial Statements included in Item 8 for further information on restructuring costs.
Losses (gains) on sale of assets. There were no significant asset sales during the year ended December 31, 2009. In June 2008, we sold land for net proceeds of $36.5 million, which resulted in a gain of $28.8 million. Additionally, in June 2008, we sold and leased back equipment for $10.6 million resulting in a $2.2 million currently recognized gain, a short-term deferred gain of $0.8 million and a non-current deferred gain of $7.2 million. The remaining $3.7 million in 2008 was due to a loss on the sale of other real estate.
Interest Expense, net. Interest expense, net decreased to $130.5 million for the year ended December 31, 2009, from $133.2 million for the year ended December 31, 2008. This decrease of $2.7 million was primarily attributable to lower overall debt balances and interest rates offset partially by the accretion of the fair value of the Term Loan B during 2009 as compared to the same period last year. The lower overall debt balance was due primarily to our exchanging approximately $736.0 million
37
of our debt for equity on July 27, 2009. This reduction in debt effectively decreased our annual interest expense by $69.7 million. This decrease in interest expense was offset by the Term Loan B debt discount accretion as interest expense of $12.9 million during 2009, prior to the extinguishment of the Term Loan B on December 22, 2009. There was no Term Loan B debt discount accretion expense during 2008.
Loss on debt modification and extinguishment, net. On March 16, 2009, we executed the fifth amendment to our senior secured credit facility and accounted for this amendment as an extinguishment of the Term Loan B in accordance with ASC subtopic 470-50 section 40, Modifications and Extinguishments. Accordingly, we recorded the amended Term Loan B at its estimated fair value of $207.1 million at the date of extinguishment. The difference between the fair value of the amended Term Loan B and the carrying value of the original Term Loan B less the related financing cost at the date of debt extinguishment of $121.0 million was recorded as a gain. On December 22, 2009, we refinanced our senior secured credit facility and asset securitization agreement with a four-year term $300.0 million senior secured asset-based revolving credit facility and $500.0 million of senior secured 9.0 percent notes. The full extinguishment of our old senior secured credit facility and asset securitization agreement resulted in the write off of the Term Loan B debt discount and related financing costs of $163.8 million. Both the gain from the fifth amendment to our senior secured credit facility and loss from the refinancing of our senior secured credit facility and asset securitization were netted in the $42.8 million loss on debt modification and extinguishment, net in the consolidated statement of operations for the year ended December 31, 2009.
Gain on debt exchange. On July 29, 2009, we consummated the 2009 debt exchange. In accordance with ASC subtopic 470-60, Troubled Debt Restructuring by Debtors, this debt exchange was a troubled debt restructuring and thus an extinguishment of the notes for which we recognized a net gain of $400.8 million. This gain included $731.5 million of principal debt, net of original issuance discounts, $53.7 million accrued interest, $14.1 million in deferred financing fees written off and $12.4 million of third party fees which was exchanged for the $357.9 million fair value of our common and preferred stock.
Provision for (benefit from) income taxes. The provision for income taxes was $94.5 million for the year ended December 31, 2009 compared with an income tax benefit of $21.7 million for the year ended December 31, 2008. Income before income taxes increased $502.4 million from 2008 to 2009 primarily due to the $400.8 million gain on the 2009 debt exchange. Our effective tax rate for 2009 and 2008 was 41.9 percent and 7.8 percent, respectively. The difference in the effective tax rate as compared to the U.S. statutory federal income tax rate in 2009 was primarily due to federal and state income tax credits, including credits earned from timely repayment of the Mississippi Industrial Development Bond, offset by the reduction of tax attributes as a result of the 2009 debt exchange and concurrent change in control of the company for tax purposes, as well as the valuation allowance in Canada. The difference in the effective tax rate as compared to the U.S. statutory federal income tax rate in 2008 was primarily due to federal and state income tax credits, the reversal of the interest accrued on the Quebec Trust matter discussed below and the valuation allowance in Canada. We are not recognizing a tax benefit for the net operating losses in Canada, as we have determined that we have not met the ASC topic 740, Accounting for Income Taxes, criteria to allow us to realize such benefits. See Note 16 of the Notes to the Consolidated Financial Statements for further information on income taxes.
In March 2008, we reached a settlement with the provinces of Quebec and Ontario and the Canada Customs and Revenue Agency with respect to their assessments resulting from the retroactive application of tax law changes promulgated by Bill 15, which amended the Quebec Taxation Act and other legislative provisions. Royal Group, in connection with its tax advisors, had previously established tax structures that used a Quebec Trust to minimize its overall tax liabilities in Canada. Bill 15
38
eliminated the ability to use the Quebec Trust structure on a retroactive basis. We had recorded a liability for the unrecognized tax benefit of $46.1 million related to the Quebec Trust matter. We settled this matter with all relevant jurisdictions by making cash payments totaling $20.1 million. We recognized an income tax benefit of $9.2 million related to the reversal of $5.8 million in interest accrued on this liability and the reversal of $3.4 million in a previously established valuation allowance for net operating loss carryforwards, the value of which was realized via this settlement. In addition, we reduced goodwill by $16.5 million as a result of the settlement of this preacquisition tax contingency.
Chlorovinyls Segment
Chlorovinyls segment net sales totaled $940.6 million for the year ended December 31, 2009, a decrease of 32 percent compared with net sales of $1,380.0 million for the prior year primarily from our electrovinyls products group. Our overall average sales price decreased 32 percent primarily as a result of decreases in the prices of vinyl resins of 34 percent and caustic soda of 50 percent. The vinyl resins sales price decrease reflects lower prices for the feedstock ethylene and natural gas. The caustic soda sales price decrease reflects a decrease in demand caused by the significant economic downturn effectively removing large segments of the demand for caustic through shutdowns and rate reductions by end users and an increase in global supply from new chlor-alkali capacity additions in Asia. Our North American chlorovinyls sales volume decreased primarily as a result of the decrease in our sales volume for vinyl resins of 15 percent, vinyl compounds of 10 percent and caustic soda of 21 percent. Our North American sales volume decrease was offset by an increase in exports for vinyl resins of 80 percent and caustic soda of 59 percent. North American vinyl resin industry sales volume declined 1 percent as a result of the domestic sales volume decrease of 7 percent, primarily due to the decline in U.S. housing and construction offset by an increase in export sales volume of 33 percent.
Operating Income. Operating income increased by $19.3 million from $60.2 million for the year ended December 31, 2008 to $79.5 million for the year ended December 31, 2009. The increase in operating income was primarily due to a restructuring charge of $10.6 million and a non-cash impairment charge of $62.5 million during 2008. Our operating income was impacted by a decrease in sales prices and domestic sales volume for most of our chlorovinyls products partially offset by a decrease in our raw materials and natural gas costs, an increase in export sales and further realization of cost savings initiatives implemented during 2008 and 2009. The sales price decrease reflects lower prices for our feedstock costs. In addition, the caustic soda sales price decrease reflects a decrease in demand due to the significant economic downturn and an increase in global supply from chlor-alkali capacity additions in Asia. The domestic sales volume decrease is due to weak demand in North America caused primarily by the decline in U.S. housing construction. Our overall raw materials and natural gas costs during 2009 decreased 47 percent compared to 2008. Our chlorovinyls operating rate increased from 70 percent for 2008 to 75 percent for 2009. In addition, in the first quarter of 2009 we had scheduled turnaround maintenance for our caustic chlorine plant. During 2008, we reduced our cost structure with the permanent closure of the Sarnia, Ontario and Oklahoma City, Oklahoma vinyl resin manufacturing plants, which had a combined 950 million pound annualized capacity, and moved the production requirements of our customers to our other manufacturing locations.
Building Products Segment
Net Sales. Net sales totaled $728.2 million for the year ended December 31, 2009, a decrease of 21 percent (or 15 percent on a constant currency basis) compared to $917.7 million for the prior year. Our overall sales volumes decreased 13 percent in the same period, reflecting the decline in U.S. housing construction and remodeling. We experienced an unfavorable currency impact on our sales in Canada resulting from the weakening of the Canadian dollar against the U.S. dollar. During 2009, our building products segment generated about 44 percent of its revenue in the U.S. and the remainder in Canada.
39
Operating loss. Operating loss decreased by $136.9 million from an operating loss of $163.6 million for the twelve months ended December 31, 2008 to operating loss of $26.7 million for the twelve months ended December 31, 2009. The decrease in operating loss was primarily due to a decrease in restructuring charge of $5.7 million and a decrease in non-cash impairment charge of $91.3 million from 2008 to 2009. Positive impacts on our operating loss includes decreases in our raw materials costs and cost savings initiatives implemented during 2008 and 2009 partially offset by decreases in sales volumes. The industry price of vinyl resins, this segment's primary raw material, decreased from 2008 to 2009. The building product sales volume decrease is due to weak demand in North America reflecting the decline in the North American housing and construction markets. We implemented numerous cost savings initiatives during 2008 and 2009 to improve profitability, reduce indirect spending and freight costs and adjust our capacity to more closely match market demand. During 2008, we reduced our cost structure with the permanent closure of three fabrication plants and moved the production requirements of our customers to our other manufacturing locations. In May 2009, we announced the permanent closure of two additional fabrication plants and moved the production requirements of our customers to our other manufacturing locations. In addition, we sold our outdoor storage buildings business during the first quarter of 2008, which also reduced our cost structure.
Aromatics Segment
Net Sales. Aromatics segment net sales were $321.3 million for the year ended December 31, 2009, a decrease of 48 percent compared to $618.8 million for the prior year. Our overall average sales prices decreased 34 percent as a result of decreases in the prices of cumene of 36 percent and phenol and acetone of 28 percent. The sales price decreases reflect lower costs for the feedstocks benzene and propylene. The North American phenol and acetone industry operating rate was approximately 61 percent for 2009, or down about 15 percent compared with the prior year. The North American cumene industry operating rate was approximately 62 percent during 2009, or about 10 percent lower than the prior year. During the first quarter of 2009, a competitor announced the idling of a 1 billion pound cumene plant reducing North American cumene industry capacity by about 9 percent. Our overall aromatics sales volumes decreased 21 percent as a result of a decline in phenol and acetone of 49 percent. The phenol and acetone sales volume decrease is due to weak demand in North America caused primarily by the decline in the U.S. housing construction and automotive markets and reduced export sales. Our cumene sales volume increase of 10 percent reflects additional spot sales opportunities realized during the year ended December 31, 2009.
Operating Income. Operating income increased by $51.9 million from an operating loss of $35.0 million for the year ended December 31, 2008 to $16.9 million operating income for the year ended December 31, 2009. This increase in operating income was due to decreases in our raw materials costs which more than offset decreases in our sales prices and volumes for most of our aromatics products. Also during 2009, we were able to fully recover previously purchased raw materials costs in an increasing feedstock and sales price environment. Conversely during the fourth quarter of 2008, we experienced a $24.8 million operating loss due to a sharp decline in feedstock and product prices and we were not able to recover previously purchased feedstock costs due to the time lag between the purchase of raw materials and their sale as finished goods. Our aromatics segment is allocated costs for certain maintenance, utilities, environmental and service costs, as well as other selling, general and administrative costs.
Liquidity and Capital Resources
Operating Activities. Positive cash flow from operations was the largest contributor to the increase of cash on hand for fiscal year 2010. For the year ended December 31, 2010, cash flows provided by operating activities was $183.8 million compared with $0.7 million for the year ended December 31,
40
2009, primarily due to the $114.8 million improvement in operating results and improvement in net working capital. In 2009 we used $111.0 million to repurchase our asset securitization in connection with terminating and refinancing this facility, whereas no cash was used related to this in the current year. Additionally, we received net tax refunds of $16.0 million in 2010 compared to cash taxes paid of $10.0 million in 2009, further contributing to the improvement of cash from operations.
For the year ended December 31, 2010, net working capital increased by $59.7 million versus the prior fiscal year. This increase is largely represented by an increase in cash of $84.0 million due to increased cash generated from operations. This is offset by increases in compensation accrual and interest payable of $22.3 million and $19.7 million, respectively; and decreases in income taxes receivable, prepaid expenses, and the current portion of long term debt of $29.4 million, $7.4 million, and $6.1 million, respectively. We also improved working capital efficiency by 13 days during the 2010 fiscal year. The increased working capital amounts at the end of the fiscal year are due to significantly higher sales levels throughout the year and higher raw material prices.
In 2010, the largest change from the prior year related to the use of cash in operations is a result of the decrease in interest expense. This resulted in a savings in interest expense of $61.3 million versus the prior year. As of December 31, 2010, $nil million was drawn on the ABL Revolver in comparison to $56.5 million in prior year. Repayment of the ABL Revolver during the 2010 fiscal year was a result of increased cash flows from operations and contributed to the reduction of interest expense for the same year. We expect to continue to benefit from a reduction in interest expense under our current capital structure.
The major use of cash for fiscal year 2009 was a $111.0 million repurchase of previously sold accounts receivable as a result of the termination and replacement of our asset securitization agreement as part of our December 2009 refinancing that included a new ABL Revolver and issuance of $500.0 million aggregate principal amount of 9.0 percent senior secured notes. Additionally we incurred costs of approximately $21.8 million on restructuring and process improvement initiatives. Total working capital at December 31, 2009 was $340.7 million versus $225.2 million at December 31, 2008. The significant increase in working capital for fiscal year 2009 includes the $111.0 million increase in accounts receivable due to the above described termination of our asset securitization facility and a decrease of $28.6 million in our current portion of long-term debt.
For the year ended December 31, 2008, cash flows provided by operating activities decreased $87.2 million during the fiscal year. Total working capital at December 31, 2008 was $225.2 million, an increase of $24.5 million from the previous fiscal year. The significant increase in working capital for fiscal year 2008 includes an $80.7 million increase in cash partially offset by a $32.6 million increase in our current portion of long-term debt and decreases in accounts payable, accrued compensation, and liability for unrecognized tax benefits of $127.4 million, $23.0 million and $52.1 million, respectively. These significant increases in working capital for fiscal year 2008 were partially offset by a decrease in inventories of $126.3 million. The majority of our inventory decrease was mainly due to lower prices in our raw materials and adjusting our levels to the decrease in current demand.
Investing Activities. Net cash used in investing activities was $44.7 million for the year ended December 31, 2010. This is an increase in cash used for capital expenditures of $15.6 million over the previous year. The largest use of cash was $22.9 million of capital investment related to our U.S. chemical facilities.
We estimate that we expect to invest approximately $75 to $85 million for capital expenditures in 2011. In our chemicals businesses, we expect to make the productivity and reliability investments that are required to run the higher operating rates we expect in the coming years. In our building products businesses, we expect to invest in productivity improvements as well as accelerating our new product development efforts ahead of the expected eventual recovery in these markets.
41
For the fiscal year 2009, cash used in investing activities was $26.0 million. The major use of cash was $30.1 million for capital expenditures, including investments at our U.S. chemical facilities, partially offset by insurance proceeds of $2.0 million and proceeds from the sale of assets of $2.1 million.
During 2008, we received cash proceeds from sales of property, plant and equipment and assets held for sale of $79.8 million. These proceeds relate primarily to the sale of the outdoor storage business for $13.0 million, a sale of real estate in Ontario, Canada for $12.6 million, a sale of real estate in Manitoba, Canada for $4.5 million, the sale of a vacant tract of land along the Houston ship channel in Pasadena, Texas for net proceeds of $36.5 million, and the sale and lease back of equipment for $10.6 million.
We incurred maintenance expense for our production facilities of $137.4 million, $104.5 million and $109.1 million during the years ended December 31, 2010, 2009, and 2008, respectively.
Financing Activities. On December 31, 2010, our debt consisted of $9.0 million of unsecured 7.125 percent senior notes due 2013, $13.2 million of unsecured 9.5 percent senior notes due 2014, $41.4 million of unsecured 10.75 percent senior subordinated notes due 2016, $497.1 million of senior secured 9.0 percent notes due 2017, $112.4 million of lease financing obligations and $17.0 million in other debt. At December 31, 2010, under our ABL Revolver, we had a maximum borrowing capacity of $300.0 million, and net of qualifying accounts receivable and inventory, outstanding letters of credit of $20.2 million, current borrowings of $nil , and less a fixed $15.0 million availability reserve we had remaining availability of $264.8 million. As discussed below, in January 2011 we amended this ABL agreement, removing the $15 million availability block, reducing fees and extending the maturity until 2016. On February 16, 2011, we announced our intent to redeem $22.1 million of debt in 2011 consisting of our 2013 and 2014 notes and therefore we have classified this debt as current in our consolidated balance sheet as of December 31, 2010. We intend to redeem these notes with cash from operations. Our lease financing obligation consists of rent of approximately $8 million a year through 2016, and does not represent an obligation to repay the lease financing obligation of $112.4 million.
All of our current debt outstanding contains fixed interest rates. Borrowings under the ABL Revolver, if any, are at variable interest rates. Subsequent to year end, we completed the approximate $72.0 million purchase of Exterior Portfolio, an addition to our siding business. This acquisition was funded with cash on hand. Cash used by financing activities was $55.7 million for the fiscal year ended 2010 primarily related to the $56.4 million full repayment of borrowings under the ABL Revolver.
Our short term borrowings consist of our ABL Revolver. At December 31, 2010, we had no short term borrowings.
($ in millions)
|
As of and for the quarter ended December 31, 2010 |
As of and for the year ended December 31, 2010 |
As of and for the year ended December 2009 |
|||||||
|---|---|---|---|---|---|---|---|---|---|---|
Short-Term Borrowings from Banks: |
||||||||||
Outstanding amount at period ending |
$ | 0.0 | $ | 0.0 | $ | 56.5 | ||||
Weighted average interest rate at period ending * |
0.0 | % | 0.0 | % | 6.0 | % | ||||
Average daily amount outstanding for the period |
$ | 3.9 | $ | 54.3 | $ | 144.6 | ||||
Weighted average daily interest rate for the period |
5.1 | % | 5.1 | % | 8.9 | % | ||||
Maximum month end amount outstanding during the period |
$ | 0.0 | $ | 117.7 | $ | 207.7 | ||||
- *
- As of the 2010 year end, the applicable rate for future borrowings would have been 3.6 to 5.5 percent.
42
The ABL Revolver provides for revolving credit including letters of credit through January 2016, subject to borrowing base availability. The borrowing base is determined on a monthly basis and is equal to specified percentages of our eligible accounts receivable and inventories, less a fixed $15.0 million availability reserve (which reserve was removed by our recent January 2011 amendment to the ABL Revolver) and reserves reasonably determined by the co-collateral agents. Interest on this facility is variable at a rate per annum, at our option, based on the prime rate plus the applicable pricing margin or the London Interbank Offered Rate, ("LIBOR") plus the applicable pricing margin. The ABL Revolver is secured by substantially all of our assets and contains certain restrictive covenants including restrictions on debt incurrence, granting of liens, dividends, acquisitions and investments. On January 14, 2011 we amended the ABL Revolver. The amendment removed the $15.0 million availability reserve, extended the term to January 13, 2016, and also beneficially modified certain financial covenants and definitions. See Note 22 to the Consolidated Financial Statements included in Item 8 for additional ABL Revolver information.
Management believes based on current and projected levels of operations and conditions in our markets and cash flow from operations, together with our cash and cash equivalents on hand of $122.8 million and the availability to borrow an additional $264.8 million under our ABL Revolver as of December 31, 2010, the Company has adequate funding for the foreseeable future to make required payments of principal and interest on our debt and fund our working capital and capital expenditure requirements and comply with the financial ratios of the senior ABL Revolver and covenants under our indenture for the 9.0 percent notes. To the extent our cash flow and liquidity exceeds the levels necessary for us to make our required debt payments, fund our working capital and capital expenditure requirements and comply with our ABL Revolver and the indenture for the 9.0 percent notes, we may use that excess liquidity to further grow our business through investments or acquisitions, payment of dividends and/or to further reduce our debt through optional prepayments or redemptions of our outstanding debt securities.
Cash used in financing activities was $29.1 million for the year ended December 31, 2009. During the 2009 fiscal year we successfully recapitalized our balance sheet including the refinancing of our senior secured credit facility and our $175 million asset securitization facility. At the time of the refinancing our senior secured credit facility consisted of a $300 million revolving credit facility and a $347.7 million Term Loan B. We replaced the senior secured credit facility and asset securitization facility with the four-year term senior secured $300 million ABL Revolver and the issuance of $500.0 million in principal amount of 9.0 percent senior secured notes due 2017. These notes were issued at a discount to effectively provide a 9.12 percent interest rate. We also consummated our 2009 debt exchange totaling approximately $736.0 million (principal amount), comprised of $91.0 million of the $100 million of outstanding 2013 notes, $486.8 million of the $500 million of outstanding 2014 notes, and $158.1 million of the $200 million of outstanding 2016 notes. An aggregate of approximately 30.2 million shares of convertible preferred stock and approximately 1.3 million shares of common stock were issued in exchange for the tendered notes after giving effect to a 1-for-25 reverse stock split, which reduced the outstanding common shares, before the issuance of common shares in the debt exchange, to approximately 1.4 million shares.
The recapitalization activities and a $17.0 million payoff of other debt are the primary contributors to reducing our total debt by $655.1 million at December 31, 2009 from the prior fiscal year. The recapitalization also significantly extended the duration of our debt maturities. Further, the recapitalization reduced our cash interest costs and removed the quarterly maintenance covenants that required waivers and amendments from our lenders in the past. The 2009 debt exchange was a troubled debt restructuring and thus an extinguishment of the notes for which we recognized a net gain of $400.8 million, or approximately $16.18 per share. Cash tax payments in 2009 were approximately $10 million. As a result of the enactment of the American Recovery and Reinvestment Act passed in 2009, we have the option to defer the federal taxes payable as a result of the debt exchange to 2014
43
and then pay those taxes ratably over five years. We made this election in our 2009 federal tax return and therefore do not have a large current tax liability.
Cash provided by financing activities was $15.4 million for the year ended December 31, 2008. Cash provided by financing activities in 2008 was impacted by our adjustment of our cash management activities intended to maximize our financial flexibility. Specifically, Lehman Commercial Paper, Inc., a subsidiary of Lehman Brothers Inc. (collectively "Lehman Brothers"), was a participant in our revolving line of credit facility, representing about 12 percent of our $375.0 million revolving line of credit facility. Due to their failure to fund revolver draws, we had about $6.6 million of our revolving line of credit that was not available to us. As a result we maintained a higher cash balance partially due to $105.8 million of net additional borrowings on our revolving line of credit that was partially offset by the repayment of $74.0 million of long-term debt. Long-term debt repayments were primarily funded by proceeds from the sale of underutilized assets. During fiscal year 2008, we increased our total debt by $33.3 million due primarily to the above noted issues with Lehman Brothers and the impact on the availability of our revolving line of credit. Had the revolving line of credit been fully available we could have decreased total debt during fiscal 2008 by $46.7 million by applying approximately $80.0 million of the $90.0 million of cash and cash equivalents on hand at December 31, 2008 towards our outstanding revolving line of credit balance.
Off-Balance Sheet Arrangement. In the past, we had agreements pursuant to which we sold an undivided percentage ownership interest in a defined pool of our U.S. trade receivables on a revolving basis through a wholly owned subsidiary to a third party (the "Securitization"). The funded balance has the effect of reducing accounts receivable and short-term liabilities by the same amount. As collections reduce accounts receivable included in the pool, we sold interests in new receivables to bring the ownership interests sold up to a maximum of $175.0 million, as permitted by the Securitization.
As of December 22, 2009, the Securitization was terminated and replaced with the ABL Revolver (see Note 10 of the Notes to the Consolidated Financial Statements included in Item 8).
Contractual Obligations. Our aggregate future payments under contractual obligations by category as of December 31, 2010, were as follows:
(In millions)
|
Total | 2011 | 2012 | 2013 | 2014 | 2015 | 2016 and thereafter |
|||||||||||||||
|---|---|---|---|---|---|---|---|---|---|---|---|---|---|---|---|---|---|---|---|---|---|---|
Contractual obligations: |
||||||||||||||||||||||
Long-term debt—principal |
$ | 582 | $ | — | $ | 18 | $ | 9 | $ | 13 | $ | — | $ | 542 | ||||||||
Long-term debt—interest |
306 | 53 | 51 | 51 | 51 | 50 | 50 | |||||||||||||||
Lease financing obligations |
49 | 7 | 8 | 8 | 8 | 8 | 10 | |||||||||||||||
Operating lease obligations |
68 | 18 | 16 | 10 | 8 | 5 | 11 | |||||||||||||||
Purchase obligations |
2,365 | 948 | 600 | 459 | 358 | — | — | |||||||||||||||
Expected pension contributions |
17 | 1 | — | 1 | 5 | 4 | 6 | |||||||||||||||
Uncertain income tax positions |
1 | 1 | — | — | — | — | — | |||||||||||||||
Asset retirement obligation |
11 | — | — | — | — | — | 11 | |||||||||||||||
Total |
$ | 3,399 | $ | 1,028 | $ | 693 | $ | 538 | $ | 443 | $ | 67 | $ | 630 | ||||||||
Long-Term Debt. Long-term debt includes principal and interest payments based upon our interest rates as of December 31, 2010. Long-term debt obligations are listed based on when they are contractually due.
Lease Financing Obligations. We lease land and buildings for certain of our Canadian manufacturing facilities under leases with varying maturities through the year 2017.
44
Operating Lease Obligations. We lease railcars, storage terminals, computer equipment, automobiles and warehouse and office space under non-cancelable operating leases with varying maturities through the year 2017. We did not have significant capital lease obligations as of December 31, 2010.
Expected Pension Contributions. Pension funding represents the projected minimum required contributions based on current assumptions for the Georgia Gulf Corporation Retirement Plan in accordance with the Employee Retirement Income Security Act. Contributions for the U.S Supplemental Executive Retirement Agreements, and the Canadian Royal Polymers Limited Pension Plan are also included. The payment during 2011 assumes full funding of the windup deficit for the Canadian Royal Polymers Limited Pension Plan. See Note 15 of the Notes to the Consolidated Financial Statements included in Item 8.
Purchase Obligations. Purchase obligations include agreements to purchase goods or services that are enforceable and legally binding and that specify all significant terms. We have certain long-term raw material supply contracts and energy purchase agreements with various terms extending through 2014. These commitments are designed to assure sources of supply for our normal requirements. Amounts are based upon contractual raw material volumes and market rates as of December 31, 2010.
Uncertain Income Tax Positions. We have recognized a liability for our unrecognized uncertain income tax positions of approximately $53.3 million as of December 31, 2010. We have included in the table above any liability for our uncertain income tax positions related to audits and other tax matters that we are likely to pay within a twelve month period. The ultimate resolution and timing of payment for remaining matters continues to be uncertain and are therefore excluded from the above table.
Asset Retirement Obligation. We have recognized a liability for the present value of cost we estimate we will incur to retire certain assets. The amount reported in the table above represents the undiscounted estimated cost to retire such assets.
Outlook
We based our 2011 operating plans on conservative macro economic assumptions regarding the main drivers of our businesses. We assume a slight recovery in U.S. housing starts and a slight weakening in Canadian housing starts, gross domestic product ("GDP") growth in both the U.S. and Canada greater than 2 percent over 2010, a continuation of favorable conditions for PVC exports, and natural gas costs similar to 2010.
In addition to the macroeconomic assumptions, we expect our sales and earnings will reflect the acquisition of Exterior Portfolio from February 9, 2011.
We expect we will invest $75 million to $85 million of capital expenditures in our businesses in 2011. In our Chlorovinyls and Aromatics segments, we expect we will make the productivity and reliability investments that are required to run the higher operating rates we expect in the coming years. In our Building Products segment, we expect to invest in productivity improvements as well as accelerating our new product development efforts ahead of the expected eventual recovery in these markets.
Inflation
The most significant component of our cost of sales is raw materials, which include basic oil-based commodities and natural gas or derivatives thereof. The costs of raw materials and natural gas are based primarily on market forces and have not been significantly affected by inflation. Inflation has not had a material impact on our sales or income from operations.
45
New Accounting Pronouncements
In January 2010, the FASB issued ASU 2010-6, Improving Disclosures about Fair Value Measurements. This ASU discusses the level of disaggregation required for each class of assets and liabilities and for fair value measurements that fall within Level 2 or 3 of the fair value hierarchy. Additionally, we have disaggregated our pension asset portfolio by each asset class. See Note 18, "Fair Value of Financial Instruments". This ASU is effective for interim and annual reporting periods beginning after December 15, 2009, except for the disclosures concerning purchases, sales, issuances and settlements in the roll forward of activity in Level 3 fair value measurements. Those disclosures are effective for fiscal years beginning after December 15, 2010, and for interim periods within those fiscal years. We are currently evaluating the impact of this statement on our consolidated financial statements.
On March 23, 2010, President Obama signed into law the Patient Protection and Affordable Care Act (the "Act"). The Act is a comprehensive health care reform bill that includes provisions for raising nearly $400 billion in revenue over ten years through tax increases on high-income individuals, excise taxes on high cost group health plans, and new fees on selected health-care-related industries. The Act eliminates the tax deduction for the portion of the prescription drug costs for which an employer receives a Medicare Part D federal subsidy (i.e., it reduces a company's tax deduction). As a result of this enacted legislation, a company may need to reduce its deferred tax asset associated with the deductible temporary differences related to its other postemployment benefit obligation. The Act did not have a material impact on our consolidated financial statements.
Critical Accounting Policies and Estimates
Critical accounting policies are those that are important to our financial condition and require management's most difficult, subjective, or complex judgments. Different amounts would be reported under different operating conditions or under alternative assumptions. We have evaluated the accounting policies used in the preparation of the accompanying consolidated financial statements and related notes and believe those policies to be reasonable and appropriate. See Note 1 of the Notes to Consolidated Financial Statements in Item 8 for a complete listing of our accounting policies. We believe the following to be our most critical accounting policies applied in the preparation of our financial statements.
Environmental and Legal Accruals. In our determination of the estimates relating to ongoing environmental costs and legal proceedings (see Note 11 of the Notes to Consolidated Financial Statements included in Item 8), we consult with our advisors (consultants, engineers and attorneys). Such consultation provides us with the information on which we base our judgments on these matters and under which we accrue an expense when it has been determined that it is probable that a liability has been incurred and the amount is reasonably estimable. While we believe that the amounts recorded in the accompanying consolidated financial statements related to these contingencies are based on the best estimates and judgments available to us, the actual outcomes could differ from our estimates. To the extent that actual outcomes differ from our estimates by 10 percent, our net income would be higher or lower by approximately $1.3 million, on an after-tax basis, depending on whether the actual outcomes were better or worse than the estimates.
Valuation of Goodwill and Other Intangible Assets. Goodwill is the excess of cost of an acquired entity over the amounts specifically assigned to assets acquired and liabilities assumed in purchase accounting for business combinations. Other identifiable intangible assets are intangible assets such as customer lists, trade names and technology that are identified during acquisitions. Our carrying value of our goodwill and indefinite lived intangible assets are tested for impairment annually on October 1 and are tested for impairment between annual impairment tests if an event occurs or circumstances change that would indicate the carrying amounts may be impaired. Indicators include, but are not limited to
46
significant declines in the markets and industries which buy our products, changes in the estimated future cash flows of our reporting units, changes in capital markets and changes in our market capitalization. Impairment testing for goodwill and indefinite lived intangible assets is a two-step test performed at a reporting unit level. The first step is to identify potential impairment by comparing the fair value of the reporting unit to the book value, including goodwill. If the fair value of the reporting unit exceeds the book value, goodwill is not considered impaired. If the book value exceeds the fair value, the second step of the process is performed to measure the amount of impairment. Our goodwill evaluations utilized discounted cash flow analyses and market multiple analyses in estimating fair value. Our weighting of the discounted cash flow and market approaches varies by each reporting unit based on factors specific to each reporting unit. Inherent in our fair value determinations are certain judgments and estimates relating to future cash flows, including interpretation of current economic indicators and market conditions, overall economic conditions and our strategic operational plans with regard to our operations. In addition, to the extent significant changes occur in market conditions, overall economic conditions or our strategic operational plan; it is possible that goodwill not currently impaired may become impaired in the future.
Inherent in our fair value determinations are certain judgments and estimates relating to future cash flows, including interpretation of current economic indicators and market conditions, overall economic conditions and our strategic operational plans with regard to our operations. A change in such assumptions may cause a change in the results of the analyses performed. In addition, to the extent significant changes occur in market conditions, overall economic conditions or our strategic operational plan; it is possible that goodwill not currently impaired may become impaired in the future. We have two segments that contain reporting units with goodwill and intangible assets. Chlorovinyls includes goodwill in our Compounding reporting unit and Building Products segment includes goodwill primarily from our Window and Door profiles reporting unit. Based on the results of our evaluation in connection with our goodwill impairment test as of October 1, 2010, we did not record an impairment charge to goodwill in 2010. The estimated fair value of the Compound reporting unit significantly exceeds the carrying value. Our Window and Door profiles reporting unit maintains a goodwill balance of $18.2 million and the estimated fair value exceeds the carrying value by approximately of 5.0%. The evaluation of this reporting unit gave no indication that an impairment of that goodwill had occurred. This was based on a discount rate of 12.4% on future cash flows, and weighting of 50% to each the income and market approaches and a gradual increase in financial performance. This evaluation assumed a modest housing market recovery to approximately 1.7 million home starts by 2015. These assumptions are based on the historical evaluation of the housing market and the specific productivity of this reporting unit. See Note 9 of the Notes to Consolidated Financial Statements included in Item 8 for further details of the 2010 goodwill and other intangible asset impairment test. We did not have any impairment to our goodwill and other intangible assets in 2010 or 2009. We recorded a non-cash impairment charge to write down goodwill and other intangible assets by $112.1 million in 2008 primarily as a result of the deteriorating North America housing and construction markets.
Valuation of Long-Lived Assets. Our long-lived assets, such as property, plant, and equipment, are reviewed for impairment whenever events or changes in circumstances indicate that the carrying amount of an asset may not be recoverable, in accordance with ASC topic 360 Property, Plant, and Equipment. Recoverability of assets to be held and used is measured by a comparison of the carrying amount of an asset to the estimated undiscounted future cash flows expected to be generated by the asset. If the carrying amount of an asset exceeds its estimated undiscounted future cash flows, an impairment charge is recognized for the amount by which the carrying amount of the asset exceeds the fair value of the asset. Our judgments regarding the existence of impairment indicators are based on legal factors, market conditions and assumptions for operational performance of our businesses. The assumptions used to estimate our future undiscounted cash flows are predominately identified from our financial forecasts. The actual impairment charge incurred could vary significantly from amounts that
47
we estimate. Additionally, future events could cause us to conclude that impairment indicators exist and that associated long-lived assets of our businesses are impaired.
There were no long-lived asset impairments during 2010. During 2009 we continued the consolidation of our Window and Door profiles plants resulting in impairments of $21.6 million.
Pension Liabilities. Accounting for employee retirement plans involves estimating the cost of benefits that are to be provided in the future and attempting to match, for each employee, that estimated cost to the period worked. To accomplish this, we make assumptions about discount rates, expected long-term rates of return on plan assets, salary increases, employee turnover and mortality rates, among others. We reevaluate all assumptions annually with our independent actuaries taking into consideration existing as well as forecasted economic conditions, and our policy and strategy with regard to the plans. We believe our estimates, the most significant of which are stated below, to be reasonable.
The discount rate reflects the rate at which pension benefit obligations could be effectively settled. We determined our discount rate by matching the expected cash flows of our pension obligations to a yield curve generated from a broad portfolio of high-quality fixed rate debt instruments. The discount rate assumption used for determining annual pension expense for our U.S. pension plans in 2010 was 5.6 percent. At December 31, 2010, this rate was 6.0 percent for determining 2011 annual pension expense for our U.S. pension plans. A 25 basis point increase or decrease in this discount rate would immaterially decrease or increase our annual pre-tax pension expense for our U.S. pension plans. In addition to the expense, a 25 basis point increase in our discount rate would decrease our year-end benefit obligations by $4.0 million, whereas a 25 basis point decrease would increase our year-end benefit obligations by $4.2 million for our U.S. pension plans.
The expected long-term rate of return on plan assets assumption is based on historical and projected rates of return for current and planned asset classes in the plan's investment portfolio. Our weighted average asset allocation as of December 31, 2010, is 66.6 percent equity securities, 20.7 percent debt securities, 1.4 percent real estate and 11.3 percent other. Assumed projected rates of return for each of the plan's projected asset classes were selected by us after analyzing historical experience and future expectations of the returns and volatility of the various asset classes. The expected long-term rate of return assumption used for determining annual pension expense for 2011 was 8.5 percent for our U.S. pension plans. At December 31, 2010, this rate was 8.66 percent for determining 2011 annual pension expense for our U.S. pension plans. A 25 basis point increase or decrease in the long-term rate of return on plan assets assumption would decrease or increase our annual pre-tax pension expense by $0.3 million for our U.S. pension plans. A 25 basis point increase or decrease in the expected long-term rate of return assumption for our foreign pension plans is not material.
Income Taxes. Income taxes are accounted for under the asset and liability method. Deferred tax assets and liabilities are recognized for the future tax consequences attributable to differences between the financial statement carrying amounts of existing assets and liabilities and their respective tax bases. Deferred tax assets and liabilities are measured using enacted tax rates expected to apply to taxable income in the years in which those temporary differences are expected to be recovered or settled. The effect on deferred tax assets and liabilities of a change in tax rates is recognized in income in the period that includes the enactment date. At December 31, 2010 and 2009, we had a net deferred tax liability balance of $174.5 million and $175.7 million, respectively.
In evaluating the ability to realize our deferred tax assets we rely principally on forecasted taxable income using historical and projected future operating results and the reversal of existing temporary differences. At December 31, 2010 and 2009, we had deferred tax assets for state tax credit carryforwards of $15.9 million and $16.1 million, respectively, which carryforward indefinitely. We believe we will achieve taxable income in the related jurisdictions in order to realize the deferred tax
48
assets for state tax credit carryforwards. In addition, at December 31, 2010 we had deferred tax assets for net operating loss carryforwards in the U.S. and Canada of $1.7 million and $23.3 million, respectively, of which we have a $15.8 million valuation allowance to record these deferred tax assets related to net operating losses at their estimated realizable values.
We released approximately $5.6 million of previously established valuation allowance attributable to certain Canadian deferred tax assets which offset our 2010, deferred income tax provision in Canada. In 2009 and 2008, we recorded a $7.3 million and $55.5 million valuation allowance, respectively, on certain deferred tax assets in Canada that, in the judgment of management, are not more likely than not to be realized. In assessing the realizability of deferred tax assets, management considers whether it is more likely than not that some or all of the deferred tax assets will not be realized. The ultimate realization of deferred tax assets depends on the generation of future taxable income during the periods in which those temporary differences are deductible. Management considers the scheduled reversal of deferred tax liabilities (including the impact of available carryback and carryforward periods), projected taxable income and tax-planning strategies available to the company in making this assessment. In order to fully realize the deferred tax assets, we will need to generate future taxable income before the expiration of the deferred tax assets governed by the tax code. Based on the level of historical cumulative losses, management believes that it is more likely than not that the company will realize the benefits of these deductible differences, net of the existing valuation allowances at December 31, 2010. As a result of the debt exchange completed in July 2009, we experienced a change in control as defined by the Internal Revenue Code. Because of this change in control, we will be unable to realize a benefit from the U.S. federal net operating loss arising before the acquisition of the Royal Group. Therefore, we no longer carry those net operating losses as a deferred tax asset. The change in control also limits our ability to realize certain expenses in the future and we have recorded deferred tax liabilities to reflect this.
In addition, we have accrued a reserve for non-income tax contingencies of $8.0 million and $8.7 million, at December 31, 2010 and 2009, respectively. The decrease in the reserve is related primarily to the settlement of a Canadian issue and the lapsing of the statute of limitations and a reduction in accrued interest related to these matters, which was partially offset by the addition of a new reserve for sales and use taxes in the U.S. We accrue for non-income tax contingencies when it is probable that a liability to a taxing authority has been incurred and the amount of the contingency can be reasonably estimated. The non-income tax contingency reserves are adjusted for, among other things, changes in facts and circumstances, receipt of tax assessments, expiration of statutes of limitations, interest and settlements and additional uncertainties.
Stock-Based Compensation. We account for share-based payments in accordance with ASC topic 718, Compensation—Stock Compensation ("ASC 718"). All share-based payments to employees and non-employee directors, including grants of stock options, restricted and deferred stock units, restricted stock and employee stock purchase rights are required to be recognized in our financial statements based on their respective grant date fair values. Under ASC 718, the fair value of each share-based payment award is estimated on the date of grant using an option-pricing model that meets certain requirements. We currently use the Black-Scholes option-pricing model to estimate the fair value of our share-based payment awards. The Black-Scholes model meets the requirements of ASC 718; however, the fair values generated by the model may not be indicative of the actual fair values of our awards as it does not consider certain factors important to our awards, such as continued employment, periodic vesting requirements and limited transferability. Future stock-based compensation expense and unearned stock-based compensation will increase to the extent that we grant additional equity awards to employees or we assume unvested equity awards in connection with acquisitions. The determination of the fair value of share-based payment awards utilizing the Black-Scholes model is affected by our stock price and a number of assumptions, including expected volatility, expected life, risk-free interest rate and expected dividends. We use the historical volatility for our stock, as we believe that historical
49
volatility is more representative than implied volatility. The expected life of the awards is based on historical and other economic data trended into the future. The risk-free interest rate assumption is based on observed interest rates appropriate for the terms of our awards. The dividend yield assumption is based on our historical dividend yield and expectation of future dividend payouts. The fair value of our restricted and deferred stock units and restricted stock are based on the fair market value of our stock on the date of grant. Forfeitures are estimated at the time of grant and revised, if necessary, in subsequent periods if actual forfeitures differ from those estimates. Stock-based compensation expense recognized in our financial statements is based on awards that are ultimately expected to vest. We evaluate the assumptions used to value our awards on a quarterly basis. If factors change and we employ different assumptions, stock-based compensation expense may differ significantly from what we have recorded in the past. If there are any modifications or cancellations of the underlying unvested securities, we may be required to accelerate, increase or cancel any remaining unearned stock-based compensation expense.
Environmental
Our operations are subject to increasingly stringent federal, state, and local laws and regulations relating to environmental quality. These regulations, which are enforced principally by USEPA and comparable state agencies, govern the management of solid hazardous waste, emissions into the air and discharges into surface and underground waters, and the manufacture of chemical substances. Our Canadian operations are subject to similar laws and regulations.
We believe that we are in material compliance with all current environmental laws and regulations. We estimate that any expenses incurred in maintaining compliance with these requirements will not materially affect earnings or cause us to exceed our level of anticipated capital expenditures. However, there can be no assurance that regulatory requirements will not change, and it is not possible to accurately predict the aggregate cost of compliance resulting from any such changes.
Item 7A. QUANTITATIVE AND QUALITATIVE DISCLOSURES ABOUT MARKET RISK.
We are subject to certain market risks related to long-term financing and related derivative financial instruments, foreign currency exchange rates and raw material commodity prices. These financial exposures are managed as an integral part of our risk management program, which seeks to reduce the potentially adverse effect that the volatility of the interest rate, exchange rate, raw material commodity and natural gas markets may have on our operating results. We do not engage in speculative transactions, nor do we hold or issue financial instruments for trading purposes.
Interest Rate Risk Management. The following table is "forward-looking" information that provides information about our debt obligations and other significant financial instruments that are sensitive to changes in interest rates. Our policy is to manage interest rates through the use of a combination of fixed and floating rate debt instruments. At times, we may utilize interest rate swap agreements to help manage our interest rate risk. As of December 31, 2010 and 2009 we had no outstanding interest rate swaps. As of December 31, 2010, our only variable rate instrument is our ABL Revolver which does not have any outstanding principal amounts. The table presents principal cash flows and related weighted average interest rates by expected maturity dates for the financial instruments.
(In thousands)
|
2011 | 2012 | 2013 | 2014 | 2015 | Thereafter | Total | Fair value at 12/31/10 |
||||||||||||||||||
|---|---|---|---|---|---|---|---|---|---|---|---|---|---|---|---|---|---|---|---|---|---|---|---|---|---|---|
Financial instruments: |
||||||||||||||||||||||||||
Fixed rate principal |
$ | — | $ | 18,038 | $ | 8,965 | $ | 13,214 | $ | — | $ | 541,856 | $ | 582,073 | $ | 604,514 | ||||||||||
Average interest rate |
— | % | 6.53 | % | 7.13 | % | 9.50 | % | — | % | 9.14 | % | 9.03 | % | ||||||||||||
50
Foreign Currency Exchange Risk Management. Our international operations require active participation in foreign exchange markets. We may or may not enter into foreign exchange forward contracts and options, and cross-currency swaps to hedge various currency exposures or create desired exposures.
Raw Materials and Natural Gas Price Risk Management. The availability and price of our raw materials and natural gas are subject to fluctuations due to unpredictable factors in global supply and demand. To reduce price risk caused by market fluctuations, from time to time, we may enter into forward swap contracts, which are generally less than one year in duration. We designate forward swap contracts with financial counter-parties as cash flow hedges. Any outstanding contracts are valued at market with the offset going to other comprehensive income, net of applicable income taxes, and any material hedge ineffectiveness is recognized in cost of goods sold. Any gain or loss is recognized in cost of goods sold in the same period or periods during which the hedged transaction affects earnings. The fair value of our natural gas swap contract was a $0.4 million and $0.3 million asset at December 31, 2010 and December 31, 2009, respectively.
We also have other long-term supply contracts for raw materials, which are at prices not in excess of market, designed to assure a source of supply and not expected to be in excess of our normal manufacturing operations requirements. Historically, we have taken physical delivery under these contracts and we intend to take physical delivery in the future.
51
Item 8. FINANCIAL STATEMENTS AND SUPPLEMENTARY DATA.
Report of Independent Registered Public Accounting Firm
To
the Board of Directors and Stockholders of
Georgia Gulf Corporation
Atlanta, Georgia
We have audited the accompanying consolidated balance sheets of Georgia Gulf Corporation and subsidiaries (the "Company") as of December 31, 2010 and 2009, and the related consolidated statements of operations, stockholders' equity, and cash flows for each of the three years in the period ended December 31, 2010. Our audits also included the financial statement schedule listed in the Index at Item 15. These financial statements and financial statement schedule are the responsibility of the Company's management. Our responsibility is to express an opinion on the financial statements and financial statement schedule based on our audits.
We conducted our audits in accordance with the standards of the Public Company Accounting Oversight Board (United States). Those standards require that we plan and perform the audit to obtain reasonable assurance about whether the financial statements are free of material misstatement. An audit includes examining, on a test basis, evidence supporting the amounts and disclosures in the financial statements. An audit also includes assessing the accounting principles used and significant estimates made by management, as well as evaluating the overall financial statement presentation. We believe that our audits provide a reasonable basis for our opinion.
In our opinion, such consolidated financial statements present fairly, in all material respects, the financial position of Georgia Gulf Corporation and subsidiaries as of December 31, 2010 and 2009, and the results of their operations and their cash flows for each of the three years in the period ended December 31, 2010, in conformity with accounting principles generally accepted in the United States of America. Also, in our opinion, such financial statement schedule, when considered in relation to the basic consolidated financial statements taken as a whole, presents fairly, in all material respects, the information set forth therein.
We have also audited, in accordance with the standards of the Public Company Accounting Oversight Board (United States), the Company's internal control over financial reporting as of December 31, 2010, based on the criteria established in Internal Control—Integrated Framework issued by the Committee of Sponsoring Organizations of the Treadway Commission and our report dated March 10, 2011 expressed an adverse opinion on the Company's internal control over financial reporting because of a material weakness.
/s/ DELOITTE & TOUCHE LLP
Atlanta,
Georgia
March 10, 2011
52
Georgia Gulf Corporation and Subsidiaries
Consolidated Balance Sheets
(In thousands, except share data)
| |
December 31, 2010 |
December 31, 2009 |
|||||||
|---|---|---|---|---|---|---|---|---|---|
Assets |
|||||||||
Cash and cash equivalents |
$ | 122,758 | $ | 38,797 | |||||
Receivables, net of allowance for doubtful accounts of $10,026 in 2010 and $16,453 in 2009 |
267,662 | 208,941 | |||||||
Inventories |
261,235 | 251,397 | |||||||
Prepaid expenses |
16,606 | 24,002 | |||||||
Income tax receivable |
899 | 30,306 | |||||||
Deferred income taxes |
7,266 | 13,177 | |||||||
Total current assets |
676,426 | 566,620 | |||||||
Property, plant and equipment, net |
653,137 | 687,570 | |||||||
Goodwill |
209,631 | 203,809 | |||||||
Intangible assets, net of accumulated amortization of $11,997 in 2010 and $10,996 in 2009 |
14,351 | 15,223 | |||||||
Deferred income taxes |
8,078 | — | |||||||
Other assets |
89,927 | 116,494 | |||||||
Non-current assets held for sale |
14,151 | 14,924 | |||||||
Total assets |
$ | 1,665,701 | $ | 1,604,640 | |||||
Liabilities and Stockholders' Equity |
|||||||||
Current portion of long-term debt |
$ | 22,132 | $ | 28,231 | |||||
Accounts payable |
132,639 | 124,829 | |||||||
Interest payable |
22,558 | 2,844 | |||||||
Income taxes payable |
2,910 | 1,161 | |||||||
Accrued compensation |
38,382 | 16,069 | |||||||
Liability for unrecognized income tax benefits and other tax reserves |
8,822 | 9,529 | |||||||
Other accrued liabilities |
48,536 | 43,236 | |||||||
Total current liabilities |
275,979 | 225,899 | |||||||
Long-term debt |
667,810 | 710,774 | |||||||
Liability for unrecognized income tax benefits |
46,884 | 48,471 | |||||||
Deferred income taxes |
189,805 | 188,910 | |||||||
Other non-current liabilities |
40,631 | 37,036 | |||||||
Total liabilities |
1,221,109 | 1,211,090 | |||||||
Commitments and contingencies (Note 11) |
|||||||||
Stockholders' equity: |
|||||||||
Preferred stock—$0.01 par value; 75,000,000 shares authorized; no shares issued |
— | — | |||||||
Common stock—$0.01 par value; 100,000,000 shares authorized; issued and outstanding: 33,962,291 in 2010 and 33,718,367 in 2009 |
340 | 337 | |||||||
Additional paid-in capital |
476,276 | 472,018 | |||||||
Accumulated other comprehensive loss, net of tax |
(210 | ) | (4,314 | ) | |||||
Accumulated deficit |
(31,814 | ) | (74,491 | ) | |||||
Total stockholders' equity |
444,592 | 393,550 | |||||||
Total liabilities and stockholders' equity |
$ | 1,665,701 | $ | 1,604,640 | |||||
See accompanying notes to consolidated financial statements.
53
Georgia Gulf Corporation and Subsidiaries
Consolidated Statements of Operations
(In thousands)
| |
Year Ended December 31, | |||||||||||
|---|---|---|---|---|---|---|---|---|---|---|---|---|
| |
2010 | 2009 | 2008 | |||||||||
Net sales |
$ | 2,818,040 | $ | 1,990,091 | $ | 2,916,477 | ||||||
Operating costs and expenses: |
||||||||||||
Cost of sales |
2,543,638 | 1,778,998 | 2,717,409 | |||||||||
Selling, general and administrative expenses |
160,031 | 182,937 | 168,572 | |||||||||
Long-lived asset impairment charges |
— | 21,804 | 175,201 | |||||||||
Restructuring costs |
102 | 6,858 | 21,973 | |||||||||
Losses (gains) on sale of assets |
— | 62 | (27,282 | ) | ||||||||
Total operating costs and expenses |
2,703,771 | 1,990,659 | 3,055,873 | |||||||||
Operating income (loss) |
114,269 | (568 | ) | (139,396 | ) | |||||||
Interest expense |
(69,795 | ) | (131,102 | ) | (134,513 | ) | ||||||
Loss on debt modification and extinguishment, net |
— | (42,797 | ) | — | ||||||||
Gain on debt exchange |
— | 400,835 | — | |||||||||
Foreign exchange loss |
(839 | ) | (1,400 | ) | (4,264 | ) | ||||||
Interest income |
322 | 583 | 1,308 | |||||||||
Income (loss) before income taxes |
43,957 | 225,551 | (276,865 | ) | ||||||||
Provision (benefit) for income taxes |
1,279 | 94,492 | (21,695 | ) | ||||||||
Net income (loss) |
$ | 42,678 | $ | 131,059 | $ | (255,170 | ) | |||||
Earnings (loss) per share: |
||||||||||||
Basic |
$ | 1.22 | $ | 8.27 | $ | (191.21 | ) | |||||
Diluted |
$ | 1.22 | $ | 8.26 | $ | (191.21 | ) | |||||
Weighted average common shares outstanding: |
||||||||||||
Basic |
33,825 | 14,903 | 1,378 | |||||||||
Diluted |
33,825 | 14,908 | 1,378 | |||||||||
See accompanying notes to consolidated financial statements.
54
Georgia Gulf Corporation and Subsidiaries
Consolidated Statements of Stockholders' Equity (Deficit)
(In thousands)
| |
Common Stock Shares |
Amount | Additional Paid-In Capital |
Retained Earnings (deficit) |
Accumulated Other Comprehensive Income (loss) |
Total Stockholders' Equity (deficit) |
|||||||||||||
|---|---|---|---|---|---|---|---|---|---|---|---|---|---|---|---|---|---|---|---|
Balance, January 1, 2008 |
1,376 | $ | 14 | $ | 103,568 | $ | 55,209 | $ | 57,182 | $ | 215,973 | ||||||||
Comprehensive loss: |
|||||||||||||||||||
Net loss |
— | — | — | (255,170 | ) | — | (255,170 | ) | |||||||||||
Pension liability adjustment including effect of ASC topic 715, net of taxes of $16,519 |
— | — | — | — | (23,113 | ) | (23,113 | ) | |||||||||||
Foreign currency translation adjustments, net of taxes of $30,907 |
— | — | — | — | (54,760 | ) | (54,760 | ) | |||||||||||
Unrealized gain on derivatives, net of tax of $609 |
— | — | — | — | 1,009 | 1,009 | |||||||||||||
Total comprehensive loss |
— | — | — | — | — | (332,034 | ) | ||||||||||||
Employee stock purchase and stock compensation plans, net of forfeitures |
4 | 1 | 3,301 | — | — | 3,302 | |||||||||||||
Retirement of common stock associated with stock compensation plans |
(1 | ) | — | (110 | ) | — | — | (110 | ) | ||||||||||
Tax benefit (deficiency) from stock purchase and stock compensation plans |
— | — | (945 | ) | — | — | (945 | ) | |||||||||||
Dividends |
— | — | — | (5,589 | ) | — | (5,589 | ) | |||||||||||
Balance, December 31, 2008 |
1,379 | 14 | 105,815 | (205,550 | ) | (19,682 | ) | (119,403 | ) | ||||||||||
Comprehensive income: |
|||||||||||||||||||
Net income |
— | — | — | 131,059 | — | 131,059 | |||||||||||||
Pension liability adjustment including effect of ASC Topic 715, net of taxes of $419 |
— | — | — | — | (4,469 | ) | (4,469 | ) | |||||||||||
Foreign currency translation adjustments, net of taxes of $22,388 |
— | — | — | — | 18,016 | 18,016 | |||||||||||||
Unrealized gain on derivatives, net of tax of $1,105 |
— | — | — | — | 1,821 | 1,821 | |||||||||||||
Total comprehensive income |
— | — | — | — | — | 146,427 | |||||||||||||
Preferred stock issued and converted to common stock |
31,582 | 316 | 357,237 | — | — | 357,553 | |||||||||||||
Employee stock purchase and stock compensation plans, net of forfeitures |
1,154 | 12 | 17,650 | — | — | 17,662 | |||||||||||||
Retirement of common stock associated with stock compensation plans |
(397 | ) | (4 | ) | (7,153 | ) | — | — | (7,157 | ) | |||||||||
Tax benefit (deficiency) from stock purchase and stock compensation plans |
— | — | (1,532 | ) | — | — | (1,532 | ) | |||||||||||
Dividends |
— | — | — | — | — | — | |||||||||||||
Balance, December 31, 2009 |
33,718 | 337 | 472,018 | (74,491 | ) | (4,314 | ) | 393,550 | |||||||||||
Comprehensive income: |
|||||||||||||||||||
Net income |
— | — | — | 42,678 | — | 42,678 | |||||||||||||
Pension liability adjustment including effect of ASC Topic 715, net of taxes of $1,543 |
— | — | — | — | (4,264 | ) | (4,264 | ) | |||||||||||
Foreign currency translation adjustments, net of taxes of $8,772 |
— | — | — | — | 8,264 | 8,264 | |||||||||||||
Unrealized gain on derivatives, net of tax of $64 |
— | — | — | — | 104 | 104 | |||||||||||||
Total comprehensive income |
— | — | — | — | — | 46,782 | |||||||||||||
Fees paid to issue common stock |
— | — | (145 | ) | — | — | (145 | ) | |||||||||||
Employee stock purchase and stock compensation plans, net of forfeitures |
372 | 4 | 3,484 | — | — | 3,488 | |||||||||||||
Retirement of common stock associated with stock compensation plans |
(128 | ) | (1 | ) | (1,947 | ) | — | — | (1,948 | ) | |||||||||
Tax benefit (deficiency) from stock purchase and stock compensation plans |
— | — | 2,866 | — | — | 2,866 | |||||||||||||
Dividends |
— | — | — | — | — | — | |||||||||||||
Balance, December 31, 2010 |
33,962 | $ | 340 | $ | 476,276 | $ | (31,814 | ) | $ | (210 | ) | $ | 444,592 | ||||||
See accompanying notes to consolidated financial statements.
55
Georgia Gulf Corporation and Subsidiaries
Consolidated Statements of Cash Flows
(In thousands)
| |
Year Ended December 31, | |||||||||||
|---|---|---|---|---|---|---|---|---|---|---|---|---|
| |
2010 | 2009 | 2008 | |||||||||
Operating activities: |
||||||||||||
Net income (loss) |
$ | 42,678 | $ | 131,059 | $ | (255,170 | ) | |||||
Adjustments to reconcile net income (loss) to net cash provided by operating activities: |
||||||||||||
Depreciation and amortization |
99,691 | 117,690 | 143,718 | |||||||||
Loss on debt modification and extinguishment, net |
— | 42,797 | — | |||||||||
Gain on debt exchange |
— | (400,835 | ) | — | ||||||||
Accretion of fair value discount on term loan |
— | 12,944 | — | |||||||||
Foreign exchange gain |
(738 | ) | (938 | ) | 7,108 | |||||||
Deferred income taxes |
(1,964 | ) | 116,668 | (23,435 | ) | |||||||
Tax deficiency related to stock plans |
(4,001 | ) | (1,630 | ) | (945 | ) | ||||||
Long-lived asset impairment charges |
— | 21,866 | 175,201 | |||||||||
Stock based compensation |
3,487 | 17,663 | 3,302 | |||||||||
Loss (gains) on sale of assets |
— | 218 | (27,282 | ) | ||||||||
Other non-cash items |
19,646 | 762 | 10,717 | |||||||||
Change in operating assets and liabilities: |
||||||||||||
Receivables |
(25,454 | ) | 2,362 | 117,591 | ||||||||
Securitization of trade receivables |
— | (111,000 | ) | (36,000 | ) | |||||||
Inventories |
(4,860 | ) | 1,112 | 97,704 | ||||||||
Prepaid expenses and other current assets |
7,654 | (5,371 | ) | (2,472 | ) | |||||||
Accounts payable |
17,485 | 5,462 | (117,437 | ) | ||||||||
Interest payable |
19,742 | 40,397 | (1,637 | ) | ||||||||
Accrued income taxes |
1,685 | (2,493 | ) | 8,603 | ||||||||
Accrued compensation |
22,733 | 5,261 | (20,996 | ) | ||||||||
Other accrued liabilities |
2,543 | (6,255 | ) | (31,627 | ) | |||||||
Other |
(16,528 | ) | 12,984 | (5,551 | ) | |||||||
Net cash provided by operating activities |
183,799 | 723 | 41,392 | |||||||||
Investing activities: |
||||||||||||
Proceeds from insurance recoveries related to property, plant and equipment |
— | 1,980 | 7,308 | |||||||||
Capital expenditures |
(45,714 | ) | (30,085 | ) | (62,545 | ) | ||||||
Proceeds from sale of assets |
1,069 | 2,080 | 79,806 | |||||||||
Net cash (used in) provided by investing activities |
(44,645 | ) | (26,025 | ) | 24,569 | |||||||
Financing activities: |
||||||||||||
Borrowings on revolving line of credit |
— | 254,301 | 1,005,904 | |||||||||
Repayments on revolving line of credit |
— | (389,523 | ) | (898,186 | ) | |||||||
Borrowings on ABL revolver |
482,208 | 56,462 | — | |||||||||
Repayments on ABL revolver |
(538,561 | ) | — | — | ||||||||
Long-term debt payments |
(37 | ) | (367,402 | ) | (74,004 | ) | ||||||
Long-term debt proceeds |
— | 496,739 | — | |||||||||
Fees paid to amend or issue debt facilities and equity |
(3,330 | ) | (79,749 | ) | (9,823 | ) | ||||||
Tax benefits from employee share-based exercises |
4,001 | 98 | — | |||||||||
Stock compensation plan activity |
— | (25 | ) | (110 | ) | |||||||
Dividends |
— | — | (8,379 | ) | ||||||||
Net cash (used in) provided by financing activities |
(55,719 | ) | (29,099 | ) | 15,402 | |||||||
Effect of exchange rate changes on cash and cash equivalents |
526 | 3,223 | (615 | ) | ||||||||
Net change in cash and cash equivalents |
83,961 | (51,178 | ) | 80,748 | ||||||||
Cash and cash equivalents at beginning of period |
38,797 | 89,975 | 9,227 | |||||||||
Cash and cash equivalents at end of period |
$ | 122,758 | $ | 38,797 | $ | 89,975 | ||||||
See accompanying notes to consolidated financial statements.
56
Georgia Gulf Corporation and Subsidiaries
Notes to Consolidated Financial Statements
1. SUMMARY OF SIGNIFICANT ACCOUNTING POLICIES AND NATURE OF BUSINESS
Principles of Consolidation. The consolidated financial statements include the accounts of Georgia Gulf Corporation and its wholly-owned subsidiaries. All significant intercompany balances and transactions have been eliminated in consolidation.
Nature of Operations. We are a leading North American manufacturer and an international marketer of chlorovinyl and aromatic chemicals and also manufacture and market vinyl-based building and home improvement products. Our chlorovinyl and aromatic chemicals products are sold for further processing into a wide variety of end-use applications, including plastic pipe and pipe fittings, siding and window frames, bonding agents for wood products, high-quality plastics, acrylic sheeting and coatings for wire and cable. Our building products segment manufacturers window and door profiles, mouldings, siding, pipe and pipe fittings and deck, fence, and rail products and markets vinyl-based building and home improvement products under the Royal Group brand names.
Use of Estimates. Management is required to make estimates and assumptions that affect amounts reported in the financial statements and accompanying notes prepared in conformity with accounting principles generally accepted in the United States of America. Actual results could differ from those estimates.
Foreign Currency Translation and Transactions. Our subsidiaries that operate outside the United States use their local currency as the functional currency. The functional currency is translated into U.S. dollars for balance sheet accounts using the month end exchange rates in effect as of the balance sheet date and the average exchange rate for revenues and expenses for each respective period. The translation adjustments are deferred as a separate component of stockholders' equity, within accumulated other comprehensive income (loss), net of tax where applicable. Gains or losses resulting from transactions denominated in foreign currencies are reported in the same financial statement captions as the underlying transactions in the consolidated statements of operations. We recorded a gain of $2.7 million, and losses of $1.1 million and $2.3 million, in fiscal years 2010, 2009, and 2008, respectively, within operating income (loss) in the consolidated statements of operations. The year over year fluctuation in transaction related gains or (losses) is due to both the volume of foreign currency denominated transactions and the volatility in the underlying exchange rates.
Cash and Cash Equivalents. Marketable securities that are highly liquid with an original maturity of 90 days or less are considered to be the equivalent of cash for purposes of financial statement presentation.
Accounts Receivable and Allowance for Doubtful Accounts. We grant credit to customers under credit terms that are customary in the industry and based on the creditworthiness of the customer and generally do not require collateral. We also provide allowances for cash discounts and doubtful accounts based on contract terms, historical collection experience, periodic evaluations of the aging of the accounts receivable and specific collectability analysis.
Revenue Recognition. We recognize revenue in accordance with generally accepted accounting principles as outlined in the Financial Accounting Standards Board's ("FASB") Accounting Standard Codification ("ASC" or "Codification") topic 605, Revenue Recognition , which requires that four basic criteria be met before revenue can be recognized: (i) persuasive evidence of an arrangement exists; (ii) the price is fixed or determinable; (iii) collectability is reasonably assured; and (iv) product delivery
57
Georgia Gulf Corporation and Subsidiaries
Notes to Consolidated Financial Statements (Continued)
1. SUMMARY OF SIGNIFICANT ACCOUNTING POLICIES AND NATURE OF BUSINESS (Continued)
has occurred. We recognize revenue as products are shipped based on free on board ("FOB") terms when title passes to customers, and the customer takes ownership and assumes risk of loss.
Sales Incentives. We offer sales incentives, primarily in the form of volume rebates, slotting fees and advertising allowances to our customers, which are classified as a reduction of net sales and are calculated based on contractual terms of customer contracts. We accrue for these sales incentives based on contract terms and historical experience.
Shipping Costs. All amounts billed to a customer in a sale transaction related to shipping are classified as revenue. Shipping fees billed to customers and included in sales and cost of goods sold were $74.4 million in 2010, $62.0 million in 2009, and $74.0 million in 2008.
Advertising Costs. Advertising costs and promotion expenses generally relate to our vinyl-based building and home improvement products marketed under the Royal Group brand names and are charged to earnings during the period in which they are incurred. Advertising and promotion expenses are included in selling, general and administrative expenses and were $6.4 million, $5.7 million, and $8.3 million, in 2010, 2009, and 2008, respectively.
Inventories. Inventories are valued at the lower of cost or market. Cost is determined using the first-in, first-out method for the majority of inventory and the weighted average cost method for the remainder. Costs include raw materials, direct labor and manufacturing overhead. Market is based on current replacement cost for raw materials and supplies and on net realizable value for finished goods.
Property, Plant and Equipment. Property, plant and equipment are stated at cost. Maintenance and repairs are charged to expense as incurred, and major renewals and improvements are capitalized. Interest expense attributable to funds used in financing the construction of major plant and equipment is capitalized. Interest expense capitalized during 2010, 2009, and 2008 was $0.5 million, $1.0 million, and $0.4 million, respectively. Depreciation is computed using the straight-line method over the estimated useful lives of the assets. Depreciation expense totaled approximately $90.5 million, $98.5 million, and $128.2 million, for the years ended December 31, 2010, 2009, and 2008, respectively. The estimated useful lives of our assets are as follows:
Buildings |
27-30 years | |
Land improvements |
15 years | |
Machinery and equipment |
2-15 years | |
Dies and moulds |
3-5 years | |
Office furniture and equipment |
2-10 years | |
Computer equipment and software |
3-10 years |
Asset Retirement Obligation. We account for asset retirement obligations in accordance with ASC topic 410 sub-topic 20, Asset Retirement Obligations, which requires the fair value of a liability for an asset retirement obligation be recognized in the period in which it is incurred and capitalized as part of the carrying amount of the long-lived asset. When a liability is initially recorded, we capitalize the cost by increasing the carrying value of the related long-lived asset. The liability is accreted to its future value each period, and the capitalized cost is depreciated over the estimated useful life of the related asset. Upon settlement of the liability, a gain or loss is recorded. We had $2.6 million and $2.3 million
58
Georgia Gulf Corporation and Subsidiaries
Notes to Consolidated Financial Statements (Continued)
1. SUMMARY OF SIGNIFICANT ACCOUNTING POLICIES AND NATURE OF BUSINESS (Continued)
of asset retirement obligations recorded in other non-current liabilities in the consolidated balance sheets as of December 31, 2010 and 2009, respectively.
Other Assets. Other assets primarily consist of advances for long-term raw materials purchase contracts (see Note 11), our investment in joint ventures (see Notes 8 and 12) and unamortized debt issuance costs (see Note 8). Advances for long-term raw materials purchase contracts are being amortized as additional raw materials costs over the life of the related contracts in proportion to raw materials delivery or related contract terms. Debt issuance costs are amortized to interest expense using the effective interest rate and straight-line methods over the term of the related debt instruments.
Goodwill and Other Intangible Assets. We account for our goodwill and other intangible assets in accordance with ASC topic 350, Intangibles—Goodwill and Other. Goodwill is the excess of cost of an acquired entity over the amounts specifically assigned to assets acquired and liabilities assumed in purchase accounting for business combinations. Our other identifiable intangible assets include customer lists, trade names and purchased technology. We test the carrying value of our goodwill and other intangible assets with indefinite lives for impairment on an annual basis on October 1. The carrying value will be tested for impairment between annual impairment tests if an event occurs or circumstances change that would indicate the carrying amount may be impaired. Indicators include, but are not limited to, significant declines in the markets and industries that buy our products, changes in the estimated future cash flows of our reporting units, changes in capital markets and changes in our market capitalization. Impairment testing for goodwill and indefinite lived intangible assets is a two-step process performed at a reporting unit level. Our reporting units subject to such testing are window and door profiles; mouldings; deck, fence and rail products and compounds (vinyl and additives). An impairment loss may be recognized when the carrying amount of the reporting unit's net assets exceeds the estimated fair value of the reporting unit. Intangible assets with definite lives are amortized on a straight-line basis over their estimated useful lives. See Note 9 for a summary of goodwill and other intangible assets by reportable segment.
Long-Lived Assets. Our long-lived assets, such as property, plant, and equipment, and intangible assets with definite lives are analyzed for impairment whenever events or changes in circumstances indicate that the carrying amount of an asset may not be recoverable. Recoverability of assets to be held and used is measured by a comparison of the carrying amount of an asset to the estimated undiscounted cash flows over the remaining life of the asset. If the carrying amount of an asset exceeds estimated fair value of the asset, an impairment charge is recognized for the amount by which the carrying amount of the asset exceeds the estimated fair value of the asset based on discounted cash flows. Assets to be disposed of would be recorded at the lower of the carrying amount or fair value less costs to sell and no longer depreciated.
Pension Plans and Other Postretirement Benefit Plans. We have defined contribution pension plans covering substantially all of our employees. In addition, we have two defined benefit pension plans. For the defined benefit pension plans, the benefits are based on years of service and the employee's compensation. Our postretirement benefit plan was terminated and paid out during 2009. Our Canadian defined benefit plan is being fully funded in early 2011 to allow benefits to be settled. Our policy on funding the defined benefit plans is to contribute an amount within the range of the minimum required and the maximum tax-deductible contribution. Accounting for employee retirement
59
Georgia Gulf Corporation and Subsidiaries
Notes to Consolidated Financial Statements (Continued)
1. SUMMARY OF SIGNIFICANT ACCOUNTING POLICIES AND NATURE OF BUSINESS (Continued)
plans involves estimating the cost of benefits that are to be provided in the future and attempting to match, for each employee, that estimated cost to the period worked. To accomplish this, we make assumptions about discount rates, expected long-term rates of return on plan assets, salary increases and employee turnover and mortality, among others. We reevaluate all assumptions annually with our independent actuaries taking into consideration existing as well as forecasted economic conditions, and our policy and strategy with regard to the plans. As of March 31, 2009, we suspended any further benefits associated with the defined benefit plans. As of December 31, 2010, this benefit remained frozen. Company contributions to our defined contribution plans were suspended in July 2009 and reinstated in July 2010.
Income Taxes. Income taxes are accounted for under the asset and liability method. Deferred tax assets and liabilities are recognized for the future tax consequences attributable to differences between the financial statement carrying amounts of existing assets and liabilities and their respective tax bases. Deferred tax assets and liabilities are measured using enacted tax rates expected to apply to taxable income in the years in which those temporary differences are expected to be recovered or settled. The effect on deferred tax assets and liabilities of a change in tax rates is recognized in income in the period that includes the enactment date. We account for uncertain tax positions in accordance with ASC topic 740, Accounting for Income Taxes.
Self-Insurance Accruals. We are self-insured up to certain limits for costs associated with workers' compensation and employee group medical coverage. Liabilities for insurance claims and reserves include accruals of estimated settlements for known claims, as well as accruals of estimates of incurred, but not reported claims. These accruals are included in other current liabilities in the accompanying consolidated balance sheets. We also use information provided by independent consultants to assist in the determination of estimated accruals. In estimating these costs, we consider historical loss experience and make judgments about the expected levels of costs per claim.
Warranty Costs. We provide warranties for certain building and home improvement products against defects in material, performance and workmanship. We accrue for warranty claims at the time of sale based on historical warranty claims experience. Our warranty liabilities are included in other accrued liabilities in the consolidated balance sheets. Activity in our warranty liabilities for the years ended December 31, 2010, 2009, and 2008 is as follows:
In thousands
|
2010 | 2009 | 2008 | |||||||
|---|---|---|---|---|---|---|---|---|---|---|
January 1, |
$ | 7,368 | $ | 7,498 | $ | 12,160 | ||||
Warranty provisions |
2,114 | 3,005 | 2,189 | |||||||
Foreign currency translation |
334 | 896 | (1,659 | ) | ||||||
Warranty claims paid |
(3,256 | ) | (4,031 | ) | (5,192 | ) | ||||
December 31, |
$ | 6,560 | $ | 7,368 | $ | 7,498 | ||||
Derivative Financial Instruments. Derivatives that are not hedges must be adjusted to fair value through earnings in accordance with ASC topic 815, Derivatives and Hedging. If the derivative is a hedge, depending on the nature of the hedge, changes in its fair value are either offset against the change in fair value of assets, liabilities, or firm commitments through earnings or recognized in other
60
Georgia Gulf Corporation and Subsidiaries
Notes to Consolidated Financial Statements (Continued)
1. SUMMARY OF SIGNIFICANT ACCOUNTING POLICIES AND NATURE OF BUSINESS (Continued)
comprehensive income until the hedged item is recognized in earnings. We engage in activities that expose us to market risks, including the effects of changes in interest rates, foreign currency and changes in commodity prices. Financial exposures are managed as an integral part of our risk management program, which seeks to reduce the potentially adverse effect that the volatility of the interest rate, foreign currency, and commodity markets may have on operating results. We do not engage in speculative transactions nor do we hold or issue financial instruments for trading purposes.
We formally document all hedging instruments and hedging transactions, as well as our risk management objective and strategy for undertaking hedged transactions. This process includes linking all derivatives that are designated as fair value and cash flow hedges to specific assets or liabilities on the consolidated balance sheet or to forecasted transactions. We also formally assess, both at inception and on an ongoing basis, whether the derivatives that are used in hedging transactions are highly effective in offsetting changes in fair value or cash flows of hedged transactions. When it is determined that a derivative is not highly effective or the derivative expires or is sold, terminated, exercised, or discontinued because it is unlikely that a forecasted transaction will occur, we discontinue the use of hedge accounting for that specific hedge instrument.
Litigation. In the normal course of business, we are involved in legal proceedings. We accrue a liability for such matters when it is probable that a material liability has been incurred and the amount can be reasonably estimated. The accrual for a litigation loss contingency might include, for example, estimates of potential damages, outside legal fees and other directly related costs expected to be incurred.
Environmental Expenditures. Environmental expenditures related to current operations or future revenues are expensed or capitalized consistent with our capitalization policy. Expenditures that relate to an existing condition caused by past operations and that do not contribute to future revenues are expensed in the period incurred. Liabilities are recognized when material environmental assessments or cleanups are probable and the costs can be reasonably estimated.
Accumulated Other Comprehensive loss. Accumulated other comprehensive loss includes foreign currency translation of assets and liabilities of foreign subsidiaries, effects of exchange rate changes on intercompany balances of a long-term nature, unrealized gains and losses on derivative financial instruments designated as cash flow hedges, and adjustments to pension liabilities as required by ASC topic 715. Amounts recorded in accumulated other comprehensive loss, net of tax, on the consolidated statements of stockholders' equity as of December 31, 2010 and 2009 are as follows:
| |
December 31, | |||||||
|---|---|---|---|---|---|---|---|---|
In thousands
|
2010 | 2009 | ||||||
Unrealized gain on derivative contracts |
$ | 264 | $ | 160 | ||||
Pension liability adjustment including affect of ASC topic 715 |
(27,641 | ) | (23,377 | ) | ||||
Currency translation adjustment |
27,167 | 18,903 | ||||||
Total accumulated other comprehensive loss, net of tax |
$ | (210 | ) | $ | (4,314 | ) | ||
Stock-Based Compensation. Stock based compensation is accounted for in accordance with ASC topic 718, Compensation-Stock Compensation. ASC topic 718 requires all share-based payments to
61
Georgia Gulf Corporation and Subsidiaries
Notes to Consolidated Financial Statements (Continued)
1. SUMMARY OF SIGNIFICANT ACCOUNTING POLICIES AND NATURE OF BUSINESS (Continued)
employees, including grants of employee stock options, restricted stock, restricted stock units and non-employee director deferred shares and restricted stock units to be recognized in the financial statements based on their fair values at the grant date.
ASC topic 718 required the elimination of unearned compensation (contra-equity account) related to earlier awards against the appropriate equity accounts, additional paid-in capital, in our circumstance. ASC topic 718 requires tax benefits relating to excess share-based compensation deductions to be prospectively presented in the statements of cash flows as a financing activity cash inflow.
Earnings (Loss) Per Share. We calculate earnings per share in accordance with ASC subtopic 260-10, Earnings per Share, using the two-class method. The two-class method requires that share-based awards with non-forfeitable dividends be classified as participating securities. In calculating basic earnings per share, this method requires net income to be reduced by the amount of dividends declared in the current period for each participating security and by the contractual amount of dividends or other participation payments that are paid or accumulated for the current period. Undistributed earnings for the period are allocated to participating securities based on the contractual participation rights of the security to share in those current earnings assuming all earnings for the period are distributed. Recipients of our restricted stock awards have contractual participation rights that are equivalent to those of common stockholders. Therefore, we allocate undistributed earnings to holders of restricted stock and common stocks based on their respective ownership percentage, as of the end of the period.
The two-class method also requires the denominator to include the weighted average number of shares of restricted stock when calculating basic earnings per share. Diluted earnings per share also include the additional share equivalents from the assumed conversion of stock options calculated using the treasury stock method, subject to the anti-dilution provisions of ASC subtopic 260-10. The two-class method has been retroactively applied for all periods presented.
In computing diluted earnings per share for the years ended December 31, 2010 and 2009, options to purchase 0.2 million shares, respectively, were not included due to their anti-dilutive effect. In computing diluted loss per share for the year ended December 31, 2008, all common stock equivalents were excluded as a result of their anti-dilutive effect.
62
Georgia Gulf Corporation and Subsidiaries
Notes to Consolidated Financial Statements (Continued)
1. SUMMARY OF SIGNIFICANT ACCOUNTING POLICIES AND NATURE OF BUSINESS (Continued)
Computations of basic and diluted earnings (loss) per share are presented in the following table:
Basic and Diluted Earnings (Loss) Per Share—Two-class Method
| |
Year ended December 31, | ||||||||||
|---|---|---|---|---|---|---|---|---|---|---|---|
In thousands, except per share data
|
2010 | 2009 | 2008 (a) | ||||||||
Basic Earnings (loss) per share |
|||||||||||
Undistributed income (loss) |
$ | 42,678 | $ | 131,059 | $ | (263,550 | ) | ||||
Restricted stock ownership |
3 | % | 6 | % | — | % | |||||
Restricted stock interest on undistributed income |
$ | 1,294 | $ | 7,869 | $ | — | |||||
Weighted average restricted shares—Basic |
1,058 | 952 | 16 | ||||||||
Total restricted stockholders' basic earnings per share |
$ | 1.22 | $ | 8.27 | $ | — | |||||
Undistributed income (loss) |
$ | 42,678 | $ | 131,059 | $ | (263,550 | ) | ||||
Common stock ownership |
97 | % | 94 | % | 100 | % | |||||
Common stockholders' interest in undistributed income (loss) |
$ | 41,384 | $ | 123,190 | $ | (263,550 | ) | ||||
Weighted average common shares—Basic |
33,825 | 14,903 | 1,378 | ||||||||
Total common stockholders' basic earnings (loss) per share |
$ | 1.22 | $ | 8.27 | $ | (191.21 | ) | ||||
Total basic earnings (loss) per share |
$ | 1.22 | $ | 8.27 | $ | (191.21 | ) | ||||
Diluted earnings (loss) per share |
|||||||||||
Undistributed income (loss) |
$ | 42,678 | $ | 131,059 | $ | (263,550 | ) | ||||
Deduct: Undistributed earnings—restricted stock |
$ | 1,294 | 7,869 | — | |||||||
Common stockholders' interest in undistributed income (loss) used in diluted earnings per share |
$ | 41,384 | $ | 123,190 | $ | (263,550 | ) | ||||
Weighted average common shares—Basic |
33,825 | 14,903 | 1,378 | ||||||||
Stock options |
— | 5 | — | ||||||||
Weighted average common shares—Diluted |
33,825 | 14,908 | 1,378 | ||||||||
Total diluted earnings (loss) per share |
$ | 1.22 | $ | 8.26 | $ | (191.21 | ) | ||||
- (a)
- In accordance with ASC subtopic 260-10, undistributed losses have been entirely allocated to the common stockholders and corresponding common stockholders basic and diluted loss per share due to the fact that the restricted stock owners are not contractually obligated to share in the losses of the Company.
On July 28, 2009, we effected a 1-for-25 reverse stock split of our common stock. This reverse stock split has been reflected in share data and earnings per share data contained herein for all periods presented. The par value of the common stock was not affected by the reverse stock split and remains at $0.01 per share. Consequently, on the Company's consolidated balance sheets and consolidated statements of stockholders' equity (deficit), the aggregate par value of the issued common stock was reduced by reclassifying the par value amount of the eliminated shares of common stock to additional paid-in capital. On July 29, 2009, in connection with the debt for equity exchange, we issued
63
Georgia Gulf Corporation and Subsidiaries
Notes to Consolidated Financial Statements (Continued)
1. SUMMARY OF SIGNIFICANT ACCOUNTING POLICIES AND NATURE OF BUSINESS (Continued)
approximately 1.3 million common shares and approximately 30.2 million convertible preferred shares to our bond holders that tendered their notes (See Note 10, Long-Term Debt for description of the debt for equity exchange). These common shares are included in the years ended December 31, 2010 and 2009 earnings per share on a weighted average basis from the date of issuance. On September 17, 2009, the convertible preferred shares were converted to common shares. The preferred shares that converted to common shares were eligible to participate in dividends that we issue and thus were treated as common share equivalents from the period issued until the date they formally converted to common shares in the calculations above.
2. NEW ACCOUNTING PRONOUNCEMENTS
In January 2010, the FASB issued ASU 2010-6, Improving Disclosures about Fair Value Measurements. This ASU discusses the level of disaggregation required for each class of assets and liabilities and for fair value measurements that fall within Level 2 or 3 of the fair value hierarchy. Additionally, we have disaggregated our pension asset portfolio by each asset class. See Note 18, "Fair Value of Financial Instruments". This ASU is effective for interim and annual reporting periods beginning after December 15, 2009, except for the disclosures concerning purchases, sales, issuances and settlements in the roll forward of activity in Level 3 fair value measurements. Those disclosures are effective for fiscal years beginning after December 15, 2010, and for interim periods within those fiscal years. We are currently evaluating the impact of this statement on our consolidated financial statements.
On March 23, 2010, President Obama signed into law the Patient Protection and Affordable Care Act (the "Act"). The Act is a comprehensive health care reform bill that includes provisions for raising nearly $400 billion in revenue over ten years through tax increases on high-income individuals, excise taxes on high cost group health plans, and new fees on selected health-care-related industries. The Act eliminates the tax deduction for the portion of the prescription drug costs for which an employer receives a Medicare Part D federal subsidy (i.e., it reduces a company's tax deduction). As a result of this enacted legislation, a company may need to reduce its deferred tax asset associated with the deductible temporary differences related to its other postemployment benefit obligation. The Act did not have a material impact on our consolidated financial statements.
3. DIVESTITURES AND ASSETS HELD-FOR-SALE
Divestitures. In March 2008, we sold the assets and operations of our outdoor storage buildings business that were previously a part of our outdoor building products segment. The outdoor storage buildings business was sold for $13.0 million and resulted in a loss of approximately $4.6 million. We sold the land and building from our Winnipeg, Manitoba Window and Door Profiles plant for $4.5 million, resulting in a gain of $0.3 million in March 2008. In June 2008, we sold land for net proceeds of $36.5 million, which resulted in a gain of $28.8 million. Additionally in June 2008, we sold and leased back equipment for $10.6 million resulting in a $2.2 million currently recognized gain, a short-term deferred gain of $0.8 million and a non-current deferred gain of $7.2 million. The deferred gain is being recognized ratably over the term of the equipment leases. In addition we sold the Oklahoma City, Oklahoma polyvinyl chloride ("PVC" or "vinyl resin") plant in December 2008 for $1.3 million.
64
Georgia Gulf Corporation and Subsidiaries
Notes to Consolidated Financial Statements (Continued)
3. DIVESTITURES AND ASSETS HELD-FOR-SALE (Continued)
Assets Held-For-Sale. Assets held for sale include U.S. and Canadian real estate totaling $14.2 million and $14.9 million at December 31, 2010 and 2009, respectively. Prior to 2008 we had assets held for sale that in March 2008, we executed a contingent sale agreement and received net proceeds of $12.6 million for this certain Canadian real estate. The contingency was based on the buyer satisfying certain property zoning conditions. The contingency was resolved in June 2008. This transaction resulted in a $3.3 million loss recorded in March 2008. In June 2008, we sold additional property for $3.2 million and received $1.2 million in cash and a short-term note for $2.0 million. Both gains and losses resulting from each transaction are included in losses (gains) on sale of assets in the accompanying condensed consolidated statement of operations for the year ended December 31, 2008. See Note 4.
4. RESTRUCTURING ACTIVITIES
In March 2008, we initiated plans to permanently shut down the Oklahoma City, Oklahoma 500 million pound PVC plant, the "Oklahoma City Restructuring Plan," which was a part of the Chlorovinyls segment. The plant ceased operations in March 2008. We wrote down the plant's property, plant and equipment in accordance with ASC subtopic 360-10, Property, Plant and Equipment, resulting in a $15.5 million impairment charge, and incurred additional termination benefits and closing costs of $2.0 million that were expensed as incurred, in accordance with ASC 420-10, Exit or Disposal Cost Obligations. No significant costs related to the Oklahoma City Restructuring Plan were incurred in the years ended December 31, 2010 or 2009, and we do not expect there to be any future costs associated with the Oklahoma City Restructuring Plan.
Additionally, the restructuring costs for the year ended December 31, 2009 and 2008 include our divestiture and closure of our outdoor storage buildings business assets and operations. The outdoor storage building business was sold for $13.0 million and resulted in a loss of approximately $4.6 million ("Outdoor Storage Plan"). During 2009 we reached a favorable settlement on a legal claim which resulted in the reversal of a litigation accrual of $3.1 million and a credit of restructuring costs for the same amount for the year ended December 31, 2009. The amount is noted as a reduction in the additions column in the table below. We do not expect to incur any future costs associated with the Outdoor Storage Plan.
In the fourth quarter of 2008, we initiated a restructuring plan (the "Fourth Quarter 2008 Restructuring Plan") that included the permanent shut down of our 450 million pound PVC manufacturing facility in Sarnia, Ontario, the exit of a recycled PVC compound manufacturing facility in Woodbridge, Ontario, the consolidation of various manufacturing facilities, and elimination of certain duplicative activities in our operations. In connection with the Fourth Quarter 2008 Restructuring Plan, we incurred costs related to termination benefits, including severance, pension and postretirement benefits, operating lease termination costs, asset impairment charges, relocation and other exit costs and have recognized these costs in accordance with ASC 420-10 and related accounting standards. Any costs incurred associated with the Fourth Quarter 2008 Restructuring Plan that will benefit future periods, such as relocation costs, will be expensed in the periods incurred. Total restructuring expenses incurred for the year ended December 31, 2009 includes a $4.0 million credit adjustment for the wind up of the Canadian pension plan (see Note 14). The amount is noted as a reduction in the additions column in the table below. Additionally, future costs for the Fourth Quarter 2008 Restructuring Plan are estimated to be approximately $0.8 million, consisting of future severance and non-workforce related costs.
65
Georgia Gulf Corporation and Subsidiaries
Notes to Consolidated Financial Statements (Continued)
4. RESTRUCTURING ACTIVITIES (Continued)
In May 2009, we initiated plans to further consolidate our window and door profiles manufacturing plants within our Building Products reportable segment ("2009 Window and Door Consolidation Plan"). As a result, we incurred restructuring costs, including impairment of the plants' fixed assets for the year ended December 31, 2009. For the year ended December 31, 2009, we incurred $21.6 million of impairment charges for real estate and other fixed assets associated with the consolidation of these plants. The details of restructuring and impairment expenses incurred for the years ended December 31, 2010 and 2009 are noted in the tables below. As of December 31, 2010, additional future costs for the 2009 Window and Door Consolidation Plan are not expected to be significant.
The expenses associated with the Fourth Quarter 2008 Restructuring Plan, the Outdoor Storage Plan and the 2009 Window and Door Consolidation Plan for the years ended December 31, 2010, 2009, and 2008 for severance and other exit costs were approximately $0.1 million, $4.4 million, and $22.0 million, respectively, and are included in restructuring costs in the consolidated statement of operations. A summary of our restructuring activities recognized as a result of the Fourth Quarter 2008 Restructuring Plan, the Outdoor Storage Plan and the 2009 Window and Door Consolidation Plan, by reportable segment for the years ended December 31, 2010, 2009, and 2008 is as follows:
(In thousands)
|
Balance at December 31, 2009 |
Additions | Cash Payments |
Foreign Exchange and Other Adjustments |
Balance at December 31, 2010 |
||||||||||||
|---|---|---|---|---|---|---|---|---|---|---|---|---|---|---|---|---|---|
Chlorovinyls |
|||||||||||||||||
Fourth Quarter 2008 Restructuring Plan: |
|||||||||||||||||
Involuntary termination benefits |
$ | 1,030 | $ | 120 | $ | (1,165 | ) | $ | 123 | $ | 108 | ||||||
Exit costs |
1,976 | (478 | ) | (1,098 | ) | (270 | ) | 130 | |||||||||
Building Products |
|||||||||||||||||
Fourth Quarter 2008 Restructuring Plan: |
|||||||||||||||||
Involuntary termination benefits |
2,418 | 309 | (1,645 | ) | 86 | 1,168 | |||||||||||
Exit costs |
— | 55 | (55 | ) | — | — | |||||||||||
2009 Window and Door Consolidation Plan: |
|||||||||||||||||
Involuntary termination benefits |
879 | (437 | ) | (438 | ) | 25 | 29 | ||||||||||
Exit costs |
179 | 460 | (639 | ) | — | — | |||||||||||
Outdoor Storage Plan: |
|||||||||||||||||
Involuntary termination benefits |
163 | (82 | ) | (29 | ) | 5 | 57 | ||||||||||
Corporate |
|||||||||||||||||
Fourth Quarter 2008 Restructuring Plan: |
|||||||||||||||||
Involuntary termination benefits |
48 | 155 | — | (47 | ) | 156 | |||||||||||
Total |
$ | 6,693 | $ | 102 | $ | (5,069 | ) | $ | (78 | ) | $ | 1,648 | |||||
66
Georgia Gulf Corporation and Subsidiaries
Notes to Consolidated Financial Statements (Continued)
4. RESTRUCTURING ACTIVITIES (Continued)
(In thousands)
|
Balance at December 31, 2008 |
Additions | Cash Payments |
Foreign Exchange and Other Adjustments |
Balance at December 31, 2009 |
||||||||||||
|---|---|---|---|---|---|---|---|---|---|---|---|---|---|---|---|---|---|
Chlorovinyls |
|||||||||||||||||
Fourth Quarter 2008 Restructuring Plan: |
|||||||||||||||||
Involuntary termination benefits |
$ | 3,246 | $ | (3,566 | ) (a) | $ | (2,900 | ) | $ | 4,250 | $ | 1,030 | |||||
Exit costs |
4,185 | 3,525 | (5,477 | ) | (257 | ) (b) | 1,976 | ||||||||||
Other |
1,184 | — | — | (1,184 | ) | — | |||||||||||
Building Products |
|||||||||||||||||
Fourth Quarter 2008 Restructuring Plan: |
|||||||||||||||||
Involuntary termination benefits |
2,755 | 3,622 | (4,548 | ) | 589 | 2,418 | |||||||||||
Exit costs |
1 | 45 | (46 | ) | — | — | |||||||||||
Other |
1,967 | — | — | (1,967 | ) | — | |||||||||||
2009 Window and Door Consolidation Plan: |
|||||||||||||||||
Involuntary termination benefits |
— | 1,124 | (390 | ) | 145 | 879 | |||||||||||
Exit costs |
— | 576 | (397 | ) | — | 179 | |||||||||||
Outdoor Storage Plan: |
|||||||||||||||||
Involuntary termination benefits |
523 | 138 | (315 | ) | (183 | ) | 163 | ||||||||||
Exit costs |
1,779 | (1,244 | ) | (1,943 | ) | 1,408 | — | ||||||||||
Corporate |
|||||||||||||||||
Fourth Quarter 2008 Restructuring Plan: |
|||||||||||||||||
Involuntary termination benefits |
— | 171 | (123 | ) | — | 48 | |||||||||||
Total |
$ | 15,640 | $ | 4,391 | $ | (16,139 | ) | $ | 2,801 | $ | 6,693 | ||||||
- (a)
- Includes
a $4.0 million adjustment for the wind up of the Canadian post retirement health and welfare and pension plans that were previously
reflected in accumulated other comprehensive income.
- (b)
- Includes a reclassification of $0.8 million of Other Post Retirement Benefits from Exit Costs to Involuntary Termination Benefits for the Fourth Quarter 2008 Restructuring Plan in the Chlorovinyls segment.
67
Georgia Gulf Corporation and Subsidiaries
Notes to Consolidated Financial Statements (Continued)
4. RESTRUCTURING ACTIVITIES (Continued)
(In thousands)
|
Balance at December 31, 2007 |
Additions | Cash Payments |
Foreign Exchange and Other Adjustments |
Balance at December 31, 2008 |
||||||||||||
|---|---|---|---|---|---|---|---|---|---|---|---|---|---|---|---|---|---|
Chlorovinyls |
|||||||||||||||||
Fourth Quarter 2008 Restructuring Plan: |
|||||||||||||||||
Involuntary termination benefits |
$ | — | $ | 3,468 | $ | (256 | ) | $ | 34 | $ | 3,246 | ||||||
Exit costs |
— | 4,902 | (751 | ) | 34 | 4,185 | |||||||||||
Other |
— | 1,184 | — | — | 1,184 | ||||||||||||
Building Products |
|||||||||||||||||
Fourth Quarter 2008 Restructuring Plan: |
|||||||||||||||||
Involuntary termination benefits |
2698 | 3,057 | (2,644 | ) | (356 | ) | 2,755 | ||||||||||
Exit costs |
690 | (83 | ) | (568 | ) | (38 | ) | 1 | |||||||||
Other |
1,967 | — | — | 1,967 | |||||||||||||
Outdoor Storage Plan: |
|||||||||||||||||
Involuntary termination benefits |
1,574 | (847 | ) | (204 | ) | 523 | |||||||||||
Exit costs |
4,814 | (2,854 | ) | (181 | ) | 1,779 | |||||||||||
Corporate |
|||||||||||||||||
Fourth Quarter 2008 Restructuring Plan: |
|||||||||||||||||
Involuntary termination benefits |
— | 1,090 | (1,131 | ) | 41 | — | |||||||||||
Total |
$ | 3,388 | $ | 21,973 | $ | (9,051 | ) | $ | (670 | ) | $ | 15,640 | |||||
In the first quarter of 2009, we engaged the services of several consultants to assist us in performance improvement, transportation management and indirect sourcing cost reduction initiatives among other areas of the business, with the ultimate goal to restructure our businesses and improve and sustain profitability for the long-term. For the year ended December 31, 2009, we incurred $2.5 million related to fees paid to these consultants to advise us on the restructuring strategies noted above which are included in restructuring costs in the consolidated statement of operations.
A summary of impairment of tangible long-lived assets incurred in connection with our restructuring activities as a result of the Fourth Quarter 2008 Restructuring Plan, the Outdoor Storage Plan and the 2009 Window and Door Consolidation Plan, by reportable segment for the years ended
68
Georgia Gulf Corporation and Subsidiaries
Notes to Consolidated Financial Statements (Continued)
4. RESTRUCTURING ACTIVITIES (Continued)
December 31, 2009 and 2008 are in the table below. There were no similar charges for the year ended December 31, 2010.
(In thousands)
|
Year Ended December 31, 2009 |
Year Ended December 31, 2008 |
||||||
|---|---|---|---|---|---|---|---|---|
Chlorovinyls |
||||||||
Impairment of Long-Lived Assets |
$ | 201 | $ | 44,310 | ||||
Window and door profiles and mouldings products |
||||||||
Impairment of Long-Lived Assets |
21,603 | 2,246 | ||||||
Outdoor building products |
||||||||
Impairment of Long-Lived Assets |
— | 634 | ||||||
Other, including unallocated corporate |
||||||||
Impairment of Long-Lived Assets |
— | (187 | ) | |||||
Total |
$ | 21,804 | $ | 47,003 | ||||
The total impairment of tangible long-lived assets for the years ended December 31, 2009 and 2008 is included in long-lived asset impairment charges in the consolidated statement of operations.
5. ACCOUNTS RECEIVABLE SECURITIZATION
On March 17, 2009, we entered into an Asset Securitization agreement pursuant to which we sold an undivided percentage ownership interest in a certain defined pool of our U.S. and Canadian trade accounts receivable on a revolving basis through a wholly-owned subsidiary to a third party (the "Securitization"). This wholly-owned subsidiary was funded through advances on sold trade receivables and collections of those trade receivables and its activities were exclusively related to the Securitization. This Securitization replaced a previous agreement pursuant to which we sold an undivided percentage ownership interest in a certain defined pool of our U.S. trade receivables on a revolving basis through a wholly-owned subsidiary to two third parties. Under the Securitization, we could sell ownership interests in new receivables to bring the ownership interests sold up to a maximum of $175.0 million. As collections reduced our accounts receivable included in the pool, we could sell ownership interests in new receivables to bring the ownership interests sold up to a maximum of $175.0 million, as permitted by the Securitization. On December 22, 2009, we replaced the Securitization with a senior secured asset-based revolving credit facility (the "ABL Revolver") (see Note 9). As a result of the termination and replacement of our Securitization and the execution of the ABL Revolver, we repurchased $110.0 million of previously sold accounts receivable. The repurchase of these trade receivables did not result in any significant losses and the repurchased receivables have been collected.
69
Georgia Gulf Corporation and Subsidiaries
Notes to Consolidated Financial Statements (Continued)
6. INVENTORIES
The major classes of inventories were as follows:
| |
December 31, | ||||||
|---|---|---|---|---|---|---|---|
(In thousands)
|
2010 | 2009 | |||||
Raw materials |
$ | 98,815 | $ | 92,860 | |||
Work-in-progress and supplies |
5,104 | 4,491 | |||||
Finished goods |
157,316 | 154,046 | |||||
Inventories |
$ | 261,235 | $ | 251,397 | |||
7. PROPERTY, PLANT AND EQUIPMENT, NET
Property, plant and equipment consisted of the following:
(In thousands)
|
December 31, 2010 |
December 31, 2009 |
|||||
|---|---|---|---|---|---|---|---|
Machinery and equipment |
$ | 1,395,455 | $ | 1,346,740 | |||
Land and land improvements |
89,042 | 86,013 | |||||
Buildings |
201,228 | 195,602 | |||||
Construction-in-progress |
21,573 | 25,629 | |||||
Property, plant and equipment, at cost |
1,707,298 | 1,653,984 | |||||
Accumulated depreciation |
1,054,161 | 966,414 | |||||
Property, plant and equipment, net |
$ | 653,137 | $ | 687,570 | |||
8. OTHER ASSETS, NET
Other assets, net of accumulated amortization, consisted of the following:
(In thousands)
|
December 31, 2010 |
December 31, 2009 |
|||||
|---|---|---|---|---|---|---|---|
Advances for long-term purchase contracts |
$ | 49,204 | $ | 67,257 | |||
Investment in joint ventures |
9,691 | 12,804 | |||||
Deferred financing costs, net |
21,926 | 25,654 | |||||
Long-term receivables |
89 | 3,714 | |||||
Other |
9,017 | 7,065 | |||||
Total other assets, net |
$ | 89,927 | $ | 116,494 | |||
During 2009, in connection with refinancing our capital structure, we (i) effected a debt for equity exchange on July 27, 2009 and (ii) on December 22, 2009 (A) issued $500.0 million aggregate principal amount of senior secured 9.0 percent notes due 2017, (B) entered into the ABL Revolver, (C) terminated our senior secured credit facility, and (D) terminated our Securitization (see Note 10). We incurred $79.7 million of related financing fees of which $24.4 million were deferred and included in other assets, net at December 31, 2009 and the remaining amount was expensed in the year ended December 31, 2009 in connection with the respective refinancings referred to above. Debt issuance cost
70
Georgia Gulf Corporation and Subsidiaries
Notes to Consolidated Financial Statements (Continued)
8. OTHER ASSETS, NET (Continued)
amortized as interest expense during 2010, 2009, and 2008 were $4.3 million, $9.6 million, and $6.9 million, respectively.
9. GOODWILL AND OTHER INTANGIBLE ASSETS
Goodwill Impairment Charges. We performed our annual impairment testing for goodwill and other intangible assets in accordance with ASC topic 350 sub-topic 020, Goodwill, as of October 1, 2010. We evaluate goodwill and other intangible assets for impairment using the two-step process prescribed by ASC topic 350. The first step is to identify potential impairment by comparing the fair value of the reporting unit to the book value, including goodwill. If the fair value of the reporting unit exceeds the book value, goodwill is not considered impaired. If the book value exceeds the fair value, the second step of the process is performed to measure the amount of impairment. Our goodwill evaluations utilized discounted cash flow analyses and market multiple analyses in estimating fair value. Our weighting of the discounted cash flow and market approaches varies by each reporting unit based on factors specific to each reporting unit. Inherent in our fair value determinations are certain judgments and estimates relating to future cash flows, including interpretation of current economic indicators and market conditions, overall economic conditions and our strategic operational plans with regard to our operations. In addition, to the extent significant changes occur in market conditions, overall economic conditions or our strategic operational plan; it is possible that goodwill not currently impaired may become impaired in the future.
We have two segments that contain reporting units with goodwill and intangible assets. Chlorovinyls includes goodwill in our Compound reporting unit and the Building Products segment includes goodwill primarily in our Window and Door profiles reporting unit. The estimated fair value of the Compound reporting unit significantly exceeds the carrying value.
Our Window and Door profiles reporting unit maintains a goodwill balance of $18.2 million and the estimated fair value of this reporting unit exceeds the carrying value by approximately 5.0%. The evaluation of this reporting unit gave no indication that an impairment of that goodwill had occurred. This was based on a discount rate of 12.4% on future cash flows, and an equal weighting of the income and market approaches and a gradual increase in financial performance. This evaluation assumed a modest North American housing market recovery to approximately 1.7 million home starts by 2015. These assumptions are based on the historical evaluation of the housing market and the specific productivity of this reporting unit. The use of different assumptions could yield materially different results.
Based on the information above, the company determined that there were no goodwill impairments in 2010 or 2009. Goodwill impairment charges were $62.6 million in 2008.
71
Georgia Gulf Corporation and Subsidiaries
Notes to Consolidated Financial Statements (Continued)
9. GOODWILL AND OTHER INTANGIBLE ASSETS (Continued)
Goodwill. The following table provides the detail of the changes made to goodwill by reportable segment during the years ended December 31, 2010, 2009, and 2008.
In thousands
|
Chlorovinyls | Building Products |
Total | |||||||
|---|---|---|---|---|---|---|---|---|---|---|
Gross goodwill at January 1, 2008 |
$ | 246,207 | $ | 161,145 | $ | 407,352 | ||||
Settlement of pre-acquisition tax contingency and other |
— | (15,307 | ) | (15,307 | ) | |||||
Foreign currency translation adjustment |
(21,569 | ) | 6,220 | (15,349 | ) | |||||
Gross goodwill at December 31, 2008 |
224,638 | 152,058 | 376,696 | |||||||
Accumulated impairment losses at January 1, 2008 |
(55,487 | ) | (69,583 | ) | (125,070 | ) | ||||
Impairment charges |
— | (62,623 | ) | (62,623 | ) | |||||
Accumulated impairment losses at December 31, 2008 |
(55,487 | ) | (132,206 | ) | (187,693 | ) | ||||
Net goodwill at December 31, 2008 |
$ | 169,151 | $ | 19,852 | $ | 189,003 | ||||
Gross goodwill at December 31, 2008 |
$ | 224,638 | $ | 152,058 | $ | 376,696 | ||||
Foreign currency translation adjustment |
14,806 | — | 14,806 | |||||||
Gross goodwill at December 31, 2009 |
239,444 | 152,058 | 391,502 | |||||||
Accumulated impairment losses at December 31, 2009 |
(55,487 | ) | (132,206 | ) | (187,693 | ) | ||||
Net goodwill at December 31, 2009 |
$ | 183,957 | $ | 19,852 | $ | 203,809 | ||||
Gross goodwill at December 31, 2009 |
$ | 239,444 | 152,058 | 391,502 | ||||||
Foreign currency translation adjustment |
5,822 | — | 5,822 | |||||||
Gross goodwill at December 31, 2010 |
245,266 | 152,058 | 397,324 | |||||||
Accumulated impairment losses at December 31, 2010 |
(55,487 | ) | (132,206 | ) | (187,693 | ) | ||||
Net goodwill at December 31, 2010 |
$ | 189,779 | $ | 19,852 | $ | 209,631 | ||||
Indefinite lived intangible assets. At December 31, 2010 and 2009, we held trade names. Our indefinite lived intangible asset evaluations utilized discounted cash flows analyses in estimating fair value.
The following table provides the detail of the changes made to indefinite-lived intangible assets by reporting segment during years ended December 31, 2010 and 2009.
72
Georgia Gulf Corporation and Subsidiaries
Notes to Consolidated Financial Statements (Continued)
9. GOODWILL AND OTHER INTANGIBLE ASSETS (Continued)
Indefinite-lived intangible assets-trade names
In thousands
|
Chlorovinyls | Building Products |
Total | |||||||
|---|---|---|---|---|---|---|---|---|---|---|
Balance at January 1, 2009 |
$ | 303 | $ | 3,854 | $ | 4,157 | ||||
Foreign currency translation adjustment |
50 | 283 | 333 | |||||||
Balance at December 31, 2009 |
$ | 353 | $ | 4,137 | $ | 4,490 | ||||
Foreign currency translation adjustment |
19 | 110 | 129 | |||||||
Balance at December 31, 2010 |
$ | 372 | $ | 4,247 | $ | 4,619 | ||||
Finite-lived intangible assets. At December 31, 2010 and 2009, we also had customer relationship and technology intangibles. Impairment charges in 2008 of $0.8 million in Chlorovinyls and $42.2 million in Building Products were determined utilizing discounted cash flow analyses. There were no similar charges in 2010 or 2009. The following table provides the detail of the changes made to finite-lived intangible assets by reportable segment during the years ended December 31, 2010 and 2009.
Finite-lived intangible assets
In thousands
|
Chlorovinyls | Building Products |
Total | ||||||||
|---|---|---|---|---|---|---|---|---|---|---|---|
Gross carrying amounts at December 31, 2010: |
|||||||||||
Customer relationships |
$ | 199 | $ | 11,422 | $ | 11,621 | |||||
Technology |
— | 11,867 | 11,867 | ||||||||
Total |
199 | 23,289 | 23,488 | ||||||||
Accumulated amortization at December 31, 2010: |
|||||||||||
Customer relationships |
(124 | ) | (5,199 | ) | (5,323 | ) | |||||
Technology |
— | (6,674 | ) | (6,674 | ) | ||||||
Total |
(124 | ) | (11,873 | ) | (11,997 | ) | |||||
Foreign currency translation adjustment and other at December 31, 2010: |
|||||||||||
Customer relationships |
(75 | ) | (1,684 | ) | (1,759 | ) | |||||
Technology |
— | — | — | ||||||||
Total |
(75 | ) | (1,684 | ) | (1,759 | ) | |||||
Net carrying amounts at December 31, 2010: |
|||||||||||
Customer relationships |
— | 4,539 | 4,539 | ||||||||
Technology |
— | 5,193 | 5,193 | ||||||||
Total |
$ | — | $ | 9,732 | $ | 9,732 | |||||
73
Georgia Gulf Corporation and Subsidiaries
Notes to Consolidated Financial Statements (Continued)
9. GOODWILL AND OTHER INTANGIBLE ASSETS (Continued)
In thousands
|
Chlorovinyls | Building Products |
Total | ||||||||
|---|---|---|---|---|---|---|---|---|---|---|---|
Gross carrying amounts at December 31, 2009: |
|||||||||||
Customer relationships |
$ | 199 | $ | 11,422 | $ | 11,621 | |||||
Technology |
— | 11,867 | 11,867 | ||||||||
Total |
199 | 23,289 | 23,488 | ||||||||
Accumulated amortization at December 31, 2009: |
|||||||||||
Customer relationships |
(124 | ) | (4,868 | ) | (4,992 | ) | |||||
Technology |
— | (6,004 | ) | (6,004 | ) | ||||||
Total |
(124 | ) | (10,872 | ) | (10,996 | ) | |||||
Foreign currency translation adjustment and other at December 31, 2009: |
|||||||||||
Customer relationships |
(75 | ) | (1,684 | ) | (1,759 | ) | |||||
Technology |
— | — | — | ||||||||
Total |
(75 | ) | (1,684 | ) | (1,759 | ) | |||||
Net carrying amounts at December 31, 2009: |
|||||||||||
Customer relationships |
— | 4,870 | 4,870 | ||||||||
Technology |
— | 5,863 | 5,863 | ||||||||
Total |
$ | — | $ | 10,733 | $ | 10,733 | |||||
The average estimated useful life for the customer relationships and technology are 18 years and 12 years, respectively. Amortization expense for the finite-lived intangible assets was $1.0 million, $1.0 million, and $3.8 million for the years ended December 31, 2010, 2009, and 2008, respectively. Total finite-lived intangible asset estimated annual amortization expense for the next five fiscal years is approximately $1.0 million per year.
74
Georgia Gulf Corporation and Subsidiaries
Notes to Consolidated Financial Statements (Continued)
10. LONG-TERM DEBT
Long-term debt consisted of the following:
In thousands
|
December 31, 2010 |
December 31, 2009 |
||||||
|---|---|---|---|---|---|---|---|---|
Senior secured ABL revolving credit facility due 2016 * |
$ | — | $ | 56,462 | ||||
9.0% senior secured notes due 2017 |
497,085 | 496,739 | ||||||
7.125% senior notes due 2013 |
8,965 | 8,965 | ||||||
9.5% senior notes due 2014 |
13,162 | 13,151 | ||||||
10.75% senior subordinated notes due 2016 |
41,412 | 41,360 | ||||||
Lease financing obligation |
112,385 | 106,436 | ||||||
Other |
16,933 | 15,892 | ||||||
Total debt |
689,942 | 739,005 | ||||||
Less current portion |
(22,132 | ) | (28,231 | ) | ||||
Long-term debt |
$ | 667,810 | $ | 710,774 | ||||
- *
- See Subsequent Event Note 22.
On December 22, 2009, we refinanced our senior secured credit facility and our $175 million Securitization. At the time of the refinancing, our senior secured credit facility was comprised of a $300 million revolving credit facility and a $347.7 million Term Loan B. We replaced the senior secured credit facility and Securitization with a four-year term senior secured asset-based revolving credit agreement (the "ABL Revolver") and the issuance of $500.0 million in principal amount of our 9.0 percent senior secured notes.
The ABL Revolver provides for a maximum of $300 million of revolving credit through January 2016(*), subject to borrowing base availability, including sub-limits for letters of credit and swing line loans. The borrowing base is equal to specified percentages of our eligible accounts receivable and inventories, less a fixed $15 million availability reserve and other reserves reasonably determined by the co-collateral agents. Borrowings under the ABL Revolver are secured by substantially all of our assets.
The weighted average interest rate under the ABL Revolver was 5.1 percent and 6.0 percent as of December 31, 2010 and December 31, 2009, respectively. In addition to paying interest on outstanding principal under the ABL Revolver, we are required to pay a fee in respect of the unutilized commitments and we must also pay customary letter of credit fees equal to the applicable margin on London Interbank Offered Rate ("LIBOR") loans and agency fees.
The ABL Revolver requires that if excess availability is less than $45 million, we comply with a minimum fixed charge coverage ratio of at least 1.10 to 1.00. At December 31, 2010 and December 31, 2009 excess availability was $264.8 million and $134.5 million, respectively. In addition, the ABL Revolver includes affirmative and negative covenants that, subject to significant exceptions, limit our ability and the ability of our subsidiaries to, among other things: incur, assume or permit to exist additional indebtedness or guarantees; incur liens; make investments and loans; pay dividends, make payments or redeem or repurchase capital stock; engage in mergers, acquisitions and asset sales; prepay, redeem or purchase certain indebtedness including the 9.0 percent senior secured notes; amend or otherwise alter terms of certain indebtedness, including the 9.0 percent senior secured notes; engage in certain transactions with affiliates; and alter the business that we conduct.
75
Georgia Gulf Corporation and Subsidiaries
Notes to Consolidated Financial Statements (Continued)
10. LONG-TERM DEBT (Continued)
If at any time the aggregate amount of outstanding loans, unreimbursed letter of credit drawings and undrawn letters of credit under the ABL Revolver exceeds the lesser of (i) the commitment amount and (ii) the borrowing base, we will be required to repay outstanding loans and cash collateralize letters of credit in an aggregate amount equal to such excess, with no reduction of the commitment amount. If the amount available under the ABL Revolver is less than $60 million for a period of three consecutive business days or certain events of default have occurred, we will be required to deposit cash from our material deposit accounts (including all concentration accounts) daily in a collection account maintained with the administrative agent under the ABL Revolver, which will be used to repay outstanding loans and cash collateralize letters of credit.
On December 31, 2010 and 2009 we had nil and $56.5 million, respectively, in outstanding principal borrowed under the ABL Revolver. At December 31, 2010 and 2009, we had outstanding letters of credit totaling $20.2 million and $45.2 million, respectively.
On December 22, 2009, we also issued $500.0 million principal amount of 9.0 percent senior secured notes due 2017. Interest on these notes is payable January 15 and July 15 of each year. On or after January 15, 2014, we may redeem the notes in whole or in part, initially at 104.5 percent of their principal amount, and thereafter at prices declining annually to 100 percent on or after January 15, 2016. During any twelve-month period prior to January 15, 2014, we may make optional redemptions of up to 10 percent of the aggregate principal amount of the 9.0 percent notes at a redemption price of 103.0 percent of such principal amount plus any accrued and unpaid interest. In addition, prior to January 15, 2013, we may redeem up to 35 percent of the aggregate principal amount of the notes at a redemption price equal to 109.0 percent of such principal amount, plus any accrued and unpaid interest. In addition, we may redeem some or all of the notes at any time prior to January 15, 2014 at a price equal to the principal amount thereof plus a make-whole premium and any accrued and unpaid interest. The 9.0 percent senior secured notes are secured by substantially all of our assets and contain certain restrictive covenants including restrictions on debt incurrence, granting of liens, dividends, acquisitions and investments.
Management believes based on current and projected levels of operations and conditions in our markets that cash flow from operations, together with our cash and cash equivalents on hand of $122.8 million and the availability to borrow an additional $264.8 million under our ABL Revolver as of December 31, 2010, will be adequate for the foreseeable future to make required payments of principal and interest on our debt and fund our working capital and capital expenditure requirements. Additionally, based on our current and projected levels of operations and financial conditions, we believe we will be able to continue for the foreseeable future to meet the restrictive covenants and comply with the financial ratio requirements of the ABL Revolver and the indenture related to the 9.0 percent senior secured notes. As of December 31, 2010, we are in compliance with all required debt covenants.
On March 31, 2009, we commenced private exchange offers for our outstanding 7.125 percent senior notes due 2013 (the "2013 notes"), 9.5 percent senior notes due 2014 (the "2014 notes"), and 10.75 percent senior subordinated notes due 2016 (the "2016 notes" and collectively with the 2013 notes and 2014 notes, the "notes"). After numerous extensions and amendments, on July 29, 2009, we consummated these exchanges of debt for equity consisting of approximately $736.0 million (principal amount), or 92.0 percent, in aggregate principal amount of the notes (the "debt exchange"). The $736.0 million was comprised of $91.0 million of the $100 million of outstanding 2013 notes,
76
Georgia Gulf Corporation and Subsidiaries
Notes to Consolidated Financial Statements (Continued)
10. LONG-TERM DEBT (Continued)
$486.8 million of the $500 million of outstanding 2014 notes, and $158.1 million of the $200 million of outstanding 2016 notes. An aggregate of approximately 30.2 million shares of convertible preferred stock and 1.3 million shares of common stock were issued in exchange for the tendered notes after giving effect to a 1-for-25 reverse stock split, which reduced the outstanding common shares, before the issuance of common shares in the exchange, to approximately 1.4 million shares. In exchange for each $1,000 in principal amount of the 2013 notes and 2014 notes, we issued 47.30 shares of convertible preferred stock and 2.11 shares of common stock, and in exchange for each $1,000 in principal amount of the 2016 notes, we issued 18.36 shares of convertible preferred stock and 0.82 shares of common stock. In September 2009 the 30.2 million shares of preferred stock converted to an equal number of common shares. As of December 31, 2010, we have outstanding $9.0 million of the 2013 notes, $13.2 million of the 2014 notes and $41.4 million of the 2016 notes.
In accordance with ASC subtopic 470-60, Troubled Debt Restructuring by Debtors, this debt for equity exchange was a troubled debt restructuring and thus an extinguishment of the exchanged notes on which we recognized a net gain of $400.8 million. The $400.8 million net gain from the debt for equity exchange represents diluted earnings per share of approximately $16.18 for the year ended December 31, 2009, respectively. This gain included $731.5 million of principal debt, net of original issuance discounts, $53.7 million accrued interest, $14.1 million deferred financing fees written off and $12.4 million of third party fees, which was exchanged for the $357.9 million fair value of the common and preferred shares. The $357.9 million fair value of the common and preferred shares was estimated using a combination of discounted future cash flows; market multiples for similar companies and recent comparable transactions. In addition, the fair value of the equity issued approximates $11.36 per share that was also evaluated relative to prices in the public markets and determined to be reasonable. Due to the fact that the determination of the fair value of the equity issued was primarily derived by projected future cash flows we evaluated the sensitivity of the major assumptions including discount rates and forecasted cash flows. A 100 basis points increase or decrease in the discount rate or a 10% increase or decrease in the annual forecasted cash flows results in an approximately $30.0 million increase or decrease in the estimated fair value of the equity issued.
Scheduled maturities and cash interest. Scheduled maturities of long-term debt outstanding at December 31, 2010 are nil in 2011, $18.0 million in 2012, $9.0 million in 2013, $13.2 million in 2014, nil in 2015 and $541.9 million thereafter. Cash payments for interest during the years ended December 31, 2010, 2009, and 2008 were $45.3 million, $69.9 million, and $129.5 million, respectively. The $22.1 million of current portion of long-term debt at December 31, 2010 represents the $9.0 million of 2013 notes and $13.2 million of 2014 notes that we previously announced we would redeem.
Lease Financing Transaction. The lease financing obligation is the result of the sale and concurrent leaseback of certain land and buildings in Canada in 2007. In connection with this transaction, a collateralized letter of credit was issued in favor of the buyer lessor resulting in the transaction being recorded as a financing transaction rather than a sale, and the land and building and related accounts continue to be recognized in the consolidated balance sheet. The future minimum lease payments under the terms of the related lease agreements at December 31, 2010 are $7.4 million in 2011, $7.5 million in 2012, $7.8 million in 2013, $7.8 million in 2014, $8.1 million in 2015, and $10.2 million thereafter. The change in the future minimum lease payments from the December 31, 2009 balance is due to monthly payments and the change in the Canadian dollar exchange rate for the year ended December 31, 2010.
77
Georgia Gulf Corporation and Subsidiaries
Notes to Consolidated Financial Statements (Continued)
11. COMMITMENTS AND CONTINGENCIES
Leases. We lease railcars, storage terminals, computer equipment, automobiles and warehouse and office space under non-cancelable operating leases with varying maturities through the year 2018. Future minimum payments under these non-cancelable operating leases as of December 31, 2010 are $18.4 million in 2011, $16.1 million in 2012, $9.8 million in 2013, $8.0 million in 2014, $5.4 million in 2015, and $10.6 million thereafter. Total lease expense was approximately $33.8 million, $33.8 million, and $41.4 million for the years ended December 31, 2010, 2009, and 2008, respectively. Lease expense is recognized on a straight-line basis over the term of the lease.
Letters of Credit. As of December 31, 2010 and 2009, we had outstanding letters of credit totaling approximately $20.2 million and $45.2 million, respectively. These outstanding letters of credit directly reduced the availability under our ABL Revolver as of December 31, 2010 and 2009, respectively. These letters of credit, which typically have terms from one month to one year, primarily provide additional security for payments to real property lessors and suppliers, and financial assurance to states for environmental closures, post-closure costs, and potential third party liability awards.
Purchase Commitments. We have long-term raw material purchase agreements with variable and fixed payment obligations through 2014. The variable component of future payments is based on market prices of commodities used in production. Under these contracts we were required to prepay a certain portion of the fixed and determinable costs, of which we have capitalized $49.2 million and $67.3 million as of December 31, 2010 and 2009, respectively, in the accompanying consolidated balance sheets. We amortize these advances over the lives of the applicable contracts. We analyze the recoverability of these prepaid manufacturing costs based on the creditworthiness of the manufacturer and the performance under the terms of the contract. In addition, these purchase commitments are at market prices and are designed to assure a source of supply. The aggregate amount of payments made under the fixed and determinable cost component of these agreements for purchases in 2010, 2009, and 2008 was $156.8 million, $122.3 million, and $199.6 million, respectively.
Legal Proceedings. In August 2004 and January and February 2005, the USEPA conducted environmental investigations of our manufacturing facilities in Aberdeen, Mississippi and Plaquemine, Louisiana, respectively. The USEPA informed us that it identified several "areas of concern," and indicated that such areas of concern may, in its view, constitute violations of applicable requirements, thus warranting monetary penalties and possible injunctive relief. In lieu of pursuing such relief through its traditional enforcement process, the USEPA proposed that the parties enter into negotiations in an effort to reach a global settlement of the areas of concern and that such a global settlement cover our manufacturing facilities at Lake Charles, Louisiana and Oklahoma City, Oklahoma as well. During the second quarter of 2006, we were informed by the USEPA that its regional office responsible for Oklahoma and Louisiana desired to pursue resolution of these matters on a separate track from the regional office responsible for Mississippi. During the second quarter of 2007, we reached agreement with the USEPA responsible for Mississippi on the terms and conditions of a consent decree that would settle USEPA's pending enforcement action against our Aberdeen, Mississippi facility. All parties have executed a consent decree setting forth the terms and conditions of the settlement. The consent decree has been approved by the federal district court in Atlanta, Georgia. Under the consent decree, we were required to, among other things, pay a $610,000 fine, which was paid in March 2008, and undertake certain other environmental improvement projects. While the cost of such additional projects will likely exceed $1 million, we do not believe that these projects will have a material effect on our financial position, results of operations, or cash flows.
78
Georgia Gulf Corporation and Subsidiaries
Notes to Consolidated Financial Statements (Continued)
11. COMMITMENTS AND CONTINGENCIES (Continued)
We have not yet achieved a settlement with the USEPA regional office responsible for Oklahoma and Louisiana. However, on November 17, 2009, we received a unilateral administrative order (UAO) from this USEPA regional office. The UAO, issued pursuant to Section 3013(a) of the Resource Conservation and Recovery Act ("RCRA"), requires us to take certain monitoring and assessment activities in and around several of our wastewater and storm water conveyance systems.
We have also recently received several compliance orders and notices of potential penalties from the Louisiana Department of Environmental Quality (LDEQ). On December 17, 2009, we received a Notice of Potential Penalty (NOPP) from LDEQ containing allegations of violations of Louisiana's hazardous waste management regulations. On October 7, 2010, we received a Consolidated Compliance Order (CCO) from LDEQ addressing the same allegations as were contained in the December 17, 2009 NOPP. On October 1, 2010, we received Consolidated Compliance Orders and Notices of Potential Penalties (CCONPPs) for both the Plaquemine, Louisiana and Lake Charles, Louisiana facilities. These CCONPPs allege violations of reporting, recordkeeping, and other requirements contained in Louisiana's air pollution control regulations.
Some of the allegations contained in these compliance orders and notices of potential penalties may potentially be similar to the "areas of concern" raised by USEPA that are discussed above. These compliance orders and notices of potential penalties do not identify specific penalty amounts. It is likely that any settlement, if achieved, will result in the imposition of monetary penalties, capital expenditures for installation of environmental controls and/or other relief. We are not able to forecast the total cost of any monetary penalties, environmental projects, or other relief that would be imposed in any settlement or order. While we expect that such costs will exceed $100,000, we do not expect that such costs will have a material effect on our financial position, results of operations, or cash flows.
On June 6, 2008, we received notice and a letter of transmittal (collectively, the "Notice") from persons ("Claimants") claiming to own at least 25 percent of our 2013 Notes, which were issued under an indenture dated December 3, 2003 (the "Indenture") between us and U.S. Bank National Association, as trustee. The Notice asserted that borrowings under our senior secured credit facility resulted in the incurrence of debt obligations in excess of the amount permitted under Section 3.3 of the Indenture. Believing that all existing indebtedness was incurred in compliance with the provisions of the Indenture, we disputed the Notice. We filed a complaint in the Court of Chancery of the State of Delaware on June 8, 2008 seeking to enjoin the Claimants and seeking a declaratory judgment to the effect that we were not in default under Section 3.3 of the Indenture (the "Complaint").
On July 15, 2008, we entered into a settlement agreement with the Claimants. In connection with the settlement, the Claimants withdrew their notice of default, and the parties dismissed the litigation. The terms of the settlement include mutual releases of the parties, certain restrictions and obligations upon the Claimants with regard to their holdings of our securities, and the payment by us of $1.4 million of legal fees to the Claimants.
On September 29, 2008, we obtained the consent of holders of a majority of the 2013 Notes to an amendment to the related Indenture and paid a consent fee of $1.5 million to all consenting note holders pro rata to their respective holdings. The amendment amends certain covenants in the Indenture, and provides a waiver of defaults, if any. Approval of the lenders under our senior secured credit agreement was required for the consent fee payment and the Indenture amendment.
79
Georgia Gulf Corporation and Subsidiaries
Notes to Consolidated Financial Statements (Continued)
11. COMMITMENTS AND CONTINGENCIES (Continued)
In addition, we are subject to other claims and legal actions that may arise in the ordinary course of business. We believe that the ultimate liability, if any, with respect to these other known claims and legal actions will not have a material effect on our financial position or on our results of operations.
Environmental Regulation. Our operations are subject to increasingly stringent federal, state and local laws and regulations relating to environmental quality. These regulations, which are enforced principally by the USEPA and comparable state agencies and Canadian federal and provincial agencies, govern the management of solid hazardous waste, emissions into the air and discharges into surface and underground waters, and the manufacture of chemical substances. In addition to the matters involving environmental regulation above, we have the following potential environmental issues.
In the first quarter of 2007, the USEPA informed us of possible noncompliance at our Aberdeen, Mississippi facility with certain provisions of the Toxic Substances Control Act. Subsequently, we discovered possible non-compliance involving our Plaquemine, Louisiana and Pasadena, Texas facilities, which were then disclosed. We expect that all of these disclosures will be resolved in one settlement agreement with USEPA. While the penalties, if any, for such noncompliance may exceed $100,000, we do not expect that any penalties will have a material effect on our financial position, results of operations, or cash flows.
There are several serious environmental issues concerning the VCM facility at Lake Charles, Louisiana we acquired from CONDEA Vista Company ("CONDEA Vista" is now Sasol North America, Inc.) on November 12, 1999. Substantial investigation of the groundwater at the site has been conducted, and groundwater contamination was first identified in 1981. Groundwater remediation through the installation of groundwater recovery wells began in 1984. The site currently contains an extensive network of monitoring wells and recovery wells. Investigation to determine the full extent of the contamination is ongoing. It is possible that offsite groundwater recovery will be required, in addition to groundwater monitoring. Soil remediation could also be required.
Investigations are currently underway by federal environmental authorities concerning contamination of an estuary near the Lake Charles VCM facility we acquired known as the Calcasieu Estuary. It is likely that this estuary will be listed as a Superfund site and will be the subject of a natural resource damage recovery claim. It is estimated that there are about 200 Potentially Responsible Parties (PRPs) associated with the estuary contamination. CONDEA Vista is included among these parties with respect to its Lake Charles facilities, including the VCM facility we acquired. The estimated cost for investigation and remediation of the estuary is unknown and could be significant. Also, Superfund statutes may impose joint and several liabilities for the cost of investigations and remedial actions on any company that generated the waste, arranged for disposal of the waste, transported the waste to the disposal site, selected the disposal site, or presently or formerly owned, leased or operated the disposal site or a site otherwise contaminated by hazardous substances. Any or all of the responsible parties may be required to bear all of the costs of cleanup regardless of fault, legality of the original disposal or ownership of the disposal site. Currently, we discharge our wastewater to CONDEA Vista, which has a permit to discharge treated wastewater into the estuary.
CONDEA Vista has agreed to retain responsibility for substantially all environmental liabilities and remediation activity relating to the vinyls business we acquired from it, including the Lake Charles, Louisiana VCM facility. For all matters of environmental contamination that were known at the time of acquisition (November 1999), we may make a claim for indemnification at any time. For environmental
80
Georgia Gulf Corporation and Subsidiaries
Notes to Consolidated Financial Statements (Continued)
11. COMMITMENTS AND CONTINGENCIES (Continued)
matters that were then unknown, we must generally have made such claims for indemnification before November 12, 2009. No such material claims were made.
At our Lake Charles VCM facility, CONDEA Vista continued to conduct the ongoing remediation at its expense until November 12, 2009. We are now responsible for remediation costs up to about $150,000 of expense per year, as well as costs in any year in excess of this annual amount up to an aggregate one-time amount of about $2.3 million. As part of our ongoing assessment of our environmental contingencies, we determined these remediation costs to be probable and estimable and therefore maintained a $1.3 million accrual in non-current liabilities at December 31, 2010.
As for employee and independent contractor exposure claims, CONDEA Vista is responsible for exposures before November 12, 2009, and we are responsible for exposures after November 12, 2009, on a pro rata basis determined by years of employment or service before and after November 12, 1999, by any claimant.
In May 2008, our corporate management was informed that further efforts to remediate a spill of styrene reducer at our Royal Mouldings facility in Atkins, Virginia would be necessary. The spill was the result of a supply line rupture from an external holding tank. As a result of this spill, the facility entered into a voluntary remediation agreement with the Virginia Department of Environmental Quality ("VDEQ") in August 2003 and began implementing the terms of the voluntary agreement shortly thereafter. In August 2007, the facility submitted a report on the progress of the remediation to the VDEQ. Subsequently, the VDEQ responded by indicating that continued remediation of the area impacted by the spill is required. While the additional remediation costs may exceed $100,000, we do not expect such costs will have a material effect on our financial position, results of operations or cash flows.
We believe that we are in material compliance with all current environmental laws and regulations. We estimate that any expenses incurred in maintaining compliance with these requirements will not materially affect earnings or cause us to exceed our level of anticipated capital expenditures. However, there can be no assurance that regulatory requirements will not change, and it is not possible to accurately predict the aggregate cost of compliance resulting from any such changes.
12. RELATED PARTY TRANSACTIONS
Our joint ventures are accounted for using the equity method. We own a 50 percent interest in PHH Monomers, LLC ("PHH"), a manufacturing joint venture with PPG Industries, Inc., ("PPG"), to produce VCM used in our chlorovinyls segment. We receive 50 percent of the VCM production of PHH and consume the majority of the production to produce our vinyl resins. Pursuant to the terms of the operating agreement and a related manufacturing and services agreement, PPG is the operator of PHH. We purchase our share of the raw materials and pay 50 percent of the processing costs for the right to 50 percent of the VCM production of PHH. PHH has capacity to produce 1.15 million pounds of VCM. The chlorine needs of the PHH facility are supplied via pipeline, under a long-term market price based contract with PPG. PHH is an integral part of our manufacturing operations.
At December 31, 2010 and 2009, our investment in joint ventures included in our chlorovinyls segment was $3.6 million and $7.1 million, respectively, which primarily represents 50 percent of the property, plant and equipment of the PHH production facility, and is included in other long-term assets.
81
Georgia Gulf Corporation and Subsidiaries
Notes to Consolidated Financial Statements (Continued)
12. RELATED PARTY TRANSACTIONS (Continued)
We own a 50 percent interest in several manufacturing joint ventures in the building products segment. We sell raw materials to these joint ventures at market prices. Sales of materials to these joint ventures for fiscal year 2010, 2009 and 2008 were $11.8 million, $12.4 million and $20.5 million, respectively. As of December 31, 2010 and 2009, our investment in these manufacturing joint ventures was $6.1 million and $5.7 million, respectively.
At December 31, 2010 and 2009, we had $1.4 million and $7.1 million, respectively, of liabilities due to these related parties included in accounts payable. At December 31, 2010 and 2009, we had $3.7 million and $7.4 million, respectively, of receivables due from these related parties included in accounts receivable. Our equity in earnings from our joint ventures was $1.9 million, $2.0 million, and $3.1 million for the years ended December 31, 2010, 2009, and 2008, respectively.
13. STOCKHOLDERS' EQUITY
On April 20, 2010, the Board of Directors declared a dividend distribution of one preferred share purchase right (a "Right") for each outstanding share of common stock of the Company. The Rights were issued pursuant to a Rights Agreement, dated as of April 26, 2010, by and between the Company and Computershare Trust Company, N.A., as rights agent. The plan pursuant to which the Rights were issued took effect upon the expiration of the Company's prior rights plan on April 27, 2010.
Pursuant to the Rights Agreement, each outstanding share of common stock is accompanied by a Right, which, if exercisable, would entitle the holder to purchase from us 1/100th of a share of Junior Participating Preferred Stock for $100.00, subject to adjustment. The Rights will generally not become exercisable until the earlier of (1) 10 days after a public announcement by the Company that a person or group has become an Acquiring Person (as defined in the Rights Agreement), and (2) 10 business days (or a later date determined by our Board) after a person or group begins a tender or exchange offer that would result in that person or group becoming the beneficial owner of 20% or more of our common stock (the "Distribution Date"). Subject to certain conditions, if a person or group becomes an Acquiring Person, each Right will entitle its holder (other than an Acquiring Person) to receive, upon exercise, shares of common stock having a market value equal to two times the Right's exercise price.
In addition, subject to certain conditions, if we are involved in a merger or certain other business combination transactions, each Right will entitle its holder (other than an Acquiring Person) to receive, upon exercise, shares of common stock of the acquiring company having a market value equal to two times the Right's exercise price. If issued, the Junior Participating Preferred Stock would be entitled, subject to the prior rights of any senior preferred stock, to a dividend equal to the greater of $1.00 or one hundred times the aggregate per share amount of all cash and non-cash dividends, other than dividends payable in common shares, declared on the common shares. The Rights may be redeemed by the Company for $0.001 per right at any time before the later of the Distribution Date and the date of the first public announcement or disclosure by the Company that a person or group has become an Acquiring Person. Unless earlier redeemed or exchanged, the rights will expire on (i) May 10, 2013, or (ii) the day following the certification of the voting results of the Company's 2011 annual meeting of stockholders, if the Company's stockholders do not approve the plan pursuant to which the Rights were issued at such meeting. In connection with the distribution of Rights, 1.0 million authorized shares of preferred stock have been designated as Junior Participating Preferred Stock.
82
Georgia Gulf Corporation and Subsidiaries
Notes to Consolidated Financial Statements (Continued)
14. STOCK-BASED COMPENSATION
On September 17, 2009, our stockholders approved the 2009 Equity and Performance Incentive Plan (the "2009 Plan"). The 2009 Plan provides for the issuance of up to 3,033,000 (post the 1-for-25 reverse split effective July 2009) shares of our common stock. On July 27, 2009, the 2009 Plan was adopted in connection with the completion of our 2009 debt exchange described in Note 10. Additionally, on July 27, 2009, restricted share units for 2,274,745 shares in the aggregate were granted under the 2009 Plan. The fair value used to determine stock compensation for this grant was the closing stock price of our common stock on July 27, 2009, the date of grant.
We have various types of share-based payment arrangements with our employees and non-employee directors including restricted stock units, deferred stock units, and stock options. We issue new shares upon the exercise of stock options and the issuance of deferred stock units and restricted stock units. As of December 31, 2010, there were 614,182 shares available for future grant to employees and non-employee directors under our 2009 Plan.
Total after-tax share-based compensation cost by type of program was as follows:
| |
Year ended December 31 | |||||||||
|---|---|---|---|---|---|---|---|---|---|---|
In thousands
|
2010 | 2009 | 2008 | |||||||
Restricted and deferred stock units expense |
$ | 2,784 | $ | 16,164 | $ | 1,674 | ||||
Stock options expense |
703 | 1,497 | 1,628 | |||||||
Before-tax share-based compensation expense |
3,487 | 17,661 | 3,302 | |||||||
Income tax benefit |
(943 | ) | (6,245 | ) | (227 | ) | ||||
After-tax share-based compensation expense |
$ | 2,544 | $ | 11,416 | $ | 3,075 | ||||
The amount of share-based compensation cost capitalized in 2010, 2009 and 2008 was not material.
Stock Options. Option prices are equal to the closing price of our common stock on the day of grant. Options vest over a one or three-year period from the date of grant and expire no more than ten years after the date of grant. A summary of stock option activity under all plans during 2010 is as follows:
| |
Year ended December 31, 2010 | |||||||||||
|---|---|---|---|---|---|---|---|---|---|---|---|---|
| |
Shares | Weighted Average Remaining Contractual Terms |
Weighted Average Exercise Price |
Aggregate Intrinsic Value |
||||||||
| |
|
|
|
(In thousands) |
||||||||
Outstanding on January 1, 2010 |
159,114 | $ | 348.52 | |||||||||
Granted |
— | — | ||||||||||
Exercised |
— | — | ||||||||||
Forfeited |
(3,361 | ) | 714.97 | |||||||||
Expired |
(60 | ) | 682.81 | |||||||||
Outstanding on December 31, 2010 |
155,693 | 6.0 years | $ | 340.48 | $ | 155 | ||||||
Exercisable on December 31, 2010 |
111,213 | 5.2 years | 455.22 | 52 | ||||||||
Vested or expected to vest at December 31, 2010 |
155,319 | 6.0 years | $ | 341.18 | $ | 153 | ||||||
83
Georgia Gulf Corporation and Subsidiaries
Notes to Consolidated Financial Statements (Continued)
14. STOCK-BASED COMPENSATION (Continued)
There were no stock options granted during 2010. The weighted-average grant date fair value of options granted during 2009 and 2008 was $16.77 and $54.25, respectively. There were no options exercised during the years ended December 31, 2010, 2009 and 2008. The intrinsic value is calculated as the difference between the market value on December 31, 2010 and the exercise price of the shares. The following table summarizes information about stock options outstanding at December 31, 2010:
| |
Outstanding | Exercisable | |||||||||||||
|---|---|---|---|---|---|---|---|---|---|---|---|---|---|---|---|
Range of Exercise Prices
|
Shares | Weighted Average Exercise Price |
Weighted Average Remaining Contractual Life |
Shares | Weighted Average Exercise Price |
||||||||||
$8.75 to $41.50 |
54,308 | $ | 22.62 | 8.2 years | 19,441 | $ | 23.91 | ||||||||
$90.50 to $476.00 |
43,970 | 264.57 | 5.2 years | 34,357 | 291.42 | ||||||||||
$510.75 to $1,334.50 |
57,415 | 699.27 | 4.6 years | 57,415 | 699.27 | ||||||||||
Total $8.75 to $1,334.50 |
155,693 | $ | 340.48 | 6.0 years | 111,213 | $ | 455.22 | ||||||||
Stock-Based Compensation related to Stock Option Plan. The fair value of stock options granted has been estimated as of the date of grant using the Black-Scholes option-pricing model. The use of a valuation model requires us to make certain assumptions with respect to selected model inputs. The use of different assumptions could result in materially different valuations. We use the historical volatility for our stock, as we believe that historical volatility is more representative than implied volatility. The expected life of the awards is based on historical and other economic data trended into the future. The risk-free interest rate assumption is based on observed interest rates appropriate for the terms of our awards. The dividend yield assumption is based on our dividend paying history and expectation of future dividend payments. The weighted average assumptions used in the Black-Scholes model are as follows (as described above no stock options were granted in the year ended December 31, 2010):
| |
Stock option grants | ||||
|---|---|---|---|---|---|
| |
Year Ended December 31, | ||||
| |
2009 | ||||
Assumptions |
|||||
Risk-free interest rate |
2.13 | % | |||
Expected life |
6.0 years | ||||
Expected volatility |
101 | % | |||
Expected dividend yield |
— | ||||
Restricted and Deferred Stock. During 2010, 2009 and 2008, we granted 154,048, 2,274,745 and 10,959 restricted stock units and deferred stock units, respectively, to certain key employees and non-employee directors. The restricted and deferred stock units normally vest over a three-year period. The 2009 grant was made in connection with the company's debt exchange completed on July 29, 2009. One-half of the restricted stock units granted to officers and non-officer employees on July 27, 2009 vested on December 22, 2009, due to the company achieving certain pre-established targets. Restricted stock surrendered in satisfaction of required minimum tax withholding obligations was 128,654, 396,906
84
Georgia Gulf Corporation and Subsidiaries
Notes to Consolidated Financial Statements (Continued)
14. STOCK-BASED COMPENSATION (Continued)
and 659 shares during 2010, 2009, and 2008, respectively. A summary of restricted and deferred stock units activity under all plans during 2010 is as follows:
| |
Year ended December 31, 2010 | |||||||||||
|---|---|---|---|---|---|---|---|---|---|---|---|---|
| |
Shares | Weighted Average Remaining Contractual Terms |
Weighted Average Grant Date Fair Value |
Aggregate Intrinsic Value |
||||||||
| |
|
|
|
(In thousands) |
||||||||
Outstanding on January 1, 2010 |
1,133,426 | $ | 10.82 | |||||||||
Granted |
154,048 | $ | 16.37 | |||||||||
Vested and released |
(372,578 | ) | $ | 13.21 | ||||||||
Forfeited |
(5,538 | ) | $ | 16.93 | ||||||||
Outstanding on December 31, 2010 |
909,358 | 1.8 years | $ | 10.75 | $ | 21,879 | ||||||
Vested or expected to vest at December 31, 2010 |
905,844 | 1.8 years | $ | 10.75 | $ | 21,795 | ||||||
The weighted average grant date fair value per share of restricted and deferred stock units granted during 2010, 2009 and 2008 was $16.37, $8.75 and $168.00, respectively, which is based on the stock price as of the date of grant. The total intrinsic value of restricted stock units and deferred stock units that vested during the years ended December 31, 2010, 2009 and 2008 was $5.6 million, $20.1 million and $0.1 million, respectively.
Nonvested shares. A summary of the status of the nonvested share activity under all plans during 2010 is as follows:
| |
Year ended December 31, 2010 | ||||||
|---|---|---|---|---|---|---|---|
| |
Shares | Weighted Average Grant Date Fair Value |
|||||
Nonvested on January 1, 2010 |
1,212,590 | $ | 12.66 | ||||
Granted |
154,048 | $ | 16.37 | ||||
Vested |
(407,246 | ) | $ | 17.17 | |||
Forfeited and expired |
(5,738 | ) | $ | 18.32 | |||
Nonvested on December 31, 2010 |
953,654 | $ | 11.31 | ||||
As of December 31, 2010, we had approximately $5.1 million of total unrecognized compensation cost related to nonvested share-based compensation, which we will record in our statements of operations over a weighted average recognition period of less than two years. The total fair value of shares vested during 2010, 2009 and 2008, was $7.0 million, $13.8 million and $6.5 million, respectively.
85
Georgia Gulf Corporation and Subsidiaries
Notes to Consolidated Financial Statements (Continued)
15. EMPLOYEE RETIREMENT PLANS
We have certain employee retirement plans that cover substantially all of our employees. The expense (credit) incurred for these plans was approximately an expense of $2.3 million, a credit of $1.3 million, and an expense of $7.4 million for the years ended December 31, 2010, 2009 and 2008, respectively. These plans are discussed below.
Most employees are covered by defined contribution plans under which we made contributions to individual employee accounts. We had expense related to these defined contribution plans of approximately $1.3 million, $1.8 million and $2.5 million for the years ended December 31, 2010, 2009 and 2008, respectively. On June 12, 2009, the Company announced to its employees that it would discontinue the Company matching contribution feature of the 401(k) Plan effective with the first payroll period having a disbursement date after July 31, 2009. During July 2010, the Company announced it was reinstating the company match for the U.S. and Canadian retirement savings plans. Most of our U.S. employees are covered by a defined benefit cash balance pension plan. In addition, employees who worked at our now-closed manufacturing facility in Sarnia, Ontario are covered by a defined benefit pension plan for which the benefits are based on years of service and the employee's compensation. We sponsored a postretirement health care plan, which covered employees at our closed manufacturing facility in Sarnia, Ontario, that was terminated, and fully settled during 2009.
In December 2008, we announced that we would close our manufacturing facility in Sarnia, Ontario. As a result, we wound up the defined benefit pension plan during 2009, and terminated the postretirement health care plan, which covered employees who worked at this facility. Due to the wind up of the pension plan, special termination retirement benefits were available to certain employees who are covered by this plan. A special termination benefit charge of $2.0 million was recognized in the fourth quarter of fiscal 2008 for these additional benefits. In addition, curtailment gains were recognized in the fourth quarter of fiscal year 2008 due to reductions in staff at this facility. As a result of the curtailment, a curtailment gain of $0.6 million related to the defined benefit pension plan, and a curtailment gain of $0.4 million related to the other postretirement plan was recorded in the fourth quarter of fiscal 2008. Curtailment gains of $1.4 million were recognized as of December 31, 2009 when the remaining employees were released and the plant decommissioning was complete. During February 2011, we made a contribution of $0.8 million to the pension plan in order to fully fund the wind up deficit and allow benefits to be settled. All pension benefit obligations will be fully settled in early 2011. All future benefit obligations in the postretirement health care plan were fully settled as of December 31, 2009. The Company recognized benefit income for this plan of $2.5 million for the year ended December 31, 2009, which included a curtailment gain of $0.8 million and a settlement gain of $1.7 million. Also in 2009, we made a cash payout offer to the remaining participants in the postretirement health care plan, which each accepted, thus completing the wind up of the plan.
In February 2009, upon approval by the Compensation Committee of the Board of Directors, we announced that we were freezing the benefits for the Georgia Gulf Corporation Retirement Plan (the "Plan") as of March 31, 2009. No future benefits accrued under this plan after March 31, 2009. As a result, we recognized a curtailment gain of $4.3 million in fiscal 2009 due to accelerated recognition of prior service credits. In addition, as a result of freezing the Plan on March 31, 2009, we changed the amortization method for gains and losses from the average expected future service period for active plan participants to the average expected future lifetime for all plan participants. This change in amortization method is reflected in net periodic benefit costs after March 31, 2009 including fiscal year 2010.
86
Georgia Gulf Corporation and Subsidiaries
Notes to Consolidated Financial Statements (Continued)
15. EMPLOYEE RETIREMENT PLANS (Continued)
Benefit Obligations. The reconciliation of the beginning and ending balances of the projected benefit obligation for defined benefit plans is as follows:
| |
Pension Benefits | |||||||
|---|---|---|---|---|---|---|---|---|
In thousands
|
2010 | 2009 | ||||||
Change in Benefit Obligation |
||||||||
Benefit obligation, beginning of year |
$ | 133,229 | $ | 118,666 | ||||
Service cost |
— | 1,231 | ||||||
Interest cost |
7,747 | 7,803 | ||||||
Actuarial loss |
6,378 | 9,104 | ||||||
Foreign currency exchange rate changes |
390 | 850 | ||||||
Gross benefits paid |
(4,721 | ) | (3,886 | ) | ||||
Plan amendments |
110 | — | ||||||
Curtailments |
— | (539 | ) | |||||
Benefit obligation, end of year |
$ | 143,133 | $ | 133,229 | ||||
Accumulated benefit obligation, end of year |
$ | 143,133 | $ | 133,229 | ||||
The accumulated benefit obligation is defined as the actuarial present value of pension benefits (whether vested or unvested) attributed to employee service rendered before December 31, 2010 and 2009, respectively, and based on employee service and compensation prior to the applicable date. The accumulated benefit obligation differs from the projected benefit obligation in that it includes no assumption about future compensation levels. The accumulated benefit obligation is equal to the projected benefit obligation at December 31, 2010 because no future benefits are accruing under the pension plans.
Plan Assets. The summary and reconciliation of the beginning and ending balances of the fair value of the plans' assets were as follows:
| |
Pension Benefits | |||||||
|---|---|---|---|---|---|---|---|---|
In thousands
|
2010 | 2009 | ||||||
Change in Plan Assets |
||||||||
Fair value of plan assets, beginning of year |
$ | 115,613 | $ | 99,611 | ||||
Actual return on plan assets |
9,704 | 18,099 | ||||||
Foreign currency exchange rate changes |
397 | 817 | ||||||
Employer contribution |
1,516 | 972 | ||||||
Gross benefits paid |
(4,721 | ) | (3,886 | ) | ||||
Fair value of plan assets, end of year |
$ | 122,509 | $ | 115,613 | ||||
In accordance with ASC topic 820, the Plan classifies its investments based on the lowest level of input that is significant to the fair value measurement. The following table sets forth by level within the
87
Georgia Gulf Corporation and Subsidiaries
Notes to Consolidated Financial Statements (Continued)
15. EMPLOYEE RETIREMENT PLANS (Continued)
fair value hierarchy a summary of the Plan's investments measured at fair value and the target and current allocation.
Asset Category
|
Target Allocation 2011 |
Total | Quoted Prices in Active Markets for Identical Assets (Level 1) |
Significant Observable Inputs (Level 2) |
Significant Unobservable Inputs (Level 3) |
Percentage of Plan Assets, December 31, 2010 |
||||||||||||||
|---|---|---|---|---|---|---|---|---|---|---|---|---|---|---|---|---|---|---|---|---|
| (In thousands, except percentages) |
|
|
|
|
||||||||||||||||
Short-term investment funds |
$ | 3,715 | $ | — | $ | 3,715 | $ | — | 3 | % | ||||||||||
U.S. equity securities: |
||||||||||||||||||||
Consumer Discretionary Sector |
6,739 | 6,739 | — | — | ||||||||||||||||
Consumer Staples Sector |
6,291 | 6,291 | — | — | ||||||||||||||||
Energy Sector |
4,707 | 4,707 | — | — | ||||||||||||||||
Financial Sector |
4,458 | 4,361 | 97 | — | ||||||||||||||||
Health Care Sector |
4,657 | 4,657 | — | — | ||||||||||||||||
Industrials Sector |
4,464 | 4,464 | — | — | ||||||||||||||||
Information Technology Sector |
5,813 | 5,813 | — | — | ||||||||||||||||
Capital appreciation mutual fund |
3,700 | 3,700 | ||||||||||||||||||
Small cap growth mutual fund |
5,469 | 5,469 | — | — | ||||||||||||||||
Other |
1,337 | 1,337 | ||||||||||||||||||
Total U.S. equity securities |
43 | % | 47,635 | 47,538 | 97 | — | 39 | % | ||||||||||||
International equity securities: |
||||||||||||||||||||
EUROPACIFIC GROWTH fund |
24,249 | 24,249 | — | — | ||||||||||||||||
Pooled Segregated Fund |
8,149 | 8,149 | ||||||||||||||||||
Other |
1,374 | 1,374 | — | — | ||||||||||||||||
Total International equity securities |
20 | % | 33,772 | 25,623 | 8,149 | — | 28 | % | ||||||||||||
Fixed income securities: |
||||||||||||||||||||
Financial Services Sector |
64 | 64 | — | |||||||||||||||||
Pimco Total Return INSTL |
25,256 | 25,256 | — | — | ||||||||||||||||
Total Fixed Income Securities |
20 | % | 25,320 | 25,256 | 64 | — | 21 | % | ||||||||||||
Long-biased hedge fund |
10 | % | 10,184 | — | — | 10,184 | 8 | % | ||||||||||||
Real estate partnership |
3 | % | 1,738 | — | 1,738 | 1 | % | |||||||||||||
Other securities |
145 | 145 | ||||||||||||||||||
Emerging Markets |
5 | % | ||||||||||||||||||
Total |
100 | % | $ | 122,509 | $ | 98,562 | $ | 12,025 | $ | 11,922 | 100 | % | ||||||||
88
Georgia Gulf Corporation and Subsidiaries
Notes to Consolidated Financial Statements (Continued)
15. EMPLOYEE RETIREMENT PLANS (Continued)
Asset Category
|
Total | Quoted Prices in Active Markets for Identical Assets (Level 1) |
Significant Observable Inputs (Level 2) |
Significant Unobservable Inputs (Level 3) |
Percentage of Plan Assets, December 31, 2009 |
||||||||||||
|---|---|---|---|---|---|---|---|---|---|---|---|---|---|---|---|---|---|
| (In thousands, except percentage) |
|
|
|
||||||||||||||
Short-term investment fund |
$ | 14,228 | $ | — | $ | 14,228 | $ | — | 12 | % | |||||||
US Equity securities: |
|||||||||||||||||
Consumer Discretionary Sector |
5,317 | 5,317 | — | — | |||||||||||||
Consumer Staples Sector |
3,982 | 3,982 | — | — | |||||||||||||
Energy Sector |
3,569 | 3,569 | — | — | |||||||||||||
Financial Sector |
5,477 | 5,358 | 119 | — | |||||||||||||
Health Care Sector |
3,796 | 3,796 | — | — | |||||||||||||
Industrials Sector |
2,834 | 2,834 | — | — | |||||||||||||
Information Technology Sector |
5,355 | 5,355 | — | — | |||||||||||||
Capital appreciation mutual fund |
9,583 | 9,583 | |||||||||||||||
Small cap growth mutual fund |
3,963 | 3,963 | — | — | |||||||||||||
Other |
2,452 | 2,452 | |||||||||||||||
Total US Equity securities |
46,328 | 46,209 | 119 | — | 40 | % | |||||||||||
International equity securities: |
|||||||||||||||||
EUROPACIFIC GROWTH fund |
20,101 | 20,101 | — | — | |||||||||||||
Pooled Segregated Fund |
6,500 | 6,500 | |||||||||||||||
Other |
1,382 | 1,382 | — | — | |||||||||||||
Total International equity securities |
27,983 | 21,483 | 6,500 | — | 24 | % | |||||||||||
Fixed Income securities: |
|||||||||||||||||
Financial Services Sector |
59 | — | 59 | ||||||||||||||
Pimco Total Return INSTL |
25,050 | 25,050 | — | — | |||||||||||||
Total Fixed Income Securities |
25,109 | 25,050 | — | 59 | 22 | % | |||||||||||
Real estate partnership |
1,824 | — | 1,824 | 2 | % | ||||||||||||
Other Securities |
141 | 141 | |||||||||||||||
Total |
$ | 115,613 | $ | 92,883 | $ | 20,847 | $ | 1,883 | 100 | % | |||||||
Equity securities do not include any of our common stock at the end of 2010 and 2009.
89
Georgia Gulf Corporation and Subsidiaries
Notes to Consolidated Financial Statements (Continued)
15. EMPLOYEE RETIREMENT PLANS (Continued)
Funded Status. The following table shows the funded status of the plans reconciled to the amounts reported on the balance sheets:
| |
Pension Benefits December 31, |
|||||||
|---|---|---|---|---|---|---|---|---|
In thousands
|
2010 | 2009 | ||||||
Funded status, end of year: |
||||||||
Fair value of plan assets |
$ | 122,509 | $ | 115,613 | ||||
Benefit obligations |
143,133 | 133,229 | ||||||
Funded status |
(20,624 | ) | (17,616 | ) | ||||
Amount recognized, end of year |
$ | (20,624 | ) | $ | (17,616 | ) | ||
Amounts recognized in the balance sheets consist of: |
||||||||
Current liability |
$ | (1,274 | ) | $ | (419 | ) | ||
Noncurrent liability |
(19,350 | ) | (17,197 | ) | ||||
|
$ | (20,624 | ) | $ | (17,616 | ) | ||
Gross amounts recognized in accumulated other comprehensive income consist of: |
||||||||
Net actuarial loss |
$ | 43,461 | $ | 37,760 | ||||
Prior service credit |
106 | — | ||||||
|
$ | 43,567 | $ | 37,760 | ||||
Changes in Other Comprehensive Income (Loss). The following table summarizes the changes in plan assets and benefit obligations which were recognized in other comprehensive income:
| |
Other Changes in Plan Assets and Benefit Obligations Recognized in Other Comprehensive Loss for Pension December 31, |
|||||||
|---|---|---|---|---|---|---|---|---|
In thousands
|
2010 | 2009 | ||||||
End of year: |
||||||||
Curtailment effects |
$ | — | $ | 6,224 | ||||
Current year actuarial loss |
6,495 | 70 | ||||||
Amortization of actuarial loss |
(794 | ) | (1,480 | ) | ||||
Current year prior service cost |
110 | — | ||||||
Amortization of prior service (cost) credit |
(4 | ) | 129 | |||||
Total recognized in other comprehensive income |
$ | 5,807 | $ | 4,943 | ||||
Total recognized in net periodic benefit cost and other comprehensive income (loss) |
$ | 4,498 | $ | (936 | ) | |||
90
Georgia Gulf Corporation and Subsidiaries
Notes to Consolidated Financial Statements (Continued)
15. EMPLOYEE RETIREMENT PLANS (Continued)
The estimated amount that will be amortized from accumulated other comprehensive income (loss) into net periodic benefit cost in 2011 is $1.8 million consisting of:
In thousands
|
Pension | |||
|---|---|---|---|---|
Actuarial loss |
$ | 1,799 | ||
Prior service cost |
4 | |||
Total |
$ | 1,803 | ||
Net Periodic Benefit (Income) Cost. The amount of net periodic benefit (income) cost recognized includes the following components:
| |
Pension Benefit Year Ended December 31, |
|||||||||||
|---|---|---|---|---|---|---|---|---|---|---|---|---|
In thousands
|
2010 | 2009 | 2008 | |||||||||
Components of net periodic benefit (income) cost: |
||||||||||||
Service cost |
$ | — | $ | 1,231 | $ | 5,136 | ||||||
Interest cost |
7,747 | 7,803 | 7,427 | |||||||||
Expected return on assets |
(9,854 | ) | (8,135 | ) | (11,024 | ) | ||||||
Amortization of: |
||||||||||||
Prior service cost (credit) |
4 | (129 | ) | (546 | ) | |||||||
Actuarial loss (gain) |
794 | 1,524 | (12 | ) | ||||||||
Special termination benefits |
— | — | 2,036 | |||||||||
Curtailment gain |
— | (5,690 | ) | (649 | ) | |||||||
Total net periodic benefit (income) cost |
$ | (1,309 | ) | $ | (3,396 | ) | $ | 2,368 | ||||
Assumptions. The major assumption used to determine benefit obligations for our pension plans is a weighted average discount rate, which was 6.00% in 2009 and 5.48% in 2010. Due to the pension plans being frozen in February 2009, a rate of compensation increase is no longer an applicable assumption in determining benefit obligations for our pension plans.
The major assumptions used to determine net periodic benefit (income) cost for pension plans are presented as weighted-averages:
| |
Year Ended December 31, | |||||||||
|---|---|---|---|---|---|---|---|---|---|---|
| |
2010 | 2009 | 2008 | |||||||
Discount rate |
6.00 | % | 6.67 | % | 6.19 | % | ||||
Expected long-term rate of return on plan assets |
8.66 | % | 8.67 | % | 7.94 | % | ||||
Rate of compensation increase |
N/A | (1) | 4.51 | % | 4.19 | % | ||||
- (1)
- Due to the pension plans being frozen, the rate of compensation increase is no longer applicable.
The expected long-term rate of return on plan assets assumption is based on historical and projected rates of return for current and planned asset classes in the plan's investment portfolio. Projected rates of return for each of the plans' projected asset classes were selected after analyzing
91
Georgia Gulf Corporation and Subsidiaries
Notes to Consolidated Financial Statements (Continued)
15. EMPLOYEE RETIREMENT PLANS (Continued)
historical experience and future expectations of the returns and volatility of the various asset classes. Based on the target asset allocation for each asset class, the overall expected rate of return for the portfolio was developed and adjusted for historical and expected experience of active portfolio management results compared to the benchmark returns and for the effect of expenses paid from plan assets.
Our investment committee establishes investment policies and strategies and regularly monitors the performance of the plans' funds. Our investment strategy with respect to pension assets is to invest the assets in accordance with the "prudent investor" guidelines contained in the Employee Retirement Income Security Act of 1974, and fiduciary standards. Our policy on funding is to contribute an amount within the range of the minimum required and the maximum tax-deductible contribution.
Employer contributions include direct benefits paid under all pension plans of $0.4 million from employer assets in 2010, 2009 and 2008, respectively. We previously sponsored a post-retirement benefit program for certain Canadian employees which was terminated and fully settled during 2009. There were no benefit obligations for the post-retirement benefit program as of December 31, 2010 or 2009. Benefit costs (credits) related to our other post-retirement program were income of $2.5 million in 2009, and income of $0.1 million in 2008. There were no benefit costs incurred in this program in 2010.
Expected Cash Flows. We expect to make contributions of $1.3 million to our pension plans during 2011. Our expected direct benefit payments for 2011 is approximately $0.4 million for all pension plans. Expected benefit payments for all pension plans are as follows:
In thousands
|
Pension Benefits | ||||
|---|---|---|---|---|---|
Expected benefit payments: |
|||||
2011 |
$ | 14,172 | |||
2012 |
$ | 5,694 | |||
2013 |
$ | 6,277 | |||
2014 |
$ | 6,843 | |||
2015 |
$ | 7,416 | |||
2016-2020 |
$ | 44,847 | |||
16. INCOME TAXES
For the years ended December 31, 2010, 2009 and 2008, income (loss) from continuing operations before taxes consists of the following:
| |
Year Ended December 31, | |||||||||
|---|---|---|---|---|---|---|---|---|---|---|
In thousands
|
2010 | 2009 | 2008 | |||||||
U.S. operations |
$ | 32,381 | $ | 253,795 | $ | (143,030 | ) | |||
Foreign operations |
11,576 | (28,244 | ) | (133,835 | ) | |||||
Total |
$ | 43,957 | $ | 225,551 | $ | (276,865 | ) | |||
92
Georgia Gulf Corporation and Subsidiaries
Notes to Consolidated Financial Statements (Continued)
16. INCOME TAXES (Continued)
Taxes from continuing operations consist of the following:
| |
Year Ended December 31, | ||||||||||
|---|---|---|---|---|---|---|---|---|---|---|---|
In thousands
|
2010 | 2009 | 2008 | ||||||||
Current income taxes: |
|||||||||||
Federal |
$ | 9,793 | $ | (22,177 | ) | $ | 8,871 | ||||
State |
1,587 | 1,721 | 973 | ||||||||
Foreign |
(8,182 | ) | (1,267 | ) | (2,342 | ) | |||||
Total current |
3,198 | (21,723 | ) | 7,502 | |||||||
Deferred income taxes: |
|||||||||||
Federal |
(1,838 | ) | 103,770 | (25,828 | ) | ||||||
State |
(81 | ) | 12,445 | (2,332 | ) | ||||||
Foreign |
— | — | (1,037 | ) | |||||||
Total deferred |
(1,919 | ) | 116,215 | (29,197 | ) | ||||||
Provision for (benefit from) income taxes |
$ | 1,279 | $ | 94,492 | $ | (21,695 | ) | ||||
Income tax expense attributable to income (loss) before income taxes from continuing operations differs from the amounts computed by applying the U.S. statutory federal income tax rate to income (loss) before income taxes from continuing operations as follows:
| |
Year Ended December 31, | ||||||||||
|---|---|---|---|---|---|---|---|---|---|---|---|
| |
2010 | 2009 | 2008 | ||||||||
Statutory federal income tax rate |
35.0 | % | 35.0 | % | 35.0 | % | |||||
State and local income taxes, net of federal benefit |
1.8 | 3.6 | 0.4 | ||||||||
Difference between U.S. and foreign tax rates |
(2.3 | ) | 1.7 | (2.4 | ) | ||||||
Tax credits |
— | (3.6 | ) | — | |||||||
Domestic manufacturing deduction |
(2.2 | ) | — | — | |||||||
Non-deductible compensation |
0.5 | 0.6 | — | ||||||||
Percentage depletion |
(1.9 | ) | (0.3 | ) | 0.2 | ||||||
Legislation changes impacting rate |
— | — | (0.2 | ) | |||||||
Debt restructuring activities |
1.6 | 0.8 | — | ||||||||
Change in valuation allowance |
(13.4 | ) | 3.2 | (18.4 | ) | ||||||
Net change in unrecognized tax benefits |
(17.3 | ) | 0.3 | 0.1 | |||||||
Non-deductible goodwill, other intangibles and other long-lived asset impairment |
— | — | (7.5 | ) | |||||||
Other, net |
1.1 | 0.6 | 0.6 | ||||||||
Effective income tax rate |
2.9 | % | 41.9 | % | 7.8 | % | |||||
Net cash (refunds) payments for income taxes during 2010, 2009 and 2008 were ($16.0 million), $10.0 million and $27.9 million, respectively.
93
Georgia Gulf Corporation and Subsidiaries
Notes to Consolidated Financial Statements (Continued)
16. INCOME TAXES (Continued)
Our net deferred tax liability consisted of the following major items:
| |
December 31, | ||||||||
|---|---|---|---|---|---|---|---|---|---|
In thousands
|
2010 | 2009 | |||||||
Deferred tax assets: |
|||||||||
Receivables |
$ | 2,434 | $ | 2,782 | |||||
Inventories |
3,895 | 5,148 | |||||||
Net operating loss carryforwards |
19,312 | 28,888 | |||||||
Employee compensation |
7,714 | 9,574 | |||||||
Accrued liabilities |
2,671 | 2,550 | |||||||
Tax credits |
22,987 | 21,632 | |||||||
Spare parts inventories |
78 | 83 | |||||||
Environmental |
1,492 | 1,892 | |||||||
Property, plant and equipment—foreign |
70,854 | 61,485 | |||||||
Pension |
7,855 | 6,765 | |||||||
Federal benefit of state unrecognized tax benefits |
1,665 | 1,712 | |||||||
Valuation allowance |
(97,512 | ) | (99,489 | ) | |||||
Total deferred tax assets |
43,445 | 43,022 | |||||||
Deferred tax liability: |
|||||||||
Property, plant and equipment—domestic |
(112,380 | ) | (127,890 | ) | |||||
Intangible assets |
(34,825 | ) | (29,870 | ) | |||||
Other |
(3,082 | ) | (3,916 | ) | |||||
Debt restructuring |
(49,947 | ) | (46,975 | ) | |||||
Foreign currency gain |
(17,672 | ) | (10,104 | ) | |||||
Total deferred tax liability |
(217,906 | ) | (218,755 | ) | |||||
Net deferred tax liability |
$ | (174,461 | ) | $ | (175,733 | ) | |||
As of December 31, 2010, we had U.S. state and foreign net operating loss carryforwards ("NOLs"). Our foreign NOLs principally relate to our operations in Canada and reside in both federal and provincial tax jurisdictions. The jurisdictional amount of NOLs as of December 31, 2010, and the years in which they will expire, are as follows (in thousands):
Jurisdiction
|
NOL amount | Year of expiration | |||||
|---|---|---|---|---|---|---|---|
U.S. state |
$ | 2,636 | 2012-2030 | ||||
Canada federal |
$ | 94,749 | 2023-2029 | ||||
Canada provincial |
$ | 94,749 | 2026-2029 | ||||
As a result of the debt exchange completed in July 2009, we experienced a change in control as defined by the Internal Revenue Code. Because of this change in control, we will be unable to realize some of the benefit from the U.S. federal net operating losses arising before the acquisition of the Royal Group. Therefore, we no longer carry those net operating losses as a deferred tax asset. This change in control will also limit our ability to deduct certain expenses in the future and we have recorded deferred tax liabilities to reflect this. The debt exchange may also limit our ability to realize the benefit of previously accrued state net operating losses, and we have recorded a valuation
94
Georgia Gulf Corporation and Subsidiaries
Notes to Consolidated Financial Statements (Continued)
16. INCOME TAXES (Continued)
allowance to offset that tax benefit. In addition, in 2009 and 2008 we recorded a $7.3 million and a $55.5 million valuation allowance, respectively, on certain deferred tax assets in Canada that, in the judgment of management, are not more likely than not to be realized. In assessing the realizability of deferred tax assets, management considers whether it is more likely than not that some or all of the deferred tax assets will not be realized. The ultimate realization of deferred tax assets depends on the generation of future taxable income during the periods in which those temporary differences are deductible. Management considers the scheduled reversal of deferred tax liabilities (including the impact of available carryback and carryforward periods), projected taxable income, and tax-planning strategies available to us in making this assessment. In 2010, the Company's Canadian operations generated book income of approximately $11.7 million. Our valuation allowance decreased from $99.5 million to $97.5 million predominantly because of foreign exchange differences and the release of previously established valuation allowance attributable to certain Canadian deferred tax assets, predominantly net operating losses, used to offset the tax liability on our 2010 Canadian operating income. In accordance with ASC 740 we evaluate the recoverability of deferred tax assets and the provisions for valuation allowance periodically based on our projections of future taxable earnings, timing of the reversal of future taxable temporary differences and tax planning strategies available to us to determine the timing and extent we will release our valuation allowance against our net deferred tax assets in Canada in the future. In order to fully realize the deferred tax assets, we will need to generate future taxable income before the expiration of the deferred tax assets.
Subsequently recognized tax benefits related to the valuation allowance for deferred tax assets as of December 31, 2010 will result in an income tax benefit if realized in a future year of $97.1 million.
As of December 31, 2010, we had U.S. state and foreign tax credit carryovers. These tax credits expire over varying amounts and periods as follows (in thousands):
Jurisdiction
|
Tax credit carryover amount |
Year of expiration |
|||||
|---|---|---|---|---|---|---|---|
U.S. state tax credits |
$ | 15,931 | unlimited | ||||
Foreign tax credits |
$ | 7,056 | 2018-2029 | ||||
The foreign tax credit includes approximately $4.8 million of foreign investment tax credits that were recorded as a result of our acquisition of Royal Group. The balance of the foreign tax credits was earned during the period from the acquisition date of Royal through December 31, 2010.
Under ASC subtopic 740-30, Accounting for Income Taxes—Special Areas, we are not permanently reinvested with respect to earnings of our foreign subsidiaries. Accordingly, we record a deferred tax liability with respect to the tax effect of repatriating the earnings of our foreign subsidiaries. As a result of losses with respect to our foreign jurisdictions, we did not record any additional deferred tax liability with respect to the losses of our foreign subsidiaries for the years ended December 31, 2009 and 2008. For the year ended December 31, 2010, our foreign subsidiaries were profitable.
Liability for Unrecognized Income Tax Benefits
We account for uncertain income tax positions in accordance with ASC topic 740, Accounting for Income Taxes. ASC topic 740 prescribes a recognition threshold and measurement attribute for the financial statement recognition and measurement of a tax position taken or expected to be taken in a tax return. Under ASC topic 740, we recognize the financial statement effects of a tax position when it
95
Georgia Gulf Corporation and Subsidiaries
Notes to Consolidated Financial Statements (Continued)
16. INCOME TAXES (Continued)
is more likely than not, based upon the technical merits, that the position will be sustained upon examination. Conversely, we derecognize a previously recognized tax position in the first period in which it is no longer more likely than not that the tax position would be sustained upon examination. A tax position that meets the more likely than not recognition threshold will initially and subsequently be measured as the largest amount of tax benefit that is greater than fifty percent likely of being realized upon ultimate settlement with a taxing authority. We also recognize interest expense by applying a rate of interest to the difference between the tax position recognized in accordance with ASC topic 740 and the amount previously taken or expected to be taken in a tax return. We classify interest expense and related penalties, if any, with respect to our uncertain tax positions in the provision for income taxes.
Effective January 1, 2007, we adopted ASC topic 740, Accounting for Income Taxes, which clarifies the accounting for uncertainty in income taxes recognized in an enterprise's financial statements. ASC topic 740 prescribes a recognition threshold and measurement attribute for the financial statement recognition and measurement of a tax position taken or expected to be taken in a tax return. Under ASC topic 740, we recognize the financial statement effects of a tax position when it is more likely than not, based upon the technical merits, that the
As of December 31, 2010, and 2009, our liability for unrecognized income tax benefits was approximately $53.3 million and $58.5 million, respectively. Of these amounts, as of December 31, 2010 and 2009, approximately $23.7 million and $24.8 million, respectively, relates to accrued interest and penalties. If recognized, all of this amount would affect our effective tax rate. For the years ended December 31, 2010, 2009 and 2008, we recognized approximately $1.5 million, $1.5 million and $5.7 million, respectively, of additional interest expense in our income tax provision related to our liability for unrecognized income tax benefits. Our liability for unrecognized income tax benefits decreased during the year ended December 31, 2010, primarily as the result of the resolution of uncertain tax positions acquired with Royal Group, primarily in Canada, offset by foreign currency translation adjustments and the accrual of additional interest expense related to our liabilities for unrecognized tax benefits. During 2011, it is reasonably possible that uncertain tax positions in the U.S. and Canada will be recognized as a result of the lapse of the applicable statute of limitations. The aggregate amount of these positions is about $7.7 million.
In March 2008, we reached a settlement with the provinces of Quebec and Ontario and the Canada Customs and Revenue Agency with respect to their assessments resulting from the retroactive application of tax law changes promulgated by Bill 15, which amended the Quebec Taxation Act and other legislative provisions. Royal Group, in connection with its tax advisors, established tax structures that used a Quebec Trust to minimize its overall tax liabilities in Canada. Bill 15 has eliminated the ability to use the Quebec Trust structure on a retroactive basis. As of December 31, 2007, we had recorded a liability for the unrecognized tax benefit of $46.1 million related to the Quebec Trust matter. In 2008, we settled this matter with all relevant jurisdictions by making cash payments totaling $20.1 million ("Quebec tax settlement"). We recognized an income tax benefit of $9.2 million related to the reversal of $5.8 million in interest accrued on this liability and the reversal of $3.4 million of a previously established valuation allowance for net operating loss carryforwards, the value of which was realized via this settlement. In addition, in 2008 we reduced goodwill by $16.5 million as a result of the settlement of the preacquisition tax contingency.
96
Georgia Gulf Corporation and Subsidiaries
Notes to Consolidated Financial Statements (Continued)
16. INCOME TAXES (Continued)
The following table describes the tax years that remain subject to examination by major tax jurisdiction:
Tax
Jurisdiction
| |
Open Years | |||
|---|---|---|---|---|
United States Federal |
2006-2010 | |||
Canada |
2005-2010 | |||
Various States |
2001-2010 | |||
A reconciliation of the liability for unrecognized tax benefits for the years ended December 31, 2010, 2009 and 2008 follows:
In thousands
|
2010 | 2009 | 2008 | ||||||||
|---|---|---|---|---|---|---|---|---|---|---|---|
Balance as of beginning of the year |
$ | 58,458 | $ | 50,732 | $ | 107,469 | |||||
Additions for current year tax positions |
3,329 | 5,022 | 719 | ||||||||
Additions for prior year tax positions (including interest & penalties of $1,522, $3,301, and $5,871 for the years ended December 31, 2010, 2009 and 2008, respectively) |
1,626 | 3,301 | 6,189 | ||||||||
Reductions for prior year tax positions |
(7,715 | ) | (416 | ) | (26,096 | ) | |||||
Settlements |
(1,303 | ) | (1,607 | ) | (23,581 | ) | |||||
Reductions related to expirations of statute of limitations |
(3,215 | ) | (6,323 | ) | (2,645 | ) | |||||
Foreign currency translation |
2,135 | 7,749 | (11,323 | ) | |||||||
Balance as of the end of the year |
$ | 53,315 | $ | 58,458 | $ | 50,732 | |||||
We are under examination by the Internal Revenue Service for the years ended December 31, 2006 and 2007. The results of the IRS examination cannot presently be determined. In addition, we have accrued a reserve for non-income tax contingencies of $8.0 million and $8.7 million at December 31, 2010 and 2009, respectively. The decrease in the reserve is related primarily to the settlement of a Canadian issue and the lapsing of the statute of limitations and a reduction in accrued interest related to these matters, which was partially offset by the addition of a new reserve for sales and use taxes in the U.S. We accrue for non-income tax contingencies when it is probable that a liability to a taxing authority has been incurred and the amount of the contingency can be reasonably estimated. The non-income tax contingency reserve is adjusted for, among other things, changes in facts and circumstances, receipt of tax assessments, expiration of statutes of limitations, interest and settlements and additional uncertainties.
17. HEDGING TRANSACTIONS AND DERIVATIVE FINANCIAL INSTRUMENTS
We use derivative financial instruments primarily to reduce our exposure to adverse fluctuations in interest rates, foreign currency exchange rates and commodity prices. When entered into, we formally designate and document the financial instrument as a hedge of a specific underlying exposure, as well as the risk management objectives and strategies for undertaking the hedge transactions. We formally assess both at the inception and at least quarterly thereafter, whether the financial instruments that are
97
Georgia Gulf Corporation and Subsidiaries
Notes to Consolidated Financial Statements (Continued)
17. HEDGING TRANSACTIONS AND DERIVATIVE FINANCIAL INSTRUMENTS (Continued)
used in hedging transactions are effective at offsetting changes in either the fair value or cash flows of the related underlying exposure. Because of the high degree of effectiveness between the hedging instrument and the underlying exposure being hedged, fluctuations in the value of the derivative instruments are generally offset by changes in the fair values or cash flows of the underlying exposures being hedged. Any ineffective portion of a financial instrument's change in fair value is immediately recognized in earnings. Virtually all of our derivatives are straightforward over-the-counter instruments with liquid markets. We do not enter into derivative financial instruments for trading purposes.
The fair values of derivatives used to hedge or modify our risks fluctuate over time. We do not view these fair value amounts in isolation, but rather in relation to the fair values or cash flows of the underlying hedged transaction or other exposures. The notional amounts of the derivative financial instruments do not necessarily represent amounts exchanged by the parties and, therefore, are not a direct measure of our exposure to the financial risks described above. The amounts exchanged are calculated by reference to the notional amounts and by other terms of the derivatives, such as interest rates, foreign currency exchange rates or other financial indices.
We recognize all derivative instruments as either assets or liabilities in our consolidated balance sheets at fair value. The accounting for changes in fair value of a derivative instrument depends on whether it has been designated and qualifies as part of a hedging relationship and, further, on the type of hedging relationship. At the inception of the hedging relationship, we must designate the instrument as a fair value hedge, a cash flow hedge, or a hedge of a net investment in a foreign operation, depending on the exposure being hedged.
Commodity Price Risk Management. The availability and price of our commodities are subject to fluctuations due to unpredictable factors in global supply and demand. To reduce price risk caused by market fluctuations, we may or may not enter into derivative contracts, such as swaps, futures and option contracts with financial counter-parties, which are generally less than one year in duration. We designate any commodity derivatives as cash flow hedges. Our outstanding contracts are valued at market with the offset going to other comprehensive income, net of applicable income taxes and any hedge ineffectiveness. Any gain or loss is recognized in cost of goods sold in the same period or periods during which the hedged transaction affects earnings. The fair value of our natural gas swap contracts was a $0.4 million and $0.3 million current asset at December 31, 2010 and 2009, respectively.
Interest Rate Risk Management. From time to time, we maintain floating rate debt, which exposes us to changes in interest rates. Our policy was to manage our interest rate risk through the use of a combination of fixed and floating rate instruments and interest rate swap agreements. We designated all our interest rate derivatives as cash flow hedges. At December 31, 2010 and 2009, we had no interest rate swaps. Our interest rate swap hedge expired in November 2009. The effective portion of the mark-to-market effects of our cash flow hedge instruments was recorded to accumulate other comprehensive income ("AOCI") until the underlying interest payments were realized. The unrealized amounts in AOCI fluctuated based on changes in the fair value of open contracts at the end of each reporting period. During 2009 and 2008, the impact on the consolidated financial statements due to interest rate hedge ineffectiveness was immaterial.
Foreign Currency Risk Management. Our international operations require active participation in foreign exchange markets. We may or may not enter into foreign exchange forward contracts and options, and cross-currency swaps to hedge various currency exposures or create desired exposures. At
98
Georgia Gulf Corporation and Subsidiaries
Notes to Consolidated Financial Statements (Continued)
17. HEDGING TRANSACTIONS AND DERIVATIVE FINANCIAL INSTRUMENTS (Continued)
December 31, 2010 and 2009, we had no assets or liabilities related to forward contracts, options and cross-currency swaps to buy, sell, or exchange foreign currencies.
18. FAIR VALUE OF FINANCIAL INSTRUMENTS
Financial instruments consist primarily of cash and cash equivalents, accounts receivable, accounts payable, accrued expenses, long-term debt, and commodity forward purchase contracts. The carrying amount of cash and cash equivalents, accounts receivable, accounts payable and accrued expenses approximate their fair value because of the nature of such instruments. The fair values of our 9.0 percent senior secured notes and our natural gas swap contract are based on quoted market values. During 2010, the fair values of our 7.125 percent senior notes, our 9.5 percent senior notes, and our 10.75 percent senior subordinated notes were determined to be level 2 and no longer level 1 valuations due to a significant decline in trading activity for these specific financial instruments in 2010 versus 2009. The fair values of these bonds are based on a weighted average of trading activity before and after December 31, 2010. Our natural gas swap contracts are fair valued with Level 2 inputs. For further details concerning our derivative instruments refer to Note 17 "Hedging Transactions and Derivative Financial Instruments."
The FASB ASC 820-10 establishes a fair value hierarchy that prioritizes observable and unobservable inputs to valuation techniques used to measure fair value. These levels, in order of highest to lowest priority are described below:
Level 1—Quoted prices (unadjusted) in active markets for identical assets or liabilities at the measurement date.
Level 2—Observable prices that are based on inputs not quoted on active markets, but corroborated by market data.
Level 3—Prices that are unobservable for the asset or liability and are developed based on the best information available in the circumstances, which might include the company's own data.
During January 2010, ASC 820-10 has been amended to require us to disclose a more detailed level of disaggregation within each class of assets and liabilities measured at fair value. For further details, see Note 15, "Employee Retirement Plans." The fair value of the level 2 investment in our employee retirement plans includes: (a) short-term investment funds that we have contracted short-term rates of return and (b) investment funds that invest in other funds for which the value is based on the underlying individual funds. The fair value of the level 3 investment in our employee retirement is valued primarily based on trade information from multiple fund portfolios. Regarding these investments our balance as of December 31, 2009 was $1.8 million and during the year, our purchases were $10.1 million and our net unrealized/realized gains were $.04 million. As of December 31, 2010, our ending balance in these investments is $11.9 million.
Our goodwill and other intangibles annual impairment evaluations and resulting impairment charges in the year ended December 31, 2008 were determined by Level 3 inputs. For further details concerning the fair value of goodwill and other intangibles see Note 9, "Goodwill and Other Intangible Assets."
99
Georgia Gulf Corporation and Subsidiaries
Notes to Consolidated Financial Statements (Continued)
18. FAIR VALUE OF FINANCIAL INSTRUMENTS (Continued)
The following is a summary of the carrying values and estimated fair values of our fixed-rate long-term debt and natural gas swaps as of December 31, 2010 and 2009:
| |
December 31, 2010 | December 31, 2009 | ||||||||||||
|---|---|---|---|---|---|---|---|---|---|---|---|---|---|---|
In thousands
|
Carrying Amount |
Fair Value |
Carrying Amount |
Fair Value |
||||||||||
Level 1 |
||||||||||||||
Long-term debt: |
||||||||||||||
9.0% senior secured notes due 2017 |
$ | 497,085 | $ | 538,750 | $ | 496,739 | $ | 506,250 | ||||||
7.125% senior notes due 2013 |
— | — | 8,965 | 8,293 | ||||||||||
9.5% senior notes due 2014 |
— | — | 13,151 | 12,157 | ||||||||||
10.75% senior subordinated notes due 2016 |
— | — | 41,360 | 38,591 | ||||||||||
Level 2 |
||||||||||||||
Long-term debt: |
||||||||||||||
ABL revolver expires 2016 |
— | — | 56,462 | 56,462 | ||||||||||
7.125% senior notes due 2013 |
8,965 | 8,885 | — | — | ||||||||||
9.5% senior notes due 2014 |
13,162 | 13,235 | — | — | ||||||||||
10.75% senior subordinated notes due 2016 |
41,412 | 43,644 | — | — | ||||||||||
Derivative instruments: |
||||||||||||||
Natural gas forward purchase contracts liability (asset) |
(425 | ) | (425 | ) | (257 | ) | (257 | ) | ||||||
19. SEGMENT INFORMATION
At December 31, 2009, we reported four reportable segments: (i) chlorovinyls; (ii) window and door profiles and mouldings products; (iii) outdoor building products; and (iv) aromatics. These four segments reflected the organization used by our management for purposes of allocating resources and assessing performance. Throughout 2009, we undertook various management changes, cost reductions and restructuring strategies to improve the operating results of our building products businesses. These changes resulted in realigning and consolidating the previous window and door profiles and mouldings products segment and the previous outdoor building products segment in one segment, the building products segment. The building products segment is now overseen by one business manager and under one operating structure and further meets the aggregation criteria of ASC topic 280, Segment Reporting.
Accordingly, beginning January 1, 2010, we report the following three reportable segments: (i) chlorovinyls; (ii) aromatics; and (iii) building products. The chlorovinyls segment is a highly integrated chain of products, which includes the electrovinyls product group that consists of chlorine, caustic soda, vinyl chloride monomers and vinyl resins and the compounds product group, which consists of vinyl compounds and compound additives. The aromatics segment is also integrated and includes cumene and the co-products phenol and acetone. Our vinyl-based building and home improvement products, including window and door profiles and mouldings, and our outdoor products group consisting of siding, pipe and pipe fittings and deck, fence and rail products are marketed under the Royal Group brand names, and are managed within the building products segment.
Earnings of our segments exclude interest income and expense, unallocated corporate expenses and general plant services, provision for income taxes and costs of our receivables securitization program. Transactions between operating segments are valued at market-based prices. The revenues generated by these transfers are provided in the following table.
100
Georgia Gulf Corporation and Subsidiaries
Notes to Consolidated Financial Statements (Continued)
19. SEGMENT INFORMATION (Continued)
Identifiable assets consist of property, plant and equipment used in the operations of the segment as well as inventory, receivables and other assets directly related to the segment. Unallocated and other assets include cash, certain corporate receivables, data processing equipment and prepaid pension costs. The accounting policies of the reportable segments are the same as those described in Note 2, "Summary of Significant Accounting Policies."
Segments
In thousands
|
Chlorovinyls | Aromatics | Building Products |
Unallocated and Other |
Total | ||||||||||||
|---|---|---|---|---|---|---|---|---|---|---|---|---|---|---|---|---|---|
Year Ended December 31, 2010: |
|||||||||||||||||
Net sales |
$ | 1,224,724 | $ | 799,676 | $ | 793,639 | $ | — | $ | 2,818,040 | |||||||
Intersegment revenues |
245,977 | — | 140 | (246,117 | ) | — | |||||||||||
Total net sales |
1,470,701 | 799,676 | 793,779 | (246,117 | ) | 2,818,040 | |||||||||||
Restructuring costs |
(340 | ) | — | 442 | 102 | ||||||||||||
Operating income |
114,297 | 23,335 | 14,554 | (37,917 | ) (1) | 114,269 | |||||||||||
Depreciation and amortization |
59,524 | 1,405 | 33,695 | 5,067 | 99,691 | ||||||||||||
Capital expenditures |
22,810 | 2,641 | 20,263 | — | 45,714 | ||||||||||||
Total assets |
953,756 | 140,941 | 554,016 | 16,988 | 1,665,701 | ||||||||||||
Year Ended December 31, 2009: |
|||||||||||||||||
Net sales |
$ | 940,639 | $ | 321,305 | $ | 728,147 | $ | — | $ | 1,990,091 | |||||||
Intersegment revenues |
198,996 | — | 1,509 | (200,505 | ) | — | |||||||||||
Total net sales |
1,139,635 | 321,305 | 729,656 | (200,505 | ) | 1,990,091 | |||||||||||
Long-lived asset impairment charges |
201 | — | 21,603 | — | 21,804 | ||||||||||||
Restructuring costs |
(19 | ) | — | 4,409 | 2,468 | 6,858 | |||||||||||
(Gains) losses on sale of assets |
— | — | 62 | — | 62 | ||||||||||||
Operating income (loss) |
79,469 | 16,884 | (26,713 | ) | (70,208 | ) (2) | (568 | ) | |||||||||
Depreciation and amortization |
60,362 | 4,297 | 37,846 | 15,185 | 117,690 | ||||||||||||
Capital expenditures |
21,553 | 188 | 8,343 | — | 30,084 | ||||||||||||
Total assets |
895,375 | 78,201 | 537,515 | 93,549 | 1,604,640 | ||||||||||||
Year Ended December 31, 2008: |
|||||||||||||||||
Net sales |
$ | 1,379,957 | $ | 618,837 | $ | 917,683 | $ | — | $ | 2,916,477 | |||||||
Intersegment revenues |
293,086 | — | 4,871 | (297,957 | ) | — | |||||||||||
Total net sales |
1,673,043 | 618,837 | 922,554 | (297,957 | ) | 2,916,477 | |||||||||||
Long-lived asset impairment charges |
62,535 | — | 112,853 | (187 | ) | 175,201 | |||||||||||
Restructuring costs |
10,579 | — | 10,154 | 1,240 | 21,973 | ||||||||||||
(Gains) losses on sale of assets |
(1,689 | ) | — | 3,237 | (28,830 | ) | (27,282 | ) | |||||||||
Operating income (loss) |
60,205 | (34,979 | ) | (163,575 | ) | (1,047 | ) (3) | (139,396 | ) | ||||||||
Depreciation and amortization |
73,413 | 5,701 | 56,919 | 7,685 | 143,718 | ||||||||||||
Capital expenditures |
39,516 | 485 | 22,544 | — | 62,545 | ||||||||||||
Total assets |
825,109 | 50,269 | 626,418 | 108,605 | 1,610,401 | ||||||||||||
- (1)
- Includes
shared services, administrative and legal expenses.
- (2)
- Includes shared services, administrative and legal expenses, along with the cost of our receivable securitization program.
101
Georgia Gulf Corporation and Subsidiaries
Notes to Consolidated Financial Statements (Continued)
19. SEGMENT INFORMATION (Continued)
- (3)
- Includes shared services, administrative and legal expenses, along with the cost of our receivables securitization program, plus gains recognized on the sale of land in Pasadena, Texas.
Sales by Product Line
The table below summarizes sales by product. Our Electrovinyls products are primarily comprised of chlorine/ caustic soda, VCM and vinyl resins. Our compound products are comprised of vinyl compounds, compound additives and plasticizers. Our outdoor building products are comprised of siding, pipe and pipe fittings, deck, fence, and rail.
| |
Year Ended December 31, | ||||||||||
|---|---|---|---|---|---|---|---|---|---|---|---|
(In thousands)
|
2010 | 2009 | 2008 | ||||||||
Chlorovinyls |
|||||||||||
Electrovinyl products |
$ | 839,037 | $ | 622,786 | $ | 978,000 | |||||
Compound products |
385,687 | 317,853 | 401,957 | ||||||||
Total |
1,224,724 | 940,639 | 1,379,957 | ||||||||
Aromatics |
|||||||||||
Cumene products |
520,493 | 201,288 | 300,399 | ||||||||
Phenol/acetone products |
279,183 | 120,017 | 318,438 | ||||||||
Total |
799,676 | 321,305 | 618,837 | ||||||||
Building Products |
|||||||||||
Window & Door Profiles and Moulding products |
347,998 | 323,696 | 408,880 | ||||||||
Outdoor Building products |
445,641 | 404,451 | 508,803 | ||||||||
Total |
793,639 | 728,147 | 917,683 | ||||||||
Total external revenue |
$ | 2,818,040 | $ | 1,990,091 | $ | 2,916,477 | |||||
Geographic Areas
Sales are attributable to geographic areas based on customer location and are as follows for the years ended December 31, 2010, 2009, and 2008.
| |
Year Ended December 31, | ||||||||||
|---|---|---|---|---|---|---|---|---|---|---|---|
In thousands
|
2010 | 2009 | 2008 | ||||||||
Net sales: |
|||||||||||
United States |
$ | 2,032,787 | $ | 1,286,991 | $ | 2,164,611 | |||||
Non-U.S. |
785,253 | 703,100 | 751,866 | ||||||||
Total |
$ | 2,818,040 | $ | 1,990,091 | $ | 2,916,477 | |||||
Export sales were approximately 28%, 35%, and 26% of our sales for the years ended December 31, 2010, 2009 and 2008, respectively. Based on destination, the principal international markets we serve are Canada, Mexico, Europe, and Asia. Net sales to Canada in 2010 were 20% of net sales as compared to 23% and 21% percent of net sales in 2009 and 2008 respectively.
102
Georgia Gulf Corporation and Subsidiaries
Notes to Consolidated Financial Statements (Continued)
19. SEGMENT INFORMATION (Continued)
Long-lived assets are attributable to geographic areas based on asset location. Long-lived assets by geographic area as of December 31, 2010 and 2009 are as follows.
| |
December 31, | |||||||
|---|---|---|---|---|---|---|---|---|
In thousands
|
2010 | 2009 | ||||||
Long-lived assets: |
||||||||
United States |
$ | 413,365 | $ | 448,688 | ||||
Non-U.S. |
239,772 | 238,882 | ||||||
Total |
$ | 653,137 | $ | 687,570 | ||||
Net assets (liabilities) are attributable to geographic areas based on the location of the legal entity. Net assets (liabilities) by geographic locations are as follows:
| |
December 31, | |||||||
|---|---|---|---|---|---|---|---|---|
In thousands
|
2010 | 2009 | ||||||
Net (liabilities) assets: |
||||||||
United States |
$ | 569,300 | $ | 529,930 | ||||
Non-U.S. |
(124,708 | ) | (136,380 | ) | ||||
Total |
$ | 444,592 | $ | 393,550 | ||||
In our amended Annual Report on Form 10-K/A as of and for the year ended December 31, 2009 we inadvertently did not update our net assets attributable to geographic area for the related restatements and previously reported the 2009 U.S. net assets, Non-U.S. net (liabilities), and total net assets of $513,138, $(136,431), and $376,707 respectively. These amounts have been corrected and the restated amounts are included in the table above.
103
Georgia Gulf Corporation and Subsidiaries
Notes to Consolidated Financial Statements (Continued)
20. QUARTERLY FINANCIAL DATA (UNAUDITED)
The following table sets forth certain quarterly financial data for the periods indicated:
(In thousands, except per share data *)
|
First Quarter (1) |
Second Quarter |
Third Quarter (2) |
Fourth Quarter (3) |
||||||||||
|---|---|---|---|---|---|---|---|---|---|---|---|---|---|---|
2010 |
||||||||||||||
Net sales |
$ | 631,450 | $ | 735,706 | $ | 758,042 | $ | 692,842 | ||||||
Gross margin |
27,079 | 75,292 | 96,804 | 75,591 | ||||||||||
Operating (loss) income |
(10,474 | ) | 37,894 | 53,226 | 33,624 | |||||||||
Net (loss) income |
(19,031 | ) | 21,689 | 24,958 | 15,062 | |||||||||
(Loss) earnings per share: |
||||||||||||||
Basic |
$ | (0.56 | ) | $ | 0.62 | $ | 0.72 | $ | 0.43 | |||||
Diluted |
$ | (0.56 | ) | $ | 0.62 | $ | 0.72 | $ | 0.43 | |||||
2009 |
||||||||||||||
Net sales |
$ | 407,331 | $ | 524,343 | $ | 556,342 | $ | 502,075 | ||||||
Gross margin |
15,009 | 75,382 | 83,699 | 37,001 | ||||||||||
Operating (loss) income |
(25,704 | ) | 5,130 | 38,596 | (18,588 | ) | ||||||||
Net income (loss) |
48,482 | 2,666 | 204,656 | (124,742 | ) | |||||||||
Earnings (loss) per share: |
||||||||||||||
Basic |
$ | 34.65 | $ | 1.91 | $ | 8.19 | $ | (3.77 | ) | |||||
Diluted |
$ | 34.65 | $ | 1.90 | $ | 8.18 | $ | (3.77 | ) | |||||
- *
- Totaling
quarterly data for 2010 and 2009 may differ from the annual audited consolidated income statements due to rounding.
- (1)
- Net
income for the first quarter of 2009 includes $121.0 million for the Term Loan B fair value adjustment.
- (2)
- Net
income for the third quarter of 2009 includes a gain on debt exchange of $400.8 million.
- (3)
- Net loss includes a loss on the debt extinguishment of $163.8 million in the fourth quarter of 2009.
21. SUPPLEMENTAL GUARANTOR INFORMATION
Our payment obligations under the indenture for our 9.0 percent senior secured notes are guaranteed by Georgia Gulf Lake Charles, LLC, Georgia Gulf Chemicals & Vinyls, LLC, Royal Mouldings Limited, Royal Plastics Group (USA) Limited, Rome Delaware Corporation, Plastic Trends, Inc., Royal Group Sales (USA) Limited, Royal Outdoor Products, Inc., Royal Window and Door Profiles Plant 13 Inc., and Royal Window and Door Profiles Plant 14 Inc., all of which are wholly-owned subsidiaries (the "Guarantor Subsidiaries") of Georgia Gulf Corporation. The guarantees are full, unconditional and joint and several. Georgia Gulf is in essence a holding company for all of its wholly and majority owned subsidiaries. Investments in subsidiaries in the following tables reflect investments in wholly owned entities within Georgia Gulf Corporation. The following consolidating balance sheet information, statements of operations information and statements of cash flows information present the combined financial statements of the parent company, and the combined financial statements of our Guarantor Subsidiaries and our remaining subsidiaries (the "Non-Guarantor Subsidiaries"). Separate financial statements of the Guarantor Subsidiaries are not presented because we have determined that they would not be material to investors.
104
Georgia Gulf Corporation and Subsidiaries
Notes to Consolidated Financial Statements (Continued)
21. SUPPLEMENTAL GUARANTOR INFORMATION (Continued)
Georgia Gulf Corporation and Subsidiaries
Supplemental Condensed Consolidated Balance Sheet Information
December 31, 2010
(In thousands)
|
Parent Company |
Guarantor Subsidiaries |
Non-Guarantor Subsidiaries |
Eliminations | Consolidated | ||||||||||||
|---|---|---|---|---|---|---|---|---|---|---|---|---|---|---|---|---|---|
Cash and cash equivalents |
$ | — | $ | 93,681 | $ | 29,077 | $ | — | $ | 122,758 | |||||||
Receivables, net |
72 | 580,625 | 66,537 | (379,572 | ) | 267,662 | |||||||||||
Inventories |
— | 174,231 | 87,004 | — | 261,235 | ||||||||||||
Prepaid expenses |
147 | 12,712 | 3,747 | — | 16,606 | ||||||||||||
Income tax receivable |
— | 844 | 55 | — | 899 | ||||||||||||
Deferred income taxes |
— | 7,266 | — | — | 7,266 | ||||||||||||
Total current assets |
219 | 869,359 | 186,420 | (379,572 | ) | 676,426 | |||||||||||
Property, plant and equipment, net |
228 | 413,137 | 239,772 | — | 653,137 | ||||||||||||
Long term receivables—affiliates |
457,500 | — | — | (457,500 | ) | — | |||||||||||
Goodwill |
— | 97,572 | 112,059 | — | 209,631 | ||||||||||||
Intangible assets, net |
— | 11,875 | 2,476 | — | 14,351 | ||||||||||||
Deferred income taxes |
— | — | 8,078 | — | 8,078 | ||||||||||||
Other assets |
18,572 | 61,265 | 10,090 | — | 89,927 | ||||||||||||
Non-current assets held for sale |
— | 14,151 | — | — | 14,151 | ||||||||||||
Investment in subsidiaries |
1,081,369 | — | — | (1,081,369 | ) | — | |||||||||||
Total assets |
$ | 1,557,888 | $ | 1,467,359 | $ | 558,895 | $ | (1,918,441 | ) | $ | 1,665,701 | ||||||
Current portion of long-term debt |
$ | 22,128 | $ | 4 | $ | — | $ | — | $ | 22,132 | |||||||
Accounts payable |
375,604 | 112,422 | 24,185 | (379,572 | ) | 132,639 | |||||||||||
Interest payable |
22,528 | — | 30 | — | 22,558 | ||||||||||||
Income taxes payable |
— | 1,683 | 1,227 | — | 2,910 | ||||||||||||
Accrued compensation |
— | 23,863 | 14,519 | — | 38,382 | ||||||||||||
Liability for unrecognized income tax benefits and other tax reserves |
— | 2,897 | 5,925 | — | 8,822 | ||||||||||||
Other accrued liabilites |
419 | 23,162 | 24,955 | — | 48,536 | ||||||||||||
Total current liabilities |
420,679 | 164,031 | 70,841 | (379,572 | ) | 275,979 | |||||||||||
Long-term debt |
555,425 | — | 112,385 | — | 667,810 | ||||||||||||
Long-term payables—affiliates |
— | — | 457,500 | (457,500 | ) | — | |||||||||||
Liability for unrecognized income tax benefits |
— | 6,919 | 39,965 | — | 46,884 | ||||||||||||
Deferred income taxes |
19,144 | 170,661 | — | — | 189,805 | ||||||||||||
Other non-current liabilities |
118,048 | 44,379 | 2,913 | (124,709 | ) | 40,631 | |||||||||||
Total liabilities |
1,113,296 | 385,990 | 683,604 | (961,781 | ) | 1,221,109 | |||||||||||
Total stockholders' equity (deficit) |
444,592 | 1,081,369 | (124,709 | ) | (956,660 | ) | 444,592 | ||||||||||
Total liabilities and stockholders' equity |
$ | 1,557,888 | $ | 1,467,359 | $ | 558,895 | $ | (1,918,441 | ) | $ | 1,665,701 | ||||||
105
Georgia Gulf Corporation and Subsidiaries
Notes to Consolidated Financial Statements (Continued)
21. SUPPLEMENTAL GUARANTOR INFORMATION (Continued)
Georgia Gulf Corporation and Subsidiaries
Supplemental Condensed Consolidating Balance Sheet Information
December 31, 2009
(In thousands)
|
Parent Company |
Guarantor Subsidiaries |
Non-Guarantor Subsidiaries |
Eliminations | Consolidated | ||||||||||||
|---|---|---|---|---|---|---|---|---|---|---|---|---|---|---|---|---|---|
Cash and cash equivalents |
$ | — | $ | 24,881 | $ | 13,916 | $ | — | $ | 38,797 | |||||||
Receivables, net |
150,321 | 411,690 | 59,620 | (412,690 | ) | 208,941 | |||||||||||
Inventories |
— | 176,891 | 74,506 | — | 251,397 | ||||||||||||
Prepaid expenses |
604 | 18,790 | 4,608 | — | 24,002 | ||||||||||||
Income tax receivables |
— | 28,846 | 1,460 | — | 30,306 | ||||||||||||
Deferred income taxes |
— | 13,177 | — | — | 13,177 | ||||||||||||
Total current assets |
150,925 | 674,275 | 154,110 | (412,690 | ) | 566,620 | |||||||||||
Property, plant and equipment, net |
196 | 448,492 | 238,882 | — | 687,570 | ||||||||||||
Long-term receivables—affiliates |
436,247 | — | — | (436,247 | ) | — | |||||||||||
Goodwill |
— | 97,572 | 106,237 | — | 203,809 | ||||||||||||
Intangible assets, net |
— | 12,885 | 2,338 | — | 15,223 | ||||||||||||
Other assets, net |
21,330 | 80,041 | 15,123 | — | 116,494 | ||||||||||||
Non-current assets held-for-sale |
— | 14,210 | 714 | — | 14,924 | ||||||||||||
Investment in subsidiaries |
969,180 | 41 | — | (969,221 | ) | — | |||||||||||
Total assets |
$ | 1,577,878 | $ | 1,327,516 | $ | 517,404 | $ | (1,818,158 | ) | $ | 1,604,640 | ||||||
Current portion of long-term debt |
$ | 27,769 | $ | — | $ | 462 | $ | — | $ | 28,231 | |||||||
Accounts payable |
407,356 | 100,147 | 30,016 | (412,690 | ) | 124,829 | |||||||||||
Interest payable |
2,786 | — | 58 | — | 2,844 | ||||||||||||
Income taxes payable |
— | — | 1,161 | — | 1,161 | ||||||||||||
Accrued compensation |
586 | 8,844 | 6,639 | — | 16,069 | ||||||||||||
Liability for unrecognized income tax benefits and other tax reserves |
— | 3,055 | 6,474 | — | 9,529 | ||||||||||||
Other accrued liabilities |
434 | 17,208 | 25,594 | — | 43,236 | ||||||||||||
Total current liabilities |
438,931 | 129,254 | 70,404 | (412,690 | ) | 225,899 | |||||||||||
Long-term debt |
604,338 | 41 | 106,395 | — | 710,774 | ||||||||||||
Long-term payables—affiliates |
— | — | 436,247 | (436,247 | ) | — | |||||||||||
Liability for unrecognized income tax benefits |
— | 8,211 | 40,260 | — | 48,471 | ||||||||||||
Deferred income taxes |
13,310 | 177,126 | (1,526 | ) | — | 188,910 | |||||||||||
Other non-current liabilities |
127,749 | 43,629 | 2,038 | (136,380 | ) | 37,036 | |||||||||||
Total liabilities |
1,184,328 | 358,261 | 653,818 | (985,317 | ) | 1,211,090 | |||||||||||
Total stockholders' equity |
393,550 | 969,255 | (136,414 | ) | (832,841 | ) | 393,550 | ||||||||||
Total liabilities and stockholders' equity |
$ | 1,577,878 | $ | 1,327,516 | $ | 517,404 | $ | (1,818,158 | ) | $ | 1,604,640 | ||||||
106
Georgia Gulf Corporation and Subsidiaries
Notes to Consolidated Financial Statements (Continued)
21. SUPPLEMENTAL GUARANTOR INFORMATION (Continued)