Attached files
| file | filename |
|---|---|
| 8-K - ARROW ELECTRONICS, INC. 8-K - ARROW ELECTRONICS INC | a50556534.htm |
| EX-99.1 - EXHIBIT 99.1 - ARROW ELECTRONICS INC | a50556534-ex991.htm |
Exhibit 99.2
Fourth-Quarter 2012 CFO Commentary
As reflected in our earnings release, there are a number of items that impact the comparability of our results with those in the trailing quarter and the fourth quarter of last year. Any discussion of our results will exclude these items to give you a better sense of our operating results. As always, the operating information we provide to you should be used as a complement to GAAP numbers. For a complete reconciliation between our GAAP and Non-GAAP results, please refer to our earnings release or the earnings reconciliation found at the end of this document.
The following fourth quarter and pro forma information included in this CFO commentary is unaudited and should be read in conjunction with the company's consolidated financial statements and related notes appearing in the company's 2012 Annual Report on Form 10-K as filed with the Securities and Exchange Commission.
Fourth-Quarter and Full-Year Summary
We delivered strong results in the fourth quarter, in a market that continues to be hindered by macroeconomic uncertainty, with sales of $5.4 billion and non-GAAP earnings per share of $1.22 well ahead of our expectations. We also delivered very strong full-year performance, with revenue and non-GAAP EPS of $20.4 billion and $4.40 per share, respectively. Cash flow is again a great story as we generated $675 million in cash from operations, once again exceeding our target for cash conversion. Our balance sheet remains exceptionally strong, allowing us to selectively reinvest in the business for future growth and operational efficiency, as well as fund strategic acquisitions that increase the size of our addressable markets, expand our geographic footprint, and enhance our portfolio of value-added services and solutions for our customers and suppliers.
In global components, fourth-quarter sales of $3.2 billion were at the high end of our expectations. Sales in our core business in the Americas were in line with normal seasonality with particularly strong growth in our vertical markets. In Asia, sales in the core business were near the high end of normal seasonality, with excellent growth in China and the ASEAN region. Sales in our core European business were below normal seasonality, not surprisingly, in light of recently published economic data that showed a contraction in the Euro Zone’s economies. Global components book to bill was the highest Q4 level in the past three years.
In our global enterprise computing solutions segment, fourth-quarter sales of $2.2 billion increased a very strong 11% year over year and were in line with our expectations. The ECS team delivered another quarter of organic growth. On a global basis, we delivered impressive double-digit year-over-year growth in storage, software, and services. In the Americas sales growth was at the midpoint of normal seasonality. In Europe, sales were at the high end of normal seasonality with strength across all regions.
1
Consolidated Overview – Full Year 2012
|
P&L Highlights*
|
2012
|
Y/Y
Change
|
Y/Y Change Pro
Forma
|
|
Sales
|
$20,405
|
-5%
|
-7%
|
|
Gross Profit Margin
|
13.4%
|
-40bps
|
-60bps
|
|
Operating Expense/Sales
|
9.6%
|
+30bps
|
+10bps
|
|
Operating Income
|
$772.4
|
-19%
|
-21%
|
|
Operating Margin
|
3.8%
|
-70bps
|
-70bps
|
|
Net Income
|
$488.4
|
-19%
|
-21%
|
|
Diluted EPS
|
$4.40
|
-15%
|
-17%
|
* $ in millions, except per share data, may reflect rounding
|
●
|
2012 sales of $20.4 billion
|
|
o
|
On a reported basis as well as a pro forma basis for changes in foreign currency and acquisitions, sales decreased 5% year over year
|
|
o
|
Solid growth in our ECS business offset by weakness in global components reflecting the difficult economic environment
|
|
●
|
Consolidated gross profit margin was 13.4%
|
|
o
|
Decreased 40 basis points year over year primarily due to ongoing pricing pressure in global components as well as a change in mix of products
|
|
§
|
Pro forma for acquisitions and excluding the impact of foreign currency, gross profit margins decreased by approximately 60 basis points year over year due to increased competitive pricing pressure in both the company's business segments, as well as a change in mix of products
|
|
●
|
Operating expenses as a percentage of sales was 9.6%
|
|
o
|
Increased 30 basis points year over year
|
|
o
|
On an absolute dollar basis, operating expenses declined 2% year over year as acquisitions added $60 million, a strengthening dollar lowered expenses by $50 million due to translation, and efficiency gains lowered expenses in the base business by $45 million
|
|
§
|
Pro forma for acquisitions and excluding the impact of foreign currency, operating expenses declined $75 million year over year and were up 10 basis points as a percentage of sales
|
|
●
|
Operating income was $772.4 million
|
|
o
|
Decreased 19% year over year
|
|
o
|
Pro forma for acquisitions, operating income declined 21%
|
|
●
|
Operating income as a percentage of sales was 3.8%
|
|
o
|
Decreased 70 basis points year over year on a reported and pro forma basis
|
|
●
|
Effective tax rate for the year was 28.0%
|
|
●
|
Net income was $488.4 million
|
|
o
|
Decreased 19% compared with last year
|
|
o
|
Pro forma for acquisitions, net income was down 21% year over year
|
|
●
|
Earnings per share were $4.47 and $4.40 on a basic and diluted basis, respectively
|
|
o
|
Diluted EPS decreased 15% year over year
|
|
o
|
Pro forma for acquisitions, EPS decreased 17% year over year
|
|
●
|
Returns on capital accretive to shareholders
|
|
o
|
Return on working capital was 24.9%
|
|
o
|
Return on invested capital of 10.2% is in excess of our weighted average cost of capital
|
2
Consolidated Overview – Fourth Quarter
|
P&L Highlights*
|
Q4 2012
|
Y/Y
Change
|
Y/Y Change
Pro Forma
|
Q/Q
Change
|
|
Sales
|
$5,403
|
-1%
|
-4%
|
+9%
|
|
Gross Profit Margin
|
13.1%
|
-60bps
|
-70bps
|
-30bps
|
|
Operating Expense/Sales
|
9.4%
|
+20bps
|
+10bps
|
-40bps
|
|
Operating Income
|
$196.3
|
-20%
|
-22%
|
+10%
|
|
Operating Margin
|
3.6%
|
-90bps
|
-90bps
|
Flat
|
|
Net Income
|
$132.4
|
-16%
|
-18%
|
+18%
|
|
Diluted EPS
|
$1.22
|
-11%
|
-13%
|
+20%
|
* $ in millions, except per share data, may reflect rounding
|
●
|
Fourth quarter sales of $5.4 billion were in line with our expectations
|
|
o
|
Decreased 1% year over year and increased 9% sequentially
|
|
o
|
Pro forma for acquisitions and excluding the impact of foreign currency, sales declined 3% year over year and increased 7% sequentially
|
|
●
|
Consolidated gross profit margin was 13.1%
|
|
o
|
Decreased 60 basis year over year primarily due to ongoing pricing pressure in global components as well as a change in mix of products
|
|
§
|
Decreased 30 basis points sequentially
|
|
o
|
Pro forma for acquisitions and excluding the impact of foreign currency, gross profit margins decreased by approximately 70 basis points year over year due to increased competitive pricing pressure in both the company's business segments, as well as a change in mix of products
|
|
●
|
Operating expenses as a percentage of sales were 9.4%
|
|
o
|
Increased 20 basis points year over year and declined 40 basis points sequentially
|
|
§
|
On an absolute dollar basis, operating expenses increased 2% year over year on a reported basis and declined 1% year over year on a pro forma basis excluding foreign currency
|
|
●
|
Operating income was $196.3 million
|
|
o
|
Decreased 20% year over year and increased 10% sequentially
|
|
o
|
Pro forma for acquisitions, operating income was down 22% year over year
|
|
●
|
Operating income as a percentage of sales was 3.6%
|
|
o
|
Decreased 90 basis points year over year on a reported and pro forma basis
|
|
o
|
Flat sequentially
|
|
●
|
Effective tax rate for the quarter was 24.9%
|
|
●
|
Net income was $132.4 million
|
|
o
|
Decreased 16% compared with last year and increased 18% sequentially
|
|
o
|
Pro forma for acquisitions, net income was down 18% year over year
|
|
●
|
Earnings per share were $1.25 and $1.22 on a basic and diluted, respectively
|
|
o
|
Diluted EPS decreased 11% year over year and increased 20% sequentially
|
|
o
|
Pro forma for acquisitions, EPS decreased 13% year over year
|
3
Global Components
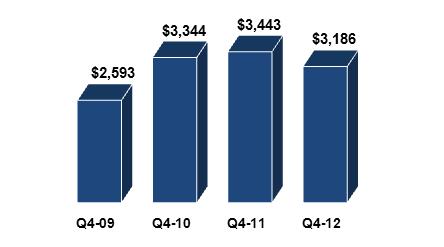 $2,593 $3,344 $3,443 $3,186 Q4-09 Q4-10 Q4-11 Q4-12
Sales ($ in millions)
|
|
●
|
Sales decreased 7% year over year and 6% sequentially
|
|
o
|
Pro forma for acquisitions and excluding the impact of foreign currency, sales in global components were down 9% year over year and declined 7% sequentially
|
|
●
|
Gross margin declined 40 basis points year over year due to ongoing pricing pressure as well as a change in geographic mix and product mix
|
|
o
|
Sequentially, gross margin increased 30 basis points
|
|
o
|
Pro forma for acquisitions and excluding the impact of foreign currency, gross margin declined 60 basis points year over year due to the aforementioned ongoing pricing pressure and change in mix
|
|
●
|
Book to bill was the highest Q4 level in the past three years
|
|
o
|
Above parity in the Americas and EMEA
|
|
o
|
Core Asia business book-to-bill was at its highest level in two years
|
|
●
|
Leading indicators, including lead times and cancellation rates, are in line with historical levels
|
|
●
|
Operating profit declined 30% year over year
|
|
o
|
Operating margin of 3.9% decreased 130 basis points year over year on a reported and pro forma basis
|
|
●
|
Return on working capital declined 660 basis points year over year
|
4
Americas Components Region
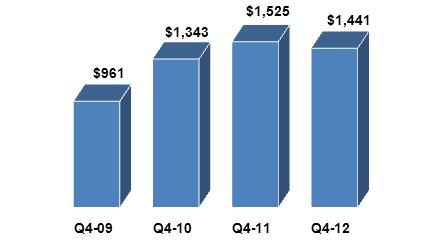 $961 $1,343 $1,525 $1,441 Q4-09 Q4-10 Q4-11 Q4-12
Sales ($ in millions)
|
|
●
|
Sales decreased 6% year over year and 1% sequentially
|
|
o
|
Pro forma for acquisitions, sales decreased 8% year over year and 2% on a sequential basis
|
|
o
|
Sales in line with normal seasonality on a sequential basis
|
|
●
|
Vertical markets continue to exhibit solid growth
|
|
o
|
Lighting, medical, and alternative energy increased 22%, 7%, and 6%, respectively, year over year
|
|
o
|
For full year 2012, lighting grew 10% following an 8% increase in 2011
|
|
●
|
Operating income decreased 19% year over year
|
|
o
|
We continue to generate operating margins at the high end of the targeted level in what was a more difficult environment compared to a year ago
|
|
●
|
Looking ahead to the first quarter, we expect sales in our legacy Americas components business to be below normal seasonality
|
5
Europe Components Region
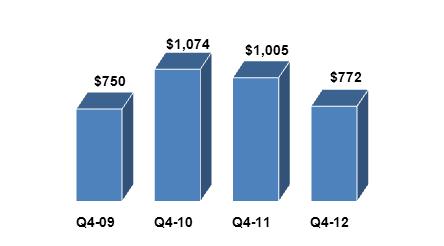 $750 $1,074 $1,005 $772 Q4-09 Q4-10 Q4-11 Q4-12
Sales ($ in millions)
|
|
●
|
Sales declined 23% year over year and 8% sequentially
|
|
o
|
Pro forma for acquisitions and excluding the impact of foreign currency, sales declined 22% year over year and 11% sequentially
|
|
o
|
Sales in our core business were below normal seasonality reflecting ongoing market softness in all regions, particularly Central Europe
|
|
●
|
Vertical market growth continues to outperform the broader market
|
|
o
|
Lighting and automotive each increased 9% year over year
|
|
●
|
Operating income declined 59% year over year
|
|
●
|
Looking ahead to the first quarter, we expect sales in our legacy European components business to be below normal seasonality
|
6
Asia Pacific Components Region
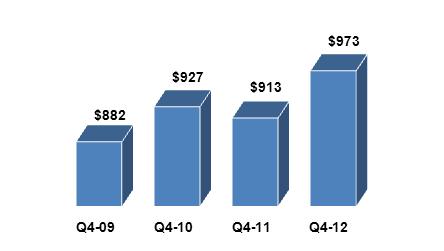 $882 $927 $913 $973 Q4-09 Q4-10 Q4-11 Q4-12
Sales ($ in millions)
|
|
●
|
Sales increased 7% year over year and declined 10% sequentially
|
|
o
|
Pro forma for acquisitions, sales increased 4% year over year
|
|
o
|
Sales in our core Asia business in line with high end of normal seasonality
|
|
§
|
Core Asia sales increased 11% year over year
|
|
§
|
Strength in China and ASEAN region
|
|
●
|
The mobile vertical market continues to grow strongly, increasing 39% year over year
|
|
o
|
For the full year, mobile grew 46%
|
|
●
|
Operating profit declined 5% year over year
|
|
●
|
Looking ahead to the first quarter, we expect sales in our legacy Asia Pacific components business to be below normal seasonality
|
7
Global Enterprise Computing Solutions
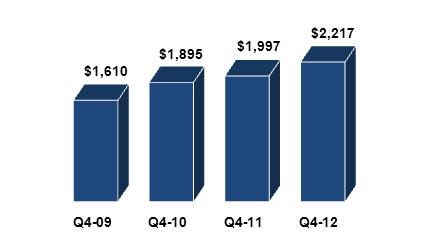 $1,610 $1,895 $1,997 $2,217 Q4-09 Q4-10 Q4-11 Q4-12
Sales ($ in millions)
|
|
●
|
Sales increased 11% year over year and 39% sequentially
|
|
o
|
Record level revenue for any quarter
|
|
o
|
Pro forma for acquisitions and excluding the impact of foreign currency, sales increased 6% year over year and 38% sequentially
|
|
§
|
12th consecutive quarter of year-over-year organic growth
|
|
●
|
Very strong double-digit year-over-year growth in storage (+25%), software (+22%), and services (+17%)
|
|
o
|
Networking, security, virtualization, and infrastructure continue to post strong year-over-year growth, increasing 38%, 31%, 24%, and 12%, respectively
|
|
●
|
Gross margin decreased 60 basis points year over year driven primarily by product mix
|
|
o
|
Gross margin decreased 60 basis points on a sequential basis
|
|
●
|
Operating income increased 7% year over year
|
|
o
|
Operating margin was down 10 basis points year over year to 5.2%
|
|
o
|
Full year 2012 operating margin of 4.1% increased 10 basis points year over year
|
|
§
|
Near low end of long-term targets
|
|
●
|
Return on working capital continues to excel
|
8
ECS America
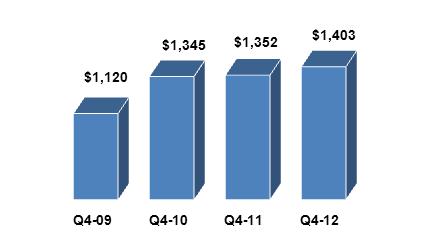 $1,120 $1,345 $1,352 $1,403 Q4-09 Q4-10 Q4-11 Q4-12
Sales ($ in millions)
|
|
●
|
Sales increased 4% year over year and 27% sequentially
|
|
o
|
Sales in our core value-added distribution business in line with normal seasonality
|
|
●
|
Robust double-digit year-over-year growth in storage (+21%), software (+17%) and services (+16%)
|
|
o
|
Networking grew 48%, security grew 40%, and virtualization grew 15% year over year
|
|
●
|
Operating income was flat year over year
|
|
o
|
Operating margin remains within our long-term target range
|
|
●
|
Looking ahead to the first quarter, we expect sales in our legacy Americas value-added computing solutions business to be at normal seasonality
|
9
ECS Europe
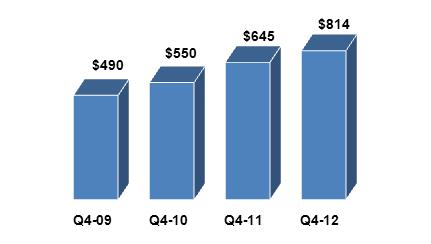 $490 $550 $645 $814 Q4-09 Q4-10 Q4-11 Q4-12
Sales ($ in millions) |
|
●
|
Sales increased 26% year over year and 69% sequentially
|
|
o
|
Pro forma for acquisitions and excluding the impact of foreign currency, sales increased 11% year over year and 63% sequentially
|
|
●
|
Organic sales growth was in line with high end of normal seasonality on a sequential basis
|
|
o
|
Double-digit growth in all regions, led by UK, which increased 24% year over year
|
|
o
|
Strong year-over-year growth driven by proprietary servers (+40%), storage (+21%), and services (+17%)
|
|
§
|
Virtualization increased 25% year over year
|
|
●
|
Operating profit increased 29% year over year
|
|
●
|
Looking ahead to the first quarter, we expect sales in our legacy European value-added computing solutions business to be slightly below normal seasonality
|
10
Cash Flow and Balance Sheet Highlights
|
●
|
Cash Flow from Operations
|
We generated $188 million in cash from operations in the fourth quarter. Over the last twelve months we have generated $675 million in cash flow from operations and converted 133% of our GAAP net income to cash, significantly outperforming our target.
|
●
|
Working Capital
|
We continue to effectively manage all levers of our working capital with working capital to sales of $.15. Return on working capital is 24.5%.
|
●
|
Return on Invested Capital
|
Our return on invested capital of 10.7% remains ahead of our weighted average cost of capital.
|
●
|
Share Buyback
|
In 2012 we repurchased 7.0 million shares for a total of $253 million. Over the past five years we have returned $800 million to shareholders. We currently have $98 million remaining on our most recent repurchase authorization to fund future share buybacks.
|
●
|
Debt and Liquidity
|
Our balance sheet and capital structure remain very strong with conservative debt levels, and a net debt to EBITDA ratio of approximately 1.7x. Our total liquidity is $2.4 billion when including our cash of $410 million. Thus, we have the flexibility to continue to take advantage of opportunities in the marketplace.
|
First-Quarter 2013 Guidance
|
|
|
Consolidated Sales
|
$4.60 billion to $5.00 billion
|
|
Global Components
|
$3.05 billion to $3.25 billion
|
|
Global ECS
|
$1.55 billion to $1.75 billion
|
|
Diluted Earnings per Share*
|
$.80 to $.92
|
* First quarter guidance assumes average diluted shares outstanding of 108.3 million.
11
Arrow Electronics Revenue Seasonality*
|
Global
Components
|
NAC
|
EMEA ex FX
|
AAP
|
|
Q1
|
-2% to +4%
|
+13% to +19%
|
-1% to +5%
|
|
Q2
|
-3% to +3%
|
-5% to -11%
|
+4% to +10%
|
|
Q3
|
-2% to +4%
|
-5% to +1%
|
+3% to +9%
|
|
Q4
|
-4% to +2%
|
-3% to -9%
|
-1% to -7%
|
|
Global ECS
|
NA
|
EMEA ex FX
|
|
Q1
|
-28% to -34%
|
-21% to -27%
|
|
Q2
|
+20% to +26%
|
+1% to +7%
|
|
Q3
|
-2% to -8%
|
-12% to -18%
|
|
Q4
|
+28% to +34%
|
+59% to +65%
|
* Revenue seasonality based on historical sequential sales growth for 2007-2011 for our traditional components and ECS businesses excluding acquisitions
12
Risk Factors
The discussion of the company’s business and operations should be read together with the risk factors contained in Item 1A of its 2012 Annual Report on Form 10-K, filed with the Securities and Exchange Commission, which describe various risks and uncertainties to which the company is or may become subject. If any of the described events occur, the company’s business, results of operations, financial condition, liquidity, or access to the capital markets could be materially adversely affected.
Certain Non-GAAP Financial Information
In addition to disclosing results that are determined in accordance with Generally Accepted Accounting Principles ("GAAP"), the company provides certain non-GAAP financial information relating to operating income, net income attributable to shareholders and net income per basic and diluted share, each as adjusted for certain charges, credits, and gains and losses that the company believes impact the comparability of its results of operations. These charges, credits, and gains and losses arise out of the company's efficiency enhancement initiatives and acquisitions. A reconciliation of the company's non-GAAP financial information to GAAP is set forth in the table below.
The company believes that such non-GAAP financial information is useful to investors to assist in assessing and understanding the company's operating performance and underlying trends in the company's business because management considers the charges, credits, and gains and losses referred to above to be outside the company's core operating results. This non-GAAP financial information is among the primary indicators management uses as a basis for evaluating the company's financial and operating performance. In addition, the company's Board of Directors may use this non-GAAP financial information in evaluating management performance and setting management compensation.
The presentation of this additional non-GAAP financial information is not meant to be considered in isolation or as a substitute for, or alternative to, operating income, net income attributable to shareholders and net income per basic and diluted share determined in accordance with GAAP. Analysis of results and outlook on a non-GAAP basis should be used as a complement to, and in conjunction with, data presented in accordance with GAAP.
13
Earnings Reconciliation
($ in thousands, except per share data)
|
Quarter Ended
|
Year Ended
|
|||||||||||||||
|
December 31,
|
December 31,
|
|||||||||||||||
|
2012
|
2011
|
2012
|
2011
|
|||||||||||||
|
Operating income, as reported
|
$ | 264,168 | $ | 232,183 | $ | 804,123 | $ | 908,843 | ||||||||
|
Restructuring, integration, and other charges
|
11,285 | 14,135 | 47,437 | 37,811 | ||||||||||||
|
Settlement of legal matters
|
(79,158 | ) | -- | (79,158 | ) | 5,875 | ||||||||||
|
Operating income, as adjusted
|
196,295 | 246,318 | 772,402 | 952,529 | ||||||||||||
|
Net income attributable to shareholders, as reported
|
$ | 174,704 | $ | 174,088 | $ | 506,332 | $ | 598,810 | ||||||||
|
Restructuring, integration, and other charges
|
6,320 | 11,223 | 30,739 | 28,054 | ||||||||||||
|
Settlement of legal matters
|
(48,623 | ) | -- | (48,623 | ) | 3,609 | ||||||||||
|
Gain / (adjustment) on bargain purchase
|
-- | 410 | -- | (668 | ) | |||||||||||
|
Loss on prepayment of debt
|
-- | 549 | -- | 549 | ||||||||||||
|
Reversal of valuation allowance on deferred tax assets
|
-- | (28,928 | ) | -- | (28,928 | ) | ||||||||||
|
Net income attributable to shareholders, as adjusted
|
$ | 132,401 | $ | 157,342 | $ | 488,448 | $ | 601,426 | ||||||||
|
Net income per diluted share, as reported
|
$ | 1.62 | $ | 1.53 | $ | 4.56 | $ | 5.17 | ||||||||
|
Restructuring, integration, and other charges
|
0.06 | 0.10 | 0.28 | 0.24 | ||||||||||||
|
Settlement of legal matters
|
(0.45 | ) | -- | (0.44 | ) | 0.03 | ||||||||||
|
Gain / (adjustment) on bargain purchase
|
-- | -- | -- | (0.01 | ) | |||||||||||
|
Loss on prepayment of debt
|
-- | -- | -- | -- | ||||||||||||
|
Reversal of valuation allowance on deferred tax assets
|
-- | (0.25 | ) | -- | (0.25 | ) | ||||||||||
|
Net income per diluted share, as adjusted
|
$ | 1.22 | $ | 1.38 | $ | 4.40 | $ | 5.19 | ||||||||
The sum of the components for diluted EPS, as Adjusted, may not agree to totals, as presented, due to rounding.
Earnings Reconciliation
References to restructuring and other charges refer to the following incremental charges taken in the periods indicated:
|
Q4-12 Restructuring, Integration, and Other Charges: During the fourth quarter of 2012, the company recorded restructuring, integration, and other charges of $11.3 million ($6.3 million net of related taxes or $.06 per share on both a basic and diluted basis).
|
|
Q4-12 Settlement of Legal Matter: During the fourth quarter of 2012, the company recorded a gain of $79.2 million ($48.6 million net of related taxes or $.46 and $.45 per share on a basic and diluted basis, respectively) related to the settlement of a legal matter.
|
|
Q4-11 Restructuring, Integration, and Other Charges: During the fourth quarter of 2011, the company recorded restructuring, integration, and other charges of $14.1 million ($11.2 million net of related taxes or $.10 per share on both a basic and diluted basis).
|
14
|
Q4-11 Gain/(Adjustment) on Bargain Purchase: During the fourth quarter of 2011, the company recorded an adjustment to the gain on bargain purchase recorded in the first quarter of 2011 of $.7 million ($.4 million net of related taxes).
|
|
Q4-11 Loss on Prepayment of Debt: During the fourth quarter of 2011, the company recorded a loss on prepayment of debt of $.9 million ($.5 million net of related taxes).
|
|
Q4-11 Reversal of Valuation Allowance on Deferred Tax Assets: During the fourth quarter of 2011, the company recorded a net reduction in the provision for income taxes of $28.9 million ($.26 and $.25 per share on a basic and diluted basis, respectively) principally due to a reversal of a valuation allowance on certain deferred tax assets.
|
|
2012 Restructuring, Integration, and Other Charges: During 2012, the company recorded restructuring, integration, and other charges of $47.4 million ($30.7 million net of related taxes or $.28 per share on both a basic and diluted basis).
|
|
2012 Settlement of Legal Matter: During 2012, the company recorded a gain of $79.2 million ($48.6 million net of related taxes or $.45 and $.44 per share on a basic and diluted basis, respectively) related to the settlement of a legal matter.
|
|
2011 Restructuring, Integration, and Other Charges: During 2011, the company recorded restructuring, integration, and other charges of $37.8 million ($28.1 million net of related taxes or $.25 and $.24 per share on a basic and diluted basis, respectively) primarily related to initiatives taken by the company to improve operating efficiencies.
|
|
2011 Settlement of Legal Matter: During 2011, the company recorded a charge of $5.9 million ($3.6 million net of related taxes or $.03 per share on both a basic and diluted basis) related to the settlement of a legal matter.
|
|
2011 Gain/(Adjustment) on Bargain Purchase: During 2011, the company recorded a gain on a bargain purchase of $1.1 million ($.7 million net of related taxes or $.01 per share on both a basic and diluted basis).
|
|
2011 Loss on Prepayment of Debt: During 2011, the company recorded a loss on prepayment of debt of $.9 million ($.5 million net of related taxes).
|
|
2011 Reversal of Valuation Allowance on Deferred Tax Assets: During 2011, the company recorded a net reduction in the provision for income taxes of $28.9 million ($.25 per share on both a basic and diluted basis) principally due to a reversal of a valuation allowance on certain deferred tax assets.
|
15