Attached files
| file | filename |
|---|---|
| EX-21 - EXHIBIT 21 - ARROW ELECTRONICS INC | a201510kex21.htm |
| EX-4.(A)(X) - EXHIBIT 4.(A)(X) - ARROW ELECTRONICS INC | arwexhibit4ax.htm |
| EX-31.(I) - EXHIBIT 31.(I) - ARROW ELECTRONICS INC | arwexhibit31iq415.htm |
| EX-32.(L) - EXHIBIT 32.(I) - ARROW ELECTRONICS INC | arwexhibit32iq415.htm |
| EX-32.(LL) - EXHIBIT 32.(II) - ARROW ELECTRONICS INC | arwexhibit32iiq415.htm |
| EX-31.(II) - EXHIBIT 31.(II) - ARROW ELECTRONICS INC | arwexhibit31iiq415.htm |
| EX-10.(C)(II) - EXHIBIT 10.(C)(II) - ARROW ELECTRONICS INC | arwexhibit10ciifebruary220.htm |
| EX-10.(M) - EXHIBIT 10.(M) - ARROW ELECTRONICS INC | arwexhibit10mfebruary22016.htm |
| EX-10.(A)(I) - EXHIBIT 10.(A)(I) - ARROW ELECTRONICS INC | arwexhibit10aifebruary22016.htm |
| EX-23 - EXHIBIT 23 - ARROW ELECTRONICS INC | a201510kex23.htm |
UNITED STATES SECURITIES AND EXCHANGE COMMISSION
Washington, D.C. 20549
FORM 10-K
x | ANNUAL REPORT PURSUANT TO SECTION 13 OR 15(d) OF THE SECURITIES EXCHANGE ACT OF 1934 |
For the fiscal year ended December 31, 2015
OR
o | TRANSITION REPORT PURSUANT TO SECTION 13 OR 15(d) OF THE SECURITIES EXCHANGE ACT OF 1934 |
For the transition period from to
Commission file number 1-4482
ARROW ELECTRONICS, INC.
(Exact name of registrant as specified in its charter)
New York | 11-1806155 |
(State or other jurisdiction of | (I.R.S. Employer |
incorporation or organization) | Identification Number) |
9201 East Dry Creek Road, Centennial, Colorado | 80112 |
(Address of principal executive offices) | (Zip Code) |
(303) 824-4000
(Registrant's telephone number, including area code)
Securities registered pursuant to Section 12(b) of the Act:
Title of each class | Name of each exchange on which registered | |
Common Stock, $1 par value | New York Stock Exchange | |
Securities registered pursuant to Section 12(g) of the Act: None
Indicate by check mark if the registrant is a well-known seasoned issuer, as defined in Rule 405 of the Securities Act. Yes x No o
Indicate by check mark if the registrant is not required to file reports pursuant to Section 13 or Section 15(d) of the Exchange Act.
Yes o No x
Indicate by check mark whether the registrant (1) has filed all reports required to be filed by Section 13 or 15(d) of the Securities Exchange Act of 1934 during the preceding 12 months (or for such shorter period that the registrant was required to file such reports), and (2) has been subject to such filing requirements for the past 90 days. Yes x No o
Indicate by check mark whether the registrant has submitted electronically and posted on its corporate Web site, if any, every Interactive Data File required to be submitted and posted pursuant to Rule 405 of Regulation S-T (§232.405 of this chapter) during the preceding 12 months (or for such shorter period that the registrant was required to submit and post such files). Yes x No o
Indicate by check mark if disclosure of delinquent filers pursuant to Item 405 of Regulation S-K (§229.405 of this chapter) is not contained herein, and will not be contained, to the best of the registrant's knowledge, in definitive proxy or information statements incorporated by reference in Part III of this Form 10-K or any amendment to this Form 10-K. o
Indicate by check mark whether the registrant is a large accelerated filer, an accelerated filer, a non-accelerated filer, or a smaller reporting company. See the definitions of "large accelerated filer," "accelerated filer," and "smaller reporting company" in Rule 12b-2 of the Exchange Act (check one):
Large accelerated filer x | Accelerated filer o |
Non-accelerated filer o (do not check if a smaller reporting company) | Smaller reporting company o |
Indicate by check mark whether the registrant is a shell company (as defined in Rule 12b-2 of the Exchange Act). Yes o No x
The aggregate market value of voting stock held by non-affiliates of the registrant as of the last business day of the registrant's most recently completed second fiscal quarter was $5,352,842,897.
There were 90,943,344 shares of Common Stock outstanding as of February 1, 2016.
DOCUMENTS INCORPORATED BY REFERENCE
The definitive proxy statement related to the registrant's Annual Meeting of Shareholders, to be held May 12, 2016 is incorporated by reference in Part III to the extent described therein.
TABLE OF CONTENTS
PART I | |||
Item 1. | Business. | ||
Item 1A. | Risk Factors. | ||
Item 1B. | Unresolved Staff Comments. | ||
Item 2. | Properties. | ||
Item 3. | Legal Proceedings. | ||
Item 4. | Mine Safety Disclosures. | ||
PART II | |||
Item 5. | Market for Registrant's Common Equity, Related Stockholder Matters and Issuer Purchases of Equity Securities. | ||
Item 6. | Selected Financial Data. | ||
Item 7. | Management's Discussion and Analysis of Financial Condition and Results of Operations. | ||
Item 7A. | Quantitative and Qualitative Disclosures About Market Risk. | ||
Item 8. | Financial Statements and Supplementary Data. | ||
Item 9. | Changes in and Disagreements with Accountants on Accounting and Financial Disclosure. | ||
Item 9A. | Controls and Procedures. | ||
Item 9B. | Other Information. | ||
PART III | |||
Item 10. | Directors, Executive Officers and Corporate Governance. | ||
Item 11. | Executive Compensation. | ||
Item 12. | Security Ownership of Certain Beneficial Owners and Management and Related Stockholder Matters. | ||
Item 13. | Certain Relationships and Related Transactions, and Director Independence. | ||
Item 14. | Principal Accounting Fees and Services. | ||
PART IV | |||
Item 15. | Exhibits and Financial Statement Schedules. | ||
Signatures | |||
2
PART I
Item 1. Business.
Arrow Electronics, Inc. (the "company" or "Arrow") is a global provider of products, services, and solutions to industrial and commercial users of electronic components and enterprise computing solutions. The company has one of the world’s broadest portfolios of product offerings available from leading electronic components and enterprise computing solutions suppliers, coupled with a range of services, solutions and tools that help industrial and commercial customers introduce innovative products, reduce their time to market, and enhance their overall competitiveness. Arrow was incorporated in New York in 1946 and serves over 100,000 customers.
Arrow's diverse worldwide customer base consists of original equipment manufacturers ("OEMs"), contract manufacturers ("CMs"), and other commercial customers. These customers include manufacturers of industrial equipment (such as machine tools, factory automation, and robotic equipment) and consumer products serving industries ranging from telecommunications, automotive and transportation, aerospace and defense, medical, professional services, and alternative energy, among others. Customers also include value-added resellers ("VARs") of enterprise computing solutions.
The company maintains over 300 sales facilities and 40 distribution and value-added centers in 53 countries, serving over 85 countries. Through this network, Arrow guides innovation forward by helping its customers deliver new technologies, new materials, new ideas, and new electronics that impact the business community and consumers.
The company has two business segments, the global components business and the global enterprise computing solutions ("ECS") business. The company distributes electronic components to OEMs and CMs through its global components business segment and provides enterprise computing solutions to VARs through its global ECS business segment. For 2015, approximately 62% of the company's sales were from the global components business segment, and approximately 38% of the company's sales were from the global ECS business segment. The financial information about the company's business segments and geographic operations is found in Note 16 of the Notes to the Consolidated Financial Statements.
The company's financial objectives are to grow sales faster than the market, increase the markets served, grow profits faster than sales, and increase return on invested capital. To achieve its objectives, the company seeks to capture significant opportunities to grow across products, markets, and geographies. To supplement its organic growth strategy, the company continually evaluates strategic acquisitions to broaden its product and value-added service offerings, increase its market penetration, and expand its geographic reach.
Global Components
Global components markets and distributes electronic components and provides a comprehensive range of value-added capabilities throughout the entire life cycle of technology products and services. The company provides customers with the ability to deliver the latest technologies to the market through design engineering, global marketing and integration, global logistics and supply chain management. The company offers the convenience of accessing, from a single source, multiple technologies and products from its suppliers with rapid or scheduled deliveries. Additionally, the company offers expertise in reverse logistics, asset management, and asset recovery to maximize value at the end of a product’s life cycle. Most of the company's customers require delivery of their orders on schedules or volumes that are generally not available on direct purchases from manufacturers.
As one of the largest providers of electronic components and related services in the world, global components covers the world's largest electronics markets - the Americas, EMEA (Europe, Middle East, and Africa), and Asia Pacific regions. The Americas include operations in Argentina, Brazil, Canada, Mexico, and the United States. In the EMEA region, the global components business segment operates in Austria, Belgium, Czech Republic, Denmark, Egypt, Estonia, Finland, France, Germany, Hungary, Israel, Italy, the Netherlands, Norway, Poland, Portugal, Romania, the Russian Federation, Slovakia, Slovenia, South Africa, Spain, Sweden, Switzerland, Turkey, Ukraine, and the United Kingdom. In the Asia Pacific region, the global components business segment operates in Australia, China, Hong Kong, India, Indonesia, Japan, Malaysia, New Zealand, Philippines, Singapore, Taiwan, Thailand, and Vietnam.
Within the global components business segment, approximately 66% of the company's sales consist of semiconductor products and related services; approximately 19% consist of passive, electro-mechanical, and interconnect products, consisting primarily of capacitors, resistors, potentiometers, power supplies, relays, switches, and connectors; approximately 10% consist of computing and memory; and approximately 5% consist of other products and services.
3
Over the past three years, the global components business segment completed 16 strategic acquisitions to broaden its product and service offerings, to further expand its geographic reach in the Asia Pacific region, and to increase its digital capabilities to meet the evolving needs of customers and suppliers. These acquisitions also expanded the company's global components business segment's portfolio of products and services across the full product lifecycle including new product development, reverse logistics, and electronics asset disposition.
Global ECS
The company's global ECS business segment is a leading value-added provider of comprehensive computing solutions and services. Global ECS’ portfolio of computing solutions includes datacenter, cloud, security, and analytics solutions. Global ECS brings broad market access, extensive supplier relationships, scale and resources to help its VARs meet the needs of their end-users. Global ECS works with VARs to tailor complex IT solutions for their end-users. Customers have access to various services including engineering and integration support, warehousing and logistics, marketing resources, and authorized hardware and software training. Global ECS’ suppliers benefit from demand creation, speed to market, and efficient supply chain management. For these suppliers, global ECS is the aggregation point to over 20,000 VARs.
Global ECS operates in 32 countries around the world, largely in the Americas, EMEA, and the Asia Pacific regions. The Americas include operations in the United States, Canada, and Brazil. In the EMEA region, the global ECS business segment operates in Austria, Belgium, Czech Republic, Denmark, Estonia, Finland, France, Germany, Hungary, Iceland, Ireland, Israel, Italy, Latvia, Lithuania, Luxembourg, Morocco, the Netherlands, Norway, Poland, Portugal, Spain, Sweden, Switzerland, the United Arab Emirates, and the United Kingdom. The Asia Pacific region includes offices in Australia, New Zealand, and Singapore.
Within the global ECS business segment, approximately 39% consist of software, 35% of the company's sales consist of storage, 9% consist of proprietary servers, 9% consist of industry standard servers, and 8% consist of other products and services.
Over the past three years, the global ECS business segment completed 4 strategic acquisitions to further expand its geographic reach and its portfolio of products. Aligned with the vision of guiding innovation forward in the IT channel, the company is investing in emerging and adjacent markets, such as managed services and unified computing, within the ECS business.
Customers and Suppliers
The company and its affiliates serve over 100,000 industrial and commercial customers. Industrial customers range from major OEMs and CMs to small engineering firms, while commercial customers primarily include VARs and OEMs. No single customer accounted for more than 2% of the company's 2015 consolidated sales.
The company’s sales teams focus on an extensive portfolio of products and services to support customers’ material management and production needs, including connecting customers to the company’s field application engineers that provide technical support and serve as a gateway to the company’s supplier partners. The company’s sales representatives generally focus on a specific customer segment, particular product lines or a specific geography, and provide end-to-end product offerings and solutions with an emphasis on helping customers introduce innovative products, reduce their time to market, and enhance their overall competitiveness.
Substantially all of the company's sales are made on an order-by-order basis, rather than through long-term sales contracts. As such, the nature of the company's business does not provide visibility of material forward-looking information from its customers and suppliers beyond a few months.
No single supplier accounted for more than 7% of the company's consolidated sales in 2015. The company believes that many of the products it sells are available from other sources at competitive prices. However, certain parts of the company's business, such as the company's global ECS business segment, rely on a limited number of suppliers with the strategy of providing focused support, extensive product knowledge, and customized service to suppliers and VARs. Most of the company's purchases are pursuant to distributor agreements, which are typically non-exclusive and cancelable by either party at any time or on short notice.
Distribution Agreements
Generally, our agreements with manufacturers protect us against the potential write-down of inventories due to technological change or manufacturers' price reductions. Write-downs of inventories to market value are based upon contractual provisions, which typically provide certain protections to the company for product obsolescence and price erosion in the form of return privileges, scrap allowances, and price protection. Under the terms of the related distributor agreements and assuming the company complies with certain conditions, such suppliers are required to credit the company for reductions in manufacturers' list prices.
4
As of December 31, 2015, this type of arrangement covered approximately 57% of the company's consolidated inventories. In addition, under the terms of many such agreements, the company has the right to return to the manufacturer, for credit, a defined portion of those inventory items purchased within a designated period of time.
A manufacturer, which elects to terminate a distribution agreement, is generally required to purchase from the company the total amount of its products carried in inventory. As of December 31, 2015, this type of repurchase arrangement covered approximately 61% of the company's consolidated inventories.
While these inventory practices do not wholly protect the company from inventory losses, the company believes that they currently provide substantial protection from such losses.
Competition
The company operates in a highly competitive environment, both in the United States and internationally. The company competes with other large multinational and national electronic components and enterprise computing solutions distributors, as well as numerous other smaller, specialized competitors who generally focus on narrower markets, products, or particular sectors. The company also competes for customers with its suppliers. The size of the company's competitors vary across markets sectors, as do the resources the company has allocated to the sectors in which it does business. Therefore, some of the company's competitors may have a more extensive customer and/or supplier base than the company in one or more of its market sectors. There is significant competition within each market sector and geography served that creates pricing pressure and the need to improve services. Other competitive factors include rapid technological changes, product availability, credit availability, speed of delivery, ability to tailor solutions to customer needs, quality and depth of product lines and training, as well as service and support provided by the distributor to the customer.
The company also faces competition from companies entering or expanding into the logistics and product fulfillment, electronic catalog distribution, and e-commerce supply chain services markets. As the company seeks to expand its business into new areas in order to stay competitive in the market, the company may encounter increased competition from its current and/or new competitors.
The company believes that it is well equipped to compete effectively with its competitors in all of these areas due to its comprehensive product and service offerings, highly-skilled work force, and global distribution network.
Employees
The company and its affiliates employed approximately 18,500 employees worldwide as of December 31, 2015.
Available Information
The company files its Annual Report on Form 10-K, Quarterly Reports on Form 10-Q, Current Reports on Form 8-K, Proxy Statements, and other documents with the U.S. Securities and Exchange Commission ("SEC") under the Securities Exchange Act of 1934. A copy of any document the company files with the SEC is available for review at the SEC's public reference room, 100 F Street, N.E., Washington, D.C. 20549. The SEC is reachable at 1-800-SEC-0330 for further information on the public reference room. The company's SEC filings are also available to the public on the SEC's Web site at http://www.sec.gov and through the New York Stock Exchange ("NYSE"), 20 Broad Street, New York, New York 10005, on which the company's common stock is listed.
A copy of any of the company's filings with the SEC, or any of the agreements or other documents that constitute exhibits to those filings, can be obtained by request directed to the company at the following address and telephone number:
Arrow Electronics, Inc.
9201 East Dry Creek Road
Centennial, Colorado 80112
(303) 824-4000
Attention: Corporate Secretary
The company also makes these filings available, free of charge, through its website (http://www.arrow.com) as soon as reasonably practicable after the company files such material with the SEC. The company does not intend this internet address to be an active link or to otherwise incorporate the contents of the website into this Annual Report on Form 10-K.
5
Executive Officers
The following table sets forth the names, ages, and the positions held by each of the executive officers of the company as of February 5, 2016:
Name | Age | Position |
Michael J. Long | 57 | Chairman, President, and Chief Executive Officer |
Andrew S. Bryant | 60 | Chief Operating Officer, Arrow Global Enterprise Computing Solutions and Global Components |
Sean J. Kerins | 53 | President, Arrow Global Enterprise Computing Solutions |
Andy King | 52 | President, Arrow Global Components |
Vincent P. Melvin | 52 | Senior Vice President, Chief Information Officer |
M. Catherine Morris | 57 | Senior Vice President, Chief Strategy Officer |
Paul J. Reilly | 59 | Executive Vice President, Finance and Operations, and Chief Financial Officer |
Gregory P. Tarpinian | 54 | Senior Vice President, General Counsel, and Secretary |
Gretchen K. Zech | 46 | Senior Vice President, Global Human Resources |
Set forth below is a brief account of the business experience during the past five years of each executive officer of the company.
Michael J. Long has been Chairman of the Board of Directors and Chief Executive Officer of the company for more than five years. He has been a Director and President of the company for more than five years.
Andrew S. Bryant was appointed Chief Operating Officer of the Arrow Global Enterprise Computing Solutions and Global Components businesses in May 2014. Prior thereto he served as the President of Arrow Global Enterprise Computing Solutions for more than five years.
Sean J. Kerins was appointed President of Arrow Global Enterprise Computing Solutions in May 2014. Prior thereto he served as President of North America Enterprise Computing Solutions from July 2010 to May 2014.
Andy King was appointed President of Arrow Global Components in November 2015. Prior thereto he served as President of EMEA Components from November 2013 to November 2015 and Vice President of Sales in EMEA Components from November 2011 to November 2013. He also served as the VP of EMEA Marketing and Engineering from November 2010 to November 2011.
Vincent P. Melvin was appointed Senior Vice President of the company in December 2013. Prior thereto he served as Vice President of the company from September 2006 to December 2013. He has been the Chief Information Officer of the company for more than five years.
M. Catherine Morris has been Senior Vice President and Chief Strategy Officer of the company for more than five years.
Paul J. Reilly has been Executive Vice President, Finance and Operations, and Chief Financial Officer of the company for more than five years.
Gregory P. Tarpinian was appointed Senior Vice President, General Counsel, and Secretary of the company effective January 2015. Prior thereto he served as the Vice President of Legal Affairs for more than five years.
Gretchen K. Zech was appointed Senior Vice President of Global Human Resources of the company in November 2011. Prior to joining Arrow she served as Senior Vice President, Human Resources, for Dex One Corporation (formerly known as R.H. Donnelley Corporation) from June 2006 to November 2011. R.H. Donnelley Corporation filed for reorganization under Chapter 11 of the United States Bankruptcy Code in May 2009 and emerged as Dex One Corporation in January 2010.
6
Item 1A. Risk Factors.
Described below and throughout this report are certain risks that the company's management believes are applicable to the company's business and the industry in which it operates. If any of the described events occur, the company's business, results of operations, financial condition, liquidity, or access to the capital markets could be materially adversely affected. When stated below that a risk may have a material adverse effect on the company's business, it means that such risk may have one or more of these effects. There may be additional risks that are not presently material or known. There are also risks within the economy, the industry, and the capital markets that could materially adversely affect the company, including those associated with an economic recession, inflation, a global economic slowdown, and those associated with customers' inability or refusal to pay for the products and services provided by the company. There are also risks associated with the occurrence of natural disasters such as tsunamis, hurricanes, tornadoes, and floods. These factors affect businesses generally, including the company's customers and suppliers and, as a result, are not discussed in detail below except to the extent such conditions could materially affect the company and its customers and suppliers in particular ways. Included below are some risks pertaining to specific government regulation, however, not all regulations applicable to the company or unanticipated regulation changes (such as changes in tax regulations in the various geographies we operate) have been described. The continuing expansion of government laws and regulations, some that may apply specifically to the company's industry and others to the market generally, as well as any actions taken by activist investors, could negatively impact the company's profitability.
If the company is unable to maintain its relationships with its suppliers or if the suppliers materially change the terms of their existing agreements with the company, the company's business could be materially adversely affected.
A substantial portion of the company's inventory is purchased from suppliers with which the company has entered into non-exclusive distribution agreements. These agreements are typically cancelable on short notice (generally 30 to 90 days). Certain parts of the company's business, such as the company's global ECS business, rely on a limited number of suppliers. To the extent that the company's significant suppliers reduce the amount of products they sell through distribution, are unwilling to continue to do business with the company, or are unable to continue to meet or significantly alter their obligations, the company's business could be materially adversely affected. In addition, to the extent that the company's suppliers modify the terms of their contracts with the company, limit supplies due to capacity constraints, or other factors, there could be a material adverse effect on the company's business.
The competitive pressures the company faces could have a material adverse effect on the company's business.
The company operates in a highly competitive international environment. The company competes with other large multinational and national electronic components and enterprise computing solutions distributors, as well as numerous other smaller, specialized competitors who generally focus on narrower markets, products, or particular sectors. The company also competes for customers with its suppliers. The size of the company's competitors vary across market sectors, as do the resources the company has allocated to the sectors in which it does business. Therefore, some of the company's competitors may have a more extensive customer and/or supplier base than the company in one or more of its market sectors. There is significant competition within each market sector and geography that creates pricing pressure and the need for constant attention to improve services. Other competitive factors include rapid technological changes, product availability, credit availability, speed of delivery, ability to tailor solutions to customer needs, quality and depth of product lines and training, as well as service and support provided by the distributor to the customer. The Company also faces competition from companies entering or expanding into the logistics and product fulfillment, catalog distribution, and e-commerce supply chain services markets. As the company seeks to expand its business into new areas in order to stay competitive in the market, such as in the area of the "Internet of Things," the company may encounter increased competition from its current and/or new competitors. The company's failure to maintain and enhance its competitive position could have a material adverse effect on its business.
Products sold by the company may be found to be defective and, as a result, warranty and/or product liability claims may be asserted against the company, which may have a material adverse effect on the company.
The company sells its components at prices that are significantly lower than the cost of the equipment or other goods in which they are incorporated. As a result, the company may face claims for damages (such as consequential damages) that are disproportionate to the revenues and profits it receives from the components involved in the claims. While the company typically has provisions in its supplier agreements that hold the supplier accountable for defective products, and the company and its suppliers generally exclude consequential damages in their standard terms and conditions, the company's ability to avoid such liabilities may be limited as a result of differing factors, such as the inability to exclude such damages due to the laws of some of the countries where it does business. The company's business could be materially adversely affected as a result of a significant quality or performance issue in the products sold by the company, if it is required to pay for the associated damages. Although the company
7
currently has product liability insurance, such insurance is limited in coverage and amount. Further, when relying on contractual liability exclusions, the company could lose customers if their claims are not addressed to their satisfaction.
Declines in value and other factors pertaining to the company's inventory could materially adversely affect its business.
The market for the company's products and services is subject to rapid technological change, evolving industry standards, changes in end-market demand, oversupply of product, and regulatory requirements, which can contribute to the decline in value or obsolescence of inventory. Although most of the company's suppliers provide the company with certain protections from the loss in value of inventory (such as price protection and certain rights of return), the company cannot be sure that such protections will fully compensate it for the loss in value, or that the suppliers will choose to, or be able to, honor such agreements. For example, many of the company's suppliers will not allow products to be returned after they have been held in inventory beyond a certain amount of time, and, in most instances, the return rights are limited to a certain percentage of the amount of product the company purchased in a particular time frame. All of these factors pertaining to inventory could have a material adverse effect on the company's business.
The company is subject to environmental laws and regulations that could materially adversely affect its business.
A number of jurisdictions in which the company's products are sold have enacted laws addressing environmental and other impacts from product disposal, use of hazardous materials in products, use of chemicals in manufacturing, recycling of products at the end of their useful life, and other related matters. These laws prohibit the use of certain substances in the manufacture of the company's products and impose a variety of requirements for modification of manufacturing processes, registration, chemical testing, labeling, and other matters. Failure to comply with these laws or any other applicable environmental regulations could result in fines or suspension of sales. Additionally, these directives and regulations may result in the company having non-compliant inventory that may be less readily salable or have to be written off.
Some environmental laws impose liability, sometimes without fault, for investigating or cleaning up contamination on or emanating from the company's currently or formerly owned, leased, or operated property, as well as for damages to property or natural resources and for personal injury arising out of such contamination. As the distribution business, in general, does not involve the manufacture of products, it is typically not subject to significant liability in this area. However, there may be occasions, including through acquisitions, where environmental liability arises. Two sites for which the company assumed responsibility as part of the Wyle Electronics ("Wyle") acquisition are known to have environmental issues, one at Norco, California and the other at Huntsville, Alabama. The company was also named as a defendant in a private lawsuit filed in connection with alleged contamination at a small industrial building formerly leased by Wyle Laboratories in El Segundo, California. The lawsuit was settled, but the possibility remains that government entities or others may attempt to involve the company in further characterization or remediation of groundwater issues in the area. The presence of environmental contamination could also interfere with ongoing operations or adversely affect the company's ability to sell or lease its properties. The discovery of contamination for which the company is responsible, the enactment of new laws and regulations, or changes in how existing requirements are enforced, could require the company to incur costs for compliance or subject it to unexpected liabilities.
Expansion into the electronic asset disposition market has broadened the company's risk profile.
The company has expanded into the electronics asset disposition business, pursuant to which it provides services related to electronic devices being disposed of by business customers. These services include, the cleansing of storage devices from customer equipment and either recycling it through resale or disposing of it in an environmentally compliant manner. The company may also hold equipment in order to protect and preserve customer data. If the company does not meet its contractual and regulatory obligations with respect to such data, it could be subject to financial damages, penalties, and damage to reputation. Also, the company's or its subcontractors' failure to comply with applicable environmental laws and regulations in disposing of the equipment could result in liability. Such environmental liability may be joint and several, meaning that the company could be held responsible for more than its share of the liability involved. To the extent that company fails to comply with its obligations and such failure is not covered by insurance, the company's business could be adversely affected.
The company may not have adequate or cost-effective liquidity or capital resources.
The company requires cash or committed liquidity facilities for general corporate purposes, such as funding its ongoing working capital, acquisition, and capital expenditure needs, as well as to refinance indebtedness. At December 31, 2015, the company had cash and cash equivalents of $273.1 million. In addition, the company currently has access to committed credit lines and an asset securitization program of $2.4 billion, of which the company had outstanding borrowings of $147.0 million at December 31, 2015. The company's ability to satisfy its cash needs depends on its ability to generate cash from operations and to access the
8
financial markets, both of which are subject to general economic, financial, competitive, legislative, regulatory, and other factors that are beyond its control.
The company may, in the future, need to access the financial markets to satisfy its cash needs. The company's ability to obtain external financing is affected by various factors including general financial market conditions and the company's debt ratings. Further, any increase in the company's level of debt, change in status of its debt from unsecured to secured debt, or deterioration of its operating results may cause a reduction in its current debt ratings. Any downgrade in the company's current debt rating or tightening of credit availability could impair the company's ability to obtain additional financing or renew existing credit facilities on acceptable terms. Under the terms of any external financing, the company may incur higher financing expenses and become subject to additional restrictions and covenants. For example, the company's existing debt agreements contain restrictive covenants, including covenants requiring compliance with specified financial ratios, and a failure to comply with these or any other covenants may result in an event of default. The company's lack of access to cost-effective capital resources, an increase in the company's financing costs, or a breach of debt covenants could have a material adverse effect on the company's business.
The agreements governing some of the company's financing arrangements contain various covenants and restrictions that limit some of management's discretion in operating the business and could prevent the company from engaging in some activities that may be beneficial to its business.
The agreements governing the company's financings contain various covenants and restrictions that, in certain circumstances, could limit its ability to:
• | grant liens on assets; |
• | make investments; |
• | merge, consolidate, or transfer all or substantially all of its assets; |
• | incur additional debt; or |
• | engage in certain transactions with affiliates. |
As a result of these covenants and restrictions, the company may be limited in how it conducts its business and may be unable to raise additional debt, compete effectively, or make investments.
The company's failure to have long-term sales contracts may have a material adverse effect on its business.
Most of the company's sales are made on an order-by-order basis, rather than through long-term sales contracts. The company generally works with its customers to develop non-binding forecasts for future orders. Based on such non-binding forecasts, the company makes commitments regarding the level of business that it will seek and accept, the inventory that it purchases, and the levels of utilization of personnel and other resources. A variety of conditions, both specific to each customer and generally affecting each customer's industry may cause customers to cancel, reduce, or delay orders that were either previously made or anticipated, file for bankruptcy protection or fail, or default on their payments. Generally, customers cancel, reduce, or delay purchase orders and commitments without penalty. The company seeks to mitigate these risks, in some cases, by entering into noncancelable/nonreturnable sales agreements, but there is no guarantee that such agreements will adequately protect the company. Significant or numerous cancellations, reductions, delays in orders by customers, loss of customers, and/or customer defaults on payments could materially adversely affect the company's business.
The company's revenues originate primarily from the sales of semiconductor, PEMCO (passive, electro-mechanical and interconnect), IT hardware and software products, the sales of which are traditionally cyclical.
The semiconductor industry historically has experienced fluctuations in product supply and demand, often associated with changes in technology and manufacturing capacity and subject to significant economic market upturns and downturns. Sales of semiconductor products and related services represented approximately 41%, 42%, and 41% of the company's consolidated sales in 2015, 2014, and 2013, respectively. The sale of the company's PEMCO products closely tracks the semiconductor market. Accordingly, the company's revenues and profitability, particularly in its global components business segment, tend to closely follow the strength or weakness of the semiconductor market. Further, economic weakness could cause a decline in spending in information technology, which could have a negative impact on the company's ECS business. A cyclical downturn in the technology industry could have a material adverse effect on the company's business and negatively impact its ability to maintain historical profitability levels.
9
The company's non-U.S. sales represent a significant portion of its revenues, and consequently, the company is exposed to risks associated with operating internationally.
In 2015, 2014, and 2013, approximately 54%, 54%, and 53%, respectively, of the company's sales came from its operations outside the United States. As a result of the company's international sales and locations, its operations are subject to a variety of risks that are specific to international operations, including the following:
• | import and export regulations that could erode profit margins or restrict exports; |
• | the burden and cost of compliance with international laws, treaties, and technical standards and changes in those regulations; |
• | potential restrictions on transfers of funds; |
• | import and export duties and value-added taxes; |
• | transportation delays and interruptions; |
• | the burden and cost of compliance with complex multi-national tax laws and regulations; |
• | uncertainties arising from local business practices and cultural considerations; |
• | enforcement of the Foreign Corrupt Practices Act, or similar laws of other jurisdictions; |
• | foreign laws that potentially discriminate against companies which are headquartered outside that jurisdiction; |
• | volatility associated with sovereign debt of certain international economies; |
• | potential military conflicts and political risks; and |
• | currency fluctuations, which the company attempts to minimize through traditional hedging instruments. |
Furthermore, products the company sells which are either manufactured in the United States or based on U.S. technology ("U.S. Products") are subject to the Export Administration Regulations ("EAR") when exported and re-exported to and from all international jurisdictions, in addition to the local jurisdiction's export regulations applicable to individual shipments. Licenses or proper license exemptions may be required by local jurisdictions' export regulations, including EAR, for the shipment of certain U.S. Products to certain countries, including China, India, Russia, and other countries in which the company operates. Non-compliance with the EAR or other applicable export regulations can result in a wide range of penalties including the denial of export privileges, fines, criminal penalties, and the seizure of inventories. In the event that any export regulatory body determines that any shipments made by the company violate the applicable export regulations, the company could be fined significant sums and/or its export capabilities could be restricted, which could have a material adverse effect on the company's business.
Also, the company's operating income margins in the components business in the Asia/Pacific region tend to be lower than those in the other markets in which the company sells products and services. If sales in this market increased as a percentage of overall sales, consolidated operating income margins will be lower. The financial impact of lower operating income on returns on working capital is offset, in part, by lower working capital requirements. While the company has and will continue to adopt measures to reduce the potential impact of losses resulting from the risks of doing business abroad, it cannot ensure that such measures will be adequate and, therefore, could have a material adverse effect on its business.
When the company makes acquisitions, it may take on additional liabilities or not be able to successfully integrate such acquisitions.
As part of the company's history and growth strategy, it has acquired other businesses. Acquisitions involve numerous risks, including the following:
• | effectively combining the acquired operations, technologies, or products; |
• | unanticipated costs or assumed liabilities, including those associated with regulatory actions or investigations; |
• | not realizing the anticipated financial benefit from the acquired companies; |
• | diversion of management's attention; |
• | negative effects on existing customer and supplier relationships; and |
• | potential loss of key employees, especially those of the acquired companies. |
Further, the company has made, and may continue to make acquisitions of, or investments in new services, businesses or technologies to expand its current service offerings and product lines. Some of these may involve risks that may differ from those traditionally associated with the company's core distribution business, including undertaking product or service warranty responsibilities that in its traditional core business would generally reside primarily with its suppliers. If the company is not successful in mitigating or insuring against such risks, it could have a material adverse effect on the company's business.
10
The company's goodwill and identifiable intangible assets could become impaired, which could reduce the value of its assets and reduce its net income in the year in which the write-off occurs.
Goodwill represents the excess of the cost of an acquisition over the fair value of the assets acquired. The company also ascribes value to certain identifiable intangible assets, which consist primarily of customer relationships and trade names, among others, as a result of acquisitions. The company may incur impairment charges on goodwill or identifiable intangible assets if it determines that the fair values of the goodwill or identifiable intangible assets are less than their current carrying values. The company evaluates, on a regular basis, whether events or circumstances have occurred that indicate all, or a portion, of the carrying amount of goodwill or identifiable intangible assets may no longer be recoverable, in which case an impairment charge to earnings would become necessary.
Refer to Notes 1 and 3 of the Notes to the Consolidated Financial Statements and 'Critical Accounting Policies' in Management's Discussion and Analysis of Financial Condition and Results of Operations for further discussion of the impairment testing of goodwill and identifiable intangible assets.
A decline in general economic conditions or global equity valuations could impact the judgments and assumptions about the fair value of the company's businesses and the company could be required to record impairment charges on its goodwill or other identifiable intangible assets in the future, which could impact the company's consolidated balance sheet, as well as the company's consolidated statement of operations. If the company is required to recognize an impairment charge in the future, the charge would not impact the company's consolidated cash flows, current liquidity, or capital resources.
If the company fails to maintain an effective system of internal controls or discovers material weaknesses in its internal controls over financial reporting, it may not be able to report its financial results accurately or timely or detect fraud, which could have a material adverse effect on its business.
An effective internal control environment is necessary for the company to produce reliable financial reports and is an important part of its effort to prevent financial fraud. The company is required to annually evaluate the effectiveness of the design and operation of its internal controls over financial reporting. Based on these evaluations, the company may conclude that enhancements, modifications, or changes to internal controls are necessary or desirable. While management evaluates the effectiveness of the company's internal controls on a regular basis, these controls may not always be effective. There are inherent limitations on the effectiveness of internal controls, including collusion, management override, and failure in human judgment. In addition, control procedures are designed to reduce rather than eliminate financial statement risk. If the company fails to maintain an effective system of internal controls, or if management or the company's independent registered public accounting firm discovers material weaknesses in the company's internal controls, it may be unable to produce reliable financial reports or prevent fraud, which could have a material adverse effect on the company's business. In addition, the company may be subject to sanctions or investigation by regulatory authorities, such as the SEC or the NYSE. Any such actions could result in an adverse reaction in the financial markets due to a loss of confidence in the reliability of the company's financial statements, which could cause the market price of its common stock to decline or limit the company's access to capital.
Cyber security and privacy breaches may hurt the company’s business, damage its reputation, increase its costs, and cause losses.
The company’s information technology systems could be subject to invasion, cyber-attack, or data privacy breaches by employees, others with authorized access, and unauthorized persons. Such attacks could result in disruption to the company’s operations, loss or disclosure of, or damage to, the company’s or any of its customer’s or supplier’s data or confidential information. The company’s information technology systems security measures may also be breached due to employee error, malfeasance, or otherwise. Additionally, outside parties may attempt to fraudulently induce employees, customers or suppliers to disclose sensitive information in order to gain access to the company’s data and information technology systems. Any such breach could result in significant legal and financial exposure, damage to the company’s reputation, loss of competitive advantage, and a loss of confidence in the security of the company’s information technology systems that could potentially have an impact on the company’s business. Because the techniques used to obtain unauthorized access, disable or degrade, or sabotage the company’s information technology systems change frequently and often are not recognized until launched, the company may be unable to anticipate these techniques or to implement adequate preventive measures. Further, third parties, such as hosted solution providers, that provide services for the company’s operations, could also be a source of security risk in the event of a failure of their own security systems and infrastructure. In addition, sophisticated hardware and operating system software and applications that the company procures from third parties may contain defects in design or manufacture, including "bugs" and other problems that could unexpectedly interfere with the operation of the company’s information technology systems. Although the company has developed systems and processes that are designed to protect information and prevent data loss and other security breaches, including systems and processes designed
11
to reduce the impact of a security breach, such measures cannot provide absolute security. Such breaches, whether successful or unsuccessful, could result in the company incurring costs related to, for example, rebuilding internal systems, defending against litigation, responding to regulatory inquiries or actions, paying damages, or taking other remedial steps.
Also, global privacy legislation, enforcement, and policy activity are rapidly expanding and creating a complex compliance environment. The company’s failure to comply with federal, state, or international privacy related or data protection laws and regulations could result in proceedings against the company by governmental entities or others. Although the company has insurance coverage for protecting against cyber security risks, it may not be sufficient to cover all possible claims, and the company may suffer losses that could have a material adverse effect on its business.
The company relies heavily on its internal information systems, which, if not properly functioning, could materially adversely affect the company's business.
The company's current global operations reside on multiple technology platforms. The size and complexity of the company's computer systems make them potentially vulnerable to breakdown, malicious intrusion, and random attack. Because many of the company's systems consist of a number of legacy, internally developed applications, it can be harder to upgrade and may be more difficult to adapt to commercially available software.
The company is in process of implementing a global enterprise resource planning ("ERP") system to standardize its global components processes worldwide and adopt best-in-class capabilities. The conversion is substantially complete in the EMEA and Asia/Pacific regions, while the conversion in the Americas region is expected to be implemented over the next few years. The company has committed significant resources to this new ERP system, which replaces multiple legacy systems of the company. This conversion is extremely complex, in part, because of the wide range of processes and the multiple legacy systems that must be integrated globally. The company is using a controlled project plan that it believes will provide for the adequate allocation of resources. However, such a plan, or a divergence from it, may result in cost overruns, project delays, or business interruptions. During the conversion process, the company may be limited in its ability to integrate any business that it may want to acquire. Failure to properly or adequately address these issues could impact the company's ability to perform necessary business operations, which could materially adversely affect the company's business.
The company may be subject to intellectual property rights claims, which are costly to defend, could require payment of damages or licensing fees and could limit the company's ability to use certain technologies in the future.
Certain of the company's products and services include intellectual property owned primarily by the company's third party suppliers and, to a lesser extent, the company itself. Substantial litigation and threats of litigation regarding intellectual property rights exist in the semiconductor/integrated circuit, software and some service industries. From time to time, third parties (including certain companies in the business of acquiring patents not for the purpose of developing technology but with the intention of aggressively seeking licensing revenue from purported infringers) may assert patent, copyright and/or other intellectual property rights to technologies that are important to the company's business. In some cases, depending on the nature of the claim, the company may be able to seek indemnification from its suppliers for itself and its customers against such claims, but there is no assurance that it will be successful in obtaining such indemnification or that the company is fully protected against such claims. In addition, the company is exposed to potential liability for technology that it develops itself for which it has no indemnification protections. In any dispute involving products or services that incorporate intellectual property developed, licensed by the company, or obtained through acquisition, the company's customers could also become the target of litigation. The company is obligated in many instances to indemnify and defend its customers if the products or services the company sells are alleged to infringe any third party's intellectual property rights. Any infringement claim brought against the company, regardless of the duration, outcome, or size of damage award, could:
• | result in substantial cost to the company; |
• | divert management's attention and resources; |
• | be time consuming to defend; |
• | result in substantial damage awards; or |
• | cause product shipment delays. |
Additionally, if an infringement claim is successful the company may be required to pay damages or seek royalty or license arrangements, which may not be available on commercially reasonable terms. The payment of any such damages or royalties may significantly increase the company's operating expenses and harm the company's operating results and financial condition. Also, royalty or license arrangements may not be available at all. The company may have to stop selling certain products or using technologies, which could affect the company's ability to compete effectively.
12
The company may not be able to adequately anticipate, prevent or mitigate damage resulting from criminal and other illegal or fraudulent activities committed against it.
Global businesses like ours are facing increasing risks of criminal, illegal and other fraudulent acts. The evolving nature of such threats, in light of new and sophisticated methods used by criminals, including phishing, social engineering and forgery, are making it increasingly difficult for us to anticipate and adequately mitigate these risks. Although management believes internal controls are adequate to timely detect unauthorized cash disbursements so as to prevent a material misstatement of the company’s financial statements, these controls may not be adequate to safeguard the company’s cash assets from unauthorized transfers resulting from human error. In addition, designing and implementing measures to defend against, prevent and detect these types of activities are increasingly costly and invasive into the operations of the business. As a result, we could experience a material loss in the future to the extent that controls and other measures we implement to address these threats fail to prevent or detect such acts.
Compliance with government regulations regarding the use of "conflict minerals" may result in increased costs and risks to the company.
As part of the Dodd-Frank Wall Street Reform and Consumer Protection Act of 2010 (the "Act"), the SEC has promulgated disclosure requirements regarding the use of certain minerals, which are mined from the Democratic Republic of Congo and adjoining countries, known as conflict minerals. The disclosure rules were effective in May 2014. The company must publicly disclose the process it took to determine whether it manufactures (as defined in the Act) any products that contain conflict minerals. Customers typically rely on the company to provide critical data regarding the parts they purchase, including conflict mineral information. The company's material sourcing is broad-based and multi-tiered, and it is not able to easily verify the origins for conflict minerals used in all of the products it sells. The company has many suppliers and each provides conflict mineral information in a different manner, if at all. Accordingly, because the supply chain is complex, the company may face reputational challenges if it is unable to sufficiently verify the origins of conflict minerals used in its products. Additionally, customers may demand that the products they purchase be free of conflict minerals. This may limit the number of suppliers that can provide products in sufficient quantities to meet customer demand or at competitive prices.
Item 1B. Unresolved Staff Comments.
None.
Item 2. Properties.
The company owns and leases sales offices, distribution centers, and administrative facilities worldwide. Its executive office is located in Centennial, Colorado and occupies a 129,000 square foot facility under a long-term lease expiring in 2017. The company owns 21 locations throughout the Americas, EMEA, and Asia Pacific regions and occupies approximately 450 additional locations under leases due to expire on various dates through 2026. The company believes its facilities are well maintained and suitable for company operations.
Item 3. Legal Proceedings.
Environmental and Related Matters
In connection with the purchase of Wyle in August 2000, the company acquired certain of the then outstanding obligations of Wyle, including Wyle's indemnification obligations to the purchasers of its Wyle Laboratories division for environmental clean-up costs associated with any then existing contamination or violation of environmental regulations. Under the terms of the company's purchase of Wyle from the sellers, the sellers agreed to indemnify the company for certain costs associated with the Wyle environmental obligations, among other things. As part of the settlement agreement the company accepted responsibility for any potential subsequent costs incurred related to the Wyle matters. The company is aware of two Wyle Laboratories facilities (in Huntsville, Alabama and Norco, California) at which contaminated groundwater was identified and will require environmental remediation. As further discussed in Note 15 of the Notes to the Consolidated Financial Statements, the Huntsville, Alabama site is being investigated by the company under the direction of the Alabama Department of Environmental Management. The Norco, California site is subject to a consent decree, entered in October 2003, between the company, Wyle Laboratories, and the California Department of Toxic Substance Control. In addition, the company was named as a defendant in several lawsuits related to the Norco facility and a third site in El Segundo, California which have now been settled to the satisfaction of the parties.
13
The company expects these environmental liabilities to be resolved over an extended period of time. Costs are recorded for environmental matters when it is probable that a liability has been incurred and the amount of the liability can be reasonably estimated. Accruals for environmental liabilities are adjusted periodically as facts and circumstances change, assessment and remediation efforts progress, or as additional technical or legal information becomes available. Environmental liabilities are difficult to assess and estimate due to various unknown factors such as the timing and extent of remediation, improvements in remediation technologies, and the extent to which environmental laws and regulations may change in the future. Accordingly, the company cannot presently fully estimate the ultimate potential costs related to these sites until such time as a substantial portion of the investigation at the sites is completed and remedial action plans are developed and, in some instances implemented. To the extent that future environmental costs exceed amounts currently accrued by the company, net income would be adversely impacted and such impact could be material.
As successor-in-interest to Wyle, the company is the beneficiary of various Wyle insurance policies that covered liabilities arising out of operations at Norco and Huntsville. To date, the company has recovered approximately $37.0 million from certain insurance carriers relating to environmental clean-up matters at the Norco site. The company is considering the best way to pursue its potential claims against insurers regarding liabilities arising out of operations at Huntsville. The resolution of these matters will likely take several years. The company has not recorded a receivable for any potential future insurance recoveries related to the Norco and Huntsville environmental matters, as the realization of the claims for recovery are not deemed probable at this time.
The company believes the settlement amount together with potential recoveries from various insurance policies covering environmental remediation and related litigation will be sufficient to cover any potential future costs related to the Wyle acquisition; however, it is possible unexpected costs beyond those anticipated could occur.
Tekelec Matter
In 2000, the company purchased Tekelec Europe SA ("Tekelec") from Tekelec Airtronic SA and certain other selling shareholders. Subsequent to the closing of the acquisition, Tekelec received a product liability claim in the amount of €11.3 million. The product liability claim was the subject of a French legal proceeding started by the claimant in 2002, under which separate determinations were made as to whether the products that are subject to the claim were defective and the amount of damages sustained by the purchaser. The manufacturer of the products also participated in this proceeding. The claimant has commenced legal proceedings against Tekelec and its insurers to recover damages in the amount of €3.7 million and expenses of €.3 million plus interest. In May 2012, the French court ruled in favor of Tekelec and dismissed the plaintiff's claims. In January 2015, the Court of Appeals confirmed the French court's ruling; however, the ruling remains subject to a final appeal by the plaintiff. The company believes that any amount in addition to the amount accrued by the company would not materially adversely impact the company's consolidated financial position, liquidity, or results of operations.
Antitrust Investigation
On January 21, 2014, the company received a Civil Investigative Demand in connection with an investigation by the Federal Trade Commission ("FTC") relating generally to the use of a database program (the “database program”) that has operated for more than ten years under the auspices of the Global Technology Distribution Council ("GTDC"), a trade group of which the company is a member. Under the database program, certain members of the GTDC who participate in the program provide sales data to a third party independent contractor chosen by the GTDC. The data is aggregated by the third party and the aggregated data is made available to the program participants. The company understands that other members participating in the database program have received similar Civil Investigative Demands.
In April 2014, the company responded to the Civil Investigative Demand. The Civil Investigative Demand merely sought information, and no proceedings have been instituted against any person. The company continues to believe that there has not been any conduct by the company or its employees that would be actionable under the antitrust laws in connection with its participation in the database program. Since this matter is at a preliminary stage, it is not possible to predict the potential impact, if any, of the Civil Investigative Demand or whether any actions may be instituted by the FTC against any person.
Other
From time to time, in the normal course of business, the company may become liable with respect to other pending and threatened litigation, environmental, regulatory, labor, product, and tax matters. While such matters are subject to inherent uncertainties, it is not currently anticipated that any such matters will materially impact the company's consolidated financial position, liquidity, or results of operations.
14
Item 4. Mine Safety Disclosures.
Not applicable.
15
PART II
Item 5. | Market for Registrant's Common Equity, Related Stockholder Matters and Issuer Purchases of Equity Securities. |
Market Information
The company's common stock is listed on the NYSE (trading symbol: "ARW"). The high and low sales prices during each quarter of 2015 and 2014 are as follows:
Year | High | Low | ||||
2015: | ||||||
Fourth Quarter | $ | 59.98 | $ | 51.60 | ||
Third Quarter | 59.27 | 50.79 | ||||
Second Quarter | 63.77 | 57.67 | ||||
First Quarter | 64.67 | 54.27 | ||||
2014: | ||||||
Fourth Quarter | $ | 59.43 | $ | 46.42 | ||
Third Quarter | 62.71 | 56.90 | ||||
Second Quarter | 60.81 | 54.40 | ||||
First Quarter | 58.52 | 48.82 | ||||
Record Holders
On February 1, 2016, there were approximately 1,647 shareholders of record of the company's common stock.
Dividend History
The company did not pay cash dividends on its common stock during 2015 or 2014. While from time to time the Board of Directors (the "Board") considers the payment of dividends on the common stock, the declaration of future dividends is dependent upon the company's earnings, financial condition, and other relevant factors, including debt covenants.
Equity Compensation Plan Information
The following table summarizes information, as of December 31, 2015, relating to the Omnibus Incentive Plan, which was approved by the company's shareholders and under which cash-based awards, non-qualified stock options, incentive stock options, stock appreciation rights, restricted stock, restricted stock units, performance shares, performance share units, covered employee annual incentive awards, and other stock-based awards may be granted.
Plan Category | Number of Securities to be Issued Upon Exercise of Outstanding Options, Warrants and Rights | Weighted-Average Exercise Price of Outstanding Options, Warrants and Rights | Number of Securities Remaining Available for Future Issuance | |||||||
Equity compensation plans approved by security holders | 3,607,360 | $ | 48.11 | 7,553,173 | ||||||
Total | 3,607,360 | $ | 48.11 | 7,553,173 | ||||||
16
Performance Graph
The following graph compares the performance of the company's common stock for the periods indicated with the performance of the Standard & Poor's 500 Stock Index ("S&P 500 Stock Index") and the average performance of a group consisting of the company's peer companies ("Peer Group") on a line-of-business basis. The companies included in the Peer Group are Anixter International Inc., Avnet, Inc., Celestica Inc., Flextronics International Ltd., Ingram Micro Inc., Jabil Circuit, Inc., and Tech Data Corporation. The graph assumes $100 invested on December 31, 2010 in the company, the S&P 500 Stock Index, and the Peer Group. Total return indices reflect reinvestment of dividends and are weighted on the basis of market capitalization at the time of each reported data point.
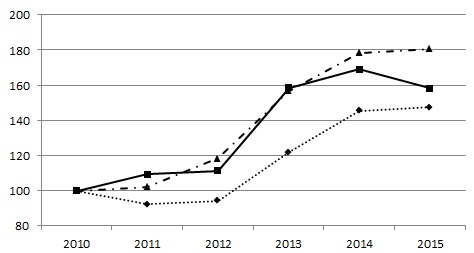

2010 | 2011 | 2012 | 2013 | 2014 | 2015 | |
Arrow Electronics | 100 | 109 | 111 | 158 | 169 | 158 |
Peer Group | 100 | 92 | 94 | 122 | 145 | 147 |
S&P 500 Stock Index | 100 | 102 | 118 | 157 | 178 | 181 |
Issuer Purchases of Equity Securities
During 2014, the company's Board approved the repurchase of up to $400 million ($200 million in May and December, respectively) of the company's common stock through a share-repurchase program. In September 2015, the company's Board approved an additional repurchase of up to $400 million of the company's common stock (collectively the "Share-Repurchase Programs").
The following table shows the share-repurchase activity for the quarter ended December 31, 2015:
Month | Total Number of Shares Purchased(a) | Average Price Paid per Share | Total Number of Shares Purchased as Part of Publicly Announced Program(b) | Approximate Dollar Value of Shares that May Yet be Purchased Under the Program | ||||||||||
September 27 through October 31, 2015 | — | $ | — | — | $ | 469,413,591 | ||||||||
November 1 through 28, 2015 | 1,565,710 | 58.27 | 1,565,710 | 378,177,246 | ||||||||||
November 29 through December 31, 2015 | 1,055,930 | 55.49 | 1,052,281 | 319,782,917 | ||||||||||
Total | 2,621,640 | 2,617,991 | ||||||||||||
17
(a) | Includes share repurchases under the Share-Repurchase Programs and those associated with shares withheld from employees for stock-based awards, as permitted by the Omnibus Incentive Plan, in order to satisfy the required tax withholding obligations. |
(b) | The difference between the "total number of shares purchased" and the "total number of shares purchased as part of publicly announced program" for the quarter ended December 31, 2015 is 3,649 shares, which relate to shares withheld from employees for stock-based awards, as permitted by the Omnibus Incentive Plan, in order to satisfy the required tax withholding obligations. The purchase of these shares were not made pursuant to any publicly announced repurchase plan. |
18
Item 6. Selected Financial Data.
The following table sets forth certain selected consolidated financial data and must be read in conjunction with the company's consolidated financial statements and related notes appearing elsewhere in this Annual Report on Form 10-K (dollars in thousands except per share data):
For the years ended December 31: | 2015 (a) | 2014 (b) | 2013 (c) | 2012 (d) | 2011 (e) | ||||||||||||||
Sales | $ | 23,282,020 | $ | 22,768,674 | $ | 21,357,285 | $ | 20,405,128 | $ | 21,390,264 | |||||||||
Operating income | $ | 824,482 | $ | 762,257 | $ | 693,500 | $ | 804,123 | $ | 908,843 | |||||||||
Net income attributable to shareholders | $ | 497,726 | $ | 498,045 | $ | 399,420 | $ | 506,332 | $ | 598,810 | |||||||||
Net income per share: | |||||||||||||||||||
Basic | $ | 5.26 | $ | 5.05 | $ | 3.89 | $ | 4.64 | $ | 5.25 | |||||||||
Diluted | $ | 5.20 | $ | 4.98 | $ | 3.85 | $ | 4.56 | $ | 5.17 | |||||||||
At December 31: | |||||||||||||||||||
Accounts receivable and inventories | $ | 8,627,908 | $ | 8,379,107 | $ | 7,937,046 | $ | 6,976,618 | $ | 6,446,027 | |||||||||
Total assets | 13,021,930 | 12,435,301 | 12,051,562 | 10,779,737 | 9,821,563 | ||||||||||||||
Long-term debt | 2,380,575 | 2,067,898 | 2,216,811 | 1,581,528 | 1,920,307 | ||||||||||||||
Shareholders' equity | 4,142,443 | 4,153,970 | 4,180,232 | 3,983,222 | 3,668,812 | ||||||||||||||
(a) | Operating income and net income attributable to shareholders include identifiable intangible asset amortization of $51.0 million ($41.3 million net of related taxes or $.44 and $.43 per share on a basic and diluted basis, respectively), and restructuring, integration, and other charges of $68.8 million ($51.3 million net of related taxes or $.54 per share on both a basic and diluted basis). Net income attributable to shareholders includes a loss on prepayment of debt of $2.9 million ($1.8 million net of related taxes or $.02 per share on both a basic and diluted basis), a gain on sale of investment of $2.0 million ($1.7 million net of related taxes or $.02 per share on both a basic and diluted basis), and a loss on investment of $3.0 million ($1.8 million net of related taxes or $.02 per share on both a basic and diluted basis). |
(b) | Operating income and net income attributable to shareholders include identifiable intangible asset amortization of $44.1 million ($36.0 million net of related taxes or $.36 per share on both a basic and diluted basis), restructuring, integration, and other charges of $39.8 million ($29.3 million net of related taxes or $.30 and $.29 per share on a basic and diluted basis, respectively), and a non-cash impairment charge associated with discontinuing the use of a trade name of $78.0 million ($47.9 million net of related taxes or $.49 and $.48 per share on a basic and diluted basis, respectively). Net income attributable to shareholders also includes a gain on sale of investment of $29.7 million ($18.3 million net of related taxes or $.19 and $.18 per share on a basic and diluted basis, respectively). |
(c) | Operating income and net income attributable to shareholders include identifiable intangible asset amortization of $36.8 million ($29.3 million net of related taxes or $.29 and $.28 per share on a basic and diluted basis, respectively), and restructuring, integration, and other charges of $92.7 million ($65.6 million net of related taxes or $.64 and $.63 per share on a basic and diluted basis, respectively). Net income attributable to shareholders also includes a loss on prepayment of debt of $4.3 million ($2.6 million net of related taxes or $.03 per share on both a basic and diluted basis), as well as an increase in the provision of income taxes of $20.8 million ($.20 per share on both a basic and diluted basis) and interest expense of $1.6 million ($1.2 million net of related taxes or $.01 per share on both a basic and diluted basis) relating to the settlement of certain international tax matters. |
(d) | Operating income and net income attributable to shareholders include identifiable intangible asset amortization of $36.5 million ($29.3 million net of related taxes or $.27 and $.26 per share on a basic and diluted basis, respectively), restructuring, integration, and other charges of $47.4 million ($30.7 million net of related taxes or $.28 per share on both a basic and diluted basis), and a gain of $79.2 million ($48.6 million net of related taxes or $.45 and $.44 per share on a basic and diluted basis, respectively) related to the settlement of a legal matter. |
(e) | Operating income and net income attributable to shareholders include identifiable intangible asset amortization of $35.4 million ($27.1 million net of related taxes or $.24 and $.23 per share on a basic and diluted basis, respectively), |
19
restructuring, integration, and other charges of $37.8 million ($28.1 million net of related taxes or $.25 and $.24 per share on a basic and diluted basis, respectively), and a charge of $5.9 million ($3.6 million net of related taxes or $.03 per share on both a basic and diluted basis) related to the settlement of a legal matter. Net income attributable to shareholders also includes a gain on bargain purchase of $1.1 million ($.7 million net of related taxes or $.01 per share on both a basic and diluted basis), a loss on prepayment of debt of $.9 million ($.5 million net of related taxes or $.01 per share on both a basic and diluted basis), and a net reduction in the provision for income taxes of $28.9 million ($.25 per share on both a basic and diluted basis) principally due to a reversal of a valuation allowance on certain deferred tax assets.
20
Item 7. Management's Discussion and Analysis of Financial Condition and Results of Operations.
Overview
The company is a global provider of products, services, and solutions to industrial and commercial users of electronic components and enterprise computing solutions. The company provides one of the broadest product offerings in the electronic components and enterprise computing solutions distribution industries and a wide range of value-added services to help customers introduce innovative products, reduce their time to market, and enhance their overall competitiveness. The company has two business segments, the global components business segment and the global ECS business segment. The company distributes electronic components to OEMs and CMs through its global components business segment and provides enterprise computing solutions to VARs through its global ECS business segment. For 2015, approximately 62% of the company's sales were from the global components business segment and approximately 38% of the company's sales were from the global ECS business segment.
The company's financial objectives are to grow sales faster than the market, increase the markets served, grow profits faster than sales, and increase return on invested capital. To achieve its objectives, the company seeks to capture significant opportunities to grow across products, markets, and geographies. To supplement its organic growth strategy, the company continually evaluates strategic acquisitions to broaden its product and value-added service offerings, increase its market penetration, and/or expand its geographic reach.
Executive Summary
Consolidated sales for 2015 increased by 2.3%, compared with the year-earlier period, due to a 0.6% increase in the global components business segment sales and a 5.0% increase in the global ECS business segment sales. The translation of the company's international financial statements into U.S. dollars resulted in a decrease in consolidated sales of 5.4% for 2015 compared with the year-earlier period, due to a stronger U.S. dollar. Adjusted for the change in foreign currencies and acquisitions, consolidated sales increased 2.9% compared with the year-earlier period.
Net income attributable to shareholders for 2015 of $497.7 million was relatively flat compared with net income attributable to shareholders of $498.0 million in the year-earlier period. The following items impacted the comparability of the company's results for the years ended December 31, 2015 and 2014:
• | restructuring, integration, and other charges of $68.8 million ($51.3 million net of related taxes) in 2015 and $39.8 million ($29.3 million net of related taxes) in 2014; |
• | identifiable intangible asset amortization of $51.0 million ($41.3 million net of related taxes) in 2015 and $44.1 million ($36.0 million net of related taxes) in 2014; |
• | a gain on sale of investment of $2.0 million ($1.7 million net of related taxes) in 2015 and $29.7 million ($18.3 million net of related taxes) in 2014; |
• | a loss on investment of $3.0 million ($1.8 million net of related taxes) in 2015; |
• | a loss on prepayment of debt of $2.9 million ($1.8 million net of related taxes) in 2015; and |
• | a non-cash impairment charge associated with discontinuing the use of a trade name of $78.0 million ($47.9 million net of related taxes) in 2014. |
Excluding the aforementioned items, net income attributable to shareholders for 2015 of $592.3 million was relatively flat compared with $593.0 million in the year-earlier period.
Certain Non-GAAP Financial Information
In addition to disclosing financial results that are determined in accordance with accounting principles generally accepted in the United States ("GAAP"), the company also discloses certain non-GAAP financial information, including:
• | Sales, income, or expense items as adjusted for the impact of changes in foreign currencies (referred to as "impact of changes in foreign currencies") and the impact of acquisitions by adjusting the company's prior periods to include the operating results of businesses acquired, including the amortization expense related to acquired intangible assets, as if the acquisitions had occurred at the beginning of the earliest period presented (referred to as "impact of acquisitions"); |
• | Operating income as adjusted to exclude identifiable intangible asset amortization, restructuring, integration, and other charges, and impairment charge; and |
• | Net income attributable to shareholders as adjusted to exclude identifiable intangible asset amortization, restructuring, integration, and other charges, impairment charge, gain on sale of investment, loss on investment, loss on prepayment of debt, and settlement of certain international tax matters. |
21
Management believes that providing this additional information is useful to the reader to better assess and understand the company's operating performance, especially when comparing results with previous periods, primarily because management typically monitors the business adjusted for these items in addition to GAAP results. However, analysis of results on a non-GAAP basis should be used as a complement to, and in conjunction with, data presented in accordance with GAAP.
Sales
Substantially all of the company's sales are made on an order-by-order basis, rather than through long-term sales contracts. As such, the nature of the company's business does not provide for the visibility of material forward-looking information from its customers and suppliers beyond a few months.
Following is an analysis of net sales by business segment for the years ended December 31 (in millions):
2015 | 2014 | % Change | ||||||||
Consolidated sales, as reported | $ | 23,282 | $ | 22,769 | 2.3 | % | ||||
Impact of changes in foreign currencies | — | (1,315 | ) | |||||||
Impact of acquisitions | 403 | 1,573 | ||||||||
Consolidated sales, as adjusted | $ | 23,685 | $ | 23,027 | 2.9 | % | ||||
Global components sales, as reported | $ | 14,406 | $ | 14,313 | 0.6 | % | ||||
Impact of changes in foreign currencies | — | (737 | ) | |||||||
Impact of acquisitions | 320 | 968 | ||||||||
Global components sales, as adjusted | $ | 14,726 | $ | 14,544 | 1.3 | % | ||||
Global ECS sales, as reported | $ | 8,876 | $ | 8,456 | 5.0 | % | ||||
Impact of changes in foreign currencies | — | (578 | ) | |||||||
Impact of acquisitions | 83 | 605 | ||||||||
Global ECS sales, as adjusted | $ | 8,959 | $ | 8,483 | 5.6 | % | ||||
Consolidated sales for 2015 increased by $513.3 million, or 2.3%, compared with the year-earlier period. The increase in 2015 was driven by an increase in global components business segment sales of $92.8 million, or 0.6%, and an increase in global ECS business segment sales of $420.6 million, or 5.0%, compared with the year-earlier period. Adjusted for the impact of changes in foreign currencies and acquisitions, the company's consolidated sales increased by 2.9% in 2015, compared with the year-earlier period. The translation of the company's international financial statements into U.S. dollars resulted in a decrease in consolidated sales of 5.4% for 2015 compared with the year-earlier period.
In the global components business segment, sales for 2015 increased 0.6%, compared with the year-earlier period primarily driven by increased demand in the EMEA regions and the impact of recently acquired businesses, offset in part, by the impact of changes in foreign currencies. Adjusted for the impact of changes in foreign currencies and acquisitions, the company's global components business segment sales increased by 1.3% in 2015, compared with the year-earlier period.
In the global ECS business segment, sales for 2015 increased 5.0% primarily driven by increased demand in the EMEA regions and the impact of recently acquired businesses, offset in part, by the impact of changes in foreign currencies. Adjusted for the impact of changes in foreign currencies and acquisitions, the company's global ECS business segment sales increased by 5.6% in 2015, compared with the year-earlier period.
22
Following is an analysis of net sales by business segment for the years ended December 31 (in millions):
2014 | 2013 | % Change | |||||||||
Consolidated sales, as reported | $ | 22,769 | $ | 21,357 | 6.6 | % | |||||
Impact of changes in foreign currencies | — | (79 | ) | ||||||||
Impact of acquisitions | 160 | 1,082 | |||||||||
Consolidated sales, as adjusted | $ | 22,929 | $ | 22,360 | 2.5 | % | |||||
Global components sales, as reported | $ | 14,313 | $ | 13,496 | 6.1 | % | |||||
Impact of changes in foreign currencies | — | (3 | ) | ||||||||
Impact of acquisitions | 79 | 320 | |||||||||
Global components sales, as adjusted | $ | 14,392 | $ | 13,813 | 4.2 | % | |||||
Global ECS sales, as reported | $ | 8,456 | $ | 7,862 | 7.6 | % | |||||
Impact of changes in foreign currencies | — | (76 | ) | ||||||||
Impact of acquisitions | 81 | 761 | |||||||||
Global ECS sales, as adjusted | $ | 8,537 | $ | 8,547 | flat | ||||||
Consolidated sales for 2014 increased by $1.41 billion, or 6.6%, compared with the year-earlier period. The increase in 2014 was driven by an increase in global components business segment sales of $817.3 million, or 6.1%, and an increase in global ECS business segment sales of $594.1 million, or 7.6%, compared with the year-earlier period. Adjusted for the impact of changes in foreign currencies and acquisitions, the company's consolidated sales increased by 2.5% in 2014, compared with the year-earlier period.
In the global components business segment, sales for 2014 increased 6.1% compared with the year-earlier period primarily due to an increase in demand for products worldwide and the impact of recently acquired businesses. Adjusted for the impact of changes in foreign currencies and acquisitions, the company's global components business segment sales increased by 4.2% in 2014, compared with the year-earlier period.
In the global ECS business segment, sales for 2014 increased 7.6% primarily driven by growth in software, services, storage and industry standard servers, offset, in part, by a decrease in demand for proprietary servers in the North America and EMEA regions. Adjusted for the impact of changes in foreign currencies and acquisitions, the company's global ECS business segment sales were flat in 2014, compared with the year-earlier period.
Gross Profit
Following is an analysis of gross profit for the years ended December 31 (in millions):
2015 | 2014 | Change | |||||||||
Consolidated gross profit, as reported | $ | 3,035 | $ | 2,996 | 1.3 | % | |||||
Impact of changes in foreign currencies | — | (203 | ) | ||||||||
Impact of acquisitions | 52 | 231 | |||||||||
Consolidated gross profit, as adjusted | $ | 3,087 | $ | 3,024 | 2.1 | % | |||||
Consolidated gross profit as a percentage of sales, as reported | 13.0 | % | 13.2 | % | (20 | ) | bps | ||||
Consolidated gross profit as a percentage of sales, as adjusted | 13.0 | % | 13.1 | % | (10 | ) | bps | ||||
The company recorded gross profit of $3.04 billion and $3.00 billion for 2015 and 2014, respectively. The increase in gross profit was primarily due to the aforementioned 2.3% increase in sales during 2015. Gross profit margins for 2015 decreased by approximately 20 basis points, compared with the year-earlier period primarily due to competitive pricing pressure in the ECS
23
business. Adjusted for the impact of changes in foreign currencies and acquisitions, the company's consolidated gross profit margin decreased approximately 10 basis points in 2015, compared with the year-earlier period.
Following is an analysis of gross profit for the years ended December 31 (in millions):
2014 | 2013 | Change | |||||||||
Consolidated gross profit, as reported | $ | 2,996 | $ | 2,791 | 7.3 | % | |||||
Impact of changes in foreign currencies | — | (10 | ) | ||||||||
Impact of acquisitions | 39 | 189 | |||||||||
Consolidated gross profit, as adjusted | $ | 3,035 | $ | 2,970 | 2.2 | % | |||||
Consolidated gross profit as a percentage of sales, as reported | 13.2 | % | 13.1 | % | 10 | bps | |||||
Consolidated gross profit as a percentage of sales, as adjusted | 13.2 | % | 13.3 | % | (10 | ) | bps | ||||
The company recorded gross profit of $3.00 billion and $2.79 billion for 2014 and 2013, respectively. Gross profit margins for 2014 increased by approximately 10 basis points, compared with the year-earlier period primarily due to a more favorable product mix in the global ECS business segment as compared with the year-earlier period, offset, in part, by competitive pricing pressure. Adjusted for the impact of changes in foreign currencies and acquisitions, the company's consolidated gross profit margin decreased approximately 10 basis points in 2014, compared with the year-earlier period.
Selling, General, and Administrative Expenses and Depreciation and Amortization
Following is an analysis of operating expenses for the years ended December 31 (in millions):
2015 | 2014 | % Change | |||||||||
Selling, general, and administrative expenses, as reported | $ | 1,986 | $ | 1,960 | 1.4 | % | |||||
Depreciation and amortization, as reported | 156 | 156 | flat | ||||||||
Operating expenses, as reported | 2,142 | 2,116 | 1.2 | % | |||||||
Impact of changes in foreign currencies | — | (155 | ) | ||||||||
Impact of acquisitions | 40 | 162 | |||||||||
Operating expenses, as adjusted* | $ | 2,182 | $ | 2,122 | 2.8 | % | |||||
Operating expenses as a percentage of sales, as reported | 9.2 | % | 9.3 | % | (10 | ) | bps | ||||
Operating expenses as a percentage of sales, as adjusted | 9.2 | % | 9.2 | % | — | bps | |||||
* The sum of the components for operating expenses, as adjusted may not agree to totals, as presented, due to rounding.
Selling, general, and administrative expenses increased by $26.5 million, or 1.4%, in 2015, on a sales increase of 2.3%, compared with the year-earlier period. Selling, general, and administrative expenses, as a percentage of sales, was 8.5% and 8.6% for 2015 and 2014, respectively.
Adjusted for the impact of changes in foreign currencies and acquisitions, operating expenses (which include both selling, general, and administrative expenses and depreciation and amortization expense) for 2015 increased 2.8%, on a sales increase, as adjusted, of 2.9%, due to the company's ability to efficiently manage operating costs.
24
Following is an analysis of operating expenses for the years ended December 31 (in millions):
2014 | 2013 | % Change | |||||||||
Selling, general, and administrative expenses, as reported | $ | 1,960 | $ | 1,874 | 4.6 | % | |||||
Depreciation and amortization, as reported | 156 | 131 | 19.0 | % | |||||||
Operating expenses, as reported | 2,116 | 2,005 | 5.5 | % | |||||||
Impact of changes in foreign currencies | — | (5 | ) | ||||||||
Impact of acquisitions | 24 | 157 | |||||||||
Operating expenses, as adjusted | $ | 2,140 | $ | 2,157 | (0.8 | )% | |||||
Operating expenses as a percentage of sales, as reported | 9.3 | % | 9.4 | % | (10 | ) | bps | ||||
Operating expenses as a percentage of sales, as adjusted | 9.3 | % | 9.6 | % | (30 | ) | bps | ||||
Selling, general, and administrative expenses increased $86.1 million, or 4.6%, in 2014, on a sales increase of 6.6%, compared with the year-earlier period. Selling, general, and administrative expenses, as a percentage of sales, was 8.6% and 8.8%, for 2014 and 2013, respectively.
Depreciation and amortization expense for 2014 increased by $24.9 million, or 19.0%, compared with the year-earlier period, primarily due to acquisitions and further implementation of the company's ERP initiative. Included in depreciation and amortization expense for 2014 and 2013 was $44.1 million ($36.0 million net of related taxes or $.36 per share on both a basic and diluted basis) and $36.8 million ($29.3 million net of related taxes or $.29 and $.28 per share on a basic and diluted basis, respectively), respectively, related to identifiable intangible asset amortization.
Adjusted for the impact of changes in foreign currencies and acquisitions, operating expenses (which include both selling, general, and administrative expenses and depreciation and amortization expense) for 2014 decreased 0.8%, on a sales increase, as adjusted, of 2.5%, due to the company's ability to efficiently manage operating costs.
Restructuring, Integration, and Other Charges
2015 Charges
In 2015, the company recorded restructuring, integration, and other charges of $68.8 million ($51.3 million net of related taxes or $.54 per share on both a basic and diluted basis). Included in the restructuring, integration, and other charges for 2015 is a restructuring and integration charge of $39.1 million related to initiatives taken by the company to improve operating efficiencies. Also included in the restructuring, integration, and other charges for 2015 is a charge of $4.1 million related to restructuring and integration actions taken in prior periods and acquisition-related expenses and other charges of $25.6 million.
The restructuring and integration charge of $39.1 million in 2015 includes personnel costs of $33.9 million, facilities costs of $4.2 million, and other costs of $1.0 million. These restructuring initiatives are due to the company's continued efforts to lower cost and drive operational efficiency. Integration costs are primarily related to the integration of acquired businesses within the company's pre-existing business and the consolidation of certain operations.
2014 Charges
In 2014, the company recorded restructuring, integration, and other charges of $39.8 million ($29.3 million net of related taxes or $.30 and $.29 per share on a basic and diluted basis, respectively). Included in the restructuring, integration, and other charges for 2014 is a restructuring and integration charge of $38.3 million related to initiatives taken by the company to improve operating efficiencies. Also included in the restructuring, integration, and other charges for 2014 is a charge of $1.1 million related to restructuring and integration actions taken in prior periods and acquisition-related expenses of $0.4 million.
The restructuring and integration charge of $38.3 million in 2014 includes personnel costs of $29.3 million, facilities costs of $5.6 million, and other costs of $3.5 million. These restructuring initiatives are due to the company's continued efforts to lower cost and drive operational efficiency. Integration costs are primarily related to the integration of acquired businesses within the company's pre-existing business and the consolidation of certain operations.
25
2013 Charges
In 2013, the company recorded restructuring, integration, and other charges of $92.7 million ($65.6 million net of related taxes or $.64 and $.63 per share on a basic and diluted basis, respectively). Included in the restructuring, integration, and other charges for 2013 is a restructuring and integration charge of $79.9 million related to initiatives taken by the company to improve operating efficiencies. Also included in the restructuring, integration, and other charges for 2013 is a charge of $0.8 million related to restructuring and integration actions taken in prior periods and acquisition-related expenses of $11.9 million.
The restructuring and integration charge of $79.9 million in 2013 includes personnel costs of $66.2 million, facilities costs of $12.6 million, and asset write-downs of $1.1 million. These restructuring initiatives are due to the company's continued efforts to lower cost and drive operational efficiency. Integration costs are primarily related to the integration of acquired businesses within the company's pre-existing business and the consolidation of certain operations.
As of December 31, 2015, the company does not anticipate there will be any material adjustments relating to the aforementioned restructuring plans. Refer to Note 9, "Restructuring, Integration, and Other Charges," of the Notes to the Consolidated Financial Statements for further discussion of the company's restructuring and integration activities.
Trade Name Impairment Charge
The company tests goodwill and other indefinite-lived intangible assets for impairment annually as of the first day of the fourth quarter, or more frequently if indicators of potential impairment exist. During the fourth quarter of 2014, in connection with the company's global re-branding initiative to brand certain of its businesses under the Arrow name, the company made the decision to discontinue the use of a trade name of one of its businesses within the global ECS business segment. As no future cash flows will be attributed to the impacted trade name, the entire book value was written-off, resulting in a non-cash impairment charge of $78.0 million ($47.9 million net of related taxes or $.49 and $.48 per share on a basic and diluted basis, respectively) as of December 31, 2014 in the company's consolidated statements of operations. Fair value was determined using unobservable (Level 3) inputs. The impairment charge did not impact the company’s consolidated cash flows, liquidity, capital resources, and covenants under its existing revolving credit facility, asset securitization program, and other outstanding borrowings. No impairment existed as of December 31, 2014 with respect to the company's other identifiable intangible assets.
Operating Income
Following is an analysis of operating income for the years ended December 31 (in millions):
2015 | 2014 | ||||||
Consolidated operating income, as reported | $ | 824 | $ | 762 | |||
Identifiable intangible asset amortization | 51 | 44 | |||||
Restructuring, integration, and other charges | 69 | 40 | |||||
Impairment charge | — | 78 | |||||
Consolidated operating income, as adjusted* | $ | 944 | $ | 924 | |||
Consolidated operating income as a percentage of sales, as reported | 3.5 | % | 3.3 | % | |||
Consolidated operating income, as adjusted, as a percentage of sales, as reported | 4.1 | % | 4.1 | % | |||
* The sum of the components for consolidated operating income, as adjusted may not agree to totals, as presented, due to rounding.
The company recorded operating income of $824.5 million, or 3.5% of sales, in 2015 compared with operating income of $762.3 million, or 3.3% of sales, in 2014. Included in operating income for 2015 and 2014 were the previously discussed identifiable intangible asset amortization of $51.0 million and $44.1 million, respectively, restructuring, integration, and other charges of $68.8 million and $39.8 million, respectively, and impairment charge of $78.0 million in 2014. Excluding these items operating income, as adjusted was $944.3 million, or 4.1% of sales, in 2015 compared with operating income, as adjusted of $924.2 million, or 4.1% of sales, in 2014.
26
Following is an analysis of operating income for the years ended December 31 (in millions):
2014 | 2013 | ||||||
Consolidated operating income, as reported | $ | 762 | $ | 694 | |||
Identifiable intangible asset amortization | 44 | 37 | |||||
Restructuring, integration, and other charges | 40 | 93 | |||||
Impairment charge | 78 | — | |||||
Consolidated operating income, as adjusted* | $ | 924 | $ | 823 | |||
Consolidated operating income as a percentage of sales, as reported | 3.3 | % | 3.2 | % | |||
Consolidated operating income, as adjusted, as a percentage of sales, as reported | 4.1 | % | 3.9 | % | |||
* The sum of the components for consolidated operating income, as adjusted may not agree to totals, as presented, due to rounding.
The company recorded operating income of $762.3 million, or 3.3% of sales, in 2014 compared with operating income of $693.5 million, or 3.2% of sales, in 2013. Included in operating income for 2014 and 2013 were the previously discussed identifiable intangible asset amortization of $44.1 million and $36.8 million, respectively, and restructuring, integration, and other charges of $39.8 million and $92.7 million, respectively, and impairment charge of $78.0 million. Excluding these items operating income, as adjusted was $924.2 million, or 4.1% of sales, in 2014 compared with operating income, as adjusted of $822.9 million, or 3.9% of sales, in 2013.
Gain on Sale of Investment
During 2015, the company recorded a gain on sale of investment of $2.0 million ($1.7 million net of related taxes or $.02 per share on both a basic and diluted basis).
During 2014, the company sold its 1.9% equity ownership interest in WPG Holdings Co., Ltd. for proceeds of $40.5 million and accordingly recorded a gain on sale of investment of $29.7 million ($18.3 million net of related taxes or $.19 and $.18 per share on a basic and diluted basis).
Loss on Prepayment of Debt
During 2015, the company recorded a loss on prepayment of debt of $2.9 million ($1.8 million net of related taxes or $.02 per share on both a basic and diluted basis), related to the redemption of $250.0 million principal amount of its 3.375% notes due November 2015.
During 2013, the company recorded a loss on prepayment of debt of $4.3 million ($2.6 million net of related taxes or $.03 per share on both a basic and diluted basis), related to the redemption of $332.1 million principal amount of its 6.875% senior notes due July 2013.
Interest and Other Financing Expense, Net
Net interest and other financing expense increased by 16.7% in 2015 to $135.4 million, compared with $116.0 million in 2014, primarily due to higher average debt outstanding that was used to refinance the company's 3.375% notes due November 1, 2015 before maturity and for general corporate purposes.
Net interest and other financing expense increased by 1.4% in 2014 to $116.0 million, relatively consistent compared with $114.4 million in 2013.
Income Taxes
The company recorded a provision for income taxes of $191.7 million (an effective tax rate of 27.7%) for 2015. The company's provision for income taxes and effective tax rate for 2015 were impacted by the previously discussed restructuring, integration, and other charges, loss on prepayment of debt, gain on sale of investment, and loss on investment. Excluding the impact of the aforementioned items, the company's effective tax rate for 2015 was 27.6%.
27
The company recorded a provision for income taxes of $184.9 million (an effective tax rate of 27.1%) for 2014. The company's provision for income taxes and effective tax rate for 2014 were impacted by the previously discussed restructuring, integration, and other charges, gain on sale of investment, and trade name impairment charge. Excluding the impact of the aforementioned items, the company's effective tax rate for 2014 was 27.8%.
The company recorded a provision for income taxes of $182.3 million (an effective tax rate of 31.3%) for 2013. During 2013 the company recorded an increase in the provision for income taxes of $20.8 million ($.20 per share on both a basic and diluted basis) relating to the settlement of certain international tax matters. The company's provision for income taxes and effective tax rate for 2013 were impacted by the previously discussed adjustment to tax reserves, restructuring, integration, and other charges, and loss on prepayment of debt. Excluding the impact of the aforementioned items, the company's effective tax rate for 2013 was 28.0%.
The company's provision for income taxes and effective tax rate are impacted by, among other factors, the statutory tax rates in the countries in which it operates and the related level of income generated by these operations.
Net Income Attributable to Shareholders
Following is an analysis of net income attributable to shareholders for the years ended December 31 (in millions):
2015 | 2014 | ||||||
Net income attributable to shareholders, as reported | $ | 498 | $ | 498 | |||
Identifiable intangible asset amortization | 41 | 36 | |||||
Restructuring, integration, and other charges | 51 | 29 | |||||
Impairment charge | — | 48 | |||||
Gain on sale of investment | (2 | ) | (18 | ) | |||
Loss on prepayment of debt | 2 | — | |||||
Loss on investment | 2 | — | |||||
Net income attributable to shareholders, as adjusted* | $ | 592 | $ | 593 | |||
* The sum of the components for net income attributable to shareholders, as adjusted may not agree to totals, as presented, due to rounding.
The company recorded net income attributable to shareholders of $497.7 million for 2015, compared with net income attributable to shareholders of $498.0 million in the year-earlier period. Net income attributable to shareholders, as adjusted was $592.3 million for 2015, compared with $593.0 million in the year-earlier period.
Following is an analysis of net income attributable to shareholders for the years ended December 31 (in millions):
2014 | 2013 | ||||||
Net income attributable to shareholders, as reported | $ | 498 | $ | 399 | |||
Identifiable intangible asset amortization | 36 | 29 | |||||
Restructuring, integration, and other charges | 29 | 66 | |||||
Impairment charge | 48 | — | |||||
Gain on sale of investment | (18 | ) | — | ||||
Loss on prepayment of debt | — | 3 | |||||
Settlement of international tax matters: | |||||||
Income taxes | — | 21 | |||||
Interest (net of taxes) | — | 1 | |||||
Net income attributable to shareholders, as adjusted* | $ | 593 | $ | 519 | |||
* The sum of the components for net income attributable to shareholders, as adjusted may not agree to totals, as presented, due to rounding.
The company recorded net income attributable to shareholders of $498.0 million for 2014, compared with net income attributable to shareholders of $399.4 million in the year-earlier period. Net income attributable to shareholders, as adjusted of $593.0 million
28
for 2014, increased compared with net income attributable to shareholders, as adjusted of $519.0 million in the year-earlier period primarily due to an increase in sales in the global components and global ECS segments, and the impact of recent acquisitions.
Liquidity and Capital Resources
At December 31, 2015 and 2014, the company had cash and cash equivalents of $273.1 million and $400.4 million, respectively, of which $232.6 million and $300.9 million, respectively, were held outside the United States. Liquidity is affected by many factors, some of which are based on normal ongoing operations of the company's business and some of which arise from fluctuations related to global economics and markets. Cash balances are generated and held in many locations throughout the world. It is the company's current intent to permanently reinvest these funds outside the United States and its current plans do not demonstrate a need to repatriate them to fund its United States operations. If these funds were to be needed for the company's operations in the United States it would be required to record and pay significant United States income taxes to repatriate these funds. Additionally, local government regulations may restrict the company's ability to move cash balances to meet cash needs under certain circumstances. The company currently does not expect such regulations and restrictions to impact its ability to make acquisitions or to pay vendors and conduct operations throughout the global organization.
During 2015, the net amount of cash provided by the company's operating activities was $655.1 million, the net amount of cash used for investing activities was $664.0 million, and the net amount of cash used for financing activities was $84.2 million. The effect of exchange rate changes on cash was a decrease of $34.1 million.
During 2014, the net amount of cash provided by the company's operating activities was $673.3 million, the net amount of cash used for investing activities was $244.8 million, and the net amount of cash used for financing activities was $434.9 million. The effect of exchange rate changes on cash was an increase of $16.2 million.
During 2013, the net amount of cash provided by the company's operating activities was $450.7 million, the net amount of cash used for investing activities was $487.1 million, and the net amount of cash used for financing activities was $26.6 million. The effect of exchange rate changes on cash was an increase of $43.9 million.
Cash Flows from Operating Activities
The company maintains a significant investment in accounts receivable and inventories. As a percentage of total assets, accounts receivable and inventories were approximately 66.3% at December 31, 2015 and were approximately 67.4% at December 31, 2014.
The net amount of cash provided by the company's operating activities during 2015 was $655.1 million and was primarily due to earnings from operations, adjusted for non-cash items, offset, in part, by an increase in net working capital to support the increase in sales.
The net amount of cash provided by the company's operating activities during 2014 was $673.3 million and was primarily due to earnings from operations, adjusted for non-cash items.
The net amount of cash provided by the company's operating activities during 2013 was $450.7 million and was primarily due to earnings from operations, adjusted for non-cash items, offset in part, by an increase in net working capital to support an increase in sales.
Working capital, as a percentage of sales, was 14.8%, 14.7%, and 16.1% in 2015, 2014, and 2013, respectively.
Cash Flows from Investing Activities
The net amount of cash used for investing activities during 2015 was $664.0 million, primarily reflecting $514.7 million of cash consideration paid, net of cash acquired, for acquired businesses, $154.8 million for capital expenditures, $3.5 million of proceeds from sale of facilities, and $2.0 million of proceeds from sale of investment. Included in capital expenditures for 2015 is $48.8 million related to the company's global ERP initiative.
During 2015, the company completed ten acquisitions, inclusive of a 53.7% acquisition of Data Modul AG. The aggregate consideration paid for these ten acquisitions was $514.7 million, net of cash acquired, contingent consideration and other amounts withheld.
29
The net amount of cash used for investing activities during 2014 was $244.8 million, primarily reflecting $162.9 million of cash consideration paid for acquired businesses, $122.5 million for capital expenditures, and $40.5 million of proceeds from sale of investment. Included in capital expenditures for 2014 is $57.0 million related to the company's global ERP initiative.
The net amount of cash used for investing activities during 2013 was $487.1 million, primarily reflecting $367.9 million of cash consideration paid for acquired businesses, $116.2 million for capital expenditures, and $3.0 million related to the purchase of a cost method investment. Included in capital expenditures for 2013 is $57.1 million related to the company's global ERP initiative.
During 2013, the company acquired ComputerLinks, a value-added distributor of enterprise computing solutions with a comprehensive offering of IT solutions from many of the world's leading technology suppliers for aggregate consideration of $292.2 million, net of cash acquired. During 2013 the company completed four additional acquisitions for aggregate consideration of $75.7 million, net of cash acquired and contingent consideration.
Cash Flows from Financing Activities
The net amount of cash used for financing activities during 2015 was $84.2 million. The uses of cash from financing activities included $356.4 million of repurchases of common stock, $46.6 million decrease in short-term and other borrowings, $254.3 million of redemption of notes, $128.0 million of net repayments of long-term bank borrowings, and $7.8 million of other acquisition related payments. The sources of cash from financing activities during 2015 were $688.2 million of net proceeds from a note offering and $20.8 million of proceeds from the exercise of stock options and other benefits related to stock-based compensation arrangements.
During 2015, the company completed the sale of $350.0 million principal amount of 3.50% notes due in 2022 and $350.0 million principal amount of 4.00% notes due in 2025. The net proceeds of the offering of $688.2 million were used to refinance the company's 3.375% notes due November 2015 and for general corporate purposes.
During 2015, the company redeemed $250.0 million principal amount of its 3.375% notes due November 2015. The related loss on the redemption for the year-ended December 31, 2015 aggregated $2.9 million ($1.8 million net of related taxes or $.02 per share on both a basic and diluted basis) and was recognized as a loss on prepayment of debt in the company's consolidated statements of operations.
The net amount of cash used for financing activities during 2014 was $434.9 million. The uses of cash from financing activities included $145.0 million of net repayments of long-term bank borrowings, $304.8 million of repurchases of common stock, a $12.5 million decrease in short-term and other borrowings, and other contingent consideration payments of $1.5 million. The source of cash from financing activities during 2014 was $28.9 million of proceeds from the exercise of stock options and other benefits related to stock-based compensation arrangements.
The net amount of cash used for financing activities during 2013 was $26.6 million. The uses of cash from financing activities included $338.2 million of redemption of senior notes, $362.8 million of repurchases of common stock, and a $31.3 million decrease in short-term and other borrowings. The sources of cash from financing activities during 2013 were $591.2 million of net proceeds from a note offering, $71.4 million of net proceeds of long-term bank borrowings, and $43.2 million of proceeds from the exercise of stock options and other benefits related to stock-based compensation arrangements.
During 2013, the company completed the sale of $300.0 million principal amount of its 3.00% notes due in 2018 and $300.0 million principal amount of its 4.50% notes due in 2023. The net proceeds of the offering of $591.2 million were used to refinance the company's 6.875% senior notes due July 2013 and for general corporate purposes.
During 2013, the company redeemed $332.1 million principal amount of its 6.875% senior notes due July 2013. The related loss on the redemption for the year ended December 31, 2013 aggregated $4.3 million ($2.6 million net of related taxes or $.03 per share on both a basic and diluted basis) and was recognized as a loss on prepayment of debt in the company's consolidated statements of operations.
The company has a $1.50 billion revolving credit facility, maturing in December 2018. This facility may be used by the company for general corporate purposes including working capital in the ordinary course of business, letters of credit, repayment, prepayment or purchase of long-term indebtedness and acquisitions, and as support for the company's commercial paper program, as applicable. Interest on borrowings under the revolving credit facility is calculated using a base rate or a euro currency rate plus a spread (1.30% at December 31, 2015), which is based on the company's credit ratings, for an effective interest rate of 1.58% at December 31, 2015. The facility fee is .20%. The company had $72.0 million in outstanding borrowings under the revolving credit facility at December 31, 2015. There were no outstanding borrowings under the revolving credit facility at December 31, 2014. During
30
the years ended December 31, 2015 and 2014, the average daily balance outstanding under the revolving credit facility was $381.0 million and $378.7 million, respectively.
The company has an asset securitization program collateralized by accounts receivable of certain of its subsidiaries. The company may borrow up to $900 million under the asset securitization program, which matures in March 2017. The asset securitization program is conducted through Arrow Electronics Funding Corporation ("AFC"), a wholly-owned, bankruptcy remote subsidiary. The asset securitization program does not qualify for sale treatment. Accordingly, the accounts receivable and related debt obligation remain on the company's consolidated balance sheets. Interest on borrowings is calculated using a base rate or a commercial paper rate plus a spread (.40% at December 31, 2015), which is based on the company's credit ratings, for an effective interest rate of .86% at December 31, 2015. The facility fee is .40%. The company had $75.0 million and $275.0 million in outstanding borrowings under the asset securitization program at December 31, 2015 and 2014, respectively. During the years ended December 31, 2015 and 2014, the average daily balance outstanding under the asset securitization program was $498.7 million and $488.2 million, respectively.
Both the revolving credit facility and asset securitization program include terms and conditions that limit the incurrence of additional borrowings and require that certain financial ratios be maintained at designated levels. The company was in compliance with all covenants as of December 31, 2015 and is currently not aware of any events that would cause non-compliance with any covenants in the future.
During 2014, the company entered into an agreement for an uncommitted line of credit. Under this agreement, the company may borrow up to a total of $100.0 million. There were no outstanding borrowings under the uncommitted line of credit at December 31, 2015 and 2014.
In the normal course of business certain of the company’s subsidiaries have agreements to sell, without recourse, selected trade receivables to financial institutions. The company does not retain financial or legal interests in these receivables, and accordingly they are accounted for as sales of the related receivables and the receivables are removed from the company’s consolidated balance sheets. Financing costs related to these transactions were not material and are included in "Interest and other financing expense, net" in the company’s consolidated statements of operations.
The company filed a shelf registration statement with the SEC in October 2015 registering debt securities, preferred stock, common stock, and warrants of Arrow Electronics, Inc. that may be issued by the company from time to time. As set forth in the shelf registration statement, the net proceeds from the sale of the offered securities may be used by the company for general corporate purposes, including repayment of borrowings, working capital, capital expenditures, acquisitions and stock repurchases, or for such other purposes as may be specified in the applicable prospectus supplement.
Management believes that the company's current cash availability, its current borrowing capacity under its revolving credit facility and asset securitization program, its expected ability to generate future operating cash flows, and the company's access to capital markets are sufficient to meet its projected cash flow needs for the foreseeable future. The company continually evaluates its liquidity requirements and would seek to amend its existing borrowing capacity or access the financial markets as deemed necessary.
Contractual Obligations
Payments due under contractual obligations at December 31, 2015 are as follows (in thousands):
Within 1 Year | 1-3 Years | 4-5 Years | After 5 Years | Total | |||||||||||||||
Debt | $ | 41,701 | $ | 646,119 | $ | 299,708 | $ | 1,432,279 | $ | 2,419,807 | |||||||||
Interest on long-term debt | 111,084 | 196,987 | 153,876 | 196,198 | 658,145 | ||||||||||||||
Capital leases | 2,323 | 1,999 | 410 | — | 4,732 | ||||||||||||||
Operating leases | 63,781 | 85,382 | 48,001 | 38,627 | 235,791 | ||||||||||||||
Purchase obligations (a) | 2,253,508 | 970,618 | 4,682 | 800 | 3,229,608 | ||||||||||||||
Other (b) | 21,318 | 1,360 | 5,800 | 14,100 | 42,578 | ||||||||||||||
$ | 2,493,715 | $ | 1,902,465 | $ | 512,477 | $ | 1,682,004 | $ | 6,590,661 | ||||||||||
(a) | Amounts represent an estimate of non-cancelable inventory purchase orders and other contractual obligations related to information technology and facilities as of December 31, 2015. Most of the company's inventory purchases are pursuant |
31
to authorized distributor agreements, which are typically cancelable by either party at any time or on short notice, usually within a few months.
(b) | Includes estimates of contributions required to meet the requirements of the Wyle defined benefit plan. Amounts are subject to change based upon the performance of plan assets, as well as the discount rate used to determine the obligation. The company does not anticipate having to make required contributions to the plans beyond 2025. Also included are amounts relating to personnel, facilities, and certain other costs resulting from restructuring and integration activities. |
Under the terms of various joint venture agreements, the company is required to pay its pro-rata share of the third party debt of the joint ventures in the event that the joint ventures are unable to meet their obligations. There were no outstanding borrowings under the third party agreements of the joint ventures as of December 31, 2015.
At December 31, 2015, the company had a liability for unrecognized tax benefits and a liability for the payment of related interest totaling $45.8 million, of which approximately $.5 million is expected to be paid within one year. For the remaining liability, due to the uncertainties related to these tax matters, the company is unable to make a reasonably reliable estimate when cash settlement with a taxing authority will occur.
Share-Repurchase Programs
During 2014, the company's Board of Directors (the "Board") approved the repurchase of up to $400 million ($200 million in May and December, respectively) of the company's common stock through a share-repurchase program. In September 2015, the company's Board approved an additional repurchase of up to $400 million of the company's common stock. As of December 31, 2015, the company repurchased 8,474,574 shares under these programs with a market value of $480.2 million at the dates of repurchase, of which 2,617,991 shares with a market value of $149.6 million were repurchased during the fourth quarter of 2015.
Off-Balance Sheet Arrangements
The company has no off-balance sheet financing or unconsolidated special purpose entities.
Critical Accounting Policies and Estimates
The company's consolidated financial statements are prepared in accordance with accounting principles generally accepted in the United States. The preparation of these financial statements requires the company to make significant estimates and judgments that affect the reported amounts of assets, liabilities, revenues, and expenses and the related disclosure of contingent assets and liabilities. The company evaluates its estimates on an ongoing basis. The company bases its estimates on historical experience and on various other assumptions that are believed reasonable under the circumstances; the results of which form the basis for making judgments about the carrying values of assets and liabilities that are not readily apparent from other sources. Actual results may differ from these estimates under different assumptions or conditions.
The company believes the following critical accounting policies involve the more significant judgments and estimates used in the preparation of its consolidated financial statements:
Revenue Recognition
The company recognizes revenue when there is persuasive evidence of an arrangement, delivery has occurred or services are rendered, the sales price is fixed or determinable, and collectibility is reasonably assured. Revenue typically is recognized at time of shipment. Sales are recorded net of discounts, rebates, and returns, which historically have not been material.
A portion of the company's business involves shipments directly from its suppliers to its customers. In these transactions, the company is responsible for negotiating price both with the supplier and customer, payment to the supplier, establishing payment terms with the customer, product returns, and has risk of loss if the customer does not make payment. As the principal with the customer, the company recognizes the sale and cost of sale of the product upon receiving notification from the supplier that the product was shipped.
The company has certain business with select customers and suppliers that is accounted for on an agency basis (that is, the company recognizes the fees associated with serving as an agent in sales with no associated cost of sales). Generally, these transactions relate to the sale of supplier service contracts to customers where the company has no future obligation to perform under these contracts or the rendering of logistics services for the delivery of inventory for which the company does not assume the risks and rewards of ownership.
32
Accounts Receivable
The company maintains allowances for doubtful accounts for estimated losses resulting from the inability of its customers to make required payments. The allowances for doubtful accounts are determined using a combination of factors, including the length of time the receivables are outstanding, the current business environment, and historical experience.
Inventories
Inventories are stated at the lower of cost or market. Write-downs of inventories to market value are based upon contractual provisions governing price protection, stock rotation, and obsolescence, as well as assumptions about future demand and market conditions. If assumptions about future demand change and/or actual market conditions are less favorable than those projected by the company, additional write-downs of inventories may be required. Due to the large number of transactions and the complexity of managing the process around price protections and stock rotations, estimates are made regarding adjustments to the book cost of inventories. Actual amounts could be different from those estimated.
Investments
The company accounts for available-for-sale investments at fair value, using quoted market prices, and the related holding gains and losses are included in "Accumulated other comprehensive income (loss)" in the shareholders' equity section in the company's consolidated balance sheets. The company assesses its long-term investments accounted for as available-for-sale on an ongoing basis to determine whether declines in market value below cost are other-than-temporary. When the decline is determined to be other-than-temporary, the cost basis for the individual security is reduced and a loss is realized in the company's consolidated statement of operations in the period in which it occurs. The company makes such determination after considering the length of time and the extent to which the market value of the investment is less than its cost, the financial condition and operating results of the investee, and the company's intent and ability to retain the investment over time to potentially allow for any recovery in market value. In addition, the company assesses the following factors:
• | broad economic factors impacting the investee's industry; |
• | publicly available forecasts for sales and earnings growth for the industry and investee; and |
• | the cyclical nature of the investee's industry. |
The company could incur an impairment charge in future periods if, among other factors, the investee's future earnings differ from currently available forecasts.
Income Taxes
The carrying value of the company's deferred tax assets is dependent upon the company's ability to generate sufficient future taxable income in certain tax jurisdictions. Should the company determine that it is more likely than not that some portion or all of its deferred tax assets will not be realized, a valuation allowance to the deferred tax assets would be established in the period such determination was made.
It is the company's policy to provide for uncertain tax positions and the related interest and penalties based upon management's assessment of whether a tax benefit is more likely than not to be sustained upon examination by tax authorities. At December 31, 2015, the company believes it has appropriately accounted for any unrecognized tax benefits. To the extent the company prevails in matters for which a liability for an unrecognized tax benefit is established or is required to pay amounts in excess of the liability, the company's effective tax rate in a given financial statement period may be affected.
Financial Instruments
The company uses various financial instruments, including derivative instruments, for purposes other than trading. Certain derivative instruments are designated at inception as hedges and measured for effectiveness both at inception and on an ongoing basis. Derivative instruments not designated as hedges are marked-to-market each reporting period with any unrealized gains or losses recognized in earnings.
The company occasionally enters into interest rate swap transactions that convert certain fixed-rate debt to variable-rate debt or variable-rate debt to fixed-rate debt in order to manage its targeted mix of fixed- and floating-rate debt. The company also occasionally enters into forward starting interest rate swaps to fix the rate on an anticipated future long term debt issuance. The company uses the hypothetical derivative method to assess the effectiveness of its interest rate swaps on a quarterly basis. The effective portion of the change in the fair value of interest rate swaps designated as fair value hedges is recorded as a change to
33
the carrying value of the related hedged debt, and the effective portion of the change in fair value of interest rate swaps designated as cash flow hedges is recorded in the shareholders' equity section in the company's consolidated balance sheets in "Accumulated other comprehensive income (loss)." The ineffective portion of the interest rate swaps, if any, is recorded in "Interest and other financing expense, net" in the company's consolidated statements of operations.
Contingencies and Litigation
The company is subject to proceedings, lawsuits, and other claims related to environmental, regulatory, labor, product, tax, and other matters and assesses the likelihood of an adverse judgment or outcome for these matters, as well as the range of potential losses. A determination of the reserves required, if any, is made after careful analysis. The reserves may change in the future due to new developments impacting the probability of a loss, the estimate of such loss, and the probability of recovery of such loss from third parties.
Stock-Based Compensation
The company records share-based payment awards exchanged for employee services at fair value on the date of grant and expenses the awards in the consolidated statements of operations over the requisite employee service period. Stock-based compensation expense includes an estimate for forfeitures. Stock-based compensation expense related to awards with a market or performance condition is generally recognized over the vesting period of the award utilizing the graded vesting method, while all other awards are recognized on a straight-line basis. The fair value of stock options is determined using the Black-Scholes valuation model and the assumptions shown in Note 12 of the Notes to the Consolidated Financial Statements. The assumptions used in calculating the fair value of share-based payment awards represent management's best estimates. The company's estimates may be impacted by certain variables including, but not limited to, stock price volatility, employee stock option exercise behaviors, additional stock option grants, estimates of forfeitures, the company's performance, and related tax impacts.
Costs in Excess of Net Assets of Companies Acquired
Goodwill represents the excess of the cost of an acquisition over the fair value of the net assets acquired. The company tests goodwill for impairment annually as of the first day of the fourth quarter and/or when an event occurs or circumstances change such that it is more likely than not that an impairment may exist. Examples of such events and circumstances that the company would consider include the following:
• | macroeconomic conditions such as deterioration in general economic conditions, limitations on accessing capital, fluctuations in foreign exchange rates, or other developments in equity and credit markets; |
• | industry and market considerations such as a deterioration in the environment in which the company operates, an increased competitive environment, a decline in market-dependent multiples or metrics (considered in both absolute terms and relative to peers), a change in the market for the company's products or services, or a regulatory or political development; |
• | cost factors such as increases in raw materials, labor, or other costs that have a negative effect on earnings and cash flows; |
• | overall financial performance such as negative or declining cash flows or a decline in actual or planned revenue or earnings compared with actual and projected results of relevant prior periods; |
• | other relevant entity-specific events such as changes in management, key personnel, strategy, or customers; contemplation of bankruptcy; or litigation; |
• | events affecting a reporting unit such as a change in the composition or carrying amount of its net assets, a more-likely-than-not expectation of selling or disposing all, or a portion, of a reporting unit, the testing for recoverability of a significant asset group within a reporting unit, or recognition of a goodwill impairment loss in the financial statements of a subsidiary that is a component of a reporting unit; and |
• | a sustained decrease in share price (considered in both absolute terms and relative to peers). |
Goodwill is tested at a level of reporting referred to as "the reporting unit." The company's reporting units are defined as each of the three regional businesses within the global components business segment, which are the Americas, EMEA, and Asia/Pacific and each of the two regional businesses within the global ECS business segment, which are North America and EMEA.
An entity has the option to first assess qualitative factors to determine whether the existence of events or circumstances leads to a determination that it is more likely than not (that is, a likelihood of more than 50%) that the fair value of a reporting unit is less than its carrying amount. If, after assessing the totality of events or circumstances, an entity determines it is not more likely than not that the fair value of a reporting unit is less than its carrying amount, then performing the two-step impairment test is unnecessary. The company has elected not to perform the qualitative assessment and began its impairment testing with the first step of the two-step impairment process. The first step, used to identify potential impairment, compares the calculated fair value of a reporting unit with its carrying amount. If the carrying amount of the reporting unit is less than its fair value, no impairment exists and the
34
second step is not performed. If the carrying amount of a reporting unit exceeds its fair value, the entity is required to perform the second step of the goodwill impairment test to measure the amount of the impairment loss, if any. The second step of the goodwill impairment test compares the implied fair value of the reporting unit goodwill with the carrying amount of that goodwill. If the carrying amount of the reporting unit goodwill exceeds the implied fair value of that goodwill, an impairment loss is recognized for the excess.
The company estimates the fair value of a reporting unit using the income approach. For the purposes of the income approach, fair value is determined based on the present value of estimated future cash flows, discounted at an appropriate risk-adjusted rate. The assumptions included in the income approach include forecasted revenues, gross profit margins, operating income margins, working capital cash flow, forecasted capital expenditures, perpetual growth rates, and long-term discount rates, among others, all of which require significant judgments by management. Actual results may differ from those assumed in the company's forecasts. The company also reconciles its discounted cash flow analysis to its current market capitalization allowing for a reasonable control premium. As of the first day of the fourth quarters of 2015, 2014, and 2013, the company's annual impairment testing did not indicate impairment at any of the company's reporting units.
A decline in general economic conditions or global equity valuations could impact the judgments and assumptions about the fair value of the company's businesses, and the company could be required to record an impairment charge in the future, which could impact the company's consolidated balance sheet, as well as the company's consolidated statement of operations. If the company was required to recognize an impairment charge in the future, the charge would not impact the company's consolidated cash flows, current liquidity, capital resources, and covenants under its existing revolving credit facility, asset securitization program, and other outstanding borrowings.
As of December 31, 2015, the company has $2.37 billion of goodwill, of which approximately $1.10 billion, $70.0 million and $60.7 million was allocated to the Americas, EMEA, and Asia/Pacific reporting units within the global components business segment, respectively and $760.9 million and $377.1 million was allocated to the North America and EMEA reporting units within the global ECS business segment, respectively. As of the date of the company's latest impairment test, the fair value of the Americas, EMEA, and Asia/Pacific reporting units within the global components business segment and the fair value of the North America and EMEA reporting units within the global ECS business segment exceeded their carrying values by approximately 20%, 187%, 26%, 338%, and 177%, respectively.
Impairment of Long-Lived Assets
The company reviews long-lived assets, including property, plant, and equipment and identifiable intangible assets, for impairment whenever changes in circumstances or events may indicate that the carrying amounts are not recoverable. The company also tests indefinite-lived intangible assets, consisting of acquired trade names, for impairment at least annually as of the first day of the fourth quarter. If the fair value is less than the carrying amount of the asset, a loss is recognized for the difference.
Factors which may cause an impairment of long-lived assets include significant changes in the manner of use of these assets, negative industry or market trends, a significant underperformance relative to historical or projected future operating results, or a likely sale or disposal of the asset before the end of its estimated useful life. If any of these factors exist, the company is required to test the long-lived asset for recoverability and may be required to recognize an impairment charge for all or a portion of the asset's carrying value.
During the fourth quarter of 2014, in connection with the company's global re-branding initiative to brand certain of its businesses under the Arrow name, the company made the decision to discontinue the use of a trade name of one of its businesses within the global ECS business segment. As no future cash flows will be attributed to the impacted trade name, the entire book value was written-off, resulting in a non-cash impairment charge of $78.0 million ($47.9 million net of related taxes or $.49 and $.48 per share on a basic and diluted basis, respectively) as of December 31, 2014 in the company's consolidated statements of operations. Fair value was determined using unobservable (Level 3) inputs. The impairment charge did not impact the company’s consolidated cash flows, liquidity, capital resources, and covenants under its existing revolving credit facility, asset securitization program, and other outstanding borrowings. No impairment existed as of December 31, 2014 with respect to the company's other identifiable intangible assets.
Impact of Recently Issued Accounting Standards
In January 2016, the Financial Accounting Standards Board (“FASB”) issued Accounting Standards Update No. 2016-01, Financial Instruments - Recognition and Measurement of Financial Assets and Financial Liabilities (Topic 825) ("ASU No. 2016-01"). ASU No. 2016-01 revises the classification and measurement of investments in certain equity investments and the presentation of certain fair value changes for certain financial liabilities measured at fair value. ASU No. 2016-01 requires the change in fair value of
35
many equity investments to be recognized in net income. ASU No. 2016-01 is effective for interim and annual periods beginning after December 15, 2017, with early adoption permitted. Adopting ASU No. 2016-01 may result in a cumulative effect adjustment to the consolidated statement of equity retained earnings as of the beginning of the year of adoption. The company is currently evaluating the potential effects of adopting the provisions of ASU No. 2016-01.
In November 2015, the FASB issued Accounting Standards Update No. 2015-17, Income Taxes - Balance Sheet Classification of Deferred Taxes (Topic 740) ("ASU No. 2015-17"). ASU No. 2015-17 requires deferred tax liabilities and assets to be classified as noncurrent in the consolidated balance sheet. ASU No. 2015-17 is effective for interim and annual periods beginning after December 15, 2016, with early adoption permitted. ASU No. 2015-17 may be applied either prospectively to all deferred tax liabilities and assets or retrospectively to all periods presented. The adoption of the provisions of ASU No. 2015-17 is not expected to have a material impact on the company's financial position or results of operations.
In September 2015, the FASB issued Accounting Standards Update No. 2015-16, Business Combinations - Simplifying the Accounting for Measurement-Period Adjustments (Topic 805) ("ASU No. 2015-16"). ASU No. 2015-16 requires that an acquirer recognize adjustments to provisional amounts that are identified during the measurement period in the reporting period in which the adjustment amounts are determined. ASU No. 2015-16 is effective for interim and annual periods beginning after December 15, 2015, with early adoption permitted, and is to be applied on a prospective basis. Effective June 28, 2015, the company adopted the provisions of ASU No. 2015-16. The adoption of the provisions of ASU No. 2015-16 did not materially impact the company's consolidated financial position or results of operations.
In July 2015, the FASB issued Accounting Standards Update No. 2015-11, Inventory - Simplifying the Measurement of Inventory (Topic 330) ("ASU No. 2015-11"). ASU No. 2015-11 requires an entity to measure inventory within the scope of the update at the lower of cost and net realizable value, and defines net realizable value as the estimated selling prices in the ordinary course of business, less reasonably predictable costs of completion, disposal, and transportation. ASU No. 2015-11 is effective for interim and annual periods beginning after December 15, 2016, with early adoption permitted, and is to be applied on a prospective basis. The adoption of the provisions of ASU No. 2015-17 is not expected to have a material impact on the company's financial position or results of operations.
In April 2015, the FASB issued Accounting Standards Update No. 2015-03, Interest - Imputation of Interest (Subtopic 835-30) ("ASU No. 2015-03"). ASU No. 2015-03 requires that debt issuance costs related to a recognized debt liability be presented in the balance sheet as a direct deduction from the carrying amount of the corresponding debt liability. In August 2015, the FASB issued Accounting Standards Update No. 2015-15, Interest - Imputation of Interest: Presentation and Subsequent Measurement of Debt Issuance Costs Associated with Line-of-Credit Arrangements (Subtopic 835-30) ("ASU No. 2015-15"). ASU No. 2015-15 provides additional guidance on the presentation and subsequent measurement of debt issuance costs associated with line-of-credit arrangements. ASU No. 2015-03 and ASU No. 2015-15 are effective for interim and annual periods beginning after December 15, 2015, with early adoption permitted, and is to be applied on a retrospective basis. Effective January 1, 2015 and June 28, 2015, the company adopted the provisions of ASU No. 2015-03 and ASU No. 2015-15, respectively. The adoption of the provisions of ASU No. 2015-03 and ASU No. 2015-15 did not materially impact the company's consolidated financial position or results of operations. Prior period amounts were reclassified to conform to the current period presentation.
In May 2014, the FASB issued Accounting Standards Update No. 2014-09, Revenue from Contracts with Customers (Topic 606) ("ASU No. 2014-09"). ASU No. 2014-09 supersedes the revenue recognition requirements in Topic 605, Revenue Recognition, and most industry-specific guidance throughout the Industry Topics of the Codification. Additionally, ASU No. 2014-09 supersedes some cost guidance included in Subtopic 605-35, Revenue Recognition-Construction-Type and Production-Type Contracts. Under ASU No. 2014-09, an entity should recognize revenue when it transfers promised goods or services to customers in an amount that reflects the consideration to which the entity expects to be entitled in exchange for those goods or services. ASU No. 2014-09 also requires additional disclosure about the nature, amount, timing, and uncertainty of revenue and cash flows arising from customer contracts. This includes significant judgments and changes in judgments and assets recognized from costs incurred to obtain or fulfill a contract. ASU No. 2014-09 is effective for interim and annual periods beginning after December 15, 2017, with early application permitted for interim and annual periods beginning after December 15, 2016. ASU No. 2014-09 allows for either full retrospective or modified retrospective adoption. The company is evaluating the transition method that will be elected and the potential effects of adopting the provisions of ASU No. 2014-09.
36
Information Relating to Forward-Looking Statements
This report includes forward-looking statements that are subject to numerous assumptions, risks, and uncertainties, which could cause actual results or facts to differ materially from such statements for a variety of reasons, including, but not limited to: industry conditions, the company's implementation of its new enterprise resource planning system, changes in product supply, pricing and customer demand, competition, other vagaries in the global components and global ECS markets, changes in relationships with key suppliers, increased profit margin pressure, the effects of additional actions taken to become more efficient or lower costs, risks related to the integration of acquired businesses, changes in legal and regulatory matters, and the company’s ability to generate additional cash flow. Forward-looking statements are those statements which are not statements of historical fact. These forward-looking statements can be identified by forward-looking words such as "expects," "anticipates," "intends," "plans," "may," "will," "believes," "seeks," "estimates," and similar expressions. Shareholders and other readers are cautioned not to place undue reliance on these forward-looking statements, which speak only as of the date on which they are made. The company undertakes no obligation to update publicly or revise any of the forward-looking statements.
37
Item 7A. Quantitative and Qualitative Disclosures About Market Risk.
The company is exposed to market risk from changes in foreign currency exchange rates and interest rates.
Foreign Currency Exchange Rate Risk
The company, as a large global organization, faces exposure to adverse movements in foreign currency exchange rates. These exposures may change over time as business practices evolve and could materially impact the company's financial results in the future. The company's primary exposure relates to transactions in which the currency collected from customers is different from the currency utilized to purchase the product sold in Europe, the Asia Pacific region, Canada, and Latin America. The company's policy is to hedge substantially all such currency exposures for which natural hedges do not exist. Natural hedges exist when purchases and sales within a specific country are both denominated in the same currency and, therefore, no exposure exists to hedge with foreign exchange forward, option, or swap contracts (collectively, the "foreign exchange contracts"). In many regions in Asia, for example, sales and purchases are primarily denominated in U.S. dollars, resulting in a "natural hedge." Natural hedges exist in most countries in which the company operates, although the percentage of natural offsets, as compared with offsets that need to be hedged by foreign exchange contracts, will vary from country to country. The company does not enter into foreign exchange contracts for trading purposes. The risk of loss on a foreign exchange contract is the risk of nonperformance by the counterparties, which the company minimizes by limiting its counterparties to major financial institutions. The fair values of the foreign exchange contracts, which are nominal, are estimated using market quotes. The notional amount of the foreign exchange contracts at December 31, 2015 and 2014 was $382.0 million and $401.0 million, respectively.
The translation of the financial statements of the non-United States operations is impacted by fluctuations in foreign currency exchange rates. The change in consolidated sales and operating income was impacted by the translation of the company's international financial statements into U.S. dollars. This resulted in decreased sales and operating income of $1.2 billion and $41.8 million, respectively, for 2015, compared with the year-earlier period, based on 2014 sales and operating income at the average rate for 2015. Sales and operating income would decrease by approximately $680.3 million and $30.2 million, respectively, if average foreign exchange rates had declined by 10% against the U.S. dollar in 2015. These amounts were determined by considering the impact of a hypothetical foreign exchange rate on the sales and operating income of the company's international operations.
Interest Rate Risk
The company's interest expense, in part, is sensitive to the general level of interest rates in North America, Europe, and the Asia Pacific region. The company historically has managed its exposure to interest rate risk through the proportion of fixed-rate and floating-rate debt in its total debt portfolio. Additionally, the company utilizes interest rate swaps in order to manage its targeted mix of fixed- and floating-rate debt.
At December 31, 2015, approximately 88% of the company's debt was subject to fixed rates, and 12% of its debt was subject to floating rates. A one percentage point change in average interest rates would not materially impact net interest and other financing expense in 2015. This was determined by considering the impact of a hypothetical interest rate on the company's average floating rate on investments and outstanding debt. This analysis does not consider the effect of the level of overall economic activity that could exist. In the event of a change in the level of economic activity, which may adversely impact interest rates, the company could likely take actions to further mitigate any potential negative exposure to the change. However, due to the uncertainty of the specific actions that might be taken and their possible effects, the sensitivity analysis assumes no changes in the company's financial structure.
In January 2015, the company entered into four seven-year forward-starting interest rate swaps (the "2015 swaps") which locked in an average treasury rate of 1.98% on a total aggregate notional amount of $200.0 million. These 2015 swaps were designated as cash flow hedges and managed the risk associated with changes in treasury rates and the impact of future interest payments on the anticipated debt issuances to replace the company's 3.375% notes due to mature in November 2015. In February 2015, the company received $.9 million in connection with the termination of the 2015 swaps upon issuance of the seven-year notes due in 2022. The fair value of the 2015 swaps is recorded in the shareholders' equity section in the company's consolidated balance sheets in "Accumulated other comprehensive income (loss)" and is being reclassified into income over the seven-year term of the notes due in 2022. For the year ended December 31, 2015, the company reclassified into income $.1 million relating to the 2015 swaps.
In April 2014, the company entered into an interest rate swap, with a notional amount of $50.0 million. This swap modifies the company's interest rate exposure by effectively converting a portion of the fixed 6.00% notes to a floating rate, based on the six-month U.S. dollar LIBOR plus a spread (an effective interest rate of 4.43% at December 31, 2015), through its maturity. The swap is classified as a fair value hedge and had a fair value of $.6 million at December 31, 2015.
38
In April 2014, the company entered into an interest rate swap, with a notional amount of $50.0 million. This swap modifies the company's interest rate exposure by effectively converting a portion of the fixed 6.875% senior debentures to a floating rate, based on the six-month U.S. dollar LIBOR plus a spread (an effective interest rate of 5.96% at December 31, 2015), through its maturity. The swap is classified as a fair value hedge and had a fair value of less than $.1 million at December 31, 2015.
In September 2011, the company entered into a ten-year forward-starting interest rate swap (the "2011 swap") which locked in a treasury rate of 2.63% on an aggregate notional amount of $175.0 million. This swap managed the risk associated with changes in treasury rates and the impact of future interest payments. The 2011 swap related to the interest payments for anticipated debt issuances to replace the company's 6.875% senior notes due to mature in July 2013. The 2011 swap is classified as a cash flow hedge. During 2013, the company paid $7.7 million to terminate the 2011 swap upon issuance of the ten-year notes due in 2023. The fair value of the 2011 swap is recorded in the shareholders' equity section in the company's consolidated balance sheets in "Accumulated other comprehensive income (loss)" and is being reclassified into income over the ten-year term of the notes due in 2023. For the 2011 swap, the company reclassified into income $(.7) million, $(.7) million, and $(0.2) million in 2015, 2014 and 2013, respectively.
In December 2010, the company entered into interest rate swaps, with an aggregate notional amount of $250.0 million. The swaps modified the company's interest rate exposure by effectively converting the fixed 3.375% notes due in November 2015 to a floating rate, based on the three-month U.S. dollar LIBOR plus a spread, through its maturity. In September 2011, these interest rate swap agreements were terminated for proceeds of $11.9 million, net of accrued interest. The proceeds of the swap terminations, less accrued interest, were reflected as a premium to the underlying debt and were being amortized as a reduction to interest expense over the remaining term of the underlying debt. In March 2015, the unamortized premium was included in the loss on prepayment of debt recorded as a result of the redemption of the 3.375% notes due November 2015.
In June 2004 and November 2009, the company entered into interest rate swaps, with an aggregate notional amount of $275.0 million. The swaps modified the company's interest rate exposure by effectively converting a portion of the fixed 6.875% senior notes due in July 2013 to a floating rate, based on the six-month U.S. dollar LIBOR plus a spread, through its maturity. In September 2011, these interest rate swap agreements were terminated for proceeds of $12.2 million, net of accrued interest. The proceeds of the swap terminations, less accrued interest, were reflected as a premium to the underlying debt and were amortized as a reduction to interest expense over the term of the underlying debt.
39
Item 8. Financial Statements and Supplementary Data.
REPORT OF INDEPENDENT REGISTERED PUBLIC ACCOUNTING FIRM
The Board of Directors and Shareholders
Arrow Electronics, Inc.
We have audited the accompanying consolidated balance sheets of Arrow Electronics, Inc. and subsidiaries (the “company”) as of December 31, 2015 and 2014, and the related consolidated statements of operations, comprehensive income, equity and cash flows for each of the three years in the period ended December 31, 2015. Our audits also included the financial statement schedule listed in the Index at Item 15(a). These financial statements and schedule are the responsibility of the company's management. Our responsibility is to express an opinion on these financial statements and schedule based on our audits.
We conducted our audits in accordance with the standards of the Public Company Accounting Oversight Board (United States). Those standards require that we plan and perform the audit to obtain reasonable assurance about whether the financial statements are free of material misstatement. An audit includes examining, on a test basis, evidence supporting the amounts and disclosures in the financial statements. An audit also includes assessing the accounting principles used and significant estimates made by management, as well as evaluating the overall financial statement presentation. We believe that our audits provide a reasonable basis for our opinion.
In our opinion, the financial statements referred to above present fairly, in all material respects, the consolidated financial position of Arrow Electronics, Inc. and subsidiaries at December 31, 2015 and 2014, and the consolidated results of its operations and its cash flows for each of the three years in the period ended December 31, 2015, in conformity with U.S. generally accepted accounting principles. Also, in our opinion, the related financial statement schedule, when considered in relation to the basic financial statements taken as a whole, presents fairly in all material respects the information set forth therein.
We also have audited, in accordance with the standards of the Public Company Accounting Oversight Board (United States), Arrow Electronics, Inc.’s internal control over financial reporting as of December 31, 2015, based on criteria established in Internal Control-Integrated Framework issued by the Committee of Sponsoring Organizations of the Treadway Commission (2013 framework) and our report dated February 5, 2016 expressed an adverse opinion thereon.
/s/ ERNST & YOUNG LLP
New York, New York
February 5, 2016
40
ARROW ELECTRONICS, INC.
CONSOLIDATED STATEMENTS OF OPERATIONS
(In thousands except per share data)
Years Ended December 31, | ||||||||||||
2015 | 2014 | 2013 | ||||||||||
Sales | $ | 23,282,020 | $ | 22,768,674 | $ | 21,357,285 | ||||||
Costs and expenses: | ||||||||||||
Cost of sales | 20,246,770 | 19,772,779 | 18,566,356 | |||||||||
Selling, general, and administrative expenses | 1,986,249 | 1,959,749 | 1,873,638 | |||||||||
Depreciation and amortization | 155,754 | 156,048 | 131,141 | |||||||||
Restructuring, integration, and other charges | 68,765 | 39,841 | 92,650 | |||||||||
Trade name impairment charge | — | 78,000 | — | |||||||||
22,457,538 | 22,006,417 | 20,663,785 | ||||||||||
Operating income | 824,482 | 762,257 | 693,500 | |||||||||
Equity in earnings of affiliated companies | 7,037 | 7,318 | 7,429 | |||||||||
Gain on sale of investment | 2,008 | 29,743 | — | |||||||||
Loss on prepayment of debt | 2,943 | — | 4,277 | |||||||||
Interest and other financing expense, net | 135,401 | 115,985 | 114,433 | |||||||||
Other expense | 3,000 | — | — | |||||||||
Income before income taxes | 692,183 | 683,333 | 582,219 | |||||||||
Provision for income taxes | 191,697 | 184,943 | 182,343 | |||||||||
Consolidated net income | 500,486 | 498,390 | 399,876 | |||||||||
Noncontrolling interests | 2,760 | 345 | 456 | |||||||||
Net income attributable to shareholders | $ | 497,726 | $ | 498,045 | $ | 399,420 | ||||||
Net income per share: | ||||||||||||
Basic | $ | 5.26 | $ | 5.05 | $ | 3.89 | ||||||
Diluted | $ | 5.20 | $ | 4.98 | $ | 3.85 | ||||||
Weighted-average shares outstanding: | ||||||||||||
Basic | 94,608 | 98,675 | 102,559 | |||||||||
Diluted | 95,686 | 99,947 | 103,699 | |||||||||
See accompanying notes.
41
ARROW ELECTRONICS, INC.
CONSOLIDATED STATEMENTS OF COMPREHENSIVE INCOME
(In thousands)
Years Ended December 31, | |||||||||||
2015 | 2014 | 2013 | |||||||||
Consolidated net income | $ | 500,486 | $ | 498,390 | $ | 399,876 | |||||
Other comprehensive income: | |||||||||||
Foreign currency translation adjustment | (223,268 | ) | (265,030 | ) | 65,793 | ||||||
Unrealized gain (loss) on investment securities, net | 814 | (12,925 | ) | 1,027 | |||||||
Unrealized gain on interest rate swaps designated as cash flow hedges, net | 871 | 403 | 2,075 | ||||||||
Employee benefit plan items, net | 2,947 | (12,617 | ) | 11,520 | |||||||
Other comprehensive income (loss) | (218,636 | ) | (290,169 | ) | 80,415 | ||||||
Comprehensive income | 281,850 | 208,221 | 480,291 | ||||||||
Less: Comprehensive income attributable to noncontrolling interests | 4,213 | 345 | 456 | ||||||||
Comprehensive income attributable to shareholders | $ | 277,637 | $ | 207,876 | $ | 479,835 | |||||
See accompanying notes.
42
ARROW ELECTRONICS, INC.
CONSOLIDATED BALANCE SHEETS
(In thousands except par value)
December 31, | ||||||||
2015 | 2014 | |||||||
ASSETS | ||||||||
Current assets: | ||||||||
Cash and cash equivalents | $ | 273,090 | $ | 400,355 | ||||
Accounts receivable, net | 6,161,418 | 6,043,850 | ||||||
Inventories | 2,466,490 | 2,335,257 | ||||||
Other current assets | 285,473 | 253,145 | ||||||
Total current assets | 9,186,471 | 9,032,607 | ||||||
Property, plant, and equipment, at cost: | ||||||||
Land | 23,547 | 23,770 | ||||||
Buildings and improvements | 162,011 | 144,530 | ||||||
Machinery and equipment | 1,250,115 | 1,146,045 | ||||||
1,435,673 | 1,314,345 | |||||||
Less: Accumulated depreciation and amortization | (735,495 | ) | (678,046 | ) | ||||
Property, plant, and equipment, net | 700,178 | 636,299 | ||||||
Investments in affiliated companies | 73,376 | 69,124 | ||||||
Intangible assets, net | 389,326 | 335,711 | ||||||
Cost in excess of net assets of companies acquired | 2,368,832 | 2,069,209 | ||||||
Other assets | 303,747 | 292,351 | ||||||
Total assets | $ | 13,021,930 | $ | 12,435,301 | ||||
LIABILITIES AND EQUITY | ||||||||
Current liabilities: | ||||||||
Accounts payable | $ | 5,192,665 | $ | 5,027,103 | ||||
Accrued expenses | 819,463 | 797,464 | ||||||
Short-term borrowings, including current portion of long-term debt | 44,024 | 13,454 | ||||||
Total current liabilities | 6,056,152 | 5,838,021 | ||||||
Long-term debt | 2,380,575 | 2,067,898 | ||||||
Other liabilities | 390,392 | 370,471 | ||||||
Commitments and Contingencies (Note 14 and 15) | ||||||||
Equity: | ||||||||
Shareholders' equity: | ||||||||
Common stock, par value $1: | ||||||||
Authorized - 160,000 shares in both 2015 and 2014 | ||||||||
Issued - 125,424 shares in both 2015 and 2014 | 125,424 | 125,424 | ||||||
Capital in excess of par value | 1,107,314 | 1,086,082 | ||||||
Treasury stock (34,501 and 29,529 shares in 2015 and 2014, respectively), at cost | (1,480,069 | ) | (1,169,673 | ) | ||||
Retained earnings | 4,674,480 | 4,176,754 | ||||||
Accumulated other comprehensive loss | (284,706 | ) | (64,617 | ) | ||||
Total shareholders' equity | 4,142,443 | 4,153,970 | ||||||
Noncontrolling interests | 52,368 | 4,941 | ||||||
Total equity | 4,194,811 | 4,158,911 | ||||||
Total liabilities and equity | $ | 13,021,930 | $ | 12,435,301 | ||||
See accompanying notes.
43
ARROW ELECTRONICS, INC.
CONSOLIDATED STATEMENTS OF CASH FLOWS
(In thousands)
Years Ended December 31, | ||||||||||||
2015 | 2014 | 2013 | ||||||||||
Cash flows from operating activities: | ||||||||||||
Consolidated net income | $ | 500,486 | $ | 498,390 | $ | 399,876 | ||||||
Adjustments to reconcile consolidated net income to net cash provided by operations: | ||||||||||||
Depreciation and amortization | 155,754 | 156,048 | 131,141 | |||||||||
Amortization of stock-based compensation | 47,274 | 41,930 | 36,923 | |||||||||
Equity in earnings of affiliated companies | (7,037 | ) | (7,318 | ) | (7,429 | ) | ||||||
Deferred income taxes | 5,833 | (25,744 | ) | 273 | ||||||||
Restructuring, integration, and other charges | 51,305 | 29,324 | 65,601 | |||||||||
Trade name impairment charge | — | 78,000 | — | |||||||||
Gain on sale of investment | (2,008 | ) | (18,269 | ) | — | |||||||
Excess tax benefits from stock-based compensation arrangements | (5,911 | ) | (7,129 | ) | (7,172 | ) | ||||||
Other | 10,894 | 2,686 | 3,534 | |||||||||
Change in assets and liabilities, net of effects of acquired businesses: | ||||||||||||
Accounts receivable | (68,990 | ) | (521,613 | ) | (572,886 | ) | ||||||
Inventories | (42,790 | ) | (210,789 | ) | (21,277 | ) | ||||||
Accounts payable | 33,398 | 628,697 | 446,814 | |||||||||
Accrued expenses | 4,834 | 12,396 | (123,969 | ) | ||||||||
Other assets and liabilities | (27,963 | ) | 16,692 | 99,262 | ||||||||
Net cash provided by operating activities | 655,079 | 673,301 | 450,691 | |||||||||
Cash flows from investing activities: | ||||||||||||
Cash consideration paid for acquired businesses | (514,731 | ) | (162,881 | ) | (367,940 | ) | ||||||
Acquisition of property, plant, and equipment | (154,800 | ) | (122,505 | ) | (116,162 | ) | ||||||
Proceeds from sale of facilities | 3,496 | — | — | |||||||||
Proceeds from sale of investment | 2,008 | 40,542 | — | |||||||||
Purchase of cost method investments | — | — | (3,000 | ) | ||||||||
Net cash used for investing activities | (664,027 | ) | (244,844 | ) | (487,102 | ) | ||||||
Cash flows from financing activities: | ||||||||||||
Change in short-term and other borrowings | (46,645 | ) | (12,541 | ) | (31,340 | ) | ||||||
Proceeds from (repayment of) long-term bank borrowings, net | (128,000 | ) | (145,000 | ) | 71,400 | |||||||
Net proceeds from note offering | 688,162 | — | 591,156 | |||||||||
Redemption of notes | (254,313 | ) | — | (338,184 | ) | |||||||
Proceeds from exercise of stock options | 14,900 | 21,788 | 36,014 | |||||||||
Excess tax benefits from stock-based compensation arrangements | 5,911 | 7,129 | 7,172 | |||||||||
Repurchases of common stock | (356,434 | ) | (304,763 | ) | (362,793 | ) | ||||||
Other | (7,768 | ) | (1,499 | ) | — | |||||||
Net cash used for financing activities | (84,187 | ) | (434,886 | ) | (26,575 | ) | ||||||
Effect of exchange rate changes on cash | (34,130 | ) | 16,182 | 43,904 | ||||||||
Net increase (decrease) in cash and cash equivalents | (127,265 | ) | 9,753 | (19,082 | ) | |||||||
Cash and cash equivalents at beginning of year | 400,355 | 390,602 | 409,684 | |||||||||
Cash and cash equivalents at end of year | $ | 273,090 | $ | 400,355 | $ | 390,602 | ||||||
See accompanying notes.
44
ARROW ELECTRONICS, INC.
CONSOLIDATED STATEMENTS OF EQUITY
(In thousands)
Common Stock at Par Value | Capital in Excess of Par Value | Treasury Stock | Retained Earnings | Accumulated Other Comprehensive Income (Loss) | Noncontrolling Interests | Total | |||||||||||||||||||||
Balance at December 31, 2012 | $ | 125,424 | $ | 1,086,239 | $ | (652,867 | ) | $ | 3,279,289 | $ | 145,137 | $ | 4,140 | $ | 3,987,362 | ||||||||||||
Consolidated net income | — | — | — | 399,420 | — | 456 | 399,876 | ||||||||||||||||||||
Other comprehensive income | — | — | — | — | 80,415 | — | 80,415 | ||||||||||||||||||||
Amortization of stock-based compensation | — | 36,923 | — | — | — | — | 36,923 | ||||||||||||||||||||
Shares issued for stock-based compensation awards | — | (59,118 | ) | 95,132 | — | — | — | 36,014 | |||||||||||||||||||
Tax benefits related to stock-based compensation awards | — | 7,031 | — | — | — | — | 7,031 | ||||||||||||||||||||
Repurchases of common stock | — | — | (362,793 | ) | — | — | — | (362,793 | ) | ||||||||||||||||||
Balance at December 31, 2013 | 125,424 | 1,071,075 | (920,528 | ) | 3,678,709 | 225,552 | 4,596 | 4,184,828 | |||||||||||||||||||
Consolidated net income | — | — | — | 498,045 | — | 345 | 498,390 | ||||||||||||||||||||
Other comprehensive loss | — | — | — | — | (290,169 | ) | — | (290,169 | ) | ||||||||||||||||||
Amortization of stock-based compensation | — | 41,930 | — | — | — | — | 41,930 | ||||||||||||||||||||
Shares issued for stock-based compensation awards | — | (33,830 | ) | 55,618 | — | — | — | 21,788 | |||||||||||||||||||
Tax benefits related to stock-based compensation awards | — | 6,907 | — | — | — | — | 6,907 | ||||||||||||||||||||
Repurchases of common stock | — | — | (304,763 | ) | — | — | — | (304,763 | ) | ||||||||||||||||||
Balance at December 31, 2014 | 125,424 | 1,086,082 | (1,169,673 | ) | 4,176,754 | (64,617 | ) | 4,941 | 4,158,911 | ||||||||||||||||||
Consolidated net income | — | — | — | 497,726 | — | 2,760 | 500,486 | ||||||||||||||||||||
Other comprehensive income (loss) | — | — | — | — | (220,089 | ) | 1,453 | (218,636 | ) | ||||||||||||||||||
Amortization of stock-based compensation | — | 47,274 | — | — | — | — | 47,274 | ||||||||||||||||||||
Shares issued for stock-based compensation awards | — | (31,138 | ) | 46,038 | — | — | — | 14,900 | |||||||||||||||||||
Tax benefits related to stock-based compensation awards | — | 5,795 | — | — | — | — | 5,795 | ||||||||||||||||||||
Repurchases of common stock | — | — | (356,434 | ) | — | — | — | (356,434 | ) | ||||||||||||||||||
Acquisition of non-controlling interest | — | — | — | — | — | 47,451 | 47,451 | ||||||||||||||||||||
Purchase of subsidiary shares from noncontrolling interest | — | (699 | ) | — | — | — | (4,019 | ) | (4,718 | ) | |||||||||||||||||
Distributions | — | — | — | — | — | (218 | ) | (218 | ) | ||||||||||||||||||
Balance at December 31, 2015 | $ | 125,424 | $ | 1,107,314 | $ | (1,480,069 | ) | $ | 4,674,480 | $ | (284,706 | ) | $ | 52,368 | $ | 4,194,811 | |||||||||||
See accompanying notes.
45
ARROW ELECTRONICS, INC.
NOTES TO THE CONSOLIDATED FINANCIAL STATEMENTS
(Dollars in thousands except per share data)
1.Summary of Significant Accounting Policies
Principles of Consolidation
The consolidated financial statements include the accounts of the company and its majority-owned subsidiaries. All significant intercompany transactions are eliminated.
Use of Estimates
The preparation of financial statements in conformity with accounting principles generally accepted in the United States requires the company to make significant estimates and assumptions that affect the amounts reported in the consolidated financial statements and accompanying notes. Actual results could differ from those estimates.
Cash and Cash Equivalents
Cash equivalents consist of highly liquid investments, which are readily convertible into cash, with original maturities of three months or less.
Inventories
Inventories are stated at the lower of cost or market. Cost approximates the first-in, first-out method. Substantially all inventories represent finished goods held for sale.
Property, Plant, and Equipment
Property, plant, and equipment are stated at cost. Depreciation is computed on the straight-line method over the estimated useful lives of the assets. The estimated useful lives for depreciation of buildings is generally 20 to 30 years, and the estimated useful lives of machinery and equipment is generally three to ten years. Leasehold improvements are amortized over the shorter of the term of the related lease or the life of the improvement. Long-lived assets are reviewed for impairment whenever events or changes in circumstances indicate that the carrying amounts may not be recoverable. If the carrying value of the asset can not be recovered from estimated future cash flows, undiscounted and without interest, the fair value of the asset is calculated using the present value of estimated net future cash flows. If the fair value is less than the carrying amount of the asset, a loss is recognized for the difference.
Software Development Costs
The company capitalizes certain internal and external costs incurred to acquire or create internal-use software. Capitalized software costs are amortized on a straight-line basis over the estimated useful life of the software, which is generally three to ten years. At December 31, 2015 and 2014, the company had unamortized software development costs of $433,146 and $411,056, respectively, which are included in "Machinery and equipment" in the company's consolidated balance sheets.
Identifiable Intangible Assets
Amortization of definite-lived intangible assets is computed on the straight-line method over the estimated useful lives of the assets, while indefinite-lived intangible assets are not amortized. Identifiable intangible assets are reviewed for impairment whenever events or changes in circumstances indicate that the carrying amounts may not be recoverable. The company also tests indefinite-lived intangible assets, consisting of acquired trade names, for impairment at least annually as of the first day of the fourth quarter. If the fair value is less than the carrying amount of the asset, a loss is recognized for the difference.
Investments
Investments are accounted for using the equity method if the investment provides the company the ability to exercise significant influence, but not control, over an investee. Significant influence is generally deemed to exist if the company has an ownership interest in the voting stock of the investee between 20% and 50%, although other factors, such as representation on the investee's Board of Directors, are considered in determining whether the equity method is appropriate. The company records its investments
46
ARROW ELECTRONICS, INC.
NOTES TO THE CONSOLIDATED FINANCIAL STATEMENTS
(Dollars in thousands except per share data)
in equity method investees meeting these characteristics as "Investments in affiliated companies" in the company's consolidated balance sheets.
All other equity investments, which consist of investments for which the company does not possess the ability to exercise significant influence, are accounted for under the cost method, if privately held, or as available-for-sale, if publicly traded, and are included in "Other assets" in the company's consolidated balance sheets. Under the cost method of accounting, investments are carried at cost and are adjusted only for other-than-temporary declines in realizable value and additional investments. The company accounts for available-for-sale investments at fair value, using quoted market prices, and the related holding gains and losses are included in "Accumulated other comprehensive income (loss)" in the shareholders' equity section in the company's consolidated balance sheets. The company assesses its long-term investments accounted for as available-for-sale on an ongoing basis to determine whether declines in market value below cost are other-than-temporary. When the decline is determined to be other-than-temporary, the cost basis for the individual security is reduced and a loss is realized in the company's consolidated statement of operations in the period in which it occurs. The company makes such determination after considering the length of time and the extent to which the market value of the investment is less than its cost, the financial condition and operating results of the investee, and the company's intent and ability to retain the investment over time to potentially allow for any recovery in market value. In addition, the company assesses the following factors:
• | broad economic factors impacting the investee's industry; |
• | publicly available forecasts for sales and earnings growth for the industry and investee; and |
• | the cyclical nature of the investee's industry. |
The company could incur an impairment charge in future periods if, among other factors, the investee's future earnings differ from currently available forecasts.
Cost in Excess of Net Assets of Companies Acquired
Goodwill represents the excess of the cost of an acquisition over the fair value of the net assets acquired. The company tests goodwill for impairment annually as of the first day of the fourth quarter and/or when an event occurs or circumstances change such that it is more likely than not that an impairment may exist. Examples of such events and circumstances that the company would consider include the following:
• | macroeconomic conditions such as deterioration in general economic conditions, limitations on accessing capital, fluctuations in foreign exchange rates, or other developments in equity and credit markets; |
• | industry and market considerations such as a deterioration in the environment in which the company operates, an increased competitive environment, a decline in market-dependent multiples or metrics (considered in both absolute terms and relative to peers), a change in the market for the company's products or services, or a regulatory or political development; |
• | cost factors such as increases in raw materials, labor, or other costs that have a negative effect on earnings and cash flows; |
• | overall financial performance such as negative or declining cash flows or a decline in actual or planned revenue or earnings compared with actual and projected results of relevant prior periods; |
• | other relevant entity-specific events such as changes in management, key personnel, strategy, or customers; contemplation of bankruptcy; or litigation; |
• | events affecting a reporting unit such as a change in the composition or carrying amount of its net assets, a more-likely-than-not expectation of selling or disposing all, or a portion, of a reporting unit, the testing for recoverability of a significant asset group within a reporting unit, or recognition of a goodwill impairment loss in the financial statements of a subsidiary that is a component of a reporting unit; and |
• | a sustained decrease in share price (considered in both absolute terms and relative to peers). |
Goodwill is tested at a level of reporting referred to as "the reporting unit." The company's reporting units are defined as each of the three regional businesses within the global components business segment, which are the Americas, EMEA (Europe, Middle East, and Africa), and Asia/Pacific and each of the two regional businesses within the global ECS business segment, which are North America and EMEA.
An entity has the option to first assess qualitative factors to determine whether the existence of events or circumstances leads to a determination that it is more likely than not (that is, a likelihood of more than 50%) that the fair value of a reporting unit is less than its carrying amount. If, after assessing the totality of events or circumstances, an entity determines it is not more likely than not that the fair value of a reporting unit is less than its carrying amount, then performing the two-step impairment test is unnecessary.
47
ARROW ELECTRONICS, INC.
NOTES TO THE CONSOLIDATED FINANCIAL STATEMENTS
(Dollars in thousands except per share data)
The company has elected not to perform the qualitative assessment and began its impairment testing with the first step of the two-step impairment process. The first step, used to identify potential impairment, compares the calculated fair value of a reporting unit with its carrying amount. If the carrying amount of the reporting unit is less than its fair value, no impairment exists and the second step is not performed. If the carrying amount of a reporting unit exceeds its fair value, the entity is required to perform the second step of the goodwill impairment test to measure the amount of the impairment loss, if any. The second step of the goodwill impairment test compares the implied fair value of the reporting unit goodwill with the carrying amount of that goodwill. If the carrying amount of the reporting unit goodwill exceeds the implied fair value of that goodwill, an impairment loss is recognized for the excess.
The company estimates the fair value of a reporting unit using the income approach. For the purposes of the income approach, fair value is determined based on the present value of estimated future cash flows, discounted at an appropriate risk-adjusted rate. The assumptions included in the income approach include forecasted revenues, gross profit margins, operating income margins, working capital cash flow, forecasted capital expenditures, perpetual growth rates, and long-term discount rates, among others, all of which require significant judgments by management. Actual results may differ from those assumed in the company's forecasts. The company also reconciles its discounted cash flow analysis to its current market capitalization allowing for a reasonable control premium. As of the first day of the fourth quarters of 2015, 2014, and 2013, the company's annual impairment testing did not indicate impairment at any of the company's reporting units.
Foreign Currency Translation and Remeasurement
The assets and liabilities of international operations are translated at the exchange rates in effect at the balance sheet date. Revenue and expense accounts are translated at the monthly average exchange rates. Adjustments arising from the translation of the foreign currency financial statements of the company's international operations are reported as a component of "Accumulated other comprehensive income (loss)" in the company's consolidated balance sheets.
For foreign currency remeasurement from each local currency into the appropriate functional currency, monetary assets and liabilities are remeasured to functional currencies using current exchange rates in effect at the balance sheet date. Gains or losses from these remeasurements were not significant and have been included in the company’s consolidated statements of operations. Non-monetary assets and liabilities are recorded at historical exchange rates.
Income Taxes
Income taxes are accounted for under the liability method. Deferred income taxes reflect the tax consequences on future years of differences between the tax bases of assets and liabilities and their financial reporting amounts. The carrying value of the company's deferred tax assets is dependent upon the company's ability to generate sufficient future taxable income in certain tax jurisdictions. Should the company determine that it is more likely than not that some portion or all of its deferred tax assets will not be realized, a valuation allowance to the deferred tax assets would be established in the period such determination was made.
It is the company's policy to provide for uncertain tax positions and the related interest and penalties based upon management's assessment of whether a tax benefit is more likely than not to be sustained upon examination by tax authorities. To the extent the company prevails in matters for which a liability for an unrecognized tax benefit is established or is required to pay amounts in excess of the liability, the company's effective tax rate in a given financial statement period may be affected.
Net Income Per Share
Basic net income per share is computed by dividing net income attributable to shareholders by the weighted-average number of common shares outstanding for the period. Diluted net income per share reflects the potential dilution that would occur if securities or other contracts to issue common stock were exercised or converted into common stock.
Comprehensive Income
Comprehensive income consists of consolidated net income, foreign currency translation adjustment, employee benefit plan items, and unrealized gains or losses on investment securities and interest rate swaps designated as cash flow hedges. Unrealized gains or losses on investment securities and interest rate swaps are net of any reclassification adjustments for realized gains or losses included in consolidated net income. Foreign currency translation adjustments included in comprehensive income were not tax
48
ARROW ELECTRONICS, INC.
NOTES TO THE CONSOLIDATED FINANCIAL STATEMENTS
(Dollars in thousands except per share data)
effected as investments in international affiliates are deemed to be permanent. All other comprehensive income items are net of related income taxes.
Stock-Based Compensation
The company records share-based payment awards exchanged for employee services at fair value on the date of grant and expenses the awards in the consolidated statements of operations over the requisite employee service period. Stock-based compensation expense includes an estimate for forfeitures. Stock-based compensation expense related to awards with a market or performance condition is generally recognized over the vesting period of the award utilizing the graded vesting method, while all other awards are recognized on a straight-line basis. The company recorded, as a component of selling, general, and administrative expenses, amortization of stock-based compensation of $47,274, $41,930, and $36,923 in 2015, 2014, and 2013, respectively.
Segment Reporting
Operating segments are defined as components of an enterprise for which separate financial information is available that is evaluated regularly by the chief operating decision maker in deciding how to allocate resources and in assessing performance. The company's operations are classified into two reportable business segments: global components and global ECS.
Revenue Recognition
The company recognizes revenue when there is persuasive evidence of an arrangement, delivery has occurred or services are rendered, the sales price is fixed or determinable, and collectibility is reasonably assured. Revenue typically is recognized at time of shipment. Sales are recorded net of discounts, rebates, and returns, which historically have not been material.
A portion of the company's business involves shipments directly from its suppliers to its customers. In these transactions, the company is responsible for negotiating price both with the supplier and customer, payment to the supplier, establishing payment terms with the customer, product returns, and has risk of loss if the customer does not make payment. As the principal with the customer, the company recognizes the sale and cost of sale of the product upon receiving notification from the supplier that the product was shipped.
The company has certain business with select customers and suppliers that is accounted for on an agency basis (that is, the company recognizes the fees associated with serving as an agent in sales with no associated cost of sales). Generally, these transactions relate to the sale of supplier service contracts to customers where the company has no future obligation to perform under these contracts or the rendering of logistics services for the delivery of inventory for which the company does not assume the risks and rewards of ownership.
Shipping and Handling Costs
The company reports shipping and handling costs, primarily related to outbound freight, in the consolidated statements of operations as a component of selling, general, and administrative expenses. Shipping and handling costs included in selling, general, and administrative expenses totaled $77,399, $85,591, and $92,620 in 2015, 2014, and 2013, respectively.
Impact of Recently Issued Accounting Standards
In January 2016, the Financial Accounting Standards Board (“FASB”) issued Accounting Standards Update No. 2016-01, Financial Instruments - Recognition and Measurement of Financial Assets and Financial Liabilities (Topic 825) ("ASU No. 2016-01"). ASU No. 2016-01 revises the classification and measurement of investments in certain equity investments and the presentation of certain fair value changes for certain financial liabilities measured at fair value. ASU No. 2016-01 requires the change in fair value of many equity investments to be recognized in net income. ASU No. 2016-01 is effective for interim and annual periods beginning after December 15, 2017, with early adoption permitted. Adopting ASU No. 2016-01 may result in a cumulative effect adjustment to the consolidated statement of equity retained earnings as of the beginning of the year of adoption. The company is currently evaluating the potential effects of adopting the provisions of ASU No. 2016-01.
In November 2015, the FASB issued Accounting Standards Update No. 2015-17, Income Taxes - Balance Sheet Classification of Deferred Taxes (Topic 740) ("ASU No. 2015-17"). ASU No. 2015-17 requires deferred tax liabilities and assets to be classified as noncurrent in the consolidated balance sheet. ASU No. 2015-17 is effective for interim and annual periods beginning after
49
ARROW ELECTRONICS, INC.
NOTES TO THE CONSOLIDATED FINANCIAL STATEMENTS
(Dollars in thousands except per share data)
December 15, 2016, with early adoption permitted. ASU No. 2015-17 may be applied either prospectively to all deferred tax liabilities and assets or retrospectively to all periods presented. The adoption of the provisions of ASU No. 2015-17 is not expected to have a material impact on the company's financial position or results of operations.
In September 2015, the FASB issued Accounting Standards Update No. 2015-16, Business Combinations - Simplifying the Accounting for Measurement-Period Adjustments (Topic 805) ("ASU No. 2015-16"). ASU No. 2015-16 requires that an acquirer recognize adjustments to provisional amounts that are identified during the measurement period in the reporting period in which the adjustment amounts are determined. ASU No. 2015-16 is effective for interim and annual periods beginning after December 15, 2015, with early adoption permitted, and is to be applied on a prospective basis. Effective June 28, 2015, the company adopted the provisions of ASU No. 2015-16. The adoption of the provisions of ASU No. 2015-16 did not materially impact the company's consolidated financial position or results of operations.
In July 2015, the FASB issued Accounting Standards Update No. 2015-11, Inventory - Simplifying the Measurement of Inventory (Topic 330) ("ASU No. 2015-11"). ASU No. 2015-11 requires an entity to measure inventory within the scope of the update at the lower of cost and net realizable value, and defines net realizable value as the estimated selling prices in the ordinary course of business, less reasonably predictable costs of completion, disposal, and transportation. ASU No. 2015-11 is effective for interim and annual periods beginning after December 15, 2016, with early adoption permitted, and is to be applied on a prospective basis. The adoption of the provisions of ASU No. 2015-11 is not expected to have a material impact on the company's financial position or results of operations.
In April 2015, the FASB issued Accounting Standards Update No. 2015-03, Interest - Imputation of Interest (Subtopic 835-30) ("ASU No. 2015-03"). ASU No. 2015-03 requires that debt issuance costs related to a recognized debt liability be presented in the balance sheet as a direct deduction from the carrying amount of the corresponding debt liability. In August 2015, the FASB issued Accounting Standards Update No. 2015-15, Interest - Imputation of Interest: Presentation and Subsequent Measurement of Debt Issuance Costs Associated with Line-of-Credit Arrangements (Subtopic 835-30) ("ASU No. 2015-15"). ASU No. 2015-15 provides additional guidance on the presentation and subsequent measurement of debt issuance costs associated with line-of-credit arrangements. ASU No. 2015-03 and ASU No. 2015-15 are effective for interim and annual periods beginning after December 15, 2015, with early adoption permitted, and is to be applied on a retrospective basis. Effective January 1, 2015 and June 28, 2015, the company adopted the provisions of ASU No. 2015-03 and ASU No. 2015-15, respectively. The adoption of the provisions of ASU No. 2015-03 and ASU No. 2015-15 did not materially impact the company's consolidated financial position or results of operations. Prior period amounts were reclassified to conform to the current period presentation.
In May 2014, the FASB issued Accounting Standards Update No. 2014-09, Revenue from Contracts with Customers (Topic 606) ("ASU No. 2014-09"). ASU No. 2014-09 supersedes the revenue recognition requirements in Topic 605, Revenue Recognition, and most industry-specific guidance throughout the Industry Topics of the Codification. Additionally, ASU No. 2014-09 supersedes some cost guidance included in Subtopic 605-35, Revenue Recognition-Construction-Type and Production-Type Contracts. Under ASU No. 2014-09, an entity should recognize revenue when it transfers promised goods or services to customers in an amount that reflects the consideration to which the entity expects to be entitled in exchange for those goods or services. ASU No. 2014-09 also requires additional disclosure about the nature, amount, timing, and uncertainty of revenue and cash flows arising from customer contracts. This includes significant judgments and changes in judgments and assets recognized from costs incurred to obtain or fulfill a contract. ASU No. 2014-09 is effective for interim and annual periods beginning after December 15, 2017, with early application permitted for interim and annual periods beginning after December 15, 2016. ASU No. 2014-09 allows for either full retrospective or modified retrospective adoption. The company is evaluating the transition method that will be elected and the potential effects of adopting the provisions of ASU No. 2014-09.
Reclassification
Certain prior year amounts were reclassified to conform to the current year presentation.
2. Acquisitions
The company accounts for acquisitions using the acquisition method of accounting. The results of operations of acquisitions are included in the company's consolidated results from their respective dates of acquisition. The company allocates the purchase price of each acquisition to the tangible assets, liabilities, and identifiable intangible assets acquired based on their estimated fair values. In certain circumstances, a portion of purchase price may be contingent upon the achievement of certain operating results. The fair values assigned to identifiable intangible assets acquired and contingent consideration were determined primarily by using an income approach which was based on assumptions and estimates made by management. Significant assumptions utilized in
50
ARROW ELECTRONICS, INC.
NOTES TO THE CONSOLIDATED FINANCIAL STATEMENTS
(Dollars in thousands except per share data)
the income approach were based on company specific information and projections, which are not observable in the market and are thus considered Level 3 measurements by authoritative guidance (see Note 7). The excess of the purchase price over the fair value of the identified assets and liabilities has been recorded as goodwill. Any change in the estimated fair value of the net assets prior to the finalization of the allocation for acquisitions could change the amount of the purchase price allocable to goodwill. The company is not aware of any information that indicates the final purchase price allocations will differ materially from the preliminary estimates.
2015 Acquisitions
On March 31, 2015, the company acquired immixGroup, Inc. ("immixGroup"), for a purchase price of $280,454, which included $28,205 of cash acquired. immixGroup is a value-added provider supporting value-added resellers, solution providers, service providers, and other public sector channel partners with specialized resources to accelerate their government sales. immixGroup has operations in North America.
Since the date of the acquisition, immixGroup sales for 2015 of $384,926 were included in the company's consolidated results of operations.
The following table summarizes the preliminary allocation of the net consideration paid to the fair value of the assets acquired and liabilities assumed for the immixGroup acquisition:
Accounts receivable, net | $ | 145,130 | |
Other current assets | 26,647 | ||
Property, plant, and equipment | 1,569 | ||
Other assets | 5,313 | ||
Identifiable intangible assets | 53,700 | ||
Cost in excess of net assets acquired | 174,074 | ||
Accounts payable | (136,921 | ) | |
Accrued expenses | (11,736 | ) | |
Other liabilities | (5,527 | ) | |
Cash consideration paid, net of cash acquired | $ | 252,249 | |
In connection with the immixGroup acquisition, the company allocated $53,700 to customer relationships with a weighted-average life of 13 years.
The cost in excess of net assets acquired related to the immixGroup acquisition was recorded in the company's global ECS business segment. The intangible assets related to the immixGroup acquisition are expected to be deductible for income tax purposes.
During 2015, the company completed 9 additional acquisitions for an aggregate purchase price of approximately $263,341, net of cash acquired, inclusive of a 53.7% acquisition of Data Modul AG, and an additional 3.6% was acquired subsequent to the date of acquisition. The company also assumed $84,487 in debt in connection with these acquisitions. The impact of these acquisitions was not material, individually or in the aggregate, to the company's consolidated financial position or results of operations.
51
ARROW ELECTRONICS, INC.
NOTES TO THE CONSOLIDATED FINANCIAL STATEMENTS
(Dollars in thousands except per share data)
The following table summarizes the company's consolidated results of operations for 2015 and 2014, as well as the unaudited pro forma consolidated results of operations of the company, as though the 2015 acquisitions occurred on January 1:
For the Years Ended December 31, | |||||||||||||||
2015 | 2014 | ||||||||||||||
As Reported | Pro Forma | As Reported | Pro Forma | ||||||||||||
Sales | $ | 23,282,020 | $ | 23,684,746 | $ | 22,768,674 | $ | 24,189,797 | |||||||
Net income attributable to shareholders | 497,726 | 500,554 | 498,045 | 518,859 | |||||||||||
Net income per share: | |||||||||||||||
Basic | $ | 5.26 | $ | 5.29 | $ | 5.05 | $ | 5.26 | |||||||
Diluted | $ | 5.20 | $ | 5.23 | $ | 4.98 | $ | 5.19 | |||||||
The unaudited pro forma consolidated results of operations do not purport to be indicative of the results obtained had these acquisitions occurred as of the beginning of 2015 and 2014, or of those results that may be obtained in the future. Additionally, the above table does not reflect any anticipated cost savings or cross-selling opportunities expected to result from these acquisitions.
2014 Acquisitions
During 2014, the company completed five acquisitions. The aggregate consideration paid for these acquisitions was $162,881, net of cash acquired, and included $5,853 of contingent consideration and $210 of other amounts withheld. The impact of these acquisitions was not material, individually or in the aggregate, to the company's consolidated financial position or results of operations. The pro forma impact of the 2014 acquisitions on the consolidated results of operations of the company for the years ended December 31, 2014 and 2013, as though the 2014 acquisitions occurred on January 1, 2013 was also not material.
2013 Acquisitions
On October 28, 2013, the company acquired CSS Computer Security Solutions Holding GmbH, doing business as ComputerLinks AG ("ComputerLinks"), for a purchase price of approximately $313,209, which included $20,981 of cash acquired. ComputerLinks is a value-added distributor of enterprise computing solutions with a comprehensive offering of IT solutions from many of the world's leading technology suppliers. ComputerLinks has operations in EMEA, North America, and select countries within the Asia Pacific region.
ComputerLinks sales for the year ended December 31, 2013 of $208,177 were included in the company's consolidated results of operations.
52
ARROW ELECTRONICS, INC.
NOTES TO THE CONSOLIDATED FINANCIAL STATEMENTS
(Dollars in thousands except per share data)
The following table summarizes the allocation of the net consideration paid to the fair value of the assets acquired and liabilities assumed for the ComputerLinks acquisition:
Accounts receivable, net | $ | 177,700 | |
Inventories | 58,041 | ||
Other current assets | 11,168 | ||
Property, plant, and equipment | 7,070 | ||
Other assets | 1,480 | ||
Identifiable intangible assets | 39,195 | ||
Cost in excess of net assets acquired | 275,442 | ||
Accounts payable | (213,456 | ) | |
Accrued expenses | (51,270 | ) | |
Other liabilities | (13,142 | ) | |
Cash consideration paid, net of cash acquired | $ | 292,228 | |
In connection with the ComputerLinks acquisition, the company allocated the following amounts to identifiable intangible assets:
Weighted-Average Life | |||||
Customer relationships | 9 years | $ | 37,125 | ||
Other intangible assets | (a) | 2,070 | |||
Total identifiable intangible assets | $ | 39,195 | |||
(a) | Consists of non-competition agreements and sales backlog with useful lives ranging from one to two years. |
The cost in excess of net assets acquired related to the ComputerLinks acquisition was recorded in the company's global ECS business segment. The intangible assets related to the ComputerLinks acquisition are not expected to be deductible for income tax purposes.
During 2013, the company completed four additional acquisitions. The aggregate consideration for these four acquisitions was $80,210, net of cash acquired, and includes $4,498 of contingent consideration. The impact of these acquisitions was not material, individually or in the aggregate, to the company's consolidated financial position or results of operations.
The following table summarizes the company's consolidated results of operations for 2013, as well as the unaudited pro forma consolidated results of operations of the company, as though the 2013 acquisitions occurred on January 1:
For the Year Ended December 31, | ||||||||
2013 | ||||||||
As Reported | Pro Forma | |||||||
Sales | $ | 21,357,285 | $ | 22,191,263 | ||||
Net income attributable to shareholders | 399,420 | 408,290 | ||||||
Net income per share: | ||||||||
Basic | $ | 3.89 | $ | 3.98 | ||||
Diluted | $ | 3.85 | $ | 3.94 | ||||
The unaudited pro forma consolidated results of operations do not purport to be indicative of the results obtained had these acquisitions occurred as of the beginning of 2013, or of those results that may be obtained in the future. Additionally, the above table does not reflect any anticipated cost savings or cross-selling opportunities expected to result from these acquisitions.
53
ARROW ELECTRONICS, INC.
NOTES TO THE CONSOLIDATED FINANCIAL STATEMENTS
(Dollars in thousands except per share data)
3. Cost in Excess of Net Assets of Companies Acquired and Intangible Assets, Net
Goodwill represents the excess of the cost of an acquisition over the fair value of the net assets acquired. The company tests goodwill and other indefinite-lived intangible assets for impairment annually as of the first day of the fourth quarter, or more frequently if indicators of potential impairment exist.
As of the first day of the fourth quarters of 2015, 2014, and 2013, the company's annual impairment testing did not result in any indicators of impairment of cost in excess of net assets of companies acquired.
Cost in excess of net assets of companies acquired, allocated to the company's business segments, is as follows:
Global Components | Global ECS | Total | ||||||||||
Balance as of December 31, 2013 (a) | $ | 1,000,860 | $ | 1,038,433 | $ | 2,039,293 | ||||||
Acquisitions | 63,077 | 47,974 | 111,051 | |||||||||
Foreign currency translation adjustment | (12,154 | ) | (68,981 | ) | (81,135 | ) | ||||||
Balance as of December 31, 2014 (a) | 1,051,783 | 1,017,426 | 2,069,209 | |||||||||
Acquisitions | 187,977 | 174,074 | 362,051 | |||||||||
Foreign currency translation adjustment | (8,928 | ) | (53,500 | ) | (62,428 | ) | ||||||
Balance as of December 31, 2015 (a) | $ | 1,230,832 | $ | 1,138,000 | $ | 2,368,832 | ||||||
(a) | The total carrying value of cost in excess of net assets of companies acquired for all periods in the table above is reflected net of $1,018,780 of accumulated impairment charges, of which $716,925 was recorded in the global components business segment and $301,855 was recorded in the global ECS business segment. |
Intangible assets, net, are comprised of the following as of December 31, 2015:
Weighted-Average Life | Gross Carrying Amount | Accumulated Amortization | Net | ||||||||||
Trade names | indefinite | $ | 101,000 | $ | — | $ | 101,000 | ||||||
Customer relationships | 10 years | 498,319 | (215,263 | ) | 283,056 | ||||||||
Developed technology | 5 years | 13,154 | (7,894 | ) | 5,260 | ||||||||
Other intangible assets | (b) | 917 | (907 | ) | 10 | ||||||||
$ | 613,390 | $ | (224,064 | ) | $ | 389,326 | |||||||
Intangible assets, net, are comprised of the following as of December 31, 2014:
Weighted-Average Life | Gross Carrying Amount | Accumulated Amortization | Net | ||||||||||
Trade names | indefinite | $ | 101,000 | $ | — | $ | 101,000 | ||||||
Customer relationships | 10 years | 402,036 | (171,071 | ) | 230,965 | ||||||||
Developed technology | 5 years | 8,806 | (5,444 | ) | 3,362 | ||||||||
Other intangible assets | (b) | 1,719 | (1,335 | ) | 384 | ||||||||
$ | 513,561 | $ | (177,850 | ) | $ | 335,711 | |||||||
(b) | Consists of non-competition agreements with useful lives ranging from two to three years. |
The gross carrying value of trade names in the table above is reflected net of a $78,000 non-cash impairment charge recorded during the fourth quarter of 2014. In connection with the company's global re-branding initiative to brand certain of its businesses
54
ARROW ELECTRONICS, INC.
NOTES TO THE CONSOLIDATED FINANCIAL STATEMENTS
(Dollars in thousands except per share data)
under the Arrow name, the company made the decision to discontinue the use of a trade name of one of its businesses within the global ECS business segment. As no future cash flows will be attributed to the impacted trade name, the entire book value was written-off, resulting in the non-cash impairment charge of $78,000 ($47,911 net of related taxes or $.49 and $.48 per share on a basic and diluted basis, respectively) as of December 31, 2014 in the company's consolidated statements of operations. Fair value was determined using unobservable (Level 3) inputs. The impairment charge did not impact the company’s consolidated cash flows, liquidity, capital resources, and covenants under its existing revolving credit facility, asset securitization program, and other outstanding borrowings. No impairment existed as of December 31, 2014 with respect to the company's other identifiable intangible assets.
Amortization expense related to identifiable intangible assets was $51,036 ($41,256 net of related taxes or $.44 and $.43 per share on a basic and diluted basis, respectively), $44,063 ($35,965 net of related taxes or $.36 per share on both a basic and diluted basis), and $36,769 ($29,339 net of related taxes or $.29 and $.28 per share on a basic and diluted basis, respectively) for the years ended December 31, 2015, 2014, and 2013, respectively. Amortization expense for each of the years 2016 through 2020 is estimated to be approximately $51,758, $48,728, $43,198, $36,853, and $30,256, respectively.
4. Investments in Affiliated Companies
The company owns a 50% interest in several joint ventures with Marubun Corporation (collectively "Marubun/Arrow") and a 50% interest in Arrow Altech Holdings (Pty.) Ltd. ("Altech Industries"), a joint venture with Allied Technologies Limited. As a result of one of the company's 2015 acquisitions, the company acquired a 50% interest in two immaterial joint ventures which are included in "Other" in the tables below. These investments are accounted for using the equity method.
The following table presents the company's investment in the following joint ventures at December 31:
2015 | 2014 | |||||||
Marubun/Arrow | $ | 62,530 | $ | 58,617 | ||||
Altech Industries | 8,261 | 10,507 | ||||||
Other | 2,585 | — | ||||||
$ | 73,376 | $ | 69,124 | |||||
The equity in earnings of affiliated companies for the years ended December 31 consists of the following:
2015 | 2014 | 2013 | ||||||||||
Marubun/Arrow | $ | 6,212 | $ | 6,510 | $ | 6,386 | ||||||
Altech Industries | 592 | 808 | 1,043 | |||||||||
Other | 233 | — | — | |||||||||
$ | 7,037 | $ | 7,318 | $ | 7,429 | |||||||
Under the terms of various joint venture agreements, the company is required to pay its pro-rata share of the third party debt of the joint ventures in the event that the joint ventures are unable to meet their obligations. There were no outstanding borrowings under the third party debt agreements of the joint ventures as of December 31, 2015.
5. Accounts Receivable
Accounts receivable, net, consists of the following at December 31:
2015 | 2014 | |||||||
Accounts receivable | $ | 6,211,077 | $ | 6,103,038 | ||||
Allowances for doubtful accounts | (49,659 | ) | (59,188 | ) | ||||
Accounts receivable, net | $ | 6,161,418 | $ | 6,043,850 | ||||
55
ARROW ELECTRONICS, INC.
NOTES TO THE CONSOLIDATED FINANCIAL STATEMENTS
(Dollars in thousands except per share data)
The company maintains allowances for doubtful accounts for estimated losses resulting from the inability of its customers to make required payments. The allowances for doubtful accounts are determined using a combination of factors, including the length of time the receivables are outstanding, the current business environment, and historical experience.
6. Debt
At December 31, 2015 and 2014, short-term borrowings of $44,024 and $13,454, respectively, were primarily utilized to support the working capital requirements of certain international operations. The weighted-average interest rates on these borrowings at December 31, 2015 and 2014 were 3.3% and 3.8%, respectively.
Long-term debt consists of the following at December 31:
2015 | 2014 | |||||||
Revolving credit facility | $ | 72,000 | $ | — | ||||
Asset securitization program | 75,000 | 275,000 | ||||||
3.375% notes, due 2015 | — | 251,955 | ||||||
6.875% senior debentures, due 2018 | 198,886 | 198,424 | ||||||
3.00% notes, due 2018 | 298,197 | 297,408 | ||||||
6.00% notes, due 2020 | 298,932 | 298,680 | ||||||
5.125% notes, due 2021 | 248,566 | 248,287 | ||||||
3.50% notes, due 2022 | 345,061 | — | ||||||
4.50% notes, due 2023 | 296,194 | 295,765 | ||||||
4.00% notes, due 2025 | 344,092 | — | ||||||
7.50% senior debentures, due 2027 | 198,366 | 198,219 | ||||||
Interest rate swaps designated as fair value hedges | 710 | 378 | ||||||
Other obligations with various interest rates and due dates | 4,571 | 3,782 | ||||||
$ | 2,380,575 | $ | 2,067,898 | |||||
The 7.50% senior debentures are not redeemable prior to their maturity. The 6.875% senior debentures, 3.00% notes, 6.00% notes, 5.125% notes, 3.50% notes, 4.50% notes, and 4.00% notes may be called at the option of the company subject to "make whole" clauses.
The estimated fair market value at December 31, using quoted market prices, is as follows:
2015 | 2014 | |||||||
3.375% notes, due 2015 | $ | — | $ | 255,000 | ||||
6.875% senior debentures, due 2018 | 218,000 | 232,000 | ||||||
3.00% notes, due 2018 | 303,000 | 309,000 | ||||||
6.00% notes, due 2020 | 330,000 | 339,000 | ||||||
5.125% notes, due 2021 | 267,500 | 277,500 | ||||||
3.50% notes, due 2022 | 343,000 | — | ||||||
4.50% notes, due 2023 | 309,000 | 321,000 | ||||||
4.00% notes, due 2025 | 336,000 | — | ||||||
7.50% senior debentures, due 2027 | 238,000 | 254,000 | ||||||
The carrying amount of the company's short-term borrowings in various countries, revolving credit facility, asset securitization program, and other obligations approximate their fair value.
56
ARROW ELECTRONICS, INC.
NOTES TO THE CONSOLIDATED FINANCIAL STATEMENTS
(Dollars in thousands except per share data)
The company has a $1,500,000 revolving credit facility, maturing in December 2018. This facility may be used by the company for general corporate purposes including working capital in the ordinary course of business, letters of credit, repayment, prepayment or purchase of long-term indebtedness and acquisitions, and as support for the company's commercial paper program, as applicable. Interest on borrowings under the revolving credit facility is calculated using a base rate or a euro currency rate plus a spread (1.30% at December 31, 2015), which is based on the company's credit ratings, for an effective interest rate of 1.58% at December 31, 2015. The facility fee, which is based on the company's credit ratings, was .20% at December 31, 2015. The company had $72,000 in outstanding borrowings under the revolving credit facility at December 31, 2015. There were no outstanding borrowings under the revolving credit facility at December 31, 2014.
The company has an asset securitization program collateralized by accounts receivable of certain of its subsidiaries. The company may borrow up to $900,000 under the asset securitization program, which matures in March 2017. The asset securitization program is conducted through Arrow Electronics Funding Corporation ("AFC"), a wholly-owned, bankruptcy remote subsidiary. The asset securitization program does not qualify for sale treatment. Accordingly, the accounts receivable and related debt obligation remain on the company's consolidated balance sheets. Interest on borrowings is calculated using a base rate or a commercial paper rate plus a spread (.40% at December 31, 2015), which is based on the company's credit ratings, for an effective interest rate of .86% at December 31, 2015. The facility fee is .40%.
At December 31, 2015 and 2014, the company had $75,000 and $275,000, respectively, in outstanding borrowings under the asset securitization program, which was included in "Long-term debt" in the company's consolidated balance sheets, and total collateralized accounts receivable of approximately $1,871,831 and $2,060,589, respectively, were held by AFC and were included in "Accounts receivable, net" in the company's consolidated balance sheets. Any accounts receivable held by AFC would likely not be available to other creditors of the company in the event of bankruptcy or insolvency proceedings before repayment of any outstanding borrowings under the asset securitization program.
Both the revolving credit facility and asset securitization program include terms and conditions that limit the incurrence of additional borrowings and require that certain financial ratios be maintained at designated levels. The company was in compliance with all covenants as of December 31, 2015 and is currently not aware of any events that would cause non-compliance with any covenants in the future.
Annual payments of borrowings during each of the years 2016 through 2020 are $44,024, $78,284, $569,834, $530, and $299,588, respectively, and $1,432,279 for all years thereafter.
During 2015, the company completed the sale of $350,000 principal amount of 3.50% notes due in 2022 and $350,000 principal amount of 4.00% notes due in 2025. The net proceeds of the offering of $688,162 were used to refinance the company's 3.375% notes due November 2015 and for general corporate purposes.
During 2015, the company redeemed $250,000 principal amount of its 3.375% notes due November 2015. The related loss on the redemption for 2015 was $2,943 ($1,808 net of related taxes or $.02 per share on both a basic and diluted basis) and was recognized as a loss on prepayment of debt in the company's consolidated statements of operations.
During 2014, the company entered into an agreement for an uncommitted line of credit. Under this agreement, the company may borrow up to a total of $100,000. There were no outstanding borrowings under the uncommitted line of credit at December 31, 2015 and 2014.
During 2013, the company completed the sale of $300,000 principal amount of its 3.00% notes due in 2018 and $300,000 principal amount of its 4.50% notes due in 2023. The net proceeds of the offering of $591,156 were used to refinance the company's 6.875% senior notes due July 2013 and for general corporate purposes.
During 2013, the company redeemed $332,107 principal amount of its 6.875% senior notes due July 2013. The related loss on the redemption aggregated $4,277 ($2,627 net of related taxes or $.03 per share on both a basic and diluted basis) and was recognized as a loss on prepayment of debt in the company's consolidated statements of operations.
Interest and other financing expense, net, includes interest and dividend income of $6,301, $5,552, and $5,632 in 2015, 2014, and 2013, respectively. Interest paid, net of interest and dividend income, amounted to $133,390, $120,477, and $116,663 in 2015, 2014, and 2013, respectively.
57
ARROW ELECTRONICS, INC.
NOTES TO THE CONSOLIDATED FINANCIAL STATEMENTS
(Dollars in thousands except per share data)
7. Financial Instruments Measured at Fair Value
Fair value is defined as the exchange price that would be received for an asset or paid to transfer a liability (an exit price) in the principal or most advantageous market for the asset or liability in an orderly transaction between market participants on the measurement date. The company utilizes a fair value hierarchy, which maximizes the use of observable inputs and minimizes the use of unobservable inputs when measuring fair value. The fair value hierarchy has three levels of inputs that may be used to measure fair value:
Level 1 | Unadjusted quoted prices in active markets that are accessible at the measurement date for identical, unrestricted assets or liabilities. |
Level 2 | Quoted prices in markets that are not active; or other inputs that are observable, either directly or indirectly, for substantially the full term of the asset or liability. |
Level 3 | Prices or valuation techniques that require inputs that are both significant to the fair value measurement and unobservable. |
The following table presents assets (liabilities) measured at fair value on a recurring basis at December 31, 2015:
Level 1 | Level 2 | Level 3 | Total | |||||||||||||
Available-for-sale securities | 41,178 | — | — | 41,178 | ||||||||||||
Interest rate swaps | — | 711 | — | 711 | ||||||||||||
Foreign exchange contracts | — | (738 | ) | — | (738 | ) | ||||||||||
Contingent consideration | — | — | (3,889 | ) | (3,889 | ) | ||||||||||
$ | 41,178 | $ | (27 | ) | $ | (3,889 | ) | $ | 37,262 | |||||||
The following table presents assets (liabilities) measured at fair value on a recurring basis at December 31, 2014:
Level 1 | Level 2 | Level 3 | Total | |||||||||||||
Cash and cash equivalents | $ | 99,000 | $ | — | $ | — | $ | 99,000 | ||||||||
Available-for-sale securities | 38,109 | — | — | 38,109 | ||||||||||||
Interest rate swaps | — | 378 | — | 378 | ||||||||||||
Foreign exchange contracts | — | 694 | — | 694 | ||||||||||||
Contingent consideration | — | — | (6,202 | ) | (6,202 | ) | ||||||||||
$ | 137,109 | $ | 1,072 | $ | (6,202 | ) | $ | 131,979 | ||||||||
The following table summarizes the Level 3 activity for the year ended December 31, 2015:
Balance as of December 31, 2014 | $ | (6,202 | ) |
Fair value of initial contingent consideration | — | ||
Change in fair value of contingent consideration included in earnings | (1,128 | ) | |
Payment of contingent consideration (a) | 3,000 | ||
Foreign currency translation adjustment | 441 | ||
Balance as of December 31, 2015 | $ | (3,889 | ) |
(a) | Contingent consideration payment relates to an acquisition completed prior to 2015. |
The change in the fair value of contingent consideration is included in "Restructuring, integration, and other charges" in the company's consolidated statements of operations.
58
ARROW ELECTRONICS, INC.
NOTES TO THE CONSOLIDATED FINANCIAL STATEMENTS
(Dollars in thousands except per share data)
Assets and liabilities that are measured at fair value on a nonrecurring basis relate primarily to our trade names. The company tests these assets for impairment if indicators of potential impairment exist.
During 2014, in connection with the company's global re-branding initiative to brand certain of its businesses under the Arrow name, the company made the decision to discontinue the use of a trade name of one of its businesses within the global ECS business segment. As no future cash flows will be attributed to the impacted trade name, the entire book value was written-off, resulting in a non-cash impairment charge of $78,000 ($47,911 net of related taxes or $.49 and $.48 per share on a basic and diluted basis, respectively) as of December 31, 2014 in the company's consolidated statements of operations. Fair value was determined using unobservable (Level 3) inputs. The impairment charge did not impact the company’s consolidated cash flows, liquidity, capital resources, and covenants under its existing revolving credit facility, asset securitization program, and other outstanding borrowings. No impairment existed as of December 31, 2014 with respect to the company's other identifiable intangible assets.
During 2015, 2014, and 2013 there were no transfers of assets (liabilities) measured at fair value between the three levels of the fair value hierarchy.
Available-For-Sale Securities
The company has an 8.4% equity ownership interest in Marubun Corporation ("Marubun") and a portfolio of mutual funds with quoted market prices, all of which are accounted for as available-for-sale securities.
During 2014, the company sold its 1.9% equity ownership interest in WPG Holdings Co., Ltd. ("WPG") for proceeds of $40,542 and accordingly recorded a gain on sale of investment of $29,743 ($18,269 net of related taxes or $.19 and $.18 per share on a basic and diluted basis, respectively).
The fair value of the company's available-for-sale securities is as follows at December 31:
2015 | 2014 | ||||||||||||||
Marubun | Mutual Funds | Marubun | Mutual Funds | ||||||||||||
Cost basis | $ | 10,016 | $ | 17,389 | $ | 10,016 | $ | 16,233 | |||||||
Unrealized holding gain | 8,708 | 5,065 | 6,174 | 5,686 | |||||||||||
Fair value | $ | 18,724 | $ | 22,454 | $ | 16,190 | $ | 21,919 | |||||||
The fair values of these investments are included in "Other assets" in the company's consolidated balance sheets, and the related unrealized holding gains or losses are included in "Accumulated other comprehensive income (loss)" in the shareholders' equity section in the company's consolidated balance sheets.
Derivative Instruments
The company uses various financial instruments, including derivative instruments, for purposes other than trading. Certain derivative instruments are designated at inception as hedges and measured for effectiveness both at inception and on an ongoing basis. Derivative instruments not designated as hedges are marked-to-market each reporting period with any unrealized gains or losses recognized in earnings.
Interest Rate Swaps
The company occasionally enters into interest rate swap transactions that convert certain fixed-rate debt to variable-rate debt or variable-rate debt to fixed-rate debt in order to manage its targeted mix of fixed- and floating-rate debt. The company uses the hypothetical derivative method to assess the effectiveness of its interest rate swaps on a quarterly basis. The effective portion of the change in the fair value of interest rate swaps designated as fair value hedges is recorded as a change to the carrying value of the related hedged debt, and the effective portion of the change in fair value of interest rate swaps designated as cash flow hedges is recorded in the shareholders' equity section in the company's consolidated balance sheets in "Accumulated other comprehensive income (loss)." The ineffective portion of the interest rate swaps, if any, is recorded in "Interest and other financing expense, net" in the company's consolidated statements of operations.
59
ARROW ELECTRONICS, INC.
NOTES TO THE CONSOLIDATED FINANCIAL STATEMENTS
(Dollars in thousands except per share data)
In January 2015, the company entered into four seven-year forward-starting interest rate swaps (the "2015 swaps") which locked in an average treasury rate of 1.98% on a total aggregate notional amount of $200,000. These 2015 swaps were designated as cash flow hedges and managed the risk associated with changes in treasury rates and the impact of future interest payments on the anticipated debt issuances to replace the company's 3.375% notes due to mature in November 2015. In February 2015, the company received $896 in connection with the termination of the 2015 swaps upon issuance of the seven-year notes due in 2022. The fair value of the 2015 swaps is recorded in the shareholders' equity section in the company's consolidated balance sheets in "Accumulated other comprehensive income (loss)" and is being reclassified into income over the seven-year term of the notes due in 2022. For the year ended December 31, 2015, the company reclassified into income $98 relating to the 2015 swaps.
In April 2014, the company entered into an interest rate swap, with a notional amount of $50,000. This swap modifies the company's interest rate exposure by effectively converting a portion of the fixed 6.00% notes to a floating rate, based on the six-month U.S. dollar LIBOR plus a spread (an effective interest rate of 4.43% at December 31, 2015), through its maturity. The swap is classified as a fair value hedge and had a fair value of $583 at December 31, 2015.
In April 2014, the company entered into an interest rate swap, with a notional amount of $50,000. This swap modifies the company's interest rate exposure by effectively converting a portion of the fixed 6.875% senior debentures to a floating rate, based on the six-month U.S. dollar LIBOR plus a spread (an effective interest rate of 5.96% at December 31, 2015), through its maturity. The swap is classified as a fair value hedge and had a fair value of $128 at December 31, 2015.
In September 2011, the company entered into a ten-year forward-starting interest rate swap (the "2011 swap") which locked in a treasury rate of 2.63% on an aggregate notional amount of $175,000. This swap managed the risk associated with changes in treasury rates and the impact of future interest payments. The 2011 swap related to the interest payments for anticipated debt issuances to replace the company's 6.875% senior notes due to mature in July 2013. The 2011 swap is classified as a cash flow hedge. During 2013, the company paid $7,700 to terminate the 2011 swap upon issuance of the ten-year notes due in 2023. The fair value of the 2011 swap is recorded in the shareholders' equity section in the company's consolidated balance sheets in "Accumulated other comprehensive income (loss)" and is being reclassified into income over the ten-year term of the notes due in 2023. For the 2011 swap, the company reclassified into income $(690), $(656), and $(245) in 2015, 2014, and 2013, respectively.
In December 2010, the company entered into interest rate swaps, with an aggregate notional amount of $250,000. The swaps modified the company's interest rate exposure by effectively converting the fixed 3.375% notes due in November 2015 to a floating rate, based on the three-month U.S. dollar LIBOR plus a spread, through its maturity. In September 2011, these interest rate swap agreements were terminated for proceeds of $11,856, net of accrued interest. The proceeds of the swap terminations, less accrued interest, were reflected as a premium to the underlying debt and were being amortized as a reduction to interest expense over the remaining term of the underlying debt. In March 2015, the unamortized premium was included in the loss on prepayment of debt recorded as a result of the redemption of the 3.375% notes due November 2015 (see Note 6).
In June 2004 and November 2009, the company entered into interest rate swaps, with an aggregate notional amount of $275,000. The swaps modified the company's interest rate exposure by effectively converting a portion of the fixed 6.875% senior notes due in July 2013 to a floating rate, based on the six-month U.S. dollar LIBOR plus a spread, through its maturity. In September 2011, these interest rate swap agreements were terminated for proceeds of $12,203, net of accrued interest. The proceeds of the swap terminations, less accrued interest, were reflected as a premium to the underlying debt and were amortized as a reduction to interest expense over the term of the underlying debt.
Foreign Exchange Contracts
The company enters into foreign exchange forward, option, or swap contracts (collectively, the "foreign exchange contracts") to mitigate the impact of changes in foreign currency exchange rates. These contracts are executed to facilitate the hedging of foreign currency exposures resulting from inventory purchases and sales and generally have terms of no more than six months. Gains or losses on these contracts are deferred and recognized when the underlying future purchase or sale is recognized or when the corresponding asset or liability is revalued. The company does not enter into foreign exchange contracts for trading purposes. The risk of loss on a foreign exchange contract is the risk of nonperformance by the counterparties, which the company minimizes by limiting its counterparties to major financial institutions. The fair value of the foreign exchange contracts are estimated using market quotes. The notional amount of the foreign exchange contracts at December 31, 2015 and 2014 was $382,025 and $401,048, respectively.
60
ARROW ELECTRONICS, INC.
NOTES TO THE CONSOLIDATED FINANCIAL STATEMENTS
(Dollars in thousands except per share data)
The fair values of derivative instruments in the consolidated balance sheets are as follows at December 31:
Asset (Liability) Derivatives | ||||||||||
Fair Value | ||||||||||
Balance Sheet Location | 2015 | 2014 | ||||||||
Derivative instruments designated as hedges: | ||||||||||
Interest rate swaps designated as fair value hedges | Other liabilities | $ | — | $ | (3 | ) | ||||
Interest rate swaps designated as fair value hedges | Other assets | 711 | 381 | |||||||
Foreign exchange contracts designated as cash flow hedges | Other current assets | 896 | 960 | |||||||
Foreign exchange contracts designated as cash flow hedges | Accrued expenses | (572 | ) | (376 | ) | |||||
Total derivative instruments designated as hedging instruments | 1,035 | 962 | ||||||||
Derivative instruments not designated as hedges: | ||||||||||
Foreign exchange contracts | Other current assets | 1,729 | 2,404 | |||||||
Foreign exchange contracts | Accrued expenses | (2,791 | ) | (2,294 | ) | |||||
Total derivative instruments not designated as hedging instruments | (1,062 | ) | 110 | |||||||
Total | $ | (27 | ) | $ | 1,072 | |||||
The effect of derivative instruments on the consolidated statements of operations is as follows for the years ended December 31:
Gain (Loss) Recognized in Income | ||||||||||||
2015 | 2014 | 2013 | ||||||||||
Fair value hedges: | ||||||||||||
Interest rate swaps (a) | $ | — | $ | — | $ | — | ||||||
Total | $ | — | $ | — | $ | — | ||||||
Derivative instruments not designated as hedges: | ||||||||||||
Foreign exchange contracts (b) | $ | 1,825 | $ | (793 | ) | $ | (144 | ) | ||||
Total | $ | 1,825 | $ | (793 | ) | $ | (144 | ) | ||||
61
ARROW ELECTRONICS, INC.
NOTES TO THE CONSOLIDATED FINANCIAL STATEMENTS
(Dollars in thousands except per share data)
Cash Flow Hedges | ||||||||
Interest Rate Swaps (c) | Foreign Exchange Contracts (d) | |||||||
2015 | ||||||||
Effective portion: | ||||||||
Gain (loss) recognized in other comprehensive income | $ | 827 | $ | (1,001 | ) | |||
Gain (loss) reclassified into income | $ | (592 | ) | $ | 2,930 | |||
Ineffective portion: | ||||||||
Gain recognized in income | $ | 69 | $ | — | ||||
2014 | ||||||||
Effective portion: | ||||||||
Gain recognized in other comprehensive income | $ | — | $ | 412 | ||||
Loss reclassified into income | $ | (656 | ) | $ | (402 | ) | ||
Ineffective portion: | ||||||||
Gain (loss) recognized in income | $ | — | $ | — | ||||
2013 | ||||||||
Effective portion: | ||||||||
Gain (loss) recognized in other comprehensive income | $ | 3,132 | $ | (243 | ) | |||
Gain (loss) reclassified into income | $ | (537 | ) | $ | 439 | |||
Ineffective portion: | ||||||||
Gain recognized in income | $ | 292 | $ | — | ||||
(a) | The amount of gain (loss) recognized in income on derivatives is recorded in "Interest and other financing expense, net" in the company's consolidated statements of operations. |
(b) | The amount of gain (loss) recognized in income on derivatives is recorded in "Cost of sales" in the company's consolidated statements of operations. |
(c) | Both the effective and ineffective portions of any gain (loss) reclassified or recognized in income are recorded in "Interest and other financing expense, net" in the company's consolidated statements of operations. The gain (loss) amounts reclassified into income relate to the termination of swaps. |
(d) | Both the effective and ineffective portions of any gain (loss) reclassified or recognized in income are recorded in "Cost of sales" in the company's consolidated statements of operations. |
Contingent Consideration
The company estimates the fair value of contingent consideration as the present value of the expected contingent payments, determined using the weighted probability of possible payments. The company reassesses the fair value of contingent consideration on a quarterly basis. At December 31, 2015, contingent consideration of $3,889 was included in "Accrued Expenses" in the company's consolidated balance sheet in connection with two acquisitions prior to 2015. There was no contingent consideration recorded in connection with the 2015 acquisitions. For the acquisitions prior to 2015, payment of a portion of the respective purchase price is contingent upon the achievement of certain operating results, with a maximum possible payout of $8,400 in 2016. A twenty percent increase or decrease in projected operating performance over the remaining performance period would not result in a material change in the fair value of the contingent consideration recorded as of December 31, 2015.
62
ARROW ELECTRONICS, INC.
NOTES TO THE CONSOLIDATED FINANCIAL STATEMENTS
(Dollars in thousands except per share data)
Other
The carrying amount of cash and cash equivalents, accounts receivable, net, and accounts payable approximate their fair value due to the short maturities of these financial instruments.
8. Income Taxes
The provision for income taxes for the years ended December 31 consists of the following:
2015 | 2014 | 2013 | |||||||||
Current: | |||||||||||
Federal | $ | 82,532 | $ | 101,857 | $ | 85,173 | |||||
State | 18,022 | 20,123 | 15,845 | ||||||||
International | 85,310 | 88,707 | 81,052 | ||||||||
185,864 | 210,687 | 182,070 | |||||||||
Deferred: | |||||||||||
Federal | 12,127 | (1,097 | ) | 22,973 | |||||||
State | (1,828 | ) | (2,071 | ) | 2,438 | ||||||
International | (4,466 | ) | (22,576 | ) | (25,138 | ) | |||||
5,833 | (25,744 | ) | 273 | ||||||||
$ | 191,697 | $ | 184,943 | $ | 182,343 | ||||||
The principal causes of the difference between the U.S. federal statutory tax rate of 35% and effective income tax rates for the years ended December 31 are as follows:
2015 | 2014 | 2013 | |||||||||
United States | $ | 281,579 | $ | 317,400 | $ | 326,990 | |||||
International | 410,604 | 365,933 | 255,229 | ||||||||
Income before income taxes | $ | 692,183 | $ | 683,333 | $ | 582,219 | |||||
Provision at statutory tax rate | $ | 242,264 | $ | 239,166 | $ | 203,777 | |||||
State taxes, net of federal benefit | 10,526 | 11,734 | 11,885 | ||||||||
International effective tax rate differential | (56,132 | ) | (56,865 | ) | (22,059 | ) | |||||
Change in valuation allowance | (205 | ) | (7,803 | ) | (8,253 | ) | |||||
Other non-deductible expenses | 3,530 | 4,040 | 2,840 | ||||||||
Changes in tax accruals | (7,423 | ) | 1,335 | (1,336 | ) | ||||||
Other | (863 | ) | (6,664 | ) | (4,511 | ) | |||||
Provision for income taxes | $ | 191,697 | $ | 184,943 | $ | 182,343 | |||||
During 2013, the company recorded an increase in the provision for income taxes, inclusive of penalties, of $20,809 ($.20 per share on both a basic and diluted basis) and interest expense of $1,623 ($1,236 net of related taxes or $.01 per share on both a basic and diluted basis) relating to the settlement of certain international tax matters.
At December 31, 2015, the company had a liability for unrecognized tax benefits of $36,935 (substantially all of which, if recognized, would favorably affect the company's effective tax rate), of which approximately $525 is expected to be paid over the next twelve months. The company does not believe there will be any other material changes in its unrecognized tax positions over the next twelve months.
63
ARROW ELECTRONICS, INC.
NOTES TO THE CONSOLIDATED FINANCIAL STATEMENTS
(Dollars in thousands except per share data)
A reconciliation of the beginning and ending amount of unrecognized tax benefits for the years ended December 31 is as follows:
2015 | 2014 | 2013 | |||||||||
Balance at beginning of year | $ | 44,701 | $ | 45,987 | $ | 46,980 | |||||
Additions based on tax positions taken during a prior period | 2,568 | 3,792 | 22,170 | ||||||||
Reductions based on tax positions taken during a prior period | (9,482 | ) | (7,737 | ) | (3,684 | ) | |||||
Additions based on tax positions taken during the current period | 8,440 | 5,518 | 7,593 | ||||||||
Reductions related to settlement of tax matters | (4,143 | ) | (317 | ) | (24,450 | ) | |||||
Reductions related to a lapse of applicable statute of limitations | (5,149 | ) | (2,542 | ) | (2,622 | ) | |||||
Balance at end of year | $ | 36,935 | $ | 44,701 | $ | 45,987 | |||||
Interest costs related to unrecognized tax benefits are classified as a component of "Interest and other financing expense, net" in the company's consolidated statements of operations. In 2015, 2014, and 2013 the company recognized $(3,247), $1,570, and $267, respectively, of interest expense related to unrecognized tax benefits. At December 31, 2015 and 2014, the company had a liability for the payment of interest of $8,878 and $12,173, respectively, related to unrecognized tax benefits.
In many cases the company's uncertain tax positions are related to tax years that remain subject to examination by tax authorities. The following describes the open tax years, by major tax jurisdiction, as of December 31, 2015:
United States - Federal | 2012 - present | |
United States - States | 2008 - present | |
Germany (a) | 2010 - present | |
Hong Kong | 2009 - present | |
Italy (a) | 2008 - present | |
Sweden | 2010 - present | |
United Kingdom | 2013 - present | |
(a) Includes federal as well as local jurisdictions.
Deferred income taxes are provided for the effects of temporary differences between the tax basis of an asset or liability and its reported amount in the consolidated balance sheets. These temporary differences result in taxable or deductible amounts in future years.
64
ARROW ELECTRONICS, INC.
NOTES TO THE CONSOLIDATED FINANCIAL STATEMENTS
(Dollars in thousands except per share data)
The significant components of the company's deferred tax assets and liabilities, included primarily in "Other current assets," "Other assets," "Accrued expenses," and "Other liabilities" in the company's consolidated balance sheets, consist of the following at December 31:
2015 | 2014 | ||||||
Deferred tax assets: | |||||||
Net operating loss carryforwards | $ | 102,005 | $ | 113,414 | |||
Inventory adjustments | 48,467 | 42,635 | |||||
Allowance for doubtful accounts | 13,371 | 16,055 | |||||
Accrued expenses | 43,044 | 44,369 | |||||
Interest carryforward | 26,051 | 34,558 | |||||
Stock-based compensation awards | 26,911 | 22,819 | |||||
Other comprehensive income items | 16,232 | 19,885 | |||||
Integration and restructuring | 4,117 | 2,737 | |||||
Other | 7,892 | — | |||||
288,090 | 296,472 | ||||||
Valuation allowance | (8,149 | ) | (8,353 | ) | |||
Total deferred tax assets | $ | 279,941 | $ | 288,119 | |||
Deferred tax liabilities: | |||||||
Goodwill | $ | (113,788 | ) | $ | (81,716 | ) | |
Depreciation | (83,291 | ) | (78,151 | ) | |||
Intangible assets | (31,481 | ) | (30,372 | ) | |||
Other | — | (1,654 | ) | ||||
Total deferred tax liabilities | $ | (228,560 | ) | $ | (191,893 | ) | |
Total net deferred tax assets | $ | 51,381 | $ | 96,226 | |||
At December 31, 2015, the company had international tax loss carryforwards of approximately $282,026, of which $8,089 have expiration dates ranging from 2016 to 2034, and the remaining $273,937 have no expiration date. Deferred tax assets related to these international tax loss carryforwards were $85,637 with a corresponding valuation allowance of $3,697.
The company also has Federal net operating loss carryforwards of approximately $38,643 at December 31, 2015 which relate to acquired subsidiaries. These Federal net operating losses expire in various years beginning after 2020. The company has an agreement with the sellers of an acquired business to reimburse them for the company's utilization of certain Federal net operating loss carryforwards.
Valuation allowances reflect the deferred tax benefits that management is uncertain of the ability to utilize in the future.
Cumulative undistributed earnings of international subsidiaries were $3,286,018 at December 31, 2015. No deferred Federal income taxes were provided for the undistributed earnings as they are permanently reinvested in the company's international operations.
Income taxes paid, net of income taxes refunded, amounted to $182,668, $223,909, and $235,102 in 2015, 2014, and 2013, respectively.
9. Restructuring, Integration, and Other Charges
In 2015, 2014, and 2013, the company recorded restructuring, integration, and other charges of $68,765 ($51,305 net of related taxes or $.54 per share on both a basic and diluted basis), $39,841 ($29,324 net of related taxes or $.30 and $.29 per share on a
65
ARROW ELECTRONICS, INC.
NOTES TO THE CONSOLIDATED FINANCIAL STATEMENTS
(Dollars in thousands except per share data)
basic and diluted basis, respectively), and $92,650 ($65,601 net of related taxes or $.64 and $.63 per share on a basic and diluted basis, respectively), respectively.
The following table presents the components of the restructuring, integration, and other charges for the years ended December 31:
2015 | 2014 | 2013 | ||||||||||
Restructuring and integration charge - current period actions | $ | 39,119 | $ | 38,347 | $ | 79,921 | ||||||
Restructuring and integration charges - actions taken in prior periods | 4,084 | 1,130 | 794 | |||||||||
Acquisition-related expenses and other charges | 25,562 | 364 | 11,935 | |||||||||
$ | 68,765 | $ | 39,841 | $ | 92,650 | |||||||
2015 Restructuring and Integration Charge
The following table presents the components of the 2015 restructuring and integration charge of $39,119 and activity in the related restructuring and integration accrual for 2015:
Personnel Costs | Facilities Costs | Other | Total | |||||||||||||
Restructuring and integration charge | $ | 33,850 | $ | 4,223 | $ | 1,046 | $ | 39,119 | ||||||||
Payments | (17,569 | ) | (3,335 | ) | (204 | ) | (21,108 | ) | ||||||||
Non-cash usage | — | (482 | ) | (679 | ) | (1,161 | ) | |||||||||
Foreign currency translation | 40 | (3 | ) | (4 | ) | 33 | ||||||||||
Balance as of December 31, 2015 | $ | 16,321 | $ | 403 | $ | 159 | $ | 16,883 | ||||||||
The restructuring and integration charge of $39,119 in 2015 includes personnel costs of $33,850, facilities costs of $4,223, and other costs of $1,046. These restructuring initiatives are due to the company's continued efforts to lower cost and drive operational efficiency. Integration costs are primarily related to the integration of acquired businesses within the company's pre-existing business and the consolidation of certain operations.
2014 Restructuring and Integration Charge
The following table presents the components of the 2014 restructuring and integration charge of $38,347 and activity in the related restructuring and integration accrual for 2014 and 2015:
Personnel Costs | Facilities Costs | Other | Total | |||||||||||||
Restructuring and integration charge | $ | 29,268 | $ | 5,591 | $ | 3,488 | $ | 38,347 | ||||||||
Payments | (20,172 | ) | (3,082 | ) | (1,511 | ) | (24,765 | ) | ||||||||
Non-cash usage | — | — | (729 | ) | (729 | ) | ||||||||||
Foreign currency translation | (474 | ) | (30 | ) | (1 | ) | (505 | ) | ||||||||
Balance as of December 31, 2014 | 8,622 | 2,479 | 1,247 | 12,348 | ||||||||||||
Restructuring and integration charge | 180 | 885 | 1,915 | 2,980 | ||||||||||||
Payments | (6,688 | ) | (1,955 | ) | (1,140 | ) | (9,783 | ) | ||||||||
Non-cash usage | — | (252 | ) | (2,022 | ) | (2,274 | ) | |||||||||
Foreign currency translation | (558 | ) | (90 | ) | — | (648 | ) | |||||||||
Balance as of December 31, 2015 | $ | 1,556 | $ | 1,067 | $ | — | $ | 2,623 | ||||||||
66
ARROW ELECTRONICS, INC.
NOTES TO THE CONSOLIDATED FINANCIAL STATEMENTS
(Dollars in thousands except per share data)
The restructuring and integration charge of $38,347 in 2014 includes personnel costs of $29,268, facilities costs of $5,591, and other costs of $3,488. These restructuring initiatives are due to the company's continued efforts to lower cost and drive operational efficiency. Integration costs are primarily related to the integration of acquired businesses within the company's pre-existing business and the consolidation of certain operations.
Restructuring and Integration Accruals Related to Actions Taken Prior to 2014
Included in restructuring, integration, and other charges for 2015 are restructuring and integration charges and other charges of $1,104 related to restructuring and integration actions taken prior to 2014. The restructuring and integration charge includes adjustments to personnel costs of $(451) and facilities costs of $1,555. The restructuring and integration accruals related to actions taken prior to 2014 of $2,472, include accruals for personnel costs of $1,198, and accruals for facilities costs of $1,274.
Restructuring and Integration Accrual Summary
In summary, the restructuring and integration accruals aggregate $21,978 at December 31, 2015, all of which are expected to be spent in cash, and are expected to be utilized as follows:
• | The accruals for personnel costs totaling $19,075 relate to the termination of personnel that have scheduled payouts of $18,757 in 2016 and $318 in 2017. |
• | The accruals for facilities totaling $2,744 relate to vacated leased properties that have scheduled payments of $2,402 in 2017, $190 in 2018, and $152 in 2019. |
• | Other accruals of $159 are expected to be spent within one year. |
Acquisition-Related Expenses and Other Charges
Included in restructuring, integration, and other charges for 2015 are acquisition-related expenses of $19,565, primarily consisting of charges related to contingent consideration for acquisitions completed in prior years which were conditional upon the financial performance of the acquired companies and the continued employment of the selling shareholders, as well as professional and other fees directly related to recent acquisition activity.
Included in restructuring, integration, and other charges for 2014 are acquisition-related expenses of $364, primarily consisting of changes in the fair value of contingent consideration and professional fees directly related to acquisition activity, offset in part, by an insurance recovery related to environmental matters in connection with the Wyle Electronics ("Wyle") acquisition.
Included in restructuring, integration, and other charges for 2013 are acquisition-related expenses of $11,935, primarily consisting of charges related to contingent consideration for acquisitions completed in prior years which were conditional upon the financial performance of the acquired companies and the continued employment of the selling shareholders, as well as professional fees directly related to acquisition activity.
67
ARROW ELECTRONICS, INC.
NOTES TO THE CONSOLIDATED FINANCIAL STATEMENTS
(Dollars in thousands except per share data)
10. Shareholders' Equity
Accumulated Other Comprehensive Income (Loss)
The following table presents the changes in Accumulated other comprehensive income (loss), excluding non-controlling interests:
Foreign Currency Translation Adjustment | Unrealized Gain (Loss) on Investment Securities, Net | Unrealized Gain (Loss) on Interest Rate Swaps Designated as Cash Flow Hedges, Net | Employee Benefit Plan Items, Net | Total | ||||||||||||||||
Balance as of December 31, 2013 | $ | 248,425 | $ | 20,644 | $ | (4,594 | ) | $ | (38,923 | ) | $ | 225,552 | ||||||||
Other comprehensive income (loss) before reclassifications (a) | (265,432 | ) | 5,344 | — | (14,630 | ) | (274,718 | ) | ||||||||||||
Amounts reclassified into income (loss) | 402 | (18,269 | ) | 403 | 2,013 | (15,451 | ) | |||||||||||||
Net change in accumulated other comprehensive income (loss) for the year ended December 31, 2014 | (265,030 | ) | (12,925 | ) | 403 | (12,617 | ) | (290,169 | ) | |||||||||||
Balance as of December 31, 2014 | (16,605 | ) | 7,719 | (4,191 | ) | (51,540 | ) | (64,617 | ) | |||||||||||
Other comprehensive income (loss) before reclassifications (a) | (221,791 | ) | 814 | 550 | 15 | (220,412 | ) | |||||||||||||
Amounts reclassified into income | (2,930 | ) | — | 321 | 2,932 | 323 | ||||||||||||||
Net change in accumulated other comprehensive income (loss) for the year ended December 31, 2015 | (224,721 | ) | 814 | 871 | 2,947 | (220,089 | ) | |||||||||||||
Balance as of December 31, 2015 | $ | (241,326 | ) | $ | 8,533 | $ | (3,320 | ) | $ | (48,593 | ) | $ | (284,706 | ) | ||||||
(a) | Foreign currency translation adjustment includes intra-entity foreign currency transactions that are of a long-term investment nature of $30,960 and $57,109 for 2015 and 2014, respectively. |
Common Stock Outstanding Activity
The following table sets forth the activity in the number of shares outstanding (in thousands):
Common Stock Issued | Treasury Stock | Common Stock Outstanding | |||||||
Common stock outstanding at December 31, 2012 | 125,424 | 19,423 | 106,001 | ||||||
Shares issued for stock-based compensation awards | — | (2,772 | ) | 2,772 | |||||
Repurchases of common stock | — | 8,837 | (8,837 | ) | |||||
Common stock outstanding at December 31, 2013 | 125,424 | 25,488 | 99,936 | ||||||
Shares issued for stock-based compensation awards | — | (1,506 | ) | 1,506 | |||||
Repurchases of common stock | — | 5,547 | (5,547 | ) | |||||
Common stock outstanding at December 31, 2014 | 125,424 | 29,529 | 95,895 | ||||||
Shares issued for stock-based compensation awards | — | (1,155 | ) | 1,155 | |||||
Repurchases of common stock | — | 6,127 | (6,127 | ) | |||||
Common stock outstanding at December 31, 2015 | 125,424 | 34,501 | 90,923 | ||||||
The company has 2,000,000 authorized shares of serial preferred stock with a par value of one dollar. There were no shares of serial preferred stock outstanding at December 31, 2015 and 2014.
68
ARROW ELECTRONICS, INC.
NOTES TO THE CONSOLIDATED FINANCIAL STATEMENTS
(Dollars in thousands except per share data)
Share-Repurchase Programs
During 2014, the company's Board of Directors (the "Board") approved the repurchase of up to $400,000 ($200,000 in May and December, respectively) of the company's common stock through a share-repurchase program. In September 2015, the company's Board approved an additional repurchase of up to $400,000 of the company's common stock. As of December 31, 2015, the company repurchased 8,474,574 shares under these programs with a market value of $480,217 at the dates of repurchase, of which 2,617,991 shares with a market value of $149,631 were repurchased during the fourth quarter of 2015.
11. Net Income Per Share
The following table presents the computation of net income per share on a basic and diluted basis for the years ended December 31 (shares in thousands):
2015 | 2014 | 2013 | ||||||||||
Net income attributable to shareholders | $ | 497,726 | $ | 498,045 | $ | 399,420 | ||||||
Weighted-average shares outstanding - basic | 94,608 | 98,675 | 102,559 | |||||||||
Net effect of various dilutive stock-based compensation awards | 1,078 | 1,272 | 1,140 | |||||||||
Weighted-average shares outstanding - diluted | 95,686 | 99,947 | 103,699 | |||||||||
Net income per share: | ||||||||||||
Basic | $ | 5.26 | $ | 5.05 | $ | 3.89 | ||||||
Diluted (a) | $ | 5.20 | $ | 4.98 | $ | 3.85 | ||||||
(a) | Stock-based compensation awards for the issuance of 658 shares, 294 shares, and 874 shares for the years ended December 31, 2015, 2014, and 2013, respectively, were excluded from the computation of net income per share on a diluted basis as their effect was anti-dilutive. |
12. Employee Stock Plans
Omnibus Plan
The company maintains the Arrow Electronics, Inc. 2004 Omnibus Incentive Plan (the "Omnibus Plan"), which provides an array of equity alternatives available to the company when designing compensation incentives. The Omnibus Plan permits the grant of cash-based awards, non-qualified stock options, incentive stock options ("ISOs"), stock appreciation rights, restricted stock, restricted stock units, performance shares, performance units, covered employee annual incentive awards, and other stock-based awards. The Compensation Committee of the company's Board of Directors (the "Compensation Committee") determines the vesting requirements, termination provision, and the terms of the award for any awards under the Omnibus Plan when such awards are issued.
Under the terms of the Omnibus Plan, a maximum of 21,800,000 shares of common stock may be awarded, subject to adjustment. In October 2015, the company registered an additional 5,600,000 shares of common stock reserved for issuance pursuant to the Omnibus Plan. There were 7,553,173 and 3,228,748 shares available for grant under the Omnibus Plan as of December 31, 2015 and 2014, respectively. Generally, shares are counted against the authorization only to the extent that they are issued. Restricted stock, restricted stock units, performance shares, and performance units count against the authorization at a rate of 1.69 to 1.
Stock Options
Under the Omnibus Plan, the company may grant both ISOs and non-qualified stock options. ISOs may only be granted to employees of the company, its subsidiaries, and its affiliates. The exercise price for options cannot be less than the fair market value of Arrow's common stock on the date of grant. Options generally become exercisable in equal installments over a four-year period. Options currently outstanding have terms of ten years.
69
ARROW ELECTRONICS, INC.
NOTES TO THE CONSOLIDATED FINANCIAL STATEMENTS
(Dollars in thousands except per share data)
The following information relates to the stock option activity for the year ended December 31, 2015:
Shares | Weighted- Average Exercise Price | Weighted- Average Remaining Contractual Life | Aggregate Intrinsic Value | ||||||||||
Outstanding at December 31, 2014 | 1,860,693 | $ | 40.67 | ||||||||||
Granted | 402,612 | 62.14 | |||||||||||
Exercised | (408,559 | ) | 36.47 | ||||||||||
Forfeited | (41,548 | ) | 44.63 | ||||||||||
Outstanding at December 31, 2015 | 1,813,198 | 46.29 | 78 | months | $ | 18,435 | |||||||
Exercisable at December 31, 2015 | 869,317 | 37.64 | 57 | months | $ | 14,598 | |||||||
The aggregate intrinsic value in the table above represents the total pre-tax intrinsic value (the difference between the company's closing stock price on the last trading day of 2015 and the exercise price, multiplied by the number of in-the-money options) received by the option holders had all option holders exercised their options on December 31, 2015. This amount changes based on the market value of the company's stock.
The total intrinsic value of options exercised during 2015, 2014, and 2013 was $10,400, $15,360, and $16,345, respectively.
Cash received from option exercises during 2015, 2014, and 2013 was $14,900, $21,788, and $36,014, respectively, and is included within the financing activities section in the company's consolidated statements of cash flows. The actual tax benefit realized from share-based payment awards during 2015, 2014, and 2013 was $16,593, $18,718, and $21,882, respectively.
The fair value of stock options was estimated using the Black-Scholes valuation model with the following weighted-average assumptions for the years ended December 31:
2015 | 2014 | 2013 | ||||||
Volatility (percent) (a) | 28 | 37 | 41 | |||||
Expected term (in years) (b) | 4.8 | 5.3 | 5.4 | |||||
Risk-free interest rate (percent) (c) | 1.5 | 1.6 | 1.0 | |||||
(a) | Volatility is measured using historical daily price changes of the company's common stock over the expected term of the option. |
(b) | The expected term represents the weighted-average period the option is expected to be outstanding and is based primarily on the historical exercise behavior of employees. |
(c) | The risk-free interest rate is based on the U.S. Treasury zero-coupon yield with a maturity that approximates the expected term of the option. |
There is no expected dividend yield.
The weighted-average fair value per option granted was $19.10, $20.32, and $15.83 during 2015, 2014, and 2013, respectively.
Performance Awards
The Compensation Committee, subject to the terms and conditions of the Omnibus Plan, may grant performance share and/or performance unit awards (collectively "performance awards"). The fair value of a performance award is the fair market value of the company's common stock on the date of grant. Such awards will be earned only if performance goals over performance periods established by or under the direction of the Compensation Committee are met. The performance goals and periods may vary from participant-to-participant, group-to-group, and time-to-time. The performance awards will be delivered in common stock at the
70
ARROW ELECTRONICS, INC.
NOTES TO THE CONSOLIDATED FINANCIAL STATEMENTS
(Dollars in thousands except per share data)
end of the service period based on the company's actual performance compared to the target metric and may be from 0% to 175% of the initial award. Compensation expense is recognized using the graded vesting method over the three-year service period and is adjusted each period based on the current estimate of performance compared to the target metric.
Restricted Stock
Subject to the terms and conditions of the Omnibus Plan, the Compensation Committee may grant shares of restricted stock and/or restricted stock units. Restricted stock units are similar to restricted stock except that no shares are actually awarded to the participant on the date of grant. Shares of restricted stock and/or restricted stock units awarded under the Omnibus Plan may not be sold, transferred, pledged, assigned, or otherwise alienated or hypothecated until the end of the applicable period of restriction established by the Compensation Committee and specified in the award agreement (and in the case of restricted stock units until the date of delivery or other payment). Compensation expense is recognized on a straight-line basis as shares become free of forfeiture restrictions (i.e., vest) generally over a four-year period.
Non-Employee Director Awards
The company's Board shall set the amounts and types of equity awards that shall be granted to all non-employee directors on a periodic, nondiscriminatory basis pursuant to the Omnibus Plan, as well as any additional amounts, if any, to be awarded, also on a periodic, nondiscriminatory basis, based on each of the following: the number of committees of the Board on which a non-employee director serves, service of a non-employee director as the chair of a Committee of the Board, service of a non-employee director as Chairman of the Board or Lead Director, or the first selection or appointment of an individual to the Board as a non-employee director. Non-employee directors currently receive annual awards of fully-vested restricted stock units valued at $130. All restricted stock units are settled in common stock following the director's separation from the Board.
Unless a non-employee director gives notice setting forth a different percentage, 50% of each director's annual retainer fee is deferred and converted into units based on the fair market value of the company's stock as of the date it was payable. Upon a non-employee director's termination of Board service, each unit in their deferral account will be converted into a share of company stock and distributed to the non-employee director as soon as practicable following such date.
Summary of Non-Vested Shares
The following information summarizes the changes in non-vested performance shares, performance units, restricted stock, and restricted stock units for 2015:
Shares | Weighted- Average Grant Date Fair Value | |||||
Non-vested shares at December 31, 2014 | 1,764,272 | $ | 45.78 | |||
Granted | 615,091 | 58.68 | ||||
Vested | (770,453 | ) | 42.14 | |||
Forfeited | (76,648 | ) | 59.72 | |||
Non-vested shares at December 31, 2015 | 1,532,262 | 52.09 | ||||
The total fair value of shares vested during 2015, 2014, and 2013 was $48,118, $47,583, and $59,876, respectively.
As of December 31, 2015, there was $43,084 of total unrecognized compensation cost related to non-vested shares and stock options which is expected to be recognized over a weighted-average period of 2.17 years.
71
ARROW ELECTRONICS, INC.
NOTES TO THE CONSOLIDATED FINANCIAL STATEMENTS
(Dollars in thousands except per share data)
13. Employee Benefit Plans
The company maintains an unfunded Arrow supplemental executive retirement plan ("SERP") under which the company will pay supplemental pension benefits to certain employees upon retirement. As of December 31, 2015, there were 8 current and 20 former corporate officers participating in this plan. The Board determines those employees who are eligible to participate in the Arrow SERP.
The Arrow SERP, as amended, provides for the pension benefits to be based on a percentage of average final compensation, based on years of participation in the Arrow SERP. The Arrow SERP permits early retirement, with payments at a reduced rate, based on age and years of service subject to a minimum retirement age of 55. Participants whose accrued rights under the Arrow SERP, prior to the 2002 amendment, which were adversely affected by the amendment, will continue to be entitled to such greater rights.
Additionally, as part of the company's acquisition of Wyle in 2000, Wyle provided retirement benefits for certain employees under a defined benefit plan. Benefits under this plan were frozen as of December 31, 2000.
72
ARROW ELECTRONICS, INC.
NOTES TO THE CONSOLIDATED FINANCIAL STATEMENTS
(Dollars in thousands except per share data)
The company uses a December 31 measurement date for the Arrow SERP and the Wyle defined benefit plan. Pension information for the year ended December 31 is as follows:
Arrow SERP | Wyle Defined Benefit Plan | ||||||||||||||
2015 | 2014 | 2015 | 2014 | ||||||||||||
Accumulated benefit obligation | $ | 83,310 | $ | 76,261 | $ | 129,029 | $ | 136,298 | |||||||
Changes in projected benefit obligation: | |||||||||||||||
Projected benefit obligation at beginning of year | $ | 85,114 | $ | 75,312 | $ | 136,298 | $ | 126,481 | |||||||
Service cost | 1,669 | 1,330 | — | — | |||||||||||
Interest cost | 3,484 | 3,280 | 5,318 | 5,491 | |||||||||||
Actuarial loss (gain) | 2,220 | 8,668 | (6,571 | ) | 10,206 | ||||||||||
Benefits paid | (3,758 | ) | (3,476 | ) | (6,016 | ) | (5,880 | ) | |||||||
Projected benefit obligation at end of year | $ | 88,729 | $ | 85,114 | $ | 129,029 | $ | 136,298 | |||||||
Changes in plan assets: | |||||||||||||||
Fair value of plan assets at beginning of year | $ | — | $ | — | $ | 105,598 | $ | 104,714 | |||||||
Actual return on plan assets | — | — | 2,277 | 2,264 | |||||||||||
Company contributions | — | — | — | 4,500 | |||||||||||
Benefits paid | — | — | (6,016 | ) | (5,880 | ) | |||||||||
Fair value of plan assets at end of year | $ | — | $ | — | $ | 101,859 | $ | 105,598 | |||||||
Funded status | $ | (88,729 | ) | $ | (85,114 | ) | $ | (27,170 | ) | $ | (30,700 | ) | |||
Amounts recognized in the company's consolidated balance sheets: | |||||||||||||||
Current liabilities | $ | (3,816 | ) | $ | (3,700 | ) | $ | — | $ | — | |||||
Noncurrent liabilities | (84,913 | ) | (81,414 | ) | (27,170 | ) | (30,700 | ) | |||||||
Net liabilities at end of year | $ | (88,729 | ) | $ | (85,114 | ) | $ | (27,170 | ) | $ | (30,700 | ) | |||
Components of net periodic pension cost: | |||||||||||||||
Service cost | $ | 1,669 | $ | 1,330 | $ | — | $ | — | |||||||
Interest cost | 3,484 | 3,280 | 5,318 | 5,491 | |||||||||||
Expected return on plan assets | — | — | (7,159 | ) | (7,066 | ) | |||||||||
Amortization of net loss | 3,615 | 1,997 | 1,668 | 1,270 | |||||||||||
Amortization of prior service cost | 25 | 42 | — | — | |||||||||||
Net periodic pension cost | $ | 8,793 | $ | 6,649 | $ | (173 | ) | $ | (305 | ) | |||||
Weighted-average assumptions used to determine benefit obligation: | |||||||||||||||
Discount rate | 4.00 | % | 4.00 | % | 4.25 | % | 4.00 | % | |||||||
Rate of compensation increase | 5.00 | % | 5.00 | % | N/A | N/A | |||||||||
Expected return on plan assets | N/A | N/A | 6.25 | % | 6.75 | % | |||||||||
Weighted-average assumptions used to determine net periodic pension cost: | |||||||||||||||
Discount rate | 4.00 | % | 4.50 | % | 4.00 | % | 4.50 | % | |||||||
Rate of compensation increase | 5.00 | % | 5.00 | % | N/A | N/A | |||||||||
Expected return on plan assets | N/A | N/A | 6.75 | % | 6.75 | % | |||||||||
The amounts reported for net periodic pension cost and the respective benefit obligation amounts are dependent upon the actuarial assumptions used. The company reviews historical trends, future expectations, current market conditions, and external data to determine the assumptions. The discount rate represents the market rate for a high-quality corporate bond. The rate of compensation increase is determined by the company, based upon its long-term plans for such increases. The expected return on plan assets is
73
ARROW ELECTRONICS, INC.
NOTES TO THE CONSOLIDATED FINANCIAL STATEMENTS
(Dollars in thousands except per share data)
based on current and expected asset allocations, historical trends, and projected returns on those assets. The actuarial assumptions used to determine the net periodic pension cost are based upon the prior year's assumptions used to determine the benefit obligation.
Benefit payments are expected to be paid as follows:
Arrow SERP | Wyle Defined Benefit Plan | ||||||
2016 | $ | 3,885 | $ | 6,918 | |||
2017 | 3,853 | 7,019 | |||||
2018 | 4,365 | 7,073 | |||||
2019 | 5,729 | 7,249 | |||||
2020 | 5,689 | 7,429 | |||||
2021-2025 | 29,531 | 38,759 | |||||
The company makes contributions to the Wyle defined benefit plan so that minimum contribution requirements, as determined by government regulations, are met. The company made contributions of $0 and $4,500 in 2015 and 2014, respectively. The company does not expect to make contributions in 2016.
The fair values of the company's pension plan assets for the Wyle defined benefit plan at December 31, 2015, utilizing the fair value hierarchy discussed in Note 7, are as follows:
Level 1 | Level 2 | Level 3 | Total | ||||||||||||
Equities: | |||||||||||||||
U.S. common stocks | $ | 40,757 | $ | — | $ | — | $ | 40,757 | |||||||
International mutual funds | 14,750 | — | — | 14,750 | |||||||||||
Index mutual funds | 13,812 | — | — | 13,812 | |||||||||||
Fixed Income: | |||||||||||||||
Mutual funds | 29,345 | — | — | 29,345 | |||||||||||
Insurance contracts | — | 3,195 | — | 3,195 | |||||||||||
Total | $ | 98,664 | $ | 3,195 | $ | — | $ | 101,859 | |||||||
The fair values of the company's pension plan assets for the Wyle defined benefit plan at December 31, 2014, utilizing the fair value hierarchy discussed in Note 7, are as follows:
Level 1 | Level 2 | Level 3 | Total | ||||||||||||
Equities: | |||||||||||||||
U.S. common stocks | $ | 44,100 | $ | — | $ | — | $ | 44,100 | |||||||
International mutual funds | 14,873 | — | — | 14,873 | |||||||||||
Index mutual funds | 16,477 | — | — | 16,477 | |||||||||||
Fixed Income: | |||||||||||||||
Mutual funds | 29,134 | — | — | 29,134 | |||||||||||
Insurance contracts | — | 1,014 | — | 1,014 | |||||||||||
Total | $ | 104,584 | $ | 1,014 | $ | — | $ | 105,598 | |||||||
The investment portfolio contains a diversified blend of common stocks, bonds, cash equivalents, and other investments, which may reflect varying rates of return. The investments are further diversified within each asset classification. The portfolio diversification provides protection against a single security or class of securities having a disproportionate impact on aggregate performance. The long-term target allocations for plan assets are 65% in equities and 35% in fixed income, although the actual
74
ARROW ELECTRONICS, INC.
NOTES TO THE CONSOLIDATED FINANCIAL STATEMENTS
(Dollars in thousands except per share data)
plan asset allocations may be within a range around these targets. The actual asset allocations are reviewed and rebalanced on a periodic basis to maintain the target allocations.
Comprehensive Income Items
In 2015, 2014, and 2013, actuarial (gains) losses of $185, $14,901, and $(7,615), respectively, were recognized in comprehensive income, net of related taxes, related to the company's defined benefit plans. In 2015, 2014, and 2013, the following amounts were recognized as a reclassification adjustment of comprehensive income, net of related taxes, as a result of being recognized in net periodic pension cost: prior service cost of $15, $19, and $19, respectively and an actuarial loss of $3,282, $1,994, and $2,854, respectively.
Included in accumulated other comprehensive income (loss) at December 31, 2015 and 2014 are the following amounts, net of related taxes, that have not yet been recognized in net periodic pension cost: unrecognized prior service costs (credits) of $0 and $(12), respectively, and unrecognized actuarial losses of $46,725 and $49,491, respectively.
The prior service cost and actuarial loss included in accumulated other comprehensive income (loss), net of related taxes, which are expected to be recognized in net periodic pension cost for the year ended December 31, 2016 are $0 and $3,123, respectively.
Defined Contribution Plan
The company has defined contribution plans for eligible employees, which qualify under Section 401(k) of the Internal Revenue Code. The company's contribution to the plans, which are based on a specified percentage of employee contributions, amounted to $13,604, $12,584, and $14,102 in 2015, 2014, and 2013, respectively. The company made discretionary contributions to the company's defined benefit 401(k) plan, which amounted to $7,151, $7,139, and $7,403 in 2015, 2014, and 2013, respectively. Certain international subsidiaries maintain separate defined contribution plans for their employees and made contributions thereunder, which amounted to $26,945, $27,284, and $26,038 in 2015, 2014, and 2013, respectively.
14. Lease Commitments
The company leases certain office, distribution, and other property under non-cancelable operating leases expiring at various dates through 2026. Rental expense under non-cancelable operating leases, net of sublease income, amounted to $77,405, $77,392, and $79,966 in 2015, 2014, and 2013, respectively.
Aggregate minimum rental commitments under all non-cancelable operating leases, exclusive of real estate taxes, insurance, and leases related to facilities closed as a result of the integration of acquired businesses and the restructuring of the company, are as follows:
2016 | $ | 63,781 | ||||
2017 | 50,491 | |||||
2018 | 34,891 | |||||
2019 | 26,755 | |||||
2020 | 21,246 | |||||
Thereafter | 38,627 | |||||
15. Contingencies
Settlement of Legal Matter
In connection with the purchase of Wyle in August 2000, the company acquired certain of the then outstanding obligations of Wyle, including Wyle's indemnification obligations to the purchasers of its Wyle Laboratories division for environmental clean-up costs associated with any then existing contamination or violation of environmental regulations. Under the terms of the company's purchase of Wyle from the sellers, the sellers agreed to indemnify the company for certain costs associated with the Wyle environmental obligations, among other things. As part of the settlement agreement the company accepted responsibility for any potential subsequent costs incurred related to the Wyle matters. The company is aware of two Wyle Laboratories facilities
75
ARROW ELECTRONICS, INC.
NOTES TO THE CONSOLIDATED FINANCIAL STATEMENTS
(Dollars in thousands except per share data)
(in Huntsville, Alabama and Norco, California) at which contaminated groundwater was identified and will require environmental remediation. In addition, the company was named as a defendant in several lawsuits related to the Norco facility and a third site in El Segundo, California which have now been settled to the satisfaction of the parties.
The company expects these environmental liabilities to be resolved over an extended period of time. Costs are recorded for environmental matters when it is probable that a liability has been incurred and the amount of the liability can be reasonably estimated. Accruals for environmental liabilities are adjusted periodically as facts and circumstances change, assessment and remediation efforts progress, or as additional technical or legal information becomes available. Environmental liabilities are difficult to assess and estimate due to various unknown factors such as the timing and extent of remediation, improvements in remediation technologies, and the extent to which environmental laws and regulations may change in the future. Accordingly, the company cannot presently fully estimate the ultimate potential costs related to these sites until such time as a substantial portion of the investigation at the sites is completed and remedial action plans are developed and, in some instances implemented. To the extent that future environmental costs exceed amounts currently accrued by the company, net income would be adversely impacted and such impact could be material.
Accruals for environmental liabilities are included in "Accrued expenses" and "Other liabilities" in the company's consolidated balance sheets.
As successor-in-interest to Wyle, the company is the beneficiary of various Wyle insurance policies that covered liabilities arising out of operations at Norco and Huntsville. To date, the company has recovered approximately $37,000 from certain insurance carriers relating to environmental clean-up matters at the Norco site. The company is considering the best way to pursue its potential claims against insurers regarding liabilities arising out of operations at Huntsville. The resolution of these matters will likely take several years. The company has not recorded a receivable for any potential future insurance recoveries related to the Norco and Huntsville environmental matters, as the realization of the claims for recovery are not deemed probable at this time.
The company believes the settlement amount together with potential recoveries from various insurance policies covering environmental remediation and related litigation will be sufficient to cover any potential future costs related to the Wyle acquisition; however, it is possible unexpected costs beyond those anticipated could occur.
Environmental Matters - Huntsville
In February 2015, the company and the Alabama Department of Environmental Management ("ADEM") finalized and executed a consent decree in connection with the Huntsville, Alabama site. Characterization of the extent of contaminated soil and groundwater continues at the site. Under the direction of the ADEM, approximately $4,500 was spent to date. The pace of the ongoing remedial investigations, project management, and regulatory oversight is likely to increase somewhat and though the complete scope of the activities is not yet known, the company currently estimates additional investigative and related expenditures at the site of approximately $400 to $750. The nature and scope of both feasibility studies and subsequent remediation at the site has not yet been determined, but assuming the outcome includes source control and certain other measures, the cost is estimated to be between $3,000 and $4,000.
Despite the amount of work undertaken and planned to date, the company is unable to estimate any potential costs in addition to those discussed above because the complete scope of the work is not yet known, and, accordingly, the associated costs have yet to be determined.
Environmental Matters - Norco
In October 2003, the company entered into a consent decree with Wyle Laboratories and the California Department of Toxic Substance Control (the "DTSC") in connection with the Norco site. In April 2005, a Remedial Investigation Work Plan was approved by DTSC that provided for site-wide characterization of known and potential environmental issues. Investigations performed in connection with this work plan and a series of subsequent technical memoranda continued until the filing of a final Remedial Investigation Report early in 2008. Work is under way pertaining to the remediation of contaminated groundwater at certain areas on the Norco site and of soil gas in a limited area immediately adjacent to the site. In 2008, a hydraulic containment system was installed to capture and treat groundwater before it moves into the adjacent offsite area. In September 2013, the DTSC approved the final Remedial Action Plan ("RAP") and work is currently progressing under the RAP. The approval of the RAP includes the potential for additional remediation action after the five year review of the hydraulic containment system if the review finds that contaminants have not been sufficiently reduced in the offsite area.
76
ARROW ELECTRONICS, INC.
NOTES TO THE CONSOLIDATED FINANCIAL STATEMENTS
(Dollars in thousands except per share data)
Approximately $50,000 was spent to date on remediation, project management, regulatory oversight, and investigative and feasibility study activities. The company currently estimates that these activities will give rise to an additional $14,070 to $24,500. Project management and regulatory oversight include costs incurred by project consultants for project management and costs billed by DTSC to provide regulatory oversight.
Despite the amount of work undertaken and planned to date, the company is unable to estimate any potential costs in addition to those discussed above because the complete scope of the work under the RAP is not yet known, and, accordingly, the associated costs have yet to be determined.
Tekelec Matter
In 2000, the company purchased Tekelec Europe SA ("Tekelec") from Tekelec Airtronic SA and certain other selling shareholders. Subsequent to the closing of the acquisition, Tekelec received a product liability claim in the amount of €11,333. The product liability claim was the subject of a French legal proceeding started by the claimant in 2002, under which separate determinations were made as to whether the products that are subject to the claim were defective and the amount of damages sustained by the purchaser. The manufacturer of the products also participated in this proceeding. The claimant has commenced legal proceedings against Tekelec and its insurers to recover damages in the amount of €3,742 and expenses of €312 plus interest. In May 2012, the French court ruled in favor of Tekelec and dismissed the plaintiff's claims. In January 2015, the Court of Appeals confirmed the French court's ruling; however, the ruling remains subject to a final appeal by the plaintiff. The company believes that any amount in addition to the amount accrued by the company would not materially adversely impact the company's consolidated financial position, liquidity, or results of operations.
Antitrust Investigation
On January 21, 2014, the company received a Civil Investigative Demand in connection with an investigation by the Federal Trade Commission ("FTC") relating generally to the use of a database program (the “database program”) that has operated for more than ten years under the auspices of the Global Technology Distribution Council ("GTDC"), a trade group of which the company is a member. Under the database program, certain members of the GTDC who participate in the program provide sales data to a third party independent contractor chosen by the GTDC. The data is aggregated by the third party and the aggregated data is made available to the program participants. The company understands that other members participating in the database program have received similar Civil Investigative Demands.
In April 2014, the company responded to the Civil Investigative Demand. The Civil Investigative Demand merely sought information, and no proceedings have been instituted against any person. The company continues to believe that there has not been any conduct by the company or its employees that would be actionable under the antitrust laws in connection with its participation in the database program. Since this matter is at a preliminary stage, it is not possible to predict the potential impact, if any, of the Civil Investigative Demand or whether any actions may be instituted by the FTC against any person.
Other
From time to time, in the normal course of business, the company may become liable with respect to other pending and threatened litigation, environmental, regulatory, labor, product, and tax matters. While such matters are subject to inherent uncertainties, it is not currently anticipated that any such matters will materially impact the company's consolidated financial position, liquidity, or results of operations.
16. Segment and Geographic Information
The company is a global provider of products, services, and solutions to industrial and commercial users of electronic components and enterprise computing solutions. The company distributes electronic components to original equipment manufacturers and contract manufacturers through its global components business segment and provides enterprise computing solutions to value-added resellers through its global ECS business segment. As a result of the company's philosophy of maximizing operating efficiencies through the centralization of certain functions, selected fixed assets and related depreciation, as well as borrowings, are not directly attributable to the individual operating segments and are included in the corporate business segment.
77
ARROW ELECTRONICS, INC.
NOTES TO THE CONSOLIDATED FINANCIAL STATEMENTS
(Dollars in thousands except per share data)
Sales and operating income (loss), by segment, for the years ended December 31 are as follows:
2015 | 2014 | 2013 | |||||||||
Sales: | |||||||||||
Global components | $ | 14,405,793 | $ | 14,313,026 | $ | 13,495,766 | |||||
Global ECS | 8,876,227 | 8,455,648 | 7,861,519 | ||||||||
Consolidated | $ | 23,282,020 | $ | 22,768,674 | $ | 21,357,285 | |||||
Operating income (loss): | |||||||||||
Global components | $ | 649,396 | $ | 653,992 | $ | 575,612 | |||||
Global ECS | 424,063 | 389,571 | 350,442 | ||||||||
Corporate (a) | (248,977 | ) | (281,306 | ) | (232,554 | ) | |||||
Consolidated | $ | 824,482 | $ | 762,257 | $ | 693,500 | |||||
(a) | Includes restructuring, integration, and other charges of $68,765, $39,841, and $92,650 in 2015, 2014, and 2013, respectively. Also included is a non-cash impairment charge associated with discontinuing the use of a trade name of $78,000 in 2014. |
Total assets, by segment, at December 31 are as follows:
2015 | 2014 | |||||||
Global components | $ | 7,276,143 | $ | 6,952,342 | ||||
Global ECS | 5,074,529 | 4,761,628 | ||||||
Corporate | 671,258 | 721,331 | ||||||
Consolidated | $ | 13,021,930 | $ | 12,435,301 | ||||
Sales, by geographic area, for the years ended December 31 are as follows:
2015 | 2014 | 2013 | ||||||||||
Americas (b) | $ | 11,721,528 | $ | 11,340,277 | $ | 11,023,076 | ||||||
EMEA | 6,788,738 | 6,864,104 | 6,221,569 | |||||||||
Asia/Pacific | 4,771,754 | 4,564,293 | 4,112,640 | |||||||||
Consolidated | $ | 23,282,020 | $ | 22,768,674 | $ | 21,357,285 | ||||||
(b) | Includes sales related to the United States of $10,761,932, $10,359,936, and $10,074,361 in 2015, 2014, and 2013, respectively. |
Net property, plant, and equipment, by geographic area, is as follows:
2015 | 2014 | |||||||
Americas (c) | $ | 582,973 | $ | 537,967 | ||||
EMEA | 88,727 | 76,487 | ||||||
Asia/Pacific | 28,478 | 21,845 | ||||||
Consolidated | $ | 700,178 | $ | 636,299 | ||||
(c) | Includes net property, plant, and equipment related to the United States of $580,791 and $535,397 at December 31, 2015 and 2014, respectively. |
78
ARROW ELECTRONICS, INC.
NOTES TO THE CONSOLIDATED FINANCIAL STATEMENTS
(Dollars in thousands except per share data)
17. Quarterly Financial Data (Unaudited)
The company operates on a quarterly calendar that closes on the Saturday closest to the end of the calendar quarter, except for the third quarter of 2015, which closed on September 26, 2015.
A summary of the company's consolidated quarterly results of operations is as follows:
First Quarter | Second Quarter | Third Quarter | Fourth Quarter | ||||||||||||||
2015 | |||||||||||||||||
Sales | $ | 5,002,385 | $ | 5,829,989 | $ | 5,698,304 | $ | 6,751,342 | |||||||||
Gross profit | 685,322 | 768,595 | 742,367 | 838,966 | |||||||||||||
Net income attributable to shareholders | 106,058 | (b) | 123,932 | (c) | 109,244 | (d) | 158,492 | (e) | |||||||||
Net income per share (a): | |||||||||||||||||
Basic | $ | 1.11 | (b) | $ | 1.30 | (c) | $ | 1.16 | (d) | $ | 1.71 | (e) | |||||
Diluted | $ | 1.09 | (b) | $ | 1.28 | (c) | $ | 1.15 | (d) | $ | 1.69 | (e) | |||||
2014 | |||||||||||||||||
Sales | $ | 5,082,040 | $ | 5,676,539 | $ | 5,613,216 | $ | 6,396,879 | |||||||||
Gross profit | 703,828 | 747,521 | 728,687 | 815,859 | |||||||||||||
Net income attributable to shareholders | 107,120 | (f) | 127,884 | (g) | 146,864 | (h) | 116,177 | (i) | |||||||||
Net income per share (a): | |||||||||||||||||
Basic | $ | 1.07 | (f) | $ | 1.29 | (g) | $ | 1.49 | (h) | $ | 1.20 | (i) | |||||
Diluted | $ | 1.06 | (f) | $ | 1.27 | (g) | $ | 1.47 | (h) | $ | 1.18 | (i) | |||||
(a) | Quarterly net income per share is calculated using the weighted-average shares outstanding during each quarterly period, while net income per share for the full year is calculated using the weighted-average shares outstanding during the year. Therefore, the sum of the net income per share for each of the four quarters may not equal the net income per share for the full year. |
(b) | Includes identifiable intangible asset amortization ($9,029 net of related taxes or $.09 per share on both a basic and diluted basis) and restructuring, integration, and other charges ($12,569 net of related taxes or $.13 per share on both a basic and diluted basis). Also included is a loss on prepayment of debt ($1,808 net of related taxes or $.02 per share on both a basic and diluted basis) and a gain on sale of investment ($1,667 net of related taxes or $.02 per share on both a basic and diluted basis). |
(c) | Includes identifiable intangible asset amortization ($11,169 net of related taxes or $.12 per share on both a basic and diluted basis) and restructuring, integration, and other charges ($12,895 net of related taxes or $.13 per share on both a basic and diluted basis). Also included is a loss on investment ($921 net of related taxes or $.01 per share on both a basic and diluted basis). |
(d) | Includes identifiable intangible asset amortization ($11,521 net of related taxes or $.12 per share on both a basic and diluted basis) and restructuring, integration, and other charges ($12,642 net of related taxes or $.13 per share on both a basic and diluted basis). |
(e) | Includes identifiable intangible asset amortization ($9,537 net of related taxes or $.10 per share on both a basic and diluted basis) and restructuring, integration, and other charges ($13,198 net of related taxes or $.14 per share on both a basic and diluted basis). Also included is a loss on investment ($921 net of related taxes or $.01 per share on both a basic and diluted basis). |
79
ARROW ELECTRONICS, INC.
NOTES TO THE CONSOLIDATED FINANCIAL STATEMENTS
(Dollars in thousands except per share data)
(f) | Includes identifiable intangible asset amortization ($8,907 net of related taxes or $.09 per share on both a basic and diluted basis) and restructuring, integration, and other charges ($8,020 net of related taxes or $.08 per share on both a basic and diluted basis). |
(g) | Includes identifiable intangible asset amortization ($8,867 net of related taxes or $.09 per share on both a basic and diluted basis) and restructuring, integration, and other charges ($7,526 net of related taxes or $.08 and $.07 per share on a basic and diluted basis, respectively). |
(h) | Includes identifiable intangible asset amortization ($9,086 net of related taxes or $.09 per share on both a basic and diluted basis) and restructuring, integration, and other charges ($2,556 net of related taxes or $.03 per share on both a basic and diluted basis). Also included is a gain on sale of investment ($18,269 net of related taxes or $.19 and $.18 per share on a basic and diluted basis, respectively). |
(i) | Includes identifiable intangible asset amortization ($9,105 net of related taxes or $.09 per share on both a basic and diluted basis), restructuring, integration, and other charges ($11,222 net of related taxes or $.12 and $.11 per share on a basic and diluted basis, respectively), and a non-cash impairment charge associated with discontinuing the use of a trade name ($47,911 net of related taxes or $.49 per share on both a basic and diluted basis). |
18. Subsequent Event
In January 2016, the company was the target of criminal fraud by persons impersonating a company executive, which resulted in unauthorized transfers of cash from a Company account in Europe to outside bank accounts in Asia. Investigations and legal actions by the company and law enforcement are ongoing and the results of, and timing to conclude, these investigations is uncertain. To date, the findings of our investigation indicate that this is an isolated event not associated with a security breach or loss of data. The company expects to record a one-time charge of approximately of $13,000 in the first quarter of 2016.
80
Item 9. Changes in and Disagreements with Accountants on Accounting and Financial Disclosure.
None.
Item 9A. Controls and Procedures.
Evaluation of Disclosure Controls and Procedures
The company's management, under the supervision and with the participation of the company's Chief Executive Officer and Chief Financial Officer, carried out an evaluation of the effectiveness of the design and operation of the company's disclosure controls and procedures as of December 31, 2015 (the "Evaluation"). Based upon the Evaluation, the company's Chief Executive Officer and Chief Financial Officer concluded that, as of such date, because of a material weakness in the company’s internal control over financial reporting, the Company's disclosure controls and procedures were not effective as required under Rules 13a-15(e) and 15d-15(e) under the Exchange Act.
Notwithstanding the identified material weakness described below, management does not believe that these deficiencies had an adverse effect on the company’s reported operating results or financial condition and management has determined that the financial statements and other information included in this report and other periodic filings present fairly in all material respects the company’s financial condition, results of operations and cash flows at and for the periods presented in accordance with accounting principles generally accepted in the United States (“GAAP”).
Management's Report on Internal Control Over Financial Reporting
The company's management is responsible for establishing and maintaining adequate "internal control over financial reporting" (as defined in Exchange Act Rules 13a-15(f) and 15d-15(f)). Management evaluates the effectiveness of the company's internal control over financial reporting using the criteria set forth by the Committee of Sponsoring Organizations of the Treadway Commission (2013 framework). Based on that evaluation, which included the company’s consideration of factors contributing to the fraud loss discussed in Note 18 of the accompanying notes to consolidated financial statements, management has concluded that, as of December 31, 2015, the company had the following material weakness in its internal control over financial reporting.
Management determined that the company’s internal controls were not adequately designed to prevent or timely detect unauthorized cash disbursements. Specifically, although management believes internal controls are adequate to timely detect unauthorized cash disbursements so as to prevent or detect a material misstatement of the company’s financial statements, these controls were not adequate to safeguard the company’s cash assets from unauthorized transfers resulting from the failure of certain members of the finance organization to exercise appropriate skepticism and oversight for disbursement of company-owned funds. This material weakness in the company’s controls resulted in the inability to prevent and timely detect the fraud loss discussed in Note 18 of the accompanying notes to consolidated financial statements.
Management has taken immediate action to begin remediating the material weakness. Management expects to complete the remediation during the first quarter of 2016.
Because of the material weakness, the company’s Chief Executive Officer and Chief Financial Officer concluded that the company did not maintain effective internal control over financial reporting as of December 31, 2015. The material weakness did not result in a material misstatement of the company’s consolidated financial statements.
The company acquired ten separate entities during the year ended December 31, 2015, which are included in the company's 2015 consolidated financial statements and constituted 7.5% percent of total assets as of December 31, 2015 and 4.4% percent of the company's consolidated sales and 3.6% percent of the company's consolidated net income attributable to shareholders for the year ended December 31, 2015. The company has excluded these ten entities from its annual assessment of and conclusion on the effectiveness of the company's internal control over financial reporting.
The company's independent registered public accounting firm, Ernst & Young LLP, has audited the effectiveness of the company's internal control over financial reporting as of December 31, 2015, as stated in their report, which is included herein.
81
REPORT OF INDEPENDENT REGISTERED PUBLIC ACCOUNTING FIRM
The Board of Directors and Shareholders
Arrow Electronics, Inc.
We have audited Arrow Electronics, Inc.’s (the “company”) internal control over financial reporting as of December 31, 2015, based on criteria established in Internal Control-Integrated Framework issued by the Committee of Sponsoring Organizations of the Treadway Commission (2013 framework) (the COSO criteria). The company’s management is responsible for maintaining effective internal control over financial reporting, and for its assessment of the effectiveness of internal control over financial reporting included in the accompanying Management’s Report on Internal Control over Financial Reporting. Our responsibility is to express an opinion on the company’s internal control over financial reporting based on our audit.
We conducted our audit in accordance with the standards of the Public Company Accounting Oversight Board (United States). Those standards require that we plan and perform the audit to obtain reasonable assurance about whether effective internal control over financial reporting was maintained in all material respects. Our audit included obtaining an understanding of internal control over financial reporting, assessing the risk that a material weakness exists, testing and evaluating the design and operating effectiveness of internal control based on the assessed risk, and performing such other procedures as we considered necessary in the circumstances. We believe that our audit provides a reasonable basis for our opinion.
A company’s internal control over financial reporting is a process designed to provide reasonable assurance regarding the reliability of financial reporting and the preparation of financial statements for external purposes in accordance with generally accepted accounting principles. A company’s internal control over financial reporting includes those policies and procedures that (1) pertain to the maintenance of records that, in reasonable detail, accurately and fairly reflect the transactions and dispositions of the assets of the company; (2) provide reasonable assurance that transactions are recorded as necessary to permit preparation of financial statements in accordance with generally accepted accounting principles, and that receipts and expenditures of the company are being made only in accordance with authorizations of management and directors of the company; and (3) provide reasonable assurance regarding prevention or timely detection of unauthorized acquisition, use, or disposition of the company’s assets that could have a material effect on the financial statements.
Because of its inherent limitations, internal control over financial reporting may not prevent or detect misstatements. Also, projections of any evaluation of effectiveness to future periods are subject to the risk that controls may become inadequate because of changes in conditions, or that the degree of compliance with the policies or procedures may deteriorate.
As indicated in the accompanying Management’s Report on Internal Control Over Financial Reporting, management’s assessment of and conclusion on the effectiveness of internal control over financial reporting did not include the internal controls of ten separate entities that were acquired during the year ended December 31, 2015, which are included in the company’s 2015 consolidated financial statements and constituted 7.5 percent of total assets as of December 31, 2015 and 4.4 percent of sales and 3.6 percent of net income attributable to shareholders for the year then ended. Our audit of internal control over financial reporting of the company also did not include an evaluation of the internal control over financial reporting of these ten entities.
A material weakness is a deficiency, or combination of deficiencies, in internal control over financial reporting, such that there is a reasonable possibility that a material misstatement of the company’s annual or interim financial statements will not be prevented or detected on a timely basis. The following material weakness has been identified and included in management’s assessment. Management determined that the company’s internal controls were not adequately designed to prevent or timely detect unauthorized cash disbursements. Specifically, these controls were not adequate to safeguard the company’s cash assets from unauthorized transfers resulting from the failure of certain members of the finance organization to exercise appropriate skepticism and oversight for disbursement of company-owned funds. We also have audited, in accordance with the standards of the Public Company Accounting Oversight Board (United States), the 2015 consolidated financial statements. This material weakness was considered in determining the nature, timing and extent of audit tests applied in our audit of the 2015 financial statements, and this report does not affect our report dated February 5, 2016, which expressed an unqualified opinion on those financial statements.
In our opinion, because of the effect of the material weakness described above on the achievement of the objectives of the control criteria, Arrow Electronics, Inc. has not maintained effective internal control over financial reporting as of December 31, 2015, based on the COSO criteria.
/s/ ERNST & YOUNG LLP
New York, New York
February 5, 2016
82
Changes in Internal Control Over Financial Reporting
There was no change in the company's internal control over financial reporting that occurred during the company's most recent fiscal quarter that has materially affected, or is reasonably likely to materially affect, the company's internal control over financial reporting.
Item 9B. Other Information.
None.
83
PART III
Item 10. Directors, Executive Officers and Corporate Governance.
See "Executive Officers" in Part I of this Annual Report on Form 10-K. In addition, the information set forth under the headings "Election of Directors" and "Section 16(a) Beneficial Ownership Reporting Compliance" in the company's Proxy Statement, filed in connection with the Annual Meeting of Shareholders scheduled to be held on May 12, 2016, are incorporated herein by reference.
Information about the company's audit committee financial experts set forth under the heading "The Board and its Committees" in the company's Proxy Statement, filed in connection with the Annual Meeting of Shareholders scheduled to be held on May 12, 2016, is incorporated herein by reference.
Information about the company's code of ethics governing the Chief Executive Officer, Chief Financial Officer, and Corporate Controller, known as the "Finance Code of Ethics," as well as a code of ethics governing all employees, known as the "Worldwide Code of Business Conduct and Ethics," is available free of charge on the company's website at http://www.arrow.com and is available in print to any shareholder upon request.
Information about the company's "Corporate Governance Guidelines" and written committee charters for the company's Audit Committee, Compensation Committee, and Corporate Governance Committee is available free of charge on the company's website at http://www.arrow.com and is available in print to any shareholder upon request.
Item 11. Executive Compensation.
The information required by Item 11 is included in the company's Proxy Statement filed in connection with the Annual Meeting of Shareholders scheduled to be held on May 12, 2016, and is incorporated herein by reference.
Item 12. | Security Ownership of Certain Beneficial Owners and Management and Related Stockholder Matters. |
The information required by Item 12 is included in the company's Proxy Statement filed in connection with the Annual Meeting of Shareholders scheduled to be held on May 12, 2016, and is incorporated herein by reference.
Item 13. Certain Relationships and Related Transactions, and Director Independence.
The information required by Item 13 is included in the company's Proxy Statement filed in connection with the Annual Meeting of Shareholders scheduled to be held on May 12, 2016, and is incorporated herein by reference.
Item 14. Principal Accounting Fees and Services.
The information required by Item 14 is included in the company's Proxy Statement filed in connection with the Annual Meeting of Shareholders scheduled to be held on May 12, 2016, and is incorporated herein by reference.
84
PART IV
Item 15. Exhibits and Financial Statement Schedules.
(a) | The following documents are filed as part of this report: | Page | |
1. | Financial Statements. | ||
Report of Independent Registered Public Accounting Firm | |||
Consolidated Statements of Operations for the years ended December 31, 2015, 2014, and 2013 | |||
Consolidated Statements of Comprehensive Income for the years ended December 31, 2015, 2014, and 2013 | |||
Consolidated Balance Sheets as of December 31, 2015 and 2014 | |||
Consolidated Statements of Cash Flows for the years ended December 31, 2015, 2014, and 2013 | |||
Consolidated Statements of Equity for the years ended December 31, 2015, 2014, and 2013 | |||
Notes to the Consolidated Financial Statements | |||
2. | Financial Statement Schedule. | ||
Schedule II - Valuation and Qualifying Accounts | |||
All other schedules are omitted since the required information is not present, or is not present in amounts sufficient to require submission of the schedule, or because the information required is included in the consolidated financial statements, including the notes thereto. | |||
3. | Exhibits. | ||
See Index of Exhibits included on pages 85 - 90 | |||
85
INDEX OF EXHIBITS
Exhibit Number | Exhibit | |
3(a)(i) | Certificate of Amendment of the Restated Certificate of Incorporation of the company, dated as of October 12, 2000 (incorporated by reference to Exhibit 3(a)(iii) to the company's Annual Report on Form 10-K for the year ended December 31, 2000, Commission File No. 1-4482). | |
3(b) | Amended Corporate By-Laws, dated July 29, 2004 (incorporated by reference to Exhibit 3(ii) to the company's Quarterly Report on Form 10-Q for the quarter ended September 30, 2004, Commission File No. 1-4482). | |
4(a)(i) | Indenture, dated as of January 15, 1997, between the company and The Bank of New York Mellon (formerly, the Bank of Montreal Trust Company), as Trustee (incorporated by reference to Exhibit 4(b)(i) to the company's Annual Report on Form 10-K for the year ended December 31, 1996, Commission File No. 1-4482). | |
4(a)(ii) | Officers' Certificate, as defined by the Indenture in 4(a)(i) above, dated as of January 22, 1997, with respect to the company's $200,000,000 7% Senior Notes due 2007 and $200,000,000 7 1/2% Senior Debentures due 2027 (incorporated by reference to Exhibit 4(b)(ii) to the company's Annual Report on Form 10-K for the year ended December 31, 1996, Commission File No. 1-4482). | |
4(a)(iii) | Officers' Certificate, as defined by the Indenture in 4(a)(i) above, dated as of January 15, 1997, with respect to the $200,000,000 6 7/8% Senior Debentures due 2018, dated as of May 29, 1998 (incorporated by reference to Exhibit 4(b)(iii) to the company's Annual Report on Form 10-K for the year ended December 31, 1998, Commission File No. 1-4482). | |
4(a)(iv) | Supplemental Indenture, dated as of February 21, 2001, between the company and The Bank of New York (as successor to the Bank of Montreal Trust Company), as trustee (incorporated by reference to Exhibit 4.2 to the company's Current Report on Form 8-K, dated March 12, 2001, Commission File No. 1-4482). | |
4(a)(v) | Supplemental Indenture, dated as of December 31, 2001, between the company and The Bank of New York (as successor to the Bank of Montreal Trust Company), as trustee (incorporated by reference to Exhibit 4(b)(vi) to the company's Annual Report on Form 10-K for the year ended December 31, 2001, Commission File No. 1-4482). | |
4(a)(vi) | Supplemental Indenture, dated as of March 11, 2005, between the company and The Bank of New York (as successor to the Bank of Montreal Trust Company), as trustee (incorporated by reference to Exhibit 4(b)(vii) to the company's Annual Report on Form 10-K for the year ended December 31, 2004, Commission File No. 1-4482). | |
4(a)(vii) | Supplemental Indenture, dated as of September 30, 2009, between the company and The Bank of New York Mellon (as successor to the Bank of Montreal Trust Company), as trustee (incorporated by reference to Exhibit 4.1 to the company's Current Report on Form 8-K dated September 29, 2009, Commission File No. 1-4482). | |
4(a)(viii) | Supplemental Indenture, dated as of November 3, 2010, between the company and The Bank of New York Mellon (as successor to the Bank of Montreal Trust Company), as trustee (incorporated by reference to Exhibit 4.1 to the company's Current Report on Form 8-K dated November 2, 2010, Commission File No. 1-4482). | |
4(a)(ix) | Supplemental Indenture, dated as of February 20, 2013, between the company and The Bank of New York Mellon (as successor to the Bank of Montreal Trust Company), as trustee (incorporated by reference to Exhibit 4.1 to the company's Current Report on Form 8-K dated February 14, 2013, Commission File No. 1-4482). | |
4(a)(x) | Supplemental Indenture, dated as of March 2, 2015, between the company and The Bank of New York Mellon (as successor to the Bank of Montreal Trust Company), as trustee. | |
86
10(a) | Arrow Electronics Savings Plan, as amended and restated effective January 1, 2012 (incorporated by reference to Exhibit 10(a) to the company's Annual Report on Form 10-K for the year ended December 31, 2012, Commission File No. 1-4482). | |
10(a)(i) | Amendment 3 to the Arrow Electronics Savings Plan effective December 23, 2015. | |
10(b) | Wyle Electronics Retirement Plan, as amended and restated on September 9, 2009 (incorporated by reference to Exhibit 10(b) to the company's Quarterly Report on Form 10-Q for the quarter ended October 3, 2009, Commission File No. 1-4482). | |
10(c) | Arrow Electronics Stock Ownership Plan, as amended and restated on September 9, 2009 (incorporated by reference to Exhibit 10(c) to the company's Quarterly Report on Form 10-Q for the quarter ended October 3, 2009, Commission File No. 1-4482). | |
10(c)(i) | Amendment 4 to the Arrow Electronics Stock Ownership Plan effective December 31, 2012 (incorporated by reference to Exhibit 10(c)(i) to the company's Annual Report on Form 10-K for the year ended December 31, 2012, Commission File No. 1-4482). | |
10(c)(ii) | Amendment 6 to the Arrow Electronics Stock Ownership Plan effective December 23, 2015. | |
10(d)(i) | Arrow Electronics, Inc. 2004 Omnibus Incentive Plan (as amended through February 17, 2015) (incorporated by reference to Exhibit 10(a) to the company's Quarterly Report on Form 10-Q for the quarter ended June 27, 2015, Commission File No. 1-4482). | |
10(d)(ii) | Form of Non-Qualified Stock Option Award Agreement under 10(d)(i) above (incorporated by reference to Exhibit 10(d)(ii) to the company's Annual Report on Form 10-K for the year ended December 31, 2012, Commission File No. 1-4482). | |
10(d)(iii) | Form of Performance Stock Unit Award Agreement under 10(d)(i) above (incorporated by reference to Exhibit 10(d)(iii) to the company's Annual Report on Form 10-K for the year ended December 31, 2012, Commission File No. 1-4482). | |
10(d)(iv) | Form of Restricted Stock Unit Award Agreement under 10(d)(i) above (incorporated by reference to Exhibit 10(d)(iv) to the company's Annual Report on Form 10-K for the year ended December 31, 2012, Commission File No. 1-4482). | |
10(e) | Non-Employee Directors Deferred Compensation Plan, as amended and restated on January 1, 2009 (incorporated by reference to Exhibit 10(g) to the company's Annual Report on Form 10-K for the year ended December 31, 2012, Commission File No. 1-4482). | |
10(f) | Arrow Electronics, Inc. Supplemental Executive Retirement Plan, as amended effective January 1, 2009 (incorporated by reference to Exhibit 10(i) to the company's Annual Report on Form 10-K for the year ended December 31, 2009, Commission File No. 1-4482). | |
10(g) | Arrow Electronics, Inc. Executive Deferred Compensation Plan amended and restated effective January 1, 2009 (incorporated by reference to Exhibit 10(i) to the company's Annual Report on Form 10-K for the year ended December 31, 2011, Commission File No. 1-4482). | |
10(h)(i) | Arrow Electronics, Inc. Executive Severance Policy (incorporated by reference to Exhibit 10.1 to the company's Current Report on Form 8-K dated February 19, 2013, Commission File No. 1-4482). | |
10(h)(ii) | Form of the Arrow Electronics, Inc. Executive Severance Policy Participation Agreement (incorporated by reference to Exhibit 10.2 to the company's Current Report on Form 8-K dated February 19, 2013, Commission File No. 1-4482). | |
87
10(h)(iii) | Form of Executive Change in Control Retention Agreement (incorporated by reference to Exhibit 10.3 to the company's Current Report on Form 8-K dated February 19, 2013, Commission File No. 1-4482). | |
10(h(iv) | Grantor Trust Agreement, as amended and restated on November 11, 2003, by and between Arrow Electronics, Inc. and Wachovia Bank, N.A. (incorporated by reference to Exhibit 10(i)(xvii) to the company's Annual Report on Form 10-K for the year ended December 31, 2003, Commission File No. 1-4482). | |
10(h)(v) | First Amendment, dated September 17, 2004, to the amended and restated Grantor Trust Agreement in 10(i)(iv) above by and between Arrow Electronics, Inc. and Wachovia Bank, N.A. (incorporated by reference to Exhibit 10(a) to the company's Quarterly Report on Form 10-Q for the quarter ended September 30, 2004, Commission File No. 1-4482). | |
10(h)(vi) | Paying Agency Agreement, dated November 11, 2003, by and between Arrow Electronics, Inc. and Wachovia Bank, N.A. (incorporated by reference to Exhibit 10(d)(iii) to the company's Annual Report on Form 10-K for the year ended December 31, 2003, Commission File No. 1-4482). | |
10(i) | Amended and Restated Five-Year Credit Agreement, dated as of December 13, 2013, among Arrow Electronics, Inc. and certain of its subsidiaries, as borrowers, the lenders from time to time party thereto, JPMorgan Chase Bank, N.A., as administrative agent and BNP Paribas, Bank of America, N.A., The Bank of Nova Scotia and The Bank of Tokyo-Mitsubishi UFJ, Ltd. as syndication agents (incorporated by reference to Exhibit 10(j) to the company's Annual Report on Form 10-K for the year ended December 31, 2013, Commission File No. 1-4482). | |
10(j)(i) | Transfer and Administration Agreement, dated as of March 21, 2001, by and among Arrow Electronics Funding Corporation, Arrow Electronics, Inc., individually and as Master Servicer, the several Conduit Investors, Alternate Investors and Funding Agents and Bank of America, National Association, as administrative agent (incorporated by reference to Exhibit 10(m)(i) to the company's Annual Report on Form 10-K for the year ended December 31, 2001, Commission File No. 1-4482). | |
10(j)(ii) | Amendment No. 1 to the Transfer and Administration Agreement, dated as of November 30, 2001, to the Transfer and Administration Agreement in 10(k)(i) above (incorporated by reference to Exhibit 10(m)(ii) to the company's Annual Report on Form 10-K for the year ended December 31, 2001, Commission File No. 1-4482). | |
10(j)(iii) | Amendment No. 2 to the Transfer and Administration Agreement, dated as of December 14, 2001, to the Transfer and Administration Agreement in 10(k)(i) above (incorporated by reference to Exhibit 10(m)(iii) to the company's Annual Report on Form 10-K for the year ended December 31, 2001, Commission File No. 1-4482). | |
10(j)(iv) | Amendment No. 3 to the Transfer and Administration Agreement, dated as of March 20, 2002, to the Transfer and Administration Agreement in 10(k)(i) above (incorporated by reference to Exhibit 10(m)(iv) to the company's Annual Report on Form 10-K for the year ended December 31, 2001, Commission File No. 1-4482). | |
10(j)(v) | Amendment No. 4 to the Transfer and Administration Agreement, dated as of March 29, 2002, to the Transfer and Administration Agreement in 10(k)(i) above (incorporated by reference to Exhibit 10(n)(v) to the company's Annual Report on Form 10-K for the year ended December 31, 2002, Commission File No. 1-4482). | |
10(j)(vi) | Amendment No. 5 to the Transfer and Administration Agreement, dated as of May 22, 2002, to the Transfer and Administration Agreement in 10(k)(i) above (incorporated by reference to Exhibit 10(n)(vi) to the company's Annual Report on Form 10-K for the year ended December 31, 2002, Commission File No. 1-4482). | |
10(j)(vii) | Amendment No. 6 to the Transfer and Administration Agreement, dated as of September 27, 2002, to the Transfer and Administration Agreement in 10(k)(i) above (incorporated by reference to Exhibit 10(n)(vii) to the company's Annual Report on Form 10-K for the year ended December 31, 2002, Commission File No. 1-4482). | |
88
10(j)(viii) | Amendment No. 7 to the Transfer and Administration Agreement, dated as of February 19, 2003, to the Transfer and Administration Agreement in 10(k)(i) above (incorporated by reference to Exhibit 99.1 to the company's Current Report on Form 8-K dated February 6, 2003, Commission File No. 1-4482). | |
10(j)(ix) | Amendment No. 8 to the Transfer and Administration Agreement, dated as of April 14, 2003, to the Transfer and Administration Agreement in 10(k)(i) above (incorporated by reference to Exhibit 10(n)(ix) to the company's Annual Report on Form 10-K for the year ended December 31, 2003, Commission File No. 1-4482). | |
10(j)(x) | Amendment No. 9 to the Transfer and Administration Agreement, dated as of August 13, 2003, to the Transfer and Administration Agreement in 10(k)(i) above (incorporated by reference to Exhibit 10(n)(x) to the company's Annual Report on Form 10-K for the year ended December 31, 2003, Commission File No. 1-4482). | |
10(j)(xi) | Amendment No. 10 to the Transfer and Administration Agreement, dated as of February 18, 2004, to the Transfer and Administration Agreement in 10(k)(i) above (incorporated by reference to Exhibit 10(n)(xi) to the company's Annual Report on Form 10-K for the year ended December 31, 2003, Commission File No. 1-4482). | |
10(j)(xii) | Amendment No. 11 to the Transfer and Administration Agreement, dated as of August 13, 2004, to the Transfer and Administration Agreement in 10(k)(i) above (incorporated by reference to Exhibit 10(b) to the company's Quarterly Report on Form 10-Q for the quarter ended September 30, 2004, Commission File No. 1-4482). | |
10(j)(xiii) | Amendment No. 12 to the Transfer and Administration Agreement, dated as of February 14, 2005, to the Transfer and Administration Agreement in 10(k)(i) above (incorporated by reference to Exhibit 10(o)(xiii) to the company's Annual Report on Form 10-K for the year ended December 31, 2004, Commission File No. 1-4482). | |
10(j)(xiv) | Amendment No. 13 to the Transfer and Administration Agreement, dated as of February 13, 2006, to the Transfer and Administration Agreement in 10(k)(i) above (incorporated by reference to Exhibit 10(o)(xiv) to the company's Annual Report on Form 10-K for the year ended December 31, 2005, Commission File No. 1-4482). | |
10(j)(xv) | Amendment No. 14 to the Transfer and Administration Agreement, dated as of October 31, 2006, to the Transfer and Administration Agreement in 10(k)(i) above (incorporated by reference to Exhibit 10(o)(xv) to the company's Annual Report on Form 10-K for the year ended December 31, 2006, Commission File No. 1-4482). | |
10(j)(xvi) | Amendment No. 15 to the Transfer and Administration Agreement, dated as of February 12, 2007, to the Transfer and Administration Agreement in 10(k)(i) above (incorporated by reference to Exhibit 10(o)(xvi) to the company's Annual Report on Form 10-K for the year ended December 31, 2006, Commission File No. 1-4482). | |
10(j)(xvii) | Amendment No. 16 to the Transfer and Administration Agreement, dated as of March 27, 2007, to the Transfer and Administration Agreement in 10(k)(i) above (incorporated by reference to Exhibit 10(b) to the company's Quarterly Report on Form 10-Q for the quarter ended March 31, 2007, Commission File No. 1-4482). | |
10(j)(xviii) | Amendment No. 17 to the Transfer and Administration Agreement, dated as of March 26, 2010, to the Transfer and Administration Agreement in 10(k)(i) above (incorporated by reference to Exhibit 10(n) to the company's Current Report on Forms 8-K and 8-K/A dated March 31, 2010, Commission File No. 1-4482). | |
10(j)(xix) | Amendment No. 18 to the Transfer and Administration Agreement, dated as of December 15, 2010, to the Transfer and Administration Agreement in 10(k)(i) above (incorporated by reference to Exhibit 10(n) to the company's Current Report on Form 8-K/A dated January 13, 2011, Commission File No.1-4482). | |
89
10(j)(xx) | Amendment No. 19 to the Transfer and Administration Agreement, dated as of February 14, 2011, to the Transfer and Administration Agreement in 10(k)(i) above (incorporated by reference to Exhibit 10(m)(xx) to the company's Annual Report on Form 10-K for the year ended December 31, 2011, Commission File No. 1-4482). | |
10(j)(xxi) | Amendment No. 20 to the Transfer and Administration Agreement, dated as of December 7, 2011, to the Transfer and Administration Agreement in 10(k)(i) above (incorporated by reference to Exhibit 10.1 to the company's Current Report on Form 8-K dated December 12, 2011, Commission File No.1-4482). | |
10(j)(xxii) | Amendment No. 21 to the Transfer and Administration Agreement, dated as of March 30, 2012, to the Transfer and Administration Agreement in 10(k)(i) above (incorporated by reference to Exhibit 10(m)(xxii) to the company's Annual Report on Form 10-K for the year ended December 31, 2012, Commission File No. 1-4482). | |
10(j)(xxiii) | Amendment No. 22 to the Transfer and Administration Agreement, dated as of August 29, 2012, to the Transfer and Administration Agreement in 10(k)(i) above (incorporated by reference to Exhibit 10(m)(xxiii) to the company's Annual Report on Form 10-K for the year ended December 31, 2012, Commission File No. 1-4482). | |
10(j)(xxiv) | Amendment No. 23 to the Transfer and Administration Agreement, dated as of July 29, 2013, to the Transfer and Administration Agreement in 10(k)(i) above (incorporated by reference to Exhibit 10(k)(xxiv) to the company's Annual Report on Form 10-K for the year ended December 31, 2013, Commission File No. 1-4482). | |
10(j)(xxv) | Amendment No. 24 to the Transfer and Administration Agreement, dated as of March 24, 2014, to the Transfer and Administration Agreement in 10(k)(i) above (incorporated by reference to Exhibit 10.1 to the company's Current Report on Form 8-K dated March 27, 2014, Commission File No. 1-4482). | |
10(j)(xxvi) | Amendment No. 25 to the Transfer and Administration Agreement, dated as of March 9, 2015, to the Transfer and Administration Agreement in 10(k)(i) above (incorporated by reference to Exhibit 10(a) to the company's Quarterly Report on Form 10-Q for the quarter ended March 28, 2015, Commission File No. 1-4482). | |
10(k)(i) | Commercial Paper Private Placement Agreement, dated as of November 9, 1999, among Arrow Electronics, Inc., as issuer, and Chase Securities Inc., Bank of America Securities LLC, Goldman, Sachs & Co., and Morgan Stanley & Co. Incorporated as placement agents (incorporated by reference to Exhibit 10(g) to the company's Annual Report on Form 10-K for the year ended December 31, 1999, Commission File No. 1-4482). | |
10(k)(ii) | Amendment No. 1 to Dealer Agreement dated as of November 9, 1999, between Arrow Electronics, Inc. and J.P. Morgan Securities LLC (f.k.a. Chase Securities Inc.), Merrill Lynch, Pierce, Fenner & Smith Incorporated (f.k.a. Bank of America Securities LLC), Goldman, Sachs & Co. and Morgan Stanley & Co. LLC (f.k.a. Morgan Stanley & Co. Incorporated) (incorporated by reference to Exhibit 10(n)(ii) to the company's Annual Report on Form 10-K for the year ended December 31, 2011, Commission File No. 1-4482). | |
10(k)(iii) | Amendment No. 2 to Dealer Agreement dated as of November 9, 1999, between Goldman, Sachs & Co., J.P. Morgan Securities LLC (f.k.a. Chase Securities Inc.), Morgan Stanley & Co. LLC (f.k.a. Morgan Stanley & Co. Incorporated), Merrill Lynch, Pierce, Fenner & Smith Incorporated (f.k.a. Bank of America Securities LLC) and Arrow Electronics, Inc., as amended by Amendment No. 1 dated as of October 11, 2011 (incorporated by reference to Exhibit 10(a) to the company's Quarterly Report on Form 10-Q for the quarter ended September 27, 2014, Commission File No. 1-4482). | |
10(k)(iv) | Issuing and Paying Agency Agreement, dated as of October 20, 2014, by and between Arrow Electronics, Inc. and BNP Paribas (incorporated by reference to Exhibit 10(b) to the company's Quarterly Report on Form 10-Q for the quarter ended September 27, 2014, Commission File No. 1-4482). | |
10(l) | Form of Indemnification Agreement between the company and each director (incorporated by reference to Exhibit 10(g) to the company's Annual Report on Form 10-K for the year ended December 31, 1986, Commission File No. 1-4482). | |
90
10(m) | Management Insurance Program Agreement, dated as of September 16, 2015. | |
21 | Subsidiary Listing. | |
23 | Consent of Independent Registered Public Accounting Firm. | |
31(i) | Certification of Chief Executive Officer pursuant to Rule 13A-14(a)/15d-14(a) of the Securities and Exchange Act of 1934, as adopted pursuant to Section 302 of the Sarbanes-Oxley Act of 2002. | |
31(ii) | Certification of Chief Financial Officer pursuant to Rule 13A-14(a)/15d-14(a) of the Securities and Exchange Act of 1934, as adopted pursuant to Section 302 of the Sarbanes-Oxley Act of 2002. | |
32(i) | Certification of Chief Executive Officer pursuant to 18 U.S.C. Section 1350, as adopted pursuant to Section 906 of the Sarbanes-Oxley Act of 2002. | |
32(ii) | Certification of Chief Financial Officer pursuant to 18 U.S.C. Section 1350, as adopted pursuant to Section 906 of the Sarbanes-Oxley Act of 2002. | |
101.INS | XBRL Instance Document. | |
101.SCH | XBRL Taxonomy Extension Schema Document. | |
101.CAL | XBRL Taxonomy Extension Calculation Linkbase Document. | |
101.LAB | XBRL Taxonomy Extension Label Linkbase Document. | |
101.PRE | XBRL Taxonomy Extension Presentation Linkbase Documents. | |
101.DEF | XBRL Taxonomy Definition Linkbase Document. | |
91
ARROW ELECTRONICS, INC.
SCHEDULE II - VALUATION AND QUALIFYING ACCOUNTS
(In thousands)
Balance at beginning of year | Charged to income | Other (a) | Write-down | Balance at end of year | |||||||||||||||
Allowance for doubtful accounts: | |||||||||||||||||||
Year ended December 31, 2015 | $ | 59,188 | $ | (2,484 | ) | $ | 2,093 | $ | 9,138 | $ | 49,659 | ||||||||
Year ended December 31, 2014 | $ | 64,129 | $ | 656 | $ | 682 | $ | 6,279 | $ | 59,188 | |||||||||
Year ended December 31, 2013 | $ | 54,238 | $ | 9,201 | $ | 8,098 | $ | 7,408 | $ | 64,129 | |||||||||
(a) | Represents the allowance for doubtful accounts of the businesses acquired by the company during 2015, 2014, and 2013. |
92
SIGNATURES
Pursuant to the requirements of Section 13 or 15(d) of the Securities Exchange Act of 1934, the registrant has duly caused this report to be signed on its behalf by the undersigned, thereunto duly authorized.
ARROW ELECTRONICS, INC. | ||||
By: | /s/ Gregory P. Tarpinian | |||
Gregory P. Tarpinian | ||||
Senior Vice President, General Counsel, and Secretary | ||||
February 5, 2016 | ||||
Pursuant to the requirements of the Securities Exchange Act of 1934, this report has been signed below by the following persons on behalf of the registrant and in the capacities indicated on February 5, 2016: | ||||
By: | /s/ Michael J. Long | |||
Michael J. Long, Chairman, President, and Chief Executive Officer | ||||
By: | /s/ Paul J. Reilly | |||
Paul J. Reilly, Executive Vice President, Finance and Operations, and Chief Financial Officer | ||||
By: | /s/ Christopher D. Stansbury | |||
Christopher D. Stansbury, Vice President, Finance, and Principal Accounting Officer | ||||
By: | /s/ Barry W. Perry | |||
Barry W. Perry, Lead Independent Director | ||||
By: | /s/ Philip K. Asherman | |||
Philip K. Asherman, Director | ||||
By: | /s/ Gail E. Hamilton | |||
Gail E. Hamilton, Director | ||||
By: | /s/ John N. Hanson | |||
John N. Hanson, Director | ||||
By: | /s/ Richard S. Hill | |||
Richard S. Hill, Director | ||||
By: | /s/ Fran Keeth | |||
Fran Keeth, Director | ||||
By: | /s/ Andrew C. Kerin | |||
Andrew C. Kerin, Director | ||||
By: | /s/ Stephen C. Patrick | |||
Stephen C. Patrick, Director | ||||
93