Attached files
| file | filename |
|---|---|
| EX-10.I - ARROW ELECTRONICS INC | v172660_ex10i.htm |
| EX-10.K.V - ARROW ELECTRONICS INC | v172660_ex10kv.htm |
| EX-10.K.VI - ARROW ELECTRONICS INC | v172660_ex10kvi.htm |
| EX-21 - ARROW ELECTRONICS INC | v172660_ex21.htm |
| EX-23 - ARROW ELECTRONICS INC | v172660_ex23.htm |
| EX-32.I - ARROW ELECTRONICS INC | v172660_ex32i.htm |
| EX-31.I - ARROW ELECTRONICS INC | v172660_ex31i.htm |
| EX-31.II - ARROW ELECTRONICS INC | v172660_ex31ii.htm |
| EX-32.II - ARROW ELECTRONICS INC | v172660_ex32ii.htm |
| EX-10.K.VII - ARROW ELECTRONICS INC | v172660_ex10kvii.htm |
UNITED
STATES SECURITIES AND EXCHANGE COMMISSION
Washington,
D.C. 20549
FORM
10-K
x ANNUAL
REPORT PURSUANT TO SECTION 13 OR 15(d) OF THE SECURITIES EXCHANGE ACT OF
1934
For the
fiscal year ended December 31, 2009
OR
o TRANSITION
REPORT PURSUANT TO SECTION 13 OR 15(d) OF THE SECURITIES EXCHANGE ACT OF
1934
For the
transition period from
to
Commission
file number 1-4482
ARROW
ELECTRONICS, INC.
(Exact
name of registrant as specified in its charter)
|
New
York
|
11-1806155
|
||
|
(State
or other jurisdiction of
|
(I.R.S.
Employer
|
||
|
incorporation
or organization)
|
Identification
Number)
|
||
|
50
Marcus Drive, Melville, New York
|
11747
|
||
|
(Address
of principal executive offices)
|
(Zip
Code)
|
(631)
847-2000
(Registrant's
telephone number, including area code)
Securities
registered pursuant to Section 12(b) of the Act:
|
Title
of each class
|
Name
of each exchange on which registered
|
|
|
Common
Stock, $1 par value
|
New
York Stock Exchange
|
Securities
registered pursuant to Section 12(g) of the Act: None
Indicate
by check mark if the registrant is a well-known seasoned issuer, as defined in
Rule 405 of the Securities Act.
Yes x No
o
Indicate
by check mark if the registrant is not required to file reports pursuant to
Section 13 or Section 15(d) of the Exchange Act.
Yes o No x
Indicate
by check mark whether the registrant (1) has filed all reports required to be
filed by Section 13 or 15(d) of the Securities Exchange Act of 1934 during the
preceding 12 months (or for such shorter period that the registrant was required
to file such reports), and (2) has been subject to such filing requirements for
the past 90 days.
Yes x No
o
Indicate
by check mark whether the registrant has submitted electronically and posted on
its corporate Web site, if any, every Interactive Data File required to be
submitted and posted pursuant to Rule 405 of Regulation S-T (§232.405 of this
chapter) during the preceding 12 months (or for such shorter period that the
registrant was required to submit and post such files).
Yes o No
o
Indicate
by check mark if disclosure of delinquent filers pursuant to Item 405 of
Regulation S-K (§229.405 of this chapter) is not contained herein, and will not
be contained, to the best of the registrant's knowledge, in definitive proxy or
information statements incorporated by reference in Part III of this Form 10-K
or any amendment to this Form 10-K. o
Indicate
by check mark whether the registrant is a large accelerated filer, an
accelerated filer, a non-accelerated filer, or a smaller reporting
company. See definitions of "large accelerated filer," "accelerated
filer," and "smaller reporting company" in Rule 12b-2 of the Exchange Act (check
one):
|
Large
accelerated filer x
|
Accelerated
filer o
|
|
Non-accelerated
filer o (do not check if a smaller reporting
company)
|
Smaller
reporting company o
|
Indicate
by check mark whether the registrant is a shell company (as defined in Rule
12b-2 of the
Act). Yes
o No x
The
aggregate market value of voting stock held by non-affiliates of the registrant
as of the last business day of the registrant's most recently completed second
fiscal quarter was $2,474,561,676.
There
were 119,834,138 shares of Common Stock outstanding as of January 29,
2010.
DOCUMENTS
INCORPORATED BY REFERENCE
The
definitive proxy statement related to the registrant's Annual Meeting of
Shareholders, to be held May 4, 2010, is incorporated by reference in Part III
to the extent described therein.
TABLE OF
CONTENTS
|
PART
I
|
||
|
Item
1.
|
Business.
|
3
|
|
Item 1A.
|
Risk
Factors.
|
9
|
|
Item
1B.
|
Unresolved
Staff Comments.
|
16
|
|
Item
2.
|
Properties.
|
16
|
|
Item
3.
|
Legal
Proceedings.
|
16
|
|
Item
4.
|
Submission
of Matters to a Vote of Security Holders.
|
18
|
|
PART
II
|
||
|
Item
5.
|
Market
for Registrant's Common Equity, Related Stockholder Matters and Issuer
Purchases of Equity Securities.
|
19
|
|
Item
6.
|
Selected
Financial Data.
|
22
|
|
Item
7.
|
Management's
Discussion and Analysis of Financial Condition and Results of
Operations.
|
24
|
|
Item
7A.
|
Quantitative
and Qualitative Disclosures About Market Risk.
|
40
|
|
Item
8.
|
Financial
Statements and Supplementary Data.
|
42
|
|
Item
9.
|
Changes
in and Disagreements with Accountants on Accounting and Financial
Disclosure.
|
88
|
|
Item
9A.
|
Controls
and Procedures.
|
88
|
|
Item 9B.
|
Other
Information.
|
90
|
|
PART
III
|
||
|
Item
10.
|
Directors,
Executive Officers, and Corporate Governance.
|
91
|
|
Item
11.
|
Executive
Compensation.
|
91
|
|
Item
12.
|
Security
Ownership of Certain Beneficial Owners and Management and Related
Stockholder Matters.
|
91
|
|
Item
13.
|
Certain
Relationships and Related Transactions, and Director
Independence.
|
91
|
|
Item
14.
|
Principal
Accounting Fees and Services.
|
91
|
|
PART
IV
|
||
|
Item
15.
|
Exhibits
and Financial Statement Schedules.
|
92
|
|
SIGNATURES
|
100
|
|
PART
I
Item
1. Business.
Arrow
Electronics, Inc. (the "company" or "Arrow") is a global provider of products,
services, and solutions to industrial and commercial users of electronic
components and enterprise computing solutions. The company believes it is a
leader in the electronics distribution industry in operating systems, employee
productivity, value-added programs, and total quality
assurance. Arrow, which was incorporated in New York in 1946, serves
over 900 suppliers and over 125,000 original equipment
manufacturers ("OEMs"), contract manufacturers ("CMs"), and commercial
customers.
Serving
its industrial and commercial customers as a supply chain partner, the company
offers both a wide spectrum of products and a broad range of services and
solutions, including materials planning, design services, programming and
assembly services, inventory management, and a variety of online supply chain
tools.
Arrow's
diverse worldwide customer base consists of OEMs, CMs, and other commercial
customers. Customers include manufacturers of consumer and industrial equipment
(including machine tools, factory automation, and robotic equipment),
telecommunications products, automotive and transportation, aerospace and
defense, scientific and medical devices, and computer and office
products. Customers also include value-added resellers ("VARs") of
enterprise computing solutions.
The
company maintains over 200 sales facilities and 22 distribution and
value-added centers in 51 countries and territories, serving over 70 countries
and territories. Through this network, Arrow provides one of the broadest
product offerings in the electronic components and enterprise computing
solutions distribution industries and a wide range of value-added services to
help customers reduce their time to market, lower their total cost of ownership,
introduce innovative products through demand creation opportunities, and enhance
their overall competitiveness.
The
company has two business segments, the global components business segment and
the global enterprise computing solutions ("ECS") business
segment. The company distributes electronic components to OEMs and
CMs through its global components business segment and provides enterprise
computing solutions to VARs through its global ECS business
segment. For 2009, approximately 66% of the company's sales were from
the global components business segment, and approximately 34% of the company's
sales were from the global ECS business segment. The financial
information about the company's business segments and geographic operations is
found in Note 16 of the Notes to Consolidated Financial Statements.
Operating
efficiency and working capital management remain a key focus of the company's
business initiatives to grow sales faster than the market, grow profits faster
than sales, and increase return on invested capital. To achieve its
financial objectives, the company seeks to capture significant opportunities to
grow across products, markets, and geographies. To supplement its
organic growth strategy, the company continually evaluates strategic
acquisitions to broaden its product offerings, increase its market penetration,
and/or expand its geographic reach.
Global
Components
The
company's global components business segment, one of the largest distributors of
electronic components and related services in the world, covers the world's
largest electronics markets – North America, EMEASA (Europe, Middle East,
Africa, and South America), and the Asia Pacific region.
North
America includes sales and marketing organizations in the United States, Canada,
and Mexico. Over the past two years, the global components business segment
completed the following strategic acquisitions to increase the company's
presence in the growing aerospace and defense markets:
3
|
|
·
|
In
February 2008, acquired all the assets and operations of ACI Electronics
LLC ("ACI"), a distributor of electronic components used in defense and
aerospace applications. This acquisition further bolstered the
company's leading position in the North American defense and aerospace
market and expanded the company's leading market share in many technology
segments including discrete semiconductors used in military
applications.
|
|
·
|
In
December 2009, acquired A.E. Petsche Company, Inc. ("Petsche"), a leading
provider of interconnect products, including specialty wire, cable, and
harness management solutions, to the aerospace and defense markets. This
acquisition will expand the company's product offering in specialty wire
and cable and provide a variety of cross-selling opportunities with the
company's existing business as well as other emerging
markets.
|
In the
EMEASA region, Arrow operates in Argentina, Austria, Belgium, Brazil, Czech
Republic, Denmark, Estonia, Finland, France, Germany, Greece, Hungary, Ireland,
Israel, Italy, Latvia, Lithuania, the Netherlands, Norway, Poland, Romania, the
Russian Federation, Slovakia, Slovenia, Spain, Sweden, Switzerland, Turkey,
Ukraine, and the United Kingdom.
In the
Asia Pacific region, Arrow operates in Australia, China, Hong Kong, India,
Japan, Korea, Malaysia, New Zealand, Philippines, Singapore, Taiwan, Thailand,
and Vietnam. Over the past three years, the global components business segment
completed the following strategic acquisitions to broaden its product offerings
and expand its geographic reach in the Asia Pacific region:
|
|
·
|
In
June 2007, acquired the component distribution business of Adilam Pty.
Ltd. ("Adilam"), a leading electronic components distributor in Australia
and New Zealand.
|
|
|
·
|
In
November 2007, acquired Universe Electron Corporation ("UEC"), a
distributor of semiconductor and multimedia products in
Japan.
|
|
|
·
|
In
February 2008, acquired the components distribution business of Hynetic
Electronics and Shreyanics Electronics ("Hynetic") in
India.
|
|
|
·
|
In
July 2008, acquired the components distribution business of Achieva Ltd.
("Achieva"), a value-added distributor of semiconductors and
electromechanical devices based in Singapore. Achieva is in
eight countries within the Asia Pacific region and is focused on creating
value for its partners through technical support and demand creation
activities.
|
|
|
·
|
In
December 2008, acquired Excel Tech, Inc. ("Excel Tech"), the sole Broadcom
distributor in Korea, and Eteq Components Pte Ltd ("Eteq Components"), a
Broadcom-based components distribution business in the ASEAN region and
China.
|
Within
the global components business segment, approximately 70% of the company's sales
consist of semiconductor products and related services, approximately 18%
consist of passive, electro-mechanical, and interconnect products, consisting
primarily of capacitors, resistors, potentiometers, power supplies, relays,
switches, and connectors, and approximately 12% consist of computing, memory,
and other products. Most of the company's customers require delivery
of their orders on schedules or volumes that are generally not available on
direct purchases from manufacturers.
Most
manufacturers of electronic components rely on authorized distributors, such as
the company, to augment their sales and marketing operations. As a
marketing, stocking, technical support, and financial intermediary, the
distributor relieves manufacturers of a portion of the costs, financial risk,
and personnel associated with these functions (including otherwise sizable
investments in finished goods inventories, accounts receivable systems, and
distribution networks), while providing geographically dispersed selling, order
processing, and delivery capabilities. At the same time, the
distributor offers to a broad range of customers the convenience of accessing,
from a single source, multiple products from multiple suppliers and rapid or
scheduled deliveries, as well as other value-added services, such as materials
management,
4
memory programming capabilities, and financing solutions. The
growth of the electronics distribution industry is fostered by the many
manufacturers who recognize their authorized distributors as essential
extensions of their marketing organizations.
Global
ECS
The
company's global ECS business segment is a leading distributor of enterprise and
midrange computing products, services, and solutions to VARs in North America,
Europe, the Middle East and Africa. Over the past several years, the
company has transformed its enterprise computing solutions business into a
stronger organization with broader global reach, increased market share in the
fast-growing product segments of software and storage, and a more robust
customer and supplier base. Execution on the company's strategic
objectives resulted in the global ECS business segment becoming a leading
value-added distributor of enterprise products for various suppliers including
IBM, Sun Microsystems, and Hewlett-Packard and a leading distributor of
enterprise storage and security and virtualization software. The
global ECS geographic footprint has expanded from two countries (the United
States and Canada) in 2005, to 26 countries around the world, including Austria,
Belgium, Canada, Croatia, Czech Republic, Denmark, Estonia, Finland, France,
Germany, Hungary, Israel, Latvia, Lithuania, Luxembourg, Morocco, the
Netherlands, Norway, Poland, Serbia, Slovakia, Slovenia, Sweden, Switzerland,
the United Kingdom, and the United States. Over the past three years,
the global ECS business segment completed the following
acquisitions:
|
|
·
|
In
March 2007, acquired substantially all of the assets and operations of the
KeyLink Systems Group business ("KeyLink") from Agilysys,
Inc. The acquisition of KeyLink, a leading value-added
distributor of enterprise servers, storage and software in the United
States and Canada, brought considerable scale, cross-selling opportunities
and mid-market reseller focus to the company's global ECS business
segment. The company's global ECS business segment also entered
into a long-term procurement agreement with
Agilysys.
|
|
|
·
|
In
September 2007, acquired Centia Group Limited and AKS Group AB
("Centia/AKS"), specialty distributors of access infrastructure, security
and virtualization software solutions in
Europe.
|
|
|
·
|
In
June 2008, acquired LOGIX S.A. ("LOGIX"), a subsidiary of Groupe
OPEN. LOGIX is a leading value-added distributor of midrange
servers, storage, and software to over 6,500 partners in 11
countries. This acquisition established the global ECS business
segment’s presence in the Middle East and Africa, increased its scale
throughout Europe, and strengthened existing relationships with key
suppliers.
|
Within
the global ECS business segment, approximately 26% of the company's sales
consist of proprietary servers, 9% consist of industry standard servers, 30%
consist of software, 29% consist of storage, and 6% consist of
services.
Information
technology ("IT") demands for today’s businesses are evolving. As IT
needs become more complex, corporate information officers are increasingly
seeking products bundled into solutions that support business communication,
operations, processes, and transactions in a competitive manner.
Global
ECS provides VARs with many value-added services, including but not limited to,
vertical market expertise, systems-level training and certification, solutions
testing at Arrow ECS Solutions Centers, financing support, marketing
augmentation, complex order configuration, and access to a one-stop-shop for
mission-critical solutions. Midsize and large companies rely on VARs
for their IT needs, and global ECS works with these VARs to tailor complex,
highly-technical mid-market and enterprise solutions in a cost-competitive
manner. VARs range in size from small and medium-sized businesses to
large global organizations and are typically structured as sales organizations
and service providers. They purchase enterprise and mid-market
computing solutions from distributors and manufacturers and resell them to
end-users. The increasing complexity of these solutions and
increasing demand for bundled solutions is changing how VARs go to market and
increasing the importance of global ECS' value-added services.
5
Global ECS' suppliers benefit from affordable mid-market access,
demand creation, speed to market, and enhanced supply chain
efficiency. For suppliers, global ECS is the aggregation point to
over 18,000 VARs.
In better
serving the needs of both suppliers and VARs, the company’s focus is to evolve
toward a "channel management" model that moves Arrow from being an extension of
suppliers’ sales and marketing organizations to being the outsourced provider
that fully manages their channel. This model benefits suppliers and
VARs alike. Market development activities maximize Arrow’s full line
card, demand and lead generation services and vertical enablement programs to
help suppliers reach more resellers and thus more end-users. Channel
development services support the business needs of resellers with training and
education, business development, financing and engineering to help them
grow. Services such as financial programs, on-site and remote
professional services, supplier services and managed services help resellers
capture more revenue beyond technology sales.
Customers
and Suppliers
The
company and its affiliates serve over 125,000 industrial and commercial
customers. Industrial customers range from major OEMs and CMs to small
engineering firms, while commercial customers primarily include VARs and
OEMs. No single customer accounted for more than 4% of the company's
2009 consolidated sales.
The
products offered by the company are sold by both field sales representatives,
who regularly call on customers in assigned market areas, and by inside sales
personnel, who call on customers by telephone or email from the company's
selling locations. The company also employs sales teams that focus on
small and emerging customers where sales representatives regularly call on
customers by telephone or email from centralized selling locations, and inbound
sales agents serve customers that call into the company.
Each of
the company's North American selling locations and primary distribution centers
in the global components business segment are electronically linked to the
company's central computer system, which provides fully integrated, online,
real-time data with respect to nationwide inventory levels and facilitates
control of purchasing, shipping, and billing. The company's
international operations in the global components business segment utilize
similar online, real-time computer systems, with access to the company's
Worldwide Stock Check System. This system provides global access to
real-time inventory data.
The
company sells the products of over 900 suppliers. Sales of products
and services from IBM accounted for approximately 12% of the company's
consolidated sales in 2009. No other single supplier accounted for
more than 10% of the company's consolidated sales in 2009. The
company believes that many of the products it sells are available from other
sources at competitive prices. However, certain parts of the
company’s business, such as the company's global ECS business segment, rely on a
limited number of suppliers with the strategy of providing focused support, deep
product knowledge, and customized service to suppliers and VARs. Most
of the company's purchases are pursuant to authorized distributor agreements,
which are typically cancelable by either party at any time or on short
notice.
Distribution
Agreements
It is the
policy of most manufacturers to protect authorized distributors, such as the
company, against the potential write-down of inventories due to technological
change or manufacturers' price reductions. Write-downs of inventories
to market value are based upon contractual provisions, which typically provide
certain protections to the company for product obsolescence and price erosion in
the form of return privileges, scrap allowances, and price
protection. Under the terms of the related distributor agreements and
assuming the distributor complies with certain conditions, such suppliers are
required to credit the distributor for reductions in manufacturers' list
prices. As of December 31, 2009, this type of arrangement covered
approximately 68% of the company's consolidated inventories. In
addition, under the terms of many such agreements, the distributor has the right
to return to the manufacturer, for credit, a defined portion of those inventory
items purchased within a designated period of time.
6
A
manufacturer, which elects to terminate a distribution agreement, is generally
required to purchase from the distributor the total amount of its products
carried in inventory. As of December 31, 2009, this type of
repurchase arrangement covered approximately 71% of the company's consolidated
inventories.
While
these industry practices do not wholly protect the company from inventory
losses, the company believes that they currently provide substantial protection
from such losses.
Competition
The
company's business is extremely competitive, particularly with respect to
prices, franchises, and, in certain instances, product availability. The company
competes with several other large multinational and national distributors, as
well as numerous regional and local distributors. As one of the
world's largest electronics distributors, the company's financial resources and
sales are greater than most of its competitors.
Employees
The
company and its affiliates employed approximately 11,300 employees
worldwide as of
December 31, 2009.
Available
Information
The
company files its Annual Report on Form 10-K, Quarterly Reports on Form 10-Q,
Current Reports on Form 8-K, proxy statements, and other documents with the U.S.
Securities and Exchange Commission ("SEC") under the Securities Exchange Act of
1934. A copy of any document the company files with the SEC is
available for review at the SEC's public reference room, 100 F Street, N.E.,
Washington, D.C. 20549. The SEC is reachable at 1-800-SEC-0330 for
further information on the public reference room. The company's SEC
filings are also available to the public on the SEC's Web site at http://www.sec.gov and through the New
York Stock Exchange ("NYSE"), 20 Broad Street, New York, New York 10005, on
which the company's common stock is listed.
You may
obtain a copy of any of the company's filings with the SEC, or any of the
agreements or other documents that constitute exhibits to those filings, by
request directed to the company at the following address and telephone
number:
Arrow
Electronics, Inc.
50 Marcus
Drive
Melville,
New York 11747-4210
(631)
847-2000
Attention:
Corporate Secretary
The
company also makes these filings available, free of charge, through its website
(http://www.arrow.com) as soon
as reasonably practicable after the company files such material with the
SEC. The company does not intend this internet address to be an
active link or to otherwise incorporate the contents of the website into this
Annual Report on Form 10-K.
7
Executive
Officers
The
following table sets forth the names, ages, and the positions held by each of
the executive officers of the company as of February 3, 2010:
|
Name
|
Age
|
Position
|
||
|
Michael
J. Long
|
51
|
Chairman,
President, and Chief Executive Officer
|
||
|
Peter
S. Brown
|
59
|
Senior
Vice President, General Counsel, and Secretary
|
||
|
Andrew
S. Bryant
|
54
|
President,
Arrow Global Enterprise Computing Solutions
|
||
|
Peter
T. Kong
|
59
|
President,
Arrow Global Components
|
||
|
John
P. McMahon
|
57
|
Senior
Vice President, Human Resources
|
||
|
Paul
J. Reilly
|
53
|
Executive
Vice President, Finance and Operations, and Chief Financial
Officer
|
Set forth
below is a brief account of the business experience during the past five years
of each executive officer of the company.
Michael
J. Long was appointed Chairman of the Board of Directors in December 2009 and
Chief Executive Officer of the company in May 2009. He was appointed
a Director and President of the company in February 2008. Prior
thereto he served as Chief Operating Officer of the company from February 2008
to May 2009 and Senior Vice President of the company from January 2006 to
February 2008. He also served as Vice President of the company for
more than five years. He served as President, Arrow Global Components
from September 2006 to February 2008; served as President, North America and
Asia/Pacific Components from January 2006 until September 2006; President, North
America from May 2005 to December 2005; and President and Chief Operating
Officer of Arrow Enterprise Computing Solutions from July 1999 to April
2005.
Peter S.
Brown has been Senior Vice President, General Counsel, and Secretary of the
company for more than five years.
Andrew S.
Bryant was appointed President of Arrow Global Enterprise Computing Solutions in
April 2008. Prior to joining Arrow he served as Chief Operating
Officer for Jennings, Strouss & Salmon, P.L.C. from September 2007 to April
2008; under contract as a consultant to Avnet, Inc. from June 2006 to September
2007, and President of Logistics at Avnet, Inc. from July 2004 to June 2006.
Peter T.
Kong was appointed President of Arrow Global Components in May
2009. Prior thereto he served as President of Arrow Asia/Pacific from
March 2006 to May 2009. Prior to joining Arrow in March 2006, he
served as President of the Asia Pacific Operations for Lear Corporation since
1998.
John P.
McMahon was appointed Senior Vice President, Human Resources of the company in
March 2007. Prior to joining Arrow, he served as Senior Vice
President and Chief Human Resource Officer of UMass Memorial Health Care System
from August 2005 to March 2007 and Senior Vice President of Global Human
Resources at Fisher Scientific from June 2004 to June 2005.
Paul J.
Reilly was appointed Executive Vice President of Finance and Operations in May
2009. Prior thereto he served as Senior Vice President of the company
from May 2005 to May 2009 and Vice President of the company for more than five
years. He has been Chief Financial Officer of the company for more
than five years.
8
Item
1A. Risk
Factors.
Described
below and throughout this report are certain risks that the company’s management
believes are applicable to the company’s business and the industry in which it
operates. If any of the described events occur, the company’s
business, results of operations, financial condition, liquidity, or access to
the capital markets could be materially adversely affected. When
stated below that a risk may have a material adverse effect on the company’s
business, it means that such risk may have one or more of these
effects. There may be additional risks that are not presently
material or known. There are also risks within the economy, the
industry and the capital markets that could materially adversely affect the
company, including those associated with an economic recession, inflation, and
global economic slowdown. The recent financial crisis continues to
affect the banking systems and financial markets and the current uncertainty in
global economic conditions have resulted in a tightening in the credit markets,
a low level of liquidity in many financial markets, and unsettled credit and
equity markets. These factors affect businesses generally, including
the company’s customers and suppliers and, as a result, are not discussed in
detail below except to the extent such conditions could materially affect the
company and its customers and suppliers in particular ways.
If
the company is unable to maintain its relationships with its suppliers or if the
suppliers materially change the terms of their existing agreements with the
company, the company’s business could be materially adversely
affected.
A
substantial portion of the company’s inventory is purchased from suppliers with
which the company has entered into non-exclusive distribution
agreements. These agreements are typically cancelable on short notice
(generally 30 to 90 days). Certain parts of the company’s business,
such as the company's global ECS business, rely on a limited number of
suppliers. For example, sales of products and services from one of
the company's suppliers, IBM, accounted for approximately 12% of the company's
consolidated sales in 2009. To the extent that the company’s
significant suppliers reduce the amount of products they sell through
distribution, or are unwilling to continue to do business with the company, or
are unable to continue to meet or significantly alter their obligations, the
company’s business could be materially adversely affected. In
addition, to the extent that the company’s suppliers modify the terms of their
contracts with the company, or extend lead times, limit supplies due to capacity
constraints, or other factors, there could be a material adverse effect on the
company’s business.
The
competitive pressures the company faces could have a material adverse effect on
the company's business.
The
market for the company's products and services is very competitive and subject
to rapid technological change. Not only does the company compete with
other distributors, it also competes for customers with many of its own
suppliers. Additional competition has emerged from third-party
logistics providers, catalogue distributors, and brokers. The
company's failure to maintain and enhance its competitive position could
adversely affect its business and prospects. Furthermore, the
company's efforts to compete in the marketplace could cause deterioration of
gross profit margins and, thus, overall profitability. The sizes of
the company's competitors vary across market sectors, as do the resources the
company has allocated to the sectors in which it does
business. Therefore, some of the competitors may have a more
extensive customer and/or supplier base than the company in one or more of its
market sectors.
Products
sold by the company may be found to be defective and, as a result, warranty
and/or product liability claims may be asserted against the company, which may
have a material adverse effect on the company.
The
company sells its components at prices that are significantly lower than the
cost of the equipment or other goods in which they are
incorporated. Since a defect or failure in a product could give rise
to failures in the end products that incorporate them, the company may face
claims for damages (such as consequential damages) that are disproportionate to
the revenues and profits it receives from the products involved in the
claims. While the company typically has provisions in its supplier
agreements
9
that hold
the supplier accountable for defective products, and the company and its
suppliers generally exclude consequential damages in their standard terms and
conditions, the company’s ability to avoid such liabilities may be limited as a
result of differing factors, such as the inability to exclude such damages due
to the laws of some of the countries where it does business. The
company’s business could be materially adversely affected as a result of a
significant quality or performance issue in the products sold by the company, if
it is required to pay for the associated damages. Although the
company currently has product liability insurance, such insurance is limited in
coverage and amount.
Declines
in value and other factors pertaining to the company’s inventory could
materially adversely affect its business.
The
market for the company's products and services is subject to rapid technological
change, evolving industry standards, changes in end-market demand, oversupply of
product, and regulatory requirements, which can contribute to the decline in
value or obsolescence of inventory. Although most of the company’s
suppliers provide the company with certain protections from the loss in value of
inventory (such as price protection and certain rights of return), the company
cannot be sure that such protections will fully compensate it for the loss in
value, or that the suppliers will choose to, or be able to, honor such
agreements. For example, many of the company’s suppliers will not
allow products to be returned after they have been held in inventory beyond a
certain amount of time, and, in most instances, the return rights are limited to
a certain percentage of the amount of product the company purchased in a
particular time frame. All of these factors pertaining to
inventory could have a material adverse effect on the company’s
business.
The
company is subject to environmental laws and regulations that could materially
adversely affect its business.
The
company is subject to a wide and ever-changing variety of international and
U.S. federal, state, and local laws and regulations, compliance with which
may require substantial expense. Of particular note are three
European Union ("EU") directives known as the (i) Restriction of Certain
Hazardous Substances Directive ("RoHS"), (ii) the Waste Electrical and
Electronic Equipment Directive, and (iii) the Registration, Evaluation and
Authorisation of Chemicals ("REACH"). The first two directives
restrict the distribution of products within the EU containing certain
substances and require a manufacturer or importer to recycle products containing
those substances. REACH will require companies to inform all
purchasers of certain products in the EU to what extent they contain certain
substances covered by the legislation. In addition, China has passed
the Management Methods on Control of Pollution from Electronic Information
Products, which prohibits the import of products for use in China that contain
similar substances banned by the RoHS directive. Failure to comply
with these directives or any other applicable environmental regulations could
result in fines or suspension of sales. Additionally, these
directives and regulations may result in the company having non-compliant
inventory that may be less readily salable or have to be written
off.
Some
environmental laws impose liability, sometimes without fault, for investigating
or cleaning up contamination on or emanating from the company’s currently or
formerly owned, leased, or operated property, as well as for damages to property
or natural resources and for personal injury arising out of such
contamination. As the distribution business, in general, does not
involve the manufacture of products, it is typically not subject to significant
liability in this area. However, there may be occasions, including
through acquisitions, where environmental liability arises. Such
liability may be joint and several, meaning that the company could be held
responsible for more than its share of the liability involved. The
presence of environmental contamination could also interfere with ongoing
operations or adversely affect the company’s ability to sell or lease its
properties. The discovery of contamination for which the company is
responsible, or the enactment of new laws and regulations, or changes in how
existing requirements are enforced, could require the company to incur costs for
compliance or subject it to unexpected liabilities.
The
foregoing matters could materially adversely affect the company’s
business.
10
The
company is currently involved in the investigation and remediation of
environmental matters at two sites as a result of its Wyle Electronics
acquisition, and the company is in litigation related to those
sites.
In 2000,
the company acquired Wyle Electronics ("Wyle") and assumed its outstanding
liabilities, including responsibility for environmental problems at sites Wyle
had previously owned. The Wyle purchase agreement includes an
indemnification from the seller, now known as E.ON AG, in favor of the company,
covering virtually all costs arising out of or in connection with those
environmental obligations. Two sites are known to have environmental
issues, one at Norco, California and the other at Huntsville,
Alabama. The company has thus far borne most of the cost of the
investigation and remediation of the Norco and Huntsville sites, under the
direction of the cognizant state agencies. The company has spent
approximately $39 million to date in connection with these sites. In
addition, the company was named as a defendant in a private lawsuit filed in
connection with alleged contamination at a small industrial building formerly
leased by Wyle Laboratories in El Segundo, California. The lawsuit
was settled, but the possibility remains that government entities or others may
attempt to involve the company in further characterization or remediation of
groundwater issues in the area.
E.ON AG
acknowledged liability under the contractual indemnities with respect to the
Norco and Huntsville sites and made a small initial payment, but has
subsequently refused to make further payments. As a result, the
company is suing E.ON AG in the Regional Court in Frankfurt,
Germany. The litigation is currently suspended while the company
engages in a court-facilitated mediation with E.ON AG. The mediation
commenced in December 2009 and will continue well into 2010.
As
successor-in-interest to Wyle, the company is the beneficiary of the various
Wyle insurance policies that covered liabilities arising out of operations at
the two contaminated sites. Certain of the insurance carriers
implicated in actions, which were brought in Riverside, California, County Court
by landowners and residents alleging personal injury and property damage caused
by contaminated groundwater and related soil-vapor found in certain residential
areas adjacent to the Norco site, have undertaken substantial portions of the
defense of the company, and the company has recovered approximately $13 million
from them to date. The company has sued certain of the umbrella
liability policy carriers, however, they have yet to make payment on the
tendered losses.
The
company believes strongly in the merits of its positions regarding the E.ON AG
indemnity and the liabilities of the insurance carriers, but there can be no
guarantee of the outcome of litigation. Should and to the extent some
or all of the insurance policies at issue prove insufficient or unavailable, and
E.ON AG prevails in the litigation pending in Germany, the company would be
responsible for the costs. The total costs of 1) the investigation
and remediation of the two sites, 2) the defense of the company and the defense
and indemnity of Wyle Laboratories in the Riverside County cases, 3) the
settlement amount in those cases, and 4) the amount of any shortfall in the
availability of the E.ON AG indemnity and/or the insurance coverage are all as
yet undetermined. Any or all of those costs could have a material
adverse effect on the company's business.
The
company may not have adequate or cost-effective liquidity or capital
resources.
The
company requires cash or committed liquidity facilities for general corporate
purposes, such as funding its ongoing working capital, acquisition, and capital
expenditure needs, as well as to make interest payments on and to refinance
indebtedness. At December 31, 2009, the company had cash and cash
equivalents of $1.14 billion. In addition, the company currently has
access to committed credit lines of $1.4 billion. The company’s
ability to satisfy its cash needs depends on its ability to generate cash from
operations and to access the financial markets, both of which are subject to
general economic, financial, competitive, legislative, regulatory, and other
factors that are beyond its control.
The
company may, in the future, need to access the financial markets to satisfy its
cash needs. The company’s ability to obtain external financing is
affected by various factors including general financial market conditions and
the company’s debt ratings. While, thus far, uncertainties in global
credit markets have not significantly affected the company’s access to capital,
future financing could be difficult or more
11
expensive. Further,
any increase in the company’s level of debt, change in status of its debt from
unsecured to secured debt, or deterioration of its operating results may cause a
reduction in its current debt ratings. Any downgrade in the company’s current
debt rating or tightening of credit availability could impair the company’s
ability to obtain additional financing or renew existing credit facilities on
acceptable terms. Under the terms of any external financing, the
company may incur higher than expected financing expenses and become subject to
additional restrictions and covenants. For example, the company’s existing debt
agreements contain restrictive covenants, including covenants requiring
compliance with specified financial ratios, and a failure to comply with these
or any other covenants may result in an event of default. The
company’s lack of access to cost-effective capital resources, an increase in the
company’s financing costs, or a breach of debt instrument covenants could have a
material adverse effect on the company's business.
The
agreements governing some of the company’s financing arrangements contain
various covenants and restrictions that limit some of management's discretion in
operating the business and could prevent the company from engaging in some
activities that may be beneficial to its business.
The
agreements governing the company’s financings contain various covenants and
restrictions that, in certain circumstances, could limit its ability
to:
|
|
·
|
grant
liens on assets;
|
|
|
·
|
make
restricted payments (including paying dividends on capital stock or
redeeming or repurchasing capital
stock);
|
|
|
·
|
make
investments;
|
|
|
·
|
merge,
consolidate, or transfer all or substantially all of its
assets;
|
|
|
·
|
incur
additional debt; or
|
|
|
·
|
engage
in certain transactions with
affiliates.
|
As a
result of these covenants and restrictions, the company may be limited in how it
conducts its business and may be unable to raise additional debt, compete
effectively, or make investments.
The
company’s failure to have long-term sales contracts may have a material adverse
effect on its business.
Most of
the company’s sales are made on an order-by-order basis, rather than through
long-term sales contracts. The company generally works with its
customers to develop non-binding forecasts for future volume of
orders. Based on such non-binding forecasts, the company makes
commitments regarding the level of business that it will seek and accept, the
inventory that it purchases, and the levels of utilization of personnel and
other resources. A variety of conditions, both specific to each
customer and generally affecting each customer’s industry, such as the continued
tightening of the credit markets, may cause customers to cancel, reduce, or
delay orders that were either previously made or anticipated, go bankrupt or
fail, or default on their payments. Generally, customers cancel,
reduce, or delay purchase orders and commitments without penalty. The
company seeks to mitigate these risks, in some cases, by entering into
noncancelable/nonreturnable sales agreements, but there is no guarantee that
such agreements will adequately protect the company. Significant or
numerous cancellations, reductions, delays in orders by customers, losses of
customers, and/or customer defaults on payments could materially adversely
affect the company’s business.
12
The
company’s revenues originate primarily from the sales of semiconductor, PEMCO
(passive, electro-mechanical and interconnect), IT hardware and software
products, the sales of which are traditionally cyclical.
The
semiconductor industry historically has experienced fluctuations in product
supply and demand, often associated with changes in technology and manufacturing
capacity and subject to significant economic market upturns and
downturns. Sales of semiconductor products and related services
represented approximately 46%, 46%, and 48% of the company’s consolidated sales
in 2009, 2008, and 2007, respectively. The sale of the company's
PEMCO products closely tracks the semiconductor market. Accordingly,
the company’s revenues and profitability, particularly in its global components
business segment, tend to closely follow the strength or weakness of the
semiconductor market. Further, economic weakness could cause a
decline in spending in information technology, which could have a negative
impact on our ECS business. A cyclical downturn in the technology
industry could have a material adverse effect on the company’s business and
negatively impact its ability to maintain historical profitability
levels.
The
company’s non-U.S. sales represent a significant portion of its revenues, and
consequently, the company is increasingly exposed to risks associated with
operating internationally.
In 2009,
2008, and 2007, approximately 57%, 54%, and 50%, respectively, of the company’s
sales came from its operations outside the United States. As a result
of the company’s international sales and locations, its operations are subject
to a variety of risks that are specific to international operations, including
the following:
|
|
·
|
import
and export regulations that could erode profit margins or restrict
exports;
|
|
|
·
|
the
burden and cost of compliance with international laws, treaties, and
technical standards and changes in those
regulations;
|
|
|
·
|
potential
restrictions on transfers of funds;
|
|
|
·
|
import
and export duties and value-added
taxes;
|
|
|
·
|
transportation
delays and interruptions;
|
|
|
·
|
uncertainties
arising from local business practices and cultural
considerations;
|
|
|
·
|
potential
military conflicts and political risks;
and
|
|
|
·
|
currency
fluctuations, which the company attempts to minimize through traditional
hedging instruments.
|
Furthermore,
products the company sells which are either manufactured in the United States or
based on U.S. technology ("U.S. Products") are subject to the Export
Administration Regulations ("EAR") when exported and re-exported to and from all
international jurisdictions, in addition to the local jurisdiction’s export
regulations applicable to individual shipments. Licenses or proper
license exceptions may be required by local jurisdictions’ export regulations,
including EAR, for the shipment of certain U.S. Products to certain countries,
including China, India, Russia, and other countries in which the company
operates. Non-compliance with the EAR or other applicable export
regulations can result in a wide range of penalties including the denial of
export privileges, fines, criminal penalties, and the seizure of
commodities. In the event that any export regulatory body determines
that any shipments made by the company violate the applicable export
regulations, the company could be fined significant sums and/or its export
capabilities could be restricted, which could have a material adverse effect on
the company’s business.
Also, the
company's operating income margins are lower in certain geographic
markets. Operating income in the components business in Asia/Pacific
and information technology business in Europe tends to be lower than operating
income in North America and Europe. As sales in those markets
increased as a percentage of overall sales, consolidated operating income
margins have fallen. The financial impact of lower operating income
on returns on working capital was offset, in part, by lower working capital
requirements. While the company has and will continue to adopt
measures to reduce the potential impact
13
of losses resulting from the risks of doing business abroad, it
cannot ensure that such measures will be adequate and, therefore, could have a
material adverse effect on its business.
When
the company makes acquisitions, it may not be able to successfully integrate
them.
If the
company is unsuccessful in integrating its acquisitions, or if integration is
more difficult than anticipated, the company may experience disruptions that
could have a material adverse effect on its business.
The
company's goodwill and identifiable intangible assets could become impaired,
which could reduce the value of its assets and reduce its net income in the year
in which the write-off occurs.
Goodwill
represents the excess of the cost of an acquisition over the fair value of the
assets acquired. The company also ascribes value to certain
identifiable intangible assets, which consist primarily of customer
relationships, non-competition agreements, a long-term procurement agreement,
customer databases, and sales backlog, among others, as a result of
acquisitions. The company may incur impairment charges on goodwill or
identifiable intangible assets if it determines that the fair values of the
goodwill or identifiable intangible assets are less than their current carrying
values. The company evaluates, on a regular basis, whether events or
circumstances have occurred that indicate all, or a portion, of the carrying
amount of goodwill may no longer be recoverable, in which case an impairment
charge to earnings would become necessary.
See Notes
1 and 3 of the Notes to the Consolidated Financial Statements and 'Critical
Accounting Policies' in Management's Discussion and Analysis of Financial
Condition and Results of Operations for further discussion of the impairment
testing of goodwill and identifiable intangible assets.
A
continued decline in general economic conditions or global equity valuations,
could impact the judgments and assumptions about the fair value of the company's
businesses and the company could be required to record impairment charges on its
goodwill or other identifiable intangible assets in the future, which could
impact the company’s consolidated balance sheet, as well as the company’s
consolidated statement of operations. If the company was required to recognize
an impairment charge in the future, the charge would not impact the company’s
consolidated cash flows, current liquidity, capital resources, and covenants
under its existing revolving credit facility, asset securitization program, and
other outstanding borrowings.
If
the company fails to maintain an effective system of internal controls or
discovers material weaknesses in its internal controls over financial reporting,
it may not be able to report its financial results accurately or timely or
detect fraud, which could have a material adverse effect on its business.
An
effective internal control environment is necessary for the company to produce
reliable financial reports and is an important part of its effort to prevent
financial fraud. The company is required to periodically evaluate the
effectiveness of the design and operation of its internal controls over
financial reporting. Based on these evaluations, the company may
conclude that enhancements, modifications or changes to internal controls are
necessary or desirable. While management evaluates the effectiveness
of the company’s internal controls on a regular basis, these controls may not
always be effective. There are inherent limitations on the
effectiveness of internal controls, including collusion, management override,
and failure in human judgment. In addition, control procedures are
designed to reduce rather than eliminate business risks. If the
company fails to maintain an effective system of internal controls, or if
management or the company’s independent registered public accounting firm
discovers material weaknesses in the company’s internal controls, it may be
unable to produce reliable financial reports or prevent fraud, which could have
a material adverse effect on the company’s business. In addition, the
company may be subject to sanctions or investigation by regulatory authorities,
such as the SEC or the NYSE. Any such actions could result in an
adverse reaction in the financial markets due to a loss of
14
confidence in the reliability of the company’s financial
statements, which could cause the market price of its common stock to decline or
limit the company’s access to capital.
The
company relies heavily on its internal information systems, which, if not
properly functioning, could materially adversely affect the company’s
business.
The
company's current global operations reside on multiple technology
platforms. These platforms are subject to electrical or
telecommunications outages, computer hacking, or other general system failure,
which could have a material adverse effect on the company's
business. Because most of the company's systems consist of a number
of legacy, internally developed applications, it can be harder to upgrade and
may be more difficult to adapt to commercially available
software.
The
company is in the process of converting its various business information systems
worldwide to a single Enterprise Resource Planning system. The
company has committed significant resources to this conversion, and is expected
to be phased in over several years. This conversion is extremely
complex, in part, because of the wide range of processes and the multiple legacy
systems that must be integrated globally. The company will be using a
controlled project plan that it believes will provide for the adequate
allocation of resources. However, such a plan, or a divergence from
it, may result in cost overruns, project delays, or business
interruptions. During the conversion process, the company may be
limited in its ability to integrate any business that it may want to
acquire. Failure to properly or adequately address these issues could
impact the company's ability to perform necessary business operations, which
could materially adversely affect the company’s business.
The
company may be subject to intellectual property rights claims, which are costly
to defend, could require payment of damages or licensing fees and could limit
the company’s ability to use certain technologies in the future.
Certain
of the company’s products include intellectual property owned by the company
and/or its third party suppliers. Substantial litigation and threats
of litigation regarding intellectual property rights exist in the
semiconductor/integrated circuit and software industries. From time
to time, third parties (including certain companies in the business of acquiring
patents not for the purpose of developing technology but with the intention of
aggressively seeking licensing revenue from purported infringers) may assert
patent, copyright and/or other intellectual property rights to technologies that
are important to the company’s business. In some cases,
depending on the nature of the claim, the company may be able to seek
indemnification from its suppliers for itself and its customers against such
claims, but there is no assurance that it will be successful in obtaining such
indemnification or that the company is fully protected against such
claims. In addition, the company is exposed to potential liability
for technology that it develops itself for which it has no indemnification
protections. In any dispute involving products that incorporate
intellectual property developed or licensed by the company, the company’s
customers could also become the target of litigation. The company is
obligated in many instances to indemnify and defend its customers if the
products or services the company sells are alleged to infringe any third party’s
intellectual property rights. Any infringement claim brought against
the company, regardless of the duration, outcome or size of damage award,
could:
|
|
·
|
result
in substantial cost to the company;
|
|
|
·
|
divert
management’s attention and
resources;
|
|
|
·
|
be
time consuming to defend;
|
|
|
·
|
result
in substantial damage awards;
|
|
|
·
|
cause
product shipment delays; or
|
|
|
·
|
require
the company to seek to enter into royalty or other licensing
agreements.
|
Additionally,
if an infringement claim is successful the company may be required to pay
damages or seek royalty or license arrangements, which may not be available on
commercially reasonable terms. The payment of any such damages or
royalties may significantly increase the company’s operating expenses and harm
the company’s operating results and financial condition. Also,
royalty or license arrangements
15
may not be available at all. The company may have to
stop selling certain products or using technologies, which could affect the
company’s ability to compete effectively.
Item
1B. Unresolved
Staff Comments.
None.
Item
2. Properties.
The
company owns and leases sales offices, distribution centers, and administrative
facilities worldwide. Its executive office is located in Melville,
New York and occupies a 163,000 square foot facility under a long-term lease
expiring in 2013. The company owns 14 locations throughout North
America, EMEASA, and the Asia Pacific region and occupies approximately 300
additional locations under leases due to expire on various dates through
2022. The company believes its facilities are well maintained and
suitable for company operations.
Item
3. Legal
Proceedings.
Tekelec
Matters
In 2000,
the company purchased Tekelec Europe SA ("Tekelec") from Tekelec Airtronic SA
("Airtronic") and certain other selling shareholders. Subsequent to
the closing of the acquisition, Tekelec received a product liability claim in
the amount of €11.3 million. The product liability claim was the
subject of a French legal proceeding started by the claimant in 2002, under
which separate determinations were made as to whether the products that are
subject to the claim were defective and the amount of damages sustained by the
purchaser. The manufacturer of the products also participated in this
proceeding. The claimant has commenced legal proceedings against Tekelec
and its insurers to recover damages in the amount of €3.7 million and expenses
of €.3 million plus interest.
Environmental
and Related Matters
Wyle
Claims
In
connection with the 2000 purchase of Wyle from the VEBA Group ("VEBA"), the
company assumed certain of the then outstanding obligations of Wyle, including
Wyle’s 1994 indemnification of the purchasers of its Wyle Laboratories division
for environmental clean-up costs associated with any then existing contamination
or violation of environmental regulations. Under the terms of the company’s
purchase of Wyle from VEBA, VEBA agreed to indemnify the company for costs
associated with the Wyle environmental indemnities, among other things. The
company is aware of two Wyle Laboratories facilities (in Huntsville, Alabama and
Norco, California) at which contaminated groundwater was
identified. Each site will require remediation, the final form and
cost of which is undetermined. As further discussed in Note 15 of the
Notes to Consolidated Financial Statements, the Alabama site is being
investigated by the company under the direction of the Alabama Department of
Environmental Management. The Norco site is subject to a consent
decree, entered in October 2003, between the company, Wyle Laboratories, and the
California Department of Toxic Substance Control.
Wyle
Laboratories has demanded indemnification from the company with respect to the
work at both sites (and in connection with the litigation discussed below), and
the company has, in turn, demanded indemnification from VEBA. VEBA merged with a
publicly–traded, German conglomerate in June 2000. The combined
entity, now known as E.ON AG, remains responsible for VEBA’s liabilities. E.ON
AG acknowledged liability under the terms of the VEBA contract in connection
with the Norco and Huntsville sites and made an initial, partial
payment. Neither the company’s demands for subsequent payments nor
its demand for defense and indemnification in the related litigation and other
costs associated with the Norco site were met.
16
Related
Litigation
In
October 2005, the company filed suit against E.ON AG in the Frankfurt am Main
Regional Court in Germany. The suit seeks indemnification,
contribution, and a declaration of the parties’ respective rights and
obligations in connection with the Riverside County litigation (discussed below)
and other costs associated with the Norco site. In its
answer to the company’s claim filed in March 2009 in the German proceedings,
E.ON AG filed a counterclaim against the company for approximately $16.0
million. The company is in the process of preparing a response to the
counterclaim. The company believes it has reasonable defenses to the
counterclaim and plans to defend its position vigorously. The company
believes that the ultimate resolution of the counterclaim will not materially
adversely impact the company’s consolidated financial position, liquidity, or
results of operations. The litigation is currently suspended while the
company engages in a court-facilitated mediation with E.ON AG. The
mediation commenced in December 2009 and will continue well into
2010.
The
company was named as a defendant in several suits related to the Norco facility,
all of which were consolidated for pre-trial purposes. In January 2005, an
action was filed in the California Superior Court in Riverside County,
California (Gloria Austin, et
al. v. Wyle Laboratories, Inc. et
al.). Approximately 90 plaintiff landowners and residents sued
a number of defendants under a variety of theories for unquantified damages
allegedly caused by environmental contamination at and around the Norco site.
Also filed in the Superior Court in Riverside County were Jimmy Gandara, et al. v. Wyle Laboratories,
Inc. et al. in January
2006, and Lisa Briones, et
al. v. Wyle Laboratories, Inc. et al. in May 2006; both of
which contain allegations similar to those in the Austin case on behalf of
approximately 20 additional plaintiffs. All of these matters have now
been resolved to the satisfaction of the parties.
The
company was also named as a defendant in a lawsuit filed in September 2006 in
the United States District Court for the Central District of California (Apollo
Associates, L.P., et
anno. v. Arrow Electronics, Inc. et al.) in connection with
alleged contamination at a third site, an industrial building formerly leased by
Wyle Laboratories, in El Segundo, California. The lawsuit was settled, though
the possibility remains that government entities or others may attempt to
involve the company in further characterization or remediation of groundwater
issues in the area.
Impact on Financial
Statements
The
company believes that any cost which it may incur in connection with
environmental conditions at the Norco, Huntsville, and El Segundo sites and the
related litigation is covered by the contractual indemnifications (except, under
the terms of the environmental indemnification, for the first $.5 million),
discussed above. The company believes that recovery of costs incurred
to date associated with the environmental clean-up of the Norco and Huntsville
sites, is probable. Accordingly, the company increased the receivable
for amounts due from E.ON AG by $7.3 million during 2009 to $40.9
million. The company’s net costs for such indemnified matters may
vary from period to period as estimates of recoveries are not always recognized
in the same period as the accrual of estimated expenses.
Also
included in the proceedings against E.ON AG is a claim for the reimbursement of
pre-acquisition tax liabilities of Wyle in the amount of $8.7 million for which
E.ON AG is also contractually liable to indemnify the company. E.ON
AG has specifically acknowledged owing the company not less than $6.3 million of
such amounts, but its promises to make payments of at least that amount were not
kept. The company also believes that the recovery of these amounts is
probable.
In
connection with the acquisition of Wyle, the company acquired a $4.5 million tax
receivable due from E.ON AG (as successor to VEBA) in respect of certain tax
payments made by Wyle prior to the effective date of the acquisition, the
recovery of which the company also believes is probable.
As
successor-in-interest to Wyle, the company is the beneficiary of various Wyle
insurance policies that covered liabilities arising out of operations at Norco
and Huntsville. Certain of the insurance carriers implicated in the
Riverside County litigation have undertaken substantial portions of the defense
of the company, and the company has recovered approximately $13 million from
them to date. The company has sued certain of the umbrella liability
policy carriers, however, because they have yet to make payment on the tendered
losses.
The
company believes strongly in the merits of its positions regarding the E.ON AG
indemnity and the liabilities of the insurance carriers.
17
Other
From time
to time, in the normal course of business, the company may become liable with
respect to other pending and threatened litigation, environmental, regulatory,
labor, product, and tax matters. While such matters are subject to inherent
uncertainties, it is not currently anticipated that any such matters will
materially impact the company’s consolidated financial position, liquidity, or
results of operations.
Item
4. Submission of
Matters to a Vote of Security Holders.
None.
18
PART
II
Item
5. Market for
Registrant's Common Equity, Related Stockholder Matters and Issuer Purchases of
Equity Securities.
Market
Information
The
company's common stock is listed on the NYSE (trading symbol:
"ARW"). The high and low sales prices during each quarter of 2009 and
2008 follow:
|
Year
|
High
|
Low
|
||||||
|
2009:
|
||||||||
|
Fourth Quarter
|
$ | 30.10 | $ | 24.85 | ||||
|
Third Quarter
|
30.01 | 19.57 | ||||||
|
Second Quarter
|
25.88 | 18.61 | ||||||
|
First Quarter
|
21.32 | 15.00 | ||||||
|
2008:
|
||||||||
|
Fourth Quarter
|
$ | 26.60 | $ | 11.74 | ||||
|
Third Quarter
|
36.00 | 24.95 | ||||||
|
Second Quarter
|
34.97 | 26.50 | ||||||
|
First Quarter
|
39.44 | 29.00 | ||||||
Holders
On
January 29, 2010, there were approximately 2,900 shareholders of record of the
company's common stock.
Dividend
History
The
company did not pay cash dividends on its common stock during 2009 or 2008.
While from time to time the Board of Directors considers the payment of
dividends on the common stock, the declaration of future dividends is dependent
upon the company's earnings, financial condition, and other relevant factors,
including debt covenants.
19
Equity
Compensation Plan Information
The
following table summarizes information, as of December 31, 2009, relating to the
Omnibus Incentive Plan, which was approved by the company’s shareholders and
under which cash-based awards, non-qualified stock options, incentive stock
options, stock appreciation rights, restricted stock or restricted stock units,
performance shares or units, covered employee annual incentive awards, and other
stock-based awards may be granted.
|
Plan
Category
|
Number
of
Securities
to
be
Issued
Upon
Exercise
of
Outstanding
Options,
Warrants
and
Rights
|
Weighted
Average
Exercise
Price
of
Outstanding
Options,
Warrants
and
Rights
|
Number
of
Securities
Remaining
Available
for
Future
Issuance
|
|||||||||
|
Equity
compensation plans approved by security holders
|
6,464,861 | $ | 27.30 | 3,715,621 | ||||||||
|
Equity
compensation plans not approved by security holders
|
- | - | - | |||||||||
|
Total
|
6,464,861 | $ | 27.30 | 3,715,621 | ||||||||
Performance
Graph
The
following graphs compare the performance of the company's common stock for the
periods indicated with the performance of the Standard & Poor's 500 Stock
Index ("S&P 500 Stock Index") and the average performance of a group
consisting of the company's peer companies on a line-of-business
basis. The graphs assume $100 invested on December 31, 2004 in the
company, the S&P 500 Stock Index, and the Peer Group. Total
return indices reflect reinvestment of dividends and are weighted on the basis
of market capitalization at the time of each reported data point. During 2009,
the company expanded its Peer Group to include Ingram Micro Inc. and Tech Data
Corp. to reflect additional competitors in the enterprise computing solutions
industry, which has become a more significant portion of the company's business
over the past several years.
The
companies included in the below graph for the new Peer Group are Avnet, Inc.,
Bell Microproducts, Inc., Ingram Micro Inc., Jaco Electronics, Inc., Nu Horizons
Electronics Corp. and Tech Data Corp.
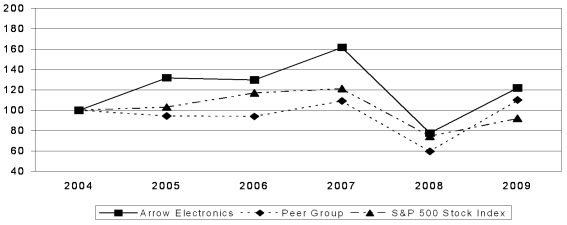
20
|
2004
|
2005
|
2006
|
2007
|
2008
|
2009
|
|||||||||||||||||||
|
Arrow
Electronics
|
100 | 132 | 130 | 162 | 78 | 122 | ||||||||||||||||||
|
Peer
Group
|
100 | 94 | 94 | 109 | 60 | 110 | ||||||||||||||||||
|
S&P
500 Stock Index
|
100 | 103 | 117 | 121 | 75 | 92 | ||||||||||||||||||
The
companies included in the below graph for the old Peer Group are Avnet, Inc.,
Bell Microproducts, Inc., Jaco Electronics, Inc., and Nu Horizons Electronics
Corp.
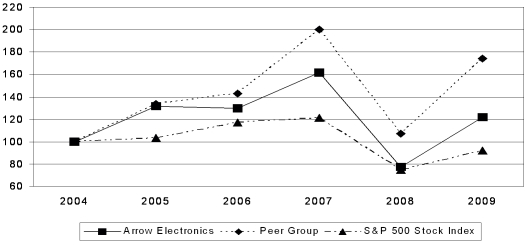
|
2004
|
2005
|
2006
|
2007
|
2008
|
2009
|
|||||||||||||||||||
|
Arrow
Electronics
|
100 | 132 | 130 | 162 | 78 | 122 | ||||||||||||||||||
|
Peer
Group
|
100 | 133 | 143 | 200 | 107 | 174 | ||||||||||||||||||
|
S&P
500 Stock Index
|
100 | 103 | 117 | 121 | 75 | 92 | ||||||||||||||||||
Unregistered
Sales of Equity Securities and Use of Proceeds
The
following table shows the share-repurchase activity for the quarter ended
December 31, 2009:
|
Month
|
Total
Number
of
Shares
Purchased
|
Average
Price
Paid
per
Share
|
Total
Number of
Shares
Purchased
as
Part
of Publicly
Announced
Program
|
Approximate
Dollar
Value
of Shares that
May
Yet be
Purchased
Under
the
Program
|
||||||||||||
|
October
4 through 31, 2009
|
93 | $ | 25.65 | - | - | |||||||||||
|
November
1 through 30, 2009
|
4,008 | 26.85 | - | - | ||||||||||||
|
December
1 through 31, 2009
|
1,558 | 27.40 | - | - | ||||||||||||
|
Total
|
5,659 | - | ||||||||||||||
The
purchases of Arrow common stock noted above reflect shares that were withheld
from employees for restricted stock, as permitted by the plan, in order to
satisfy the required tax withholding obligations. None of these purchases were
made pursuant to a publicly announced repurchase plan and the company currently
does not employ a stock repurchase plan.
21
Item
6. Selected Financial
Data.
The
following table sets forth certain selected consolidated financial data and must
be read in conjunction with the company's consolidated financial statements and
related notes appearing elsewhere in this Annual Report on Form 10-K (dollars in
thousands except per share data):
|
For
the years ended
December 31: |
2009 (a)
|
2008 (b)
|
2007 (c)
|
2006
(d)(g)
|
2005 (e)(f)(g)
|
|||||||||||||||
|
Sales
|
$ | 14,684,101 | $ | 16,761,009 | $ | 15,984,992 | $ | 13,577,112 | $ | 11,164,196 | ||||||||||
|
Operating
income (loss)
|
$ | 272,787 | $ | (493,569 | ) | $ | 686,905 | $ | 606,225 | $ | 480,258 | |||||||||
|
Net
income (loss)
attributable to shareholders |
$ | 123,512 | $ | (613,739 | ) | $ | 407,792 | $ | 388,331 | $ | 253,609 | |||||||||
|
Net
income (loss) per share:
|
||||||||||||||||||||
|
Basic
|
$ | 1.03 | $ | (5.08 | ) | $ | 3.31 | $ | 3.19 | $ | 2.15 | |||||||||
|
Diluted
|
$ | 1.03 | $ | (5.08 | ) | $ | 3.28 | $ | 3.16 | $ | 2.09 | |||||||||
|
At
December 31:
|
||||||||||||||||||||
|
Accounts
receivable and inventories
|
$ | 4,533,809 | $ | 4,713,849 | $ | 4,961,035 | $ | 4,401,857 | $ | 3,811,914 | ||||||||||
|
Total
assets
|
7,762,366 | 7,118,285 | 8,059,860 | 6,669,572 | 6,044,917 | |||||||||||||||
|
Long-term
debt
|
1,276,138 | 1,223,985 | 1,223,337 | 976,774 | 1,138,981 | |||||||||||||||
|
Shareholders'
equity
|
2,916,960 | 2,676,698 | 3,551,860 | 2,996,559 | 2,372,886 | |||||||||||||||
|
(a)
|
Operating
income and net income attributable to shareholders include restructuring,
integration, and other charges of $105.5 million ($75.7 million net of
related taxes or $.63 per share on both a basic and diluted
basis). Net income attributable to shareholders also includes a
loss on prepayment of debt of $5.3 million ($3.2 million net of related
taxes or $.03 per share on both a basic and diluted
basis).
|
|
(b)
|
Operating
loss and net loss attributable to shareholders include a non-cash
impairment charge associated with goodwill of $1.02 billion ($905.1
million net of related taxes or $7.49 per share on both a basic and
diluted basis) and restructuring, integration, and other charges of $81.0
million ($61.9 million net of related taxes or $.51 per share on both a
basic and diluted basis). Net loss attributable to shareholders
also includes a loss of $10.0 million ($.08 per share on both a basic and
diluted basis) on the write-down of an investment, and a reduction of the
provision for income taxes of $8.5 million ($.07 per share on both a basic
and diluted basis) and an increase in interest expense of $1.0 million
($1.0 million net of related taxes or $.01 per share on both a basic and
diluted basis) primarily related to the settlement of certain
international income tax matters.
|
|
(c)
|
Operating
income and net income attributable to shareholders include restructuring,
integration, and other charges of $11.7 million ($7.0 million net of
related taxes or $.06 per share on both a basic and diluted
basis). Net income attributable to shareholders also includes
an income tax benefit of $6.0 million, net, ($.05 per share on both a
basic and diluted basis) principally due to a reduction in deferred income
taxes as a result of the statutory tax rate change in
Germany.
|
|
(d)
|
Operating
income and net income attributable to shareholders include restructuring,
integration, and other charges of $16.1 million ($11.7 million net of
related taxes or $.10 per share on both a basic and diluted basis). Net
income attributable to shareholders also includes a loss on prepayment of
debt of $2.6 million ($1.6 million net of related taxes or $.01 per share
on both a basic and diluted basis) and the reduction of the provision for
income taxes of $46.2 million ($.38 per share on both a basic and diluted
basis) and the reduction of interest expense of $6.9 million ($4.2 million
net of related taxes or $.03 per share on both a basic and diluted basis)
related to the settlement of certain income tax
matters.
|
22
|
(e)
|
Operating
income and net income attributable to shareholders include restructuring,
integration, and other charges of $11.0 million ($6.0 million net of
related taxes or $.05 per share on both a basic and diluted
basis). Net income attributable to shareholders also includes a
loss on prepayment of debt of $4.3 million ($2.6 million net of related
taxes or $.02 and $.01 per share on a basic and diluted basis,
respectively) and a loss of $3.0 million ($.03 per share on both a basic
and diluted basis) on the write-down of an
investment.
|
|
(f)
|
Effective
January 1, 2006, the company began measuring share-based payment awards
exchanged for employee services at fair value and recorded an expense
related to such awards in the consolidated statements of operations over
the requisite employee service period. Prior to January 1,
2006, the company accounted for share-based payment awards using the
intrinsic value method and was not required to record any expense in the
consolidated financial statements if the exercise price of the award was
not less than the market price of the underlying stock on the date of
grant. Had compensation expense been determined in accordance
with the fair value method of accounting at the grant dates for awards
under the company's various stock-based compensation plans, operating
income and net income attributable to shareholders for 2005 would be
reduced by $15.2 million and $9.1 million ($.08 and $.07 per share on a
basic and diluted basis,
respectively).
|
|
(g)
|
Effective
January 1, 2009, the company adopted the provisions of Financial
Accounting Standards Board ("FASB") Accounting Standards Codification
("ASC") Topic 810-10-65, which requires, among other things, that the
presentation and disclosure requirements be applied retrospectively for
all periods presented. The adoption of FASB ASC Topic 810-10-65
did not have a material impact on the company’s consolidated financial
position or results of operations and, accordingly, selected financial
data was not restated to reflect the adoption of FASB ASC Topic 810-10-65
for financial statement periods dated prior to those included in this
Annual Report on Form 10-K (2006 and 2005). Reference to net
income (loss) attributable to shareholders for 2006 and 2005 is equivalent
to net income (loss) as presented in the company’s consolidated statements
of operations for those
periods.
|
23
Item 7.
Management's
Discussion and Analysis of Financial Condition and Results of
Operations.
Overview
The
company is a global provider of products, services, and solutions to industrial
and commercial users of electronic components and enterprise computing
solutions. The company provides one of the broadest product offerings
in the electronic components and enterprise computing solutions distribution
industries and a wide range of value-added services to help customers reduce
time to market, lower their total cost of ownership, introduce innovative
products through demand creation opportunities, and enhance their overall
competitiveness. The company has two business segments, the global
components business segment and the global ECS business segment. The
company distributes electronic components to OEMs and CMs through its global
components business segment and provides enterprise computing solutions to VARs
through its global ECS business segment. For 2009, approximately 66%
of the company's sales were from the global components business segment, and
approximately 34% of the company's sales were from the global ECS business
segment.
Operating
efficiency and working capital management remain a key focus of the company's
business initiatives to grow sales faster than the market, grow profits faster
than sales, and increase return on invested capital. To achieve its
financial objectives, the company seeks to capture significant opportunities to
grow across products, markets, and geographies. To supplement its
organic growth strategy, the company continually evaluates strategic
acquisitions to broaden its product offerings, increase its market penetration,
and/or expand its geographic reach. Cash flow needed to fund
this growth is primarily expected to be generated through continuous
corporate-wide initiatives to improve profitability and increase effective asset
utilization.
On June
2, 2008, the company acquired LOGIX, a subsidiary of Groupe OPEN for a purchase
price of $252.6 million, which includes assumption of debt and acquisition
costs. On March 31, 2007, the company acquired from Agilysys
substantially all of the assets and operations of KeyLink for a purchase price
of $480.6 million in cash, which included acquisition costs and final
adjustments based upon a closing audit. The company also entered into
a long-term procurement agreement with Agilysys. Results of
operations of LOGIX and KeyLink were included in the company's consolidated
results from the date of acquisition within the company's global ECS business
segment.
Consolidated
sales for 2009 declined by 12.4%, compared with the year-earlier period, due to
a 13.9% decrease in the global components business segment sales and a 9.3%
decrease in the global ECS business segment sales.
Net
income attributable to shareholders increased to $123.5 million in 2009,
compared with a net loss attributable to shareholders of $613.7 million in the
year-earlier period. The following items impacted the comparability
of the company's results for the years ended December 31, 2009 and
2008:
|
|
·
|
restructuring,
integration, and other charges of $105.5 million ($75.7 million net of
related taxes) in 2009 and $81.0 million ($61.9 million net of related
taxes) in 2008;
|
|
|
·
|
a
non-cash impairment charge associated with goodwill of $1.02 billion
($905.1 million net of related taxes) in
2008;
|
|
|
·
|
a
loss on prepayment of debt of $5.3 million ($3.2 million net of related
taxes) in 2009;
|
|
|
·
|
a
loss of $10.0 million on the write-down of an investment in 2008;
and
|
|
|
·
|
a
reduction of the provision for income taxes of $8.5 million and an
increase in interest expense of $1.0 million ($1.0 million net of related
taxes) primarily related to the settlement of certain international income
tax matters in 2008.
|
Excluding
the above-mentioned items, the decrease in net income attributable to
shareholders for 2009 was primarily the result of the sales declines in the
global ECS business segment and the more profitable global components businesses
in North America and Europe, as well as competitive pricing pressure impacting
gross profit margins. These decreases were offset, in part, by a
reduction in selling, general and administrative expenses ("SG&A") due to
the company’s continuing efforts to streamline and simplify
24
processes
and to reduce expenses in response to the decline in sales due to the worldwide
economic recession, as well as a reduction in net interest and other financing
expense.
Substantially
all of the company's sales are made on an order-by-order basis, rather than
through long-term sales contracts. As such, the nature of the
company's business does not provide for the visibility of material
forward-looking information from its customers and suppliers beyond a few
months.
Sales
Following
is an analysis of net sales (in millions) by reportable segment for the years
ended December 31:
|
2009
|
2008
|
% Change
|
||||||||||
|
Global
components
|
$ | 9,751 | $ | 11,319 | (13.9 | )% | ||||||
|
Global
ECS
|
4,933 | 5,442 | (9.3 | )% | ||||||||
|
Consolidated
|
$ | 14,684 | $ | 16,761 | (12.4 | )% | ||||||
Consolidated
sales for 2009 declined by $2.08 billion, or 12.4%, compared with the
year-earlier period. The decrease was driven by a decrease in the
global components business segment of $1.57 billion, or 13.9%, and a decrease in
the global ECS business segment of $508.7 million, or 9.3%. On a pro
forma basis, which includes LOGIX as though this acquisition occurred on January
1, 2008, consolidated sales for 2009 decreased 13.5%. The translation
of the company's international financial statements into U.S. dollars resulted
in decreased sales of $350.7 million for 2009, compared with the year-earlier
period, due to a stronger U.S. dollar. Excluding the impact of
foreign currency, the company's consolidated sales decreased by 10.5% in
2009.
In the
global components business segment, sales for 2009 decreased primarily due to
weakness in North America and Europe as a result of lower demand for products
due to the worldwide economic recession and the impact of a stronger U.S. dollar
on the translation of the company's international financial
statements. The decrease in sales for 2009 was offset, in part, by
strength in the Asia Pacific region. Excluding the impact of foreign
currency, the company's global components business segment sales decreased by
11.4% for 2009.
In the
global ECS business segment, the decrease in sales for 2009 was primarily due to
lower demand for products due to the worldwide economic recession and the impact
of a stronger U.S. dollar on the translation of the company's international
financial statements. The decrease in sales for 2009 was offset, in
part, by the LOGIX acquisition. On a pro forma basis, which includes
LOGIX as though this acquisition occurred on January 1, 2008, the global ECS
business segment sales for 2009 declined by 12.7%. Excluding the impact of
foreign currency, the company's global ECS business segment sales decreased 8.7%
for 2009.
Following
is an analysis of net sales (in millions) by reportable segment for the years
ended December 31:
|
2008
|
2007
|
% Change
|
||||||||||
|
Global
components
|
$ | 11,319 | $ | 11,224 | 0.8 | % | ||||||
|
Global
ECS
|
5,442 | 4,761 | 14.3 | % | ||||||||
|
Consolidated
|
$ | 16,761 | $ | 15,985 | 4.9 | % | ||||||
Consolidated
sales for 2008 increased by $776.0 million, or 4.9%, compared with the
year-earlier period. The increase was driven by an increase in the
global components business segment of $95.7 million, or
25
less than
1%, and an increase in the global ECS business segment of $680.3 million, or
14.3%. The translation of the company's international financial
statements into U.S. dollars resulted in increased sales of $293.4 million for
2008, compared with the year-earlier period, due to a weaker U.S.
dollar. Excluding the impact of foreign currency, the company's
consolidated sales increased by 3.0% in 2008.
In the
global components business segment, sales for 2008 increased by less than 1%
compared with the year-earlier period, primarily due to strength in the Asia
Pacific region and the impact of a weaker U.S. dollar on the translation of the
company's international financial statements. This was offset, in
part, by weakness in North America and Europe. Excluding the impact
of foreign currency, the company's global components business segment sales
decreased by 1.3% for 2008.
In the
global ECS business segment, sales for 2008 increased by 14.3%, compared with
the year-earlier period, primarily due to the KeyLink and LOGIX
acquisitions. On a pro forma basis, which includes KeyLink and LOGIX
as though these acquisitions occurred on January 1, 2007 and excluding KeyLink
sales from the related long-term procurement agreement with Agilysys for the
first quarter of 2008, the global ECS business segment sales for 2008 decreased
by less than 1%, compared with the year-earlier period. This decrease
was primarily due to weakness of servers, offset, in part, by the impact of a
weaker U.S. dollar on the translation of the company’s international financial
statements and growth in storage, software, and services. Excluding the impact
of foreign currency, the company's global ECS business segment sales increased
by 13.3% for 2008.
Gross
Profit
The
company recorded gross profit of $1.75 billion and $2.28 billion for 2009 and
2008, respectively. The gross profit margin for 2009 decreased
by approximately 170 basis points when compared with the year-earlier
period. Approximately two-thirds of the decrease in gross profit
percent was due to increased competitive pricing pressure in both the company's
business segments, and the remaining one-third was due to a change in
the mix in the company's business, with the global ECS business segment and Asia
Pacific region being a greater percentage of total sales. The
competitive pricing pressure experienced by the company during the first half of
2009 lessened in the second half of 2009. The profit margins of
products in the global ECS business segment are typically lower than the profit
margins of the products in the global components business segment, and the
profit margins of the components sold in the Asia Pacific region tend to be
lower than the profit margins in North America and Europe. The
financial impact of the lower gross profit was offset, in part, by the lower
operating costs and lower working capital requirements in the global ECS
business segment and the Asia Pacific region relative to the company’s
other businesses.
The
company recorded gross profit of $2.28 billion and $2.29 billion for 2008 and
2007, respectively. The gross profit margin for 2008 decreased
by approximately 70 basis points when compared with the year-earlier
period. The decrease in gross profit was due, in part, to the KeyLink
and LOGIX acquisitions, which are both lower gross profit margin
businesses. On a pro forma basis, which includes KeyLink and LOGIX as
though these acquisitions occurred on January 1, 2007, the gross profit margin
for 2008 decreased by approximately 60 basis points when compared with the
year-earlier period. This was primarily due to a change in the mix in
the company's business, with the global ECS business segment and Asia Pacific
region being a greater percentage of total sales.
Restructuring,
Integration, and Other Charges
2009
Charges
In 2009,
the company recorded restructuring, integration, and other charges of $105.5
million ($75.7 million net of related taxes or $.63 per share on both a basic
and diluted basis). Included in the restructuring, integration, and
other charges for 2009 is a restructuring charge of $100.3 million related to
initiatives by the company to improve operating efficiencies. Also
included in the restructuring, integration, and other charges for 2009 are
restructuring charges of $2.6 million and integration credits of $1.3 million
related to adjustments to restructuring and integration reserves established in
prior periods and acquisition-related expenses of $3.9 million.
26
The
restructuring charge of $100.3 million in 2009 primarily includes personnel
costs of $90.9 million and facilities costs of $8.0 million. The
personnel costs are related to the elimination of approximately 1,605 positions
within the global components business segment and approximately 320 positions
within the global ECS business segment. The facilities costs are related to exit
activities for 28 vacated facilities worldwide due to the company's continued
efforts to streamline its operations and reduce real estate
costs. These initiatives are due to the company's continued efforts
to lower cost and drive operational efficiency.
The
above-mentioned charges were incurred in connection with the company's cost
reduction initiatives announced in the fourth quarter of 2008 and second quarter
of 2009, which are expected to result in $275 million of annual savings, of
which $225 million is expected to be permanent.
2008
Charges
In 2008,
the company recorded restructuring, integration, and other charges of $81.0
million ($61.9 million net of related taxes or $.51 per share on both a basic
and diluted basis). Included in the restructuring, integration, and
other charges for 2008 is a restructuring charge of $69.8 million related to
initiatives by the company to improve operating efficiencies. Also
included in the restructuring, integration, and other charges for 2008 is a
restructuring credit of $.3 million related to adjustments to reserves
previously established through restructuring charges in prior periods, an
integration charge of $.6 million, primarily related to the ACI and KeyLink
acquisitions, and a charge related to a preference claim from 2001 of $10.9
million.
The
restructuring charge of $69.8 million in 2008 primarily includes personnel costs
of $39.4 million, facility costs of $4.3 million, and a write-down of a building
and related land of $25.4 million. These initiatives are the result
of the company's continued efforts to lower cost and drive operational
efficiency. The personnel costs are primarily associated with the elimination of
approximately 750 positions across multiple functions and multiple
locations. The facilities costs are related to the exit activities of
9 vacated facilities in North America and Europe. During the fourth
quarter of 2008, the company recorded an impairment charge of $25.4 million in
connection with an approved plan to actively market and sell a building and
related land in North America within the company's global components business
segment. The decision to exit this location was made to enable the
company to consolidate facilities and reduce future operating
costs. The company wrote-down the carrying values of the building and
related land to their estimated fair values less cost to sell and ceased
recording depreciation.
In 2008,
an opinion was rendered in a bankruptcy proceeding (Bridge Information Systems,
et. anno v. Merisel
Americas, Inc. & MOCA) in favor of Bridge Information Systems ("Bridge"),
the estate of a former global ECS customer that declared bankruptcy in
2001. The proceeding is related to sales made in 2000 and early 2001
by the MOCA division of ECS, a company Arrow purchased from Merisel Americas in
the fourth quarter of 2000. The court held that certain of the
payments received by the company at the time were preferential and must be
returned to Bridge. Accordingly, during 2008, the company recorded a
charge of $10.9 million in connection with the preference claim from 2001,
including legal fees.
2007
Charges
In 2007,
the company recorded restructuring, integration, and other charges of $11.7
million ($7.0 million net of related taxes or $.06 per share on both a basic and
diluted basis). Included in the restructuring, integration, and other
charges for 2007 is $9.7 million related to initiatives by the company to
improve operating efficiencies. Also included in the restructuring,
integration, and other charges for 2007 is a restructuring credit of $.9 million
primarily related to the reversal of excess reserves, which were previously
established through restructuring charges in prior periods, and an integration
charge of $2.9 million primarily related to the acquisition of
KeyLink.
The
restructuring charge of $9.7 million in 2007 primarily includes personnel costs
of $11.3 million and a
27
facilities
credit of $1.9 million. The personnel costs are related to the
elimination of approximately 400 positions. These positions were
primarily within the company's global components business segment in North
America and related to the company's continued focus on operational
efficiency. The facilities credit is primarily related to a gain on
the sale of the Harlow, England facility of $8.5 million that was vacated in
2007. This was offset by facilities costs of $6.6 million, primarily
related to exit activities for a vacated facility in Europe due to the company's
continued efforts to reduce real estate costs.
Integration
costs of $3.7 million in 2007 include $2.9 million recorded as an integration
charge and $.8 million recorded as additional costs in excess of net assets of
companies acquired. The integration costs include personnel costs of
$1.7 million associated with the elimination of approximately 50 positions in
North America related to the acquisition of KeyLink, a credit of $.5 million
primarily related to the reversal of excess facility-related accruals in
connection with certain acquisitions made prior to 2005 and other costs of $2.6
million.
Impairment
Charge
The
company tests goodwill for impairment annually as of the first day of the fourth
quarter, or more frequently if indicators of potential impairment
exist. During the fourth quarter of 2008, as a result of significant
declines in macroeconomic conditions, global equity valuations
depreciated. Both factors impacted the company’s market
capitalization, and the company determined it was necessary to perform an
interim impairment test of its goodwill and identifiable intangible
assets. Based upon the results of such testing, the company concluded
that a portion of its goodwill was impaired and, as such, recognized a non-cash
impairment charge of $1.02 billion ($905.1 million net of related taxes or $7.49
per share on both a basic and diluted basis) as of December 31, 2008, of which
$716.9 million related to the company's global components business segment and
$301.9 million related to the company's global ECS business
segment. The impairment charge did not impact the company’s
consolidated cash flows, liquidity, capital resources, and covenants under its
existing revolving credit facility, asset securitization program, and other
outstanding borrowings.
Operating
Income (Loss)
The
company recorded operating income of $272.8 million in 2009 as compared with an
operating loss of $493.6 million in 2008. Included in operating
income for 2009 was the previously discussed restructuring, integration, and
other charges of $105.5 million. Included in the operating loss for
2008 was the previously discussed impairment charge associated with goodwill of
$1.02 billion and restructuring, integration, and other charges of $81.0
million.
SG&A
decreased $301.7 million, or 18.8%, in 2009, as compared with 2008, on a sales
decrease of 12.4%. The dollar decrease compared with the year-earlier
period, was due to the company's continuing efforts to streamline and simplify
processes and to reduce expenses in response to the decline in sales, as well as
the impact of foreign exchange rates. This decrease was offset, in
part, by expenses incurred by LOGIX, which was acquired in June
2008. SG&A, as a percentage of sales, was 8.9% and 9.6% for 2009
and 2008, respectively.
The
company recorded an operating loss of $493.6 million in 2008 as compared with
operating income of $686.9 million in 2007. Included in the operating
loss for 2008 was the previously discussed impairment charge associated with
goodwill of $1.02 billion and restructuring, integration, and other charges of
$81.0 million. Included in operating income for 2007 was the
previously discussed restructuring, integration, and other charges of $11.7
million.
SG&A
increased $87.4 million, or 5.7%, in 2008, as compared with 2007, on a sales
increase of 4.9%. The dollar increase compared with the year-earlier
period, was due to the impact of foreign exchange rates, expenses incurred by
acquired companies, and increased expenditures related to the company's global
ERP initiative. SG&A, as a percentage of sales, was 9.6% and 9.5%
for 2008 and 2007, respectively.
28
Loss
on Prepayment of Debt
During
2009, the company recorded a loss on prepayment of debt of $5.3 million ($3.2
million net of related taxes or $.03 per share on both a basic and diluted
basis), related to the repurchase of $130.5 million principal amount of its
9.15% senior notes due 2010. The loss on prepayment of debt includes
the premium paid and write-off of the deferred financing costs, offset by the
gain for terminating the related interest rate swaps.
Loss
on Write-Down of an Investment
During
2008, the company determined that an other-than-temporary decline in the fair
value of its investment in Marubun Corporation occurred and, accordingly,
recognized a loss of $10.0 million ($.08 per share on both a basic and diluted
basis) on the write-down of this investment.
Interest
and Other Financing Expense, Net
Net
interest and other financing expense decreased by 16.6% in 2009 to $83.3
million, compared with $99.9 million in 2008, primarily due to lower interest
rates on the company’s variable rate debt and lower average debt
outstanding.
Net
interest and other financing expense decreased by 1.7% in 2008 to $99.9 million,
compared with $101.6 million in 2007, primarily due to lower interest rates on
the company’s variable rate debt offset, in part, by an increase in interest
expense of $1.0 million primarily related to the settlement of certain
international income tax matters (discussed in "Income Taxes"
below).
Income
Taxes
The
company recorded a provision for income taxes of $65.4 million (an effective tax
rate of 34.6%) for 2009. The company's provision and effective tax
rate for 2009 were impacted by the previously discussed restructuring,
integration, and other charges and loss on the prepayment of
debt. Excluding the impact of the above-mentioned items, the
company's effective tax rate was 32.5% for 2009.
The
company recorded a provision for income taxes of $16.7 million (an effective tax
rate of (2.8%)) for 2008. During the fourth quarter of 2008, the
company recorded a reduction of the provision of $8.5 million ($.07 per share on
both a basic and diluted basis) primarily related to the settlement of certain
international tax matters covering multiple tax years. The company's
provision and effective tax rate for 2008 were impacted by the previously
discussed settlement of certain international income tax matters, impairment
charge associated with goodwill, restructuring, integration, and other charges,
and loss on the write-down of an investment. Excluding the impact of
the above-mentioned items, the company's effective tax rate was 30.7% for
2008.
The
company recorded a provision for income taxes of $180.7 million (an effective
tax rate of 30.5%) for 2007. During 2007, the company recorded an
income tax benefit of $6.0 million, net, ($.05 per share on both a basic and
diluted basis) principally due to a reduction in deferred income taxes as a
result of the statutory tax rate change in Germany. These deferred
income taxes primarily related to the amortization of intangible assets for
income tax purposes, which are not amortized for accounting
purposes. The company's provision and effective tax rate for 2007
were impacted by the aforementioned income tax benefit and the previously
discussed restructuring, integration, and other charges. Excluding
the impact of the above-mentioned items, the company's effective tax rate was
31.7% for 2007.
The
company's provision for income taxes and effective tax rate are impacted by,
among other factors, the statutory tax rates in the countries in which it
operates and the related level of income generated by these
operations.
29
Net
Income (Loss) Attributable to Shareholders
The
company recorded net income attributable to shareholders of $123.5 million for
2009, compared with a net loss of $613.7 million in the year-earlier period.
Included in the net income for 2009 was the previously discussed restructuring,
integration, and other charges of $75.7 million and loss on the prepayment of
debt of $3.2 million. Included in the net loss attributable to
shareholders for 2008 was the previously discussed impairment charge associated
with goodwill of $905.1 million, restructuring, integration, and other charges
of $61.9 million, and loss on the write-down of an investment of $10.0 million,
as well as, a reduction of the provision for income taxes of $8.5 million and an
increase in interest expense, net of related taxes, of $1.0 million related to
the settlement of certain international income tax matters. Excluding
the above-mentioned items, the decrease in net income attributable to
shareholders was primarily the result of the sales declines in the global ECS
business segment and the more profitable global components businesses in North
America and Europe, as well as competitive pricing pressure impacting gross
profit margins. These decreases were offset, in part, by a reduction
in SG&A due to the company’s continuing efforts to streamline and simplify
processes and to reduce expenses in response to the decline in sales due to the
worldwide economic recession, as well as a reduction in net interest and other
financing expense.
The
company recorded a net loss of $613.7 million for 2008, compared with net income
of $407.8 million in the year-earlier period. Included in the net loss for 2008
was the previously discussed impairment charge associated with goodwill of
$905.1 million, restructuring, integration, and other charges of $61.9 million,
and loss on the write-down of an investment of $10.0 million, as well as, a
reduction of the provision for income taxes of $8.5 million and an increase in
interest expense, net of related taxes, of $1.0 million related to the
settlement of certain international income tax matters. Included in
net income for 2007 was the previously discussed restructuring, integration, and
other charges of $7.0 million and income tax benefit of $6.0 million, net,
principally due to a reduction in deferred income tax as a result of the
statutory tax rate change in Germany. Excluding the above-mentioned
items, the decrease in net income in 2008 was primarily the result of the sales
decline in the more profitable components businesses in North America and Europe
and increased expenditures related to the company's global ERP initiative
offset, in part, by increased sales in the global ECS business segment and the
global components businesses in the Asia Pacific region and by a lower effective
tax rate.
Liquidity
and Capital Resources
At
December 31, 2009 and 2008, the company had cash and cash equivalents of $1.14
billion and $451.3 million, respectively.
During
2009, the net amount of cash provided by the company's operating activities was
$849.9 million, the net amount of cash used for investing activities was $290.7
million, and the net amount of cash provided by financing activities was $113.7
million. The effect of exchange rate changes on cash was an increase of $12.9
million.
During
2008, the net amount of cash provided by the company's operating activities was
$619.8 million, the net amount of cash used for investing activities was $492.7
million, and the net amount of cash used for financing activities was $111.1
million. The effect of exchange rate changes on cash was a decrease of $12.5
million.
During
2007, the net amount of cash provided by the company's operating activities was
$850.7 million, the net amount of cash used for investing activities was $665.5
million, and the net amount of cash used for financing activities was $82.2
million. The effect of exchange rate changes on cash was an increase of $7.0
million.
30
Cash Flows from Operating
Activities
The
company maintains a significant investment in accounts receivable and
inventories. As a percentage of total assets, accounts receivable and
inventories were approximately 58.4% and 66.2% at December 31, 2009 and 2008,
respectively.
The net
amount of cash provided by the company's operating activities during 2009 was
$849.9 million and was primarily due to earnings from operations, adjusted for
non-cash items, a reduction in inventory, and an increase in accounts
payable. This was offset, in part, by a decrease in accrued
expenses.
The net
amount of cash provided by the company's operating activities during 2008 was
$619.8 million and was primarily due to earnings from operations, adjusted for
non-cash items, and a reduction in accounts receivable and inventory offset, in
part, by a decrease in accounts payable.
The net
amount of cash provided by the company's operating activities during 2007 was
$850.7 million and was primarily due to earnings from operations, adjusted for
non-cash items, a reduction in inventory, and an increase in accounts payable
and accrued expenses. This was offset, in part, by an increase in
accounts receivable supporting increased sales.
Working
capital, as a percentage of sales, was 12.1%, 13.4%, and 15.2% in 2009, 2008,
and 2007, respectively.
Cash Flows from Investing
Activities
The net
amount of cash used for investing activities during 2009 was $290.7 million,
primarily reflecting $170.1 million of cash consideration paid for acquired
businesses and $121.5 million for capital expenditures, offset, in part, by
proceeds from the sale of facilities of $1.2 million. Included in the
capital expenditures is $82.3 million related to the company's global ERP
initiative.
During
2009, the company acquired Petsche, a leading provider of interconnect products,
including specialty wire, cable, and harness management solutions, to the
aerospace and defense markets for cash consideration of $170.1
million.
The net
amount of cash used for investing activities during 2008 was $492.7 million,
primarily reflecting $333.5 million of cash consideration paid for acquired
businesses and $158.7 million for capital expenditures. Included in
capital expenditures is $113.4 million related to the company's global ERP
initiative.
During
2008, the company acquired Hynetic, a components distribution business in India,
ACI, a distributor of electronic components used in defense and aerospace
applications, LOGIX, a leading value-added distributor of midrange servers,
storage, and software, Achieva, a value-added distributor of semiconductors and
electro-mechanical devices, Excel Tech, the sole Broadcom distributor in Korea,
and Eteq Components, a Broadcom-based components distribution business in the
ASEAN region and China, for aggregate cash consideration of $319.9
million. In addition, the company paid $13.6 million to increase its
ownership interest in majority-owned subsidiaries.
The net
amount of cash used for investing activities during 2007 was $665.5 million,
primarily reflecting $539.6 million of cash consideration paid for acquired
businesses and $138.8 million for capital expenditures, offset, in part, by
$13.0 million of cash proceeds, primarily related to the sale of the company's
Lenexa, Kansas and Harlow, England facilities. Included in capital expenditure
is $73.1 million related to the company's global ERP initiative.
During
2007, the company acquired KeyLink, a leading enterprise computing solutions
distributor in North America, Adilam, a leading electronic components
distributor in Australia and New Zealand, Centia/AKS, specialty distributors of
access infrastructure, security, and virtualization software solutions in
Europe, and UEC, a distributor of semiconductor and multimedia products in
Japan, for aggregate cash consideration
31
of $506.9
million. In addition, the company paid $32.7 million to increase its
ownership interest in Ultra Source from 70.7% to 92.8%.
During
the fourth quarter of 2006, the company initiated a global ERP effort to
standardize processes worldwide and adopt best-in-class
capabilities. Implementation is expected to be phased-in over the
next several years. For 2010, the estimated cash flow impact of this
initiative is expected to be in the $40 to $60 million range with the annual
impact decreasing by approximately $10 million in 2011. The company
expects to finance these costs with cash flows from operations.
Cash Flows from Financing
Activities
The net
amount of cash provided by financing activities during 2009 was $113.7 million.
The primary sources of cash from financing activities were $297.4 million of net
proceeds from a note offering and $4.2 million of proceeds from the exercise of
stock options. The primary use of cash for financing activities for 2009
included $135.7 million of repurchases of senior notes, a $48.1 million decrease
in short-term borrowings, $2.5 million of repurchases of common stock, and a
$1.7 million shortfall in tax benefits from stock-based compensation
arrangements.
During
2009, the company repurchased $130.5 million principal amount of its 9.15%
senior notes due 2010. The related loss on the repurchase, including
the premium paid and write-off of the deferred financing costs, offset by the
gain for terminating the related interest rate swaps aggregated $5.3 million
($3.2 million net of related taxes or $.03 per share on both a basic and diluted
basis) and was recognized as a loss on prepayment of debt.
During
2009, the company completed the sale of $300.0 million principal amount of 6.00%
notes due in 2020. The net proceeds of the offering of $297.4 million
were used to repay a portion of the previously discussed 9.15% senior notes due
2010 and for general corporate purposes.
The net
amount of cash used for financing activities during 2008 was $111.1 million,
primarily reflecting $115.8 million of repurchases of common stock offset, in
part, by $4.4 million of cash proceeds from the exercise of stock
options.
The net
amount of cash used for financing activities during 2007 was $82.2 million. Net
repayments of short-term borrowings of $90.3 million, repayments of long-term
borrowings of $169.1 million related to the company's 7% senior notes that were
repaid in January 2007 in accordance with their terms, and repurchases of common
stock of $84.2 million were the primary uses of cash. This was
offset, in part, by net proceeds from long-term bank borrowings of $198.5
million, which include proceeds from a $200.0 million term loan due in 2012,
proceeds from the exercise of stock options of $55.2 million, and $7.7 million
related to excess tax benefits from stock-based compensation
arrangements.
On
September 23, 2009, the company filed a shelf registration statement with the
SEC registering debt securities, preferred stock, common stock and warrants of
Arrow Electronics, Inc. that may be issued by the company from time to time. As
set forth in the shelf registration statement, the net proceeds from the sale of
the offered securities may be used by the company for general corporate
purposes, including repayment of borrowings, working capital, capital
expenditures, acquisitions and stock repurchases, or for such other purposes as
may be specified in the applicable prospectus supplement.
The
company has an $800.0 million revolving credit facility with a group of banks
that matures in January 2012. Interest on borrowings under the
revolving credit facility is calculated using a base rate or a euro currency
rate plus a spread based on the company's credit ratings (.425% at December 31,
2009). The facility fee related to the revolving credit facility is
.125%.
The
company has a $600.0 million asset securitization program collateralized by
accounts receivable of certain of its North American subsidiaries which expires
in March 2010. Interest on borrowings is calculated using a base rate or a
commercial paper rate plus a spread, which is based on the company's credit
ratings (.225% at December 31, 2009). The facility fee is
.125%.
32
The
company had no outstanding borrowings under the revolving credit facility or the
asset securitization program at December 31, 2009 and 2008. Both
programs include terms and conditions that limit the incurrence of additional
borrowings, limit the company's ability to pay cash dividends or repurchase
stock, and require that certain financial ratios be maintained at designated
levels. The company was in compliance with all covenants as of December 31, 2009
and is currently not aware of any events that would cause non-compliance with
any covenants in the future.
Management
believes that company's current cash availability, its current borrowing
capacity under its revolving credit facility and asset securitization program,
its expected ability to generate future operating cash flows, and the company's
access to capital markets are sufficient to meet its projected cash flow needs
for the foreseeable future.
Contractual
Obligations
Payments
due under contractual obligations at December 31, 2009 follow (in
thousands):
|
Within
1 Year
|
1-3
Years
|
4-5
Years
|
After
5 Years
|
Total
|
||||||||||||||||
|
Debt
|
$ | 122,386 | $ | 213,157 | $ | 366,745 | $ | 695,760 | $ | 1,398,048 | ||||||||||
|
Interest
on long-term debt
|
70,724 | 129,716 | 102,669 | 354,007 | 657,116 | |||||||||||||||
|
Capital
leases
|
709 | 476 | - | - | 1,185 | |||||||||||||||
|
Operating
leases
|
53,036 | 74,631 | 42,297 | 14,180 | 184,144 | |||||||||||||||
|
Purchase
obligations (a)
|
2,675,031 | 11,614 | 4,701 | - | 2,691,346 | |||||||||||||||
|
Other
(b)
|
33,310 | 24,104 | 11,357 | 2,914 | 71,685 | |||||||||||||||
| $ | 2,955,196 | $ | 453,698 | $ | 527,769 | $ | 1,066,861 | $ | 5,003,524 | |||||||||||
|
(a)
|
Amounts
represent an estimate of non-cancelable inventory purchase orders and
other contractual obligations related to information technology and
facilities as of December 31, 2009. Most of the company's inventory
purchases are pursuant to authorized distributor agreements, which are
typically cancelable by either party at any time or on short notice,
usually within a few months.
|
|
(b)
|
Includes
estimates of contributions required to meet the requirements of several
defined benefit plans. Amounts are subject to change based upon the
performance of plan assets, as well as the discount rate used to determine
the obligation. The company does not anticipate having to make
required contributions to the plans beyond 2015. Also included are amounts
relating to personnel, facilities, customer termination, and certain other
costs resulting from restructuring and integration
activities.
|
Under the
terms of various joint venture agreements, the company is required to pay its
pro-rata share of the third party debt of the joint ventures in the event that
the joint ventures are unable to meet their obligations. At December
31, 2009, the company's pro-rata share of this debt was approximately $6.1
million. The company believes there is sufficient equity in the joint
ventures to meet their obligations.
At
December 31, 2009, the company had a liability for unrecognized tax benefits and
a liability for the payment of related interest totaling $82.2 million, of which
approximately $3.3 million is expected to be paid within one
year. For the remaining liability, due to the uncertainties related
to these tax matters, the company is unable to make a reasonably reliable
estimate when cash settlement with a taxing authority will occur.
Off-Balance
Sheet Arrangements
The
company has no off-balance sheet financing or unconsolidated special-purpose
entities.
33
Critical
Accounting Policies and Estimates
The
company's consolidated financial statements are prepared in accordance with
accounting principles generally accepted in the United States. The preparation
of these financial statements requires the company to make significant estimates
and judgments that affect the reported amounts of assets, liabilities, revenues,
and expenses and related disclosure of contingent assets and
liabilities. The company evaluates its estimates on an ongoing
basis. The company bases its estimates on historical experience and
on various other assumptions that are believed reasonable under the
circumstances; the results of which form the basis for making judgments about
the carrying values of assets and liabilities that are not readily apparent from
other sources. Actual results may differ from these estimates under different
assumptions or conditions.
The
company believes the following critical accounting policies involve the more
significant judgments and estimates used in the preparation of its consolidated
financial statements:
Revenue
Recognition
The
company recognizes revenue when there is persuasive evidence of an arrangement,
delivery has occurred or services are rendered, the sales price is determinable,
and collectibility is reasonably assured. Revenue typically is
recognized at time of shipment. Sales are recorded net of discounts,
rebates, and returns, which historically were not material.
A portion
of the company's business involves shipments directly from its suppliers to its
customers. In these transactions, the company is responsible for negotiating
price both with the supplier and customer, payment to the supplier, establishing
payment terms with the customer, product returns, and has risk of loss if the
customer does not make payment. As the principal with the customer, the company
recognizes the sale and cost of sale of the product upon receiving notification
from the supplier that the product was shipped.
The
company has certain business with select customers and suppliers that is
accounted for on an agency basis (that is, the company recognizes the fees
associated with serving as an agent in sales with no associated cost of sales)
in accordance with FASB ASC Topic 605-45-45. Generally, these
transactions relate to the sale of supplier service contracts to customers where
the company has no future obligation to perform under these contracts or the
rendering of logistics services for the delivery of inventory for which the
company does not assume the risks and rewards of ownership.
Accounts
Receivable
The
company maintains allowances for doubtful accounts for estimated losses
resulting from the inability of its customers to make required payments. The
allowances for doubtful accounts are determined using a combination of factors,
including the length of time the receivables are outstanding, the current
business environment, and historical experience.
Inventories
Inventories
are stated at the lower of cost or market. Write-downs of inventories to market
value are based upon contractual provisions governing price protection, stock
rotation, and obsolescence, as well as assumptions about future demand and
market conditions. If assumptions about future demand change and/or actual
market conditions are less favorable than those projected by the company,
additional write-downs of inventories may be required. Due to the large number
of transactions and the complexity of managing the process around price
protections and stock rotations, estimates are made regarding adjustments to the
book cost of inventories. Actual amounts could be different from those
estimated.
34
Investments
The
company assesses its long-term investments accounted for as available-for-sale
on a quarterly basis to determine whether declines in market value below cost
are other-than-temporary. When the decline is determined to be
other-than-temporary, the cost basis for the individual security is reduced and
a loss is realized in the company's consolidated statement of operations in the
period in which it occurs. When the decline is determined to be
temporary, the unrealized losses are included in the shareholders' equity
section in the company's consolidated balance sheets in "Other." The
company makes such determination based upon the quoted market price, financial
condition, operating results of the investee, and the company's intent and
ability to retain the investment over a period of time, which is sufficient to
allow for any recovery in market value. In addition, the company assesses the
following factors:
|
|
§
|
broad
economic factors impacting the investee's
industry;
|
|
|
§
|
publicly
available forecasts for sales and earnings growth for the industry and
investee; and
|
|
|
§
|
the
cyclical nature of the investee's
industry.
|
During
2008, the company determined that an other-than-temporary decline in the fair
value of its investment in Marubun Corporation occurred and, accordingly,
recognized a loss of $10.0 million ($.08 per share on both a basic and diluted
basis) on the write-down of this investment. The company could incur
an additional impairment charge in future periods if, among other factors, the
investee's future earnings differ from currently available
forecasts.
Income
Taxes
The
carrying value of the company's deferred tax assets is dependent upon the
company's ability to generate sufficient future taxable income in certain tax
jurisdictions. Should the company determine that it is more likely than not that
some portion or all of its deferred tax assets will not be realized, a valuation
allowance to the deferred tax assets would be established in the period such
determination was made.
It is the
company's policy to provide for uncertain tax positions and the related interest
and penalties based upon management's assessment of whether a tax benefit is
more likely than not to be sustained upon examination by tax
authorities. At December 31, 2009, the company believes it has
appropriately accounted for any unrecognized tax benefits. To the
extent the company prevails in matters for which a liability for an unrecognized
tax benefit is established or is required to pay amounts in excess of the
liability, the company's effective tax rate in a given financial statement
period may be affected.
Financial
Instruments
The
company uses various financial instruments, including derivative financial
instruments, for purposes other than trading. Derivatives used as
part of the company's risk management strategy are designated at inception as
hedges and measured for effectiveness both at inception and on an ongoing basis.
The company enters into interest rate swap transactions that convert certain
fixed-rate debt to variable-rate debt or variable-rate debt to fixed-rate debt
in order to manage its targeted mix of fixed- and floating-rate
debt. The effective portion of the change in the fair value of
interest rate swaps designated as fair value hedges is recorded as a change to
the carrying value of the related hedged debt, and the effective portion of the
change in fair value of interest rate swaps designated as cash flow hedges is
recorded in the shareholders' equity section in the company's consolidated
balance sheets in "Other." The ineffective portion of the interest
rate swaps, if any, is recorded in "Interest and other financing expense, net"
in the company's consolidated statements of operations.
The
company enters into cross-currency swaps to hedge a portion of its net
investment in euro-denominated net assets. The company’s
cross-currency swaps are derivatives designated as net investment
hedges. The effective portion of the change in the fair value of
derivatives designated as net investment hedges is recorded in "Foreign currency
translation adjustment" included in the company's consolidated balance sheets
and any ineffective portion is recorded in earnings. The company uses
the hypothetical derivative method to assess the effectiveness of its net
investment hedge on a quarterly
35
basis.
Contingencies and
Litigation
The
company is subject to proceedings, lawsuits, and other claims related to
environmental, regulatory, labor, product, tax, and other matters and assesses
the likelihood of an adverse judgment or outcome for these matters, as well as
the range of potential losses. A determination of the reserves required, if any,
is made after careful analysis. The reserves may change in the future due to new
developments impacting the probability of a loss, the estimate of such loss, and
the probability of recovery of such loss from third parties.
Restructuring and
Integration
The
company recorded charges in connection with restructuring its businesses, and
the integration of acquired businesses. These items primarily include employee
separation costs and estimates related to the consolidation of facilities (net
of sub-lease income), contractual obligations, and the valuation of certain
assets. Actual amounts could be different from those
estimated.
Stock-Based
Compensation
The
company records share-based payment awards exchanged for employee services at
fair value on the date of grant and expenses the awards in the consolidated
statements of operations over the requisite employee service
period. Stock-based compensation expense includes an estimate for
forfeitures and is generally recognized over the expected term of the award on a
straight-line basis. Stock-based compensation expense related to
awards with a market or performance condition is recognized over the expected
term of the award utilizing the graded vesting method. The fair value
of stock options is determined using the Black-Scholes valuation model and the
assumptions shown in Note 12 of the Notes to Consolidated Financial
Statements. The assumptions used in calculating the fair value of
share-based payment awards represent management's best estimates. The
company's estimates may be impacted by certain variables including, but not
limited to, stock price volatility, employee stock option exercise behaviors,
additional stock option grants, estimates of forfeitures, the company's
performance, and related tax impacts.
Employee Benefit
Plans
The costs
and obligations of the company's defined benefit pension plans are dependent on
actuarial assumptions. The two critical assumptions used, which impact the net
periodic pension cost (income) and the benefit obligation, are the discount rate
and expected return on plan assets. The discount rate represents the
market rate for a high quality corporate bond, and the expected return on plan
assets is based on current and expected asset allocations, historical trends,
and expected returns on plan assets. These key assumptions are evaluated
annually. Changes in these assumptions can result in different expense and
liability amounts.
Costs in Excess of Net
Assets of Companies Acquired
Goodwill
represents the excess of the cost of an acquisition over the fair value of the
assets acquired. The company tests goodwill for
impairment annually as of the first day of the fourth quarter, and when an event
occurs or circumstances change such that it is more likely than not that an
impairment may exist, such as (i) a significant adverse change in legal factors
or in business climate, (ii) an adverse action or assessment by a regulator,
(iii) unanticipated competition, (iv) a loss of key personnel, (v) a
more-likely-than-not sale or disposal of all or a significant portion of a
reporting unit, (vi) the testing for recoverability of a significant asset group
within a reporting unit, or (vii) the recognition of a goodwill impairment loss
of a subsidiary that is a component of the reporting unit. In addition, goodwill
is required to be tested for impairment after a portion of the goodwill is
allocated to a business targeted for disposal.
36
Goodwill
is reviewed for impairment utilizing a two-step process. The first
step of the impairment test requires the identification of the reporting units
and comparison of the fair value of each of these reporting units to the
respective carrying value. The company's reporting units are defined as each of
the three regional businesses within the global components business segment,
which are North America, EMEASA, and Asia/Pacific and each of the two regional
businesses within the global ECS business segment, which are North America and
Europe. Prior to 2009, the North America and Europe reporting units
within the global ECS business segment were evaluated as a single reporting
unit. If the carrying value of the reporting unit is less than its
fair value, no impairment exists and the second step is not
performed. If the carrying value of the reporting unit is higher than
its fair value, the second step must be performed to compute the amount of the
goodwill impairment, if any. In the second step, the impairment is
computed by comparing the implied fair value of the reporting unit goodwill with
the carrying amount of that goodwill. If the carrying amount of the
reporting unit goodwill exceeds the implied fair value of that goodwill, an
impairment loss is recognized for the excess.
The
company generally estimates the fair value of a reporting unit using a
three-year weighted average multiple of earnings before interest and taxes from
comparable companies, which utilizes a look-back approach. The
assumptions utilized in the evaluation of the impairment of goodwill under this
approach include the identification of reporting units and the selection of
comparable companies, which are critical accounting estimates subject to
change. During 2009 and 2008, as a result of a significant decline in
macroeconomic conditions, the company determined that it was prudent to
supplement its historical goodwill impairment testing methodology with a
forward-looking discounted cash flow methodology. The assumptions
included in the discounted cash flow methodology included forecasted revenues,
gross profit margins, operating income margins, working capital cash flow,
perpetual growth rates, and long-term discount rates, among others, all of which
require significant judgments by management. During 2009 and 2008,
the company also reconciled its discounted cash flow analysis to its current
market capitalization allowing for a reasonable control premium. As
of the first day of the fourth quarters of 2007, 2008, and 2009, the company's
annual impairment testing did not indicate impairment at any of the company's
reporting units.
During
the fourth quarter of 2008, as a result of significant declines in macroeconomic
conditions, global equity valuations depreciated. Both factors
impacted the company's market capitalization, and the company determined it was
necessary to perform an interim goodwill impairment test as of December 31,
2008. Based upon the results of the discounted cash flow approach as
of December 31, 2008, the carrying value of the global ECS reporting unit and
the EMEASA and Asia/Pacific reporting units within the global components
business segment were higher than their fair value and, accordingly, the company
performed a step-two impairment analysis. The fair value of the North America
reporting unit within the global components business segment was higher than its
carrying value and a step-two analysis was not required. The results
of the step-two impairment analysis indicated that goodwill related to the
EMEASA and Asia/Pacific reporting units within the global components business
segment were fully impaired and the goodwill related to the global ECS business
segment was partially impaired. The company recognized a total
non-cash impairment charge of $1.02 billion ($905.1 million net of related taxes
or $7.49 per share on both a basic and diluted basis) as of December 31, 2008,
of which $716.9 million related to the company's global components business
segment and $301.9 million related to the company's global ECS business
segment. The impairment charge did not impact the company’s
consolidated cash flows, liquidity, capital resources, and covenants under its
existing revolving credit facility, asset securitization program, and other
outstanding borrowings.
A
continued decline in general economic conditions or global equity valuations,
could impact the judgments and assumptions about the fair value of the company's
business. If general economic conditions or global equity valuations continue to
decline, the company could be required to record an additional impairment charge
in the future, which could impact the company’s consolidated balance sheet, as
well as the company’s consolidated statement of operations. If the company was
required to recognize an additional impairment charge in the future, the charge
would not impact the company’s consolidated cash flows, current liquidity,
capital resources, and covenants under its existing revolving credit facility,
asset securitization program, and other outstanding borrowings.
37
As of
December 31, 2009, the company has $926.3 million of goodwill, of which
approximately $473.4 million was allocated to the North America reporting unit
within the global components business segment and $255.3 million and $197.6
million was allocated to the North America and Europe reporting units within the
global ECS business segment, respectively. As of the date of the company's
latest impairment test, the fair value of the North America reporting unit
within the global components business segment and the fair value of the North
America and Europe reporting units within the global ECS business segment
exceeded their carrying values by approximately 45%, 337%, and 138%,
respectively.
Impairment of Long-Lived
Assets
The
company reviews long-lived assets, including property, plant and equipment and
identifiable intangible assets, for impairment whenever changes in circumstances
or events may indicate that the carrying amounts are not
recoverable. The company also tests indefinite-lived intangible
assets, consisting of acquired trade names, for impairment at least annually as
of the first day of the fourth quarter. If the fair value is less
than the carrying amount of the asset, a loss is recognized for the
difference.
During
2008, the company recorded an impairment charge of $25.4 million in connection
with an approved plan to market and sell a building and related land in North
America within the company's global components business segment. The
company wrote-down the carrying values of the building and related land to their
estimated fair values less cost to sell and ceased recording
depreciation. During 2009, the company recorded an additional
impairment charge of $2.1 million as a result of further declines in real estate
valuations. As of December 31, 2009 and 2008, the assets were
designated as assets held-for-sale, and the carrying values of $7.4 million and
$9.5 million, respectively, were included in "Prepaid expenses and other assets"
on the company's consolidated balance sheets. The sale is expected to
be completed in the first quarter of 2010.
Factors
which may cause an impairment of long-lived assets include significant changes
in the manner of use of these assets, negative industry or market trends, a
significant underperformance relative to historical or projected future
operating results, or a likely sale or disposal of the asset before the end of
its estimated useful life. If any of these factors exist, the company
is required to test the long-lived asset for recoverability and may be required
to recognize an impairment charge for all or a portion of the asset's carrying
value.
During
the fourth quarter of 2008, as a result of significant declines in macroeconomic
conditions, global equity valuations depreciated. Both factors
impacted the company’s market capitalization, and the company determined it was
necessary to review the recoverability of its long-lived assets to be held and
used, including property, plant and equipment and identifiable intangible
assets, by comparing the carrying value of the related asset groups to the
undiscounted cash flows directly attributable to the asset groups over the
estimated useful life of those assets. Based upon the results of such
tests as of December 31, 2008, the company’s long-lived assets to be held and
used were not impaired.
Shipping and Handling
Costs
Shipping
and handling costs are reported as either a component of cost of products sold
or SG&A. The company reports shipping and handling costs, primarily related
to outbound freight, in the consolidated statements of operations as a component
of SG&A. If the company included such costs in cost of products
sold, gross profit margin as a percentage of sales for 2009 would decrease from
11.9% to 11.6% with no impact on reported earnings.
Impact of Recently Issued
Accounting Standards
In
October 2009, the FASB issued Accounting Standards Update No. 2009-13,
"Multiple-Deliverable Revenue Arrangements" ("ASU No. 2009-13").
ASU No. 2009-13 amends guidance included within ASC Topic 605-25 to require an entity to
use an estimated selling price when vendor specific objective evidence or
acceptable third party evidence does not exist for any products or services
included in a
38
multiple
element arrangement. The arrangement consideration should be allocated among the
products and services based upon their relative selling prices, thus eliminating
the use of the residual method of allocation. ASU No. 2009-13 also requires
expanded qualitative and quantitative disclosures regarding significant
judgments made and changes in applying this guidance. ASU No. 2009-13 is
effective prospectively for revenue arrangements entered into or materially
modified in fiscal years beginning on or after June 15,
2010. Early adoption and retrospective application are also
permitted. The company is currently evaluating the impact of adopting
the provisions of ASU No. 2009-13.
In
October 2009, the FASB issued Accounting Standards Update No. 2009-14,
"Certain Revenue Arrangements That Include Software Elements" ("ASU No. 2009-14").
ASU No. 2009-14 amends guidance included within ASC Topic 985-65 to exclude
tangible products containing software components and non-software components
that function together to deliver the product’s essential
functionality. Entities that sell joint hardware and software
products that meet this scope exception will be required to follow the guidance
of ASU No. 2009-13. ASU No. 2009-14 is effective prospectively for
revenue arrangements entered into or materially modified in fiscal years
beginning on or after June 15, 2010. Early adoption and
retrospective application are also permitted. The company is
currently evaluating the impact of adopting the provisions of ASU No.
2009-14.
In June
2009, the FASB issued FASB Statement No. 166, "Accounting for Transfers of
Financial Assets, an amendment of FASB Statement No. 140" ("Statement No. 166"),
codified in ASC Topic 810-10. Statement No. 166, among other things,
eliminates the concept of a "qualifying special-purpose entity," changes the
requirements for derecognizing financial assets, and requires additional
disclosures about transfers of financial assets. Statement No. 166 is
effective for annual reporting periods beginning after November 15,
2009. The adoption of the provisions of Statement No. 166 is not
anticipated to impact the company's consolidated financial position or results
of operations.
In June
2009, the FASB issued FASB Statement No. 167, "Amendments to FASB Interpretation
No. ("FIN") 46(R)" ("Statement No. 167"), codified in ASC Topic
810-10. Statement No. 167, among other things, requires a qualitative
rather than a quantitative analysis to determine the primary beneficiary of a
variable interest entity ("VIE"), amends FIN 46(R)’s consideration of related
party relationships in the determination of the primary beneficiary of a VIE,
amends certain guidance in FIN 46(R) for determining whether an entity is a VIE,
requires continuous assessments of whether an enterprise is the primary
beneficiary of a VIE, and requires enhanced disclosures about an enterprise’s
involvement with a VIE. Statement No. 167 is effective for annual
reporting periods beginning after November 15, 2009. The adoption of
the provisions of Statement No. 167 is not anticipated to impact the company's
consolidated financial position or results of operations.
Information
Relating to Forward-Looking Statements
This
report includes forward-looking statements that are subject to numerous
assumptions, risks, and uncertainties, which could cause actual results or facts
to differ materially from such statements for a variety of reasons, including,
but not limited to: industry conditions, the company's implementation of its new
enterprise resource planning system, changes in product supply, pricing and
customer demand, competition, other vagaries in the global components and global
ECS markets, changes in relationships with key suppliers, increased profit
margin pressure, the effects of additional actions taken to become more
efficient or lower costs, and the company’s ability to generate additional cash
flow. Forward-looking statements are those statements, which are not
statements of historical fact. These forward-looking statements can
be identified by forward-looking words such as "expects," "anticipates,"
"intends," "plans," "may," "will," "believes," "seeks," "estimates," and similar
expressions. Shareholders and other readers are cautioned not to
place undue reliance on these forward-looking statements, which speak only as of
the date on which they are made. The company undertakes no obligation
to update publicly or revise any of the forward-looking
statements.
39
The
company is exposed to market risk from changes in foreign currency exchange
rates and interest rates.
Foreign Currency Exchange
Rate Risk
The
company, as a large, global organization, faces exposure to adverse movements in
foreign currency exchange rates. These exposures may change over time as
business practices evolve and could materially impact the company's financial
results in the future. The company's primary exposure relates to transactions in
which the currency collected from customers is different from the currency
utilized to purchase the product sold in Europe, the Asia Pacific region,
Canada, and Latin America. The company's policy is to hedge substantially all
such currency exposures for which natural hedges do not exist. Natural hedges
exist when purchases and sales within a specific country are both denominated in
the same currency and, therefore, no exposure exists to hedge with foreign
exchange forward, option, or swap contracts (collectively, the "foreign exchange
contracts"). In many regions in Asia, for example, sales and purchases are
primarily denominated in U.S. dollars, resulting in a "natural hedge." Natural
hedges exist in most countries in which the company operates, although the
percentage of natural offsets, as compared with offsets that need to be hedged
by foreign exchange contracts, will vary from country to country. The company
does not enter into foreign exchange contracts for trading purposes. The risk of
loss on a foreign exchange contract is the risk of nonperformance by the
counterparties, which the company minimizes by limiting its counterparties to
major financial institutions. The fair values of the foreign exchange contracts,
which are nominal, are estimated using market quotes. The notional amount of the
foreign exchange contracts at December 31, 2009 and 2008 was $294.9 million and
$315.0 million, respectively.
The
translation of the financial statements of the non-United States operations is
impacted by fluctuations in foreign currency exchange rates. The change in
consolidated sales and operating income was impacted by the translation of the
company's international financial statements into U.S. dollars. This
resulted in decreased sales of $350.7 million and decreased operating income of
$18.5 million for 2009, compared with the year-earlier period, based on 2008
sales and operating income at the average rate for 2009. Sales and operating
income would decrease by approximately $424.4 million and $.9 million,
respectively, if average foreign exchange rates had declined by 10% against the
U.S. dollar in 2009. These amounts were determined by considering the impact of
a hypothetical foreign exchange rate on the sales and operating income of the
company's international operations.
In May
2006, the company entered into a cross-currency swap, with a maturity date of
July 2011, for approximately $100.0 million or €78.3 million (the "2006
cross-currency swap") to hedge a portion of its net investment in
euro-denominated net assets. The 2006 cross-currency swap is
designated as a net investment hedge and effectively converts the interest
expense on $100.0 million of long-term debt from U.S. dollars to
euros. As the notional amount of the 2006 cross-currency swap is
expected to equal a comparable amount of hedged net assets, no material
ineffectiveness is expected. The 2006 cross-currency swap had a
negative fair value of $12.5 million and $10.0 million at December 31, 2009 and
2008, respectively.
In
October 2005, the company entered into a cross-currency swap, with a maturity
date of October 2010, for approximately $200.0 million or €168.4 million (the
"2005 cross-currency swap") to hedge a portion of its net investment in
euro-denominated net assets. The 2005 cross-currency swap is
designated as a net investment hedge and effectively converts the interest
expense on $200.0 million of long-term debt from U.S. dollars to
euros. As the notional amount of the 2005 cross-currency swap is
expected to equal a comparable amount of hedged net assets, no material
ineffectiveness is expected. The 2005 cross-currency swap had a
negative fair value of $41.9 million and $36.5 million at December 31, 2009 and
2008, respectively.
40
Interest Rate
Risk
The
company’s interest expense, in part, is sensitive to the general level of
interest rates in North America, Europe, and the Asia Pacific region. The
company historically has managed its exposure to interest rate risk through the
proportion of fixed-rate and floating-rate debt in its total debt
portfolio. Additionally, the company utilizes interest rate
swaps in order to manage its targeted mix of fixed- and floating-rate
debt.
At
December 31, 2009, approximately 56% of the company’s debt was subject to fixed
rates, and 44% of its debt was subject to floating rates. A one percentage point
change in average interest rates would not materially impact net interest and
other financing expense in 2009. This was determined by considering the impact
of a hypothetical interest rate on the company’s average floating rate on
investments and outstanding debt. This analysis does not consider the effect of
the level of overall economic activity that could exist. In the event of a
change in the level of economic activity, which may adversely impact interest
rates, the company could likely take actions to further mitigate any potential
negative exposure to the change. However, due to the uncertainty of the specific
actions that might be taken and their possible effects, the sensitivity analysis
assumes no changes in the company’s financial structure.
In June
2004, the company entered into interest rate swaps, with an aggregate notional
amount of $200.0 million. The swaps modify the company's interest
rate exposure by effectively converting the fixed 9.15% senior notes to a
floating rate, based on the six-month U.S. dollar LIBOR plus a spread (an
effective rate of 4.94% and 8.19% at December 31, 2009 and 2008, respectively),
through its maturity. In 2009, the company terminated $130.5 million
aggregate notional amount of the interest rate swaps upon the repayment of a
portion of the 9.15% senior notes. The swaps are classified as fair
value hedges and had a fair value of $2.0 million and $9.4 million at December
31, 2009 and 2008, respectively.
In June
2004 and November 2009, the company entered into interest rate swaps, with an
aggregate notional amount of $275.0 million. The swaps modify the
company's interest rate exposure by effectively converting a portion of the
fixed 6.875% senior notes to a floating rate, based on the six-month U.S. dollar
LIBOR plus a spread (an effective rate of 4.18% and 5.01% at December 31, 2009
and 2008, respectively), through its maturity. The swaps are
classified as fair value hedges and had a fair value of $9.6 million and $12.0
million at December 31, 2009 and 2008, respectively.
41
REPORT
OF INDEPENDENT REGISTERED PUBLIC ACCOUNTING FIRM
The Board
of Directors and Shareholders
Arrow
Electronics, Inc.
We have
audited the accompanying consolidated balance sheets of Arrow Electronics, Inc.
(the "company") as of December 31, 2009 and 2008 and the related
consolidated statements of operations, equity, and cash flows for each of the
three years in the period ended December 31, 2009. Our audits also included
the financial statement schedule listed in the Index at Item 15(a). These
financial statements and the schedule are the responsibility of the company’s
management. Our responsibility is to express an opinion on these financial
statements and schedule based on our audits.
We
conducted our audits in accordance with the standards of the Public Company
Accounting Oversight Board (United States). Those standards require that we plan
and perform the audit to obtain reasonable assurance about whether the financial
statements are free of material misstatement. An audit includes examining, on a
test basis, evidence supporting the amounts and disclosures in the financial
statements. An audit also includes assessing the accounting principles used and
significant estimates made by management, as well as evaluating the overall
financial statement presentation. We believe that our audits provide a
reasonable basis for our opinion.
In our
opinion, the financial statements referred to above present fairly, in all
material respects, the consolidated financial position of Arrow Electronics,
Inc. at December 31, 2009 and 2008, and the consolidated results of its
operations and its cash flows for each of the three years in the period ended
December 31, 2009 in conformity with U.S. generally accepted accounting
principles. Also, in our opinion, the related financial statement schedule, when
considered in relation to the basic financial statements taken as a whole,
presents fairly in all material respects the information set forth
therein.
As
discussed in Note 2 to the consolidated financial statements, the company
adopted the guidance issued in Financial Accounting Standards Board ("FASB")
Statement No. 141(R), "Business Combinations" (codified in FASB Accounting
Standards Codification Topic 805, "Business Combinations") on January 1,
2009.
We also
have audited, in accordance with the standards of the Public Company Accounting
Oversight Board (United States), Arrow Electronics, Inc.’s internal control over
financial reporting as of December 31, 2009, based on criteria established
in Internal Control-Integrated Framework issued by the Committee of Sponsoring
Organizations of the Treadway Commission and our report dated February 3, 2010 expressed an unqualified opinion
thereon.
/s/ ERNST
& YOUNG LLP
New York,
New York
February
3, 2010
42
ARROW
ELECTRONICS, INC.
(In
thousands except per share data)
|
Years Ended December 31,
|
||||||||||||
|
2009
|
2008
|
2007
|
||||||||||
|
Sales
|
$ | 14,684,101 | $ | 16,761,009 | $ | 15,984,992 | ||||||
|
Costs
and expenses:
|
||||||||||||
|
Cost
of products sold
|
12,933,207 | 14,478,296 | 13,699,715 | |||||||||
|
Selling,
general and administrative expenses
|
1,305,566 | 1,607,261 | 1,519,908 | |||||||||
|
Depreciation
and amortization
|
67,027 | 69,286 | 66,719 | |||||||||
|
Restructuring,
integration, and other charges
|
105,514 | 80,955 | 11,745 | |||||||||
|
Impairment
charge
|
- | 1,018,780 | - | |||||||||
| 14,411,314 | 17,254,578 | 15,298,087 | ||||||||||
|
Operating
income (loss)
|
272,787 | (493,569 | ) | 686,905 | ||||||||
|
Equity
in earnings of affiliated companies
|
4,731 | 6,549 | 6,906 | |||||||||
|
Loss
on prepayment of debt
|
5,312 | - | - | |||||||||
|
Loss
on the write-down of an investment
|
- | 10,030 | - | |||||||||
|
Interest
and other financing expense, net
|
83,285 | 99,863 | 101,628 | |||||||||
|
Income
(loss) before income taxes
|
188,921 | (596,913 | ) | 592,183 | ||||||||
|
Provision
for income taxes
|
65,416 | 16,722 | 180,697 | |||||||||
|
Consolidated
net income (loss)
|
123,505 | (613,635 | ) | 411,486 | ||||||||
|
Noncontrolling
interests
|
(7 | ) | 104 | 3,694 | ||||||||
|
Net
income (loss) attributable to shareholders
|
$ | 123,512 | $ | (613,739 | ) | $ | 407,792 | |||||
|
Net
income (loss) per share:
|
||||||||||||
|
Basic
|
$ | 1.03 | $ | (5.08 | ) | $ | 3.31 | |||||
|
Diluted
|
$ | 1.03 | $ | (5.08 | ) | $ | 3.28 | |||||
|
Average
number of shares outstanding:
|
||||||||||||
|
Basic
|
119,800 | 120,773 | 123,176 | |||||||||
|
Diluted
|
120,489 | 120,773 | 124,429 | |||||||||
See
accompanying notes.
43
ARROW
ELECTRONICS, INC.
CONSOLIDATED
BALANCE SHEETS
(In
thousands except par value)
|
December 31,
|
||||||||
|
2009
|
2008 (A)
|
|||||||
|
ASSETS
|
||||||||
|
Current
assets:
|
||||||||
|
Cash
and cash equivalents
|
$ | 1,137,007 | $ | 451,272 | ||||
|
Accounts
receivable, net
|
3,136,141 | 3,087,290 | ||||||
|
Inventories
|
1,397,668 | 1,626,559 | ||||||
|
Prepaid
expenses and other assets
|
168,812 | 180,647 | ||||||
|
Total
current assets
|
5,839,628 | 5,345,768 | ||||||
|
Property,
plant and equipment, at cost:
|
||||||||
|
Land
|
23,584 | 25,127 | ||||||
|
Buildings
and improvements
|
137,539 | 147,138 | ||||||
|
Machinery
and equipment
|
779,105 | 698,156 | ||||||
| 940,228 | 870,421 | |||||||
|
Less:
Accumulated depreciation and amortization
|
(479,522 | ) | (459,881 | ) | ||||
|
Property,
plant and equipment, net
|
460,706 | 410,540 | ||||||
|
Investments
in affiliated companies
|
53,010 | 46,788 | ||||||
|
Cost
in excess of net assets of companies acquired
|
926,296 | 905,848 | ||||||
|
Other
assets
|
482,726 | 409,341 | ||||||
|
Total assets
|
$ | 7,762,366 | $ | 7,118,285 | ||||
|
LIABILITIES
AND EQUITY
|
||||||||
|
Current
liabilities:
|
||||||||
|
Accounts
payable
|
$ | 2,763,237 | $ | 2,459,922 | ||||
|
Accrued
expenses
|
445,914 | 455,547 | ||||||
|
Short-term
borrowings, including current portion of long-term debt
|
123,095 | 52,893 | ||||||
|
Total current liabilities
|
3,332,246 | 2,968,362 | ||||||
|
Long-term
debt
|
1,276,138 | 1,223,985 | ||||||
|
Other
liabilities
|
236,685 | 248,888 | ||||||
|
Equity:
|
||||||||
|
Shareholders'
equity:
|
||||||||
|
Common
stock, par value $1:
|
||||||||
|
Authorized
– 160,000 shares in 2009 and 2008
|
||||||||
|
Issued
– 125,287 and 125,048 shares in 2009 and 2008,
respectively
|
125,287 | 125,048 | ||||||
|
Capital
in excess of par value
|
1,056,704 | 1,035,302 | ||||||
|
Treasury
stock (5,459 and 5,740 shares in 2009 and 2008, respectively), at
cost
|
(179,152 | ) | (190,273 | ) | ||||
|
Retained
earnings
|
1,694,517 | 1,571,005 | ||||||
|
Foreign
currency translation adjustment
|
229,019 | 172,528 | ||||||
|
Other
|
(9,415 | ) | (36,912 | ) | ||||
|
Total
shareholders' equity
|
2,916,960 | 2,676,698 | ||||||
|
Noncontrolling
interests
|
337 | 352 | ||||||
|
Total
equity
|
2,917,297 | 2,677,050 | ||||||
|
Total
liabilities and equity
|
$ | 7,762,366 | $ | 7,118,285 | ||||
|
(A)
|
Prior
period amounts were reclassified to conform to the current year
presentation as a result of the adoption of the Accounting Standards
Codification Topic 810-10-65. See Note 1 of the Notes to the
Consolidated Financial Statements for additional
information.
|
See
accompanying notes.
44
ARROW
ELECTRONICS, INC.
(In
thousands)
|
Years
Ended December 31,
|
||||||||||||
|
2009
|
2008
|
2007
|
||||||||||
|
Cash
flows from operating activities:
|
||||||||||||
|
Consolidated net income
(loss)
|
$ | 123,505 | $ | (613,635 | ) | $ | 411,486 | |||||
|
Adjustments
to reconcile consolidated net income (loss) to net cash provided by
operations:
|
||||||||||||
|
Depreciation and
amortization
|
67,027 | 69,286 | 66,719 | |||||||||
|
Amortization of stock-based
compensation
|
33,017 | 18,092 | 21,389 | |||||||||
|
Amortization of deferred
financing costs and discount on notes
|
2,313 | 2,162 | 2,144 | |||||||||
|
Equity in earnings of
affiliated companies
|
(4,731 | ) | (6,549 | ) | (6,906 | ) | ||||||
|
Deferred income
taxes
|
19,313 | (88,212 | ) | 8,661 | ||||||||
|
Restructuring, integration, and
other charges
|
75,720 | 61,876 | 7,036 | |||||||||
|
Impairment
charge
|
- | 1,018,780 | - | |||||||||
|
Impact of settlement of tax
matters
|
- | (7,488 | ) | - | ||||||||
|
Excess tax benefits from
stock-based compensation arrangements
|
1,731 | (161 | ) | (7,687 | ) | |||||||
|
Loss on prepayment of
debt
|
3,228 | - | - | |||||||||
|
Loss on the write-down of an
investment
|
- | 10,030 | - | |||||||||
|
Change in assets and liabilities, net of effects of acquired
businesses:
|
||||||||||||
|
Accounts
receivable
|
2,302 | 269,655 | (279,636 | ) | ||||||||
|
Inventories
|
286,626 | 85,489 | 116,657 | |||||||||
|
Prepaid expenses and other
assets
|
12,139 | 11,504 | (19,315 | ) | ||||||||
|
Accounts payable
|
304,295 | (191,669 | ) | 475,155 | ||||||||
|
Accrued expenses
|
(92,587 | ) | 2,977 | 32,458 | ||||||||
|
Other
|
15,957 | (22,338 | ) | 22,582 | ||||||||
|
Net cash provided by operating
activities
|
849,855 | 619,799 | 850,743 | |||||||||
|
Cash
flows from investing activities:
|
||||||||||||
|
Acquisition of property, plant and
equipment
|
(121,516 | ) | (158,688 | ) | (138,834 | ) | ||||||
|
Cash consideration paid for
acquired businesses
|
(170,064 | ) | (333,491 | ) | (539,618 | ) | ||||||
|
Proceeds from sale of
facilities
|
1,153 | - | 12,996 | |||||||||
|
Other
|
(272 | ) | (512 | ) | (23 | ) | ||||||
|
Net cash used for investing
activities
|
(290,699 | ) | (492,691 | ) | (665,479 | ) | ||||||
|
Cash
flows from financing activities:
|
||||||||||||
|
Change in short-term
borrowings
|
(48,144 | ) | 2,604 | (90,318 | ) | |||||||
|
Repayment of long-term bank
borrowings
|
(29,400 | ) | (3,953,950 | ) | (2,312,251 | ) | ||||||
|
Proceeds from long-term bank
borrowings
|
29,400 | 3,951,461 | 2,510,800 | |||||||||
|
Repurchase of senior
notes
|
(135,658 | ) | - | (169,136 | ) | |||||||
|
Net
proceeds from note offering
|
297,430 | - | - | |||||||||
|
Proceeds from exercise of stock
options
|
4,234 | 4,392 | 55,228 | |||||||||
|
Excess tax benefits from
stock-based compensation arrangements
|
(1,731 | ) | 161 | 7,687 | ||||||||
|
Repurchases of common
stock
|
(2,478 | ) | (115,763 | ) | (84,236 | ) | ||||||
|
Net cash provided by (used for)
financing activities
|
113,653 | (111,095 | ) | (82,226 | ) | |||||||
|
Effect
of exchange rate changes on cash
|
12,926 | (12,472 | ) | 6,963 | ||||||||
|
Net
increase in cash and cash equivalents
|
685,735 | 3,541 | 110,001 | |||||||||
|
Cash
and cash equivalents at beginning of year
|
451,272 | 447,731 | 337,730 | |||||||||
|
Cash
and cash equivalents at end of year
|
$ | 1,137,007 | $ | 451,272 | $ | 447,731 | ||||||
See
accompanying notes.
45
ARROW
ELECTRONICS, INC.
CONSOLIDATED
STATEMENTS OF EQUITY
(In
thousands)
|
Common
Stock
at Par
Value
|
Capital
in Excess
of Par
Value
|
Treasury
Stock
|
Retained
Earnings
|
Foreign
Currency
Translation
Adjustment
|
Other
Comprehensive
Income (Loss)
|
Noncontrolling
Interests
|
Total
|
|||||||||||||||||||||||||
|
Balance
at December 31, 2006
|
$ | 122,626 | $ | 943,958 | $ | (5,530 | ) | $ | 1,787,746 | $ | 155,166 | $ | (7,407 | ) | $ | 13,794 | $ | 3,010,353 | ||||||||||||||
|
Consolidated
net income
|
- | - | - | 407,792 | - | - | 3,694 | 411,486 | ||||||||||||||||||||||||
|
Translation
adjustments
|
- | - | - | - | 157,589 | - | (90 | ) | 157,499 | |||||||||||||||||||||||
|
Unrealized
gain (loss) on securities, net
|
- | - | - | - | - | 648 | (111 | ) | 537 | |||||||||||||||||||||||
|
Unrealized
loss on interest rate swaps designated as cash flow hedges,
net
|
- | - | - | - | - | (94 | ) | - | (94 | ) | ||||||||||||||||||||||
|
Other
employee benefit plan items, net
|
- | - | - | - | - | (1,867 | ) | - | (1,867 | ) | ||||||||||||||||||||||
|
Comprehensive
income
|
567,561 | |||||||||||||||||||||||||||||||
|
Amortization
of stock-based compensation
|
- | 21,389 | - | - | - | - | - | 21,389 | ||||||||||||||||||||||||
|
Shares
issued for stock-based compensation awards
|
2,413 | 50,473 | 2,197 | - | - | - | - | 55,083 | ||||||||||||||||||||||||
|
Tax
benefits related to stock-based compensation awards
|
- | 9,791 | - | - | - | - | - | 9,791 | ||||||||||||||||||||||||
|
Repurchase
of common stock
|
- | - | (84,236 | ) | - | - | - | - | (84,236 | ) | ||||||||||||||||||||||
|
Purchase
of subsidiary shares from noncontrolling interest
|
- | - | - | - | - | - | (12,143 | ) | (12,143 | ) | ||||||||||||||||||||||
|
Adjustment
to initially apply change in accounting for sabbatical
liability
|
- | - | - | (10,794 | ) | - | - | - | (10,794 | ) | ||||||||||||||||||||||
|
Balance
at December 31, 2007
|
125,039 | 1,025,611 | (87,569 | ) | 2,184,744 | 312,755 | (8,720 | ) | 5,144 | 3,557,004 | ||||||||||||||||||||||
|
Consolidated
net income (loss)
|
- | - | - | (613,739 | ) | - | - | 104 | (613,635 | ) | ||||||||||||||||||||||
|
Translation
adjustments
|
- | - | - | - | (140,227 | ) | - | (127 | ) | (140,354 | ) | |||||||||||||||||||||
|
Unrealized
loss on securities, net
|
- | - | - | - | - | (14,678 | ) | - | (14,678 | ) | ||||||||||||||||||||||
|
Unrealized
loss on interest rate swaps designated as cash flow hedges,
net
|
- | - | - | - | - | (1,032 | ) | - | (1,032 | ) | ||||||||||||||||||||||
|
Other
employee benefit plan items, net
|
- | - | - | - | - | (12,482 | ) | - | (12,482 | ) | ||||||||||||||||||||||
|
Comprehensive
loss
|
(782,181 | ) | ||||||||||||||||||||||||||||||
|
Amortization
of stock-based compensation
|
- | 18,092 | - | - | - | - | - | 18,092 | ||||||||||||||||||||||||
|
Shares
issued for stock-based compensation awards
|
9 | (8,719 | ) | 13,059 | - | - | - | - | 4,349 | |||||||||||||||||||||||
|
Tax
benefits related to stock-based compensation awards
|
- | 318 | - | - | - | - | - | 318 | ||||||||||||||||||||||||
|
Repurchase
of common stock
|
- | - | (115,763 | ) | - | - | - | - | (115,763 | ) | ||||||||||||||||||||||
|
Purchase
of subsidiary shares from noncontrolling interest
|
- | - | - | - | - | - | (4,769 | ) | (4,769 | ) | ||||||||||||||||||||||
|
Balance
at December 31, 2008
|
$ | 125,048 | $ | 1,035,302 | $ | (190,273 | ) | $ | 1,571,005 | $ | 172,528 | $ | (36,912 | ) | $ | 352 | $ | 2,677,050 | ||||||||||||||
46
ARROW
ELECTRONICS, INC.
CONSOLIDATED
STATEMENTS OF EQUITY (continued)
(In
thousands)
|
Common
Stock
at Par
Value
|
Capital
in Excess
of Par
Value
|
Treasury
Stock
|
Retained
Earnings
|
Foreign
Currency
Translation
Adjustment
|
Other
Comprehensive
Income (Loss)
|
Noncontrolling
Interests
|
Total
|
|||||||||||||||||||||||||
|
Balance
at December 31, 2008
|
$ | 125,048 | $ | 1,035,302 | $ | (190,273 | ) | $ | 1,571,005 | $ | 172,528 | $ | (36,912 | ) | $ | 352 | $ | 2,677,050 | ||||||||||||||
|
Consolidated
net income (loss)
|
- | - | - | 123,512 | - | - | (7 | ) | 123,505 | |||||||||||||||||||||||
|
Translation
adjustments
|
- | - | - | - | 56,491 | - | (8 | ) | 56,483 | |||||||||||||||||||||||
|
Unrealized
gain on securities, net
|
- | - | - | - | - | 22,844 | - | 22,844 | ||||||||||||||||||||||||
|
Unrealized
gain on interest rate swaps designated as cash flow hedges,
net
|
- | - | - | - | - | 1,132 | - | 1,132 | ||||||||||||||||||||||||
|
Other
employee benefit plan items, net
|
- | - | - | - | - | 3,521 | - | 3,521 | ||||||||||||||||||||||||
|
Comprehensive
income
|
207,485 | |||||||||||||||||||||||||||||||
|
Amortization
of stock-based compensation
|
- | 33,017 | - | - | - | - | - | 33,017 | ||||||||||||||||||||||||
|
Shares
issued for stock-based compensation awards
|
239 | (9,604 | ) | 13,599 | - | - | - | - | 4,234 | |||||||||||||||||||||||
|
Tax
benefits related to stock-based compensation awards
|
- | (2,011 | ) | - | - | - | - | - | (2,011 | ) | ||||||||||||||||||||||
|
Repurchase
of common stock
|
- | - | (2,478 | ) | - | - | - | - | (2,478 | ) | ||||||||||||||||||||||
|
Balance
at December 31, 2009
|
$ | 125,287 | $ | 1,056,704 | $ | (179,152 | ) | $ | 1,694,517 | $ | 229,019 | $ | (9,415 | ) | $ | 337 | $ | 2,917,297 | ||||||||||||||
See
accompanying notes.
47
ARROW
ELECTRONICS, INC.
NOTES
TO CONSOLIDATED FINANCIAL STATEMENTS
(Dollars
in thousands except per share data)
1.
Summary of Significant Accounting Policies
Principles of
Consolidation
The
consolidated financial statements include the accounts of the company and its
majority-owned subsidiaries. All significant intercompany
transactions are eliminated.
Use of
Estimates
The
preparation of financial statements in conformity with accounting principles
generally accepted in the United States requires the company to make significant
estimates and assumptions that affect the amounts reported in the consolidated
financial statements and accompanying notes. Actual results could
differ from those estimates.
Subsequent
Events
The
company evaluated subsequent events through February 3, 2010, the issuance date
of these consolidated financial statements.
Accounting Standards
Codification
During
2009, the company adopted the Financial Accounting Standards Board ("FASB")
Accounting Standards Update No. 2009-01, "Amendments based on Statement of
Financial Accounting Standards No. 168 – The FASB Accounting Standards
Codification and the Hierarchy of Generally Accepted Accounting Principles" (the
"Codification"). The Codification became the single source of
authoritative GAAP in the United States, other than rules and interpretive
releases issued by the United States Securities and Exchange Commission ("SEC").
The Codification reorganized GAAP into a topical format that eliminates the
previous GAAP hierarchy and instead established two levels of guidance –
authoritative and nonauthoritative. All non-grandfathered, non-SEC
accounting literature that was not included in the Codification became
nonauthoritative. The adoption of the Codification did not change previous GAAP,
but rather simplified user access to all authoritative literature related to a
particular accounting topic in one place. Accordingly, the adoption
had no impact on the company’s consolidated financial position or results of
operations. All prior references to previous GAAP in the company’s
consolidated financial statements were updated for the new references under the
Codification.
Noncontrolling
Interests
Effective
January 1, 2009, the company adopted the FASB Accounting Standards Codification
("ASC") Topic 810-10-65. ASC Topic 810-10-65 requires that
noncontrolling interests be reported as a component of equity; net income
attributable to the parent and the noncontrolling interest be separately
identified in the consolidated results of operations; changes in a parent's
ownership interest be treated as equity transactions if control is maintained;
and upon a loss of control, any gain or loss on the interest be recognized in
the consolidated results of operations. ASC Topic 810-10-65 also
requires expanded disclosures to
clearly identify and distinguish between the interests of the parent and the
interests of the noncontrolling owners. The adoption of the provisions of
ASC Topic 810-10-65 did not materially impact the company's consolidated
financial position or results of operations. Prior period amounts
were reclassified to conform to the current period presentation.
Cash and Cash
Equivalents
Cash
equivalents consist of highly liquid investments, which are readily convertible
into cash, with original maturities of three months or less.
48
ARROW
ELECTRONICS, INC.
NOTES
TO CONSOLIDATED FINANCIAL STATEMENTS
(Dollars
in thousands except per share data)
Inventories
Inventories
are stated at the lower of cost or market. Cost approximates the
first-in, first-out method.
Property, Plant and
Equipment
Property,
plant and equipment are stated at cost. Depreciation is computed on
the straight-line method over the estimated useful lives of the
assets. The estimated useful lives for depreciation of buildings is
generally 20 to 30 years, and the estimated useful lives of machinery and
equipment is generally three to ten years. Leasehold improvements are
amortized over the shorter of the term of the related lease or the life of the
improvement. Long-lived assets are reviewed for impairment whenever changes in
circumstances or events may indicate that the carrying amounts are not
recoverable. If the fair value is less than the carrying amount of
the asset, a loss is recognized for the difference.
Software Development
Costs
The
company capitalizes certain internal and external costs incurred to acquire or
create internal-use software. Capitalized software costs are
amortized on a straight-line basis over the estimated useful life of the
software, which is generally three to seven years.
Identifiable Intangible
Assets
Identifiable
intangible assets are generally the result of acquisitions and consist primarily
of customer relationships, trade names, non-competition agreements, a long-term
procurement agreement, customer databases, and sales
backlog. Identifiable intangible assets are included in "Other
assets" in the company's consolidated balance sheets. Amortization of
definite-lived intangible assets is computed on the straight-line method over
the estimated useful lives of the assets, while indefinite-lived intangible
assets are not amortized. The weighted average useful life of
customer relationships is approximately 12 years. The useful life of
other intangible assets ranges from one to five years. Identifiable
intangible assets are reviewed for impairment whenever changes in circumstances
or events may indicate that the carrying amounts are not
recoverable. The company also tests indefinite-lived intangible
assets, consisting of acquired trade names, for impairment at least annually as
of the first day of the fourth quarter. If the fair value is less
than the carrying amount of the asset, a loss is recognized for the
difference.
Investments
Investments
are accounted for using the equity method if the investment provides the company
the ability to exercise significant influence, but not control, over an
investee. Significant influence is generally deemed to exist if the
company has an ownership interest in the voting stock of the investee between
20% and 50%, although other factors, such as representation on the investee's
Board of Directors, are considered in determining whether the equity method is
appropriate. The company records its investments in equity method investees
meeting these characteristics as "Investments in affiliated companies" in the
company's consolidated balance sheets.
All other
equity investments, which consist of investments for which the company does not
possess the ability to exercise significant influence, are accounted for under
the cost method, if private, or as available-for-sale, if public, and are
included in "Other assets" in the company's consolidated balance
sheets. Under the cost method of accounting, investments are carried
at cost and are adjusted only for other-than-temporary declines in realizable
value and additional investments. The company assesses its long-term
investments accounted for as available-for-sale on a quarterly basis to
determine whether declines in market value below cost are
other-than-temporary. When the decline is
49
ARROW
ELECTRONICS, INC.
NOTES
TO CONSOLIDATED FINANCIAL STATEMENTS
(Dollars
in thousands except per share data)
determined
to be other-than-temporary, the cost basis for the individual security is
reduced and a loss is realized in the company's consolidated statement of
operations in the period in which it occurs. When the decline is determined to
be temporary, the unrealized losses are included in the shareholders' equity
section in the company's consolidated balance sheets in "Other." The company
makes such determination based upon the quoted market price, financial
condition, operating results of the investee, and the company's intent and
ability to retain the investment over a period of time, which is sufficient to
allow for any recovery in market value. In addition, the company assesses the
following factors:
|
|
·
|
broad
economic factors impacting the investee's
industry;
|
|
|
·
|
publicly
available forecasts for sales and earnings growth for the industry and
investee; and
|
|
|
·
|
the
cyclical nature of the investee's
industry.
|
The
company could incur an impairment charge in future periods if, among other
factors, the investee's future earnings differ from currently available
forecasts.
Cost in Excess of Net Assets
of Companies Acquired
Goodwill
represents the excess of the cost of an acquisition over the fair value of the
assets acquired. The company tests goodwill for impairment annually
as of the first day of the fourth quarter, and when an event occurs or
circumstances change such that it is more likely than not that an impairment may
exist, such as (i) a significant adverse change in legal factors or in business
climate, (ii) an adverse action or assessment by a regulator, (iii)
unanticipated competition, (iv) a loss of key personnel, (v) a
more-likely-than-not sale or disposal of all or a significant portion of a
reporting unit, (vi) the testing for recoverability of a significant asset group
within a reporting unit, or (vii) the recognition of a goodwill impairment loss
of a subsidiary that is a component of the reporting unit. In addition, goodwill
is required to be tested for impairment after a portion of the goodwill is
allocated to a business targeted for disposal.
Goodwill
is reviewed for impairment utilizing a two-step process. The first
step of the impairment test requires the identification of the reporting units
and comparison of the fair value of each of these reporting units to the
respective carrying value. The company's reporting units are defined as each of
the three regional businesses within the global components business segment,
which are North America, EMEASA, and Asia/Pacific and each of the two regional
businesses within the global Enterprise Computing Solutions ("ECS") business
segment, which are North America and Europe. Prior to 2009, the North
America and Europe reporting units within the global ECS business segment were
evaluated as a single reporting unit. If the carrying value of the
reporting unit is less than its fair value, no impairment exists and the second
step is not performed. If the carrying value of the reporting unit is
higher than its fair value, the second step must be performed to compute the
amount of the goodwill impairment, if any. In the second step, the
impairment is computed by comparing the implied fair value of the reporting unit
goodwill with the carrying amount of that goodwill. If the carrying
amount of the reporting unit goodwill exceeds the implied fair value of that
goodwill, an impairment loss is recognized for the excess.
The
company generally estimates the fair value of a reporting unit using a
three-year weighted average multiple of earnings before interest and taxes from
comparable companies, which utilizes a look-back approach. The
assumptions utilized in the evaluation of the impairment of goodwill under this
approach include the identification of reporting units and the selection of
comparable companies, which are critical accounting estimates subject to
change. During 2009 and 2008, as a result of significant declines in
macroeconomic conditions, the company determined that it was prudent to
supplement its historical goodwill impairment testing methodology with a
forward-looking discounted cash flow methodology. The assumptions
included in the discounted cash flow methodology included forecasted revenues,
gross profit margins, operating income margins, working capital cash flow,
perpetual growth rates, and long-term discount rates, among others, all of which
require significant judgments by management.
50
ARROW
ELECTRONICS, INC.
NOTES
TO CONSOLIDATED FINANCIAL STATEMENTS
(Dollars
in thousands except per share data)
Foreign Currency
Translation
The
assets and liabilities of international operations are translated at the
exchange rates in effect at the balance sheet date, with the related translation
gains or losses reported as a separate component of shareholders' equity in the
company's consolidated balance sheets. The results of international operations
are translated at the monthly average exchange rates.
Income
Taxes
Income
taxes are accounted for under the liability method. Deferred taxes
reflect the tax consequences on future years of differences between the tax
bases of assets and liabilities and their financial reporting amounts. The
carrying value of the company's deferred tax assets is dependent upon the
company's ability to generate sufficient future taxable income in certain tax
jurisdictions. Should the company determine that it is more likely than not that
some portion or all of its deferred assets will not be realized, a valuation
allowance to the deferred tax assets would be established in the period such
determination was made.
It is the
company's policy to provide for uncertain tax positions and the related interest
and penalties based upon management's assessment of whether a tax benefit is
more likely than not to be sustained upon examination by tax
authorities. At December 31, 2009, the company believes it has
appropriately accounted for any unrecognized tax benefits. To the
extent the company prevails in matters for which a liability for an unrecognized
tax benefit is established or is required to pay amounts in excess of the
liability, the company's effective tax rate in a given financial statement
period may be affected.
Net Income (Loss) Per
Share
Basic net
income (loss) per share is computed by dividing net income (loss) attributable
to shareholders by the weighted average number of common shares outstanding for
the period. Diluted net income (loss) per share reflects the potential dilution
that would occur if securities or other contracts to issue common stock were
exercised or converted into common stock.
Comprehensive Income
(Loss)
Comprehensive
income (loss) consists of consolidated net income (loss), foreign currency
translation adjustments, unrealized gains or losses on securities, and interest
rate swaps designated as cash flow hedges, in addition to other employee benefit
plan items. Unrealized gains or losses on securities are net of any
reclassification adjustments for realized gains or losses included in
consolidated net income (loss). Except for unrealized gains or losses
resulting from the company's cross-currency swaps, foreign currency translation
adjustments included in comprehensive income (loss) were not tax effected as
investments in international affiliates are deemed to be permanent.
Stock-Based
Compensation
The
company records share-based payment awards exchanged for employee services at
fair value on the date of grant and expenses the awards in the consolidated
statements of operations over the requisite employee service
period. Stock-based compensation expense includes an estimate for
forfeitures and is generally recognized over the expected term of the award on a
straight-line basis. Stock-based compensation expense related to
awards with a market or performance condition is recognized over the expected
term of the award utilizing the graded vesting method. The company
recorded, as a component of selling, general and administrative expenses
("SG&A"), amortization of stock-based compensation of $33,017, $18,092, and
$21,389 in 2009, 2008, and 2007, respectively.
51
ARROW
ELECTRONICS, INC.
NOTES
TO CONSOLIDATED FINANCIAL STATEMENTS
(Dollars
in thousands except per share data)
Segment
Reporting
Operating
segments are defined as components of an enterprise for which separate financial
information is available that is evaluated regularly by the chief operating
decision maker in deciding how to allocate resources and in assessing
performance. The company's operations are classified into two reportable
business segments: global components and global ECS.
Revenue
Recognition
The
company recognizes revenue when there is persuasive evidence of an arrangement,
delivery has occurred or services are rendered, the sales price is determinable,
and collectibility is reasonably assured. Revenue typically is
recognized at time of shipment. Sales are recorded net of discounts, rebates,
and returns, which historically were not material.
A portion
of the company's business involves shipments directly from its suppliers to its
customers. In these transactions, the company is responsible for negotiating
price both with the supplier and customer, payment to the supplier, establishing
payment terms with the customer, product returns, and has risk of loss if the
customer does not make payment. As the principal with the customer, the company
recognizes the sale and cost of sale of the product upon receiving notification
from the supplier that the product was shipped.
The
company has certain business with select customers and suppliers that is
accounted for on an agency basis (that is, the company recognizes the fees
associated with serving as an agent in sales with no associated cost of sales)
in accordance with FASB ASC Topic 605-45-45. Generally, these transactions
relate to the sale of supplier service contracts to customers where the company
has no future obligation to perform under these contracts or the rendering of
logistics services for the delivery of inventory for which the company does not
assume the risks and rewards of ownership.
Shipping and Handling
Costs
Shipping
and handling costs included in SG&A totaled $54,006, $73,617, and $67,911 in
2009, 2008, and 2007, respectively.
Sabbatical
Liability
Effective
January 1, 2007, the company adopted FASB ASC Topic 710-10-25. ASC
Topic 710-10-25 requires that compensation expense associated with a sabbatical
leave, or other similar benefit arrangements, be accrued over the requisite
service period during which an employee earns the benefit. Upon
adoption, the company recognized a liability of $18,048 and a cumulative-effect
adjustment to retained earnings of $10,794, net of related taxes.
Impact of Recently Issued
Accounting Standards
In October 2009, the FASB issued
Accounting Standards Update No. 2009-13, "Multiple-Deliverable Revenue
Arrangements" ("ASU No. 2009-13"). ASU No. 2009-13 amends guidance included within ASC
Topic 605-25 to require an entity to use an estimated
selling price when vendor specific objective evidence or acceptable third party
evidence does not exist for any products or services included in a multiple
element arrangement. The arrangement consideration should be allocated among the
products and services based upon their relative selling prices, thus eliminating
the use of the residual method of allocation. ASU No. 2009-13 also requires
expanded qualitative and quantitative disclosures regarding significant
judgments made and changes in applying this guidance. ASU No. 2009-13 is effective
prospectively for revenue arrangements entered into or materially modified in
fiscal years beginning on or after June 15, 2010. Early adoption
and retrospective application are also permitted. The company is
currently evaluating the impact of adopting the provisions of ASU No.
2009-13.
52
ARROW
ELECTRONICS, INC.
NOTES
TO CONSOLIDATED FINANCIAL STATEMENTS
(Dollars
in thousands except per share data)
In October 2009, the FASB issued Accounting Standards Update No. 2009-14, "Certain Revenue Arrangements That
Include Software Elements" ("ASU No. 2009-14"). ASU No. 2009-14 amends guidance
included within ASC Topic 985-605 to exclude tangible products containing
software components and non-software components that function together to
deliver the product’s essential functionality. Entities that sell
joint hardware and software products that meet this scope exception will be
required to follow the guidance of ASU No. 2009-13. ASU No. 2009-14
is effective prospectively for revenue arrangements entered into or materially
modified in fiscal years beginning on or after June 15,
2010. Early adoption and retrospective application are also
permitted. The company is currently evaluating the impact of adopting
the provisions of ASU No. 2009-14.
In June 2009, the FASB issued FASB
Statement No. 166, "Accounting for Transfers of Financial Assets, an amendment
of FASB Statement No. 140" ("Statement No. 166"), codified in ASC Topic
810-10. Statement No. 166, among other things, eliminates the concept
of a "qualifying special-purpose entity," changes the requirements for
derecognizing financial assets, and requires additional disclosures about
transfers of financial assets. Statement No. 166 is effective for
annual reporting periods beginning after November 15, 2009. The
adoption of the provisions of Statement No. 166 is not anticipated to impact the
company's consolidated financial position or results of
operations.
In June 2009, the FASB issued FASB
Statement No. 167, "Amendments to FASB Interpretation No. ("FIN") 46(R)"
("Statement No. 167"), codified in ASC Topic 810-10. Statement No.
167, among other things, requires a qualitative rather than a quantitative
analysis to determine the primary beneficiary of a variable interest entity
("VIE"), amends FIN 46(R)’s consideration of related party relationships in the
determination of the primary beneficiary of a VIE, amends certain guidance in
FIN 46(R) for determining whether an entity is a VIE, requires continuous
assessments of whether an enterprise is the primary beneficiary of a VIE, and
requires enhanced disclosures about an enterprise’s involvement with a
VIE. Statement No. 167 is effective for annual reporting periods
beginning after November 15, 2009. The adoption of the provisions of
Statement No. 167 is not anticipated to impact the company's consolidated
financial position or results of operations.
Reclassification
Certain
prior year amounts were reclassified to conform to the current year
presentation.
2.
Acquisitions
Effective
January 1, 2009, the company began accounting for business combinations under
ASC Topic 805 which requires, among other things, the acquiring entity in a
business combination to recognize the fair value of all the assets acquired and
liabilities assumed; the recognition of acquisition-related costs in the
consolidated results of operations; the recognition of restructuring costs in
the consolidated results of operations for which the acquirer becomes obligated
after the acquisition date; and contingent purchase consideration to be
recognized at their fair values on the acquisition date with subsequent
adjustments recognized in the consolidated results of operations. The accounting
prescribed by ASC Topic 805 is applicable for all business combinations entered
into after January 1, 2009.
The
results of operations of the below acquisitions were included in the company's
consolidated results from their respective dates of acquisition.
2009
On
December 20, 2009, the company acquired A.E. Petsche Company, Inc. ("Petsche")
for a purchase price of $174,100, which includes cash acquired of $4,036 and is
subject to a final working capital adjustment. The purchase price
does not reflect the present value of the income tax benefits the company will
receive relating to the deductibility of intangible assets for income tax
purposes, which are
53
ARROW
ELECTRONICS, INC.
NOTES
TO CONSOLIDATED FINANCIAL STATEMENTS
(Dollars
in thousands except per share data)
estimated
to be approximately $25,000. Petsche headquartered in Arlington,
Texas, is a leading provider of interconnect products, including specialty wire,
cable, and harness management solutions, to the aerospace and defense markets.
With approximately 250 employees, Petsche provides value-added distribution
services to over 3,500 customers in the United States, Canada, Mexico, the
United Kingdom, France, and Belgium. Total Petsche sales for 2009
were approximately $190,000.
The
following table summarizes the preliminary allocation of the net consideration
paid to the fair value of the assets acquired and liabilities assumed for the
Petsche acquisition:
|
Accounts
receivable, net
|
$ | 32,208 | ||
|
Inventories
|
50,403 | |||
|
Prepaid
expenses and other assets
|
661 | |||
|
Property,
plant and equipment
|
2,831 | |||
|
Identifiable
intangible assets
|
80,900 | |||
|
Cost
in excess of net assets of companies acquired
|
19,048 | |||
|
Accounts
payable
|
(12,551 | ) | ||
|
Accrued
expenses
|
(3,383 | ) | ||
|
Other
liabilities
|
(53 | ) | ||
|
Cash
consideration paid, net of cash acquired
|
$ | 170,064 |
The
company allocated $26,300 of the purchase price to intangible assets relating to
customer relationships, with a useful life of 15 years, $52,000 to trade names
with an indefinite useful life, and $2,600 to other intangible assets
(consisting of non-competition agreements and sales backlog), with useful lives
ranging from one to three years.
The cost
in excess of net assets of companies acquired related to the Petsche acquisition
was recorded in the company's global components business
segment. Substantially all of the intangible assets related to the
Petsche acquisition are expected to be deductible for income tax
purposes.
The
following table summarizes the company's unaudited consolidated results of
operations for 2009 and 2008 as well as the unaudited pro forma consolidated
results of operations of the company, as though the Petsche acquisition occurred
on January 1:
|
For the Years Ended December 31,
|
||||||||||||||||
|
2009
|
2008
|
|||||||||||||||
|
As Reported
|
Pro Forma
|
As Reported
|
Pro Forma
|
|||||||||||||
|
Sales
|
$ | 14,684,101 | $ | 14,867,421 | $ | 16,761,009 | $ | 16,977,405 | ||||||||
|
Net
income (loss) attributable to shareholders
|
123,512 | 133,568 | (613,739 | ) | (603,554 | ) | ||||||||||
|
Net
income (loss) per share:
|
||||||||||||||||
|
Basic
|
$ | 1.03 | $ | 1.11 | $ | (5.08 | ) | $ | (5.00 | ) | ||||||
|
Diluted
|
$ | 1.03 | $ | 1.11 | $ | (5.08 | ) | $ | (5.00 | ) | ||||||
The
unaudited pro forma consolidated results of operations does not purport to be
indicative of the results obtained had the Petsche acquisition occurred as of
the beginning of 2009 and 2008, or of those results that may be obtained in the
future. Additionally, the above table does not reflect any
anticipated cost savings or cross-selling opportunities expected to result from
this acquisition.
54
ARROW
ELECTRONICS, INC.
NOTES
TO CONSOLIDATED FINANCIAL STATEMENTS
(Dollars
in thousands except per share data)
2008
On June
2, 2008, the company acquired LOGIX S.A. ("LOGIX"), a subsidiary of Groupe OPEN
for a purchase price of $205,937, which included $15,508 of debt paid at
closing, cash acquired of $3,647, and acquisition costs. In addition,
$46,663 in debt was assumed. LOGIX is a leading value-added
distributor of midrange servers, storage, and software to over 6,500 partners in
11 European countries. Total LOGIX sales for 2007 were approximately
$600,000 (approximately €440,000). For 2008, LOGIX sales of $376,852
were included in the company's consolidated results of operations from the date
of acquisition.
The
following table summarizes the allocation of the net consideration paid to the
fair value of the assets acquired and liabilities assumed for the LOGIX
acquisition:
|
Accounts
receivable, net
|
$ | 119,599 | ||
|
Inventories
|
26,776 | |||
|
Prepaid
expenses and other assets
|
6,058 | |||
|
Property,
plant and equipment
|
5,234 | |||
|
Identifiable
intangible assets
|
23,262 | |||
|
Cost
in excess of net assets of companies acquired
|
174,269 | |||
|
Accounts
payable
|
(90,660 | ) | ||
|
Accrued
expenses
|
(6,878 | ) | ||
|
Debt
(including short-term borrowings of $43,096)
|
(46,663 | ) | ||
|
Other
liabilities
|
(8,707 | ) | ||
|
Cash
consideration paid, net of cash acquired
|
$ | 202,290 |
The
company allocated $21,401 of the purchase price to intangible assets relating to
customer relationships, with a useful life of 10 years, and $1,861 to other
intangible assets (consisting of non-competition agreements and sales backlog),
with useful lives ranging from one to two years.
The cost
in excess of net assets of companies acquired related to the LOGIX acquisition
was recorded in the company's global ECS business segment. The
intangible assets related to the LOGIX acquisition are not expected to be
deductible for income tax purposes.
During
2008, the company acquired Hynetic Electronics and Shreyanics Electronics, a
components distribution business in India, ACI Electronics LLC, a distributor of
electronic components used in defense and aerospace applications, Achieva Ltd.,
a value-added distributor of semiconductors and electro-mechanical devices,
Excel Tech, Inc., the sole Broadcom distributor in Korea, and Eteq Components
Pte Ltd, a Broadcom-based components distribution business in the ASEAN region
and China. The impact of these acquisitions was not material to the
company's consolidated financial position or results of
operations. Annual sales for these acquisitions were approximately
$320,000.
2007
On March
31, 2007, the company acquired from Agilysys, Inc. ("Agilysys") substantially
all of the assets and operations of their KeyLink Systems Group business
("KeyLink") for a purchase price of $480,640 in cash, which included acquisition
costs and final adjustments based upon a closing audit. The company
also entered into a long-term procurement agreement with
Agilysys. KeyLink, a leading enterprise computing solutions
distributor, provides complex solutions from industry leading manufacturers to
more than 800 reseller partners. KeyLink has long-standing reseller
relationships that provide the company with significant cross-selling
opportunities. KeyLink's highly experienced sales and marketing professionals
strengthen the company's existing relationships with value-added resellers
("VARs") and position the company to attract new relationships.
55
ARROW
ELECTRONICS, INC.
NOTES
TO CONSOLIDATED FINANCIAL STATEMENTS
(Dollars
in thousands except per share data)
The cost
in excess of net assets of companies acquired related to the KeyLink acquisition
was recorded in the company's global ECS business
segment. Substantially all of the intangible assets related to the
KeyLink acquisition are expected to be deductible for income tax
purposes.
During
2007, the company acquired Adilam Pty. Ltd., a leading electronic components
distributor in Australia and New Zealand, Centia Group Limited and AKS Group AB,
specialty distributors of access infrastructure, security, and virtualization
software solutions in Europe, and Universe Electron Corporation, a distributor
of semiconductor and multimedia products in Japan. The impact of
these acquisitions was not material to the company's consolidated financial
position or results of operations. Annual sales for these
acquisitions were approximately $163,000.
Other
Amortization
expense related to identifiable intangible assets for the years ended December
31, 2009, 2008, and 2007 was $15,349, $15,324, and $14,546,
respectively. Amortization expense for each of the years 2010 through
2014 are estimated to be approximately $17,838, $16,082, $14,282, $13,215, and
$13,215, respectively.
In July
2007, the company paid $32,685 that was capitalized as cost in excess of net
assets of companies acquired, partially offset by the carrying value of the
related noncontrolling interest, to increase its ownership interest in Ultra
Source Technology Corp. ("Ultra Source") from 70.7% to 92.8%. In
January 2008, the company paid $8,699 to increase its ownership interest in
Ultra Source to 100%.
Additionally,
during 2008, the company paid $4,859, which was capitalized as cost in excess of
net assets of companies acquired, partially offset by the carrying value of the
related noncontrolling interest, to increase its ownership interest in other
majority-owned subsidiaries.
3.
Cost in Excess of Net Assets of Companies Acquired
Cost in
excess of net assets of companies acquired allocated to the company's business
segments follows:
|
Global
Components
|
Global ECS
|
Total
|
||||||||||
|
December
31, 2007
|
$ | 1,091,249 | $ | 687,986 | $ | 1,779,235 | ||||||
|
Acquisitions
|
105,734 | 84,479 | 190,213 | |||||||||
|
Impairment
charge
|
(716,925 | ) | (301,855 | ) | (1,018,780 | ) | ||||||
|
Other
(primarily foreign currency translation)
|
(26,580 | ) | (18,240 | ) | (44,820 | ) | ||||||
|
December
31, 2008
|
453,478 | 452,370 | 905,848 | |||||||||
|
Acquisitions
|
19,048 | - | 19,048 | |||||||||
|
Acquisition-related
adjustments
|
601 | (8,171 | ) | (7,570 | ) | |||||||
|
Other
(primarily foreign currency translation)
|
294 | 8,676 | 8,970 | |||||||||
|
December
31, 2009
|
$ | 473,421 | $ | 452,875 | $ | 926,296 | ||||||
Goodwill
represents the excess of the cost of an acquisition over the fair value of the
assets acquired. The company tests goodwill for
impairment annually as of the first day of the fourth quarter, or more
frequently if indicators of potential impairment exist.
56
ARROW
ELECTRONICS, INC.
NOTES
TO CONSOLIDATED FINANCIAL STATEMENTS
(Dollars
in thousands except per share data)
Goodwill
is reviewed for impairment utilizing a two-step process. The first
step of the impairment test requires the identification of the reporting units
and comparison of the fair value of each of these reporting units to the
respective carrying value. The company's reporting units are defined as each of
the three regional businesses within the global components business segment,
which are North America, EMEASA, and Asia/Pacific and each of the two regional
businesses within the global ECS business segment, which are North America and
Europe. Prior to 2009, the North America and Europe reporting units
within the global ECS business segment were evaluated as a single reporting
unit. If the carrying value of the reporting unit is less than its
fair value, no impairment exists and the second step is not
performed. If the carrying value of the reporting unit is higher than
its fair value, the second step must be performed to compute the amount of the
goodwill impairment, if any. In the second step, the impairment is
computed by comparing the implied fair value of the reporting unit goodwill with
the carrying amount of that goodwill. If the carrying amount of the
reporting unit goodwill exceeds the implied fair value of that goodwill, an
impairment loss is recognized for the excess.
The
company generally estimates the fair value of a reporting unit using a
three-year weighted average multiple of earnings before interest and taxes from
comparable companies, which utilizes a look-back approach. The
assumptions utilized in the evaluation of the impairment of goodwill under this
approach include the identification of reporting units and the selection of
comparable companies, which are critical accounting estimates subject to
change. During 2009 and 2008, as a result of a significant decline in
macroeconomic conditions, the company determined that it was prudent to
supplement its historical goodwill impairment testing methodology with a
forward-looking discounted cash flow methodology. The assumptions
included in the discounted cash flow methodology included forecasted revenues,
gross profit margins, operating income margins, working capital cash flow,
perpetual growth rates, and long-term discount rates, among others, all of which
require significant judgments by management. During 2009 and 2008,
the company also reconciled its discounted cash flow analysis to its current
market capitalization allowing for a reasonable control premium. As
of the first day of the fourth quarters of 2007, 2008, and 2009, the company's
annual impairment testing did not indicate impairment at any of the company's
reporting units.
During
the fourth quarter of 2008, as a result of significant declines in macroeconomic
conditions, global equity valuations depreciated. Both factors
impacted the company's market capitalization, and the company determined it was
necessary to perform an interim goodwill impairment test as of December 31,
2008. Based upon the results of the discounted cash flow approach as
of December 31, 2008, the carrying value of the global ECS reporting unit and
the EMEASA and Asia/Pacific reporting units within the global components
business segment were higher than their fair value and, accordingly, the company
performed a step-two impairment analysis. The fair value of the North America
reporting unit within the global components business segment was higher than its
carrying value and a step-two analysis was not required. The results
of the step-two impairment analysis indicated that goodwill related to the
EMEASA and Asia/Pacific reporting units within the global components business
segment were fully impaired and the goodwill related to the global ECS business
segment was partially impaired. The company recognized a total
non-cash impairment charge of $1,018,780 ($905,069 net of related taxes or $7.49
per share on both a basic and diluted basis) as of December 31, 2008, of which
$716,925 related to the company's global components business segment and
$301,855 related to the company's global ECS business segment.
The
impairment charge did not impact the company’s consolidated cash flows,
liquidity, capital resources, and covenants under its existing revolving credit
facility, asset securitization program, and other outstanding
borrowings.
4.
Investments in Affiliated Companies
The
company owns a 50% interest in several joint ventures with Marubun Corporation
(collectively "Marubun/Arrow") and a 50% interest in Altech Industries (Pty.)
Ltd. ("Altech Industries"), a joint venture with Allied Technologies
Limited. These investments are accounted for using the equity
method.
57
ARROW
ELECTRONICS, INC.
NOTES
TO CONSOLIDATED FINANCIAL STATEMENTS
(Dollars
in thousands except per share data)
The
following table presents the company's investment in Marubun/Arrow, the
company's investment and long-term note receivable in Altech Industries, and the
company's other equity investments at December 31:
|
2009
|
2008
|
|||||||
|
Marubun/Arrow
|
$ | 37,649 | $ | 34,881 | ||||
|
Altech
Industries
|
15,361 | 11,888 | ||||||
|
Other
|
- | 19 | ||||||
| $ | 53,010 | $ | 46,788 | |||||
The
equity in earnings (loss) of affiliated companies for the years ended December
31 consists of the following:
|
2009
|
2008
|
2007
|
||||||||||
|
Marubun/Arrow
|
$ | 3,745 | $ | 5,486 | $ | 5,440 | ||||||
|
Altech
Industries
|
1,004 | 1,233 | 1,550 | |||||||||
|
Other
|
(18 | ) | (170 | ) | (84 | ) | ||||||
| $ | 4,731 | $ | 6,549 | $ | 6,906 | |||||||
Under the
terms of various joint venture agreements, the company is required to pay its
pro-rata share of the third party debt of the joint ventures in the event that
the joint ventures are unable to meet their obligations. At December
31, 2009, the company's pro-rata share of this debt was approximately $6,100.
The company believes that there is sufficient equity in the joint ventures to
meet their obligations.
5.
Accounts Receivable
The
company has a $600,000 asset securitization program collateralized by accounts
receivables of certain of its North American subsidiaries which expires in March
2010. The asset securitization program is conducted through Arrow
Electronics Funding Corporation, a wholly-owned, bankruptcy remote subsidiary.
The asset securitization program does not qualify for sale
treatment. Accordingly, the accounts receivable and related debt
obligation remain on the company's consolidated balance
sheets. Interest on borrowings is calculated using a base rate or a
commercial paper rate plus a spread, which is based on the company's credit
ratings (.225% at December 31, 2009). The facility fee is
.125%.
The
company had no outstanding borrowings under the asset securitization program at
December 31, 2009 and 2008.
Accounts
receivable, net, consists of the following at December 31:
|
2009
|
2008
|
|||||||
|
Accounts
receivable
|
$ | 3,175,815 | $ | 3,140,076 | ||||
|
Allowance
for doubtful accounts
|
(39,674 | ) | (52,786 | ) | ||||
|
Accounts
receivable, net
|
$ | 3,136,141 | $ | 3,087,290 | ||||
The
company maintains allowances for doubtful accounts for estimated losses
resulting from the inability of its customers to make required payments. The
allowances for doubtful accounts are determined using a combination of factors,
including the length of time the receivables are outstanding, the current
business environment, and historical experience.
58
ARROW
ELECTRONICS, INC.
NOTES
TO CONSOLIDATED FINANCIAL STATEMENTS
(Dollars
in thousands except per share data)
6.
Debt
Short-term
borrowings, including current portion of long-term debt, consist of the
following at December 31:
|
2009
|
2008
|
|||||||
|
9.15%
senior notes, due 2010
|
$ | 69,544 | $ | - | ||||
|
Cross-currency
swap, due 2010
|
41,943 | - | ||||||
|
Interest
rate swaps designated as fair value hedges
|
2,036 | - | ||||||
|
Short-term
borrowings in various countries
|
9,572 | 52,893 | ||||||
| $ | 123,095 | $ | 52,893 | |||||
Short-term
borrowings in various countries are primarily utilized to support the working
capital requirements of certain international operations. The
weighted average interest rates on these borrowings at December 31, 2009 and
2008 were 3.5% and 3.6%, respectively.
Long-term
debt consists of the following at December 31:
|
2009
|
2008
|
|||||||
|
9.15%
senior notes, due 2010
|
$ | - | $ | 199,994 | ||||
|
Bank
term loan, due 2012
|
200,000 | 200,000 | ||||||
|
6.875%
senior notes, due 2013
|
349,765 | 349,694 | ||||||
|
6.875%
senior debentures, due 2018
|
198,241 | 198,032 | ||||||
|
6.00%
notes, due 2020
|
299,909 | - | ||||||
|
7.5%
senior debentures, due 2027
|
197,610 | 197,470 | ||||||
|
Cross-currency
swap, due 2010
|
- | 36,467 | ||||||
|
Cross-currency
swap, due 2011
|
12,497 | 9,985 | ||||||
|
Interest
rate swaps designated as fair value hedges
|
9,556 | 21,394 | ||||||
|
Other
obligations with various interest rates and due dates
|
8,560 | 10,949 | ||||||
| $ | 1,276,138 | $ | 1,223,985 | |||||
The 7.5%
senior debentures are not redeemable prior to their maturity. The
9.15% senior notes, 6.875% senior notes, 6.875% senior debentures, and 6.00%
notes may be called at the option of the company subject to "make whole"
clauses.
The
estimated fair market value at December 31, using quoted market prices,
follow:
|
2009
|
2008
|
|||||||
|
9.15%
senior notes, due 2010
|
$ | 73,000 | $ | 206,000 | ||||
|
6.875%
senior notes, due 2013
|
378,000 | 329,000 | ||||||
|
6.875%
senior debentures, due 2018
|
214,000 | 160,000 | ||||||
|
6.00%
notes, due 2020
|
300,000 | - | ||||||
|
7.5%
senior debentures, due 2027
|
208,000 | 152,000 | ||||||
59
ARROW
ELECTRONICS, INC.
NOTES
TO CONSOLIDATED FINANCIAL STATEMENTS
(Dollars
in thousands except per share data)
The
carrying amounts of the company's short-term borrowings, bank term loan, and
other obligations approximate their fair value.
Annual
payments of borrowings during each of the years 2010 through 2014 are $123,095,
$13,228, $200,405, $359,423, and 7,322, respectively, and $695,760 for all years
thereafter.
The
company has an $800,000 revolving credit facility with a group of banks that
matures in January 2012. Interest on borrowings under the revolving
credit facility is calculated using a base rate or a euro currency rate plus a
spread based on the company's credit ratings (.425% at December 31, 2009). The
facility fee related to the revolving credit facility is .125%. The
company had no outstanding borrowings under the revolving credit facility at
December 31, 2009 and 2008. The company also entered into a $200,000
term loan with the same group of banks, which is repayable in full in January
2012. Interest on the term loan is calculated using a base rate or a
euro currency rate plus a spread based on the company's credit ratings (.60% at
December 31, 2009).
The
revolving credit facility and the asset securitization program include terms and
conditions that limit the incurrence of additional borrowings, limit the
company's ability to pay cash dividends or repurchase stock, and require that
certain financial ratios be maintained at designated levels. The company was in
compliance with all covenants as of December 31, 2009 and is currently not aware
of any events that would cause non-compliance with any covenants in the
future.
During
2009, the company repurchased $130,455 principal amount of its 9.15% senior
notes due 2010. The related loss on the repurchase, including the
premium paid and write-off of the deferred financing costs, offset by the gain
for terminating a portion of the interest rate swaps aggregated $5,312 ($3,228
net of related taxes or $.03 per share on both a basic and diluted basis) and
was recognized as a loss on prepayment of debt.
During
2009, the company completed the sale of $300,000 principal amount of 6.00% notes
due in 2020. The net proceeds of the offering of $297,430 were used
to repay a portion of the previously discussed 9.15% senior notes due 2010 and
for general corporate purposes.
Interest
and other financing expense, net, includes interest income of $2,964, $5,337,
and $5,726 in 2009, 2008, and 2007, respectively. Interest paid, net
of interest income, amounted to $79,952, $96,993, and $98,881 in 2009, 2008, and
2007, respectively.
7.
Financial Instruments Measured at Fair Value
Fair
value is defined as the exchange price that would be received for an asset or
paid to transfer a liability (an exit price) in the principal or most
advantageous market for the asset or liability in an orderly transaction between
market participants on the measurement date. The company utilizes a
fair value hierarchy, which maximizes the use of observable inputs and minimizes
the use of unobservable inputs when measuring fair value. The fair
value hierarchy has three levels of inputs that may be used to measure fair
value:
|
Level
1
|
Unadjusted
quoted prices in active markets that are accessible at the measurement
date for identical, unrestricted assets or
liabilities.
|
|
Level
2
|
Quoted
prices in markets that are not active; or other inputs that are
observable, either directly or indirectly, for substantially the full term
of the asset or liability.
|
|
Level
3
|
Prices
or valuation techniques that require inputs that are both significant to
the fair value measurement and
unobservable.
|
60
ARROW
ELECTRONICS, INC.
NOTES
TO CONSOLIDATED FINANCIAL STATEMENTS
(Dollars
in thousands except per share data)
The
following table presents assets/(liabilities) measured at fair value on a
recurring basis at December 31, 2009:
|
Level 1
|
Level 2
|
Level 3
|
Total
|
|||||||||||||
|
Cash
equivalents
|
$ | - | $ | 744,125 | $ | - | $ | 744,125 | ||||||||
|
Available-for-sale
securities
|
56,464 | - | - | 56,464 | ||||||||||||
|
Interest
rate swaps
|
- | 11,592 | - | 11,592 | ||||||||||||
|
Cross-currency
swaps
|
- | (54,440 | ) | - | (54,440 | ) | ||||||||||
| $ | 56,464 | $ | 701,277 | $ | - | $ | 757,741 | |||||||||
The
following table presents assets/(liabilities) measured at fair value on a
recurring basis at December 31, 2008:
|
Level 1
|
Level 2
|
Level 3
|
Total
|
|||||||||||||
|
Cash
equivalents
|
$ | - | $ | 198,800 | $ | - | $ | 198,800 | ||||||||
|
Available-for-sale
securities
|
21,187 | - | - | 21,187 | ||||||||||||
|
Interest
rate swaps
|
- | 19,541 | - | 19,541 | ||||||||||||
|
Cross-currency
swaps
|
- | (46,452 | ) | - | (46,452 | ) | ||||||||||
| $ | 21,187 | $ | 171,889 | $ | - | $ | 193,076 | |||||||||
Available-For-Sale
Securities
The
company has a 2.7% equity ownership interest in WPG Holdings Co., Ltd. ("WPG")
and an 8.4% equity ownership interest in Marubun Corporation ("Marubun"), which
are accounted for as available-for-sale securities.
The fair
value of the company's available-for-sale securities is as follows at December
31:
|
2009
|
2008
|
|||||||||||||||
|
Marubun
|
WPG
|
Marubun
|
WPG
|
|||||||||||||
|
Cost
basis
|
$ | 10,016 | $ | 10,798 | $ | 10,016 | $ | 10,798 | ||||||||
|
Unrealized
holding gain
|
4,408 | 31,242 | - | 373 | ||||||||||||
|
Fair
value
|
$ | 14,424 | $ | 42,040 | $ | 10,016 | $ | 11,171 | ||||||||
The fair
value of these investments is included in "Other assets" in the company's
consolidated balance sheets, and the related net unrealized holding gains and
losses are included in "Other" in the shareholders' equity section in the company's
consolidated balance sheets.
During
2008, the company determined that an other-than-temporary decline in the fair
value of Marubun occurred based upon various factors including the financial
condition and near-term prospects of Marubun, the magnitude of the loss compared
to the investment's cost, the length of time the investment was in an unrealized
loss position, and publicly available information about the industry and
geographic region in which Marubun operates and, accordingly, recorded a loss of
$10,030 ($.08 per share on both a basic and diluted basis) on the write-down of
this investment.
61
ARROW
ELECTRONICS, INC.
NOTES
TO CONSOLIDATED FINANCIAL STATEMENTS
(Dollars
in thousands except per share data)
Derivative
Instruments
The
company uses various financial instruments, including derivative financial
instruments, for purposes other than trading. Derivatives used as
part of the company's risk management strategy are designated at inception as
hedges and measured for effectiveness both at inception and on an ongoing
basis.
The fair
values of derivative instruments in the consolidated balance sheet as of
December 31, 2009 follow:
|
Asset/(Liability) Derivatives
|
||||||
|
Balance Sheet
Location
|
Fair Value
|
|||||
|
Derivative
instruments designated as hedges:
|
||||||
|
Interest
rate swaps designated as fair value hedges
|
Prepaid
expenses
|
$ | 2,036 | |||
|
Interest
rate swaps designated as fair value hedges
|
Other
assets
|
9,556 | ||||
|
Cross-currency
swaps designated as net investment hedges
|
Short-term
borrowings
|
(41,943 | ) | |||
|
Cross-currency
swaps designated as net investment hedges
|
Long-term
debt
|
(12,497 | ) | |||
|
Foreign
exchange contracts designated as cash flow hedges
|
Prepaid
expenses
|
406 | ||||
|
Foreign
exchange contracts designated as cash flow hedges
|
Accrued
expenses
|
(272 | ) | |||
|
Total
derivative instruments designated as hedging instruments
|
(42,714 | ) | ||||
|
Derivative
instruments not designated as hedges:
|
||||||
|
Foreign
exchange contracts
|
Prepaid
expenses
|
2,362 | ||||
|
Foreign
exchange contracts
|
Accrued
expenses
|
(1,952 | ) | |||
|
Total
derivative instruments not designated as hedging
instruments
|
410 | |||||
|
Total
|
$ | (42,304 | ) | |||
The
effect of derivative instruments on the consolidated statement of operations for
the year ended December 31, 2009 follow:
|
Gain/(Loss)
Recognized
in Income
|
||||
|
Fair
value hedges:
|
||||
|
Interest
rate swaps (a)
|
$
|
4,907
|
||
|
Total
|
$
|
4,907
|
||
|
Derivative
instruments not designated as hedges:
|
||||
|
Foreign
exchange contracts (b)
|
$
|
(8,574
|
)
|
|
|
Total
|
$
|
(8,574
|
)
|
|
62
ARROW
ELECTRONICS, INC.
NOTES
TO CONSOLIDATED FINANCIAL STATEMENTS
(Dollars
in thousands except per share data)
|
Effective Portion
|
Ineffective
Portion
|
|||||||||||
|
Gain/(Loss)
Recognized in
Other
Comprehensive
Income
|
Gain/(Loss)
Reclassified
into Income
|
Gain/(Loss)
Recognized in
Income
|
||||||||||
|
Cash
Flow Hedges:
|
||||||||||||
|
Interest
rate swaps (c)
|
$ | 1,853 | $ | - | $ | - | ||||||
|
Foreign
exchange contracts (d)
|
(2,277 | ) | 94 | - | ||||||||
|
Total
|
$ | (424 | ) | $ | 94 | $ | - | |||||
|
Net
Investment Hedges:
|
||||||||||||
|
Cross-currency
swaps (c)
|
$ | (7,988 | ) | $ | - | $ | 536 | |||||
|
Total
|
$ | (7,988 | ) | $ | - | $ | 536 | |||||
|
(a)
|
The
amount of gain/(loss) recognized in income on derivatives is recorded in
"Loss on prepayment of debt" in the accompanying consolidated statements
of operations.
|
|
(b)
|
The
amount of gain/(loss) recognized in income on derivatives is recorded in
"Cost of products sold" in the accompanying consolidated statements of
operations.
|
|
(c)
|
Both
the effective and ineffective portions of any gain/(loss) reclassified or
recognized in income is recorded in "Interest and other financing expense,
net" in the accompanying consolidated statements of
operations.
|
|
(d)
|
Both
the effective and ineffective portions of any gain/(loss) reclassified or
recognized in income is recorded in "Cost of products sold" in the
accompanying consolidated statements of
operations.
|
Interest Rate
Swaps
The
company enters into interest rate swap transactions that convert certain
fixed-rate debt to variable-rate debt or variable-rate debt to fixed-rate debt
in order to manage its targeted mix of fixed- and floating-rate
debt. The effective portion of the change in the fair value of
interest rate swaps designated as fair value hedges is recorded as a change to
the carrying value of the related hedged debt, and the effective portion of the
change in fair value of interest rate swaps designated as cash flow hedges is
recorded in the shareholders' equity section in the accompanying consolidated
balance sheets in "Other." The ineffective portion of the interest
rate swaps, if any, is recorded in "Interest and other financing expense, net"
in the accompanying consolidated statements of operations.
In June
2004, the company entered into interest rate swaps, with an aggregate notional
amount of $200,000. The swaps modify the company's interest rate
exposure by effectively converting the fixed 9.15% senior notes to a floating
rate, based on the six-month U.S. dollar LIBOR plus a spread (an effective rate
of 4.94% and 8.19% at December 31, 2009 and 2008, respectively), through its
maturity. In 2009, the company terminated $130,455 aggregate notional
amount of the interest rate swaps upon the repayment of a portion of the 9.15%
senior notes. The swaps are classified as fair value hedges and had a
fair value of $2,036 and $9,385 at December 31, 2009 and 2008,
respectively.
63
ARROW
ELECTRONICS, INC.
NOTES
TO CONSOLIDATED FINANCIAL STATEMENTS
(Dollars
in thousands except per share data)
In June
2004 and November 2009, the company entered into interest rate swaps, with an
aggregate notional amount of $275,000. The swaps modify the company's
interest rate exposure by effectively converting a portion of the fixed 6.875%
senior notes to a floating rate, based on the six-month U.S. dollar LIBOR plus a
spread (an effective rate of 4.18% and 5.01% at December 31, 2009 and 2008,
respectively), through its maturity. The swaps are classified as fair
value hedges and had a fair value of $9,556 and $12,009 at December 31, 2009 and
2008, respectively.
Cross-Currency
Swaps
The
company enters into cross-currency swaps to hedge a portion of its net
investment in euro-denominated net assets. The company’s
cross-currency swaps are derivatives designated as net investment
hedges. The effective portion of the change in the fair value of
derivatives designated as net investment hedges is recorded in "Foreign currency
translation adjustment" included in the accompanying consolidated balance sheets
and any ineffective portion is recorded in "Interest and other financing
expense, net" in the accompanying consolidated statements of
operations. As the notional amounts of the company’s cross-currency
swaps are expected to equal a comparable amount of hedged net assets, no
material ineffectiveness is expected. The company uses the
hypothetical derivative method to assess the effectiveness of its net investment
hedges on a quarterly basis.
In May
2006, the company entered into a cross-currency swap, with a maturity date of
July 2011, for approximately $100,000 or €78,281 (the "2006 cross-currency
swap") to hedge a portion of its net investment in euro-denominated net
assets. The 2006 cross-currency swap effectively converts the
interest expense on $100,000 of long-term debt from U.S. dollars to
euros. The 2006 cross-currency swap had a negative fair value of
$12,497 and $9,985 at December 31, 2009 and 2008, respectively.
In
October 2005, the company entered into a cross-currency swap, with a maturity
date of October 2010, for approximately $200,000 or €168,384 (the "2005
cross-currency swap") to hedge a portion of its net investment in
euro-denominated net assets. The 2005 cross-currency swap effectively
converts the interest expense on $200,000 of long-term debt from U.S. dollars to
euros. The 2005 cross-currency swap had a negative fair value of
$41,943 and $36,467 at December 31, 2009 and 2008, respectively.
Foreign Exchange
Contracts
The
company enters into foreign exchange forward, option, or swap contracts
(collectively, the "foreign exchange contracts") to mitigate the impact of
changes in foreign currency exchange rates. These contracts are executed to
facilitate the hedging of foreign currency exposures resulting from inventory
purchases and sales and generally have terms of no more than six months. Gains
or losses on these contracts are deferred and recognized when the underlying
future purchase or sale is recognized or when the corresponding asset or
liability is revalued. The company does not enter into foreign exchange
contracts for trading purposes. The risk of loss on a foreign exchange contract
is the risk of nonperformance by the counterparties, which the company minimizes
by limiting its counterparties to major financial institutions. The fair values
of foreign exchange contracts, which are nominal, are estimated using market
quotes. The notional amount of the foreign exchange contracts at December 31,
2009 and 2008 was $294,928 and $315,021, respectively.
Other
The
carrying amounts of cash and cash equivalents, accounts receivable, net, and
accounts payable approximate their fair value due to the short maturities of
these financial instruments.
64
ARROW
ELECTRONICS, INC.
NOTES
TO CONSOLIDATED FINANCIAL STATEMENTS
(Dollars
in thousands except per share data)
Cash
equivalents consist primarily of overnight time deposits and institutional money
market funds with quality financial institutions. These financial
institutions are located in many different geographical regions, and the
company's policy is designed to limit exposure with any one
institution. As part of its cash and risk management processes, the
company performs periodic evaluations of the relative credit standing of these
financial institutions.
8.
Income Taxes
The
provision for income taxes for the years ended December 31 consists of the
following:
|
2009
|
2008
|
2007
|
||||||||||
|
Current
|
||||||||||||
|
Federal
|
$ | 23,078 | $ | 55,459 | $ | 101,077 | ||||||
|
State
|
636 | 5,510 | 13,410 | |||||||||
|
International
|
22,389 | 43,965 | 57,549 | |||||||||
| 46,103 | 104,934 | 172,036 | ||||||||||
|
Deferred
|
||||||||||||
|
Federal
|
20,905 | (33,232 | ) | (6 | ) | |||||||
|
State
|
5,995 | (1,892 | ) | 5,124 | ||||||||
|
International
|
(7,587 | ) | (53,088 | ) | 3,543 | |||||||
| 19,313 | (88,212 | ) | 8,661 | |||||||||
| $ | 65,416 | $ | 16,722 | $ | 180,697 | |||||||
The
principal causes of the difference between the U.S. federal statutory tax rate
of 35% and effective income tax rates for the years ended December 31 are as
follows:
|
2009
|
2008
|
2007
|
||||||||||
|
United
States
|
$ | 108,106 | $ | 5,409 | $ | 262,068 | ||||||
|
International
|
80,815 | (602,322 | ) | 330,115 | ||||||||
|
Income
before income taxes
|
$ | 188,921 | $ | (596,913 | ) | $ | 592,183 | |||||
|
Provision
at statutory tax rate
|
$ | 66,122 | $ | (208,919 | ) | $ | 207,264 | |||||
|
State
taxes, net of federal benefit
|
4,310 | 2,352 | 12,047 | |||||||||
|
International
effective tax rate differential
|
(16,530 | ) | (28,801 | ) | (54,448 | ) | ||||||
|
Non-deductible
impairment charge
|
- | 237,602 | - | |||||||||
|
Other
non-deductible expenses
|
2,634 | 10,424 | 3,270 | |||||||||
|
Changes
in tax accruals and reserves
|
8,258 | 4,188 | 15,838 | |||||||||
|
Other
|
622 | (124 | ) | (3,274 | ) | |||||||
|
Provision
for income taxes
|
$ | 65,416 | $ | 16,722 | $ | 180,697 | ||||||
During
2008, the company recorded a reduction of the provision for income taxes of
$8,450 and an increase in interest expense of $1,009 ($962 net of related taxes)
primarily related to the settlement of certain international income tax matters
covering multiple years.
65
ARROW
ELECTRONICS, INC.
NOTES
TO CONSOLIDATED FINANCIAL STATEMENTS
(Dollars
in thousands except per share data)
During
2007, the company recorded an income tax benefit of $6,024, net, principally due
to a reduction in deferred income taxes as a result of the statutory tax rate
change in Germany. These deferred income taxes primarily related to
the amortization of intangible assets for income tax purposes, which are not
amortized for accounting purposes.
At
December 31, 2009, the company had a liability for unrecognized tax benefits of
$68,833 (of which $70,036, if recognized, would favorably affect the company's
effective tax rate). The company does not believe there will be any
material changes in its unrecognized tax positions over the next twelve
months. A reconciliation of the beginning and ending amount of
unrecognized tax benefits for the years ended December 31 is as
follows:
|
2009
|
2008
|
|||||||
|
Balance
at beginning of year
|
$ | 69,719 | $ | 77,702 | ||||
|
Additions
based on tax positions taken during a prior period
|
12,442 | 12,179 | ||||||
|
Reductions
based on tax positions taken during a prior period
|
(9,000 | ) | (19,446 | ) | ||||
|
Additions
based on tax positions taken during the current period
|
742 | 4,125 | ||||||
|
Reductions
based on tax positions taken during the current period
|
- | - | ||||||
|
Reductions
related to settlement of tax matters
|
(4,994 | ) | (3,866 | ) | ||||
|
Reductions
related to a lapse of applicable statute of limitations
|
(76 | ) | (975 | ) | ||||
|
Balance
at end of year
|
$ | 68,833 | $ | 69,719 | ||||
Interest
costs related to unrecognized tax benefits are classified as a component of
"Interest and other financing expense, net" in the company's consolidated
statements of operations. Penalties, if any, are recognized as a
component of "Selling, general and administrative expenses." In 2009, 2008, and
2007, the company recognized $4,678, $1,476, and $4,149, respectively, of
interest expense related to unrecognized tax benefits. At December
31, 2009 and 2008, the company had a liability for the payment of interest of
$13,328 and $11,634, respectively, related to unrecognized tax
benefits.
In many
cases the company's uncertain tax positions are related to tax years that remain
subject to examination by tax authorities. The following describes
the open tax years, by major tax jurisdiction, as of December 31,
2009:
|
United
States – Federal
|
2005
– present
|
|
|
United
States – State
|
2001
– present
|
|
|
Germany
(a)
|
2007
– present
|
|
|
Hong
Kong
|
2001
– present
|
|
|
Italy
(a)
|
2004
– present
|
|
|
Sweden
|
2003
– present
|
|
|
United
Kingdom
|
2007
– present
|
(a)
Includes federal as well as local jurisdictions.
Deferred
income taxes are provided for the effects of temporary differences between the
tax basis of an asset or liability and its reported amount in the consolidated
balance sheets. These temporary differences result in taxable or
deductible amounts in future years.
66
ARROW
ELECTRONICS, INC.
NOTES
TO CONSOLIDATED FINANCIAL STATEMENTS
(Dollars
in thousands except per share data)
The
significant components of the company's deferred tax assets and liabilities,
included primarily in "Prepaid expenses and other assets," "Other assets," and
"Other liabilities" in the company's consolidated balance sheets, consist of the
following at December 31:
|
2009
|
2008
|
|||||||
|
Deferred
tax assets:
|
||||||||
|
Net
operating loss carryforwards
|
$ | 52,294 | $ | 36,991 | ||||
|
Capital
loss carryforwards
|
2,223 | 2,242 | ||||||
|
Inventory
adjustments
|
30,680 | 32,037 | ||||||
|
Allowance
for doubtful accounts
|
11,280 | 12,917 | ||||||
|
Accrued
expenses
|
47,742 | 43,839 | ||||||
|
Other
comprehensive income items
|
5,128 | 23,096 | ||||||
|
Derivative financial
instruments
|
21,179 | 18,225 | ||||||
|
Restructuring and integration
reserves
|
1,613 | 5,233 | ||||||
|
Interest
carryforward
|
41,388 | 16,385 | ||||||
|
Goodwill
|
14,652 | 31,574 | ||||||
|
Other
|
- | 6,084 | ||||||
| 228,179 | 228,623 | |||||||
|
Valuation
allowance
|
(68,556 | ) | (43,453 | ) | ||||
|
Total
deferred tax assets
|
$ | 159,623 | $ | 185,170 | ||||
|
Deferred
tax liabilities:
|
||||||||
|
Other
|
$ | (6,319 | ) | $ | - | |||
|
Total
deferred tax liabilities
|
$ | (6,319 | ) | $ | - | |||
|
Total
net deferred tax assets
|
$ | 153,304 | $ | 185,170 | ||||
At
December 31, 2009, certain international subsidiaries had tax loss carryforwards
of approximately $166,821 expiring in various years after
2010. Deferred tax assets related to the tax loss carryforwards of
the international subsidiaries in the amount of $48,285 as of December 31, 2009
were recorded with a corresponding valuation allowance of $16,941. The impact of
the change in this valuation allowance on the effective rate reconciliation is
included in the international effective tax rate differential.
Valuation
allowances reflect the deferred tax benefits that management is uncertain of the
ability to utilize in the future.
Cumulative
undistributed earnings of international subsidiaries were $1,425,643 at December
31, 2009. No deferred U.S. federal income taxes were provided for the
undistributed earnings as they are permanently reinvested in the company's
international operations.
Income
taxes paid, net of income taxes refunded, amounted to $90,340, $144,215, and
$189,620 in 2009, 2008, and 2007, respectively.
67
ARROW
ELECTRONICS, INC.
NOTES
TO CONSOLIDATED FINANCIAL STATEMENTS
(Dollars
in thousands except per share data)
9.
Restructuring, Integration, and Other Charges
In 2009,
2008, and 2007, the company recorded restructuring, integration, and other
charges of $105,514 ($75,720 net of related taxes or $.63 per share on both a
basic and diluted basis), $80,955 ($61,867 net of related taxes of $.51 per
share on both a basic and diluted basis), and $11,745 ($7,036 net of related
taxes or $.06 per share on both a basic and diluted basis),
respectively.
The
following table presents the components of the restructuring, integration, and
other charges for 2009, 2008, and 2007:
|
2009
|
2008
|
2007
|
||||||||||
|
Current
year restructuring charge
|
$ | 100,274 | $ | 69,836 | $ | 9,708 | ||||||
|
Current
year integration charge
|
- | 551 | 2,944 | |||||||||
|
Adjustments
to prior year restructuring accruals
|
2,643 | (322 | ) | (907 | ) | |||||||
|
Adjustments
to prior year integration accruals
|
(1,279 | ) | - | - | ||||||||
|
Acquisition-related
expenses
|
3,876 | - | - | |||||||||
|
Preference
claim from 2001
|
- | 10,890 | - | |||||||||
| $ | 105,514 | $ | 80,955 | $ | 11,745 | |||||||
2009 Restructuring
Charge
The
following table presents the components of the 2009 restructuring charge of
$100,274 and activity in the related restructuring accrual for
2009:
|
Personnel
Costs
|
Facilities
|
Other
|
Total
|
|||||||||||||
|
Restructuring
charge
|
$ | 90,896 | $ | 8,016 | $ | 1,362 | $ | 100,274 | ||||||||
|
Payments
|
(65,524 | ) | (1,747 | ) | (1,138 | ) | (68,409 | ) | ||||||||
|
Foreign
currency translation
|
8 | 18 | - | 26 | ||||||||||||
|
December
31, 2009
|
$ | 25,380 | $ | 6,287 | $ | 224 | $ | 31,891 | ||||||||
The
restructuring charge of $100,274 in 2009 primarily includes personnel costs of
$90,896 and facilities costs of $8,016. The personnel costs are
related to the elimination of approximately 1,605 positions within the global
components business segment and approximately 320 positions within the global
ECS business segment. The facilities costs are related to exit
activities for 28 vacated facilities worldwide due to the company's continued
efforts to streamline its operations and reduce real estate costs. These
initiatives are due to the company's continued efforts to lower cost and drive
operational efficiency.
68
ARROW
ELECTRONICS, INC.
NOTES
TO CONSOLIDATED FINANCIAL STATEMENTS
(Dollars
in thousands except per share data)
2008 Restructuring
Charge
The
following table presents the components of the 2008 restructuring charge of
$69,836 and activity in the related restructuring accrual for 2008 and
2009:
|
Personnel
Costs
|
Facilities
|
Asset
Write-
Downs
|
Other
|
Total
|
|||||||||||||
|
Restructuring
charge
|
$
|
39,383
|
$
|
4,305
|
$
|
25,423
|
$
|
725
|
$
|
69,836
|
|||||||
|
Payments
|
(24,238
|
)
|
(474
|
)
|
-
|
(225
|
)
|
(24,937
|
)
|
||||||||
|
Non-cash
usage
|
-
|
-
|
(25,423
|
)
|
-
|
(25,423
|
)
|
||||||||||
|
Reclassification
of capital lease
|
-
|
810
|
-
|
-
|
810
|
||||||||||||
|
Foreign
currency translation
|
(949
|
)
|
78
|
-
|
-
|
(871
|
)
|
||||||||||
|
December
31, 2008
|
14,196
|
4,719
|
-
|
500
|
19,415
|
||||||||||||
|
Restructuring
charge (credit)
|
505
|
141
|
2,112
|
(49
|
)
|
2,709
|
|||||||||||
|
Payments
|
(13,069
|
)
|
(2,308
|
)
|
-
|
(55
|
)
|
(15,432
|
)
|
||||||||
|
Non-cash
usage
|
-
|
-
|
(2,112
|
)
|
(197
|
)
|
(2,309
|
)
|
|||||||||
|
Foreign
currency translation
|
(75
|
)
|
84
|
-
|
9
|
18
|
|||||||||||
|
December
31, 2009
|
$
|
1,557
|
$
|
2,636
|
$
|
-
|
$
|
208
|
$
|
4,401
|
|||||||
The
restructuring charge of $69,836 in 2008 primarily includes personnel costs of
$39,383, facility costs of $4,305, and a write-down of a building and related
land of $25,423. These initiatives are the result of the company's
continued efforts to lower cost and drive operational efficiency. The personnel
costs are primarily associated with the elimination of approximately 750
positions across multiple functions and multiple locations. The
facilities costs are related to the exit activities of 9 vacated facilities in
North America and Europe. During the fourth quarter of 2008, the
company recorded an impairment charge of $25,423 in connection with an approved
plan to actively market and sell a building and related land in North America
within the company's global components business segment. The decision
to exit this location was made to enable the company to consolidate facilities
and reduce future operating costs. The company wrote-down the
carrying values of the building and related land to their estimated fair values
less cost to sell and ceased recording depreciation. During 2009, the
company recorded an impairment charge of $2,112 as a result of further declines
in real estate valuations. As of December 31, 2009 and 2008, the
assets were designated as held-for-sale, and the carrying values of $7,388 and
$9,500, respectively, were included in "Prepaid expenses and other assets" on
the company's consolidated balance sheets. The sale is expected to be
completed in the first quarter of 2010.
69
ARROW
ELECTRONICS, INC.
NOTES
TO CONSOLIDATED FINANCIAL STATEMENTS
(Dollars
in thousands except per share data)
2007 Restructuring
Charge
The
following table presents the components of the 2007 restructuring charge of
$9,708 and activity in the related restructuring accrual for 2007, 2008, and
2009:
|
Personnel
Costs
|
Facilities
|
Other
|
Total
|
||||||||||||
|
Restructuring
charge (credit)
|
$
|
11,312
|
$
|
(1,947
|
)
|
$
|
343
|
$
|
9,708
|
||||||
|
Payments/proceeds
|
(7,563
|
)
|
7,896
|
(258
|
)
|
75
|
|||||||||
|
Foreign
currency translation
|
66
|
(133
|
)
|
(71
|
)
|
(138
|
)
|
||||||||
|
December
31, 2007
|
3,815
|
5,816
|
14
|
9,645
|
|||||||||||
|
Restructuring
charge
|
586
|
540
|
-
|
1,126
|
|||||||||||
|
Payments
|
(3,807
|
)
|
(1,245
|
)
|
(14
|
)
|
(5,066
|
)
|
|||||||
|
Foreign
currency translation
|
(129
|
)
|
(1,286
|
)
|
-
|
(1,415
|
)
|
||||||||
|
December
31, 2008
|
465
|
3,825
|
-
|
4,290
|
|||||||||||
|
Restructuring
charge
|
-
|
144
|
-
|
144
|
|||||||||||
|
Payments
|
(461
|
)
|
(663
|
)
|
-
|
(1,124
|
)
|
||||||||
|
Foreign
currency translation
|
(4
|
)
|
300
|
-
|
296
|
||||||||||
|
December
31, 2009
|
$
|
-
|
$
|
3,606
|
$
|
-
|
$
|
3,606
|
|||||||
The
restructuring charge of $9,708 in 2007 primarily includes personnel costs of
$11,312 and a facilities credit of $1,947. The personnel costs are
related to the elimination of approximately 400 positions. These
positions were primarily within the company's global components business segment
in North America and related to the company's continued focus on operational
efficiency. The facilities credit is primarily related to a gain on
the sale of the Harlow, England facility of $8,506 that was vacated in
2007. This was offset by facilities costs of $6,559, primarily
related to exit activities for a vacated facility in Europe due to the company's
continued efforts to reduce real estate costs.
70
ARROW
ELECTRONICS, INC.
NOTES
TO CONSOLIDATED FINANCIAL STATEMENTS
(Dollars in thousands except per share
data)
Restructuring Accrual
Related to Actions Taken Prior to 2007
The
following table presents the activity in the restructuring accrual during 2007,
2008, and 2009 related to actions taken prior to 2007:
|
Personnel
Costs
|
Facilities
|
Other
|
Total
|
||||||||||||
|
December
31, 2006
|
$
|
2,601
|
$
|
3,051
|
$
|
2,806
|
$
|
8,458
|
|||||||
|
Restructuring
charge (credit)
|
(506
|
)
|
961
|
(1,362
|
)
|
(907
|
)
|
||||||||
|
Payments
|
(1,782
|
)
|
(1,457
|
)
|
-
|
(3,239
|
)
|
||||||||
|
Foreign
currency translation
|
32
|
169
|
183
|
384
|
|||||||||||
|
December
31, 2007
|
345
|
2,724
|
1,627
|
4,696
|
|||||||||||
|
Restructuring
credit
|
(73
|
)
|
(124
|
)
|
(1,251
|
)
|
(1,448
|
)
|
|||||||
|
Payments
|
(59
|
)
|
(1,006
|
)
|
-
|
(1,065
|
)
|
||||||||
|
Non-cash
usage
|
-
|
-
|
(201
|
)
|
(201
|
)
|
|||||||||
|
Foreign
currency translation
|
(6
|
)
|
(181
|
)
|
105
|
(82
|
)
|
||||||||
|
December
31, 2008
|
207
|
1,413
|
280
|
1,900
|
|||||||||||
|
Restructuring
charge (credit)
|
-
|
60
|
(270
|
)
|
(210
|
)
|
|||||||||
|
Payments
|
(42
|
)
|
(1,120
|
)
|
-
|
(1,162
|
)
|
||||||||
|
Foreign
currency translation
|
3
|
81
|
(10
|
)
|
74
|
||||||||||
|
December
31, 2009
|
$
|
168
|
$
|
434
|
$
|
-
|
$
|
602
|
|||||||
Integration
Included
in the restructuring, integration, and other charges referenced above is an
integration credit of $1,279 for 2009, primarily related to adjustments to
integration reserves established in prior years, an integration charge of $551
for 2008, primarily related to the ACI and KeyLink acquisitions, and an
integration charge of $2,944 for 2007, primarily related to the acquisition of
KeyLink.
The
following table presents the integration charge and activity for 2007, 2008, and
2009:
|
Personnel
Costs
|
Facilities
|
Other
|
Total
|
||||||||||||
|
December
31, 2006
|
$
|
-
|
$
|
2,735
|
$
|
658
|
$
|
3,393
|
|||||||
|
Integration
costs (a)
|
1,666
|
(535
|
)
|
2,609
|
3,740
|
||||||||||
|
Payments
|
(1,109
|
)
|
(684
|
)
|
(251
|
)
|
(2,044
|
)
|
|||||||
|
Foreign
currency translation
|
-
|
58
|
-
|
58
|
|||||||||||
|
December
31, 2007
|
557
|
1,574
|
3,016
|
5,147
|
|||||||||||
|
Integration
costs (b)
|
774
|
435
|
(323
|
)
|
886
|
||||||||||
|
Payments
|
(1,091
|
)
|
(1,186
|
)
|
-
|
(2,277
|
)
|
||||||||
|
Foreign
currency translation
|
-
|
11
|
-
|
11
|
|||||||||||
|
December
31, 2008
|
240
|
834
|
2,693
|
3,767
|
|||||||||||
|
Integration
credit
|
(207
|
)
|
(3
|
)
|
(1,069
|
)
|
(1,279
|
)
|
|||||||
|
Payments
|
(30
|
)
|
(831
|
)
|
(10
|
)
|
(871
|
)
|
|||||||
|
December
31, 2009
|
$
|
3
|
$
|
-
|
$
|
1,614
|
$
|
1,617
|
|||||||
71
ARROW
ELECTRONICS, INC.
NOTES
TO CONSOLIDATED FINANCIAL STATEMENTS
(Dollars
in thousands except per share data)
|
(a)
|
Integration
costs of $3,740 in 2007 include $2,944 recorded as an integration charge
and $796 recorded as additional costs in excess of net assets of companies
acquired. The integration costs include personnel costs of
$1,666 associated with the elimination of approximately 50 positions in
North America related to the acquisition of KeyLink, a credit of $535
primarily related to the reversal of excess facility-related accruals in
connection with certain acquisitions made prior to 2005 and other costs of
$2,609.
|
|
(b)
|
Integration
costs of $886 in 2008 include $551 recorded as an integration charge and
$335 recorded as additional costs in excess of net assets of companies
acquired. Integration costs primarily include personnel costs
of $774 related to the elimination of 11 positions in North America
related to the ACI and KeyLink acquisitions and 1 position in Europe
related to the Centia/AKS acquisition. Integration costs also include
costs related to a vacated facility in Asia associated with the Achieva
acquisition.
|
Restructuring and
Integration Accrual Summary
In
summary, the restructuring and integration accruals aggregate $42,117 at
December 31, 2009, of which $41,685 is expected to be spent in cash, and are
expected to be utilized as follows:
|
·
|
The
accruals for personnel costs of $27,108 to cover the termination of
personnel are primarily expected to be spent within one year.
|
|
·
|
The
accruals for facilities totaling $12,963 relate to vacated leased
properties that have scheduled payments of $5,604 in 2010, $2,884 in 2011,
$1,766 in 2012, $1,583 in 2013, $615 in 2014, and $511
thereafter.
|
|
·
|
Other
accruals of $2,046 are expected to be utilized over several
years.
|
Acquisition-Related
Expenses
In 2009,
the company recorded acquisition-related expenses of $2,841 related to
contingent consideration for an acquisition completed in a prior year which was
conditional upon the financial performance of the acquired company and the
continued employment of the selling shareholders. In addition, the
company recorded other acquisition-related expenses of
$1,035.
Preference Claim From
2001
In 2008,
an opinion was rendered in a bankruptcy proceeding (Bridge Information Systems,
et. anno v. Merisel
Americas, Inc. & MOCA) in favor of Bridge Information Systems ("Bridge"),
the estate of a former global ECS customer that declared bankruptcy in
2001. The proceeding is related to sales made in 2000 and early 2001
by the MOCA division of ECS, a company Arrow purchased from Merisel Americas in
the fourth quarter of 2000. The court held that certain of the
payments received by the company at the time were preferential and must be
returned to Bridge. Accordingly, during 2008, the company recorded a
charge of $10,890, in connection with the preference claim from 2001, including
legal fees.
72
ARROW
ELECTRONICS, INC.
NOTES
TO CONSOLIDATED FINANCIAL STATEMENTS
(Dollars
in thousands except per share data)
10.
Shareholders' Equity
The
following table sets forth the activity in the number of shares outstanding (in
thousands):
|
Common
Stock
Issued
|
Treasury
Stock
|
Common
Stock
Outstanding
|
||||||||||
|
Common
stock outstanding at December 31, 2006
|
122,626 | 207 | 122,419 | |||||||||
|
Shares issued for stock-based
compensation awards
|
2,413 | (70 | ) | 2,483 | ||||||||
|
Repurchases of common
stock
|
- | 2,075 | (2,075 | ) | ||||||||
|
Common
stock outstanding at December 31, 2007
|
125,039 | 2,212 | 122,827 | |||||||||
|
Shares issued for stock-based
compensation awards
|
9 | (313 | ) | 322 | ||||||||
|
Repurchases of common
stock
|
- | 3,841 | (3,841 | ) | ||||||||
|
Common
stock outstanding at December 31, 2008
|
125,048 | 5,740 | 119,308 | |||||||||
|
Shares issued for stock-based
compensation awards
|
239 | (418 | ) | 657 | ||||||||
|
Repurchases of common
stock
|
- | 137 | (137 | ) | ||||||||
|
Common
stock outstanding at December 31, 2009
|
125,287 | 5,459 | 119,828 | |||||||||
The
company has 2,000,000 authorized shares of serial preferred stock with a par
value of one dollar. There were no shares of serial preferred stock
outstanding at December 31, 2009 and 2008.
11.
Net Income (Loss) Per Share
The
following table sets forth the computation of net income per share on a basic
and diluted basis for the years ended December 31 (shares in
thousands):
|
2009
|
2008
|
2007
|
||||||||||
|
Net
income (loss) attributable to shareholders, as reported
|
$ | 123,512 | $ | (613,739 | ) | $ | 407,792 | |||||
|
Net
income (loss) per share:
|
||||||||||||
|
Basic
|
$ | 1.03 | $ | (5.08 | ) | $ | 3.31 | |||||
|
Diluted (a)
|
$ | 1.03 | $ | (5.08 | ) | $ | 3.28 | |||||
|
Weighted
average shares outstanding-basic
|
119,800 | 120,773 | 123,176 | |||||||||
|
Net
effect of various dilutive stock-based compensation awards
|
689 | - | 1,253 | |||||||||
|
Weighted
average shares outstanding-diluted
|
120,489 | 120,773 | 124,429 | |||||||||
|
(a)
|
Stock-based
compensation awards for the issuance of 3,851, 4,368, and 43 shares for
the years ended December 31, 2009, 2008, and 2007, respectively, were
excluded from the computation of net income (loss) per share on a diluted
basis as their effect is
anti-dilutive.
|
12.
Employee Stock Plans
Omnibus
Plan
The
company maintains the Arrow Electronics, Inc. 2004 Omnibus Incentive Plan (the
"Omnibus Plan"), which replaced the Arrow Electronics, Inc. Stock Option Plan,
the Arrow Electronics, Inc. Restricted Stock Plan, the 2002 Non-Employee
Directors Stock Option Plan, the Non-Employee Directors Deferral
Plan,
73
ARROW
ELECTRONICS, INC.
NOTES
TO CONSOLIDATED FINANCIAL STATEMENTS
(Dollars
in thousands except per share data)
and the
1999 CEO Bonus Plan (collectively, the "Prior Plans"). The Omnibus
Plan broadens the array of equity alternatives available to the company when
designing compensation incentives. The Omnibus Plan permits the grant
of cash-based awards, non-qualified stock options, incentive stock options
("ISOs"), stock appreciation rights, restricted stock, restricted stock units,
performance shares, performance units, covered employee annual incentive awards,
and other stock-based awards. The Compensation Committee of the company's Board
of Directors (the "Compensation Committee") determines the vesting requirements,
termination provision, and the terms of the award for any awards under the
Omnibus Plan when such awards are issued.
Under the
terms of the Omnibus Plan, a maximum of 13,300,000 shares of common stock may be
awarded, subject to adjustment. There were 3,715,621 and 6,957,960
shares available for grant under the Omnibus Plan as of December 31, 2009 and
2008, respectively. Shares currently subject to awards granted under the Prior
Plans, which cease to be subject to such awards for any reason other than
exercise for, or settlement in, shares will also be available under the Omnibus
Plan. Generally, shares are counted against the authorization only to
the extent that they are issued. Restricted stock, restricted stock
units, and performance shares count against the authorization at a rate of 1.69
to 1.
After
adoption of the Omnibus Plan, there were no additional awards made under any of
the Prior Plans, though awards previously granted under the Prior Plans will
survive according to their terms.
Stock
Options
Under the
Omnibus Plan, the company may grant both ISOs and non-qualified stock
options. ISOs may only be granted to employees, subsidiaries, and
affiliates. The exercise price for options cannot be less than the
fair market value of Arrow's common stock on the date of grant. Options granted
under the Prior Plans become exercisable in equal installments over a four-year
period, except for stock options authorized for grant to directors, which become
exercisable in equal installments over a two-year period. Options currently
outstanding have terms of ten years.
The
following information relates to the stock option activity for the year ended
December 31, 2009:
|
Shares
|
Weighted
Average
Exercise
Price
|
Weighted
Average
Remaining
Contractual
Life
|
Aggregate
Intrinsic
Value
|
|||||||
|
Outstanding
at December 31, 2008
|
4,367,941
|
$
|
31.42
|
|||||||
|
Granted
|
832,092
|
17.00
|
||||||||
|
Exercised
|
(247,056
|
)
|
17.14
|
|||||||
|
Forfeited
|
(427,531
|
)
|
31.89
|
|||||||
|
Outstanding
at December 31, 2009
|
4,525,446
|
29.50
|
77 months
|
$
|
16,246
|
|||||
|
Exercisable
at December 31, 2009
|
2,656,057
|
30.86
|
63 months
|
$
|
5,883
|
|||||
The
aggregate intrinsic value in the table above represents the total pre-tax
intrinsic value (the difference between the company's closing stock price on the
last trading day of 2009 and the exercise price, multiplied by the number of
in-the-money options) received by the option holders had all option holders
exercised their options on December 31, 2009. This amount changes
based on the market value of the company's stock.
The total
intrinsic value of options exercised during 2009, 2008, and 2007 was $2,106,
$1,398, and $30,739, respectively.
74
ARROW
ELECTRONICS, INC.
NOTES
TO CONSOLIDATED FINANCIAL STATEMENTS
(Dollars
in thousands except per share data)
Cash
received from option exercises during 2009, 2008, and 2007 was $4,234, $4,392,
and $55,228, respectively, and is included within the financing activities
section in the company's consolidated statements of cash
flows. The actual tax benefit realized from share-based payment
awards during 2009, 2008, and 2007 was $3,025, $3,551, and $11,249,
respectively.
The fair
value of stock options was estimated using the Black-Scholes valuation model
with the following weighted-average assumptions for the years ended December
31:
|
2009
|
2008
|
2007
|
|||||||
|
Volatility
(percent) *
|
35
|
33
|
29
|
||||||
|
Expected
term (in years) **
|
5.9
|
5.5
|
3.6
|
||||||
|
Risk-free
interest rate (percent) ***
|
2.1
|
2.9
|
4.6
|
||||||
|
*
|
Volatility
is measured using historical daily price changes of the company's common
stock over the expected term of the
option.
|
|
**
|
The
expected term represents the weighted average period the option is
expected to be outstanding and is based primarily on the historical
exercise behavior of employees.
|
|
***
|
The
risk-free interest rate is based on the U.S. Treasury zero-coupon yield
with a maturity that approximates the expected term of the
option.
|
There is
no expected dividend yield.
The
weighted-average fair value per option granted was $6.07, $11.63, and $11.03
during 2009, 2008, and 2007, respectively.
Performance
Shares
The
Compensation Committee, subject to the terms and conditions of the Omnibus Plan,
may grant performance unit and/or performance share awards. The fair
value of a performance unit award is the fair market value of the company's
common stock on the date of grant. Such awards will be earned only if
performance goals over performance periods established by or under the direction
of the Compensation Committee are met. The performance goals and periods may
vary from participant-to-participant, group-to-group, and time-to-time. The
performance shares will be delivered in common stock at the end of the service
period based on the company's actual performance compared to the target metric
and may be from 0% to 200% of the initial award. Compensation expense
is recognized using the graded vesting method over the service period, which is
generally two to four years and is adjusted each period based on the current
estimate of performance compared to the target metric.
Restricted
Stock
Subject
to the terms and conditions of the Omnibus Plan, the Compensation Committee may
grant shares of restricted stock and/or restricted stock
units. Restricted stock units are similar to restricted stock except
that no shares are actually awarded to the participant on the date of grant.
Shares of restricted stock and/or restricted stock units awarded under the
Omnibus Plan may not be sold, transferred, pledged, assigned, or otherwise
alienated or hypothecated until the end of the applicable period of restriction
established by the Compensation Committee and specified in the award agreement
(and in the case of restricted stock units until the date of delivery or other
payment). Compensation expense is recognized on a straight-line basis
as shares become free of forfeiture restrictions (i.e., vest) generally over a
four-year period.
75
ARROW
ELECTRONICS, INC.
NOTES
TO CONSOLIDATED FINANCIAL STATEMENTS
(Dollars
in thousands except per share data)
Non-Employee Director
Awards
The
company's Board of Directors (the "Board") shall set the amounts and types of
equity awards that shall be granted to all non-employee directors on a periodic,
nondiscriminatory basis pursuant to the Omnibus Plan, as well as any additional
amounts, if any, to be awarded, also on a periodic, nondiscriminatory basis,
based on each of the following: the number of committees of the Board on which a
non-employee director serves, service of a non-employee director as the chair of
a Committee of the Board, service of a non-employee director as Chairman of the
Board or Lead Director, or the first selection or appointment of an individual
to the Board as a non-employee director. Non-employee directors
currently receive annual awards of fully-vested restricted stock units valued at
$90. All restricted stock units are settled in common stock one year
following the director's separation from the Board.
Unless a
non-employee director gives notice setting forth a different percentage, 50% of
each director's annual retainer fee is deferred and converted into units based
on the fair market value of the company's stock as of the date it was
payable. Upon a non-employee director's retirement from the Board,
each unit in their deferral account will be converted into a share of company
stock and distributed to the non-employee director as soon as practicable
following such date.
Summary of Non-Vested
Shares
The
following information summarizes the changes in non-vested performance shares,
restricted stock, restricted stock units, and non-employee director awards for
2009:
|
Shares
|
Weighted
Average
Grant Date
Fair Value
|
|||||||
|
Non-vested
shares at December 31, 2008
|
1,427,247 | $ | 33.88 | |||||
|
Granted
|
2,079,254 | 17.23 | ||||||
|
Vested
|
(472,871 | ) | 32.35 | |||||
|
Forfeited
|
(400,095 | ) | 31.51 | |||||
|
Non-vested
shares at December 31, 2009
|
2,633,535 | 21.37 | ||||||
As of
December 31, 2009, there was $29,868 of total unrecognized compensation cost
related to non-vested shares which is expected to be recognized over a
weighted-average period of 2.8 years. The total fair value of shares
vested during 2009, 2008, and 2007 was $8,809, $10,313, and $11,803,
respectively.
Stock Ownership
Plan
The
company maintains a noncontributory employee stock ownership plan, which enables
most North American employees to acquire shares of the company's common
stock. Contributions, which are determined by the Board, are in the
form of common stock or cash, which is used to purchase the company's common
stock for the benefit of participating employees. Contributions to the plan in
2009 which pertained to 2008 were $0, and contributions to the plan in 2008
which pertained to 2007 were $10,857.
76
ARROW
ELECTRONICS, INC.
NOTES
TO CONSOLIDATED FINANCIAL STATEMENTS
(Dollars
in thousands except per share data)
13.
Employee Benefit Plans
Supplemental Executive
Retirement Plans ("SERP")
The
company maintains an unfunded Arrow SERP under which the company will pay
supplemental pension benefits to certain employees upon
retirement. There are 12 current and 13 former corporate officers
participating in this plan. The Board determines those employees who
are eligible to participate in the Arrow SERP.
The Arrow
SERP, as amended, provides for the pension benefits to be based on a percentage
of average final compensation, based on years of participation in the Arrow
SERP. The Arrow SERP permits early retirement, with payments at a reduced rate,
based on age and years of service subject to a minimum retirement age of 55.
Participants whose accrued rights under the Arrow SERP, prior to the 2002
amendment, which were adversely affected by the amendment, will continue to be
entitled to such greater rights.
The
company acquired Wyle Electronics ("Wyle") in 2000. Wyle also
sponsored an unfunded SERP for certain of its executives. Benefit accruals for
the Wyle SERP were frozen as of December 31, 2000. There are 19
participants in this plan.
The
company uses a December 31 measurement date for the Arrow SERP and the Wyle
SERP. Pension information for the years ended December 31 is as
follows:
|
2009
|
2008
|
||||||
|
Accumulated
benefit obligation
|
$
|
49,058
|
$
|
46,286
|
|||
|
Changes
in projected benefit obligation:
|
|||||||
|
Projected benefit obligation at
beginning of year
|
$
|
53,885
|
$
|
53,065
|
|||
|
Service cost (Arrow
SERP)
|
2,320
|
2,587
|
|||||
|
Interest cost
|
3,017
|
2,929
|
|||||
|
Actuarial
(gain)/loss
|
848
|
(1,768
|
)
|
||||
|
Benefits paid
|
(3,018
|
)
|
(2,928
|
)
|
|||
|
Projected benefit obligation at
end of year
|
$
|
57,052
|
$
|
53,885
|
|||
|
Funded
status
|
$
|
(57,052
|
)
|
$
|
(53,885
|
)
|
|
|
Components
of net periodic pension cost:
|
|||||||
|
Service cost (Arrow
SERP)
|
$
|
2,320
|
$
|
2,587
|
|||
|
Interest cost
|
3,017
|
2,929
|
|||||
|
Amortization of net
loss
|
(174
|
)
|
321
|
||||
|
Amortization of prior service cost
(Arrow SERP)
|
591
|
549
|
|||||
|
Amortization of transition
obligation (Arrow SERP)
|
410
|
411
|
|||||
|
Net periodic pension
cost
|
$
|
6,164
|
$
|
6,797
|
|||
|
Weighted
average assumptions used to determine benefit obligation:
|
|||||||
|
Discount rate
|
5.50
|
%
|
6.00
|
%
|
|||
|
Rate of compensation increase
(Arrow SERP)
|
5.00
|
%
|
5.00
|
%
|
|||
77
ARROW
ELECTRONICS, INC.
NOTES
TO CONSOLIDATED FINANCIAL STATEMENTS
(Dollars
in thousands except per share data)
|
2009
|
2008
|
|||||
|
Weighted
average assumptions used to determine net periodic pension
cost:
|
||||||
|
Discount rate
|
6.00
|
%
|
5.75
|
%
|
||
|
Rate of compensation increase
(Arrow SERP)
|
5.00
|
%
|
5.00
|
%
|
The
amounts reported for net periodic pension cost and the respective benefit
obligation amounts are dependent upon the actuarial assumptions used. The
company reviews historical trends, future expectations, current market
conditions, and external data to determine the assumptions. The discount rate
represents the market rate for a high quality corporate bond. The
rate of compensation increase is determined by the company, based upon its
long-term plans for such increases. The actuarial assumptions used to determine
the net periodic pension cost are based upon the prior year's assumptions used
to determine the benefit obligation.
Benefit
payments are expected to be paid as follows:
|
2010
|
$ | 3,674 | ||
|
2011
|
3,656 | |||
|
2012
|
3,789 | |||
|
2013
|
3,820 | |||
|
2014
|
3,780 | |||
|
2015
- 2019
|
22,242 |
78
ARROW
ELECTRONICS, INC.
NOTES
TO CONSOLIDATED FINANCIAL STATEMENTS
(Dollars
in thousands except per share data)
Wyle Defined Benefit
Plan
Wyle
provided retirement benefits for certain employees under a defined benefit
plan. Benefits under this plan were frozen as of December 31, 2000
and former participants were permitted to participate in the company's employee
stock ownership and 401(k) plans. The company uses a December 31 measurement
date for this plan. Pension information for the years ended December
31 is as follows:
|
2009
|
2008
|
||||||
|
Accumulated
benefit obligation
|
$
|
108,124
|
$
|
101,077
|
|||
|
Changes
in projected benefit obligation:
|
|||||||
|
Projected benefit obligation at
beginning of year
|
$
|
101,077
|
$
|
101,494
|
|||
|
Interest cost
|
5,844
|
5,769
|
|||||
|
Actuarial
(gain)/loss
|
6,444
|
(1,033
|
)
|
||||
|
Benefits paid
|
(5,241
|
)
|
(5,153
|
)
|
|||
|
Projected benefit obligation at
end of year
|
$
|
108,124
|
$
|
101,077
|
|||
|
Changes
in plan assets:
|
|||||||
|
Fair value of plan assets at
beginning of year
|
$
|
62,328
|
$
|
81,364
|
|||
|
Actual return on plan
assets
|
13,821
|
(19,691
|
)
|
||||
|
Company
contributions
|
4,500
|
5,808
|
|||||
|
Benefits paid
|
(5,241
|
)
|
(5,153
|
)
|
|||
|
Fair value of plan assets at end
of year
|
$
|
75,408
|
$
|
62,328
|
|||
|
Funded
status
|
$
|
(32,716
|
)
|
$
|
(38,749
|
)
|
|
|
Components
of net periodic pension cost:
|
|||||||
|
Interest cost
|
$
|
5,844
|
$
|
5,769
|
|||
|
Expected return on plan
assets
|
(5,048
|
)
|
(6,830
|
)
|
|||
|
Amortization of net
loss
|
3,526
|
1,552
|
|||||
|
Net periodic pension
cost
|
$
|
4,322
|
$
|
491
|
|||
|
Weighted
average assumptions used to determine benefit obligation:
|
|||||||
|
Discount rate
|
5.50
|
%
|
6.00
|
%
|
|||
|
Expected return on plan
assets
|
8.25
|
%
|
8.00
|
%
|
|||
|
Weighted
average assumptions used to determine net periodic pension
cost:
|
|||||||
|
Discount rate
|
6.00
|
%
|
5.75
|
%
|
|||
|
Expected return on plan
assets
|
8.00
|
%
|
8.50
|
%
|
|||
The
amounts reported for net periodic pension cost and the respective benefit
obligation amounts are dependent upon the actuarial assumptions used. The
company reviews historical trends, future expectations, current market
conditions, and external data to determine the assumptions. The discount
rate
79
ARROW
ELECTRONICS, INC.
NOTES
TO CONSOLIDATED FINANCIAL STATEMENTS
(Dollars
in thousands except per share data)
represents
the market rate for a high quality corporate bond. The expected
return on plan assets is based on current and expected asset allocations,
historical trends, and expected returns on plan assets. The actuarial
assumptions used to determine the net periodic pension cost are based upon the
prior year's assumptions used to determine the benefit obligation.
The
company makes contributions to the plan so that minimum contribution
requirements, as determined by government regulations, are met. The company made
contributions of $4,500 in 2009 and expects to make estimated contributions in
2010 of $600.
Benefit
payments are expected to be paid as follows:
|
2010
|
$ | 6,035 | ||
|
2011
|
6,072 | |||
|
2012
|
6,176 | |||
|
2013
|
6,311 | |||
|
2014
|
6,430 | |||
|
2015
- 2019
|
34,141 |
The fair
values of the company’s pension plan assets at December 31, 2009, utilizing the
fair value hierarchy discussed in Note 7, follow:
|
Level
1
|
Level
2
|
Level
3
|
Total
|
|||||||||||||
|
Cash Equivalents:
|
||||||||||||||||
|
Common
collective trusts
|
$ | - | $ | 879 | $ | - | $ | 879 | ||||||||
|
Equities:
|
||||||||||||||||
|
U.S.
common stocks
|
25,063 | - | - | 25,063 | ||||||||||||
|
International
mutual funds
|
11,281 | - | - | 11,281 | ||||||||||||
|
Index
mutual funds
|
12,428 | - | - | 12,428 | ||||||||||||
|
Fixed Income:
|
||||||||||||||||
|
Mutual
funds
|
25,031 | - | - | 25,031 | ||||||||||||
|
Insurance
contracts
|
- | 726 | - | 726 | ||||||||||||
|
Total
|
$ | 73,803 | $ | 1,605 | $ | - | $ | 75,408 | ||||||||
The
investment portfolio contains a diversified blend of common stocks, bonds, cash
equivalents, and other investments, which may reflect varying rates of return.
The investments are further diversified within each asset classification. The
portfolio diversification provides protection against a single security or class
of securities having a disproportionate impact on aggregate performance. The
long-term target allocations for plan assets are 65% in equities and 35% in
fixed income, although the actual plan asset allocations may be within a range
around these targets. The actual asset allocations are reviewed and
rebalanced on a periodic basis to maintain the target allocations.
Comprehensive Income
items
In 2009,
2008, and 2007, actuarial (gains)/losses of $(1,038), $14,045, and $3,749,
respectively, were recognized in comprehensive income, net of related taxes,
related to the company's defined benefit plans. In 2009, 2008, and
2007, the following amounts were recognized as a reclassification adjustment of
comprehensive income, net of related taxes, as a result of being recognized in
net periodic pension cost: transition obligation of $251, $299, and
$293, respectively, prior service cost of $186, $323, and $315,
80
ARROW
ELECTRONICS, INC.
NOTES
TO CONSOLIDATED FINANCIAL STATEMENTS
(Dollars
in thousands except per share data)
respectively,
and an actuarial loss of $2,019, $939, and $1,274, respectively.
Included
in accumulated other comprehensive loss at December 31, 2009 and 2008 are the
following amounts, net of related taxes, that have not yet been recognized in
net periodic pension cost: unrecognized transition obligation of $506 and $757,
respectively, unrecognized prior service costs of $103 and $289, respectively,
and unrecognized actuarial losses of $28,893 and $31,950,
respectively.
The
transition obligation, prior service cost, and actuarial loss included in
accumulated other comprehensive loss, net of related taxes, which are expected
to be recognized in net periodic pension cost for the year ended December 31,
2010 are $18, $159, and $2,759, respectively.
Defined Contribution
Plan
The
company has a defined contribution plan for eligible employees, which qualifies
under Section 401(k) of the Internal Revenue Code. The company's contribution to
the plan, which is based on a specified percentage of employee contributions,
amounted to $7,821, $9,420, and $8,783 in 2009, 2008, and 2007,
respectively. Certain international subsidiaries maintain separate
defined contribution plans for their employees and made contributions
thereunder, which amounted to $15,588, $17,759, and $11,113 in 2009, 2008, and
2007, respectively.
14.
Lease Commitments
The
company leases certain office, distribution, and other property under
non-cancelable operating leases expiring at various dates through
2022. Rental expense under non-cancelable operating leases, net of
sublease income, amounted to $57,612, $67,334, and $60,173 in 2009, 2008, and
2007, respectively.
Aggregate
minimum rental commitments under all non-cancelable operating leases, exclusive
of real estate taxes, insurance, and leases related to facilities closed as a
result of the integration of acquired businesses and the restructuring of the
company, are as follows:
|
2010
|
$ | 53,036 | ||
|
2011
|
42,755 | |||
|
2012
|
31,876 | |||
|
2013
|
25,932 | |||
|
2014
|
16,365 | |||
|
Thereafter
|
14,180 |
15.
Contingencies
Tekelec
Matters
In 2000,
the company purchased Tekelec Europe SA ("Tekelec") from Tekelec Airtronic SA
("Airtronic") and certain other selling shareholders. Subsequent to
the closing of the acquisition, Tekelec received a product liability claim in
the amount of €11,333. The product liability claim was the subject of
a French legal proceeding started by the claimant in 2002, under which separate
determinations were made as to whether the products that are subject to the
claim were defective and the amount of damages sustained by the purchaser. The
manufacturer of the products also participated in this proceeding.
The claimant has commenced legal proceedings against Tekelec and its
insurers to recover damages in the amount of €3,742 and expenses of €312 plus
interest.
81
ARROW
ELECTRONICS, INC.
NOTES
TO CONSOLIDATED FINANCIAL STATEMENTS
(Dollars in thousands except per share
data)
Environmental and Related
Matters
Wyle
Claims
In
connection with the 2000 purchase of Wyle from the VEBA Group ("VEBA"), the
company assumed certain of the then outstanding obligations of Wyle, including
Wyle's 1994 indemnification of the purchasers of its Wyle Laboratories division
for environmental clean-up costs associated with any then existing contamination
or violation of environmental regulations. Under the terms of the company’s
purchase of Wyle from VEBA, VEBA agreed to indemnify the company for costs
associated with the Wyle environmental indemnities, among other things. The
company is aware of two Wyle Laboratories facilities (in Huntsville, Alabama and
Norco, California) at which contaminated groundwater was
identified. Each site will require remediation, the final form and
cost of which is undetermined.
Wyle
Laboratories has demanded indemnification from the company with respect to the
work at both sites (and in connection with the litigation discussed below), and
the company has, in turn, demanded indemnification from VEBA. VEBA merged with a
publicly–traded, German conglomerate in June 2000. The combined
entity, now known as E.ON AG, remains responsible for VEBA’s liabilities. E.ON
AG acknowledged liability under the terms of the VEBA contract in connection
with the Norco and Huntsville sites and made an initial, partial
payment. Neither the company’s demands for subsequent payments nor
its demand for defense and indemnification in the related litigation and other
costs associated with the Norco site were met.
Related
Litigation
In
October 2005, the company filed suit against E.ON AG in the Frankfurt am Main
Regional Court in Germany. The suit seeks indemnification,
contribution, and a declaration of the parties’ respective rights and
obligations in connection with the Riverside County litigation (discussed below)
and other costs associated with the Norco site. In its
answer to the company’s claim filed in March 2009 in the German proceedings,
E.ON AG filed a counterclaim against the company for approximately
$16,000. The company is in the process of preparing a response to the
counterclaim. The company believes it has reasonable defenses to the
counterclaim and plans to defend its position vigorously. The company
believes that the ultimate resolution of the counterclaim will not materially
adversely impact the company’s consolidated financial position, liquidity, or
results of operations. The litigation is currently suspended while
the company engages in a court-facilitated mediation with E.ON
AG. The mediation commenced in December 2009 and will continue well
into 2010.
The
company was named as a defendant in several suits related to the Norco facility,
all of which were consolidated for pre-trial purposes. In January 2005, an
action was filed in the California Superior Court in Riverside County,
California (Gloria Austin, et
al. v. Wyle Laboratories, Inc. et
al.). Approximately 90 plaintiff landowners and residents sued
a number of defendants under a variety of theories for unquantified damages
allegedly caused by environmental contamination at and around the Norco site.
Also filed in the Superior Court in Riverside County were Jimmy Gandara, et al. v. Wyle Laboratories,
Inc. et al. in January
2006, and Lisa Briones, et
al. v. Wyle Laboratories, Inc. et al. in May 2006; both of
which contain allegations similar to those in the Austin case on behalf of
approximately 20 additional plaintiffs. All of these matters have now
been resolved to the satisfaction of the parties.
The
company was also named as a defendant in a lawsuit filed in September 2006 in
the United States District Court for the Central District of California (Apollo
Associates, L.P., et
anno. v. Arrow Electronics, Inc. et al.) in connection with
alleged contamination at a third site, an industrial building formerly leased by
Wyle Laboratories, in El Segundo, California. The lawsuit was settled, though
the possibility remains that government entities or others may attempt to
involve the company in further characterization or remediation of groundwater
issues in the area.
Environmental
Matters – Huntsville
Characterization
of the extent of contaminated soil and groundwater continues at the site in
Huntsville, Alabama. Under the direction of the Alabama Department of
Environmental Management, approximately $3,000 was spent to date. The
pace of the ongoing remedial investigations, project management and regulatory
oversight is likely to increase somewhat and though the complete scope of the
activities is not
82
ARROW
ELECTRONICS, INC.
NOTES
TO CONSOLIDATED FINANCIAL STATEMENTS
(Dollars
in thousands except per share data)
yet
known, the company currently estimates additional investigative and related
expenditures at the site of approximately $500 to $1,000. The nature
and scope of both feasibility studies and subsequent remediation at the site has
not yet been determined, but assuming the outcome includes source control and
certain other measures, the cost is estimated to be between $2,500 and
$4,000.
Environmental
Matters – Norco
In
October 2003, the company entered into a consent decree with Wyle Laboratories
and the California Department of Toxic Substance Control (the "DTSC") in
connection with the Norco site. In April 2005, a Remedial
Investigation Work Plan was approved by DTSC that provided for site-wide
characterization of known and potential environmental issues. Investigations
performed in connection with this work plan and a series of subsequent technical
memoranda continued until the filing of a final Remedial Investigation Report
early in 2008. The development of a final Remedial Action Work Plan
is ongoing. An estimated $28,000 was expended to date on project
management, regulatory oversight, and investigative and feasibility study
activities.
Work is
under way pertaining to the remediation of contaminated groundwater at certain
areas on the Norco site and of soil gas in a limited area immediately adjacent
to the site. In the first quarter of 2008, a hydraulic containment
system was installed to capture and treat groundwater before it moves into the
adjacent offsite area. Approximately $8,000 was expended on
remediation to date, and it is anticipated that these activities, along with the
initial phases of the treatment of contaminated groundwater in the offsite area
and remaining Remedial Action Work Plan costs, will give rise to an additional
estimated $9,650 to $20,250.
Costs
categories related to environmental activities at Norco include those for
project management and regulatory oversight, remedial investigations,
feasibility studies, and interim remedial actions. Project management
and regulatory oversight include costs incurred by Wyle Laboratories and project
consultants for project management and costs billed by DTSC to provide
regulatory oversight.
The
company currently estimates that the additional cost of project management and
regulatory oversight will range from $500 to $750. Ongoing remedial
investigations (including costs related to soil and groundwater investigations),
and the preparation of a final remedial investigation report are projected to
cost between $400 and $700.
Despite
the amount of work undertaken and planned to date, the complete scope of work
under the consent decree is not yet known, and, accordingly, the associated
costs have not yet been determined.
Impact
on Financial Statements
The
company believes that any cost which it may incur in connection with
environmental conditions at the Norco, Huntsville, and El Segundo sites and the
related litigation is covered by the contractual indemnifications (except, under
the terms of the environmental indemnification, for the first $450), discussed
above. The company believes that the recovery of costs incurred to
date associated with the environmental clean-up of the Norco and Huntsville
sites, is probable. Accordingly, the company increased the receivable
for amounts due from E.ON AG by $7,293 during 2009 to $40,912. The
company’s net costs for such indemnified matters may vary from period to period
as estimates of recoveries are not always recognized in the same period as the
accrual of estimated expenses.
Also
included in the proceedings against E.ON AG is a claim for the reimbursement of
pre-acquisition tax liabilities of Wyle in the amount of $8,729 for which E.ON
AG is also contractually liable to indemnify the company. E.ON AG has
specifically acknowledged owing the company not less than $6,335 of such
amounts, but its promises to make payments of at least that amount were not
kept. The company also believes that the recovery of these amounts is
probable.
83
ARROW
ELECTRONICS, INC.
NOTES
TO CONSOLIDATED FINANCIAL STATEMENTS
(Dollars
in thousands except per share data)
In
connection with the acquisition of Wyle, the company acquired a $4,495 tax
receivable due from E.ON AG (as successor to VEBA) in respect of certain tax
payments made by Wyle prior to the effective date of the acquisition, the
recovery of which the company also believes is probable.
As
successor-in-interest to Wyle, the company is the beneficiary of various Wyle
insurance policies that covered liabilities arising out of operations at Norco
and Huntsville. Certain of the insurance carriers implicated in the
Riverside County litigation have undertaken substantial portions of the defense
of the company, and the company has recovered approximately $13,000 from them to
date. The company has sued certain of the umbrella liability
policy carriers, however, because they have yet to make payment on the tendered
losses.
The
company believes strongly in the merits of its positions regarding the E.ON AG
indemnity and the liabilities of the insurance carriers.
Other
From time
to time, in the normal course of business, the company may become liable with
respect to other pending and threatened litigation, environmental, regulatory,
labor, product, and tax matters. While such matters are subject to inherent
uncertainties, it is not currently anticipated that any such matters will
materially impact the company’s consolidated financial position, liquidity, or
results of operations.
16.
Segment and Geographic Information
The
company is a global provider of products, services, and solutions to industrial
and commercial users of electronic components and enterprise computing
solutions. The company distributes electronic components to original
equipment manufacturers and contract manufacturers through its global components
business segment and enterprise computing solutions to VARs through its global
ECS business segment. As a result of the company's philosophy of
maximizing operating efficiencies through the centralization of certain
functions, selected fixed assets and related depreciation, as well as
borrowings, are not directly attributable to the individual operating segments
and are included in the corporate business segment.
Sales and
operating income (loss), by segment, for the years ended December 31
follows:
|
2009
|
2008
|
2007
|
|||||||||
|
Sales:
|
|||||||||||
|
Global components
|
$
|
9,751,305
|
$
|
11,319,482
|
$
|
11,223,751
|
|||||
|
Global ECS
|
4,932,796
|
5,441,527
|
4,761,241
|
||||||||
|
Consolidated
|
$
|
14,684,101
|
$
|
16,761,009
|
$
|
15,984,992
|
|||||
|
Operating
income (loss):
|
|||||||||||
|
Global components
|
$
|
318,866
|
$
|
533,126
|
$
|
604,217
|
|||||
|
Global ECS
|
167,748
|
196,269
|
202,223
|
||||||||
|
Corporate (a)
|
(213,827
|
)
|
(1,222,964
|
)
|
(119,535
|
)
|
|||||
|
Consolidated
|
$
|
272,787
|
$
|
(493,569
|
)
|
$
|
686,905
|
||||
|
(a)
|
Includes
restructuring, integration, and other charges of $105,514, $80,955, and
$11,745 in 2009, 2008, and 2007, respectively. Also included in 2008 is a
non-cash impairment charge of $1,018,780 associated with
goodwill.
|
84
ARROW
ELECTRONICS, INC.
NOTES
TO CONSOLIDATED FINANCIAL STATEMENTS
(Dollars
in thousands except per share data)
Total
assets, by segment, at December 31 follow:
|
2009
|
2008
|
|||||||
|
Global
components
|
$
|
4,512,141
|
$
|
4,093,118
|
||||
|
Global
ECS
|
2,258,803
|
2,325,095
|
||||||
|
Corporate
|
991,422
|
700,072
|
||||||
|
Consolidated
|
$
|
7,762,366
|
$
|
7,118,285
|
||||
Sales, by
geographic area, for the years ended December 31 follow:
|
2009
|
2008
|
2007
|
||||||||
|
North
America (b)
|
$
|
7,017,389
|
$
|
8,366,124
|
$
|
8,565,247
|
||||
|
EMEASA
|
4,287,405
|
5,392,805
|
4,970,585
|
|||||||
|
Asia/Pacific
|
3,379,307
|
3,002,080
|
2,449,160
|
|||||||
|
$
|
14,684,101
|
$
|
16,761,009
|
$
|
15,984,992
|
|||||
|
(b)
|
Includes
sales related to the United States of $6,374,447, $7,705,048, and
$7,962,526 in 2009, 2008, and 2007,
respectively.
|
Net
property, plant and equipment, by geographic area, at December 31
follow:
|
2009
|
2008
|
|||||||
|
North
America (c)
|
$
|
381,581
|
$
|
324,385
|
||||
|
EMEASA
|
62,206
|
68,215
|
||||||
|
Asia/Pacific
|
16,919
|
17,940
|
||||||
|
$
|
460,706
|
$
|
410,540
|
|||||
|
(c)
|
Includes
net property, plant and equipment related to the United States of $380,576
and $323,561 in 2009 and 2008,
respectively.
|
85
ARROW
ELECTRONICS, INC.
NOTES
TO CONSOLIDATED FINANCIAL STATEMENTS
(Dollars
in thousands except per share data)
17.
Quarterly Financial Data (Unaudited)
During
2009, the company began operating on a revised interim quarterly reporting
calendar that closes on the Saturday following the end of the calendar
quarter. There were 65, 63, and 65 shipping days for the first,
second, and third quarters of 2009 compared with 64, 64, and 65 shipping days
for each of the year-earlier periods, respectively.
A summary
of the company's consolidated quarterly results of operations is as
follows:
|
First
Quarter
|
Second
Quarter
|
Third
Quarter
|
Fourth
Quarter
|
|||||||||||||||||
|
2009
|
||||||||||||||||||||
|
Sales
|
$ | 3,417,428 | $ | 3,391,823 | $ | 3,671,865 | $ | 4,202,985 | ||||||||||||
|
Gross
profit
|
430,996 | 402,194 | 421,061 | 496,643 | ||||||||||||||||
|
Net
income attributable to shareholders
|
26,741 |
(b)
|
21,097 |
(c)
|
12,581 |
(d)
|
63,093 |
(e)
|
||||||||||||
|
Net
income per share (a):
|
||||||||||||||||||||
|
Basic
|
$ | .22 |
(b)
|
$ | .18 |
(c)
|
$ | .10 |
(d)
|
$ | .53 |
(e)
|
||||||||
|
Diluted
|
.22 |
(b)
|
.18 |
(c)
|
.10 |
(d)
|
.52 |
(e)
|
||||||||||||
|
2008
|
||||||||||||||||||||
|
Sales
|
$ | 4,028,491 | $ | 4,347,477 | $ | 4,295,314 | $ | 4,089,727 | ||||||||||||
|
Gross
profit
|
586,291 | 612,471 | 563,855 | 520,096 | ||||||||||||||||
|
Net
income (loss) attributable to shareholders
|
85,871 |
(f)
|
96,215 |
(g)
|
76,070 |
(h)
|
(871,895 | ) |
(i)
|
|||||||||||
|
Net
income (loss) per share (a):
|
||||||||||||||||||||
|
Basic
|
$ | .70 |
(f)
|
$ | .79 |
(g)
|
$ | .64 |
(h)
|
$ | (7.30 | ) |
(i)
|
|||||||
|
Diluted
|
.69 |
(f)
|
.79 |
(g)
|
.63 |
(h)
|
(7.30 | ) |
(i)
|
|||||||||||
|
(a)
|
Quarterly
net income per share is calculated using the weighted average number of
shares outstanding during each quarterly period, while net income per
share for the full year is calculated using the weighted average number of
shares outstanding during the year. Therefore, the sum of the
net income per share for each of the four quarters may not equal the net
income per share for the full year.
|
|
(b)
|
Includes
restructuring, integration, and other charges ($16,069 net of related
taxes or $.13 per share on both a basic and diluted
basis).
|
|
(c)
|
Includes
restructuring, integration, and other charges ($16,124 net of related
taxes or $.13 per share on both a basic and diluted
basis).
|
|
(d)
|
Includes
restructuring, integration, and other charges ($29,075 net of related
taxes or $.24 per share on both a basic and diluted basis) and a loss on
prepayment of debt ($3,228 net of related taxes or $.03 per share on both
a basic and diluted basis).
|
|
(e)
|
Includes
restructuring, integration, and other charges ($14,452 net of related
taxes or $.12 per share on both a basic and diluted
basis).
|
|
(f)
|
Includes
restructuring, integration, and other charges ($11,981 net of related
taxes or $.10 per
|
86
ARROW
ELECTRONICS, INC.
NOTES
TO CONSOLIDATED FINANCIAL STATEMENTS
(Dollars
in thousands except per share data)
|
|
share
on both a basic and diluted basis).
|
|
(g)
|
Includes
restructuring, integration, and other charges ($5,929 net of related taxes
or $.05 per share on both a basic and diluted
basis).
|
|
(h)
|
Includes
restructuring, integration, and other charges ($7,635 net of related taxes
or $.06 per share on both a basic and diluted
basis).
|
|
(i)
|
Includes
a non-cash impairment charge associated with goodwill ($905,069 net of
related taxes or $7.58 per share on both a basic and diluted basis),
restructuring, integration, and other charges ($36,331 net of related
taxes or $.30 per share on both a basic and diluted basis), and a loss on
the write-down of an investment ($10,030 net of related taxes or $.08 per
share on both a basic and diluted basis). Also includes a
reduction of the provision for income taxes ($8,450 net of related taxes
or $.07 per share on both a basic and diluted basis) and an increase in
interest expense ($962 net of related taxes or $.01 per share on both a
basic and diluted basis) primarily related to the settlement of certain
international income tax
matters.
|
87
Item
9. Changes in and Disagreements
with Accountants on Accounting and Financial
Disclosure.
None.
Disclosure
Controls and Procedures
The
company's management, under the supervision and with the participation of the
company's Chief Executive Officer and Chief Financial Officer, carried out an
evaluation of the effectiveness of the design and operation of the company's
disclosure controls and procedures as of December 31, 2009 (the
"Evaluation"). Based upon the Evaluation, the company's Chief
Executive Officer and Chief Financial Officer concluded that the company's
disclosure controls and procedures (as defined in Rule 13a-15(e) of the
Securities Exchange Act of 1934) are effective.
Management's
Report on Internal Control Over Financial Reporting
The
company's management is responsible for establishing and maintaining adequate
"internal control over financial reporting" (as defined in Exchange Act Rules
13a-15(f) and 15d-15(f)). Management evaluates the effectiveness of
the company's internal control over financial reporting using the criteria set
forth by the Committee of Sponsoring Organizations of the Treadway Commission in
Internal Control – Integrated Framework. Management, under the
supervision and with the participation of the company's Chief Executive Officer
and Chief Financial Officer, assessed the effectiveness of the company's
internal control over financial reporting as of December 31, 2009, and concluded
that it is effective.
The
company acquired A.E. Petsche Company, Inc. ("Petsche") in December
2009. The company has excluded Petsche from its annual assessment of
and conclusion on the effectiveness of the company's internal control over
financial reporting. Petsche accounted for 2.4 percent of total
assets as of December 31, 2009 and less than 1 percent of the company's
consolidated sales and net income attributable to shareholders for the year
ended December 31, 2009.
The
company's independent registered public accounting firm, Ernst & Young LLP,
has audited the effectiveness of the company's internal control over financial
reporting as of December 31, 2009, as stated in their report, which is included
herein.
88
REPORT
OF INDEPENDENT REGISTERED PUBLIC ACCOUNTING FIRM
The Board
of Directors and Shareholders
Arrow
Electronics, Inc.
We have
audited Arrow Electronics, Inc.’s (the "company") internal control over
financial reporting as of December 31, 2009, based on criteria established
in Internal Control—Integrated Framework issued by the Committee of Sponsoring
Organizations of the Treadway Commission (the COSO criteria). The company’s
management is responsible for maintaining effective internal control over
financial reporting, and for its assessment of the effectiveness of internal
control over financial reporting included in the accompanying Management’s
Report of Internal Control over Financial Reporting. Our responsibility is to
express an opinion on the company’s internal control over financial reporting
based on our audit.
We
conducted our audit in accordance with the standards of the Public Company
Accounting Oversight Board (United States). Those standards require that we plan
and perform the audit to obtain reasonable assurance about whether effective
internal control over financial reporting was maintained in all material
respects. Our audit included obtaining an understanding of internal control over
financial reporting, assessing the risk that a material weakness exists, testing
and evaluating the design and operating effectiveness of internal control based
on the assessed risk, and performing such other procedures as we considered
necessary in the circumstances. We believe that our audit provides a reasonable
basis for our opinion.
A
company’s internal control over financial reporting is a process designed to
provide reasonable assurance regarding the reliability of financial reporting
and the preparation of financial statements for external purposes in accordance
with generally accepted accounting principles. A company’s internal control over
financial reporting includes those policies and procedures that (1) pertain to
the maintenance of records that, in reasonable detail, accurately and fairly
reflect the transactions and dispositions of the assets of the company;
(2) provide reasonable assurance that transactions are recorded as
necessary to permit preparation of financial statements in accordance with
generally accepted accounting principles, and that receipts and expenditures of
the company are being made only in accordance with authorizations of management
and directors of the company; and (3) provide reasonable assurance
regarding prevention or timely detection of unauthorized acquisition, use or
disposition of the company’s assets that could have a material effect on the
financial statements.
Because
of its inherent limitations, internal control over financial reporting may not
prevent or detect misstatements. Also, projections of any evaluation of
effectiveness to future periods are subject to the risk that controls may become
inadequate because of changes in conditions, or that the degree of compliance
with the policies or procedures may deteriorate.
As
indicated in the accompanying Management’s Report on Internal Control Over
Financial Reporting, management’s assessment of and conclusion on the
effectiveness of internal control over financial reporting did not include the
internal controls of A.E. Petsche Company, Inc. ("Petsche") acquired by the
company on December 20, 2009, which is included in the company’s 2009
consolidated financial statements and constituted 2.4 percent of total
assets as of December 31, 2009 and less than 1 percent of the sales and net
income attributable to shareholders for the year then ended. Our audit of
internal control over financial reporting of the company also did not include an
evaluation of the internal control over financial reporting of
Petsche.
In our
opinion, Arrow Electronics, Inc. maintained, in all material respects, effective
internal control over financial reporting as of December 31, 2009, based on
the COSO criteria.
We also
have audited, in accordance with the standards of the Public Company Accounting
Oversight Board (United States), the consolidated balance sheets of Arrow
Electronics, Inc. as of December 31, 2009 and 2008, and the related consolidated
statements of operations, equity, and cash flows for each of the three years in
the period ended December 31, 2009 and our report dated February 3, 2010
expressed an unqualified opinion thereon.
/s/ ERNST
& YOUNG LLP
New
York, New York
February
3, 2010
89
Changes
in Internal Control Over Financial Reporting
There was
no change in the company's internal control over financial reporting that
occurred during the company's most recent fiscal quarter that has materially
affected, or is reasonably likely to materially affect, the company's internal
control over financial reporting.
|
Item
9B.
|
Other
Information.
|
None.
90
See
"Executive Officers" in Part I of this Annual Report on Form 10-K. In
addition, the information set forth under the headings "Election of Directors"
and "Section 16(A) Beneficial Ownership Reporting Compliance" in the company's
Proxy Statement, filed in connection with the Annual Meeting of Shareholders
scheduled to be held on May 4, 2010, are incorporated herein by
reference.
Information
about the company's audit committee financial experts set forth under the
heading "The Board and its Committees" in the company's Proxy Statement, filed
in connection with the Annual Meeting of Shareholders scheduled to be held on
May 4, 2010, is incorporated herein by reference.
Information
about the company's code of ethics governing the Chief Executive Officer, Chief
Financial Officer, and Corporate Controller, known as the "Finance Code of
Ethics," as well as a code of ethics governing all employees, known as the
"Worldwide Code of Business Conduct and Ethics," is available free-of-charge on
the company's website at http://www.arrow.com and is available
in print to any shareholder upon request.
Information
about the company's "Corporate Governance Guidelines" and written committee
charters for the company's Audit Committee, Compensation Committee, and
Corporate Governance Committee is available free-of-charge on the company's
website at http://www.arrow.com
and is available in print to any shareholder upon request.
The
information required by Item 11 is included in the company's Proxy Statement
filed in connection with the Annual Meeting of Shareholders scheduled to be held
on May 4, 2010, and is incorporated herein by reference.
|
Item
12.
|
Security Ownership of
Certain Beneficial Owners and Management and Related Stockholder
Matters.
|
The
information required by Item 12 is included in the company's Proxy Statement
filed in connection with the Annual Meeting of Shareholders scheduled to be held
on May 4, 2010, and is incorporated herein by reference.
The
information required by Item 13 is included in the company's Proxy Statement
filed in connection with the Annual Meeting of Shareholders scheduled to be held
on May 4, 2010, and is incorporated herein by reference.
The
information required by Item 14 is included in the company's Proxy Statement
filed in connection with the Annual Meeting of Shareholders scheduled to be held
on May 4, 2010, and is incorporated herein by reference.
91
|
(a)
|
The
following documents are filed as part of this report:
|
||
|
Page
|
|||
|
1.
|
Financial
Statements.
|
||
|
Report of Independent Registered
Public Accounting Firm
|
42
|
||
|
Consolidated Statements of
Operations for the years ended
December 31, 2009, 2008, and
2007
|
43
|
||
|
Consolidated Balance Sheets as
of December 31, 2009 and 2008
|
44
|
||
|
Consolidated Statements of Cash
Flows for the years ended
December 31, 2009, 2008, and
2007
|
45
|
||
|
Consolidated Statements of
Equity for the years ended
December 31, 2009, 2008, and
2007
|
46
|
||
|
Notes to Consolidated Financial
Statements
|
48
|
||
|
2.
|
Financial
Statement Schedule.
|
||
|
Schedule II – Valuation and
Qualifying Accounts
|
99
|
||
|
All
other schedules are omitted since the required information is not present,
or is not present in amounts sufficient to require submission of the
schedule, or because the information required is included in the
consolidated financial statements, including the notes
thereto.
|
|||
|
3.
|
Exhibits.
|
||
|
See
Index of Exhibits included on pages 93 - 98
|
|||
92
INDEX
OF EXHIBITS
|
Exhibit
Number
|
Exhibit
|
|
|
2(a)
|
Share
Purchase Agreement, dated as of August 7, 2000, among VEBA Electronics
GmbH, EBV Verwaltungs GmbH i.L., Viterra Grundstucke Verwaltungs GmbH,
VEBA Electronics LLC, VEBA Electronics Beteiligungs GmbH, VEBA Electronics
(UK) Plc, Raab Karcher Electronics Systems Plc and E.ON AG and Arrow
Electronics, Inc., Avnet, Inc., and Cherrybright Limited regarding the
sale and purchase of the VEBA electronics distribution group (incorporated
by reference to Exhibit 2(i) to the company's Annual Report on Form 10-K
for the year ended December 31, 2000, Commission File No.
1-4482).
|
|
|
3(a)(i)
|
Restated
Certificate of Incorporation of the company, as amended (incorporated by
reference to Exhibit 3(a) to the company's Annual Report on Form 10-K for
the year ended December 31, 1994, Commission File No.
1-4482).
|
|
|
3(a)(ii)
|
Certificate
of Amendment of the Certificate of Incorporation of Arrow Electronics,
Inc., dated as of August 30, 1996 (incorporated by reference to Exhibit 3
to the company's Quarterly Report on Form 10-Q for the quarter ended
September 30, 1996, Commission File No. 1-4482).
|
|
|
3(a)(iii)
|
Certificate
of Amendment of the Restated Certificate of Incorporation of the company,
dated as of October 12, 2000 (incorporated by reference to Exhibit
3(a)(iii) to the company's Annual Report on Form 10-K for the year ended
December 31, 2000, Commission File No. 1-4482).
|
|
|
3(b)
|
Amended
Corporate By-Laws, dated July 29, 2004 (incorporated by reference to
Exhibit 3(ii) to the company's Quarterly Report on Form 10-Q for the
quarter ended September 30, 2004, Commission File No.
1-4482).
|
|
|
4(a)(i)
|
Indenture,
dated as of January 15, 1997, between the company and The Bank of New York
Mellon (formerly, the Bank of Montreal Trust Company), as Trustee
(incorporated by reference to Exhibit 4(b)(i) to the company's Annual
Report on Form 10-K for the year ended December 31, 1996, Commission File
No. 1-4482).
|
|
|
4(a)(ii)
|
Officers'
Certificate, as defined by the Indenture in 4(a)(i) above, dated as of
January 22, 1997, with respect to the company's $200,000,000 7% Senior
Notes due 2007 and $200,000,000 7 1/2% Senior Debentures due 2027
(incorporated by reference to Exhibit 4(b)(ii) to the company's Annual
Report on Form 10-K for the year ended December 31, 1996, Commission File
No. 1-4482).
|
|
|
4(a)(iii)
|
Officers'
Certificate, as defined by the Indenture in 4(a)(i) above, dated as of
January 15, 1997, with respect to the $200,000,000 6 7/8% Senior
Debentures due 2018, dated as of May 29, 1998 (incorporated by reference
to Exhibit 4(b)(iii) to the company's Annual Report on Form 10-K for the
year ended December 31, 1998, Commission File No.
1-4482).
|
|
|
4(a)(iv)
|
Supplemental
Indenture, dated as of February 21, 2001, between the company and The Bank
of New York (as successor to the Bank of Montreal Trust Company), as
trustee (incorporated by reference to Exhibit 4.2 to the company's Current
Report on Form 8-K, dated March 12, 2001, Commission File No.
1-4482).
|
93
|
Exhibit
Number
|
Exhibit
|
|
|
4(a)(v)
|
Supplemental
Indenture, dated as of December 31, 2001, between the company and The Bank
of New York (as successor to the Bank of Montreal Trust Company), as
trustee (incorporated by reference to Exhibit 4(b)(vi) to the company's
Annual Report on Form 10-K for the year ended December 31, 2001,
Commission File No. 1-4482).
|
|
|
4(a)(vi)
|
Supplemental
Indenture, dated as of March 11, 2005, between the company and The Bank of
New York (as successor to the Bank of Montreal Trust Company), as trustee
(incorporated by reference to Exhibit 4(b)(vii) to the company's Annual
Report on Form 10-K for the year ended December 31, 2004, Commission File
No. 1-4482).
|
|
|
4(a)(vii)
|
Supplemental
Indenture, dated as of September 30, 2009, between the company and The
Bank of New York (as successor to the Bank of Montreal Trust Company), as
trustee (incorporated by reference to Exhibit 4.1 to the company's Current
Report on Form 8-K dated September 29, 2009, Commission File No.
1-4482).
|
|
|
10(a)
|
Arrow
Electronics Savings Plan, as amended and restated on September 9, 2009
(incorporated by reference to Exhibit 10(a) to the company's Quarterly
Report on Form 10-Q for the quarter ended October 3, 2009, Commission File
No. 1-4482).
|
|
|
10(b)
|
Wyle
Electronics Retirement Plan, as amended and restated on September 9, 2009
(incorporated by reference to Exhibit 10(b) to the company's Quarterly
Report on Form 10-Q for the quarter ended October 3, 2009, Commission File
No. 1-4482).
|
|
|
10(c)
|
Arrow
Electronics Stock Ownership Plan, as amended and restated on September 9,
2009 (incorporated by reference to Exhibit 10(c) to the company's
Quarterly Report on Form 10-Q for the quarter ended October 3, 2009,
Commission File No. 1-4482).
|
|
|
10(d)(i)
|
Arrow
Electronics, Inc. 2004 Omnibus Incentive Plan as amended February 28, 2007
and February 27, 2008 (incorporated by reference to Exhibit 10.1 to the
company's Current Report on Form 8-K, dated May 2, 2008, Commission File
No. 1-4482).
|
|
|
10(d)(ii)
|
Form
of Stock Option Award Agreement under 10(d)(i) above (incorporated by
reference to Exhibit 10-0 to the company's Current Report on Form 8-K,
dated March 23, 2006, Commission File No. 1-4482).
|
|
|
10(d)(iii)
|
Form
of Performance Share Award Agreement under 10(d)(i) above (incorporated by
reference to Exhibit 10-0 to the company's Current Report on Form 8-K,
dated August 31, 2005, Commission File No. 1-4482).
|
|
|
10(d)(iv)
|
Form
of Restricted Stock Award Agreement under 10(d)(i) above (incorporated by
reference to Exhibit 10-0 to the company's Current Report on Form 8-K,
dated September 14, 2005, Commission File No. 1-4482).
|
|
|
10(e)(i)
|
Arrow
Electronics, Inc. Stock Option Plan, as amended and restated effective
February 27, 2002 (incorporated by reference to Exhibit 10(d)(i) to the
company's Annual Report on Form 10-K for the year ended December 31, 2002,
Commission File No.
1-4482).
|
94
|
Exhibit
Number
|
Exhibit
|
|
|
10(e)(ii)
|
Paying
Agency Agreement, dated November 11, 2003, by and between Arrow
Electronics, Inc. and Wachovia Bank, N.A. (incorporated by reference to
Exhibit 10(d)(iii) to the company's Annual Report on Form 10-K for the
year ended December 31, 2003, Commission File No.
1-4482).
|
|
|
10(f)
|
Restricted
Stock Plan of Arrow Electronics, Inc., as amended and restated effective
February 27, 2002 (incorporated by reference to Exhibit 10(e)(i) to the
company's Annual Report on Form 10-K for the year ended December 31, 2002,
Commission File No. 1-4482).
|
|
|
10(g)
|
2002
Non-Employee Directors Stock Option Plan as of May 23, 2002 (incorporated
by reference to Exhibit 10(f) to the company's Annual Report on Form 10-K
for the year ended December 31, 2002, Commission File No.
1-4482).
|
|
|
10(h)
|
Non-Employee
Directors Deferral Plan as of May 15, 1997 (incorporated by reference to
Exhibit 99(d) to the company's Registration Statement on Form S-8,
Registration No. 333-45631).
|
|
|
10(i)
|
Arrow
Electronics, Inc. Supplemental Executive Retirement Plan, as amended
effective January 1, 2009.
|
|
|
10(j)
|
Arrow
Electronics, Inc. Executive Deferred Compensation Plan as of October 1,
2004 (incorporated by reference to Exhibit 10(j) to the company's Annual
Report on Form 10-K for the year ended December 31, 2005, Commission File
No. 1-4482).
|
|
|
10(k)(i)
|
Employment
Agreement, dated as of December 30, 2008, by and between the company and
Michael J. Long (incorporated by reference to Exhibit 10(k)(i) to the
company's Annual Report on Form 10-K for the year ended December 31, 2008,
Commission File No. 1-4482).
|
|
|
10(k)(ii)
|
Employment
Agreement, dated as of December 30, 2008, by and between the company and
Peter S. Brown (incorporated by reference to Exhibit 10(k)(ii) to the
company's Annual Report on Form 10-K for the year ended December 31, 2008,
Commission File No. 1-4482).
|
|
|
10(k)(iii)
|
Employment
Agreement, dated as of December 30, 2008, by and between the company and
Paul J. Reilly (incorporated by reference to Exhibit 10(k)(iii) to the
company's Annual Report on Form 10-K for the year ended December 31, 2008,
Commission File No. 1-4482).
|
|
|
10(k)(iv)
|
Employment
Agreement, dated as of December 30, 2008, by and between the company and
John P. McMahon (incorporated by reference to Exhibit 10(k)(vi) to the
company’s Annual Report on Form 10-K for the year ended December 31, 2008,
Commission File No. 1-4482).
|
|
|
10(k)(v)
|
Employment
Agreement, dated as of December 30, 2008, by and between the company and
Andrew S. Bryant.
|
|
|
10(k)(vi)
|
Employment
Agreement, dated as of December 30, 2008, by and between the company and
Peter Kong.
|
95
|
Exhibit
Number
|
Exhibit
|
|
|
10(k)(vii)
|
Form
of agreement providing extended separation benefits under certain
circumstances between the company and certain employees party to
employment agreements, including the employees listed in 10(k)(i)-(vi)
above.
|
|
|
10(k)(viii)
|
Grantor
Trust Agreement, as amended and restated on November 11, 2003, by and
between Arrow Electronics, Inc. and Wachovia Bank, N.A. (incorporated by
reference to Exhibit 10(i)(xvii) to the company's Annual Report on Form
10-K for the year ended December 31, 2003, Commission File No.
1-4482).
|
|
|
10(k)(ix)
|
First
Amendment, dated September 17, 2004, to the amended and restated Grantor
Trust Agreement in 10(k)(viii) above by and between Arrow Electronics,
Inc. and Wachovia Bank, N.A. (incorporated by reference to Exhibit 10(a)
to the company's Quarterly Report on Form 10-Q for the quarter ended
September 30, 2004, Commission File No. 1-4482).
|
|
|
10(l)(i)
|
9.15%
Senior Exchange Notes due October 1, 2010, dated as of October 6, 2000,
among Arrow Electronics, Inc. and Goldman, Sachs & Co.; Chase
Securities Inc.; Morgan Stanley & Co. Incorporated; Bank of America
Securities LLC; Donaldson, Lufkin & Jenrette Securities Corporation;
BNY Capital Markets, Inc.; Credit Suisse First Boston Corporation;
Deutsche Bank Securities Inc.; Fleet Securities, Inc.; and HSBC Securities
(USA) Inc., as underwriters (incorporated by reference to Exhibit 4.4 to
the company's Registration Statement on Form S-4, Registration No.
333-51100).
|
|
|
10(l)(ii)
|
6.875%
Senior Exchange Notes due 2013, dated as of June 25, 2003, among Arrow
Electronics, Inc. and Goldman, Sachs & Co.; JPMorgan; and Bank of
America Securities LLC, as joint book-running managers; Credit Suisse
First Boston, as lead manager; and Fleet Securities, Inc.; HSBC, Scotia
Capital; and Wachovia Securities, as co-managers (incorporated by
reference to Exhibit 99.1 to the company's Current Report on Form 8-K
dated June 25, 2003, Commission File No. 1-4482).
|
|
|
10(m)
|
Amended
and Restated Five Year Credit Agreement, dated as of January 11, 2007,
among Arrow Electronics, Inc. and certain of its subsidiaries, as
borrowers, the lenders from time to time party thereto, JPMorgan Chase
Bank, N.A., as administrative agent, and Bank of America, N.A., The Bank
of Nova Scotia, BNP Paribas and Wachovia Bank National Association, as
syndication agents (incorporated by reference to Exhibit 10(n) to the
company's Annual Report on Form 10-K for the year ended December 31, 2006,
Commission File No. 1-4482).
|
|
|
10(n)(i)
|
Transfer
and Administration Agreement, dated as of March 21, 2001, by and among
Arrow Electronics Funding Corporation, Arrow Electronics, Inc.,
individually and as Master Servicer, the several Conduit Investors,
Alternate Investors and Funding Agents and Bank of America, National
Association, as administrative agent (incorporated by reference to Exhibit
10(m)(i) to the company's Annual Report on Form 10-K for the year ended
December 31, 2001, Commission File No. 1-4482).
|
|
|
10(n)(ii)
|
Amendment
No. 1 to the Transfer and Administration Agreement, dated as of November
30, 2001, to the Transfer and Administration Agreement in (10)(n)(i) above
(incorporated by reference to Exhibit 10(m)(ii) to the company's Annual
Report on Form 10-K for the year ended December 31, 2001, Commission File
No. 1-4482).
|
96
|
Exhibit
Number
|
Exhibit
|
|
|
10(n)(iii)
|
Amendment
No. 2 to the Transfer and Administration Agreement, dated as of December
14, 2001, to the Transfer and Administration Agreement in (10)(n)(i) above
(incorporated by reference to Exhibit 10(m)(iii) to the company's Annual
Report on Form 10-K for the year ended December 31, 2001, Commission File
No. 1-4482).
|
|
|
10(n)(iv)
|
Amendment
No. 3 to the Transfer and Administration Agreement, dated as of March 20,
2002, to the Transfer and Administration Agreement in (10)(n)(i) above
(incorporated by reference to Exhibit 10(m)(iv) to the company's Annual
Report on Form 10-K for the year ended December 31, 2001, Commission File
No. 1-4482).
|
|
|
10(n)(v)
|
Amendment
No. 4 to the Transfer and Administration Agreement, dated as of March 29,
2002, to the Transfer and Administration Agreement in (10)(n)(i) above
(incorporated by reference to Exhibit 10(n)(v) to the company's Annual
Report on Form 10-K for the year ended December 31, 2002, Commission File
No. 1-4482).
|
|
|
10(n)(vi)
|
Amendment
No. 5 to the Transfer and Administration Agreement, dated as of May 22,
2002, to the Transfer and Administration Agreement in (10)(n)(i) above
(incorporated by reference to Exhibit 10(n)(vi) to the company's Annual
Report on Form 10-K for the year ended December 31, 2002, Commission File
No. 1-4482).
|
|
|
10(n)(vii)
|
Amendment
No. 6 to the Transfer and Administration Agreement, dated as of September
27, 2002, to the Transfer and Administration Agreement in (10)(n)(i) above
(incorporated by reference to Exhibit 10(n)(vii) to the company's Annual
Report on Form 10-K for the year ended December 31, 2002, Commission File
No. 1-4482).
|
|
|
10(n)(viii)
|
Amendment
No. 7 to the Transfer and Administration Agreement, dated as of February
19, 2003, to the Transfer and Administration Agreement in (10)(n)(i) above
(incorporated by reference to Exhibit 99.1 to the company's Current Report
on Form 8-K dated February 6, 2003, Commission File No.
1-4482).
|
|
|
10(n)(ix)
|
Amendment
No. 8 to the Transfer and Administration Agreement, dated as of April 14,
2003, to the Transfer and Administration Agreement in (10)(n)(i) above
(incorporated by reference to Exhibit 10(n)(ix) to the company's Annual
Report on Form 10-K for the year ended December 31, 2003, Commission File
No. 1-4482).
|
|
|
10(n)(x)
|
Amendment
No. 9 to the Transfer and Administration Agreement, dated as of August 13,
2003, to the Transfer and Administration Agreement in (10)(n)(i) above
(incorporated by reference to Exhibit 10(n)(x) to the company's Annual
Report on Form 10-K for the year ended December 31, 2003, Commission File
No. 1-4482).
|
|
|
10(n)(xi)
|
Amendment
No. 10 to the Transfer and Administration Agreement, dated as of February
18, 2004, to the Transfer and Administration Agreement in (10)(n)(i) above
(incorporated by reference to Exhibit 10(n)(xi) to the company's Annual
Report on Form 10-K for the year ended December 31, 2003, Commission File
No. 1-4482).
|
|
|
10(n)(xii)
|
Amendment
No. 11 to the Transfer and Administration Agreement, dated as of August
13, 2004, to the Transfer and Administration Agreement in (10)(n)(i) above
(incorporated by reference to Exhibit 10(b) to the company's Quarterly
Report on Form 10-Q for the quarter ended September 30, 2004, Commission
File No.
1-4482).
|
97
|
Exhibit
Number
|
Exhibit
|
|
|
10(n)(xiii)
|
Amendment
No. 12 to the Transfer and Administration Agreement, dated as of February
14, 2005, to the Transfer and Administration Agreement in (10)(n)(i) above
(incorporated by reference to Exhibit 10(o)(xiii) to the company's Annual
Report on Form 10-K for the year ended December 31, 2004, Commission File
No. 1-4482).
|
|
|
10(n)(xiv)
|
Amendment
No. 13 to the Transfer and Administration Agreement, dated as of February
13, 2006, to the Transfer and Administration Agreement in (10)(n)(i) above
(incorporated by reference to Exhibit 10(o)(xiv) to the company's Annual
Report on Form 10-K for the year ended December 31, 2005, Commission File
No. 1-4482).
|
|
|
10(n)(xv)
|
Amendment
No. 14 to the Transfer and Administration Agreement, dated as of October
31, 2006, to the Transfer and Administration Agreement in 10(n)(i) above
(incorporated by reference to Exhibit 10(o)(xv) to the company's Annual
Report on Form 10-K for the year ended December 31, 2006, Commission File
No. 1-4482).
|
|
|
10(n)(xvi)
|
Amendment
No. 15 to the Transfer and Administration Agreement, dated as of February
12, 2007, to the Transfer and Administration Agreement in 10(n)(i) above
(incorporated by reference to Exhibit 10(o)(xvi) to the company's Annual
Report on Form 10-K for the year ended December 31, 2006, Commission File
No. 1-4482).
|
|
|
10(n)(xvii)
|
Amendment
No. 16 to the Transfer and Administration Agreement, dated as of March 27,
2007, to the Transfer and Administration Agreement in 10(n)(i) above
(incorporated by reference to Exhibit 10(b) to the company's Quarterly
Report on Form 10-Q for the quarter ended March 31, 2007, Commission File
No. 1-4482).
|
|
|
10(o)
|
Form
of Indemnification Agreement between the company and each director
(incorporated by reference to Exhibit 10(g) to the company’s Annual Report
on Form 10-K for the year ended December 31, 1986, Commission File No.
1-4482).
|
|
|
21
|
Subsidiary
Listing.
|
|
|
23
|
Consent
of Independent Registered Public Accounting Firm.
|
|
|
31(i)
|
Certification
of Chief Executive Officer Pursuant to Section 302 of the Sarbanes-Oxley
Act of 2002.
|
|
|
31(ii)
|
Certification
of Chief Financial Officer Pursuant to Section 302 of the Sarbanes-Oxley
Act of 2002.
|
|
|
32(i)
|
Certification
of Chief Executive Officer Pursuant to 18 U.S.C. Section 1350, as Adopted
Pursuant to Section 906 of the Sarbanes-Oxley Act of
2002.
|
|
|
32(ii)
|
Certification
of Chief Financial Officer Pursuant to 18 U.S.C. Section 1350, as Adopted
Pursuant to Section 906 of the Sarbanes-Oxley Act of
2002.
|
98
ARROW
ELECTRONICS, INC.
SCHEDULE
II - VALUATION AND QUALIFYING ACCOUNTS
(In
thousands)
|
For the three years ended
December 31,
|
Balance at
beginning
of year
|
Charged
to
income
|
Other (a)
|
Write-down
|
Balance
at end
of year
|
|||||||||||||||
|
Allowance
for doubtful accounts
|
||||||||||||||||||||
|
2009
|
$ | 52,786 | $ | 7,515 | $ | 1,001 | $ | 21,628 | $ | 39,674 | ||||||||||
|
2008
|
$ | 71,232 | $ | 14,866 | $ | 7,787 | $ | 41,099 | $ | 52,786 | ||||||||||
|
2007
|
$ | 75,404 | $ | 14,211 | $ | 1,372 | $ | 19,755 | $ | 71,232 | ||||||||||
|
(a)
|
Represents
the allowance for doubtful accounts of the businesses acquired by the
company during 2009, 2008, and
2007.
|
99
Pursuant
to the requirements of Section 13 or 15(d) of the Securities Exchange Act of
1934, the registrant has duly caused this report to be signed on its behalf by
the undersigned, thereunto duly authorized.
|
ARROW
ELECTRONICS, INC.
|
||
|
By:
|
/s/ Peter S. Brown
|
|
|
Peter
S. Brown
|
||
|
Senior
Vice President, General Counsel and
|
||
|
Secretary
|
||
|
February
3, 2010
|
||
Pursuant
to the requirements of the Securities Exchange Act of 1934, this report has been
signed below by the following persons on behalf of the registrant and in the
capacities indicated on February 3, 2010:
|
By:
|
/s/ Michael J. Long
|
|
Michael
J. Long, Chairman, President, and Chief
|
|
|
Executive
Officer
|
|
|
By:
|
/s/ Paul J. Reilly
|
|
Paul
J. Reilly, Executive Vice President, Finance
|
|
|
and
Operations, and Chief Financial Officer
|
|
|
By:
|
/s/ Michael A. Sauro
|
|
Michael
A. Sauro, Vice President, Corporate Controller,
|
|
|
and
Chief Accounting Officer
|
|
|
By:
|
/s/ Daniel W. Duval
|
|
Daniel
W. Duval, Lead Independent Director
|
|
|
By:
|
/s/ Gail E. Hamilton
|
|
Gail
E. Hamilton, Director
|
|
|
By:
|
/s/ John N. Hanson
|
|
John
N. Hanson, Director
|
|
|
By:
|
/s/ Richard S. Hill
|
|
Richard
S. Hill, Director
|
|
|
By:
|
/s/ Fran Keeth
|
|
Fran
Keeth, Director
|
|
|
By:
|
/s/ Roger King
|
|
Roger
King, Director
|
|
|
By:
|
/s/ Stephen C. Patrick
|
|
Stephen
C. Patrick, Director
|
|
|
By:
|
/s/ Barry W. Perry
|
|
Barry
W. Perry, Director
|
|
|
By:
|
/s/ John C. Waddell
|
|
John
C. Waddell,
Director
|
100