Attached files
| file | filename |
|---|---|
| EXCEL - IDEA: XBRL DOCUMENT - Shepherd's Finance, LLC | Financial_Report.xls |
| EX-31.1 - CERTIFICATION' - Shepherd's Finance, LLC | shepherd_10q-ex3101.htm |
| EX-32.1 - CERTIFICATION - Shepherd's Finance, LLC | shepherd_10q-ex3201.htm |
UNITED STATES
SECURITIES AND EXCHANGE COMMISSION
WASHINGTON, DC 20549
FORM 10-Q
☒ Quarterly Report Pursuant to Section 13 or 15(d) of the Securities Exchange Act of 1934
For the Quarterly Period Ended September 30, 2012
or
☐ Transition Report Pursuant to Section 13 or 15(d) of the Securities Exchange Act of 1934
For the Transition Period From ________ to ________
Commission File Number 333-181360
SHEPHERD’S FINANCE, LLC
(Exact name of registrant as specified on its charter)
| DELAWARE | 36-4608739 |
| (State or other jurisdiction of | (I.R.S. Employer |
| Incorporation or organization) | Identification No.) |
12276 San Jose Blvd., Suite 108, Jacksonville, FL 32223
(Address of principal executive offices)
302-752-2688
(Registrant’s telephone number including area code)
____________________
Indicate by check mark whether the registrant (1) has filed all reports required to be filed by section 13 or 15(d) of the Securities Exchange Act of 1934 during the preceding 12 months (or for such shorter period that the registrant was required to file such reports) and (2) has been subject to such filing requirements for the past 90 days. Yes ☒ No ☐
The registrant’s registration statement on Form S-1, as amended (SEC File No. 333-181360), was declared effective October 4, 2012. The registrant has filed all reports required to be filed by Section 13 or 15(d) of the Securities Exchange Act since that date.
Indicate by check mark whether the registrant has submitted electronically and posted on its corporate Web site, if any, every Interactive Data File required to be submitted and posted pursuant to Rule 405 of Regulation S-T (§232.405 of this chapter) during the preceding 12 months (or for such shorter period that the registrant was required to submit and post such files). Yes ☒ No ☐
Indicate by check mark whether the registrant is a large accelerated filer, accelerated filer, or non-accelerated filer. See definition of “accelerated filer and large accelerated filer” in Rule 12b-2 of the Exchange Act.
| Large accelerate filer | ☐ | Accelerated filer | ☐ |
| Non-accelerated filer | ☐ | Smaller reporting company | ☒ |
Indicate by check mark whether the registrant is a shell company (as defined in Rule 12b-2 of the Exchange Act). Yes ☐ No ☒
FORM- 10-Q
SHEPHERD’S FINANCE, LLC
TABLE OF CONTENTS
| Page | |
| Cautionary Note Regarding Forward-Looking Statements | 3 |
| PART I. FINANCIAL INFORMATION | 4 |
| Item 1. Financial Statements | 4 |
| Condensed Consolidated Balance Sheets as of September 30, 2012 (Unaudited) and December 31, 2011 | 4 |
| Condensed Consolidated Statements of Operations (Unaudited) for the Three and Nine Months Ended September 30, 2012 and 2011 | 5 |
| Condensed Consolidated Statement of Changes in Members’ Capital (Unaudited) for the Nine Months Ended September 30, 2012 | 6 |
| Condensed Consolidated Statements of Cash Flows (Unaudited) for the Nine Months Ended September 30, 2012 and 2011 | 7 |
| Notes to Condensed Consolidated Financial Statements (Unaudited) | 8 |
| Item 2. Management’s Discussion and Analysis of Financial Condition and Results of Operations | 17 |
| Item 3. Quantitative and Qualitative Disclosure About Market Risk | 27 |
| Item 4. Controls and Procedures | 27 |
| PART II. OTHER INFORMATION | |
| Item 1. Legal Proceedings | 28 |
| Item 1A. Risk Factors | 28 |
| Item 2. Unregistered Sales of Equity Securities and Use of Proceeds | 28 |
| Item 3. Defaults upon Senior Securities | 28 |
| Item 4. Mine Safety Disclosures | 28 |
| Item 5. Other Information | 28 |
| Item 6. Exhibits | 28 |
| 2 |
CAUTIONARY NOTE REGARDING FORWARD-LOOKING STATEMENTS
Certain statements contained in this Form 10-Q of Shepherd’s Finance, LLC, other than historical facts, may be considered forward-looking statements within the meaning of the federal securities laws. Words such as “may,” “will,” “expect,” “anticipate,” “believe,” “estimate,” “continue,” “predict,” or other similar words identify forward-looking statements. Forward-looking statements appear in a number of places in this report, including without limitation, “Management’s Discussion and Analysis of Financial Condition and Results of Operations,” and include statements regarding our intent, belief or current expectation about, among other things, trends affecting the markets in which we operate, our business, financial condition and growth strategies. Although we believe that the expectations reflected in these forward-looking statements are based on reasonable assumptions, forward-looking statements are not guarantees of future performance and involve risks and uncertainties. Actual results may differ materially from those predicted in the forward-looking statements as a result of various factors, including but not limited to those set forth in the “Risk Factors” section of our Form S-1 Registration Statement (SEC Registration No. 333-181360), as amended and filed with the Securities and Exchange Commission. If any of the events described in “Risk Factors” occur, they could have an adverse effect on our business, financial condition, and results of operations.
When considering forward-looking statements, you should keep these risk factors, as well as the other cautionary statements in this report and in our Form S-1 Registration Statement in mind. You should not place undue reliance on any forward-looking statement. We are not obligated to update forward-looking statements.
| 3 |
PART I – FINANCIAL INFORMATION
ITEM 1. FINANCIAL STATEMENTS
Shepherd’s Finance, LLC
Interim Condensed Consolidated Balance Sheets
As of September 30, 2012 and December 31, 2011
(in thousands of dollars) | 2012 (Unaudited) | 2011 | ||||||
| Assets | ||||||||
| Cash and cash equivalents | $ | 41 | $ | 50 | ||||
| Accrued interest on loans | 29 | 2 | ||||||
| Deferred offering costs | 508 | – | ||||||
| Other assets | 13 | 26 | ||||||
| Loans receivable, net | 4,242 | 4,580 | ||||||
| Total assets | $ | 4,833 | $ | 4,658 | ||||
| Liabilities and Members’ Capital | ||||||||
| Customer interest escrow | $ | 324 | $ | 450 | ||||
| Accounts payable and accrued expense | 97 | - | ||||||
| Notes payable unsecured | 1,500 | 1,500 | ||||||
| Notes payable related party | 1,015 | 878 | ||||||
| Total liabilities | 2,936 | 2,828 | ||||||
| Commitments and Contingencies (Note 9) | ||||||||
| Members’ capital | 1,897 | 1,830 | ||||||
| Total liabilities and members’ capital | $ | 4,833 | $ | 4,658 | ||||
The accompanying notes are an integral part of these interim condensed consolidated financial statements.
| 4 |
Shepherd’s Finance, LLC
Interim Condensed Consolidated Statements of Operations – Unaudited
For the Three and Nine Months Ended September 30, 2012 and 2011
| Three Months Ended | Nine Months Ended | |||||||||||||||
| (in thousands of dollars) | 2012 | 2011 | 2012 | 2011 | ||||||||||||
| Interest Income | ||||||||||||||||
| Interest and fee income on loans | $ | 142 | $ | – | $ | 444 | $ | – | ||||||||
| Interest expense | 30 | – | 86 | – | ||||||||||||
| Net interest income | 112 | – | 358 | – | ||||||||||||
| Less: Loan loss provision | – | – | – | – | ||||||||||||
| Net interest income | 112 | – | 358 | – | ||||||||||||
| Non-Interest Expense | ||||||||||||||||
| Selling, general and administrative | 78 | – | 258 | – | ||||||||||||
| Total non-interest expense | 78 | – | 258 | – | ||||||||||||
| Income from continuing operations | 34 | – | 100 | – | ||||||||||||
| Income from discontinued operations, net | – | 70 | – | 309 | ||||||||||||
| Net income | $ | 34 | $ | 70 | $ | 100 | $ | 309 | ||||||||
The accompanying notes are an integral part of these interim condensed consolidated financial statements.
| 5 |
Shepherd’s Finance, LLC
Interim Condensed Consolidated Statement of Changes in Members’ Capital – Unaudited
For the Nine Months Ended September 30, 2012
| (in thousands of dollars) | ||||
| Members’ capital, beginning balance | $ | 1,830 | ||
| Net income | 100 | |||
| Distributions | (33 | ) | ||
| Members’ capital, ending balance | $ | 1,897 | ||
The accompanying notes are an integral part of these interim condensed consolidated financial statements.
| 6 |
Shepherd’s Finance, LLC
Interim Condensed Consolidated Statements of Cash Flows – Unaudited
For the Nine Months Ended September 30, 2012 and 2011
| (in thousands of dollars) | 2012 | 2011 | ||||||
| Cash flows from operations | ||||||||
| Net income (loss) | $ | 100 | $ | 309 | ||||
| (Income) from discontinued operations | – | (309 | ) | |||||
| Adjustments to reconcile net income (loss) to net cash provided by (used in) operating activities | ||||||||
| Deferred loan fees | (166 | ) | – | |||||
| Net change in operating assets and liabilities | ||||||||
| Other operating assets | 21 | – | ||||||
| Accrued interest receivable | (27 | ) | – | |||||
| Customer interest escrow | (126 | ) | – | |||||
| Accounts payable and accrued expenses | 97 | – | ||||||
| Net cash provided by (used in) operating activities – continuing operations | (101 | ) | – | |||||
| Net cash provided by (used in) operating activities – discontinued operations | – | (1,405 | ) | |||||
| Net cash provided by (used in) operating activities | (101 | ) | (1,405 | ) | ||||
| Cash flows from investing activities | ||||||||
| Loan originations and principal collections, net | 504 | – | ||||||
| Other investing activity | (8 | ) | – | |||||
| Net cash provided by (used in) investing activities – continuing operations | 496 | – | ||||||
| Net cash provided by (used in) investing activities – discontinued operations | – | 10,327 | ||||||
| Net cash provided by (used in) investing activities | 496 | 10,327 | ||||||
| Cash flows from financing activities | ||||||||
| Distributions to members | (33 | ) | (956 | ) | ||||
| Proceeds from related party notes | 137 | – | ||||||
| Payments of debt issuance costs | (508 | ) | – | |||||
| Net cash provided by (used in) financing activities – continuing operation | (404 | ) | (956 | ) | ||||
| Net cash provided by (used in) financing activities – discontinued operations | – | (6,148 | ) | |||||
| Net cash provided by (used in) financing activities | (404 | ) | (7,104 | ) | ||||
| Net increase (decrease) in cash and cash equivalents | (9 | ) | 1,818 | |||||
| Cash and cash equivalents | ||||||||
| Beginning of period | 50 | 12 | ||||||
| End of period | $ | 41 | $ | 1,830 | ||||
| Supplemental disclosure of cash flow information | ||||||||
| Cash paid for interest | $ | 26 | $ | 512 | ||||
The accompanying notes are an integral part of these interim condensed consolidated financial statements.
Information presented throughout these notes to the interim condensed consolidated financial statements (Unaudited) is in thousands of dollars.
| 7 |
Shepherd’s Finance, LLC
Notes to Condensed Consolidated Financial Statements (Unaudited)
1. Description of Business and Basis of Presentation
Description of Business
Description of Business
Shepherd’s Finance, LLC and subsidiaries (the “Company”, “we” or “our”) is a finance company that intends to focus most of our future efforts on commercial lending to residential homebuilders, to finance construction of single family properties. The single family residential construction loans will be extended to residential homebuilders and, as such, are commercial loans. The Company also intends to lend and has loaned money to residential homebuilders to develop undeveloped land into residential building lots known as acquisition and development loans, which are also considered commercial loans.
Our plans include expanding our lending capacity and funding our business operations by extending notes to the general public, which will be unsecured subordinated debt. Eventually, the Company intends to repay the debt from affiliates with secured debt from a bank or through other liquidity.
Basis of Presentation
The unaudited interim condensed consolidated financial statements, in the opinion of management, reflect all adjustments necessary for a fair presentation of the consolidated financial position, results of operations and cash flows for the periods presented. Such adjustments are of a normal, recurring nature. The results of operations for any interim period are not necessarily indicative of results expected for the fiscal year ending December 31, 2012. While certain information and disclosures normally included in financial statements prepared in accordance with accounting principles generally accepted in the United States of America (“GAAP”) have been condensed or omitted pursuant to the rules and regulations of the Securities and Exchange Commission (“SEC”), management believes that the disclosures herein are adequate to make the condensed consolidated information presented not misleading. These unaudited interim condensed consolidated financial statements should be read in conjunction with the year end 2011 consolidated financial statements and notes thereto, included in the Company’s prospectus dated October 4, 2012. The accounting policies followed by the Company are set forth in Note 2 - Summary of Significant Accounting Policies of the Notes to those 2011 statements.
Liquidity and Capital Resources
The Company has a limited operating history with our current business model, and our operations are subject to certain risks and uncertainties, particularly related to the concentration of our current operations to a single customer and geographic region, as well as the evolution of the current economic environment and its impact on the United States real estate and housing markets. Both the concentration of risk and the recessionary economic environment could directly or indirectly impact losses related to certain transactions and access to and cost of adequate financing.
The Company’s anticipated primary source of liquidity going forward is interest income and/or principal repayments from our loans, as well as funds borrowed from creditors, all of whom are currently members and affiliates. Therefore, the Company’s ability to fund its operations is dependent upon our sole customer’s ability to continue paying interest and principal and our ability to obtain additional financing, as needed, from the members, general public or other entities.
We generated a profit from continuing operations of $100 and $0 for the nine months ended September 30, 2012 and 2011, respectively. Cash used in continuing operations during these periods was approximately $9 and $956, respectively. At September 30, 2012 we had cash on hand of approximately $41 and our outstanding debt totaled $2,515, which was unsecured or payable to related parties.
Our current plan is to expand the commercial lending program by using current liquidity and available funding including our offering of notes. We have anticipated the costs of this expansion and the costs of the offering, and we anticipate generating, through normal operations, the cash flows necessary to meet our operating, investing and financing requirements. As noted above, the two most significant factors driving our current plans are the continued payments of principal and interest by our sole homebuilder customer and the amount of funds received from the public offering of notes. If actual results differ materially from our current plan or if expected financing is not available, we believe we have the ability to discontinue the offering to reduce costs; we also intend and believe we have the ability to obtain funding and generate net worth through additional debt or equity infusions of cash. There can be no assurance, however, that we will be able to implement our strategies or obtain additional financing under favorable terms, if at all.
| 8 |
2. Summary of Significant Accounting Policies
Segment Reporting
We report all ongoing operations in one segment, commercial lending.
Use of Estimates
Timely preparation of financial statements in accordance with the rules and regulations of the SEC require management to make estimates that affect the reported amounts of assets and liabilities at the date of the financial statements, as well as the reported amounts of income and expenses during the reporting periods. Actual results could differ from those estimates.
Revenue Recognition
Interest income generally is recognized on an accrual basis. The accrual of interest is generally discontinued on all loans past due 90 days or more. All interest accrued but not collected for loans that are placed on nonaccrual or charged off is reversed against interest income, unless management believes that the accrued interest is recoverable through liquidation of collateral. Interest received on nonaccrual loans is applied against principal. Interest on accruing impaired loans is recognized as long as such loans do not meet the criteria for nonaccrual status.
Loans Receivable
Loans are stated at the amount of unpaid principal, net of any allowances for loan losses, and adjusted for the net amount of direct costs and nonrefundable loan fees associated with lending. The net amount of nonrefundable loan origination fees and direct costs associated with the lending process, including commitment fees, is deferred and accreted to interest income over the lives of the loans using a method that approximates the interest method. Substantially all of the Company’s loans are secured by real estate, currently all in a suburb of Pittsburgh, Pennsylvania. Accordingly, the ultimate collectability of a substantial portion of these loans is susceptible to changes in market conditions in that area.
Past due loans are loans contractually past due 30 days or more as to principal or interest payments. A loan is classified as nonaccrual, and the accrual of interest on such loan is discontinued, when the contractual payment of principal or interest becomes 90 days past due. In addition, a loan may be placed on nonaccrual at any other time management has serious doubts about further collectability of principal or interest according to the contractual terms, even though the loan is currently performing. A loan may remain on accrual status if it is in the process of collection or well-secured (i.e. the loan has sufficient collateral value). Loans are restored to accrual status when the obligation is brought current or has performed in accordance with the contractual terms for a reasonable period of time and the ultimate collectability of the total contractual principal and interest is no longer in doubt.
A loan is considered impaired when, based on current information and events, it is probable that the Company will be unable to collect the scheduled payments of principal or interest when due according to the contractual terms of the loan agreement. Impaired loans, or portions thereof, are charged off when deemed uncollectible. Once a loan is 90 days past due, management begins a workout plan with the borrower or commences its foreclosure process on the collateral.
Allowance for Loan Losses
The allowance for loan losses, when determined to be necessary, is maintained at a level believed adequate by management to absorb probable losses inherent in the loan portfolio.
For loans to one borrower with committed balances less than 10% of our total committed balances on all loans extended to all customers, we analyze for impairment all loans which are more than 60 days past due at the end of a quarter. For loans to one borrower with committed balances equal to or greater than 10% of our total committed balances on all loans extended to all customers, we analyze all loans for impairment. The analysis of loans, if required, develops a collateral value to be compared to the principal amount of the loan. If the value determined is less than the principal amount due (less any builder deposit), then the difference is included in the loan loss. As values change, estimated loan losses may be provided for more or less than the previous period, and some loans do not need a loss provision based on payment history. For homes which are partially complete, we appraise on an as-is and completed basis, and use the one that more closely aligns with our planned method of disposal for the property.
All loans that are individually evaluated for impairment have an appraisal within the last 13 months. There also is a broker’s opinion of value (“BOV”) prepared, if the appraisal is more than six months old. The lower of any BOV prepared in the last six months, or appraisal in the last 13 months will be used, unless we determine a BOV to be invalid based on the comparable sales used. If we determine a BOV to be invalid, we use the appraised value. Appraised values are adjusted down for costs associated with asset disposal.
| 9 |
Recent Accounting Pronouncements
In December 2011, the FASB issued ASU 2011-11, Disclosures about Offsetting Assets and Liabilities which creates new disclosure requirements about the nature of an entity’s rights of setoff and related arrangements associated with its financial instruments and derivative instruments. The disclosures will be limited to financial instruments and derivatives subject to enforceable master netting arrangements or similar agreements and excludes loans unless they are netted in the statement of financial condition. The amendments will affect all entities that have financial instruments and derivatives that are either offset in the balance sheet or subject to an enforceable master netting arrangement or similar agreement regardless of whether they are offset in the balance sheet. The ASU will require entities to disclose, separately for financial assets and liabilities, including derivatives, the gross amounts of recognized financial assets and liabilities; the amounts offset under current U.S. GAAP; the net amounts presented in the balance sheet; the amounts subject to an enforceable master netting arrangement or similar agreement that were not included in the offset amount above, and the reconciling amount. The disclosure requirements are effective for annual and interim reporting periods beginning on or after January 1, 2013, with retrospective application required. The Company is evaluating the impact of this amendment.
In May 2011, the FASB issued ASU No. 2011-04, Fair Value Measurement (Topic 820): Amendments to Achieve Common Fair Value Measurement and Disclosure Requirements in U.S. GAAP and IFRS, to provide a consistent definition of fair value and ensure that the fair value measurement and disclosure requirements are similar between U.S. GAAP and IFRS. ASU 2011-04 changes certain fair value measurement principles and enhances the disclosure requirements particularly for Level 3 fair value measurements. The most significant change will require entities, for their recurring Level 3 fair value measurements, to disclose quantitative information about unobservable inputs used, a description of the valuation processes used by the entity, and a qualitative discussion about the sensitivity of the measurements. New disclosures are required about the use of a nonfinancial asset measured or disclosed at fair value if its use differs from its highest and best use. In addition, entities must report the level in the fair value hierarchy of assets and liabilities not recorded at fair value but where fair value is disclosed. The amendment was effective for annual and interim reporting periods which began after December 15, 2011. The adoption of this guidance had no effect on the amounts presented in the Company’s consolidated financial statements or notes to the consolidated financial statements, as the Company currently has no assets measured at fair value on a recurring or nonrecurring basis. See Note 3.
3. Fair Value
The Company has established a framework for measuring fair value under U.S. GAAP using a hierarchy, which requires the Company to maximize the use of observable inputs and minimize the use of unobservable inputs. Fair value measurements are an exit price, representing the amount that would be received to sell an asset or paid to transfer a liability in an orderly transaction between market participants. Three levels of inputs are used to measure fair value, as follows:
Level 1 – quoted prices in active markets for identical assets or liabilities;
Level 2 – quoted prices in active markets for similar assets and liabilities and inputs that are observable for the asset or liability; or
Level 3 – unobservable inputs, such as discounted cash flow models or valuations.
The determination of where assets and liabilities fall within this hierarchy is based upon the lowest level of input that is significant to the fair value measurement.
At September 30, 2012 and December 31, 2011, the Company had no assets measured at fair value on a recurring or nonrecurring basis.
The following methods and assumptions were used to estimate the fair value of each class of financial instruments under ASC Topic 825, for which it is practicable to estimate the value:
Cash and Cash Equivalents
The carrying amount approximates fair value because of the short maturity of these instruments.
Loans Receivable
For variable rate loans that reprice frequently with no significant change in credit risk, estimated fair values are based on carrying values at September 30, 2012 and December 31, 2011. The estimated fair values for other loans are estimated by discounting the future cash flow using current rates at which similar loans would be made to borrowers with similar credit ratings and the same remaining maturities and approximate carrying values of these instruments at September 30, 2012 and December 31, 2011.
| 10 |
Borrowings under Credit Facilities
The fair value of the Company’s borrowings under credit facilities is estimated based on the expected cash flows discounted using the current rates offered to the Company for the debt of the same remaining maturities. Based on the borrowing rates currently available to the Company for bank loans with similar terms and maturities, the fair value of the Company’s notes approximates the carrying amounts of the notes at September 30, 2012 and December 31, 2011.
4. Financing Receivables
Financing receivables are comprised of the following:
| September 30, 2012 | December 31, 2011 | |||||||
| Commercial loans, net | $ | 4,242 | $ | 4,580 | ||||
| Less: Allowance for loan losses | – | – | ||||||
| $ | 4,242 | $ | 4,580 | |||||
Roll forward of commercial loans:
| Nine Months Ended September 30, 2012 | Year Ended December 31, 2011 | Nine Months Ended September 30, 2011 | ||||||||||
| Beginning balance | $ | 4,580 | $ | – | $ | – | ||||||
| Additions | 300 | 4,580 | – | |||||||||
| Payoffs/Sales | (804 | ) | – | – | ||||||||
| Earned loan fee | 166 | – | – | |||||||||
| Ending balance | $ | 4,242 | $ | 4,580 | $ | – | ||||||
Commercial Loans
On December 30, 2011, pursuant to a credit agreement by and between us, Benjamin Marcus Homes, LLC (“BMH”), Investor’s Mark Acquisitions, LLC (“IMA”) and Mark L. Hoskins (“Hoskins”) (collectively, the “Hoskins Group”) (the “Credit Agreement”), we originated two new loan assets, one to BMH as borrower (the “BMH Loan”) and one to IMA as borrower (the “New IMA Loan”). Pursuant to the Credit Agreement and simultaneously with the origination of the BMH Loan and the New IMA Loan, we also assumed the position of lender on an existing loan to IMA (the “Existing IMA Loan”) and assumed the position of borrower on another existing loan in which IMA serves as the lender (the “SF Loan”). When we assumed the position of the lender on the Existing IMA Loan, we purchased a loan which was originated by the borrower’s former lender, and assumed that lender’s position in the loan and maintained the recorded collateral position in the loan. The borrower’s former lender and the seller of the BMH property were the same party, 84 FINANCIAL, L.P., an affiliate of 84 Lumber Company. The BMH Loan, the New IMA Loan and the Existing IMA Loan are all cross-defaulted and cross-collateralized with each other. Further, IMA and Hoskins serve as guarantors of the BMH Loan, and BMH and Hoskins serve as guarantors of the New IMA Loan and the Existing IMA Loan. As such, we are currently reliant on a single developer and homebuilder for our revenues and investment capital. The terms and conditions of these loans are set forth in further detail below:
| 11 |
A detail of the financing receivables at September 30, 2012:
| Item | Term | Interest Rate | Funded to borrower | Estimated collateral values | ||||||||||
| BMH Loan | Demand* | COF +2% (7% Floor) | ||||||||||||
| 10 Lots | $ | 1,822 | $ | 1,330 | ||||||||||
| Land for phases 3, 4 and 5 | – | 1,760 | ||||||||||||
| Interest Escrow | 450 | 324 | ||||||||||||
| Loan Fee | 750 | – | ||||||||||||
| Total BMH Loan | 3,022 | 3,414 | ||||||||||||
| IMA Loans | ||||||||||||||
| New IMA Loan (loan fee) | Demand* | COF +2% (7% Floor) | 250 | – | ||||||||||
| New IMA Loan (advances) | Demand* | COF +2% (7% Floor) | 41 | – | ||||||||||
| Existing IMA Loan | Demand** | 7% | 1,687 | 1,910 | ||||||||||
| Total IMA Loans | 1,978 | 1,910 | ||||||||||||
| Unearned loan fee | (758 | ) | – | |||||||||||
| SF Loan | – | 1,500 | ||||||||||||
| Total | $ | 4,242 | $ | 6,824 | ||||||||||
A detail of the financing receivables at December 31, 2011:
| Item | Term | Interest Rate | Funded to borrower | Estimated collateral values | ||||||||||
| BMH Loan | Demand* | COF +2% (7% Floor) | ||||||||||||
| 16 Lots | $ | 2,368 | $ | 1,930 | ||||||||||
| Land for phases 3, 4 and 5 | – | 1,760 | ||||||||||||
| Interest Escrow | 450 | 450 | ||||||||||||
| Loan Fee | 750 | – | ||||||||||||
| Total BMH Loan | 3,568 | 4,140 | ||||||||||||
| IMA Loans | ||||||||||||||
| New IMA Loan (loan fee) | Demand* | COF +2% (7% Floor) | 250 | – | ||||||||||
| Existing IMA Loan | Demand** | 7% | 1,686 | 1,910 | ||||||||||
| Total IMA Loans | 1,936 | 1,910 | ||||||||||||
| Unearned loan fee | (924 | ) | – | |||||||||||
| SF Loan | – | 1,500 | ||||||||||||
| Total | $ | 4,580 | $ | 7,550 | ||||||||||
* These are the stated terms; however, in practice, principal will be repaid upon the sale of each developed lot.
** These are the stated terms; however, in practice, principal will be repaid upon the sale of each developed lot after the BMH loan and the New IMA loan are satisfied.
The loans are collectively cross-collateralized and, therefore, treated as one loan for the purpose of calculating the effective interest rate and for available remedies upon an instance of default. As lots are released, a specific release price is repaid by the borrower, with 10% of that amount being used to fund the Interest Escrow. The customer will make cash interest payments only when the Interest Escrow is fully depleted.
| 12 |
Of the $1,000 loan fee from the origination of our demand loans, $76 was used to offset legal expenses related to the creation of the loans. In accordance with ASC 310-20, Nonrefundable Fees and Other Costs, the remaining $924 loan fee is recognized over the expected life of the loans using the straight-line method. The effective annual rate on the loans at September 30, 2012 and December 31, 2011 was 11.18% and 11.81%, respectively.
The Company has a credit agreement with the customer which includes a maximum exposure on all three loans, which is $5,100 at September 30, 2012, was $5,800 at December 31, 2011 and will reduce to $4,900 in November 1, 2012, unless modified by both parties.
Credit Quality Information
Certain of the following tables present credit-related information at the “class” level in accordance with ASC 310-10-50, Disclosures about the Credit Quality of Finance Receivables and the Allowance for Credit Losses. A class is generally a disaggregation of a portfolio segment. In determining the classes, the Company considered the finance receivable characteristics and methods it applies in monitoring and assessing credit risk and performance.
The following table summarizes finance receivables by the risk ratings that regulatory agencies utilize to classify credit exposure and which are consistent with indicators the Company monitors. Risk ratings are reviewed on a regular basis and are adjusted as necessary for updated information affecting the borrowers’ ability to fulfill their obligations.
The definitions of these ratings are as follows:
| · | Pass – finance receivables in this category do not meet the criteria for classification in one of the categories below. |
| · | Special mention – a special mention asset exhibits potential weaknesses that deserve management’s close attention. If left uncorrected, these potential weaknesses may, at some future date, result in the deterioration of the repayment prospects. |
| · | Classified – a classified asset ranges from: 1) assets that are inadequately protected by the current sound worth and paying capacity of the borrower, and are characterized by the distinct possibility that some loss will be sustained if the deficiencies are not corrected to 2) assets with weaknesses that make collection or liquidation in full unlikely on the basis of current facts, conditions, and values. Assets in this classification can be accruing or on non-accrual depending on the evaluation of these factors. |
Finance Receivables – By Classification:
| September 30, 2012 | December 31, 2011 | |||||||
| Pass | $ | 4,242 | $ | 4,580 | ||||
| Special mention | – | – | ||||||
| Classified – accruing | – | – | ||||||
| Classified – nonaccrual | – | – | ||||||
| Total | $ | 4,242 | $ | 4,580 | ||||
At September 30, 2012 and December 31, 2011, there were no loans acquired with deteriorated credit quality, past due loans, impaired loans, or loans on nonaccrual status.
| 13 |
5. Borrowings
Affiliate Loans
In December of 2011, the Company entered into two secured revolving lines of credit with affiliates, both of whom are members.
Summary of Affiliate Loan borrowings:
| September 30, 2012 | December 31, 2011 | |||||||
| Maximum line of credit allowable amount | $ | 1,500 | $ | 1,500 | ||||
| Less: Outstanding balance | 1,015 | 878 | ||||||
| Available liquidity from affiliate loans | $ | 485 | $ | 622 | ||||
| Interest rate (affiliates’ cost of funds) | 3.88% | 3.73% | ||||||
6. Members’ Capital
The capital structure of the Company was changed with the adoption of the new operating agreement as of March 29, 2012. Under the new capital structure, there is currently one share class (class A common units) with two members. All members have voting rights in proportion to their capital account. There were 2,629 A Common units outstanding at September 30, 2012. There are two additional authorized share classes: class A preferred units and class B profit units. Once class B profit units are issued, the existing class A common units will become class A preferred units. Class A preferred units will receive preferred treatment in terms of distributions and liquidation proceeds.
The former capital structure of the Company included three unit classes, A units, B units, and a voting member. The former ownership classes had varying rights and privileges, primarily relating to amount and order of distributions, as well as varying allocations of profit and losses, as defined by the former operating agreement. At December 31, 2011, there were 878 A units, 9,198 B units, and 1 voting unit outstanding.
The members’ capital balances by class are as follows:
| Class | September 30, 2012 | December 31, 2011 | ||||||
| A Common Units | $ | 1,897 | $ | – | ||||
| A Units | – | 451 | ||||||
| B Units | – | 1,378 | ||||||
| Voting Member | – | 1 | ||||||
| Members’ Capital | $ | 1,897 | $ | 1,830 | ||||
7. Related Party Transactions
The accompanying interim condensed consolidated financial statements have been prepared from the separate accounts maintained by the Company and may not be indicative of the conditions that would have existed or the results of operations that would have occurred had the Company not entered into certain related party transactions or not participated in certain transactions with its members.
84 Lumber Company
The direct financing, commercial real estate leases created in 2007 and described in Note 8 were with an affiliate of 84 Lumber Company. At the time, 84 Lumber Company employed Daniel M. Wallach as its Chief Financial Officer and was therefore considered a related party. Those leases have been terminated and settled. The Company currently has no affiliation with 84 Lumber Company or its affiliates.
| 14 |
Notes and Accounts Payable to Affiliates
In December of 2011, the Company entered into a loan agreement with two of our affiliates, as more fully described in Note 5 – Borrowings.
In December of 2011, the Company entered into a loan agreement with the Hoskins Group, as more fully described in Note 4 – Financing Receivables.
8. Discontinued Operations
In accordance with the provisions of ASC Subtopic 205-20, Discontinued Operations, management of the Company determined that its commercial real estate leases created in 2007 and terminated in 2011, which were accounted for as direct finance leases, met the definition of a component of the Company. Therefore, management determined that leasing operations should be presented as discontinued operations.
For the first nine months of 2012 and 2011, the income (loss) from discontinued operations consisted of the following:
| 2012 | 2011 | |||||||
| Interest income on direct financing leases | $ | – | $ | 638 | ||||
| Selling, general and administrative expenses | – | 69 | ||||||
| Interest expense | – | 260 | ||||||
| Income from discontinued operations | $ | – | $ | 309 |
At September 30, 2012 and December 31, 2011, there were no assets or liabilities associated with the discontinued leases and their related borrowings reflected in the accompanying condensed consolidated balance sheets.
9. Commitments and Contingencies
In the normal course of business there may be outstanding commitments to extend credit that are not included in the consolidated financial statements. Commitments to extend credit are agreements to lend to a customer as long as there is no violation of any condition established in the contract. Commitments generally have fixed expiration dates or other termination clauses and may require payment of a fee. Since many of the commitments are expected to expire without being drawn upon and some of the funding may come from the earlier repayment of the same loan (in the case of revolving lines), the total commitment amounts do not necessarily represent future cash requirements. The financial instruments involve, to varying degrees, elements of credit and interest rate risk in excess of amounts recognized in the consolidated financial statements. The Company evaluates each customer’s creditworthiness on a case-by-case basis. Unfunded commitments to extend credit were approximately $100 and $296 at September 30, 2012 and December 31, 2011, respectively.
The Company is involved in various claims and lawsuits arising in the normal course of business. Management believes that any financial responsibility that may be incurred in settlement of such claims and lawsuits would not be material to the Company’s consolidated financial position, results of operations or cash flows.
| 15 |
10. Income Taxes
The entities included in the condensed consolidated financial statements are organized as pass-through entities under the Internal Revenue Code. As such, taxes are the responsibility of the members. The State of Pennsylvania charges a tax based on loan assets. This tax has been recorded on an accrual basis.
The Company applies ASC Topic 740, Income Taxes (“ASC 740”). ASC 740 provides guidance for how uncertain tax positions should be recognized, measured, presented and disclosed in the consolidated financial statements and requires the evaluation of tax positions taken or expected to be taken in the course of preparing the Company’s consolidated financial statements to determine whether the tax positions are “more-likely-than-not” to be sustained by the applicable tax authority. Tax positions with respect to income tax at the LLC level not deemed to meet the “more-likely-than-not” threshold would be recorded as a tax benefit or expense in the appropriate period. Management concluded that there are no uncertain tax positions that should be recognized in the consolidated financial statements. With few exceptions, the Company is no longer subject to income tax examinations for years prior to 2008.
11. Subsequent Events
Management of the Company has evaluated subsequent events through November 13, 2012, the date these interim condensed consolidated financial statements were issued.
The Company’s public debt offering became effective with the SEC, 27 states, and the District of Columbia on October 4, 2012. We became effective in another 6 states subsequent to October 4, 2012 and prior to November 13, 2012. We are currently effective in the following states: Alaska, Arizona, California, Colorado, Connecticut, Delaware, District of Columbia, Florida, Georgia, Hawaii, Idaho, Illinois, Indiana, Iowa, Kansas, Louisiana, Michigan, Minnesota, Mississippi, Missouri, Montana, Nevada, New Hampshire, Oregon, Pennsylvania, Rhode Island, South Carolina, South Dakota, Utah, Vermont, Virginia, West Virginia, Wisconsin, and Wyoming. Under the public debt offering, the Company has issued $0 in debt after September 30, 2012 through November 13, 2012.
| 16 |
ITEM 2. MANAGEMENT’S DISCUSSION AND ANALYSIS OF FINANCIAL CONDITION AND RESULTS OF OPERATIONS
(All dollar [$] amounts shown in thousands.)
The following Management’s Discussion and Analysis of Financial Condition and Results of Operations should be read in conjunction with our financial statements and the notes thereto contained elsewhere in this report. The following Management’s Discussion and Analysis of Financial Condition and Results of Operations should also be read in conjunction with our audited annual consolidated financial statements and related notes and other consolidated financial data included in our prospectus dated October 4, 2012. See also “Cautionary Note Regarding Forward-Looking Statements” preceding Part I.
Overview
We are a finance company and intend to focus most of our future efforts on commercial lending to residential homebuilders to finance construction of single family residential properties. The single family residential construction loans will be extended to residential homebuilders and, as such, are commercial loans. The Company also intends to lend and has loaned money to residential homebuilders to develop undeveloped land into residential building lots known as acquisition and development loans, which are also considered commercial loans.
To assist in financing these opportunities, on December 30, 2011 we obtained funding from two demand loans from our members. The total outstanding balance on these loans as of September 30, 2012 and December 31, 2011 was $1,015 and $878, respectively. These demand loans are collateralized by a lien against all of our assets. In addition, on October 4, 2012 we commenced the offering of Fixed Rate Subordinated Notes (“Notes”) to the general public pursuant to a Form S-1 Registration Statement (SEC File No. 333-181360). The Notes are junior in right of payment to the demand loans.
Critical Accounting Estimates
To assist you in evaluating our condensed consolidated financial statements, we describe below the critical accounting estimates. We consider an accounting estimate to be critical if: (1) the accounting estimate requires us to make assumptions about matters that were highly uncertain at the time the accounting estimate was made, and (2) changes in the estimate that are reasonably likely to occur from period to period, or use of different estimates that we reasonably could have used would have a material impact on our consolidated financial condition or results of operations.
Loan Losses
Nature of estimates required
Loan losses are accounted for both on the condensed consolidated balance sheets and the condensed consolidated statements of operations. On the condensed consolidated statements of operations, management estimates the amount of losses to capture during the current year; this current period amount incurred is referred to as the loan loss provision. The calculation of our allowance for loan losses, which appears on our condensed consolidated balance sheets, requires us to compile relevant data for use in a systematic approach to assess and estimate the amount of probable losses inherent in our commercial lending operations and to reflect that estimated risk in our allowance calculations. The risk of losses occurs when customers cannot pay their principal and interest due. In the past, we have estimated that risk to be minimal, and therefore have not proceeded to compare the value of the collateral versus the amount lent. For current and future loans, we use the policy summarized as follows:
For loans to one borrower with committed balances less than 10% of our total committed balances on all loans extended to all customers, we analyze for impairment all loans which are more than 60 days past due at the end of a quarter. For loans to one borrower with committed balances equal to or greater than 10% of our total committed balances on all loans extended to all customers, we analyze all loans for impairment. The analysis on loans, if required, develops a collateral value to be compared to the principal amount of the loan. If the value determined is less than the principal amount due (less any builder deposit), then the difference is included in the loan loss. As values change, estimated loan losses may be provided for more or less than the previous period, and some loans may not need a loss provision based on payment history. For homes which are partially complete, we appraise on an as-is and completed basis, and use the one that more closely aligns with our planned method of disposal for the property.
For loans that are individually evaluated for impairment, appraisals have been prepared within the last 13 months. There are also broker’s opinions of value (“BOV”) prepared, if the appraisal is more than six months old. The lower of any BOV prepared in the last six months, or appraisal in the last 13 months is used, unless we determine a BOV to be invalid based on the comparable sales used. If we determine a BOV to be invalid, we will use the appraised value. Appraised values are adjusted down for costs associated with asset disposal.
| 17 |
Appraisers are state certified and are selected by first attempting to utilize the appraiser who completed the original appraisal report. If that appraiser is unavailable or not affordable, we use another appraiser who appraises routinely in that geographic area. BOVs are created by real estate agents. We try to first select an agent we have worked with, and then, if that fails, we select another agent who works in that geographic area.
Due to the fact that all loans have been individually analyzed for impairment and that the loans are performing, we recorded neither an allowance for loan loss nor any loan loss provision.
Accounting and Auditing Standards Applicable to “Emerging Growth Companies”
We are an “emerging growth company” under the recently enacted JOBS Act. For as long as we are an “emerging growth company,” which may be up to five fiscal years, we are not required to (1) comply with any new or revised financial accounting standards that have different effective dates for public and private companies until those standards would otherwise apply to private companies, (2) provide an auditor’s attestation report on management’s assessment of the effectiveness of internal control over financial reporting pursuant to Section 404 of the Sarbanes-Oxley Act, (3) comply with any new requirements adopted by the Public Company Accounting Oversight Board, or the PCAOB, requiring mandatory audit firm rotation or a supplement to the auditor’s report in which the auditor would be required to provide additional information about the audit and the financial statements of the issuer or (4) comply with any new audit rules adopted by the PCAOB after April 5, 2012, unless the SEC determines otherwise. We intend to take advantage of such extended transition period. Since we will not be required to comply with new or revised accounting standards on the relevant dates on which adoption of such standards is required for other public companies, our financial statements may not be comparable to the financial statements of companies that comply with public company effective dates. If we were to subsequently elect to instead comply with these public company effective dates, such election would be irrevocable pursuant to Section 107 of the JOBS Act.
Consolidated Results of Operations
For a more complete understanding of our industry, the drivers of our business, and our current period results, you should read this discussion in conjunction with our condensed consolidated financial statements, including the related notes and the other information contained in this report. Additionally, our condensed consolidated financial statements reflect the information regarding the direct financing lease component as discontinued operations. Unless otherwise indicated, the condensed consolidated balance sheets, statements of operations and cash flows associated with the disposal group have been presented in the condensed consolidated financial statements separately from continuing operations. A summary of our income statement for the following periods is:
| For the | ||||||||||||||||
(in thousands of dollars) | Three Months Ended September 30, 2012 | Three Months Ended September 30, 2011 | Nine Months Ended September 30, 2012 | Nine Months Ended September 30, 2011 | ||||||||||||
| Interest Income | ||||||||||||||||
| Interest and fee income on loans | $ | 142 | $ | – | $ | 444 | $ | – | ||||||||
| Interest expense | 30 | – | 86 | – | ||||||||||||
| Net interest income (loss) | 112 | – | 358 | – | ||||||||||||
| Less: Loan loss provision | – | – | – | – | ||||||||||||
| Net interest income | 112 | – | 358 | – | ||||||||||||
| Non-Interest Expense | ||||||||||||||||
| Selling, general and administrative | 78 | – | 258 | – | ||||||||||||
| Total non-interest expense | 78 | – | 258 | – | ||||||||||||
| Income (loss) from continuing operations | 34 | – | 100 | – | ||||||||||||
| Income from discontinued operations, net | – | 70 | – | 309 | ||||||||||||
| Net income | $ | 34 | $ | 70 | $ | 100 | $ | 309 | ||||||||
Interest Spread
· Difference between the interest rate received (on our loan assets) and the interest rate paid (on our borrowings). The loans originated in December of 2011 have interest rates which are based on our cost of funds, with a minimum cost of funds of 5%. The spread is fixed at 2%. Future loans are anticipated to be originated at approximately the same 2% spread.
| 18 |
· Fee income. The two loans originated in December 2011 had a net origination fee of $924. This fee is being recognized over the life of the loans. The fee income recognized in 2012 was $52 and $166 for the three and nine month periods ended September 30, respectively. We had no fee income during the first nine months of 2011, due to the initiation of our new business plan late in 2011. In the future, we anticipate creating loans with fees ranging between 4 to 5% of the maximum loan amount.
· Amount of nonperforming assets. We had no nonperforming loan assets at September 30, 2012 and December 31, 2011.
The following table displays details on our interest income and shows our interest spread:
| For the | ||||||||||||||||||||||||||||
| Three Months Ended September 30, 2012 | Three Months Ended September 30, 2011 | Nine Months Ended September 30, 2012 | Nine Months Ended September 30, 2011 | |||||||||||||||||||||||||
| Interest Income | * | * | * | * | ||||||||||||||||||||||||
| Interest income on loans | $ | 90 | 7% | $ | – | – | $ | 278 | 7% | $ | – | |||||||||||||||||
| Fee income on loans | 52 | 4% | – | – | 166 | 4% | – | |||||||||||||||||||||
| Interest and fee income on loans | $ | 142 | 11% | – | – | $ | 444 | 11% | – | |||||||||||||||||||
| Interest expense | 30 | 2% | – | – | 86 | 2% | – | |||||||||||||||||||||
| Net interest income (spread) | 112 | 9% | – | – | 358 | 9% | – | |||||||||||||||||||||
| Weighted average outstanding loan balance | $ | 5,089 | – | $ | 5,304 | – | ||||||||||||||||||||||
*annualized number as percentage of weighted average outstanding loan balance
Our operations for most of 2011 are classified as discontinued operations. We derive interest income and pay interest expense related to the loans originated and demand loans obtained from our members, respectively. Our operations from the fourth quarter of 2011 and all of 2012 are classified as continuing operations.
We calculate interest spread by taking the difference between interest income (including fee income) and expense and dividing it by our weighted average outstanding loan balance. We anticipate interest spread for the rest of 2012 and for 2013 to continue at roughly the same percentage (9%).
Loan Loss Provision
During our existence to date, we have not held any nonperforming loans and have incurred no loan losses; this is unlikely to continue. We anticipate a loan loss provision in the future.
SG&A Expenses
The following table displays details on our SG&A Expenses:
| For the | ||||||||||||||||
(in thousands of dollars) | Three Months Ended September 30, 2012 | Three Months Ended September 30, 2011 | Nine Months Ended September 30, 2012 | Nine Months Ended September 30, 2011 | ||||||||||||
| Selling, general and administrative expenses | ||||||||||||||||
| Legal and Accounting | $ | 9 | $ | – | $ | 148 | $ | – | ||||||||
| Salaries and related expenses | 40 | – | 40 | – | ||||||||||||
| Board related expenses | 19 | – | 39 | – | ||||||||||||
| Other | 10 | – | 31 | – | ||||||||||||
| Total SG&A | $ | 78 | – | $ | 258 | – | ||||||||||
| 19 |
The 2011 SG&A expenses reclassified to discontinued operations totaled $22 and $69 for the three months and nine months ended September 30, 2011, respectively. We anticipate increases in our operational costs, including anticipated additions of personnel related to lending, underwriting, salaries and benefits, and other administrative costs. We anticipate an increase in our outside party expenses. We also expect increased costs from becoming a public company. Therefore, we anticipate our SG&A expenses to increase significantly in the fourth quarter of 2012 and into 2013.
Income from Discontinued Operations, Net
The income from discontinued operations consisted of the following:
| For the | ||||||||||||||||
(in thousands of dollars) | Three Months Ended September 30, 2012 | Three Months Ended September 30, 2011 | Nine Months Ended September 30, 2012 | Nine Months Ended September 30, 2011 | ||||||||||||
| Interest income on direct financing leases | $ | – | $ | 153 | $ | – | $ | 638 | ||||||||
| Selling, general and administrative expenses | – | 22 | – | 69 | ||||||||||||
| Interest expense | – | 61 | – | 260 | ||||||||||||
| Income from discontinued operations | $ | – | $ | 70 | $ | – | $ | 309 | ||||||||
All of the operations and assets and liabilities associated with the direct financing, commercial real estate leases were sold for a sales price that approximated net carrying value at the time of sale; therefore, there was no gain or loss on the disposal of the discontinued operations in 2011.
The commercial real estate leases we originated in 2007 had no fee income but earned an interest rate spread of 3%.
Consolidated Financial Position
Deferred Offering Costs
We have been working on registering with the SEC and various states to register the Notes for sale. These expenses were deferred until the offering became effective, which occurred on October 4, 2012. The deferred offering costs were $508 and $0 as of September 30, 2012 and December 31, 2011, respectively. They will be expensed over the life of the debt associated with the offering.
Loans Receivable
In December of 2011, we extended new loans, which, net of unearned loan fees, were valued at $4,242 and $4,580 as of September 30, 2012 and December 31, 2011, respectively. These loans were all to third party borrowers that are affiliated with each other, and are cross-collateralized. The loan balance decreased due to lot payoffs, partially offset by draws for development and the reduction in unearned loan fee. No allowance has been deemed necessary for the loans issued in 2011. We expect that we will increase our loans receivable as we raise funds from the issuance of Notes.
Roll forward of commercial loans:
| Nine Months Ended September 30, 2012 | Year Ended December 31, 2011 | Nine Months Ended September 30, 2011 | ||||||||||
| Beginning balance | $ | 4,580 | $ | – | $ | – | ||||||
| Additions | 300 | 4,580 | – | |||||||||
| Payoffs/Sales | (804 | ) | – | – | ||||||||
| Unearned loan fee | 166 | – | – | |||||||||
| Ending balance | $ | 4,242 | $ | 4,580 | $ | – | ||||||
| 20 |
The loans created in 2011 had a $1,000 loan fee. The expenses incurred related to issuing the loan were approximately $76, which were netted against the loan amount. The remaining $924, which is netted against the gross loan amount, is being spread over the expected life of the loan based on the maximum monthly allowed loan balance. The unearned loan fee was $758 and $924 as of September 30, 2012 and December 31, 2011, respectively.
While the remaining balance of the unearned loan fee related to our existing loans will decline to $0 over the life of those loans, we expect total unearned loan fees to increase along with our commercial lending program.
Aging schedule of loans receivable as of September 30, 2012, on a recency basis:
| No. Accts. | Unpaid Balances | % | ||||||||||
| Current loans (current accounts and accounts on which more than 50% of an original contract payment was made in the last 59 days) | 3 | $ | 5,000 | 100% | ||||||||
| 60-89 days | – | – | 0% | |||||||||
| 90-179 days | – | – | 0% | |||||||||
| 180-269 days | – | – | 0% | |||||||||
| Subtotal | 3 | $ | 5,000 | 100% | ||||||||
| Interest only accounts (Accounts on which interest, deferment, extension and/or default charges were received in the last 60 days) | – | $ | – | 0% | ||||||||
| Partial Payment accounts (Accounts on which the total received in the last 60 days was less than 50% of the original contractual monthly payment. “Total received” to include interest on simple interest accounts, as well as late charges on deferment charges on precomputed accounts.) | – | $ | – | 0% | ||||||||
| Total | 3 | $ | 5,000 | 100% | ||||||||
Aging schedule of loans receivable as of September 30, 2012, on a contractual basis:
| No. Accts. | Unpaid Balances | % | ||||||||||
| Contractual Terms - All current Direct Loans and Sales Finance Contracts with installments past due less than 60 days from due date. | 3 | $ | 5,000 | 100% | ||||||||
| 60-89 days | – | – | 0% | |||||||||
| 90-179 days | – | – | 0% | |||||||||
| 180-269 days | – | – | 0% | |||||||||
| Subtotal | 3 | $ | 5,000 | 100% | ||||||||
| Interest only accounts (Accounts on which interest, deferment, extension and/or default charges were received in the last 60 days) | – | $ | – | 0% | ||||||||
| Partial Payment accounts (Accounts on which the total received in the last 60 days was less than 50% of the original contractual monthly payment. “Total received” to include interest on simple interest accounts, as well as late charges on deferment charges on precomputed accounts.) | – | $ | – | 0% | ||||||||
| Total | 3 | $ | 5,000 | 100% | ||||||||
| 21 |
Aging schedule of loans receivable as of December 31, 2011, on a recency basis:
| No. Accts. | Unpaid Balances | % | ||||||||||
| Current loans (current accounts and accounts on which more than 50% of an original contract payment was made in the last 59 days) | 3 | $ | 5,504 | 100% | ||||||||
| 60-89 days | – | – | 0% | |||||||||
| 90-179 days | – | – | 0% | |||||||||
| 180-269 days | – | – | 0% | |||||||||
| Subtotal | 3 | $ | 5,504 | 100% | ||||||||
| Interest only accounts (Accounts on which interest, deferment, extension and/or default charges were received in the last 60 days) | – | $ | – | 0% | ||||||||
| Partial Payment accounts (Accounts on which the total received in the last 60 days was less than 50% of the original contractual monthly payment. “Total received” to include interest on simple interest accounts, as well as late charges on deferment charges on precomputed accounts.) | – | $ | – | 0% | ||||||||
| Total | 3 | $ | 5,504 | 100% | ||||||||
Aging schedule of loans receivable as of December 31, 2011, on a contractual basis:
| No. Accts. | Unpaid Balances | % | ||||||||||
| Contractual Terms - All current Direct Loans and Sales Finance Contracts with installments past due less than 60 days from due date. | 3 | $ | 5,504 | 100% | ||||||||
| 60-89 days | – | – | 0% | |||||||||
| 90-179 days | – | – | 0% | |||||||||
| 180-269 days | – | – | 0% | |||||||||
| Subtotal | 3 | $ | 5,504 | 100% | ||||||||
| Interest only accounts (Accounts on which interest, deferment, extension and/or default charges were received in the last 60 days) | – | $ | – | 0% | ||||||||
| Partial Payment accounts (Accounts on which the total received in the last 60 days was less than 50% of the original contractual monthly payment. “Total received” to include interest on simple interest accounts, as well as late charges on deferment charges on precomputed accounts.) | – | $ | – | 0% | ||||||||
| Total | 3 | $ | 5,504 | 100% | ||||||||
Customer Interest Escrow
The loans we extended in December of 2011 called for a funded Interest Escrow account, with funds borrowed against the properties as part of the loan balance. The initial funding on that Interest Escrow was $450. The balance as of September 30, 2012 and December 31, 2011 was $324 and $450, respectively. To the extent the balance is available in the Interest Escrow, interest due on certain loans is deducted from the Interest Escrow on the date due. The Interest Escrow is increased by 10% of lot payoffs on the same loans, and by interest on the note payable, unsecured on our balance sheet as of September 30, 2012. All of these transactions are noncash to the extent that the total escrow amount does not need additional funding. The Interest Escrow is also used to contribute to the reduction of the $400 subordinated mortgage upon certain lot sales of the collateral of that loan. In the nine months ended September 30, 2012, the Interest Escrow was reduced by $251 for interest due on loans, and $12 to reduce the balance on the $400 subordinated mortgage. The Interest Escrow was increased by $50 for interest on the note payable, unsecured and $87 from lot payoffs.
| 22 |
Note Payable Unsecured
At the same time that we extended the new loans on December 30, 2011, we assumed a note payable to our borrowing customer for $1,500, which was the balance at both September 30, 2012 and December 31, 2011. This loan is unsecured and has the same priority as the Notes. It is also collateral for the loans we extended to this customer. We expect our Note payable unsecured balance to increase as we raise funds in our Notes offering.
Note Payable Related Party
In order to minimize the amount of idle cash on our balance sheet and maximize the loans receivable which create interest spread, we have two lines of credit from affiliates, which had a combined balance as of September 30, 2012 and December 31, 2011 of $1,015 and $878, respectively. We intend to have a line(s) of credit in the future, and intend to eventually replace these lines from affiliates with lines from unrelated financial institutions. However, we can make no assurance that we will obtain a line of credit with an unrelated financial institution on favorable terms or at all.
Contractual Obligations
We currently have three notes outstanding. The two notes to affiliates are demand notes established on December 30, 2011, and the total balance on these notes was $1,015 and $878 as of September 30, 2012 and December 31, 2011, respectively. The third note is an unsecured note for $1,500, which is due at the time our customer repays its debt. The balance of this note has not changed since we became the borrower on December 30, 2011.
We are obligated to lend money to customers based on agreements we have with them. We do not always have the maximum amount obligated outstanding at any given time. The amount we have not loaned, but are obligated to lend, under certain conditions is a potential liquidity use. This amount was $100 as of September 30, 2012 and $296 at the end of 2011.
Off-Balance Sheet Arrangements
Other than as noted above under “Contractual Obligations,” we do not have any off-balance sheet arrangements that have or are reasonable likely to have a current or future effect on our consolidated financial condition, results of operations, liquidity, capital expenditures, or capital resources that are considered material, other than “Contingencies and Commitments” included in Note 9 of the notes to condensed consolidated financial statements.
Liquidity and Capital Resources
Historically, we have funded our business through credit facilities with banks, borrowings from related parties, equity investments by our members and payments made pursuant to our commercial real estate leases. We anticipate funding our business primarily through a combination of proceeds from the interest and principal payments made by our customers, two demand loans from our members, the existing unsecured loan from our customer (the “SF Loan”), the issuance of Notes, a potential future line of credit from a financial institution and equity invested by our members.
Our business of borrowing money and re-lending it to generate interest spread will be a primary use of capital resources. There are several risks in any financing company of this nature, and we will discuss significant risks here and how they relate to our Company and what, if any, mitigation techniques we have or may employ.
First, any financial institution needs to match the maturities of its borrowings with the maturities of its assets. The bulk of most financial institutions’ borrowings are in the form of public investments or deposits. These generally have maturities that are either set periods of time, or upon the demand of the investor/depositor. The risk is that either obligations come due before funds are available to be paid out (a shortage of liquidity) or that funds are repaid before the obligation comes due (idle cash, as described herein). To mitigate these risks, we are not offering demand deposits (for instance, a checking account). Instead, we are offering Notes with varying maturities between one and four years, which we believe will be longer than the average life of the loans we will extend. However, we have the option to repay the Notes early if we wish without penalty. These items protect us against this risk of matching of debt and asset maturity.
| 23 |
Second, financial institutions must have daily liquidity on their debt side, to offset variations in loan balances on a daily basis. Borrowers can repay their notes at any time, and they will request draws as they are ready for them. Further, construction loans are not funded 100% initially, so there are contractual obligations on the lender’s part to fund loans in the future. Most financial institutions mitigate this risk by having a secured line of credit from the Federal Reserve Bank. We have the same risk from customer repayments and draws as banks, and we intend to mitigate this risk by having a secured line of credit with a bank. Our current debt financing consists of the two demand loans from our members and the SF Loan. The loan balance from our members on September 30, 2012 and December 31, 2011 was $1,015 and $878, respectively. The loan balance on the SF Loan was $1,500 on both September 30, 2012 and December 31, 2011. If we are able to refinance the demand loans with a bank line of credit, we intend to maintain the outstanding balance on the line at approximately 10% of our committed loan amount. Failure to refinance the demand loans in the future with a larger bank line of credit may result in a lack of liquidity, or low loan production. Future lines of credit from banks will have expiration dates or be demand loans, which will have risks associated with those maturities.
Third, financial institutions have the risk of swings in market rates on borrowing and lending, which can make borrowing money to fund loans to their customers or fund their operations costly. The rates at which institutions can borrow are not necessarily tied to the rates at which they can lend. In our case, we are lending to customers using a rate which varies monthly with our cost of funds. So while we somewhat mitigate this risk, we are still open to the problem of, at the time of originating loans, wanting to originate new loans at a rate that would make us money, but that rate not being competitive in the market. Lack of lending may cause us to repay Notes early and lose interest spread dollars, hurting our profitability and ability to repay.
In the past, we have been able to manage our liquidity, as our borrowings coincided on a one-to-one basis with our investments, but as we grow our operations, we do not anticipate this trend will continue.
We intend to generate liquidity from:
| · | borrowings in the form of the demand loans from our members; |
| · | proceeds from the Notes; |
| · | borrowings from lines of credit with banks (not in place yet); |
| · | repayments of loan receivables; |
| · | interest and fee income; |
| · | sale of property obtained through foreclosure; and |
| · | other sources as we determine in the future. |
We intend to use liquidity to:
| · | make payments on other borrowings, including loans from affiliates; |
| · | pay Notes on their scheduled due date and Notes that we are required to redeem early; |
| · | make interest payments on the Notes; and |
| · | to the extent we have remaining net proceeds and adequate cash on hand, fund any one or more of the following activities: |
| o | to extend commercial construction loans to homebuilders to build single or multi-family homes or develop lots; |
| o | to make distributions to equity owners; |
| o | for working capital and other corporate purposes; |
| o | to purchase defaulted secured debt from financial institutions at a discount; |
| 24 |
| o | to purchase defaulted unsecured debt from suppliers to homebuilders at a discount and then secure it with real estate or other collateral; |
| o | to purchase real estate, which we will operate our business in; and |
| o | to redeem Notes which we have decided to redeem prior to maturity. |
The Company’s anticipated primary sources of liquidity going forward are interest income and principal repayments related to loans it extends, as well as funds borrowed from creditors, including affiliates and Note holders. Therefore, the Company’s ability to fund its operations is dependent upon these sources of liquidity.
We generated a profit of $100 for the nine months ended September 30, 2012. Cash used during the period was approximately $9. At September 30, 2012 we had cash on hand of approximately $41 and our outstanding debt totaled $2,515, which was unsecured or payable to related parties.
Our current plan is to expand the commercial lending program by using net proceeds we receive from the Notes offering. We have anticipated the costs of this expansion and the costs of the offering, and we anticipate generating, through normal operations, the cash flows necessary to meet our operating, investing and financing requirements. The two most significant factors driving our current plans are the continued payments of principal and interest by our sole homebuilder customer and the public offering. If actual results differ materially from our current plan or if expected financing is not available, we believe we have the ability to discontinue the offering to reduce costs; we also believe we have the ability and intent to obtain funding and generate net worth through additional debt or equity infusions of cash. There can be no assurance, however, that we will be able to implement our strategies or obtain additional financing under favorable terms, if at all.
Inflation, Interest Rates, and Housing Starts
Since we are in the housing industry, we are affected by factors that impact that industry. Housing starts impact our customers’ ability to sell their homes. Faster sales mean higher effective interest rates for us, as the recognition of fees we charge is spread over a shorter period. Slower sales mean lower effective interest rates for us. Slower sales are likely to increase the default rate we experience.
Housing inflation has a positive impact on our operations. When we lend initially, we are lending a percentage of a home’s expected value, based on historical sales. If those estimates prove to be low (in an inflationary market), the percentage we loaned on the value actually decreases, reducing potential losses on defaulted loans. The opposite is true in a deflationary housing price market. It is our opinion that values are low in many of the housing markets in the U.S. today, and our lending against these values is much safer than loans made by financial institutions in 2006 to 2008. Below is a graph showing monthly median new home sales prices in the U.S. This does not represent an exact display of what happened to any particular home over 11 years. The numbers not only vary based on inflation and deflation, but also based on size of home and areas of the country where sales prices are better or worse.
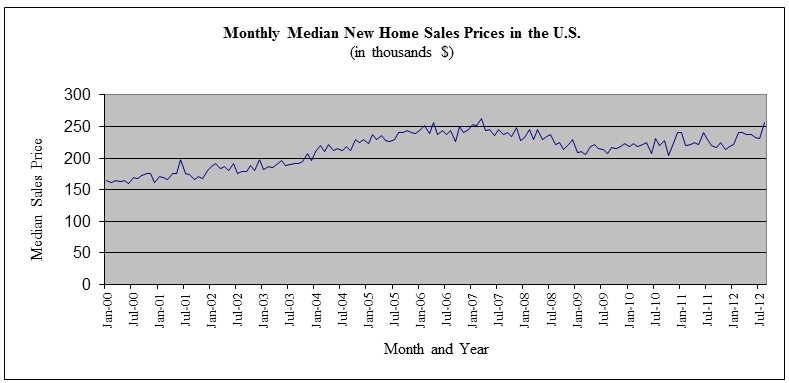
Source: U.S. Census Bureau
| 25 |
Interest rates have several impacts on our business. First, rates affect housing (starts, home size, etc.) High long term interest rates may decrease housing starts, having the effects listed above. Higher interest rates will also affect our investors. We believe that there will be a spread between the rate our Notes yield to our investors and the rates the same investors could get on deposits at FDIC insured institutions. We also believe that the spread may need to widen if these rates rise. For instance, if we pay 2% above average CD rates when CD’s are paying 0.5%, when CD’s are paying 3%, we may have to have a larger than 2% difference. This may cause our lending rates, which are based on our cost of funds, to be uncompetitive. High interest rates may also increase builder defaults, as interest payments may become a higher portion of operating costs than the builder is used to. Below is a chart showing average CD rates.
| Certificates of Deposit Index | |||||||||||||||||||||||||||||||||
| Month | 2002 | 2003 | 2004 | 2005 | 2006 | 2007 | 2008 | 2009 | 2010 | 2011 | 2012 | ||||||||||||||||||||||
| Jan | 3.363% | 1.688% | 1.132% | 1.693% | 3.674% | 5.217% | 5.145% | 2.730% | 0.488% | 0.319% | 0.313% | ||||||||||||||||||||||
| Feb | 3.077% | 1.643% | 1.113% | 1.836% | 3.837% | 5.266% | 4.958% | 2.572% | 0.407% | 0.327% | 0.315% | ||||||||||||||||||||||
| Mar | 2.828% | 1.586% | 1.098% | 1.996% | 3.996% | 5.301% | 4.748% | 2.428% | 0.337% | 0.331% | 0.316% | ||||||||||||||||||||||
| Apr | 2.607% | 1.533% | 1.085% | 2.163% | 4.158% | 5.324% | 4.543% | 2.265% | 0.288% | 0.325% | 0.321% | ||||||||||||||||||||||
| May | 2.423% | 1.483% | 1.083% | 2.332% | 4.318% | 5.338% | 4.323% | 2.091% | 0.278% | 0.305% | 0.328% | ||||||||||||||||||||||
| Jun | 2.263% | 1.419% | 1.118% | 2.492% | 4.483% | 5.336% | 4.108% | 1.893% | 0.288% | 0.280% | 0.336% | ||||||||||||||||||||||
| Jul | 2.107% | 1.358% | 1.162% | 2.658% | 4.640% | 5.324% | 3.898% | 1.690% | 0.293% | 0.266% | 0.341% | ||||||||||||||||||||||
| Aug | 1.961% | 1.303% | 1.212% | 2.833% | 4.774% | 5.333% | 3.673% | 1.483% | 0.295% | 0.263% | 0.338% | ||||||||||||||||||||||
| Sep | 1.868% | 1.247% | 1.277% | 3.000% | 4.897% | 5.343% | 3.517% | 1.204% | 0.298% | 0.268% | 0.331% | ||||||||||||||||||||||
| Oct | 1.820% | 1.194% | 1.355% | 3.174% | 4.997% | 5.323% | 3.453% | 0.864% | 0.300% | 0.276% | |||||||||||||||||||||||
| Nov | 1.767% | 1.171% | 1.451% | 3.345% | 5.081% | 5.293% | 3.236% | 0.685% | 0.305% | 0.288% | |||||||||||||||||||||||
| Dec | 1.726% | 1.151% | 1.563% | 3.512% | 5.153% | 5.268% | 2.965% | 0.556% | 0.312% | 0.304% | |||||||||||||||||||||||
| Copyright 2012 MoneyCafe.com | |||||||||||||||||||||||||||||||||
Source: Derivation of Rates Reported by Federal Reserve Board
Housing prices are also generally correlated with housing starts, so that increases in housing starts usually coincide with increases in housing values, and the reverse is generally true. Below is a graph showing single family housing starts from 2000 through 2012.
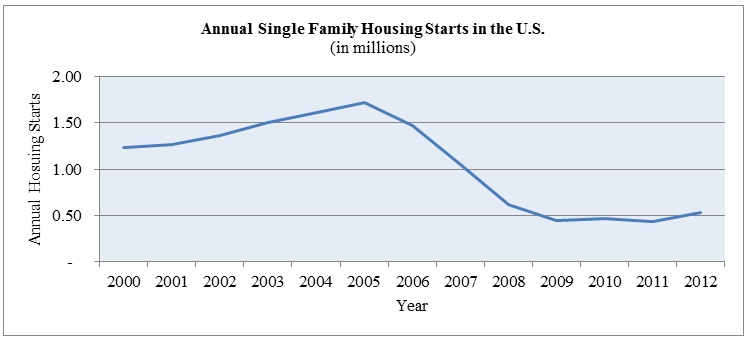
Source: U.S. Census Bureau
| 26 |
ITEM 3. QUANTITATIVE AND QUALITATIVE DISCLOSURE ABOUT MARKET RISK
We are a smaller reporting company as defined by Rule 12b-2 of the Securities Exchange Act of 1934 and are not required to provide the information under this item.
ITEM 4. CONTROLS AND PROCEDURES
Disclosure Controls and Procedures
As of the end of the period covered by this report our chief executive officer (our principal executive officer and principal financial officer) evaluated the effectiveness of the design and operation of our disclosure controls and procedures. Based upon, and as of the date of, the evaluation, our chief executive officer (our principal executive officer and principal financial officer) concluded that the disclosure controls and procedures were effective as of the end of the period covered by this report to ensure that information required to be disclosed in the reports we file and submit under the Securities Exchange Act of 1934, as amended (the “Exchange Act”), is recorded, processed, summarized and reported as and when required. Disclosure controls and procedures include, without limitation, controls and procedures designed to ensure that information required to be disclosed by us in the reports we file and submit under the Exchange Act is accumulated and communicated to our management, including our chief executive officer (our principal executive officer and principal financial officer), as appropriate to allow timely decisions regarding required disclosure.
Internal Control over Financial Reporting
There have been no changes in our internal control over financial reporting that occurred during the quarter ended September 30, 2012 that have materially affected, or are reasonably likely to materially affect, our internal control over financial reporting.
| 27 |
PART II - OTHER INFORMATION
ITEM 1. LEGAL PROCEEDINGS
None.
ITEM 1A. RISK FACTORS
Not applicable.
ITEM 2. UNREGISTERED SALES OF EQUITY SECURITIES AND USE OF PROCEEDS
| (a) | None. |
| (b) | We registered up to $700,000,000 in Fixed Rate Subordinated Notes in our public offering (SEC File No. 333-181360, effective October 4, 2012). Because our public offering had not commenced as of September 30, 2012, we had issued no Notes pursuant to our public offering. |
| (c) | None. |
ITEM 3. DEFAULTS UPON SENIOR SECURITIES
None.
ITEM 4. MINE SAFETY DISCLOSURES
Not applicable.
ITEM 5. OTHER INFORMATION
| (a) | During the quarter ended September 30, 2012, there was no information required to be disclosed in a report on Form 8-K which was not disclosed in a report on Form 8-K. |
| (b) | During the quarter ended September 30, 2012, there were no material changes to the procedures by which members may recommend nominees to our board of managers. |
ITEM 6. EXHIBITS
The exhibits required to be filed with this report are set forth on the Exhibit Index hereto and incorporated by reference herein.
| 28 |
SIGNATURES
Pursuant to the requirements of the Securities Exchange Act of 1934, the Registrant has duly caused this report to be signed on its behalf by the undersigned thereunto duly authorized.
|
SHEPHERD’S FINANCE, LLC (Registrant) | ||
| Dated: November 13, 2012 | By: |
/s/ Daniel M. Wallach |
| Daniel M. Wallach | ||
|
Chief Executive Officer and Manager
| ||
| 29 |
EXHIBIT INDEX
The following exhibits are included in this report on Form 10-Q for the period ended September 30, 2012 (and are numbered in accordance with Item 601 of Regulation S-K).
| Exhibit No. | Name of Exhibit | |||
| 3.1 | Certificate of Conversion, incorporated by reference to Exhibit 3.1 to the Company’s Registration Statement on Form S-1, filed on May 11, 2012, Commission File No. 333-181360 | |||
| 3.2 | Certificate of Formation, incorporated by reference to Exhibit 3.2 to the Company’s Registration Statement on Form S-1, filed on May 11, 2012, Commission File No. 333-181360 | |||
| 3.3 | Amended and Restated Operating Agreement, incorporated by reference to Exhibit 3.3 to the Company’s Registration Statement on Form S-1, filed on May 11, 2012, Commission File No. 333-181360 | |||
| 4.1 | * | Indenture Agreement (including Form of Note) dated October 4, 2012 | ||
| 31.1 | * | Certification of Principal Executive Officer and Principal Financial Officer, pursuant to Section 302 of the Sarbanes-Oxley Act of 2002 | ||
| 32.1 | * | Certification of Principal Executive Officer and Principal Financial Officer, pursuant to 18 U.S.C. Section 1350, as created by Section 906 of the Sarbanes-Oxley Act of 2002 | ||
| 101.INS | ** | XBRL Instance Document | ||
| 101.SCH | ** | XBRL Schema Document | ||
| 101.CAL | ** | XBRL Calculation Linkbase Document | ||
| 101.DEF | ** | XBRL Definition Linkbase Document | ||
| 101.LAB | ** | XBRL Label Linkbase Document | ||
| 101.PRE | ** | XBRL Presentation Linkbase Document |
___________________
* Filed herewith.
**Pursuant to Regulation 406T of Regulation S-T, these Interactive data files are deemed not filed or part of a registration statement or prospectus for purposes of Section 11 or 12 of the Securities Act of 1933, as amended, or Section 18 of the Securities Exchange Act of 1934, as amended, and are otherwise not subject to liability.
| 30 |