Attached files
| file | filename |
|---|---|
| EX-32.2 - Shepherd's Finance, LLC | ex32-2.htm |
| EX-32.1 - Shepherd's Finance, LLC | ex32-1.htm |
| EX-31.2 - Shepherd's Finance, LLC | ex31-2.htm |
| EX-31.1 - Shepherd's Finance, LLC | ex31-1.htm |
| EX-10.2 - Shepherd's Finance, LLC | ex10-2.htm |
| EX-10.1 - Shepherd's Finance, LLC | ex10-1.htm |
UNITED STATES
SECURITIES AND EXCHANGE COMMISSION
WASHINGTON, DC 20549
FORM 10-Q
[X] Quarterly Report Pursuant to Section 13 or 15(d) of the Securities Exchange Act of 1934
For the Quarterly Period Ended March 31, 2020
or
[ ] Transition Report Pursuant to Section 13 or 15(d) of the Securities Exchange Act of 1934
For the Transition Period From to
Commission File Number 333-224557
SHEPHERD’S FINANCE, LLC
(Exact name of registrant as specified on its charter)
| Delaware | 36-4608739 | |
| (State or other jurisdiction of | (I.R.S. Employer | |
| Incorporation or organization) | Identification No.) |
13241 Bartram Park Blvd., Suite 2401, Jacksonville, Florida 32258
(Address of principal executive offices)
(302) 752-2688
(Registrant’s telephone number including area code)
Securities registered pursuant to Section 12(b) of the Act:
| Title of Each Class | Trading Symbol(s) | Name of Each Exchange on Which Registered | ||
| None | None | None |
Indicate by check mark whether the registrant (1) has filed all reports required to be filed by section 13 or 15(d) of the Securities Exchange Act of 1934 during the preceding 12 months (or for such shorter period that the registrant was required to file such reports) and (2) has been subject to such filing requirements for the past 90 days. Yes [X] No [ ]
Indicate by check mark whether the registrant has submitted electronically every Interactive Data File required to be submitted pursuant to Rule 405 of Regulation S-T (§232.405 of this chapter) during the preceding 12 months (or for such shorter period that the registrant was required to submit such files). Yes [X] No [ ]
Indicate by check mark whether the registrant is a large accelerated filer, an accelerated filer, a non-accelerated filer, smaller reporting company, or an emerging growth company. See the definitions of “large accelerated filer,” “accelerated filer,” “smaller reporting company,” and “emerging growth company” in Rule 12b-2 of the Exchange Act.
| Large accelerated filer | [ ] | Accelerated filer | [ ] | |
| Non-accelerated filer | [X] | Smaller reporting company | [X] | |
| Emerging growth company | [X] |
If an emerging growth company, indicate by check mark if the registrant has elected not to use the extended transition period for complying with any new or revised financial accounting standards provided pursuant to Section 13(a) of the Exchange Act. [X]
Indicate by check mark whether the registrant is a shell company (as defined in Rule 12b-2 of the Exchange Act). Yes [ ] No [X]
FORM 10-Q
SHEPHERD’S FINANCE, LLC
TABLE OF CONTENTS
| 2 |
CAUTIONARY NOTE REGARDING FORWARD-LOOKING STATEMENTS
Certain statements contained in this Form 10-Q of Shepherd’s Finance, LLC, other than historical facts, may be considered forward-looking statements within the meaning of the federal securities laws. Words such as “may,” “will,” “expect,” “anticipate,” “believe,” “estimate,” “continue,” “predict,” or other similar words identify forward-looking statements. Forward-looking statements appear in a number of places in this report, including without limitation, “Management’s Discussion and Analysis of Financial Condition and Results of Operations,” and include statements regarding our intent, belief or current expectation about, among other things, trends affecting the markets in which we operate, our business, financial condition and growth strategies. Although we believe that the expectations reflected in these forward-looking statements are based on reasonable assumptions, forward-looking statements are not guarantees of future performance and involve risks and uncertainties. These risks and uncertainties include, but are not limited to: uncertainties relating to the effects of COVID-19; the length of the COVID-19 pandemic and severity of such outbreak nationally and across the globe; the pace of recovery following the COVID-19 pandemic; general economic uncertainty in key global markets and a worsening of global economic conditions or low levels of economic growth; the rate and the pace of economic recovery following economic downturns; and those other risks described in other risk factors as outlined in our Registration Statement on Form S-1, as amended, and our Annual Report on Form 10-K. If any of the events described in “Risk Factors” occur, they could have an adverse effect on our business, consolidated financial condition, results of operations, and cash flows. For further information regarding risks and uncertainties associated with our business, and important factors that could cause our actual results to vary materially from those expressed or implied in such forward-looking statements, please refer to the factors set forth in the “Management’s Discussion and Analysis of Financial Condition and Results of Operations” and “Risk Factors” sections of the documents we file from time to time with the U.S. Securities and Exchange Commission, including, but not limited to, our Annual Report on Form 10-K for the year ended December 31, 2019.
When considering forward-looking statements, you should keep these risk factors, as well as the other cautionary statements in this report and in our Annual Report on Form 10-K for the year ended December 31, 2019 in mind. You should not place undue reliance on any forward-looking statement. We are not obligated to update forward-looking statements.
| 3 |
PART I – FINANCIAL INFORMATION
Interim Condensed Consolidated Balance Sheets
| (in thousands of dollars) | March 31, 2020 | December 31, 2019 | ||||||
| (Unaudited) | ||||||||
| Assets | ||||||||
| Cash and cash equivalents | $ | 3,341 | $ | 1,883 | ||||
| Accrued interest receivable | 1,162 | 1,031 | ||||||
| Loans receivable, net | 54,197 | 55,369 | ||||||
| Foreclosed assets | 5,031 | 4,916 | ||||||
| Premises and equipment | 928 | 936 | ||||||
| Other assets | 210 | 202 | ||||||
| Total assets | $ | 64,869 | $ | 64,337 | ||||
| Liabilities and Members’ Capital | ||||||||
| Customer interest escrow | $ | 681 | $ | 643 | ||||
| Accounts payable and accrued expenses | 304 | 466 | ||||||
| Accrued interest payable | 2,414 | 2,533 | ||||||
| Notes payable secured, net of deferred financing costs | 26,054 | 26,991 | ||||||
| Notes payable unsecured, net of deferred financing costs | 28,416 | 26,520 | ||||||
| Due to preferred equity member | 37 | 37 | ||||||
| Total liabilities | $ | 57,906 | $ | 57,190 | ||||
| Commitments and Contingencies (Note 9) | ||||||||
| Redeemable Preferred Equity | ||||||||
| Series C preferred equity | $ | 3,036 | $ | 2,959 | ||||
| Members’ Capital | ||||||||
| Series B preferred equity | 1,470 | 1,470 | ||||||
| Class A common equity | 2,457 | 2,718 | ||||||
| Members’ capital | $ | 3,927 | $ | 4,188 | ||||
| Total liabilities, redeemable preferred equity and members’ capital | $ | 64,869 | $ | 64,337 | ||||
The accompanying notes are an integral part of these interim condensed consolidated financial statements.
| 4 |
Interim Condensed Consolidated Statements of Operations - Unaudited
For the Three Months ended March 31, 2020 and 2019
| Three Months Ended | ||||||||
| March 31, | ||||||||
| (in thousands of dollars) | 2020 | 2019 | ||||||
| Net Interest Income | ||||||||
| Interest and fee income on loans | $ | 2,574 | $ | 2,432 | ||||
| Interest expense: | ||||||||
| Interest related to secured borrowings | 817 | 681 | ||||||
| Interest related to unsecured borrowings | 767 | 625 | ||||||
| Interest expense | $ | 1,584 | $ | 1,306 | ||||
| Net interest income | 990 | 1,126 | ||||||
| Less: Loan loss provision | 35 | 47 | ||||||
| Net interest income after loan loss provision | 955 | 1,079 | ||||||
| Non-Interest Income | ||||||||
| Gain on foreclosure of assets | $ | - | $ | - | ||||
| Total non-interest income | - | - | ||||||
| Income | 955 | 1,079 | ||||||
| Non-Interest Expense | ||||||||
| Selling, general and administrative | $ | 708 | $ | 624 | ||||
| Depreciation and amortization | 21 | 23 | ||||||
| Loss on the sale of foreclosed assets | 35 | - | ||||||
| Impairment loss on foreclosed assets | 109 | 80 | ||||||
| Total non-interest expense | 873 | 727 | ||||||
| Net income | $ | 82 | $ | 352 | ||||
| Earned distribution to preferred equity holders | 126 | 105 | ||||||
| Net income attributable to common equity holders | $ | (44 | ) | $ | 247 | |||
The accompanying notes are an integral part of these interim condensed consolidated financial statements.
| 5 |
Interim Condensed Consolidated Statements of Changes in Members’ Capital - Unaudited
For the Three Months Ended March 31, 2020 and 2019
| (in thousands of dollars) | March 31, 2020 | March 31, 2019 | ||||||
| Members’ capital, beginning balance | $ | 4,188 | $ | 3,697 | ||||
| Net income less distributions to Series C preferred equity holders of $89 and $72 | (7 | ) | 280 | |||||
| Contributions from Series B preferred equity holders | - | 60 | ||||||
| Earned distributions to Series B preferred equity holders | (37 | ) | (33 | ) | ||||
| Distributions to common equity holders | (217 | ) | - | |||||
| Members’ capital, ending balance | $ | 3,927 | $ | 4,004 | ||||
The accompanying notes are an integral part of the interim condensed consolidated financial statements.
| 6 |
Interim Condensed Consolidated Statements of Cash Flows - Unaudited
For the Three Months Ended March 31, 2020 and 2019
Three Months Ended March 31, |
||||||||
| (in thousands of dollars) | 2020 | 2019 | ||||||
| Cash flows from operations | ||||||||
| Net income | $ | 82 | $ | 352 | ||||
| Adjustments to reconcile net income to net cash provided by operating activities | ||||||||
| Amortization of deferred financing costs | 40 | 65 | ||||||
| Provision for loan losses | 35 | 47 | ||||||
| Change in loan origination fees, net | (191 | ) | 59 | |||||
| Loss on sale of foreclosed assets | 35 | - | ||||||
| Impairment of foreclosed assets | 109 | 80 | ||||||
| Depreciation and amortization | 21 | 20 | ||||||
| Net change in operating assets and liabilities: | ||||||||
| Other assets | (21 | ) | 58 | |||||
| Accrued interest receivable | (131 | ) | (129 | ) | ||||
| Customer interest escrow | 1 | 350 | ||||||
| Accrued interest payable | (119 | ) | (48 | ) | ||||
| Accounts payable and accrued expenses | (162 | ) | (137 | ) | ||||
| Net cash (used in) provided by operating activities | (302 | ) | 717 | |||||
| Cash flows from investing activities | ||||||||
| Loan additions and principal collections, net | 1,328 | (3,606 | ) | |||||
| Investment in foreclosed assets | (444 | ) | (176 | ) | ||||
| Proceeds from the sale of foreclosed assets | 185 | - | ||||||
| Net cash provided by (used in) investing activities | 1,069 | (3,782 | ) | |||||
| Cash flows from financing activities | ||||||||
| Contributions from preferred equity holders | - | 60 | ||||||
| Distributions to preferred equity holders | (12 | ) | (32 | ) | ||||
| Distributions to common equity holders | (217 | ) | - | |||||
| Proceeds from secured note payable | 4,084 | 5,262 | ||||||
| Repayments of secured note payable | (4,390 | ) | (2,459 | ) | ||||
| Proceeds from unsecured notes payable | 5,261 | 3,925 | ||||||
| Redemptions/repayments of unsecured notes payable | (3,959 | ) | (3,087 | ) | ||||
| Deferred financing costs paid | (77 | ) | (93 | ) | ||||
| Net cash provided by financing activities | 691 | 3,576 | ||||||
| Net increase in cash and cash equivalents | 1,458 | 511 | ||||||
| Cash and cash equivalents | ||||||||
| Beginning of period | 1,883 | 1,401 | ||||||
| End of period | $ | 3,341 | $ | 1,912 | ||||
| Supplemental disclosure of cash flow information | ||||||||
| Cash paid for interest | $ | 1,703 | $ | 1,348 | ||||
| Non-cash investing and financing activities | ||||||||
| Reinvested earnings of Series B preferred equity held in interest escrow | $ | 37 | $ | 34 | ||||
| Earned but not paid distributions of Series C preferred equity holders | $ | 89 | $ | 72 | ||||
| Secured transferred to unsecured notes payable | $ | 631 | $ | - | ||||
| Reclassification of deferred financing costs from other assets | $ | - | $ | 189 | ||||
The accompanying notes are an integral part of these interim condensed consolidated financial statements.
| 7 |
Notes to Interim Condensed Consolidated Financial Statements (unaudited)
Information presented throughout these notes to the interim condensed consolidated financial statements (unaudited) is in thousands of dollars.
1. Description of Business and Basis of Presentation
Description of Business
Shepherd’s Finance, LLC and subsidiary (the “Company”) was originally formed as a Pennsylvania limited liability company on May 10, 2007. The Company is the sole member of a consolidating subsidiary, 84 REPA, LLC. The Company operates pursuant to its Second Amended and Restated Operating Agreement, as amended, by and among Daniel M. Wallach and the other members of the Company effective as of March 16, 2017.
As of March 31, 2020, the Company extends commercial loans to residential homebuilders (in 21 states) to:
| ● | construct single family homes, | |
| ● | develop undeveloped land into residential building lots, and | |
| ● | purchase and improve for sale older homes. |
Basis of Presentation
The accompanying (a) interim condensed consolidated balance sheet as of March 31, 2020, which has been derived from audited consolidated financial statements, and (b) unaudited interim condensed consolidated financial statements have been prepared in accordance with accounting principles generally accepted in the United States of America (“U.S. GAAP”) for interim financial information, the instructions to Form 10-Q and Article 8 of Regulation S-X. While certain information and disclosures normally included in financial statements prepared in accordance with U.S. GAAP have been condensed or omitted pursuant to the rules and regulations of the Securities and Exchange Commission (“SEC”), management believes that the disclosures herein are adequate to make the unaudited interim condensed consolidated information presented not misleading. In the opinion of management, the unaudited interim condensed consolidated financial statements reflect all adjustments necessary for a fair presentation of the consolidated financial position, results of operations, and cash flows for the periods presented. Such adjustments are of a normal, recurring nature. The consolidated results of operations for any interim period are not necessarily indicative of results expected for the fiscal year ending December 31, 2020. These unaudited interim condensed consolidated financial statements should be read in conjunction with the 2019 consolidated financial statements and notes thereto (the “2019 Financial Statements”) included in the Company’s Annual Report on Form 10-K for the year ended December 31, 2019 (the “2019 Form 10-K”). The accounting policies followed by the Company are set forth in Note 2 – Summary of Significant Accounting Policies in the 2019 Financial Statements.
Accounting Standards to be Adopted
Financial Accounting Standards Board (“FASB”) Accounting Standards Update (“ASU”) 2016-13, “Financial Instruments-Credit Losses: Measurement of Credit Losses on Financial Instruments”. The amendments in ASU 2016-13 introduce a new current expected credit loss (“CECL”) model for certain financial assets, including mortgage loans and reinsurance receivables. The new model will not apply to debt securities classified as available-for-sale. For assets within the scope of the new model, an entity will recognize as an allowance against earnings its estimate of the contractual cash flows not expected to be collected on day one of the asset’s acquisition. The allowance may be reversed through earnings if a security recovers in value. This differs from the current impairment model, which requires recognition of credit losses when they have been incurred and recognizes a security’s subsequent recovery in value in other comprehensive income. ASU 2016-13 also makes targeted changes to the current impairment model for available-for-sale debt securities, which comprise the majority of the Company’s invested assets. Similar to the CECL model, credit loss impairments will be recorded in an allowance against earnings that may be reversed for subsequent recoveries in value. The amendments in ASU 2016-13, along with related amendments in ASU No. 2018-19 - Codification Improvements to Topic 326, Financial Instruments-Credit Losses, are effective for annual and interim periods beginning after December 15, 2019 on a modified retrospective basis. For smaller reporting companies, the effective date for annual and interim periods is January 1, 2023. The Company is reviewing its policies and processes to ensure compliance with the requirements in ASU 2016-13.
| 8 |
FASB ASU 2018-13, “Fair Value Measurement (Topic 820): Disclosure Framework – Changes to the Disclosure Requirements for Fair Value Measurement.” This ASU amends the disclosure requirements of Topic 820, Fair Value Measurement, to remove disclosure of transfers between Level 1 and Level 2 of the fair value hierarchy and to include disclosure of the range and weighted average used in Level 3 fair value measurements, among other amendments. The ASU applies to all entities that are required to provide disclosures about recurring or non-recurring fair value measurements. Amendments should be applied retrospectively to all periods presented, except for certain amendments, which should be applied prospectively for only the most recent interim or annual period presented in the initial fiscal year of adoption. The effective date for the additional disclosures for calender year-end public companies is January 1, 2020.
Reclassifications
Certain prior year amounts have been reclassified for consistency with current period presentation.
2. Fair Value
The Company had no financial instruments measured at fair value on a recurring basis as of March 31, 2020 and December 31, 2019.
The following tables present the balances of non-financial instruments measured at fair value on a non-recurring basis as of March 31, 2020 and December 31, 2019.
| Quoted
Prices in Active Markets for |
Significant Other |
Significant | ||||||||||||||||||
| March 31, 2020 | Identical | Observable | Unobservable | |||||||||||||||||
| Carrying | Estimated | Assets | Inputs | Inputs | ||||||||||||||||
| Amount | Fair Value | Level 1 | Level 2 | Level 3 | ||||||||||||||||
| Foreclosed assets | $ | 5,031 | $ | 5,031 | $ | – | $ | – | $ | 5,031 | ||||||||||
| Impaired loans, net | 1,531 | 1,531 | – | – | 1,531 | |||||||||||||||
| Total | $ | 6,562 | $ | 6,562 | $ | – | $ | – | $ | 6,562 | ||||||||||
| Quoted Prices | ||||||||||||||||||||
| in Active | Significant | |||||||||||||||||||
| Markets for | Other | Significant | ||||||||||||||||||
| December 31, 2019 | Identical | Observable | Unobservable | |||||||||||||||||
| Carrying | Estimated | Assets | Inputs | Inputs | ||||||||||||||||
| Amount | Fair Value | Level 1 | Level 2 | Level 3 | ||||||||||||||||
| Foreclosed assets | $ | 4,916 | $ | 4,916 | $ | – | $ | – | $ | 4,916 | ||||||||||
| Impaired loans, net | 1,487 | 1,487 | – | – | 1,487 | |||||||||||||||
| Total | $ | 6,403 | $ | 6,403 | $ | – | $ | – | $ | 6,403 | ||||||||||
| 9 |
The table below is a summary of fair value estimates for financial instruments:
| March 31, 2020 | December 31, 2019 | |||||||||||||||
| Carrying | Estimated | Carrying | Estimated | |||||||||||||
| Amount | Fair Value | Amount | Fair Value | |||||||||||||
| Financial Assets | ||||||||||||||||
| Cash and cash equivalents | $ | 3,341 | $ | 3,341 | $ | 1,883 | $ | 1,883 | ||||||||
| Loans receivable, net | 54,197 | 54,197 | 55,369 | 55,369 | ||||||||||||
| Accrued interest on loans | 1,162 | 1,162 | 1,031 | 1,031 | ||||||||||||
| Financial Liabilities | ||||||||||||||||
| Customer interest escrow | 681 | 681 | 643 | 643 | ||||||||||||
| Notes payable secured, net | 26,054 | 26,054 | 26,991 | 26,991 | ||||||||||||
| Notes payable unsecured, net | 28,416 | 28,416 | 26,520 | 26,520 | ||||||||||||
| Accrued interest payable | 2,414 | 2,414 | 2,533 | 2,533 | ||||||||||||
3. Financing Receivables
Financing receivables are comprised of the following as of March 31, 2020 and December 31, 2019:
| March 31, 2020 | December 31, 2019 | |||||||
| Loans receivable, gross | $ | 56,077 | $ | 57,608 | ||||
| Less: Deferred loan fees | (676 | ) | (856 | ) | ||||
| Less: Deposits | (1,149 | ) | (1,352 | ) | ||||
| Plus: Deferred origination costs | 215 | 204 | ||||||
| Less: Allowance for loan losses | (270 | ) | (235 | ) | ||||
| Loans receivable, net | $ | 54,197 | $ | 55,369 | ||||
The allowance for loan losses at March 31, 2020 is $270, of which $224 related to loans without specific reserves. At December 31, 2019, the allowance was $235, of which $230 related to loans without specific reserves. No charge-offs occurred during the quarter ended March 31, 2020. During the year ended December 31, 2019, we incurred $173 in direct charge-offs.
Commercial Construction and Development Loans
Commercial Loans – Construction Loan Portfolio Summary
As of March 31, 2020, the Company’s portfolio consisted of 218 commercial construction and nine development loans with 67 borrowers in 21 states.
The following is a summary of the loan portfolio to builders for home construction loans as of March 31, 2020 and December 31, 2019:
| Year | Number of States |
Number
Borrowers |
Number of Loans |
Value of Collateral(1) | Commitment Amount | Gross Amount Outstanding |
Loan to Value Ratio(2) |
Loan Fee | |||||||||||||||||||||||||
| 2020 | 21 | 67 | 218 | $ | 86,958 | $ | 61,420 | $ | 46,161 | 71 | %(3) | 5 | % | ||||||||||||||||||||
| 2019 | 21 | 70 | 241 | $ | 93,211 | $ | 65,273 | $ | 48,611 | 70 | %(3) | 5 | % | ||||||||||||||||||||
| (1) | The value is determined by the appraised value. |
| (2) | The loan to value ratio is calculated by taking the commitment amount and dividing by the appraised value. |
| (3) | Represents the weighted average loan to value ratio of the loans. |
| 10 |
Commercial Loans – Real Estate Development Loan Portfolio Summary
The following is a summary of our loan portfolio to builders for land development as of March 31, 2020 and December 31, 2019:
| Year | Number
of States |
Number of Borrowers |
Number of |
Gross
Value of Collateral(1) |
Commitment Amount(3) | Gross Amount Outstanding |
Loan to Value Ratio(2) |
Interest Spread | ||||||||||||||||||||||||
| 2020 | 4 | 5 | 9 | $ | 12,151 | $ | 11,066 | $ | 9,916 | 82 | %(4) | 7 | % | |||||||||||||||||||
| 2019 | 4 | 5 | 9 | $ | 13,007 | $ | 9,866 | $ | 8,997 | 69 | %(4) | 7 | % | |||||||||||||||||||
| (1) | The value is determined by the appraised value adjusted for remaining costs to be paid. For both March 31, 2020 and December 31, 2019, a portion of this collateral is $1,470 of preferred equity in our Company. In the event of a foreclosure on the property securing these loans, the portion of our collateral that is preferred equity might be difficult to sell, which may impact our ability to recover the loan balance. In addition, a portion of the collateral value is estimated based on the selling prices anticipated for the homes. |
| (2) | The loan to value ratio is calculated by taking the outstanding amount and dividing by the appraised value calculated as described above. |
| (3) | The commitment amount does not include letters of credit and cash bonds. |
| (4) | Represents the weighted average loan to value ratio of the loans. |
Credit Quality Information
The following tables present credit-related information at the “class” level in accordance with FASB ASC 310-10-50, “Disclosures about the Credit Quality of Finance Receivables and the Allowance for Credit Losses.” See our 2019 Form 10-K, as filed with the SEC, for more information.
Gross finance receivables – By risk rating:
| March 31, 2020 | December 31, 2019 | |||||||
| Pass | $ | 50,809 | $ | 53,542 | ||||
| Special mention | 3,687 | 2,571 | ||||||
| Classified – accruing | – | – | ||||||
| Classified – nonaccrual | 1,581 | 1,495 | ||||||
| Total | $ | 56,077 | $ | 57,608 | ||||
Finance Receivables – Method of impairment calculation:
| March 31, 2020 | December 31, 2019 | |||||||
| Performing loans evaluated individually | $ | 27,732 | $ | 26,233 | ||||
| Performing loans evaluated collectively | 26,764 | 29,880 | ||||||
| Non-performing loans without a specific reserve | 1,063 | 1,467 | ||||||
| Non-performing loans with a specific reserve | 518 | 28 | ||||||
| Total evaluated collectively for loan losses | $ | 56,077 | $ | 57,608 | ||||
| 11 |
As March 31, 2020 and December 31, 2019, there were no loans acquired with deteriorated credit quality.
Impaired Loans
The following is a summary of our impaired nonaccrual commercial construction loans as of March 31, 2020 and December 31, 2019.
| March 31, 2020 | December 31, 2019 | |||||||
| Unpaid principal balance (contractual obligation from customer) | $ | 1,581 | $ | 1,495 | ||||
| Charge-offs and payments applied | - | - | ||||||
| Gross value before related allowance | 1,581 | 1,495 | ||||||
| Related allowance | (50 | ) | (8 | ) | ||||
| Value after allowance | $ | 1,531 | $ | 1,487 | ||||
Concentrations
Financial instruments that potentially subject the Company to concentrations of credit risk consist principally of loans receivable. Our concentration risks for our top three customers listed by geographic real estate market are summarized in the table below:
| March 31, 2020 | December 31, 2019 | |||||||||||
| Percent of | Percent of | |||||||||||
| Borrower | Loan | Borrower | Loan | |||||||||
| City | Commitments | City | Commitments | |||||||||
| Highest concentration risk | Pittsburgh, PA | 25 | % | Pittsburgh, PA | 25 | % | ||||||
| Second highest concentration risk | Orlando, FL | 16 | % | Orlando, FL | 15 | % | ||||||
| Third highest concentration risk | Cape Coral, FL | 4 | % | Cape Coral, FL | 3 | % | ||||||
4. Foreclosed Assets
The following table is a roll forward of foreclosed assets:
Three
Months March 31, 2020 |
Year Ended December 31, 2019 |
Three
Months March 31, 2019 |
||||||||||
| Beginning balance | $ | 4,916 | $ | 5,973 | $ | 5,973 | ||||||
| Additions from loans | - | 3,352 | - | |||||||||
| Additions for construction/development | 444 | 763 | 176 | |||||||||
| Sale proceeds | (185 | ) | (4,543 | ) | - | |||||||
| Loss on sale | (35 | ) | (274 | ) | - | |||||||
| Gain on foreclosure | - | 203 | - | |||||||||
| Impairment loss on foreclosed assets | (109 | ) | (558 | ) | (80 | ) | ||||||
| Ending balance | $ | 5,031 | $ | 4,916 | $ | 6,069 | ||||||
| 12 |
5. Borrowings
The following table displays our borrowings and a ranking of priority:
| Priority Rank |
March 31, 2020 | December 31, 2019 | ||||||||
| Borrowing Source | ||||||||||
| Purchase and sale agreements and other secured borrowings | 1 | $ | 25,445 | $ | 26,806 | |||||
| Secured line of credit from affiliates | 2 | 614 | 189 | |||||||
| Unsecured line of credit (senior) | 3 | 500 | 500 | |||||||
| Other unsecured debt (senior subordinated) | 4 | 1,407 | 1,407 | |||||||
| Unsecured Notes through our public offering, gross | 5 | 21,070 | 20,308 | |||||||
| Other unsecured debt (subordinated) | 5 | 5,302 | 4,131 | |||||||
| Other unsecured debt (junior subordinated) | 6 | 590 | 590 | |||||||
| Total | $ | 54,928 | $ | 53,931 | ||||||
The following table shows the maturity of outstanding debt as of March 31, 2020:
| Year Maturing | Total
Amount Maturing |
Public Offering |
Other Unsecured |
Secured Borrowings | ||||||||||||
| 2020 | $ | 31,813 | $ | 1,949 | $ | 4,424 | $ | 25,439 | ||||||||
| 2021 | 13,006 | 11,570 | 1,420 | 16 | ||||||||||||
| 2022 | 5,225 | 3,463 | 1,746 | 16 | ||||||||||||
| 2023 | 1,027 | 821 | 189 | 17 | ||||||||||||
| 2024 and thereafter | 3,857 | 3,267 | 20 | 571 | ||||||||||||
| Total | $ | 54,928 | $ | 21,070 | $ | 7,799 | $ | 26,059 | ||||||||
Secured Borrowings
Lines of Credit
As of March 31, 2020, the Company had borrowed $614 on its lines of credit from affiliates, which have a total limit of $2,500.
Summary
Borrowings secured by loan assets are summarized below:
| March 31, 2020 | December 31, 2019 | |||||||||||||||
| Book Value of Loans which Served as Collateral | Due from Shepherd’s Finance to Loan Purchaser or Lender | Book Value of Loans which Served as Collateral |
Due from Shepherd’s Finance to Loan Purchaser or Lender | |||||||||||||
| Loan Purchaser | ||||||||||||||||
| Builder Finance | $ | 12,593 | $ | 8,428 | $ | 13,711 | $ | 9,375 | ||||||||
| S.K. Funding | 10,004 | 6,771 | 10,394 | 6,771 | ||||||||||||
| Lender | ||||||||||||||||
| Shuman | 1,798 | 1,325 | 1,785 | 1,325 | ||||||||||||
| Jeff Eppinger | 1,941 | 1,000 | 1,821 | 1,000 | ||||||||||||
| Hardy Enterprises, Inc. | 1,852 | 1,000 | 1,684 | 1,000 | ||||||||||||
| Gary Zentner | 611 | 250 | 472 | 250 | ||||||||||||
| R. Scott Summers | 1,210 | 847 | 841 | 628 | ||||||||||||
| Paul Swanson | 6,105 | 5,193 | 8,377 | 5,824 | ||||||||||||
| Total | $ | 36,114 | $ | 24,814 | $ | 39,085 | $ | 26,173 | ||||||||
| 13 |
Unsecured Borrowings
Unsecured Notes through the Public Offering (“Notes Program”)
On March 22, 2019, the Company terminated its second public offering and commenced its third public offering of fixed rate subordinated notes (the “Notes”). The effective interest rate on borrowings through our Notes Program at March 31, 2020 and December 31, 2019 was 10.68% and 10.56%, respectively, not including the amortization of deferred financing costs. We generally offer four durations at any given time, ranging from 12 to 48 months from the date of issuance. There are limited rights of early redemption. Our 36-month Note has a mandatory early redemption option, subject to certain conditions. The following table shows the roll forward of our Notes Program:
| Three
Months Ended March 31, 2020 |
Year
Ended December 31, 2019 |
Three
Months Ended March 31, 2019 |
||||||||||
| Gross Notes outstanding, beginning of period | $ | 20,308 | $ | 17,348 | $ | 17,348 | ||||||
| Notes issued | 4,722 | 11,127 | 3,532 | |||||||||
| Note repayments / redemptions | (3,960 | ) | (8,167 | ) | (2,049 | ) | ||||||
| Gross Notes outstanding, end of period | $ | 21,070 | $ | 20,308 | $ | 18,831 | ||||||
| Less deferred financing costs, net | 453 | 416 | 454 | |||||||||
| Notes outstanding, net | $ | 20,617 | $ | 19,892 | $ | 18,377 | ||||||
The following is a roll forward of deferred financing costs:
Three Months Ended March 31, 2020 |
Year Ended December 31, 2019 |
Three Months Ended March 31, 2019 |
||||||||||
| Deferred financing costs, beginning balance | $ | 786 | $ | 1,212 | $ | 1,212 | ||||||
| Additions | 77 | 365 | 282 | |||||||||
| Disposals | - | (791 | ) | – | ||||||||
| Deferred financing costs, ending balance | 863 | 786 | 1,494 | |||||||||
| Less accumulated amortization | (410 | ) | (370 | ) | (1,040 | ) | ||||||
| Deferred financing costs, net | $ | 453 | $ | 416 | $ | 454 | ||||||
| 14 |
The following is a roll forward of the accumulated amortization of deferred financing costs:
| Three Months | Year | Three Months | ||||||||||
Ended March 31, 2020 |
Ended
December 31, 2019 |
Ended March 31, 2019 |
||||||||||
| Accumulated amortization, beginning balance | $ | 370 | $ | 1,000 | $ | 1,000 | ||||||
| Additions | 40 | 161 | 40 | |||||||||
| Disposals | - | (791 | ) | - | ||||||||
| Accumulated amortization, ending balance | $ | 410 | $ | 370 | $ | 1,040 | ||||||
Other Unsecured Debts
Our other unsecured debts are detailed below:
| Principal Amount Outstanding as of | ||||||||||||||
| Loan | Maturity
Date |
Interest
Rate(1) |
March
31, 2020 |
December 31, 2019 | ||||||||||
| Unsecured Note with Seven Kings Holdings, Inc. | Demand(2) | 9.5 | % | $ | 500 | $ | 500 | |||||||
| Unsecured Line of Credit from Builder Finance, Inc. | March 2021 | 10.0 | % | 500 | - | |||||||||
| Unsecured Line of Credit from Paul Swanson | June 2020(6) | 10.0 | % | 1,807 | 1,176 | |||||||||
| Subordinated Promissory Note | September 2020 | 9.5 | % | 563 | 563 | |||||||||
| Subordinated Promissory Note | December 2021 | 10.5 | % | 146 | 146 | |||||||||
| Subordinated Promissory Note | April 2020 | 10.0 | % | 100 | 100 | |||||||||
| Subordinated Promissory Note | April 2021 | 10.0 | % | 174 | 174 | |||||||||
| Subordinated Promissory Note | August 2022 | 11.0 | % | 200 | 200 | |||||||||
| Subordinated Promissory Note | March 2023 | 11.0 | % | 169 | 169 | |||||||||
| Subordinated Promissory Note | April 2020 | 6.5 | % | 500 | 500 | |||||||||
| Subordinated Promissory Note | February 2021 | 11.0 | % | 600 | 600 | |||||||||
| Subordinated Promissory Note | Demand | 5.0 | % | 500 | 500 | |||||||||
| Subordinated Promissory Note | Demand | 5.0 | % | 3 | 3 | |||||||||
| Subordinated Promissory Note | December 2023 | 11 | % | 20 | - | |||||||||
| Subordinated Promissory Note | February 2024 | 11 | % | 20 | - | |||||||||
| Senior Subordinated Promissory Note | March 2022(3) | 10.0 | % | 400 | 400 | |||||||||
| Senior Subordinated Promissory Note | March 2022(4) | 1.0 | % | 728 | 728 | |||||||||
| Junior Subordinated Promissory Note | March 2022(4) | 22.5 | % | 417 | 417 | |||||||||
| Senior Subordinated Promissory Note | October 2020(5) | 1.0 | % | 279 | 279 | |||||||||
| Junior Subordinated Promissory Note | October 2020(5) | 20.0 | % | 173 | 173 | |||||||||
| $ | 7,799 | $ | 6,628 | |||||||||||
| (1) | Interest rate per annum, based upon actual days outstanding and a 365/366-day year. |
| (2) | Due six months after lender gives notice. |
| (3) | Lender may require us to repay $20 of principal and all unpaid interest with 10 days’ notice. |
| (4) | These notes were issued to the same holder and, when calculated together, yield a blended return of 11% per annum. |
| (5) | These notes were issued to the same holder and, when calculated together, yield a blended return of 10% per annum. |
| (6) | Amount due in June 2020 is $1,000 with the remainder due November 2020. |
| 15 |
6. Redeemable Preferred Equity
The following is a roll forward of our Series C cumulative preferred equity (“Series C Preferred Units”):
Three Months Ended March 31, 2020 |
Year Ended December 31, 2019 |
Three Months Ended March 31, 2019 |
||||||||||
| Beginning balance | $ | 2,959 | $ | 2,385 | $ | 2,385 | ||||||
| Additions from new investment | - | 300 | - | |||||||||
| Distributions | (12 | ) | (42 | ) | ||||||||
| Additions from reinvestment | 89 | 316 | 72 | |||||||||
| Ending balance | $ | 3,036 | $ | 2,959 | $ | 2,457 | ||||||
The following table shows the earliest redemption options for investors in our Series C Preferred Units as of March 31, 2020:
| Year Maturing | Total
Amount Redeemable |
|||
| 2024 | $ | 2,719 | ||
| 2025 | 317 | |||
| Total | $ | 3,036 | ||
7. Members’ Capital
There are currently two classes of equity units outstanding that the Company classifies as Members’ Capital: Class A common units (“Class A Common Units”) and Series B cumulative preferred units (“Series B Preferred Units”). As of March 31, 2020, the Class A Common Units are held by eight members, all of whom have no personal liability. All Class A common members have voting rights in proportion to their capital account. There were 2,629 Class A Common Units outstanding as of March 31, 2020 and December 31, 2019.
The Series B Preferred Units were issued to the Hoskins Group through a reduction in a loan issued by the Hoskins Group to the Company. In December 2015, the Hoskins Group agreed to purchase 0.1 Series B Preferred Units for $10 at each closing of a lot to a third party in the Hamlets and Tuscany subdivisions. As of March 31, 2020, the Hoskins Group owned a total of 14.7 Series B Preferred Units, which were issued for a total of $1,470.
8. Related Party Transactions
As of March 31, 2020, the Company had $1,250, $250, and $386 available to borrow against the line of credit from Daniel M. Wallach (our Chief Executive Officer and chairman of the board of managers) and his wife, the line of credit from the 2007 Daniel M. Wallach Legacy Trust, and the line of credit from William Myrick (our Executive Vice President of Sales), respectively. A more detailed description is included in Note 6 of our 2019 Financial Statements. These borrowings are in notes payable secured, net of deferred financing costs on the interim condensed consolidated balance sheet.
| 16 |
9. Commitments and Contingencies
Unfunded commitments to extend credit, which have similar collateral, credit risk, and market risk to our outstanding loans, were $15,259 and $16,662 at March 31, 2020 and December 31, 2019, respectively.
10. Selected Quarterly Condensed Consolidated Financial Data (Unaudited)
Summarized unaudited quarterly condensed consolidated financial data for the quarters of 2020 and 2019 are as follows:
| Quarter 1 | Quarter 4 | Quarter 3 | Quarter 2 | Quarter 1 | ||||||||||||||||
| 2020 | 2019 | 2019 | 2019 | 2019 | ||||||||||||||||
| Net interest income after loan loss provision | $ | 955 | $ | 1,117 | $ | 1,115 | $ | 818 | $ | 1,079 | ||||||||||
| Non-interest income | - | 22 | 86 | 95 | - | |||||||||||||||
| SG&A expense | 708 | 447 | 703 | 620 | 624 | |||||||||||||||
| Depreciation and amortization | 21 | 26 | 21 | 22 | 23 | |||||||||||||||
| Loss on sale of foreclosed assets | 35 | – | 274 | – | – | |||||||||||||||
| Impairment loss on foreclosed assets | 109 | 282 | – | 196 | 80 | |||||||||||||||
| Net income | $ | 82 | $ | 384 | $ | 203 | $ | 75 | $ | 352 | ||||||||||
11. Non-Interest Expense Detail
The following table displays our selling, general and administrative (“SG&A”) expenses:
For the Three Months Ended March 31, |
||||||||
| 2020 | 2019 | |||||||
| Selling, general and administrative expenses | ||||||||
| Legal and accounting | $ | 139 | $ | 127 | ||||
| Salaries and related expenses | 278 | 362 | ||||||
| Board related expenses | 25 | 16 | ||||||
| Advertising | 21 | 19 | ||||||
| Rent and utilities | 13 | 9 | ||||||
| Loan and foreclosed asset expenses | 135 | 20 | ||||||
| Travel | 59 | 32 | ||||||
| Other | 38 | 39 | ||||||
| Total SG&A | $ | 708 | $ | 624 | ||||
12. Subsequent Events
Management of the Company has evaluated subsequent events through May 11, 2020, the date these interim condensed consolidated financial statements were issued.
In March 2020, the Company told all of its borrowers that it would fund all loans where the underlying house was already under construction, and advised the customers to build as quickly as possible to bring the houses on the market as soon as possible. For loans where the borrower had not yet begun construction of the underlying house, the Company told the borrowers that it would not fund construction and that they should therefore not start construction. As described below, the Company is now beginning to fund additional loans in certain limited circumstances.
| 17 |
The Company continues to monitor market conditions overall and in the specific markets in which it lends. Most non-bank competitors are no longer making new loans and some are not funding existing loans. Some markets have had little to no impact from a housing perspective as a result of COVID-19, while other markets have been impacted. Borrowers in Pennsylvania and Michigan have been most impacted by COVID-19 due to the government shutting down home construction completely in those states (Pennsylvania has announced reopening construction on May 1, 2020). Opportunities for home sales for our borrowers in their markets are impacted to varying degrees. The Company is now funding new loans to borrowers in stronger markets for the purpose of developing presold homes, which loans have reduced (60%) loan-to-value ratios. The Company is also considering funding spec loans in those same markets on a case-by-case basis for loans with reduced loan-to-value ratios (50-60%).
Changes in home buyer FICO scores and other requirements by end user lenders is expected to impact the Company’s builders who focus on lower priced homes, and some real estate markets where the primary business is entertainment will be more impacted than most other markets. The Company has some customers in Orlando, Florida, and is working through issues with two of those customers. Some of those customers may have their credit quality downgraded in future quarters, and the Company is working to mitigate any losses it may incur as a result of the virus for those customers and others as they become known.
As of April 20, 2020, the Company informed some of those builders located in stronger markets to begin construction. As a result, the committed amount on the remaining loans that the Company has not released for construction to begin was $4,200 with $3,000 unfunded.
On May 7, 2020, the Company made the decision to reopen lending under normal, pre-COVID-19 terms for a limited group of certain of its customers. In addition, the decision was made to allow rehab loans to builders at terms that are less conservative than the 50% loan to value established in April 2020 but more conservative than terms prior to the arrival of COVID-19.
Management is also contemplating purchasing debt from other similar lending companies at deep discounts, but does not have any serious prospects at this time.
On May 5, 2020, we entered into an agreement to borrow approximately $362 pursuant to the Paycheck Protection Program (“PPP”), created under the Coronavirus Aid, Relief, and Economic Security Act, or CARES Act. The PPP is intended to provide loans to qualified businesses to cover payroll and certain other identified costs. The loan has an interest rate of 1.0% and a term of 24 months. No payments are due for the first 6 months, although interest accrues, and monthly payments, which include interest, are due over the next 18 months to pay off the loan. Funds from the loan may only be used for certain purposes, including payroll, benefits, rent, and utilities. All or a portion of the loan may be forgivable, as provided by the terms of the PPP. The loan is evidenced by a promissory note, which contains customary events of default relating to, among other things, payment defaults and breaches of representations. We may prepay the loan at any time prior to maturity with no prepayment penalties.
The Company is continuously monitoring the markets, builders, and the COVID-19 situation for the remaining loans which the Company has not yet released for construction. Management anticipates revisiting these lending parameters in May 2020 as the COVID-19 situation continues to develop. Management also notes that while demand for its lending products declined in 2019 due increases in competition, demand during the pandemic is increasing.
| 18 |
ITEM 2. MANAGEMENT’S DISCUSSION AND ANALYSIS OF FINANCIAL CONDITION AND RESULTS OF OPERATIONS
(All dollar [$] amounts shown in thousands.)
The following Management’s Discussion and Analysis of Financial Condition and Results of Operations should be read in conjunction with our interim condensed consolidated financial statements and the notes thereto contained elsewhere in this report. The following Management’s Discussion and Analysis of Financial Condition and Results of Operations should also be read in conjunction with our audited annual consolidated financial statements and related notes and other consolidated financial data (the “2019 Financial Statements”) included in the Company’s Annual Report on Form 10-K for the year ended December 31, 2019 (the “2019 Form 10-K”). See also “Cautionary Note Regarding Forward-Looking Statements” preceding Part I.
Overview
The Company faces risks related to COVID-19, which has caused significant disruptions to the economy. COVID-19 has spread globally and the outbreak has caused significant disruptions to the economy, including in the United States and in all of the markets in which the Company lends. The Company’s operating results depend significantly on the homebuilding industry.
During March 2020, the Company made the decision due to the potential impact of COVID-19 to inform its borrowers that the Company would fund all loans where the underlying asset was currently under construction. For borrowers who currently have loans where the underlying asset was at a non-start position, they were informed to not start construction until told to do so by the Company.
During April 2020, as the Company continued to monitor market conditions overall and in the specific markets in which the Company lends, the Company observed that some markets had little to no impact from a housing perspective as a result of COVID-19; however, the Company’s borrowers in Pennsylvania and Michigan were significantly impacted due to the government shutting down home construction completely. The Company made the decision to fund new loans to borrowers in stronger markets for the purpose of developing presold homes, which loans have reduced loan-to-value ratios. In addition, the Company will continue to monitor funding spec loans in some markets on a case-by-case basis for loans with reduced loan -to-value ratios.
On May 7, 2020, the Company made the decision to reopen lending under normal, pre-COVID-19 terms for a limited group of certain of its customers. In addition, the decision was made to allow rehab loans to builders at terms that are less conservative than the 50% loan to value established in April 2020 but more conservative than terms prior to the arrival of COVID-19.
Net income for the first quarter of 2020 decreased by $270 when compared to the same period of 2019. The decrease in net income was primarily due to the following:
● | Fee income decreased $236 or 33% to $484 compared to the same period of 2019. Originations for the quarter ended March 31, 2020 were $7,771 compared to $18,982 for the same period of 2019; The decrease in originations was primarily due to competition and COVID-19. | |
● | Loss on the sale and impairment of foreclosed assets increased $64 due to one certain asset being sold and additional costs incurred to complete construction of additional properties. |
We had $54,197 and $55,369 in loan assets as of March 31, 2020 and December 31, 2019, respectively. In addition, as of March 31, 2020, we had 218 construction loans in 21 states with 67 borrowers and nine development loans in four states with five borrowers.
Cash used in operations decreased $1,019 for three months ended March 31, 2020 as compared to the same period of 2019. Our decrease in operating cash flow was due primarily to a decrease in interest escrow of $349, net income of $270 and change in loan origination fees, net of $250.
| 19 |
Critical Accounting Estimates
To assist in evaluating our interim condensed consolidated financial statements, we describe below the critical accounting estimates that we use. We consider an accounting estimate to be critical if: (1) the accounting estimate requires us to make assumptions about matters that were highly uncertain at the time the accounting estimate was made, and (2) changes in the estimate that are reasonably likely to occur from period to period, or use of different estimates that we reasonably could have used, would have a material impact on our consolidated financial condition or results of operations. See our 2019 Form 10-K, as filed with the SEC, for more information on our critical accounting estimates. No material changes to our critical accounting estimates have occurred since December 31, 2019 unless listed below.
Loan Losses
Fair value of collateral has the potential to impact the calculation of the loan loss provision (the amount we have expensed over time in anticipation of loan losses we have not yet realized). Specifically, relevant to the allowance for loan loss reserve is the fair value of the underlying collateral supporting the outstanding loan balances. Fair value measurements are an exit price, representing the amount that would be received to sell an asset or paid to transfer a liability in an orderly transaction between market participants. Due to a rapidly changing economic market, an erratic housing market, the various methods that could be used to develop fair value estimates, and the various assumptions that could be used, determining the collateral’s fair value requires significant judgment.
| March 31, 2020 | ||||
| Loan Loss | ||||
| Provision | ||||
| Change in Fair Value Assumption | Higher/(Lower) | |||
| Increasing fair value of the real estate collateral by 35%* | $ | - | ||
| Decreasing fair value of the real estate collateral by 35%** | $ | (6,528 | ) | |
* Increases in the fair value of the real estate collateral do not impact the loan loss provision, as the value generally is not “written up.”
** Assumes the loans were nonperforming and a book amount of the loans outstanding of $54,197.
Foreclosed Assets
The fair value of real estate will impact our foreclosed asset value, which is recorded at 100% of fair value (after selling costs are deducted).
| March 31, 2020 | ||||
| Foreclosed | ||||
| Assets | ||||
| Change in Fair Value Assumption | Higher/(Lower) | |||
| Increasing fair value of the foreclosed asset by 35%* | $ | - | ||
| Decreasing fair value of the foreclosed asset by 35%** | $ | (1,761 | ) | |
* Increases in the fair value of the foreclosed assets do not impact the carrying value, as the value generally is not “written up.” Those gains would be recognized at the sale of the asset.
** Assumes a book amount of the foreclosed assets of $5,031.
| 20 |
Interest Spread
The following table displays a comparison of our interest income, expense, fees, and spread:
| Three Months Ended | ||||||||||||||||
| March 31, | ||||||||||||||||
| 2020 | 2019 | |||||||||||||||
| Interest Income | * | * | ||||||||||||||
| Interest income on loans | $ | 2,090 | 14 | % | $ | 1,712 | 13 | % | ||||||||
| Fee income on loans | 484 | 4 | % | 720 | 6 | % | ||||||||||
| Interest and fee income on loans | 2,574 | 18 | % | 2,432 | 19 | % | ||||||||||
| Interest expense unsecured | 727 | 5 | % | 585 | 5 | % | ||||||||||
| Interest expense secured | 817 | 6 | % | 681 | 5 | % | ||||||||||
| Amortization of offering costs | 40 | - | % | 40 | - | % | ||||||||||
| Interest expense | 1,584 | 11 | % | 1,306 | 10 | % | ||||||||||
| Net interest income (spread) | $ | 990 | 7 | % | $ | 1,126 | 9 | % | ||||||||
| Weighted average outstanding loan asset balance | $ | 57,756 | $ | 50,886 | ||||||||||||
*annualized amount as percentage of weighted average outstanding gross loan balance
There are three main components that can impact our interest spread:
● Difference between the interest rate received (on our loan assets) and the interest rate paid (on our borrowings). The loans we have originated have interest rates which are based on our cost of funds, with a minimum cost of funds of 7%. For most loans, the margin is fixed at 3%; however, for our development loans the margin is fixed at 7%. This component is also impacted by the lending of money with no interest cost (our equity).
Interest income on loans increased 1% for the quarter ended March 31, 2020 compared to the same period of 2019 due primarily to our cost of funds. During the quarter ended March 31, 2020 and 2019, our cost of funds was 10.69% and 10.45%, respectively. In addition, loans receivables, net increased $4,206 to $54,197 as of March 31, 2020 compared to $49,991 as of March 31, 2019. The difference between interest rate received on loans and the interest paid was 3% for both the periods ended March 31, 2020 and 2019 which is our standard margin.
We currently anticipate that the difference between our interest income and interest expense will continue to be 3% for the remainder of 2020, however our margin could be compressed as a result of COVID-19. We anticipate our standard margin to be 3% on all future construction loans and 7% on all development loans which yields a blended margin of approximately 3.4%.
● Fee income. Our construction loan fee is 5% on the amount we commit to lend, which is amortized over the expected life of each loans. In addition, our development loans do not recognize a loan fee. When loans terminate before than their expected life, the remaining fee is recognized at the termination of the loan. During the quarter ended March 31, 2019, our fee income included a modification charge to our largest customer of $125. Excluding the modification charge, fee income on loans for the quarter ended March 31, 2019 was 5%. During the first quarter of 2020, our lower origination of new loans (partly due to competition and partly due to the COVID-19) caused the reduction to 4% for fee income in that quarter. Higher originations or a reduction in the balance of old loans will result in the fee income returning to 5%.
● Amount of nonperforming assets. Generally, we can have two types of nonperforming assets that negatively affect interest spread: loans not paying interest and foreclosed assets.
As of March 31, 2020 and 2019, $1,581 and $2,617 loans were not paying interest, respectively. As of late April 2020, and directly related to COVID-19, one of our customers in default located in Orlando, Florida entered into negotiations to sell half of his loans to another of our customers. We are working with the customer with respect to the remainder of his loans either through a deed in lieu of foreclosure or a foreclosure.
Foreclosed assets do not provide a monthly interest return. As of March 31, 2020 and 2019, foreclosed assets were $5,031 and $6,069, respectively, which resulted in a negative impact on our interest spread in both years.
| 21 |
The amount of nonperforming assets is expected to increase over the next quarter due to some of the nonperforming loans becoming foreclosed assets, and will decrease as we continue to sell our assets where construction is complete.
SG&A Expenses
The following table displays our SG&A expenses:
For the Three Months Ended March 31, | ||||||||
| 2020 | 2019 | |||||||
| Selling, general and administrative expenses | ||||||||
| Legal and accounting | $ | 139 | $ | 127 | ||||
| Salaries and related expenses | 278 | 362 | ||||||
| Board related expenses | 25 | 16 | ||||||
| Advertising | 21 | 19 | ||||||
| Rent and utilities | 13 | 9 | ||||||
| Loan and foreclosed asset expenses | 135 | 20 | ||||||
| Travel | 59 | 32 | ||||||
| Other | 38 | 39 | ||||||
| Total SG&A | $ | 708 | $ | 624 | ||||
Our SG&A expense increased $84 for the quarter ended March 31, 2020 compared to the same period of 2019 due significantly to the following:
| ● | Loan and foreclosed asset expenses increased $115 due to additional construction costs incurred to complete properties. The Company had 15 foreclosed assets under construction as of March 31, 2020 compared to three for the same period of 2019; | |
| ● | Legal and accounting fees increased $12 due to additional costs incurred related to the amendment of our third Indenture; | |
| ● | Board related expenses increased $9 due to the addition of one board member in April 2019; | |
| ● | Travel increased $27 due to timing of field travel; and | |
| ● | These items were offset by a decrease in salaries and related expenses which resulted from the reduction of two employees and lower Company quota bonuses. |
Impairment Loss on Foreclosed Assets
As of March 31, 2020 and 2019, impaired loss on foreclosed assets was $109 and $80, respectively. The increase in foreclosed assets was directly related to properties acquired back due to the death of a borrower in 2018. During the quarter ended March 31, 2019, we finished our largest foreclosed asset in Sarasota, Florida and recorded an impairment of $80 during the quarter on that property.
We do not anticipate losses on the sale of foreclosed assets in the future; however, this may be subject to change based on the final selling price of the foreclosed assets.
Loan Loss Provision
Our loan loss provision decreased $12 for the quarter ended March 31, 2020, compared to the same periods of 2019. The decrease in loan loss provision was primarily due to the reduction in loan loss provision for our collective reserve of $46, which was offset by an increase in loans with a specific reserve of $34. The increase in our specific researve related to additional impairment on two of our assets.
| 22 |
Consolidated Financial Position
Loans Receivable
Commercial Loans – Construction Loan Portfolio Summary
We anticipate that the aggregate balance of our construction loan portfolio will increase as loans near maturity and as we have new loan originations.
The following is a summary of our loan portfolio to builders for home construction loans as of March 31, 2020:
| State | Number of | Number of | Value of Collateral (1) | Commitment Amount | Amount Outstanding | Loan to Value Ratio(2) | Loan Fee | |||||||||||||||||||||
| Arizona | 1 | 1 | $ | 1,345 | $ | 807 | $ | 269 | 60 | % | 5 | % | ||||||||||||||||
| Connecticut | 1 | 2 | 683 | 450 | 179 | 66 | % | 5 | % | |||||||||||||||||||
| Colorado | 1 | 1 | 630 | 425 | 425 | 67 | % | 5 | % | |||||||||||||||||||
| Florida | 16 | 107 | 32,293 | 24,079 | 18,847 | 75 | % | 5 | % | |||||||||||||||||||
| Georgia | 3 | 4 | 2,085 | 1,343 | 942 | 64 | % | 5 | % | |||||||||||||||||||
| Illinois | 1 | 1 | 1,245 | 747 | 367 | 60 | % | 5 | % | |||||||||||||||||||
| Indiana | 2 | 3 | 1,687 | 1,083 | 554 | 64 | % | 5 | % | |||||||||||||||||||
| Michigan | 4 | 6 | 2,145 | 1,480 | 1,298 | 69 | % | 5 | % | |||||||||||||||||||
| New Jersey | 3 | 5 | 1,676 | 1,255 | 1,245 | 74 | % | 5 | % | |||||||||||||||||||
| New York | 2 | 4 | 1,740 | 1,199 | 979 | 69 | % | 5 | % | |||||||||||||||||||
| North Carolina | 5 | 14 | 3,875 | 2,691 | 1,506 | 69 | % | 5 | % | |||||||||||||||||||
| Ohio | 3 | 8 | 3,463 | 2,206 | 1,814 | 64 | % | 5 | % | |||||||||||||||||||
| Oregon | 2 | 4 | 1,887 | 1,252 | 798 | 66 | % | 5 | % | |||||||||||||||||||
| Pennsylvania | 3 | 20 | 17,129 | 11,557 | 10,403 | 67 | % | 5 | % | |||||||||||||||||||
| South Carolina | 8 | 20 | 6,583 | 4,907 | 2,734 | 75 | % | 5 | % | |||||||||||||||||||
| Tennessee | 3 | 4 | 1,367 | 1,069 | 547 | 78 | % | 5 | % | |||||||||||||||||||
| Texas | 4 | 6 | 3,009 | 1,987 | 946 | 66 | % | 5 | % | |||||||||||||||||||
| Utah | 2 | 4 | 2,307 | 1,701 | 1,210 | 74 | % | 5 | % | |||||||||||||||||||
| Virginia | 1 | 2 | 820 | 535 | 520 | 65 | % | 5 | % | |||||||||||||||||||
| Washington | 1 | 1 | 450 | 315 | 293 | 70 | % | 5 | % | |||||||||||||||||||
| Wisconsin | 1 | 1 | 539 | 332 | 285 | 62 | % | 5 | % | |||||||||||||||||||
| Total | 67 | 218 | $ | 86,958 | $ | 61,420 | $ | 46,161 | 71 | %(3) | 5 | % | ||||||||||||||||
| (1) | The value is determined by the appraised value. | |
| (2) | The loan to value ratio is calculated by taking the commitment amount and dividing by the appraised value. | |
| (3) | Represents the weighted average loan to value ratio of the loans. |
| 23 |
The following is a summary of our loan portfolio to builders for home construction loans as of December 31, 2019:
| State | Number of | Number of | Value of Collateral(1) | Commitment Amount | Gross Amount | Loan to Ratio(2) | Loan Fee | |||||||||||||||||||||
| Colorado | 1 | 1 | $ | 630 | $ | 425 | $ | 424 | 67 | % | 5 | % | ||||||||||||||||
| Connecticut | 1 | 1 | 340 | 224 | 55 | 66 | % | 5 | % | |||||||||||||||||||
| Florida | 17 | 112 | 32,259 | 24,031 | 16,826 | 74 | % | 5 | % | |||||||||||||||||||
| Georgia | 3 | 4 | 2,085 | 1,343 | 917 | 64 | % | 5 | % | |||||||||||||||||||
| Idaho | 1 | 1 | 310 | 217 | 173 | 70 | % | 5 | % | |||||||||||||||||||
| Indiana | 2 | 3 | 1,687 | 1,083 | 383 | 64 | % | 5 | % | |||||||||||||||||||
| Michigan | 4 | 11 | 3,696 | 2,566 | 1,820 | 69 | % | 5 | % | |||||||||||||||||||
| New Jersey | 3 | 6 | 1,925 | 1,471 | 1,396 | 76 | % | 5 | % | |||||||||||||||||||
| New York | 2 | 3 | 1,370 | 940 | 743 | 69 | % | 5 | % | |||||||||||||||||||
| North Carolina | 6 | 20 | 5,790 | 4,009 | 2,471 | 69 | % | 5 | % | |||||||||||||||||||
| Ohio | 3 | 9 | 4,117 | 2,664 | 2,153 | 65 | % | 5 | % | |||||||||||||||||||
| Oregon | 1 | 2 | 1,137 | 796 | 739 | 70 | % | 5 | % | |||||||||||||||||||
| Pennsylvania | 3 | 24 | 20,791 | 13,322 | 11,772 | 64 | % | 5 | % | |||||||||||||||||||
| South Carolina | 11 | 25 | 8,809 | 6,419 | 4,786 | 73 | % | 5 | % | |||||||||||||||||||
| Tennessee | 3 | 4 | 1,367 | 1,069 | 503 | 78 | % | 5 | % | |||||||||||||||||||
| Texas | 3 | 4 | 1,984 | 1,270 | 843 | 64 | % | 5 | % | |||||||||||||||||||
| Utah | 2 | 4 | 1,862 | 1,389 | 1,000 | 75 | % | 5 | % | |||||||||||||||||||
| Virginia | 1 | 3 | 1,245 | 815 | 734 | 65 | % | 5 | % | |||||||||||||||||||
| Washington | 1 | 2 | 1,040 | 728 | 445 | 70 | % | 5 | % | |||||||||||||||||||
| Wisconsin | 1 | 1 | 539 | 332 | 285 | 62 | % | 5 | % | |||||||||||||||||||
| Wyoming | 1 | 1 | 228 | 160 | 143 | 70 | % | 5 | % | |||||||||||||||||||
| Total | 70 | 241 | $ | 93,211 | $ | 65,273 | $ | 48,611 | 70 | %(3) | 5 | % | ||||||||||||||||
| (1) | The value is determined by the appraised value. | |
| (2) | The loan to value ratio is calculated by taking the commitment amount and dividing by the appraised value. | |
| (3) | Represents the weighted average loan to value ratio of the loans. |
Commercial Loans – Real Estate Development Loan Portfolio Summary
The following is a summary of our loan portfolio to builders for land development as of March 31, 2020:
| States | Number of Borrowers | Number of Loans | Value of Collateral(1) | Commitment Amount(2) | Gross Amount Outstanding | Loan to Value Ratio(3) | Interest Spread | |||||||||||||||||||||
| Pennsylvania | 1 | 3 | $ | 9,335 | $ | 8,200 | $ | 8,384 | 90 | % | 7 | % | ||||||||||||||||
| Florida | 2 | 3 | 1,301 | 1,356 | 783 | 60 | % | 7 | ||||||||||||||||||||
| North Carolina | 1 | 1 | 400 | 260 | 131 | 33 | % | 7 | ||||||||||||||||||||
| South Carolina | 1 | 2 | 1,115 | 1,250 | 618 | 55 | % | 7 | ||||||||||||||||||||
| Total | 5 | 9 | $ | 12,151 | $ | 11,066 | $ | 9,916 | 82 | %(4) | 7 | % | ||||||||||||||||
| (1) | The value is determined by the appraised value adjusted for remaining costs to be paid and third-party mortgage balances. Part of this collateral is $1,470 of preferred equity in our Company. In the event of a foreclosure on the property securing these loans, the portion of our collateral that is preferred equity in our Company might be difficult to sell, which could impact our ability to eliminate the loan balance. |
| (2) | The commitment amount does not include unfunded letters of credit. |
| (3) | The loan to value ratio is calculated by taking the outstanding amount and dividing by the appraised value calculated as described above. |
| (4) | Represents the weighted average loan to value ratio of the loans. |
| 24 |
The following is a summary of our loan portfolio to builders for land development as of December 31, 2019:
| States | Number of Borrowers | Number of Loans | Value of Collateral(1) | Commitment Amount(2) | Gross Amount Outstanding | Loan to Value Ratio(3) | Interest Spread | |||||||||||||||||||||
| Pennsylvania | 1 | 3 | $ | 10,191 | $ | 7,000 | $ | 7,389 | 73 | % | 7 | % | ||||||||||||||||
| Florida | 2 | 3 | 1,301 | 1,356 | 891 | 68 | % | 7 | ||||||||||||||||||||
| North Carolina | 1 | 1 | 400 | 260 | 99 | 25 | % | 7 | ||||||||||||||||||||
| South Carolina | 1 | 2 | 1,115 | 1,250 | 618 | 55 | % | 7 | ||||||||||||||||||||
| Total | 5 | 9 | $ | 13,007 | $ | 9,866 | $ | 8,997 | 69 | %(4) | 7 | % | ||||||||||||||||
| (1) | The value is determined by the appraised value adjusted for remaining costs to be paid and third-party mortgage balances. Part of this collateral is $1,470 of preferred equity in our Company. In the event of a foreclosure on the property securing these loans, the portion of our collateral that is preferred equity in our Company might be difficult to sell, which could impact our ability to eliminate the loan balance. |
| (2) | The commitment amount does not include unfunded letters of credit. |
| (3) | The loan to value ratio is calculated by taking the outstanding amount and dividing by the appraised value calculated as described above. |
| (4) | Represents the weighted average loan to value ratio of the loans. |
Combined Loan Portfolio Summary
Financing receivables are comprised of the following as of March 31, 2020 and December 31, 2019:
| March 31, 2020 | December 31, 2019 | |||||||
| Loans receivable, gross | $ | 56,077 | $ | 57,608 | ||||
| Less: Deferred loan fees | (676 | ) | (856 | ) | ||||
| Less: Deposits | (1,149 | ) | (1,352 | ) | ||||
| Plus: Deferred origination costs | 215 | 204 | ||||||
| Less: Allowance for loan losses | (270 | ) | (235 | ) | ||||
| Loans receivable, net | $ | 54,197 | $ | 55,369 | ||||
The following is a roll forward of combined loans:
Three Months Ended 2020 | Year Ended 2019 | Three Months Ended 2019 | ||||||||||
| Beginning balance | $ | 55,369 | $ | 46,490 | $ | 46,490 | ||||||
| Additions | 9,462 | 56,842 | 13,404 | |||||||||
| Principal collections | (10,993 | ) | (45,009 | ) | (9,600 | ) | ||||||
| Transferred to foreclosed assets | – | (3,352 | ) | – | ||||||||
| Change in builder deposit | 203 | 157 | (197 | ) | ||||||||
| Change in loan loss provision | (35 | ) | (49 | ) | (47 | ) | ||||||
| Change in loan fees, net | 191 | 290 | (59 | ) | ||||||||
| Ending balance | $ | 54,197 | $ | 55,369 | $ | 49,991 | ||||||
| 25 |
Finance Receivables – By risk rating:
| March 31, 2020 | December 31, 2019 | |||||||
| Pass | $ | 50,809 | $ | 53,542 | ||||
| Special mention | 3,687 | 2,571 | ||||||
| Classified – accruing | – | – | ||||||
| Classified – nonaccrual | 1,581 | 1,495 | ||||||
| Total | $ | 56,077 | $ | 57,608 | ||||
Finance Receivables – Method of impairment calculation:
| March 31, 2020 | December 31, 2019 | |||||||
| Performing loans evaluated individually | $ | 27,732 | $ | 26,233 | ||||
| Performing loans evaluated collectively | 26,764 | 29,880 | ||||||
| Non-performing loans without a specific reserve | 1,063 | 1,467 | ||||||
| Non-performing loans with a specific reserve | 518 | 28 | ||||||
| Total evaluated collectively for loan losses | $ | 56,077 | $ | 57,608 | ||||
At March 31, 2020 and December 31, 2019, there were no loans acquired with deteriorated credit quality.
Impaired Loans
The following is a summary of our impaired nonaccrual commercial construction loans as of March 31, 2020 and December 31, 2019.
| March 31, 2020 | December 31, 2019 | |||||||
| Unpaid principal balance (contractual obligation from customer) | $ | 1,581 | $ | 1,495 | ||||
| Charge-offs and payments applied | - | - | ||||||
| Gross value before related allowance | 1,581 | 1,495 | ||||||
| Related allowance | (50 | ) | (8 | ) | ||||
| Value after allowance | $ | 1,531 | $ | 1,487 | ||||
Below is an aging schedule of loans receivable as of March 31, 2020, on a recency basis:
| No. Loans | Unpaid Balances | % | ||||||||||
| Current loans (current accounts and accounts on which more than 50% of an original contract payment was made in the last 59 days) | 222 | $ | 54,496 | 97 | % | |||||||
| 60-89 days | 1 | 82 | - | % | ||||||||
| 90-179 days | - | - | - | % | ||||||||
| 180-269 days | 4 | 1,499 | 3 | % | ||||||||
| Subtotal | 227 | $ | 56,077 | 100 | % | |||||||
| Interest only accounts (Accounts on which interest, deferment, extension and/or default charges were received in the last 60 days) | - | $ | - | - | % | |||||||
| Partial Payment accounts (Accounts on which the total received in the last 60 days was less than 50% of the original contractual monthly payment. “Total received” to include interest on simple interest accounts, as well as late charges on deferment charges on pre-computed accounts.) | - | $ | - | - | % | |||||||
| Total | 227 | $ | 56,077 | 100 | % | |||||||
| 26 |
Below is an aging schedule of loans receivable as of March 31, 2020, on a contractual basis:
| No. Loans | Unpaid Balances | % | ||||||||||
| Contractual Terms - All current Direct Loans and Sales Finance Contracts with installments past due less than 60 days from due date. | 222 | $ | 54,496 | 97 | % | |||||||
| 60-89 days | 1 | 82 | - | % | ||||||||
| 90-179 days | - | - | - | % | ||||||||
| 180-269 days | 4 | 1,499 | 3 | % | ||||||||
| Subtotal | 227 | $ | 56,077 | 100 | % | |||||||
| Interest only accounts (Accounts on which interest, deferment, extension and/or default charges were received in the last 60 days) | - | $ | - | - | % | |||||||
| Partial Payment accounts (Accounts on which the total received in the last 60 days was less than 50% of the original contractual monthly payment. “Total received” to include interest on simple interest accounts, as well as late charges on deferment charges on pre-computed accounts.) | - | $ | - | - | % | |||||||
| Total | 227 | $ | 56,077 | 100 | % | |||||||
Below is an aging schedule of loans receivable as of December 31, 2019, on a recency basis:
| No. Loans | Unpaid Balances | % | ||||||||||
| Current loans (current accounts and accounts on which more than 50% of an original contract payment was made in the last 59 days) | 246 | $ | 56,113 | 97 | % | |||||||
| 60-89 days | - | - | - | % | ||||||||
| 90-179 days | 4 | 1,495 | 3 | % | ||||||||
| 180-269 days | - | - | - | % | ||||||||
| Subtotal | 250 | $ | 57,608 | 100 | % | |||||||
| Interest only accounts (Accounts on which interest, deferment, extension and/or default charges were received in the last 60 days) | - | $ | - | - | % | |||||||
| Partial Payment accounts (Accounts on which the total received in the last 60 days was less than 50% of the original contractual monthly payment. “Total received” to include interest on simple interest accounts, as well as late charges on deferment charges on pre-computed accounts.) | - | $ | - | - | % | |||||||
| Total | 250 | $ | 57,608 | 100 | % | |||||||
| 27 |
Below is an aging schedule of loans receivable as of December 31, 2019, on a contractual basis:
| No. Loans | Unpaid Balances | % | ||||||||||
| Contractual Terms - All current Direct Loans and Sales Finance Contracts with installments past due less than 60 days from due date. | 246 | $ | 56,113 | 97 | % | |||||||
| 60-89 days | - | - | - | % | ||||||||
| 90-179 days | 4 | 1,495 | 3 | % | ||||||||
| 180-269 days | - | - | - | % | ||||||||
| Subtotal | 250 | $ | 57,608 | 100 | % | |||||||
| Interest only accounts (Accounts on which interest, deferment, extension and/or default charges were received in the last 60 days) | - | $ | - | - | % | |||||||
| Partial Payment accounts (Accounts on which the total received in the last 60 days was less than 50% of the original contractual monthly payment. “Total received” to include interest on simple interest accounts, as well as late charges on deferment charges on pre-computed accounts.) | - | $ | - | - | % | |||||||
| Total | 250 | $ | 57,608 | 100 | % | |||||||
Foreclosed Assets
Below is a roll forward of foreclosed assets:
Three Months Ended March 31, 2020 | Year Ended December 31, 2019 | Three Months Ended March 31, 2019 | ||||||||||
| Beginning balance | $ | 4,916 | $ | 5,973 | $ | 5,973 | ||||||
| Additions from loans | - | 3,352 | - | |||||||||
| Additions for construction/development | 444 | 763 | 176 | |||||||||
| Sale proceeds | (185 | ) | (4,543 | ) | - | |||||||
| Loss on sale | (35 | ) | (274 | ) | - | |||||||
| Gain on foreclosure | - | 203 | - | |||||||||
| Impairment loss on foreclosed assets | (109 | ) | (558 | ) | (80 | ) | ||||||
| Ending balance | $ | 5,031 | $ | 4,916 | $ | 6,069 | ||||||
During the quarter ended March 31, 2020, we impaired eight of our 32 foreclosed assets which related to assets received into foreclosure due to the death of a borrower in 2018. In addition, we sold one of our foreclosed assets for proceeds of $185 and a loss of $35.
| 28 |
Customer Interest Escrow
Below is a roll forward of interest escrow:
Three Months Ended March 31, 2020 | Year Ended December 31, 2019 | Three Months Ended March 31, 2019 | ||||||||||
| Beginning balance | $ | 643 | $ | 939 | $ | 939 | ||||||
| Preferred equity dividends | 37 | 136 | 33 | |||||||||
| Additions from Pennsylvania loans | 500 | 1,107 | 715 | |||||||||
| Additions from other loans | 51 | 768 | 108 | |||||||||
| Interest, fees, principal or repaid to borrower | (550 | ) | (2,307 | ) | (506 | ) | ||||||
| Ending balance | $ | 681 | $ | 643 | $ | 1,289 | ||||||
Related Party Borrowings
As of March 31, 2020, the Company had $1,250, $250, and $386 available to borrow against the line of credit from Daniel M. Wallach (our Chief Executive Officer and chairman of the board of managers) and his wife, the line of credit from the 2007 Daniel M. Wallach Legacy Trust, and the line of credit from William Myrick (our Executive Vice President of Sales), respectively. A more detailed description is included in Note 6 to the 2019 Financial Statements. These borrowings are in notes payable secured, net of deferred financing costs on the interim condensed consolidated balance sheet.
Secured Borrowings
Lines of Credit
As of March 31, 2020, the Company had borrowed $614 on its lines of credit from affiliates, which have a total limit of $2,500.
None of our lines of credit have given us notice of nonrenewal, and the lines will continue to automatically renew unless notice is given by a lender.
Summary
The borrowings secured by loan assets are summarized below:
| March 31, 2020 | December 31, 2019 | |||||||||||||||
| Book Value of Loans which Served as Collateral | Due from Shepherd’s Finance to Loan Purchaser or Lender | Book Value of Loans which Served as Collateral | Due from Shepherd’s Finance to Loan Purchaser or Lender | |||||||||||||
| Loan Purchaser | ||||||||||||||||
| Builder Finance | $ | 12,593 | $ | 8,428 | $ | 13,711 | $ | 9,375 | ||||||||
| S.K. Funding | 10,004 | 6,771 | 10,394 | 6,771 | ||||||||||||
| Lender | ||||||||||||||||
| Shuman | 1,798 | 1,325 | 1,785 | 1,325 | ||||||||||||
| Jeff Eppinger | 1,941 | 1,000 | 1,821 | 1,000 | ||||||||||||
| Hardy Enterprises, Inc. | 1,852 | 1,000 | 1,684 | 1,000 | ||||||||||||
| Gary Zentner | 611 | 250 | 472 | 250 | ||||||||||||
| R. Scott Summers | 1,210 | 847 | 841 | 628 | ||||||||||||
| Paul Swanson | 6,105 | 5,193 | 8,377 | 5,824 | ||||||||||||
| Total | $ | 36,114 | $ | 24,814 | $ | 39,085 | $ | 26,173 | ||||||||
| 29 |
Unsecured Borrowings
Unsecured Notes through the Public Offering (“Notes Program”)
On March 22, 2019, the Company terminated its second public offering and commenced its third public third public offering of fixed rate subordinated notes (the “Notes”). The effective interest rate on borrowings through our Notes Program at March 31, 2020 and December 31, 2019 was 10.68% and 10.56%, respectively, not including the amortization of deferred financing costs. We generally offer four durations at any given time, ranging from 12 to 48 months from the date of issuance. There are limited rights of early redemption. Our 36-month Note has a mandatory early redemption option, subject to certain conditions. The following table shows the roll forward of our Notes Program:
Three Months Ended March 31, 2020 | Year Ended December 31, 2019 | Three Months Ended March 31, 2019 | ||||||||||
| Gross Notes outstanding, beginning of period | $ | 20,308 | $ | 17,348 | $ | 17,348 | ||||||
| Notes issued | 4,722 | 11,127 | 3,532 | |||||||||
| Note repayments / redemptions | (3,960 | ) | (8,167 | ) | (2,049 | ) | ||||||
| Gross Notes outstanding, end of period | $ | 21,070 | $ | 20,308 | $ | 18,831 | ||||||
| Less deferred financing costs, net | 453 | 416 | 454 | |||||||||
| Notes outstanding, net | $ | 20,617 | $ | 19,892 | $ | 18,377 | ||||||
The following is a roll forward of deferred financing costs:
Three Months Ended March 31, 2020 |
Year Ended December 31, 2019 | Three Months Ended March 31, 2019 | ||||||||||
| Deferred financing costs, beginning balance | $ | 786 | $ | 1,212 | $ | 1,212 | ||||||
| Additions | 77 | 365 | 282 | |||||||||
| Disposals | - | (791 | ) | – | ||||||||
| Deferred financing costs, ending balance | 863 | 786 | 1,494 | |||||||||
| Less accumulated amortization | (410 | ) | (370 | ) | (1,040 | ) | ||||||
| Deferred financing costs, net | $ | 453 | $ | 416 | $ | 454 | ||||||
The following is a roll forward of the accumulated amortization of deferred financing costs:
| Three Months | Year | Three Months | ||||||||||
Ended March 31, 2020 | Ended December 31, 2019 | Ended March 31, 2019 | ||||||||||
| Accumulated amortization, beginning balance | $ | 370 | $ | 1,000 | $ | 1,000 | ||||||
| Additions | 40 | 161 | 40 | |||||||||
| Disposals | - | (791 | ) | - | ||||||||
| Accumulated amortization, ending balance | $ | 410 | $ | 370 | $ | 1,040 | ||||||
| 30 |
Other Unsecured Debts
Our other unsecured debts are detailed below:
| Principal Amount Outstanding as of | ||||||||||||||
| Loan | Maturity Date | Interest Rate(1) | March 31, 2020 | December 31, 2019 | ||||||||||
| Unsecured Note with Seven Kings Holdings, Inc. | Demand(2) | 9.5 | % | $ | 500 | $ | 500 | |||||||
| Unsecured Line of Credit from Builder Finance, Inc. | March 2021 | 10.0 | % | 500 | - | |||||||||
| Unsecured Line of Credit from Paul Swanson | June 2020(6) | 10.0 | % | 1,807 | 1,176 | |||||||||
| Subordinated Promissory Note | September 2020 | 9.5 | % | 563 | 563 | |||||||||
| Subordinated Promissory Note | December 2021 | 10.5 | % | 146 | 146 | |||||||||
| Subordinated Promissory Note | April 2020 | 10.0 | % | 100 | 100 | |||||||||
| Subordinated Promissory Note | April 2021 | 10.0 | % | 174 | 174 | |||||||||
| Subordinated Promissory Note | August 2022 | 11.0 | % | 200 | 200 | |||||||||
| Subordinated Promissory Note | March 2023 | 11.0 | % | 169 | 169 | |||||||||
| Subordinated Promissory Note | April 2020 | 6.5 | % | 500 | 500 | |||||||||
| Subordinated Promissory Note | February 2021 | 11.0 | % | 600 | 600 | |||||||||
| Subordinated Promissory Note | Demand | 5.0 | % | 500 | 500 | |||||||||
| Subordinated Promissory Note | Demand | 5.0 | % | 3 | 3 | |||||||||
| Subordinated Promissory Note | December 2023 | 11 | % | 20 | - | |||||||||
| Subordinated Promissory Note | February 2024 | 11 | % | 20 | - | |||||||||
| Senior Subordinated Promissory Note | March 2022(3) | 10.0 | % | 400 | 400 | |||||||||
| Senior Subordinated Promissory Note | March 2022(4) | 1.0 | % | 728 | 728 | |||||||||
| Junior Subordinated Promissory Note | March 2022(4) | 22.5 | % | 417 | 417 | |||||||||
| Senior Subordinated Promissory Note | October 2020(5) | 1.0 | % | 279 | 279 | |||||||||
| Junior Subordinated Promissory Note | October 2020(5) | 20.0 | % | 173 | 173 | |||||||||
| $ | 7,799 | $ | 6,628 | |||||||||||
| (1) | Interest rate per annum, based upon actual days outstanding and a 365/366-day year. |
| (2) | Due six months after lender gives notice. |
| (3) | Lender may require us to repay $20 of principal and all unpaid interest with 10 days’ notice. |
| (4) | These notes were issued to the same holder and, when calculated together, yield a blended return of 11% per annum. |
| (5) | These notes were issued to the same holder and, when calculated together, yield a blended return of 10% per annum. |
| (6) | Amount due in June 2020 is $1,000 with the remainder due November 2020. |
Redeemable Preferred Equity and Members’ Capital
We strive to maintain a reasonable (about 15%) balance between (1) redeemable preferred equity plus members’ capital and (2) total assets. The ratio of redeemable preferred equity plus members’ capital to loan assets was 13% as of March 31, 2020 and December 31, 2019. We anticipate this ratio to decrease until more preferred equity is added.
| 31 |
Priority of Borrowings
The following table displays our borrowings and a ranking of priority. The lower the number, the higher the priority.
Priority Rank | March 31, 2020 | December 31, 2019 | ||||||||
| Borrowing Source | ||||||||||
| Purchase and sale agreements and other secured borrowings | 1 | $ | 25,445 | $ | 26,806 | |||||
| Secured line of credit from affiliates | 2 | 614 | 189 | |||||||
| Unsecured line of credit (senior) | 3 | 500 | 500 | |||||||
| Other unsecured debt (senior subordinated) | 4 | 1,407 | 1,407 | |||||||
| Unsecured Notes through our public offering, gross | 5 | 21,070 | 20,308 | |||||||
| Other unsecured debt (subordinated) | 5 | 5,302 | 4,131 | |||||||
| Other unsecured debt (junior subordinated) | 6 | 590 | 590 | |||||||
| Total | $ | 54,928 | $ | 53,931 | ||||||
Liquidity and Capital Resources
Our primary liquidity management objective is to meet expected cash flow needs while continuing to service our business and customers. Combined loans outstanding as of March 31, 2020 and December 31, 2019 was 227 and 250, respectively. Gross loans receivable totaled $56,077 and $57,608, respectively. Our unfunded commitments to extend credit, which have similar collateral, credit and market risk to our outstanding loans, were $15,259 and $16,662 as March 31, 2020 and December 31, 2019, respectively.
We anticipate an increase in our gross loan receivables over the 12 months subsequent to March 31, 2020 by directly increasing originations by funding new loans to borrowers in stronger markets for the purpose of developing presold homes, which loans have reduced loan-to-value ratios. During the second and third quarter of 2020, we expect that loan originations will decrease compared to the same period of 2019 due to risk mitigation in response to COVID-19. In addition, competition has declined; therefore, we believe the ability to return to historical levels may be achieved through 2021.
To fund our combined loans, we rely on secured debt, unsecured debt, and equity, which are described in the following table:
| Source of Liquidity | As of March 31, 2020 | As of December 31, 2019 | ||||||
| Secured debt | $ | 26,054 | $ | 26,991 | ||||
| Unsecured debt | 28,416 | 26,520 | ||||||
| Equity | 6,963 | 7,147 | ||||||
Secured debt, net of deferred financing costs decreased $937 during the three months ended March 31, 2020, which consisted of a decrease in borrowings secured by loans of $1,362 offset by an increase in affiliate lines of $425. We anticipate increasing our secured debt by roughly half of the increase in loan asset balances over the 12 months subsequent to March 31, 2020 through our existing loan purchase and sale agreements and additional lines of credit.
We anticipate that the other half of the loan asset growth will come from a combination of increases in our unsecured debt and equity. Unsecured debt, net of deferred financing costs increased $1,896 during the three months ended March 31, 2020 due primarily to an increased participation in our Notes program of $725 and other unsecured debts of $1,171. We anticipate an increase in our unsecured debt through increased sales in the Notes Program to cover most of the increase in loan assets not covered by increases in our secured debt during the 12 months subsequent to March 31, 2020.
In addition, in May 2020, we borrowed approximately $362 pursuant to the Paycheck Protection Program (“PPP”), created under the Coronavirus Aid, Relief, and Economic Security Act, or CARES Act. The PPP is intended to provide loans to qualified businesses to cover payroll and certain other identified costs. Funds from the loan may only be used for certain purposes, including payroll, benefits, rent, and utilities. All or a portion of the loan may be forgivable, as provided by the terms of the PPP.
| 32 |
Equity decreased $184 during the three months ended March 31, 2020 due primarily to distributions of Class A common equity of $217 which was offset by earned but not paid distributions of Series C cumulative preferred units of $89. We anticipate an increase in our equity during the 12 months subsequent to March 31, 2020, through the issuance of additional Series C Preferred Units. If we are not able to increase our equity through the issuance of additional Series C Preferred Units, we will rely more heavily on raising additional funds through the Notes Program. If we anticipate the ability to not fund our projected increases in loan balances as discussed above, we may reduce new loan originations to reduce need for additional funds.
Contractual Obligations
The following table shows the maturity of outstanding debt as of March 31, 2020:
| Year Maturing | Total Amount Maturing |
Public Offering |
Other Unsecured |
Secured Borrowings | ||||||||||||
| 2020 | $ | 31,813 | $ | 1,949 | $ | 4,424 | $ | 25,439 | ||||||||
| 2021 | 13,006 | 11,570 | 1,420 | 16 | ||||||||||||
| 2022 | 5,225 | 3,463 | 1,746 | 16 | ||||||||||||
| 2023 | 1,027 | 821 | 189 | 17 | ||||||||||||
| 2024 and thereafter | 3,857 | 3,267 | 20 | 571 | ||||||||||||
| Total | $ | 54,928 | $ | 21,070 | $ | 7,799 | $ | 26,059 | ||||||||
The total amount maturing through year ending December 31, 2020 is $31,813, which consists of secured borrowings of $25,439 and unsecured borrowings of $6,373.
Secured borrowings maturing through year ending December 31, 2020 significantly consists of loan purchase and sale agreements with two loan purchasers (Builder Finance, Inc. and S. K. Funding, LLC) and six lenders. Our secured borrowings are classified as maturing during 2020 due primarily to the related collateral is demand loans. The following lists our secured facilities with maturity and renewal dates:
| ● | Swanson – $5,193 due July 2021, will automatically renew unless notice is given; | |
| ● | Shuman – $1,325 due July 2020, will automatically renew unless notice is given; | |
| ● | S. K. Funding, LLC – $3,500 of the total due July 2020, will automatically renew unless notice is given; | |
| ● | S. K. Funding, LLC – $3,271 no expiration date; | |
| ● | Builder Finance, Inc. – $8,428 no expiration date; | |
| ● | New LOC Agreements – $3,096 generally one-month notice and six months to reduce principal balance to zero; | |
| ● | William Myrick – $614 no expiration date; and | |
| ● | Mortgage payable – $11. |
Unsecured borrowings due by December 31, 2020 consist of Notes issued pursuant to the Notes Program and other unsecured debt of $1,949 and $4,424, respectively. To the extent that Notes issued pursuant to the Notes Program are not reinvested upon maturity, we will be required to fund the maturities, which we anticipate funding through the issuance of new Notes in our Notes Program. Historically, approximately 81% of our Note holders reinvest upon maturity. Our other unsecured debt has historically renewed. For more information on other unsecured borrowings, see Note 5 – Borrowings. If other unsecured borrowings are not renewed in the future, we anticipate funding such maturities through investments in our Notes Program.
Summary
We have the funding available to address the loans we have today, including our unfunded commitments. We anticipate growing our assets through the net sources and uses (12-month liquidity) listed above as well as future capital increases from debt, redeemable preferred equity, and regular equity. Our expectation to grow loan asset balances is subject to changes due to changes in demand, competition, and COVID-19. Although our secured debt is almost entirely listed as currently due because of the underlying collateral being demand notes, the vast majority of our secured debt is either contractually set to automatically renew unless notice is given or, in the case of purchase and sale agreements, has no end date as to when the purchasers will not purchase new loans (although they are never required to purchase additional loans).
| 33 |
Inflation, Interest Rates, and Housing Starts
Since we are in the housing industry, we are affected by factors that impact that industry. Housing starts impact our customers’ ability to sell their homes. Faster sales generally mean higher effective interest rates for us, as the recognition of fees we charge is spread over a shorter period. Slower sales generally mean lower effective interest rates for us. Slower sales also are likely to increase the default rate we experience.
Housing inflation generally has a positive impact on our operations. When we lend initially, we are lending a percentage of a home’s expected value, based on historical sales. If those estimates prove to be low (in an inflationary market), the percentage we loaned of the value actually decreases, reducing potential losses on defaulted loans. The opposite is true in a deflationary housing price market. It is our opinion that values are average in many of the housing markets in the U.S. today, and our lending against these values is safer than loans made by financial institutions in 2006 to 2008. Our analysis of the COVID-19 impact on housing in the markets in which we do business is mixed. In many markets, our customers see demand as outpacing new housing starts. In some markets, few houses are selling due to governmental restrictions on Realtors. In Orlando, Florida, we anticipate some significant lack of demand for customers who sell more affordable homes, which is likely to lead to reductions in selling prices. We note that nationwide, fewer first-time home buyers will qualify for government backed loans due to FICO score and other criteria changes.
Interest rates have several impacts on our business. First, rates affect housing (starts, home size, etc.). High long-term interest rates may decrease housing starts, having the effects listed above. Higher interest rates will also affect our investors. We believe that there will be a spread between the rate our Notes yield to our investors and the rates the same investors could get on deposits at FDIC insured institutions. We also believe that the spread may need to widen if these rates rise. For instance, if we pay 7% above average CD rates when CDs are paying 0.5%, when CDs are paying 3%, we may have to have a larger than 7% difference. This may cause our lending rates, which are based on our cost of funds, to be uncompetitive. High interest rates may also increase builder defaults, as interest payments may become a higher portion of operating costs for the builder. Higher short-term rates may increase the rates builders are charged by banks faster than our rates to the builder will grow, which might be a benefit for us. Below is a chart showing three-year U.S. treasury rates, which are being used by us here to approximate CD rates. The rates we are paying our investors are going down due to COVID-19 and our recent offering which includes shorter redemption options with lower returns., because other alternative investments are paying lower rates. This in turn will lower the rates to our borrowers over time. We also anticipate some lower cost secured funding in the second quarter of 2020 which will also lower both our cost of funds and the rate we charge our customers.
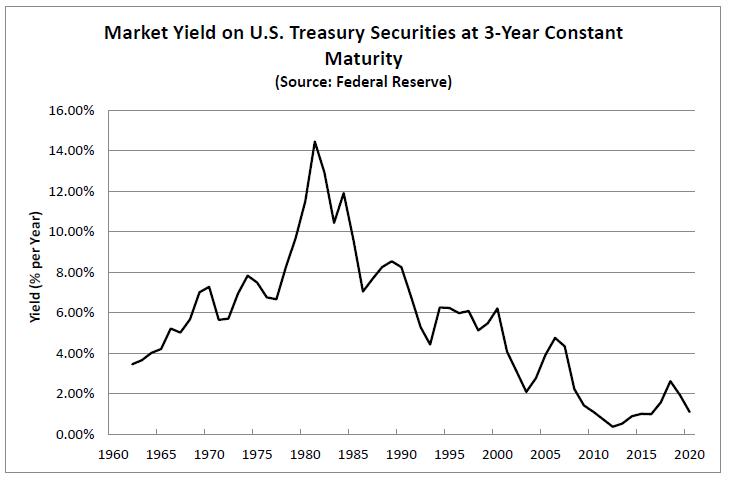
| 34 |
Housing prices are also generally correlated with housing starts, so that increases in housing starts usually coincide with increases in housing values, and the reverse is generally true. Below is a graph showing single family housing starts from 2000 through today.
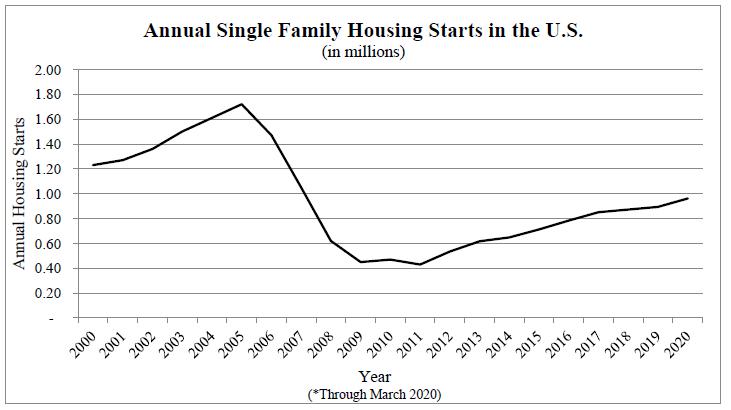
Source: U.S. Census Bureau
To date, changes in housing starts, CD rates, and inflation have not had a material impact on our business.
Off-Balance Sheet Arrangements
As of March 31, 2020, and December 31, 2019, we had no off-balance sheet transactions, nor do we currently have any such arrangements or obligations.
ITEM 3. QUANTITATIVE AND QUALITATIVE DISCLOSURE ABOUT MARKET RISK
We are a smaller reporting company as defined by Rule 12b-2 of the Securities Exchange Act of 1934 and are not required to provide the information under this item.
ITEM 4. CONTROLS AND PROCEDURES
Disclosure Controls and Procedures
As of the end of the period covered by this report, management including our Chief Executive Officer (our principal executive officer) and Acting Chief Financial Officer (our principal financial officer) evaluated the effectiveness of the design and operation of our disclosure controls and procedures. Based upon, and as of the date of, the evaluation, our CEO (our principal executive officer) and Acting CFO (our principal financial officer) concluded that the disclosure controls and procedures were effective as of the end of the period covered by this report to ensure that information required to be disclosed in the reports we file and submit under the Securities Exchange Act of 1934, as amended (the “Exchange Act”), is recorded, processed, summarized and reported as and when required. Disclosure controls and procedures include, without limitation, controls and procedures designed to ensure that information required to be disclosed by us in the reports we file and submit under the Exchange Act is accumulated and communicated to our management, including our CEO (our principal executive officer) and Acting CFO (our principal financial officer), as appropriate to allow timely decisions regarding required disclosure.
| 35 |
Internal Control over Financial Reporting
There has been no change in our internal controls over financial reporting during the quarter ended March 31, 2020 that has materially affected, or is reasonably likely to materially affect, our internal controls over financial reporting.
None.
Not applicable.
ITEM 2. UNREGISTERED SALES OF EQUITY SECURITIES AND USE OF PROCEEDS
| (a) | Reinvestments in Partial Series C Cumulative Preferred Units
Investors in the Series C cumulative preferred units (“Series C Preferred Units”) may elect to reinvest their distributions in additional Series C Preferred Units (the “Series C Reinvestment Program”). Pursuant to the Series C Reinvestment Program, we issued the following Series C Preferred Units on March 31, 2020: |
| Owner | Units | Amount | ||||||
| Daniel M. and Joyce S. Wallach | 0.4306273 | $ | 43,062.73 | |||||
| Gregory L. Sheldon and Madeline M. Sheldon | 0.1021601 | 10,216.01 | ||||||
| BLDR, LLC | 0.1393209 | 13,932.09 | ||||||
| Schultz Family Living Trust | 0.0346578 | 3,465.78 | ||||||
| Jeffrey L. Eppinger | 0.1212040 | 12,120.40 | ||||||
| Fernando Ascencio and Lorraine Carol Ascencio | 0.0648449 | 6,484.49 | ||||||
| Total | 0.8928150 | $ | 89,281.50 | |||||
| The proceeds received from the sales of the partial Series C Preferred Units in these transactions were used for the funding of construction loans. The transactions in Series C Preferred Units described above were effected in private transactions exempt from the registration requirements of the Securities Act under Section 4(a)(2) of the Securities Act. The transactions described above did not involve any public offering, were made without general solicitation or advertising, and the buyer represented to us that he/she/it is an “accredited investor” within the meaning of Rule 501 of Regulation D promulgated under the Securities Act, with access to all relevant information necessary to evaluate the investment in the Series C Preferred Units. |
| (b) | We registered up to $70,000,000 in Fixed Rate Subordinated Notes (“Notes”) in our current public offering, which is our third public offering of Notes (SEC File No. 333-224557, effective March 22, 2019). As of March 31, 2020, we had issued $13,163,000 in Notes pursuant to our current public offering. As of March 31, 2020, we incurred expenses of $428,000 in connection with the issuance and distribution of the Notes in our current public offering, which were paid to third parties. These expenses were not for underwriters or discounts, but were for advertising, printing, and professional services. Net offering proceeds as of March 31, 2020 were $12,735,000, all of which was used to increase loan balances. | |
| (c) | None. |
| 36 |
ITEM 3. DEFAULTS UPON SENIOR SECURITIES
None.
ITEM 4. MINE SAFETY DISCLOSURES
Not applicable.
| (a) | During the quarter ended March 31, 2020, there was no information required to be disclosed in a report on Form 8-K which was not disclosed in a report on Form 8-K.
On May 5, 2020, we entered into an agreement to borrow approximately $362,000 from LCA Bank Corporation pursuant to the Paycheck Protection Program (“PPP”), created under the Coronavirus Aid, Relief, and Economic Security Act, or CARES Act. The PPP is intended to provide loans to qualified businesses to cover payroll and certain other identified costs. The loan has an interest rate of 1.0% and a term of 24 months. No payments are due for the first 6 months, although interest accrues, and monthly payments, which include interest, are due over the next 18 months to pay off the loan. Funds from the loan may only be used for certain purposes, including payroll, benefits, rent, and utilities. All or a portion of the loan may be forgivable, as provided by the terms of the PPP. The loan is evidenced by a promissory note, which contains customary events of default relating to, among other things, payment defaults and breaches of representations. We may prepay the loan at any time prior to maturity with no prepayment penalties.
The foregoing description of the loan obtained pursuant to the PPP does not purport to be complete and is qualified in its entirety by reference to the full text of the Loan Agreement and the Note attached to this Quarterly Report on Form 10-Q as Exhibit 10.1 and 10.2, respectively, and incorporated herein by reference. | |
| (b) | During the quarter ended March 31, 2020, there were no material changes to the procedures by which members may recommend nominees to our board of managers. |
The exhibits required to be filed with this report are set forth on the Exhibit Index hereto and incorporated by reference herein.
EXHIBIT INDEX
The following exhibits are included in this report on Form 10-Q for the period ended March 31, 2020 (and are numbered in accordance with Item 601 of Regulation S-K).
* Filed herewith.
** Pursuant to Regulation 406T of Regulation S-T, these Interactive Data Files are deemed not filed or part of a registration statement or prospectus for purpose of Section 11 or 12 of the Securities Act of 1933, as amended, or Section 18 of the Securities Exchange Act of 1934, as amended, and are otherwise not subject to liability.
| 37 |
SIGNATURES
Pursuant to the requirements of the Securities Exchange Act of 1934, the Registrant has duly caused this report to be signed on its behalf by the undersigned thereunto duly authorized.
SHEPHERD’S FINANCE, LLC (Registrant) | ||
| Dated: May 11, 2020 | By: | /s/ Catherine Loftin |
| Catherine Loftin | ||
| Acting Chief Financial Officer | ||
| 38 |