Attached files
| file | filename |
|---|---|
| 8-K - 8-K - TCF FINANCIAL CORP | a12-26022_18k.htm |
Exhibit 99.1
|
|
TCF Financial Corporation 2012 Third Quarter Investor Presentation Foundational strength. Visionary future. |
|
|
2 Cautionary Statements for Purposes of the Safe Harbor Provisions of the Securities Litigation Reform Act Any statements contained in this presentation regarding the outlook for the Company’s businesses and their respective markets, such as projections of future performance, guidance, statements of the Company’s plans and objectives, forecasts of market trends and other matters, are forward-looking statements based on the Company’s assumptions and beliefs. Such statements may be identified by such words or phrases as “will likely result,” “are expected to,” “will continue,” “outlook,” “will benefit,” “is anticipated,” “estimate,” “project,” “management believes” or similar expressions. These forward-looking statements are subject to certain risks and uncertainties that could cause actual results to differ materially from those discussed in such statements and no assurance can be given that the results in any forward-looking statement will be achieved. For these statements, TCF claims the protection of the safe harbor for forward-looking statements contained in the Private Securities Litigation Reform Act of 1995. Any forward-looking statement speaks only as of the date on which it is made, and we disclaim any obligation to subsequently revise any forward-looking statement to reflect events or circumstances after such date or to reflect the occurrence of anticipated or unanticipated events. Certain factors could cause the Company’s future results to differ materially from those expressed or implied in any forward-looking statements contained in this Quarterly Report on Form 10-Q. These factors include the factors discussed in Part I, Item 1A of the Company’s Annual Report on Form 10-K for the year ended December 31, 2011 under the heading “Risk Factors,” the factors discussed below and any other cautionary statements, written or oral, which may be made or referred to in connection with any such forward-looking statements. Since it is not possible to foresee all such factors, these factors should not be considered as complete or exhaustive. Adverse Economic or Business Conditions, Credit and Other Risks. Deterioration in general economic and banking industry conditions, including defaults, anticipated defaults or rating agency downgrades of sovereign debt (including debt of the U.S.), or continued high rates of or increases in unemployment in TCF’s primary banking markets; adverse economic, business and competitive developments such as shrinking interest margins, deposit outflows, deposit account attrition or an inability to increase the number of deposit accounts; adverse changes in credit quality and other risks posed by TCF’s loan, lease, investment and securities available for sale portfolios, including declines in commercial or residential real estate values or changes in the allowance for loan and lease losses dictated by new market conditions or regulatory requirements; interest rate risks resulting from fluctuations in prevailing interest rates or other factors that result in a mismatch between yields earned on TCF’s interest-earning assets and the rates paid on its deposits and borrowings; foreign currency exchange risks; counterparty risk, including the risk of defaults by our counterparties or diminished availability of counterparties who satisfy our credit quality requirements; decreases in demand for the types of equipment that TCF leases or finances; limitations on TCF’s ability to attract and retain manufacturers and dealers to expand the inventory finance business. Legislative and Regulatory Requirements. New consumer protection and supervisory requirements and regulations, including those resulting from action by the Consumer Financial Protection Bureau and changes in the scope of Federal preemption of state laws that could be applied to national banks; the imposition of requirements with an adverse impact relating to TCF’s lending, loan collection and other business activities as a result of the Dodd-Frank Act, or other legislative or regulatory developments such as mortgage foreclosure moratorium laws or imposition of underwriting or other limitations that impact the ability to use certain variable-rate products; impact of legislative, regulatory or other changes affecting customer account charges and fee income or expense; changes to bankruptcy laws which would result in the loss of all or part of TCF’s security interest due to collateral value declines; deficiencies in TCF’s compliance under the Bank Secrecy Act in past or future periods, which may result in regulatory enforcement action including monetary penalties; increased health care costs resulting from Federal health care reform legislation; adverse regulatory examinations (continued) |
|
|
3 Cautionary Statements for Purposes of the Safe Harbor Provisions of the Securities Litigation Reform Act and resulting enforcement actions or other adverse consequences such as increased capital requirements or higher deposit insurance assessments; heightened regulatory practices, requirements or expectations, including, but not limited to, requirements related to the Bank Secrecy Act and anti-money laundering compliance activity. Earnings/Capital Risks and Constraints, Liquidity Risks. Limitations on TCF’s ability to pay dividends or to increase dividends because of financial performance deterioration, regulatory restrictions or limitations; increased deposit insurance premiums, special assessments or other costs related to adverse conditions in the banking industry, the economic impact on banks of the Dodd-Frank Act and other regulatory reform legislation; the impact of financial regulatory reform, including additional capital, leverage, liquidity and risk management requirements or changes in the composition of qualifying regulatory capital (including those resulting from U.S. implementation of Basel III requirements); adverse changes in securities markets directly or indirectly affecting TCF’s ability to sell assets or to fund its operations; diminished unsecured borrowing capacity resulting from TCF credit rating downgrades and unfavorable conditions in the credit markets that restrict or limit various funding sources; costs associated with new regulatory requirements or interpretive guidance relating to liquidity; uncertainties relating to customer opt-in preferences with respect to overdraft fees on point of sale and ATM transactions or the success of TCF’s reintroduction of the Free Checking product which may have an adverse impact on TCF’s fee revenue; uncertainties relating to future retail deposit account changes, including limitations on TCF’s ability to predict customer behavior and the impact on TCF’s fee revenues. Competitive Conditions; Supermarket Branching Risk; Growth Risks. Reduced demand for financial services and loan and lease products; adverse developments affecting TCF’s supermarket banking relationships or any of the supermarket chains in which TCF maintains supermarket branches including the announcement on July 11, 2012 by SUPERVALU that it is exploring strategic alternatives; customers completing financial transactions without using a bank; the effect of any negative publicity; slower than anticipated growth in existing or acquired businesses; inability to successfully execute on TCF’s growth strategy through acquisitions or cross-selling opportunities; failure to expand or diversify TCF’s balance sheet through programs or new opportunities; failure to successfully attract and retain new customers; product additions and addition of distribution channels (or entry into new markets) for existing products. Technological and Operational Matters. Technological or operational difficulties, loss or theft of information, third-party service provider or counterparty failures and the possibility that deposit account losses (fraudulent checks, etc.) may increase; failure to keep pace with technological change. Litigation Risks. Results of litigation, including class action litigation concerning TCF’s lending, deposit or leasing activities including account servicing processes or fees or charges, or employment practices, and possible increases in indemnification obligations for certain litigation against Visa U.S.A. and potential reductions in card revenues resulting from such litigation or other litigation against Visa. Accounting, Audit, Tax and Insurance Matters. Changes in accounting standards or interpretations of existing standards; federal or state monetary, fiscal or tax policies, including adoption of state legislation that would increase state taxes; ineffective internal controls; adverse state or Federal tax assessments or findings in tax audits; lack of or inadequate insurance coverage for claims against TCF; potential for claims and legal action related to TCF’s fiduciary responsibilities. |
|
|
4 $17.9 billion national bank holding company headquartered in Minnesota • 39th largest publicly-traded U.S. based bank holding company by asset size 429 bank branches in eight states, • 26th largest U.S. branch network • Five campus alliances; 5th largest in campus card banking relationships Total equity to total assets of 9.87% Tangible realized common equity of 7.55%1 85% of total assets are loans & leases Corporate Profile At September 30, 2012 1 36 7 108 25 53 194 5 Well-Diversified Loan Portfolio ($ millions) At 12/31/01 $5,242 $2,045 $957 1 See “Reconciliation of GAAP to Non-GAAP Measures – Tangible Realized Common Equity” slide At 9/30/12 Branch Summary Leasing & Equipment Finance 12% Leasing & Equipment Finance 21% Inventory Finance 9% Consumer Real Estate and Other 44% Commercial Lending 23% Auto Finance 3% |
|
|
5 As a % of total assets 2 : Net interest income 4.49% 3.17% Total non-interest income 3 2.22% 1.22% Total revenue 3 6.70% 4.39% Pre-tax pre-provision profit 3,4 2.59% 1.54% Net interest margin 2 4.85% 3.58% Yield on loans 2 5.50% 5.20% Yield on securities 2 3.15% 2.89% Rate on deposits 2 .32% .52% As a % of total assets: Securities 3.1% 5.3% Loans and leases 85.1% 61.6% Deposits 76.7% 74.8% Borrowings 11.5% 12.3% TCF 3Q12 Banks $10-$50 billion in total assets1 2Q12 Average TCF has a higher margin because it has more loans at a higher rate and more deposits at a lower rate TCF has more fee income because it has a high number of retail checking accounts, as well as fee income from its national lending businesses 1 Excludes TCF 2 Annualized 3 Excludes gains on sales of securities and non-recurring revenue (see “Reconciliation of GAAP to Non-GAAP Measures – Revenue Ratios” slide) 4 Total revenue less non-interest expense Peer Analysis |
|
|
6 A Building and Investing Year Expansion of National Lending Programs (2011 and Forward) Functionally Organized Management Structure (January 2012) Balance Sheet Repositioning (March 2012) Prudential Bank & Trust Deposit Acquisition (June 2012) Preferred Stock and Subordinated Debt Offerings (June 2012) The Return of TCF Free Checking (June 2012) Trust Preferred Redemption (July 2012) 2012: Repositioning, reinventing and improving performance 2013: Execution and results |
|
|
7 Revenue & Expenses |
|
|
8 ($ millions) 1 Excludes gains on securities of $5.8 million, $76.6 million, $13.1 million and $13 million at 12/11, 3/12, 6/12 and 9/12, respectively 2 Annualized 2012 YTD revenue was impacted by: Balance sheet repositioning occurring in 1Q12 Strong yields on loans and leases driven by mix changes in the portfolio Sale of auto loans 3Q12 net margin rate and net interest income increases were impacted by: Increases in auto finance balances Redemption of trust preferred securities 2 14-year high net interest margin rate Revenue Growth1 9/11, $1.6 million, |

|
|
9 1 Quarter-to-date, core revenues and non-interest income exclude gains on securities of $13 million in the third quarter of 2012 2 Annualized 3 Includes gain on sale of consumer real estate loans of $4.6 million Diversified Core Revenue Base1 Core Revenues1 Mix of Core Non-Interest Income1 ($ millions) September 30, 2012 ($ millions) 2.22% of total assets2 $99 Million Strong core revenues1 – 6.70% of total assets2 Increased core fee revenue from growth in national lending businesses Balance sheet repositioning has increased TCF’s ability to maximize net interest income Banking Fees and Service Charges Card Revenue National Lending Businesses ATM Revenue and Other3 4.49% of total assets2 |
|
|
10 3Q11 4Q11 1Q12 2Q12 3Q12 Change from Prior Quarter Fees & Service Charges, Card Revenue and ATM Revenue $93.7 $71.3 $61.3 $67.9 $62.8 (8)% Marketing & Premium Expense 8.2 8.7 8.6 7.1 4.8 (32)% Net Fee Income $85.5 $62.6 $52.7 $60.8 $58.0 (5)% Net fee income decrease of $2.8 million was driven by the loss of monthly maintenance fees; expect to fill this gap through quality account net growth and new product initiatives Launch of Free Checking increased 3Q12 production from a low point in 2Q12 Attrition rates peaked in 4Q11 and 1Q12, however, changes have had the desired impact and attrition rates have declined in consecutive quarters Average total deposits have increased for eight consecutive quarters ($ millions) 1 Quarterly average balance Net Banking Fee Generation |

|
|
11 ($ millions) 1 See “Reconciliation of GAAP to Non-GAAP Measures – Core Operating Expenses” slide Core Operating Expenses1 |
|
|
12 Balance Sheet Growth |

|
|
13 Loan & Lease Balances ($ millions) Well Diversified Portfolio % of Total Loans & Leases: Consumer RE & Other 55% 50% 49% 49% 44% Commercial 26% 26% 25% 25% 23% National Lending 19% 24% 26% 26% 33% 8% YTD Growth Rate |

|
|
14 ($ billions) 3Q11 YTD 3Q12 YTD Change Period Beginning Balance $14.8 $14.1 $ (.7) New Volume 4.2 7.8 3.6 Run-off 1 (4.7) (6.7) (2.0) Period Ending Balances $14.3 $15.2 $ .9 ($ millions) 3Q12 YTD vs. 3Q11 YTD Retail Lending $ 171 Commercial Banking 597 Leasing 206 Inventory Finance2 1,870 Auto Finance 739 Total Lending $ 3,583 Change in Volume 1 Includes activity from payments, pre-payments, charge-offs and loan and lease sales 2 Origination levels impacted by the high velocity of fundings and repayments with dealers Strong diversity across asset classes Origination growth from all businesses Loan & Lease Originations |
|
|
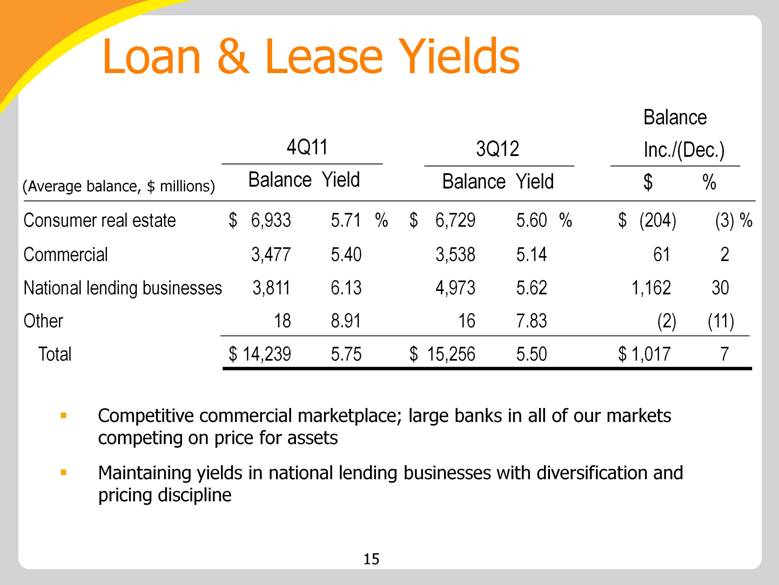
15 4Q11 Balance Yield 3Q12 Balance Yield Balance Inc./(Dec.) $ % Consumer real estate $ 6,933 5.71 % $ 6,729 5.60 % $ (204) (3) % Commercial 3,477 5.40 3,538 5.14 61 2 National lending businesses 3,811 6.13 4,973 5.62 1,162 30 Other 18 8.91 16 7.83 (2) (11) Total $ 14,239 5.75 $ 15,256 5.50 $ 1,017 7 (Average balance, $ millions) Competitive commercial marketplace; large banks in all of our markets competing on price for assets Maintaining yields in national lending businesses with diversification and pricing discipline Loan & Lease Yields |
|
|
16 $9,849 $11,386 $11,455 $12,103 $13,558 8,000 9,000 10,000 11,000 12,000 13,000 14,000 12/08 12/09 12/10 12/11 9/12 Primary funding source for asset growth Strong Deposit Franchise Quarterly Average Balances ($ millions) Average rate1: 1.51% .74% .46% .32% .32% 1 Quarter-to-date (annualized) % of total deposits: Checking 40% 36% 38% 37% 34% Savings & Money Market 35% 52% 53% 54% 52% CDs 25% 12% 9% 9% 14% Average total deposits have increased for 8 consecutive quarters |
|
|
17 1 Quarterly average balances 2 Annualized Convenience • TCF attracts a large and diverse customer base by offering a host of convenient banking services: – Free Checking – Conveniently located traditional, supermarket and campus branches open seven days a week – Free debit cards, free coin counting and free withdrawals at over 660 ATMs – TCF Free Online Banking and Free Mobile Banking Primary funding source for loan growth Average interest rate on deposits: .32%2 Low-Cost Deposit Base1 Deposit Strategy |

|
|
18 Credit Quality |
|
|
19 Implemented recent OCC clarification on consumer loans subject to a bankruptcy discharge $157.5 million of loans impacted resulting in a $31.5 million pre-tax provision charge and $103.2 million in additional non-accrual loans 93% of the accounts moved to non-accrual were less than 60 days past due on their payments as of September 30, 2012 82% of the loans impacted were first mortgages and 18% were junior liens Expect a decrease in future levels of provision for loan and lease losses as a result of this action Decrease in commercial classified loans as TCF more aggressively addressed commercial credit issues Continued strong credit performance in the national lending businesses Third Quarter Provision |
|
|
20 Consumer Real Estate Excluding the effects of the regulatory bankruptcy clarification: • Consumer real estate non-accruals – $130 million, down 7% from 2Q12 • Consumer real estate net charge-offs – $31 million, down 10% from 2Q12 Over 60-day delinquencies decreased $7 million from 2Q12 Expect modest improvements in consumer real estate credit quality as home values continue to stabilize Commercial Aggressively addressed commercial credit issues Commercial classified assets decreased $80 million from 2Q12 Expect improving but still challenging workout environment for commercial real estate non-performing assets National Lending Continued strong credit performance in the national lending businesses Credit Quality Summary |
|
|
21 Credit Quality Trends – Consumer Real Estate ($ millions) 60+ Day Delinquencies Accruing TDRs Non-Accrual Loans & Leases 1 Excludes the impact of bankruptcy-related regulatory guidance 2 Annualized 1 Real Estate Owned Allowance for Loan and Lease Losses Net-Charge-offs2 4.44% 1 |
|
|
22 Credit Quality Trends – Commercial ($ millions) Accruing TDRs Non-Accrual Loans & Leases 1 Excludes classified assets that are 60+ days delinquent 2 Annualized Performing Classified Assets1 Real Estate Owned Allowance for Loan and Lease Losses Net-Charge-offs2 |
|
|
23 Credit Quality Trends – National Lending ($ millions) 60+ Day Delinquencies Net-Charge-offs1 1 Annualized |
|
|
24 Capital |
|
|
25 1 See “Reconciliation of GAAP to Non-GAAP Measures – Tangible Realized Common Equity” slide 2 See “Reconciliation of GAAP to Non-GAAP Measures – Tier 1 Common Capital Ratio” slide Capital Ratios 2Q12 3Q12 Tangible realized common equity1 7.50% 7.55% Total equity to total assets 9.83% 9.87% Tier 1 common capital2 9.26% 9.17% Tier 1 leverage capital 8.64% 8.66% Tier 1 risk-based capital 10.53% 10.40% Total risk-based capital 13.11% 12.96% Continue to build capital through retained earnings in the quarter and going forward Basel III (Notice of Proposed Rulemaking) is in a comment period and not scheduled to start phasing in until 2014, with full compliance by 2019 Capital Ratios – Holding Company |
|
|
26 Summary 2012: Repositioning, reinventing and improving performance Return to Free Checking has had the desired effect – increased checking account production and decreased attrition Strong loan and lease growth continues in the national lending businesses Credit trends continue to be encouraging as we work through a challenging environment Outlook 2013: Execution and results Focus on performance improvement through credit and continued growth in originations Summary |
|
|
27 Appendix |
|
|
28 Loan & Lease Geographic Diversification ($ millions) 28 At 9/30/12: Consumer Real Estate and Other Commercial Real Estate and Commercial Business Leasing and Equipment Finance Inventory Finance Auto Finance Total Minnesota $ 2,558.6 $ 868.1 $ 92.7 $ 44.2 $ 5.8 $ 3,569.4 Illinois 2,025.4 811.4 106.4 40.5 16.7 3,000.4 Michigan 776.9 641.5 130.5 53.1 5.6 1,607.6 Wisconsin 417.5 672.5 56.8 49.0 .6 1,196.4 Colorado 584.5 105.9 40.7 15.4 4.9 751.4 California 111.7 16.5 406.5 47.1 55.0 636.8 Texas -- 8.9 255.1 86.5 16.1 366.6 Canada -- -- 2.3 340.0 -- 342.3 Florida 2.5 47.2 160.8 68.4 16.5 295.4 New York 2.1 -- 167.1 57.7 1.4 228.3 Ohio 1.9 36.4 129.0 48.0 3.4 218.7 Indiana 22.4 99.1 56.7 27.1 3.0 208.3 Pennsylvania 2.2 -- 130.5 47.9 6.9 187.5 Arizona 46.2 42.6 69.9 16.4 10.8 185.9 Other 123.7 161.1 1,353.0 525.0 260.4 2,423.2 Total $ 6,675.6 $ 3,511.2 $ 3,158.0 $ 1,466.3 $ 407.1 $ 15,218.2 |
|
|
29 Leasing & Equipment Finance 1 Includes operating leases ($58.1 million at September 30, 2012) 2 Excludes acquired portfolios of $107.6 million and non-accrual loans and leases 3 Annualized (Balances in $ millions)1 At September 30, 2012 14th largest bank-affiliated leasing company and 29th largest equipment finance/leasing company in the U.S. Diverse equipment types • 23% specialty vehicles, 14% manufacturing, 13% medical, 10% construction 425 employees 3Q12 fee revenue of $20.5 million, 21% of total fees and other revenue 5.33% quarterly average yield3 3Q12 originations up 14% from same 2011 period Over 60-day delinquency rate .05%2 Net charge-offs: 2010 2011 2012 1.00% .41% .37%3 Uninstalled backlog of $509 million Core portfolio increased 10.3% year-over-year |
|
|
30 TCF Inventory Finance (Balances in $ millions) At September 30, 2012 Focus on lawn and garden products, powersports, consumer electronics and appliances, recreation vehicles and marine products Experienced and seasoned management Operates in the U.S. and Canada 298 employees 100% variable-rate receivables 6.19% quarterly average yield2 Over 60-day delinquency rate .01%1 Net charge-offs: 2011 2012 .10% .13%2 Credit support from equipment manufacturers Credit risk spread across more than 8,500 active dealers $841 million of growth during 2012 1 Excludes non-accrual loans 2 Annualized |
|
|
31 Auto Finance Indirect auto finance company headquartered in Anaheim, CA Experienced and seasoned management team 349 employees More than 6,000 active dealer relationships Originating loans to consumers in 40 states 5.97% quarterly average yield2 Over 60-day delinquency rate .08%3 2012 net charge-off rate .21%2 Managed portfolio of $1,025 million Gains on sales of auto loans – $7.5 million in 3Q12 Originates and services primarily used retail auto loans acquired from franchised and independent dealers across the country At September 30, 2012 (Balances in $ millions)1 Total originations of $843 million year-to-date 1 Excludes loans held for sale and assets serviced for others 2 Annualized 3 Excludes non-accrual loans Total Originations: $33 $208 $299 $366 |

|
|
32 70% first mortgage lien positions, average loan amount of $121,638 30% junior lien positions, average loan amount of $44,123 61% fixed-rate, 39% variable-rate Average home value of $278,2441 Yields: 5.94% fixed-rate2, 5.04% variable-rate2 Over 60-day delinquency rate 1.46%3 Net charge-offs: 2010 2011 2012 1.80% 2.18% 2.85%2 Average FICO score of the retail lending operation: At origination – 729; updated 3Q12 – 727 34% of loan balances have been originated since January 1, 2009, with 2012 net charge-offs of .34%2 Consumer Real Estate (Balances in $ millions) 1 Based on value at origination 2 Annualized 3 Excludes non-accrual loans $6,895 $6,648 $7,281 $7,156 $7,302 At September 30, 2012 |
|
|
33 Commercial Lending (Balances in $ millions) At September 30, 2012 Commercial real estate – $3.2 billion • 31% apartment loans • 23% retail services • 16% office buildings • 12% industrial buildings Commercial highlights • 5.14% quarterly average yield1 • 80% fixed-rate, 20% variable-rate • Over 60-day delinquency rate .08%2 • Net charge-offs: 2010 2011 2012 1.31% 1.15% 1.16%1 • CRE location mix: 92% TCF banking markets, 8% other Continue to look for strategic expansion opportunities that fit TCF’s profile New commercial banking division called TCF Capital Funding specializing in asset-based and cash flow lending to smaller middle market companies across the U.S. 1 Annualized 2 Excludes non-accrual loans Secured Lending Philosophy |
|
|
34 1 In contrast to GAAP-basis measures, tangible realized common equity excludes the effect of goodwill, other intangibles and accumulated other comprehensive income (loss). Management reviews tangible realized common equity as an ongoing measure and has included this information because of current interest in the industry . The methodology for calculating tangible realized common equity may vary between companies. Reconciliation of GAAP to Non-GAAP Measures – Tangible Realized Common Equity1 Computation of total equity to total assets: Total equity $ 1,755,908 $ 1,764,669 Total assets $ 17,870,597 $ 17,878,393 Total equity to total assets 9.83 % 9.87 % Computation of tangible realized common equity to tangible assets Total equity $ 1,755,908 $ 1,764,669 Less: Non-controlling interest in subsidiaries 14,937 13,205 Total TCF stockholders’ equity 1,740,971 1,751,464 Less: Preferred stock 166,721 166,721 Goodwill 225,640 225,640 Intangibles 9,516 9,092 Accumulated other comprehensive income 15,703 18,067 Tangible realized common equity $ 1,323,391 $ 1,331,944 Total assets $ 17,870,597 $ 17,878,393 Less: Goodwill 225,640 225,640 Intangibles 9,516 9,092 Tangible assets $ 17,635,441 $ 17,643,661 Total realized common equity to tangible assets 7.50 % 7.55% Sept. 30, 2012 ($000s) Jun. 30, 2012 |
|
|
35 $ Computation of non-interest income excluding gains on sales of securities and non-recurring revenue: Total non-interest income $ 112,058 2.51% $58,051 1.26% Less: Gains on sales of securities 13,033 1,695 Non-recurring revenue -- 654 Total non-interest income excluding gains on securities and non-recurring revenue $ 99,025 2.22% $ 55,702 1.22% Computation of total revenue excluding gains on sales of securities and non-recurring revenue: Total revenue $ 312,617 6.99% $ 208,104 4.44% Less: Gains on sales of securities 13,033 1,695 Non-recurring revenue -- 654 Total revenue excluding gains on sales of securities and non-recurring revenue $ 299,584 6.70% $ 205,755 4.39% Computation of pre-tax pre-provision profit excluding gains on sales of securities and non-recurring revenue: Total revenue $ 312,617 $ 208,104 Less non-interest expense 196,808 134,793 Pre-tax pre-provision profit 115,809 2.59% 73,311 1.58% Less: Gains on sales of securit ies 13,033 1,695 Non-recurring revenue -- 654 Pre-tax pre-provision profit excluding gains on sales of securit ies and non-recurring revenue $ 102,776 2.30% $ 70,962 1.54% Total Assets $ 17,878,393 $ 19,074,498 Reconciliation of GAAP to Non-GAAP Measures – Revenue Ratios1 ($000s) TCF 3Q12 Banks $10-$50 billion in total assets 2Q12 Average2 1 In contrast to GAAP-basis measures, these revenue measures have been calculated excluding gains on sales of securities and other non-recurring revenue. Management reviews these measures on an on-going basis and has included this information because of current interest in the industry . 2 Excludes TCF 3 Annualized % of Total Assets3 $ % of Total Assets3 |

|
|
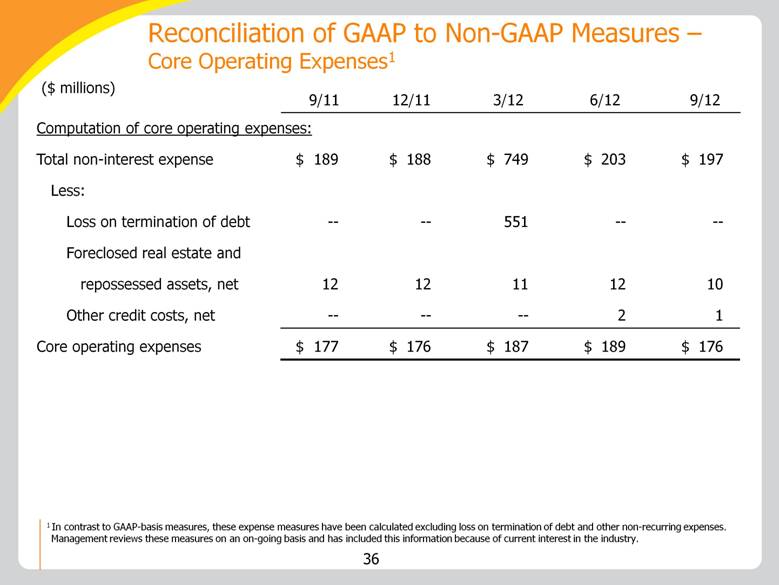
36 9/11 Reconciliation of GAAP to Non-GAAP Measures – Core Operating Expenses ($ millions) Computation of core operating expenses: Total non-interest expense $ 189 $ 188 $ 749 $ 203 $ 197 Less: Loss on termination of debt -- -- 551 -- -- Foreclosed real estate and repossessed assets, net 12 12 11 12 10 Other credit costs, net -- -- -- 2 1 Core operating expenses $ 177 $ 176 $ 187 $ 189 $ 176 3/12 12/11 6/12 9/12 1 In contrast to GAAP-basis measures, these expense measures have been calculated excluding loss on termination of debt and other non-recurring expenses. Management reviews these measures on an on-going basis and has included this information because of current interest in the industry. |
|
|
37 Jun. 30, 2012 Tier 1 risk-based capital ratio: Tier 1 capital $ 1,508,176 Total risk-weighted assets $ 14,319,406 Tier 1 risk-based capital ratio 10.53 % Computation of tier 1 common capital ratio: Tier 1 capital $ 1,508,176 Less: Preferred stock 166,721 Qualifying trust preferred securities -- Qualify ing non-controlling interest in subsidiaries 14,937 Tier 1 common capital ($000s) Sept. 30, 2012 1 In contrast to GAAP-basis measures, the total tier 1 common capital ratio excludes the effect of qualify ing trust preferred securities and qualify ing non-controlling interest in subsidiaries. Management reviews the total tier 1 common capital ratio as an on-going measure and has included this information because of current interest in the industry . The methodology for calculating total tier 1 common capital may vary between companies. $ 1,515,050 $ 14,562,779 10.40 % $ 1,515,050 166,721 -- 13,205 1,335,124 9.17 % Reconciliation of GAAP to Non-GAAP Measures –Tier 1 Common Capital Ratio1 |

|
|
38 Source References & Footnotes Slide: Corporate Profile 39th largest publicly-traded U.S. based bank holding company – SNL Financial, LC; 6/30/2012 26th largest branch network – SNL Financial, LC; 3Q12 5th largest in campus card relationships - CR80News; April 2012 Slide: Peer Analysis Banks $10-$50 Billion in Total Assets data – SNL Financial LC; 6/30/2012 Slide: Leasing & Equipment Finance 14th largest bank-affiliated leasing company – The Monitor; 2012 Monitor Bank 40 29th largest equipment finance/leasing company – The Monitor; 2012 Monitor 100 |