Attached files
| file | filename |
|---|---|
| 8-K - FORM 8-K - LegacyTexas Financial Group, Inc. | d432984d8k.htm |
Exhibit 99.1

| 1 NASDAQ: VPFG Kevin Hanigan - President and Chief Executive Officer Patti McKee - Executive Vice President and Chief Financial Officer |

| 2 Safe Harbor Statement When used in filings by the Company with the Securities and Exchange Commission (the "SEC") in the Company's press releases or other public or shareholder communications, and in oral statements made with the approval of an authorized executive officer, the words or phrases "will likely result," "are expected to," "will continue," "is anticipated," "estimate," "project," "intends" or similar expressions are intended to identify "forward-looking statements" within the meaning of the Private Securities Litigation Reform Act of 1995. Such statements are subject to certain risks and uncertainties, including, among other things, changes in economic conditions, legislative changes, changes in policies by regulatory agencies, fluctuations in interest rates, the risks of lending and investing activities, including changes in the level and direction of loan delinquencies and write-offs and changes in estimates of the adequacy of the allowance for loan losses, the Company's ability to access cost-effective funding, fluctuations in real estate values and both residential and commercial real estate market conditions, demand for loans and deposits in the Company's market area, the industry-wide decline in mortgage production, competition, changes in management's business strategies and other factors set forth under Risk Factors in the Company's Form 10-K, that could cause actual results to differ materially from historical earnings and those presently anticipated or projected. The Company wishes to advise readers that the factors listed above could materially affect the Company's financial performance and could cause the Company's actual results for future periods to differ materially from any opinions or statements expressed with respect to future periods in any current statements. The Company does not undertake - and specifically declines any obligation - to publicly release the result of any revisions which may be made to any forward-looking statements to reflect events or circumstances after the date of such statements or to reflect the occurrence of anticipated or unanticipated events. |

| 3 Corporate & Geographic Overview Total Assets: $3.64 billion1 Total Net Loans: $2.65 billion1 Total Deposits: $2.19 billion1 31 Community Bank Locations 60 years in Texas market #1 in deposit market share in the affluent Collin County market of those banks based in Texas 2 Ranked #4 in deposit market share among Texas-based community banks in DFW Metroplex2 Source: VPFG 10-Q for Q3 2012, Company documents 1 As of September 30, 2012 2 FDIC market share data as of June 2012 |
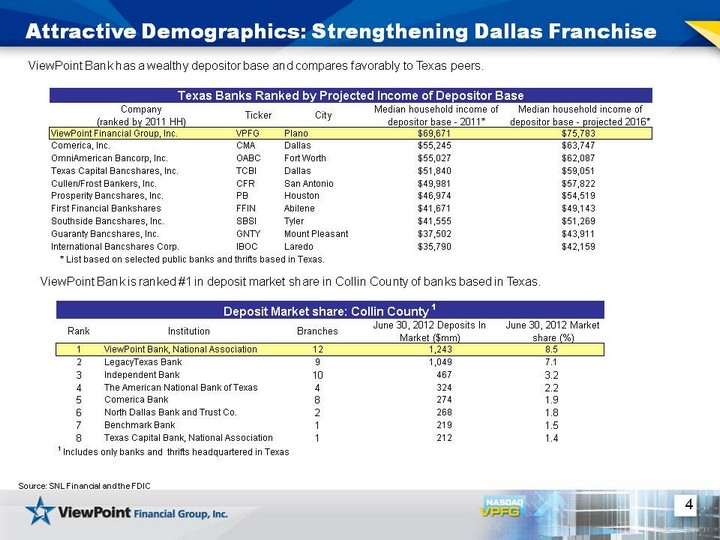
| 4 Attractive Demographics: Strengthening Dallas Franchise Source: SNL Financial and the FDIC ViewPoint Bank has a wealthy depositor base and compares favorably to Texas peers. ViewPoint Bank is ranked #1 in deposit market share in Collin County of banks based in Texas. |

| 5 Q3 2012 Highlights Net Income totaled $11.3 million, up 74% vs. prior quarter Core EPS totaled $0.30, up 88% vs. Q3 2011 Q/Q EPS up $0.13, core EPS up $0.06 Q/Q Strong Earnings Continued Loan Growth Total loans increased $140 million, or 5.5%, from Q2 to Q3 Loans HFI up 3.2% vs. Q2 2012 Loans HFS increased $88.8 million, or 9.6%, from Q2 to Q3 Increase in Net Interest Margin NIM of 3.70%, up 8 bps vs. Q2 2012 and up 83 bps vs. Q3 2011 Driven by reduced deposit cost and improvement in earning asset mix Strong Capitalization & Stable Credit Quality Quarterly cash dividend of $0.10 per share, up 25% from Q2 Tangible Common Equity ratio of 13.45%, $485 million Asset quality - NPLs/Loans of 1.70% See Appendix for reconciliation of core (non-GAAP) to GAAP net income. Source: VPFG 10-Q for Q3 2012; Company Documents |

| 6 Capitalize on a position of balance sheet strength Improve and diversify earning asset mix Migrate from low yielding securities to higher yielding loans Transition to a balanced loan book, leveraging C&I expertise Grow organically, leveraging a strong local economy Achieve greater community banking market share through high-touch service and strategic redeployment of key products Deploy capital opportunistically Continued organic loan growth and selective branching Consistent growth of dividends and opportunistic share repurchase Disciplined M&A Looking Forward - Execute Business Strategy |

| 7 ViewPoint is Positioned Well in Current Industry Headwinds Source: SNL Financial - Morgan Stanley - Peers are KRX index of 50 regional banks |

| 8 Improved Earning Asset Mix Source: Company Documents Average Earning Assets and Related Yields September 30, 2011 September 30, 2012 Quarterly yield on earning assets: 4.06% Quarterly yield on earning assets: 4.34% Improve the mix of earning assets by continuing to build on the success of our three primary loan programs, further develop our C&I program, and reduce the mix of securities. |

| 9 The Highlands acquisition accelerated ViewPoint's transition to a commercial banking model Commercial banking CEO Team of commercial lenders Shift loan portfolio away from real estate centric lending Emphasis on C&I lending with a goal to transition to balanced loan book Continued emphasis on low-cost, core deposits Commercial Bank Transformation |

| 10 Commercial Bank Transformation Loans Held for Investment Composition Source: SNL Financial, VPFG 10-Q for Q3 2012 December 31, 2007 Deposit Composition September 30, 2012 September 30, 2012 December 31, 2007 |

| 11 Continued Strong Organic Loan Growth Increase in loans held for investment Q3 vs. Q2 $51 million increase in Q3 2012, or 3% Strong organic C&I growth of $45.7 million, or 25.3%, in Q3 2012(2) Strong CRE growth of $34.0 million, or 4.5%, in Q3 2012 Gross Loans Held For Investment on Pro Forma Basis (1) ($ in millions) Source: VPFG 10-Q for Q3 2012; Company Documents The 2Q'12 balance includes $280 million in purchased loans related to the Highlands Bank acquisition. Excludes warehouse lines of credit |

| 12 Strong Loan Growth C&I Lending Growth (1) ($ in millions) Source: VPFG 10-Q for Q3 2012; Company Documents The 2Q'12 balance includes $117 million in purchased C&I loans related to the Highlands Bank acquisition The 2Q'12 balance includes $83 million in purchased CRE loans related to the Highlands Bank acquisition CRE Lending Growth (2) ($ in millions) |

| 13 National Mortgage Warehouse Purchase Program Source: Company Documents at September 30, 2012 Average balance increased $213 million for Q3 2012 vs. Q2 2012 Gross Average Yield of 4.07% for Q3 2012 Nationwide portfolio production covering 49 states 59% conforming and 41% government loans Approved maximum facility amounts ranging from $8.0 million to $45.0 million with an average utilization rate of 67%. |

| 14 Core Earnings Per Share Growth CAGR: 38% See Appendix for reconciliation of core (non-GAAP) to GAAP net income Source: VPFG 10-Q for Q3 2012; Company Documents Share and per share information for periods prior to July 6, 2010, have been revised to reflect the 1.4:1 conversion ratio on publicly traded shares Annual Quarterly Core Net Income ($ in millions): $5.3 $5.7 $9.7 $17.9 $22.2 $7.2 $8.9 $11.1 |

| 15 Profitability Net Interest Margin Source: VPFG 10-Q for Q3 2012, Company Documents 1 See Appendix for reconciliation of core (non-GAAP) to GAAP net income Efficiency Ratio Core ROAA1 Core ROAE1 |

| 16 Significant Improvement in Deposit Cost Source: VPFG 10-Q for Q3 2012 and Company Documents at September 30, 2012 Continued improvement in deposit cost Avg. non-interest bearing deposits increased to $338M from $316M linked quarter 71%, or $336M, of time deposits to mature within 12 months with WAR of 0.74% |

| 17 Robust Capital Tier 1 Capital Tang. Common Equity / Tang. Assets ViewPoint remains among the strongest capitalized institutions in the industry 22.2% Tier 1 Capital at Q3 2012 13.5% Tangible Common Equity Source: Company Documents at September 30, 2012 |
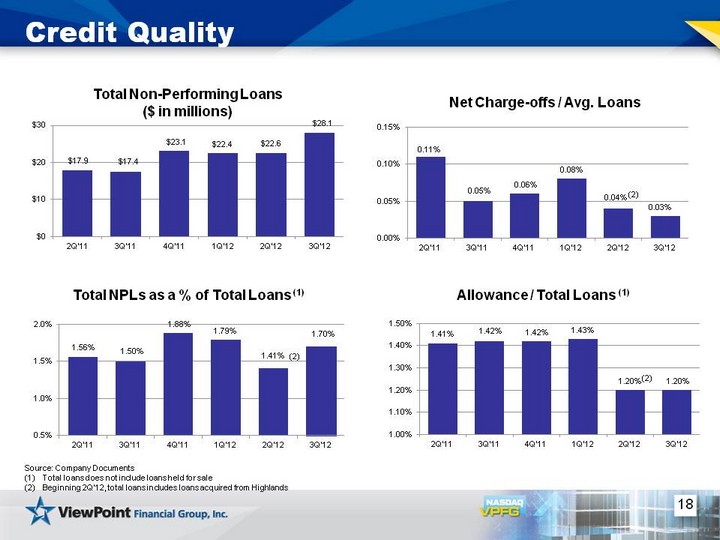
| 18 Credit Quality Total Non-Performing Loans ($ in millions) Total NPLs as a % of Total Loans (1) Allowance / Total Loans (1) Net Charge-offs / Avg. Loans Source: Company Documents Total loans does not include loans held for sale Beginning 2Q'12, total loans includes loans acquired from Highlands (2) (2) (2) |

| 19 Price to TBV Source: SNL Financial as of 10/26/2012 |

| 20 Investment Highlights Positive earnings growth trends One of the largest independent community banking franchises in the highly attractive Texas market Strong credit metrics and positive asset quality compared to peers reflecting disciplined underwriting standards Well-capitalized and able to deploy capital Price to TBV favorable compared to Texas peers |

| 21 Questions? |

| 22 Appendix The subsequent tables present non-GAAP reconciliations of the following calculations: TCE (Tangible Common Equity) to TCA (Tangible Common Assets) ratio TCE per share Price to TBV Core (non-GAAP) net income and earnings per share |
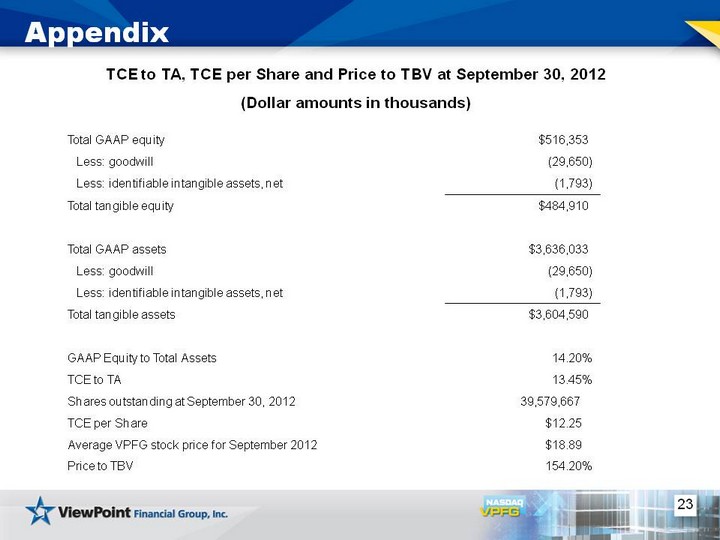
| 23 Appendix TCE to TA, TCE per Share and Price to TBV at September 30, 2012 (Dollar amounts in thousands) Total GAAP equity $516,353 Less: goodwill (29,650) Less: identifiable intangible assets, net (1,793) Total tangible equity $484,910 Total GAAP assets $3,636,033 Less: goodwill (29,650) Less: identifiable intangible assets, net (1,793) Total tangible assets $3,604,590 GAAP Equity to Total Assets 14.20% TCE to TA 13.45% Shares outstanding at September 30, 2012 39,579,667 TCE per Share $12.25 Average VPFG stock price for September 2012 $18.89 Price to TBV 154.20% |

| 24 Appendix Reconciliation of Core (non-GAAP) to GAAP Net Income and EPS (Dollar amounts in thousands except share and per share data) |

| 25 Appendix Reconciliation of Core (non-GAAP) to GAAP Net Income and EPS (Dollar amounts in thousands except share and per share data) |