Attached files
| file | filename |
|---|---|
| 8-K - ARROW ELECTRONICS, INC. 8-K - ARROW ELECTRONICS INC | a50459974.htm |
| EX-99.1 - EXHIBIT 99.1 - ARROW ELECTRONICS INC | a504559974ex99_1.htm |
Exhibit 99.2
Third-Quarter 2012 CFO Commentary
As reflected in our earnings release, there are a number of items that impact the comparability of our results with those in the trailing quarter and the third quarter of last year. Any discussion of our results will exclude these items to give you a better sense of our operating results. As always, the operating information we provide to you should be used as a complement to GAAP numbers. For a complete reconciliation between our GAAP and Non-GAAP results, please refer to our earnings release or the earnings reconciliation found at the end of this document.
The following third quarter and pro forma information included in this CFO commentary is unaudited and should be read in conjunction with the Form 10-Q for the quarterly periods ended September 29, 2012, June 30, 2012 and March 31, 2012, as well as the company's consolidated financial statements and related notes appearing in the company's 2011 Annual Report on Form 10-K as filed with the Securities and Exchange Commission.
Third-Quarter Summary
The third quarter again demonstrated our strong execution in what continues to be a well publicized challenging global macroeconomic environment. We reported third-quarter revenue of $5.0 billion and EPS of $1.02, both in line with our expectations, with cash flow generation a strong $176 million. Trailing twelve month cash flow from operations was 125% of net income, nearly double our long-term target. Return on invested capital remains an important metric for us, and we again generated returns in excess of our weighted average cost of capital.
In global components, sales of $3.4 billion were in line with our expectations. In Asia, sales growth was good driven by the core business and a rebound in our Ultra Source business. Sales in our core European business were in line with normal seasonality despite ongoing market softness across the region. Sales in the Americas were below expectations due to somewhat weaker overall market as well as customer cautiousness. Global components book to bill ended the quarter just below parity, though substantially better than the third quarter of 2011. We remain focused on our strategic priorities and are particularly focused on increasing our technical resources around the globe.
In our global enterprise computing solutions segment, sales of $1.6 billion increased 3% year over year and were in line with our expectations. This represents the 11th consecutive quarter of year-over-year organic growth for global ECS. On a global basis, solid year-over-year growth in storage and software was offset by continued weakness in the server market. In the third quarter we saw good performance in the Americas, with sales in our core value-added distribution business in line with expectations in a seasonally slow quarter. We executed well and continue to focus on our strategic priorities, including delivering value through solution selling and diversifying the portfolio as we build out our service capabilities focused on the data center. In Europe, the team delivered solid results in line with normal seasonality as our matrix expansion strategy remains a key driver of our successes in the region.
1
Consolidated Overview – Third Quarter
|
P&L Highlights*
|
Q3 2012
|
Y/Y
Change
|
Y/Y Change
Pro Forma
|
Q/Q
Change
|
|
Sales
|
$4,962
|
-4%
|
-7%
|
-4%
|
|
Gross Profit Margin
|
13.4%
|
-40bps
|
-50bps
|
+10bps
|
|
Operating Expense/Sales
|
9.8%
|
+30bps
|
Flat
|
+30bps
|
|
Operating Income
|
$178.4
|
-18%
|
-20%
|
-12%
|
|
Operating Margin
|
3.6%
|
-60bps
|
-60bps
|
-30bps
|
|
Net Income
|
$112.2
|
-19%
|
-20%
|
-10%
|
|
Diluted EPS
|
$1.02
|
-15%
|
-16%
|
-8%
|
* $ in millions, except per share data, may reflect rounding
In the third quarter of 2012, the company prospectively revised its presentation of sales related to certain fulfillment contracts to present these revenues on an agency basis as net fees, as compared to presenting gross sales and costs of sales in prior periods. Within the company’s statement of operations, this revised presentation had no impact on gross profit dollars, operating income dollars, net income dollars, and earnings per share for any periods reported. It also had no impact on the company’s consolidated balance sheet or statement of cash flows.
|
·
|
Third quarter sales of $5.0 billion were in line with our expectations
|
|
o
|
Decreased 4% year over year and sequentially
|
|
o
|
Pro forma for acquisitions and excluding the impact of both foreign currency and the aforementioned change in revenue presentation, sales were flat year over year and declined 2% sequentially
|
|
·
|
Consolidated gross profit margin was 13.4%
|
|
o
|
Decreased 40 basis year over year primarily due to ongoing pricing pressure in global components as well as a change in mix of products
|
|
§
|
Increased 10 basis points sequentially
|
|
o
|
Pro forma for acquisitions and excluding the impact of both foreign currency and the aforementioned change in revenue presentation, gross profit margins decreased by approximately 110 basis points year over year due to increased competitive pricing pressure in both the company's business segments, as well as a change in mix of products
|
|
·
|
Operating expenses as a percentage of sales were 9.8%
|
|
o
|
Increased 30 basis points year over year and sequentially
|
|
§
|
On an absolute dollar basis, operating expenses declined 2% year over year
|
|
o
|
Pro forma for acquisitions and excluding the impact of both foreign currency and the aforementioned change in revenue presentation, operating expenses declined 3% year over year and were down 30 basis points as a percentage of sales
|
|
·
|
Operating income was $178.4 million
|
|
o
|
Decreased 18% year over year and 12% sequentially
|
|
o
|
Pro forma for acquisitions, operating income was down 20% year over year
|
|
·
|
Operating income as a percentage of sales was 3.6%
|
|
o
|
Decreased 60 basis points year over year and 30 basis points sequentially
|
|
o
|
Pro forma for acquisitions and the aforementioned change in revenue presentation, operating income as a percentage of sales decreased 80 basis points year over year
|
|
·
|
Effective tax rate for the quarter was 28.3%
|
|
·
|
Net income was $112.2 million
|
|
o
|
Decreased 19% compared with last year and 10% sequentially
|
|
o
|
Pro forma for acquisitions, net income was down 20% year over year
|
|
·
|
Earnings per share were $1.04 and $1.02 on a basic and diluted, respectively
|
|
o
|
Diluted EPS decreased 15% year over year and 8% sequentially
|
|
o
|
Pro forma for acquisitions, EPS decreased 16% year over year
|
2
Global Components
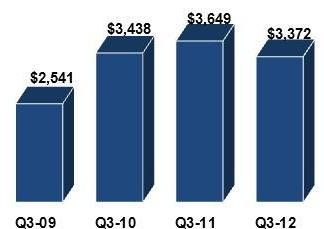
Sales ($ in millions)
|
·
|
Sales decreased 8% year over year and 2% sequentially
|
|
o
|
Pro forma for acquisitions and excluding the impact of both foreign currency and the aforementioned change in revenue presentation, sales in global components were flat year over year and increased 2% sequentially
|
|
·
|
Gross margin declined 40 basis points year over year due to ongoing pricing pressure as well as a change in geographic mix and product mix
|
|
o
|
Sequentially, gross margin decreased 30 basis points
|
|
o
|
Pro forma for acquisitions and excluding the impact of both foreign currency and the aforementioned change in revenue presentation, gross margin declined 150 basis points year over year due to the aforementioned ongoing pricing pressure and change in mix
|
|
·
|
Book to bill ended the quarter just below parity
|
|
o
|
In line with six-year average third-quarter level
|
|
·
|
Leading indicators, including lead times and cancellation rates, are in line with historical levels
|
|
·
|
Operating profit declined 20% year over year
|
|
o
|
Operating margin decreased 70 basis points year over year to 4.6%
|
|
o
|
Pro forma for acquisitions and the aforementioned change in revenue presentation, operating margin declined 110 basis points year over year
|
|
·
|
Return on working capital declined 350 basis points year over year
|
3
Americas Components Region
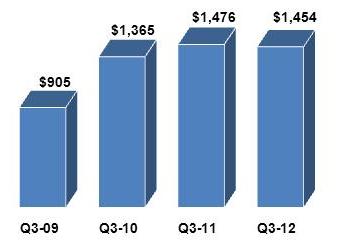
Sales ($ in millions)
|
·
|
Sales decreased 1% year over year and 3% sequentially
|
|
o
|
Pro forma for acquisitions, sales decreased 2% year over year and 3% on a sequential basis
|
|
o
|
Sales slightly below normal seasonality on a sequential basis
|
|
§
|
Somewhat weaker overall market as well as continued cautious customers
|
|
·
|
The lighting vertical continues to grow faster than the market, increasing 24% year over year and declining only 2% sequentially
|
|
·
|
Operating income decreased 9% year over year
|
|
o
|
Operating margin declined 50 basis points year over year
|
|
o
|
We continue to generate operating margins at the high end of the targeted level in what was a more difficult environment compared to a year ago
|
|
·
|
Looking ahead to the fourth quarter, we expect sales in our legacy Americas components business to be slightly below normal seasonality
|
4
Europe Components Region
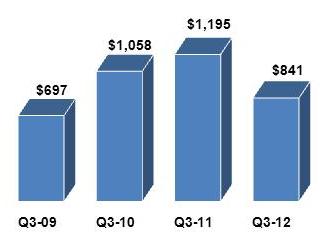
Sales ($ in millions)
|
·
|
Sales declined 30% year over year and 15% sequentially
|
|
o
|
Pro forma for acquisitions and excluding the impact of both foreign currency and the aforementioned change in revenue presentation, sales declined 5% year over year and increased 1% sequentially
|
|
o
|
Sales in our core business were in line with normal seasonality despite ongoing market softness in all regions
|
|
·
|
Vertical market growth continues to outperform the broader market
|
|
o
|
Automotive and lighting increased 13% and 3% year over year, respectively
|
|
·
|
Operating income declined 42% year over year
|
|
o
|
Operating margin declined 100 basis points year over year
|
|
·
|
Looking ahead to the fourth quarter, we expect sales in our legacy European components business to be in line with the low end of normal seasonality
|
5
Asia Pacific Components Region
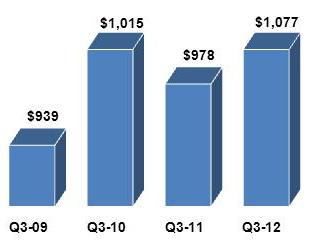
Sales ($ in millions)
|
·
|
Sales increased 10% year over year and 12% sequentially
|
|
o
|
Pro forma for acquisitions, sales increased 7% year over year
|
|
o
|
Sales in our core Asia business were in line with normal seasonality
|
|
§
|
Core Asia sales increased 13% year over year
|
|
o
|
Ultra Source sales grew 9% year over year, marking the first year-over-year increase since the first quarter of 2010
|
|
·
|
Vertical market performance was also strong with mobile and transportation growing 31% and 12% year over year, respectively
|
|
·
|
Operating profit declined 3% year over year due to a change in product mix
|
|
o
|
Operating margin declined 30 basis points year over year
|
|
·
|
Looking ahead to the fourth quarter, we expect sales in our legacy Asia Pacific components business to be slightly below normal seasonality
|
6
Global Enterprise Computing Solutions
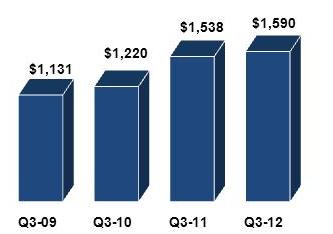
Sales ($ in millions)
|
·
|
Sales increased 3% year over year and declined 6% sequentially
|
|
o
|
Record third quarter revenue
|
|
o
|
Pro forma for acquisitions and excluding the impact of foreign currency, sales increased 2% year over year and declined 10% sequentially
|
|
§
|
11th consecutive quarter of year-over-year organic growth
|
|
·
|
Solid year-over-year growth in software (+11%) and storage (+9%)
|
|
o
|
Security, virtualization, and networking continue to post strong year-over-year growth, increasing 11%, 15%, and 20%, respectively
|
|
·
|
Gross margin decreased 10 basis points year over year driven primarily by product mix
|
|
o
|
Gross margin increased 60 basis points on a sequential basis driven by strength in unified communications margins
|
|
·
|
Operating income increased 3% year over year
|
|
o
|
Operating margin was flat year over year at 3.5%
|
|
·
|
Return on working capital continues to excel
|
7
ECS America
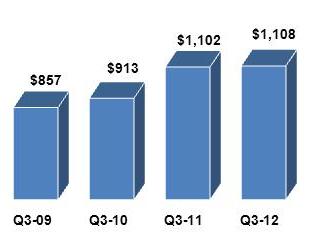
Sales ($ in millions)
|
·
|
Sales increased 1% year over year and declined 8% sequentially
|
|
o
|
Sales in our core value-added distribution business in line with expectations in a seasonally slow quarter
|
|
·
|
Robust double-digit year-over-year growth in software (+21%) and storage (+12%)
|
|
o
|
Networking grew 39%, infrastructure grew 26%, and security grew 24% year over year
|
|
·
|
Operating income grew 1% year over year
|
|
o
|
Operating margin was flat year over year and remains within our long-term target range
|
|
·
|
Looking ahead to the fourth quarter, we expect sales in our legacy Americas value-added computing solutions business to be in line with the low end of normal seasonality
|
8
ECS Europe
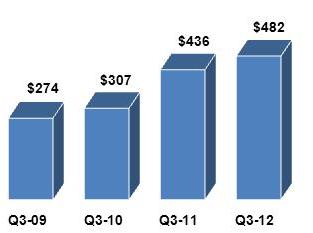
Sales ($ in millions)
|
·
|
Sales increased 10% year over year and decreased 3% sequentially
|
|
o
|
Pro forma for acquisitions and excluding the impact of foreign currency, sales increased 4% year over year and declined 14% sequentially
|
|
o
|
Strength in the UK and Nordic region
|
|
·
|
Organic sales growth was in line with normal seasonality on a sequential basis
|
|
o
|
Double-digit year-over-year growth in the UK and Nordic region
|
|
o
|
Year-over-year growth driven by software (+4%) and proprietary servers (+2%)
|
|
·
|
Operating profit increased 74% year over year
|
|
o
|
Operating income grew substantially faster than sales year over year
|
|
o
|
Operating margin increased 20 basis points year over year
|
|
·
|
Looking ahead to the fourth quarter, we expect sales in our legacy European value-added computing solutions business to be in line with normal seasonality
|
9
Cash Flow and Balance Sheet Highlights
|
·
|
Cash Flow from Operations
|
We generated $176 million in cash from operations in the third quarter. Over the last twelve months we have generated more than $634 million in cash flow from operations and converted 125% of our GAAP net income to cash, significantly outperforming our target.
|
·
|
Working Capital
|
We continue to effectively manage all levers of our working capital with working capital to sales of $.15. Return on working capital is 23.4%.
|
·
|
Return on Invested Capital
|
Our return on invested capital of 9.4% remains ahead of our weighted average cost of capital.
|
·
|
Share Buyback
|
We continued to take advantage of what we consider to be an attractive valuation and repurchased an additional $76 million of our stock in the third quarter, bringing the total amount returned to shareholders to nearly $780 million over the past five years. We have $124 million remaining for future buybacks on our current authorization.
|
·
|
Debt and Liquidity
|
Our balance sheet and capital structure remain very strong with conservative debt levels, and a net debt to EBITDA ratio of approximately 1.9x. Our total liquidity is $2.3 billion when including our cash of $359 million. Thus, we have the flexibility to continue to take advantage of opportunities in the marketplace.
|
Fourth-Quarter 2012 Guidance
|
|
|
Consolidated Sales
|
$5.1 billion to $5.5 billion
|
|
Global Components
|
$3.0 billion to $3.2 billion
|
|
Global ECS
|
$2.1 billion to $2.3 billion
|
|
Diluted Earnings per Share*
|
$1.01 to $1.13
|
* Fourth quarter guidance assumes average diluted shares outstanding of 107.3 million.
10
Arrow Electronics Revenue Seasonality*
|
Global Components
|
NAC
|
EMEA ex FX
|
AAP
|
|
Q1
|
-2% to +4%
|
+13% to +19%
|
-1% to +5%
|
|
Q2
|
-3% to +3%
|
-5% to -11%
|
+4% to +10%
|
|
Q3
|
-2% to +4%
|
-5% to +1%
|
+3% to +9%
|
|
Q4
|
-4% to +2%
|
-3% to -9%
|
-1% to -7%
|
|
Global ECS
|
NA
|
EMEA ex FX
|
|
Q1
|
-28% to -34%
|
-21% to -27%
|
|
Q2
|
+20% to +26%
|
+1% to +7%
|
|
Q3
|
-2% to -8%
|
-12% to -18%
|
|
Q4
|
+28% to +34%
|
+59% to +65%
|
* Revenue seasonality based on historical sequential sales growth for 2007-2011 for our traditional components and ECS businesses excluding acquisitions
11
Risk Factors
The discussion of the company’s business and operations should be read together with the risk factors contained in Item 1A of its 2011 Annual Report on Form 10-K, filed with the Securities and Exchange Commission, which describe various risks and uncertainties to which the company is or may become subject. If any of the described events occur, the company’s business, results of operations, financial condition, liquidity, or access to the capital markets could be materially adversely affected.
Certain Non-GAAP Financial Information
In addition to disclosing results that are determined in accordance with Generally Accepted Accounting Principles ("GAAP"), the company provides certain non-GAAP financial information relating to operating income, net income attributable to shareholders and net income per basic and diluted share, each as adjusted for certain charges, credits and losses that the company believes impact the comparability of its results of operations. These charges, credits and losses arise out of the company's efficiency enhancement initiatives and acquisitions. A reconciliation of the company's non-GAAP financial information to GAAP is set forth in the table below.
The company believes that such non-GAAP financial information is useful to investors to assist in assessing and understanding the company's operating performance and underlying trends in the company's business because management considers the charges, credits and losses referred to above to be outside the company's core operating results. This non-GAAP financial information is among the primary indicators management uses as a basis for evaluating the company's financial and operating performance. In addition, the company's Board of Directors may use this non-GAAP financial information in evaluating management performance and setting management compensation.
The presentation of this additional non-GAAP financial information is not meant to be considered in isolation or as a substitute for, or alternative to, operating income, net income attributable to shareholders and net income per basic and diluted share determined in accordance with GAAP. Analysis of results and outlook on a non-GAAP basis should be used as a complement to, and in conjunction with, data presented in accordance with GAAP.
12
Earnings Reconciliation
($ in thousands, except per share data)
| Q3 2012 | Q2 2012 | Q3 2011 | ||||||||||
|
Operating income, as Reported
|
$ | 163,817 | $ | 188,689 | $ | 209,162 | ||||||
|
Restructuring, integration, and other charges
|
14,562 | 13,347 | 8,848 | |||||||||
|
Operating income, as Adjusted
|
$ | 178,379 | $ | 202,036 | $ | 218,010 | ||||||
|
Net income attributable to shareholders, as Reported
|
$ | 103,617 | $ | 114,383 | $ | 132,216 | ||||||
|
Restructuring, integration, and other charges
|
8,576 | 9,702 | 6,048 | |||||||||
|
Net income attributable to shareholders, as Adjusted
|
$ | 112,193 | $ | 124,085 | $ | 138,264 | ||||||
|
Diluted EPS, as Reported
|
$ | 0.94 | $ | 1.02 | $ | 1.15 | ||||||
|
Restructuring, integration, and other charges
|
0.08 | 0.09 | 0.05 | |||||||||
|
Diluted EPS, as Adjusted
|
$ | 1.02 | $ | 1.11 | $ | 1.20 |
The sum of the components for diluted EPS, as Adjusted, may not agree to totals, as presented, due to rounding.
Earnings Reconciliation
References to restructuring and other charges refer to the following incremental charges taken in the periods indicated:
Q3-12 Restructuring, Integration, and Other Charges: During the third quarter of 2012, the company recorded restructuring, integration, and other charges of $14.6 million ($8.6 million net of related taxes or $.08 per share on both a basic and diluted basis).
Q2-12 Restructuring, Integration, and Other Charges: During the second quarter of 2012, the company recorded restructuring, integration, and other charges of $13.3 million ($9.7 million net of related taxes or $.09 per share on both a basic and diluted basis).
Q3-11 Restructuring, Integration, and Other Charges: During the third quarter of 2011, the company recorded restructuring, integration, and other charges of $8.8 million ($6.0 million net of related taxes or $.05 per share on both a basic and diluted basis).
13