Attached files
| file | filename |
|---|---|
| 8-K - FORM 8-K - Monarch Financial Holdings, Inc. | d413377d8k.htm |
 Investor Presentation
As of June 30, 2012
September 11-12, 2012
Exhibit 99.1 |
 Page 2
Forward-Looking Statements
Certain information contained in this discussion may include
“forward-looking statements” within the meaning
of Section 27A of the Securities Act of 1933, as amended, and
Section 21E of the Securities Exchange Act of 1934, as
amended. These forward-looking statements relate to
the Company’s future operations and are generally identified by
phrases such as “the Company expects,” “the Company
believes” or words of similar import. Although the
Company believes that its expectations with respect to the
forward-looking statements are based upon reliable
assumptions within the bounds of its knowledge of its business and
operations, there can be no assurance that actual results,
performance or achievements of the Company will not differ
materially from any future results, performance or
achievements expressed or implied by such forward-looking
statements. For details on factors that could affect
expectations, see the Company’s most recently issued Annual
Report on Form 10-K, as filed with the Securities and
Exchange Commission.
|
 Page 3
Brad E. Schwartz
Chief Executive Officer
E. Neal Crawford, Jr.
President
Introduction |
 Page 4
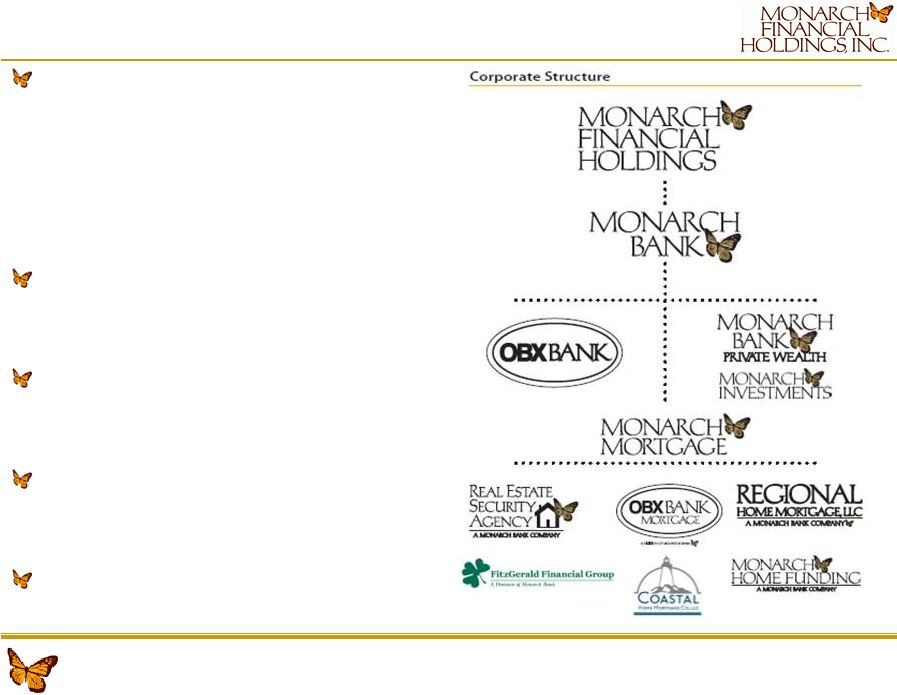
Corporate Profile
Monarch Financial Holdings is a growing
financial services company headquartered in
Chesapeake, Virginia
–
$995 million in assets
–
$626 million in loans held for investment
–
$282 million in loans held for sale
–
$853 million in deposits
Monarch Bank was founded in 1998, profitable
in
15
month
of
operation,
and
now
has
11
offices in Hampton Roads
OBX Bank, a division of Monarch Bank,
opened in May 2007 to serve the local needs of
the Outer Banks with two offices
Monarch Mortgage drives significant non-
interest income through retail residential
mortgage origination
Monarch Bank Private Wealth recently
formed to capture investment and trust
business using Raymond James Financial
th |
 Page 5
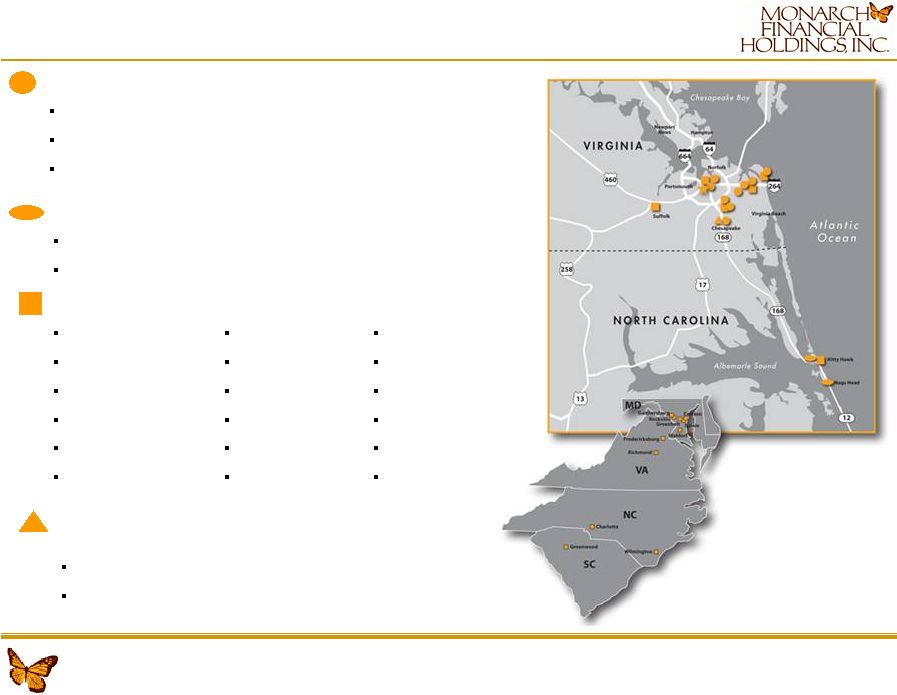
Monarch Franchise
OBX Bank Offices:
Kitty Hawk, NC
Nags Head, NC
Monarch Investments/ Monarch Bank
Private Wealth:
Chesapeake, VA
Williamsburg, VA (NEW)
Monarch Bank Offices:
Chesapeake, VA (2)
Suffolk, VA (NEW)
Norfolk, VA (2)
Williamsburg, VA (NEW)
Virginia Beach, VA (5)
Monarch Mortgage Offices:
Chesapeake, VA (2)
Norfolk, VA (2)
Virginia Beach, VA (2)
Richmond, VA (2)
Fredericksburg, VA
Fairfax, VA (2)
Bowie, MD
Crofton, MD
Gaithersburg, MD
Greenbelt, MD
Rockville, MD (2)
Towson, MD
Waldorf, MD
Annapolis,MD
Charlotte, NC (2)
Kitty Hawk, NC
Wilmington, NC (2)
Greenwood, SC |
 Our
senior
management
team
consists
of
18
officers
who
have
over
504
years
of
combined
experience and over 28 years experience on average in the financial
services industry –
11% Directors and Executive Management ownership
Page 6
Experienced Management Team
* Serves as a director on the holding company board
Years
Name
Position
Experience
Brad E. Schwartz (50) *
Chief Executive Officer
28
E. Neal Crawford (50)*
President
27
Denys Diaz
Executive Vice President & Chief Information Officer
20
Lynette P. Harris
Executive Vice President & Chief Financial Officer
30
Andrew N. Lock
Executive Vice President & Chief Risk Officer
20
William T. Morrison (50)*
CEO, Monarch Mortgage
28
Barry A. Mathias
Market President
41
David W. McGlaughon
Market President
32
W. Craig Reilly
Market President
15
Adam Goldblatt
Market President
32
W. Craig Reilly
Market President
15
Jeremy R. Starkey
Senior Vice President
21
James K. Ferber
President
30
Jack Lane
President
20
Bernie Ngo
Market President/Managing
Director
29
Patrick Faulkner
Managing Director
26
Mary A. Anderson
Senior Vice President
26
Barbara N. Lane
Executive Vice President
42
Nancy B. Porter
Senior Vice President
22
Norfolk
Suffolk
Virginia Beach
Commercial Real Estate Group
Real Estate Finance Group
Monarch Mortgage
Williamsburg/Private Wealth
Private Wealth
Human Resources
Facilities
Marketing and Training
Chesapeake
OBX Bank |
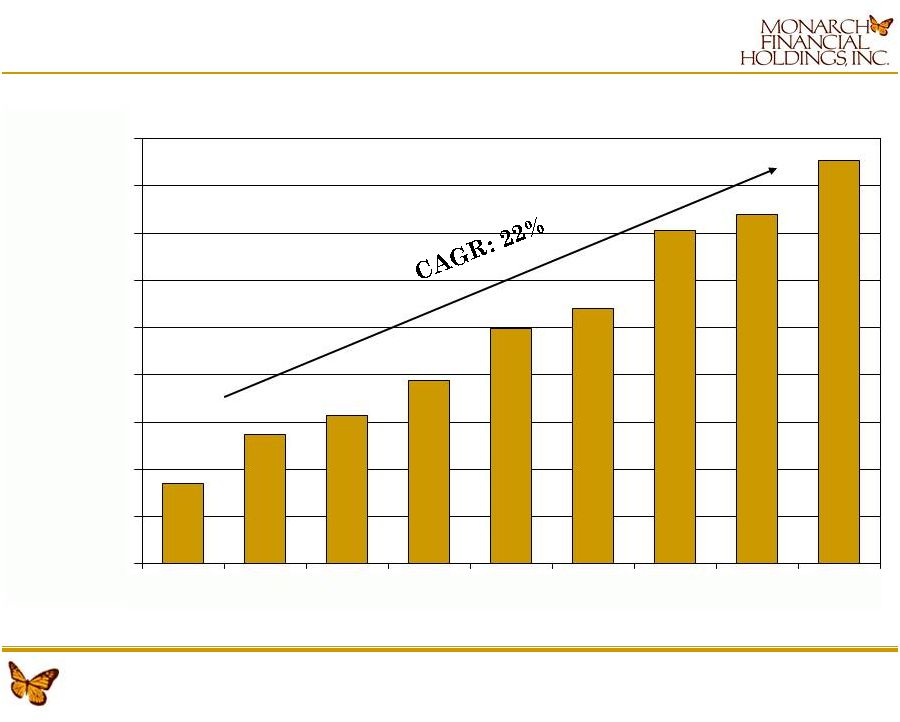
 $1,153
$1,656
$75
$200
$577
$1,630
$1,186
$0.00
$200.00
$400.00
$600.00
$800.00
$1,000.00
$1,200.00
$1,400.00
$1,600.00
$1,800.00
2006
2007
2008
2009
2010
2011
Q2-12
Page 7
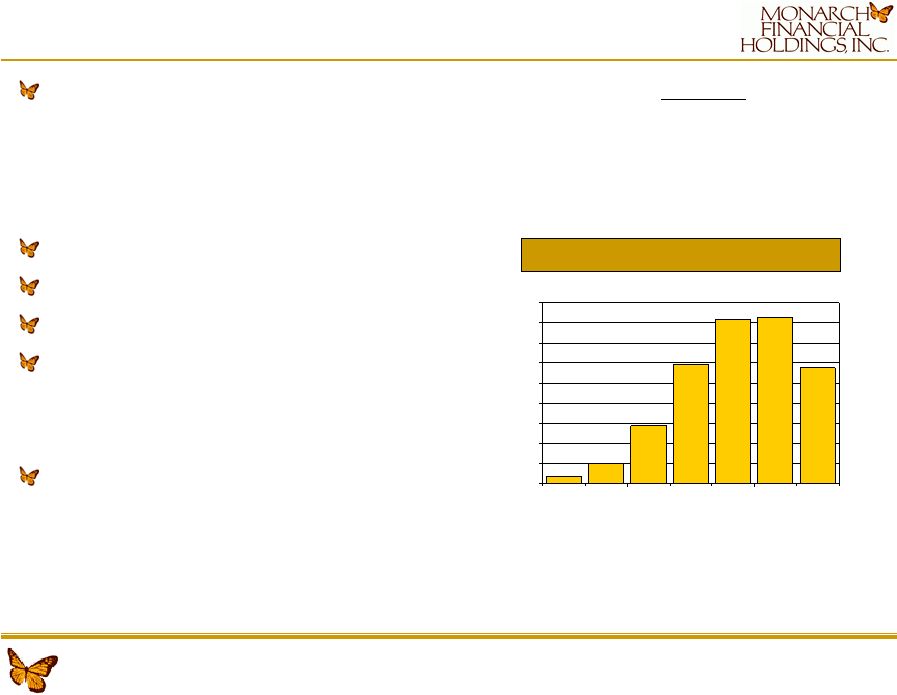
Monarch Mortgage
Monarch
Mortgage,
headquartered
in
Virginia
Beach,
was
founded
in
May
2007
–
Originates permanent residential mortgage loans primarily sold,
servicing released, into the secondary market
–
Focus on loan quality, offering only products with a proven liquid
market and multiple reliable buyers
Strong risk management and bank oversight
Experienced and proven management team
Minimal legacy loan issues
Monarch Mortgage operates 27 locations
–
7 in core banking markets
–
20 in mortgage only markets
Significant origination capabilities:
–
$1.6 Billion closed in 2011, $1.1 Billion through June 2012
–
Primary focus on purchase market, 52% of closings YTD 2012
Mortgage Originations |
 Publicly traded on Nasdaq Capital Market under MNRK, MNRKP
Formed Monarch Financial Holdings, Inc. as one bank holding company
in 2006 with 6,029,475 common shares now outstanding
Issued $14.7 Million in TARP Capital in December 2008 as an
abundance of caution during financial crisis. Repaid TARP
Capital in full in December 2009
Issued $20 Million of Non-cumulative Convertible Preferred in
2009 •
800,000 shares at $25 per share with a 7.80% rate
•
Can force convert if common stock trades at $10.40 to 2.5 million
shares •
Can redeem beginning in December 2012
Began
common stock dividends in 2010 ($0.14 in 2010, $0.16 in 2011, $0.14
YTD 2012 with one quarter remaining).
Page 8
Capital Events |
 Outside Recognition
Bauer top 5-STAR bank rating, since 2009
KBW
Honor
Roll
Award
winner
2011
(top
40
banks
in
USA)
and
2012
(top
45
banks
in
USA).
One
of
two
banks
in
Virginia
to
win
both
years.
BB&T Capital Markets/Scott and Stringfellow
“Buy” recommendation
Recognized as “Rising 20”
top growth company in Hampton Roads (2X)
Recognized
by
Inside
Business
as
one
of
the
“Best
Places
to
Work”
in
Hampton Roads in 2007, 2009, 2011, 2012)
|
 Page 10
Our
“Smart
Growth”
Business
Strategy
Continue to Grow
Banking
Franchises
Grow Core
Deposits
Maintain Risk
Management
Focus
Grow Non-
Interest Income
Lines of Business
Maintain
Financial
Discipline
Use Market Presidents and advisory boards for product and service
delivery in existing and potential expansion markets such as
the Peninsula, Williamsburg, and Richmond, the I-64
pathway. Organic and Acquisition growth
opportunities. Continue to conservatively underwrite loans
with strong committee structure and aggressively manage
problem assets. Maintain strong risk management focus
with mortgage origination business. Private Banking/Cash
Management Group focused on core deposit generation
and
service
of
business
deposits,
focused
on
checking
account
growth. Focus on office repositioning and franchise
growth. Target of $50 million or more per
office. Build and maintain sustainable revenue and net income
sources incremental to our spread income through significant
residential mortgage
origination and investment management income activities with bottom
line mentality. Continue to look for acquisition
opportunities. Deliver high performance shareholder returns
through strict adherence to risk management and pricing
philosophy. Remain a shareholder return focused
company. |
 Page 11
Financial Highlights
2012 -
2007
($ in millions)
Q2 2012
2011
2010
2007
CAGR
Balance Sheet:
Total Assets
$995.2
$908.7
$825.6
$502.4
14.7%
Loans, HFI
626.4
607.6
558.9
419.2
8.4%
Total Deposits
853.4
740.0
705.7
389.7
17.0%
Stockholders Equity
81.2
76.8
71.7
36.5
17.3%
Tangible Book Value per Share
$9.89
$9.17
$8.40
$7.10
6.85%
Income Statement:
Net Interest Income
$19.0
$33.6
$30.5
$16.1
18.7%
Non-Interest Income
38.3
54.7
53.5
8.5
55.2%
Pre-Tax Pre-Provision Income
11.9
17.3
18.4
5.8
32.6%
Net Income
5.6
7.1
5.9
3.2
28.4%
Basic Earnings per Share
$0.75
$0.93
$0.77
$0.66
23.1%
Diluted Earnings per Share
$0.62
$0.84
$0.75
$0.63
17.6%
Return on Equity
13.63%
9.66%
8.59%
8.86%
Performance:
Net Interest Margin
4.43%
4.51%
4.22%
4.29%
NPAs & 90 PD / Total Assets
0.85%
0.85%
1.30%
0.10%
Loan Loss Reserves / Loans, HFI
1.71%
1.63%
1.62%
0.95%
Equity /Assets
8.36%
9.16%
8.67%
8.59%
Banking Offices
12
11
11
9
Basic Shares Outstanding
6,029,475
5,999,989
5,715,532
4,814,738
Preferred Shares Outstanding
800,000
800,000
800,000
0 |
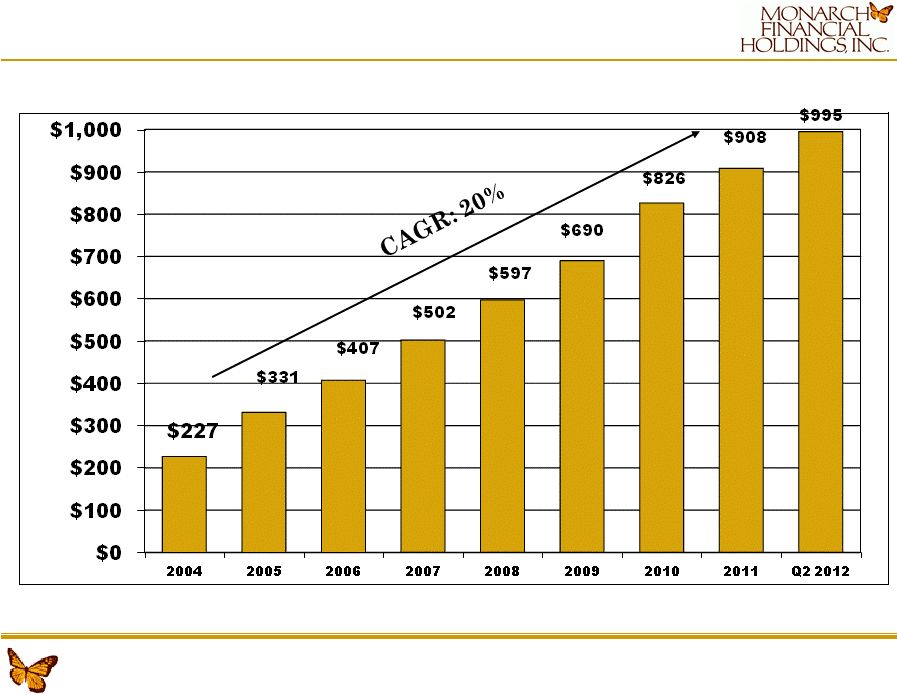 Page 12
Strong
Balance
Sheet
Growth
–
Total
Assets |
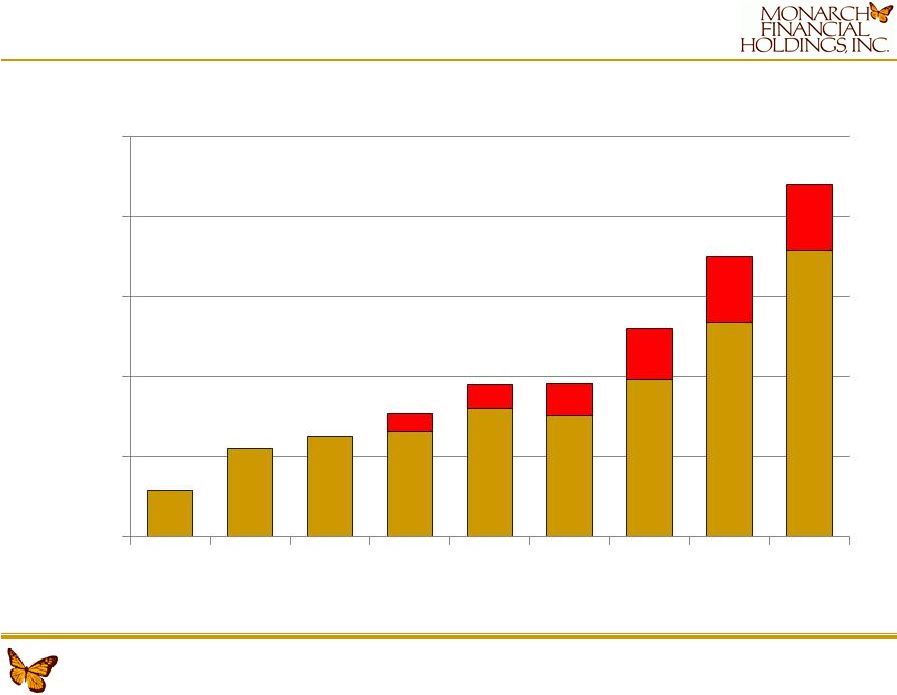
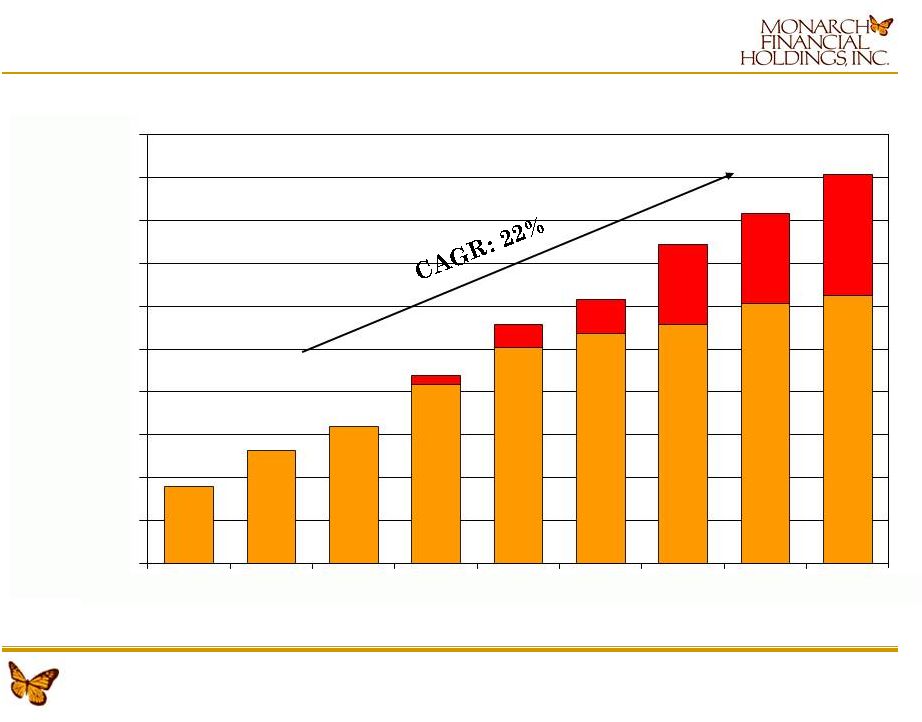 Page 13
Strong
Balance
Sheet
Growth
–
Loans
$179
$263
$321
$419
$505
$538
$559
$607
$626
$19
$54
$79
$186
$211
$282
$0
$100
$200
$300
$400
$500
$600
$700
$800
$900
$1,000
2004
2005
2006
2007
2008
2009
2010
2011
Q2 2012 |
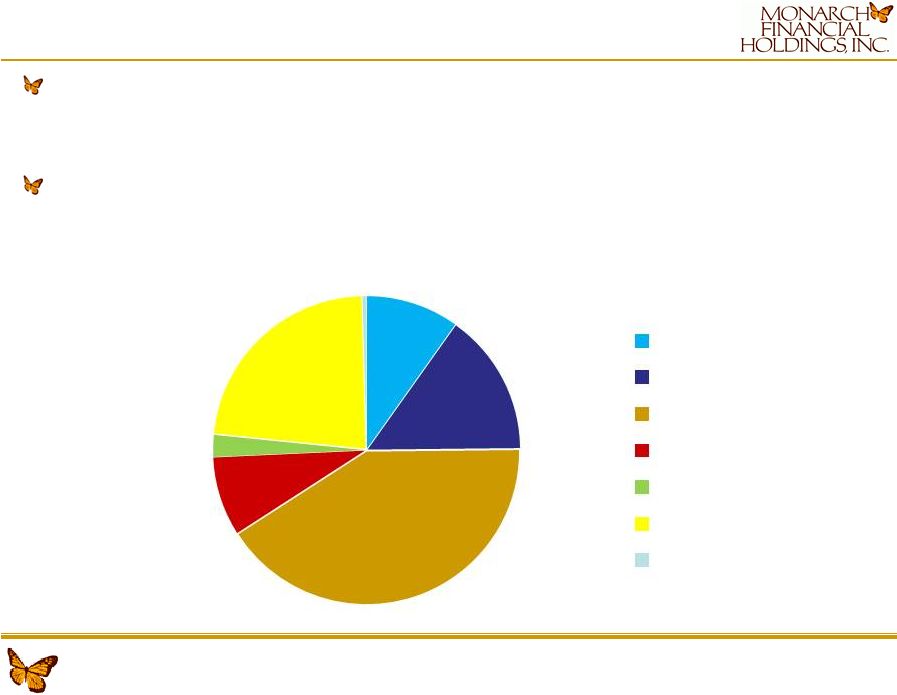 Page 14
Significant controls in place to actively monitor and manage real
estate exposure –
Centralized real estate and construction underwriting and
monitoring –
Centralized
Commercial
Real
Estate
Group
with
CRE
loan
brokerage
capacity
Mortgage loans held for sale provide additional spread income and
average 30 to 45 days on the balance sheet
Diversified Loan Portfolio
10%
15%
41%
8%
2%
23%
1%
Commercial
RE Construction
RE Residential
RE Heloc
RE Multifamily
RE Commercial
Consumer |
 Page 15
Strong
Balance
Sheet
Growth
-
Deposits
$171
$273
$314
$389
$498
$540
$706
$740
$853
$0
$100
$200
$300
$400
$500
$600
$700
$800
$900
2004
2005
2006
2007
2008
2009
2010
2011
Q2 2012 |
 Checking Account Focus = Record Growth
-
50
100
150
200
250
2004
2005
2006
2007
2008
2009
2010
2011
Q2
2012
29
56
63
66
80
76
98
134
179
11
15
20
32
41
41 |
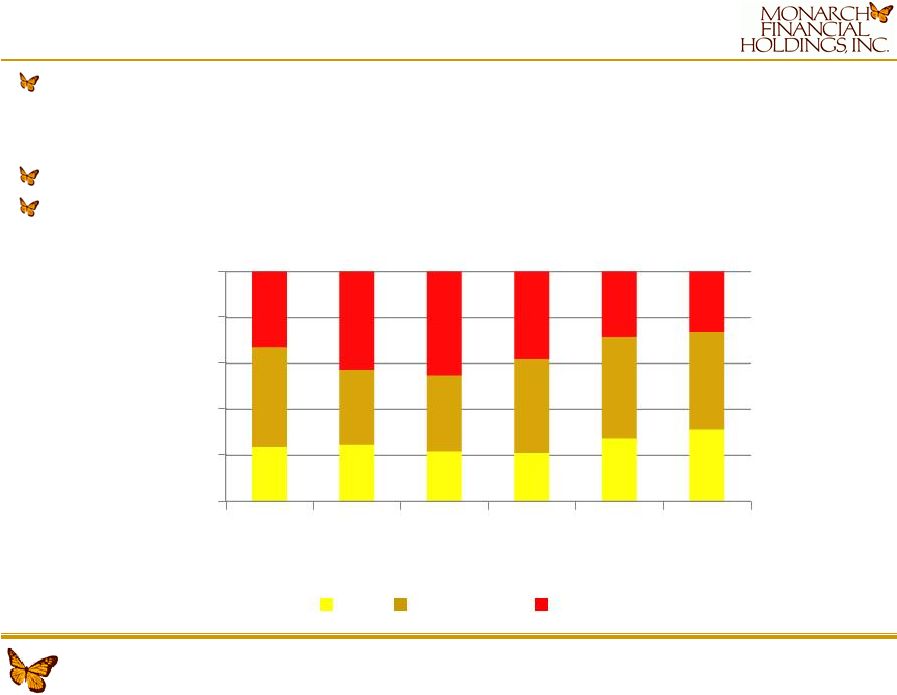 Page 17
Core Deposits Mix
Core deposit mix is vital to funding our loan growth and preserving
our net interest margin –
Built a Cash Management Team to rival larger competitors
–
Goal sell and service large DDA relationships
26% DDA growth YTD in 2012
We utilize FHLB and brokered deposits for mortgage loan
funding 0%
20%
40%
60%
80%
100%
2007
2008
2009
2010
2011
Q2
2012
CK
SAV/MM
TD
24%
25%
22%
21%
27%
31%
43%
33%
33%
41%
44%
43%
33%
43%
45%
38%
29%
26% |
 Branch
Deposits
2011
Count
in Market
Market Share (%)
Avg. Per
Rank
Institution
(#)
($M)
2011
2007
Branch
1
Wells Fargo & Company (CA)
54
$ 5,006
23.00%
21.84%
$ 92,703
2
SunTrust Banks, Inc. (GA)
42
$ 3,340
15.36%
14.19%
$ 79,523
3
TowneBank (VA)
24
$ 3,017
13.87%
10.00%
$ 125,708
4
BB&T Corporation (NC)
54
$ 2,817
12.95%
14.00%
$ 52,166
5
Bank of America Corporation (NC)
45
$ 2,167
9.97%
13.54%
$ 48,155
6
Commonwealth Bankshares, Inc. (VA)
19
$
890 4.09%
2.99%
$ 46,842
7
Hampton Roads Bankshares, Inc. (VA)
26
$
682 3.14%
2.12%
$ 26,230
8
Old Point Financial Corporation (VA)
23
$
680 3.14%
3.25%
$ 29,565
9
Monarch Financial Holdings, Inc. (VA)
11
$
656 3.02%
1.83%
$ 59,636
10
Farmers Bank
5
$
374 1.72%
1.50%
$ 74,800
Greater Hampton Roads MSA
384
$ 21,749
100.00%
100.00%
Page 18
Deposit
Market
Share
–
Greater
Hampton
Roads
Ranked #9 with $656 million or 3.02% deposit market share
–
Top five institutions had 72.23% of deposits in the market
–
CAGR 24% past five years in Hampton Roads MSA
–
Based on expected 2012 deposits we could take the #6 spot in market
share |
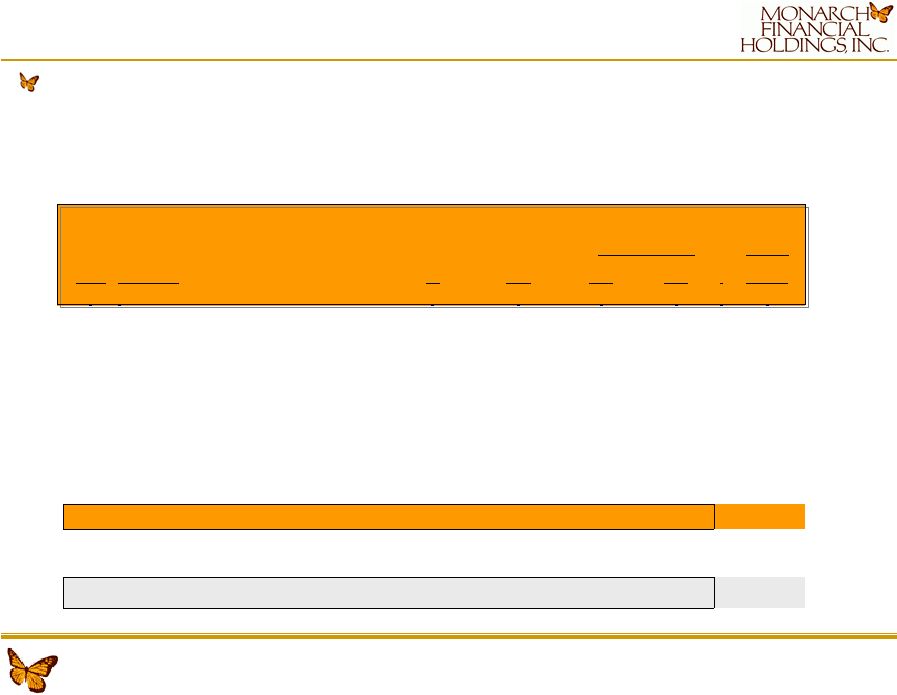
 Page 19
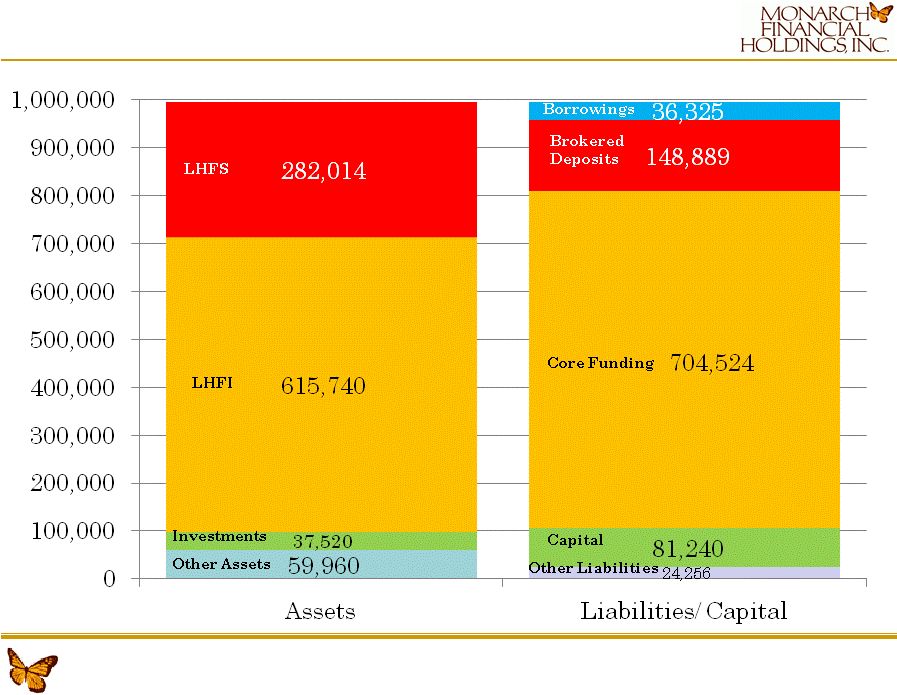
Balance Sheet 6/30/2012 |
 Page 20
2009 –
2012 Have Been Record Years
First Quarter 2009–
Record YOY 1
st
Quarter profits
Second Quarter 2009 –
Record YOY 2
nd
Quarter profits
Third Quarter 2009 –
Record YOY 3
rd
Quarter profits
Fourth Quarter 2009 –
Record YOY 4
th
Quarter profits
First Quarter 2010 –
Record YOY 1
st
Quarter profits
Second Quarter 2010 –
Record YOY 2
nd
Quarter profits
Third Quarter 2010 –
Record YOY 3
rd
Quarter profits
Fourth Quarter 2010 –
Record YOY 4
th
Quarter profits
First Quarter 2011 –
Record YOY 1
st
Quarter profits
Second Quarter 2011 –
Record YOY 2
nd
Quarter profits
Third Quarter 2011 –
Record YOY 3
rd
Quarter profits
Fourth Quarter 2011 –
Record YOY 4
th
Quarter profits
First Quarter 2012 –
Record YOY 1
st
Quarter profits
Second Quarter 2012 –
Record YOY 2
nd
Quarter profits |
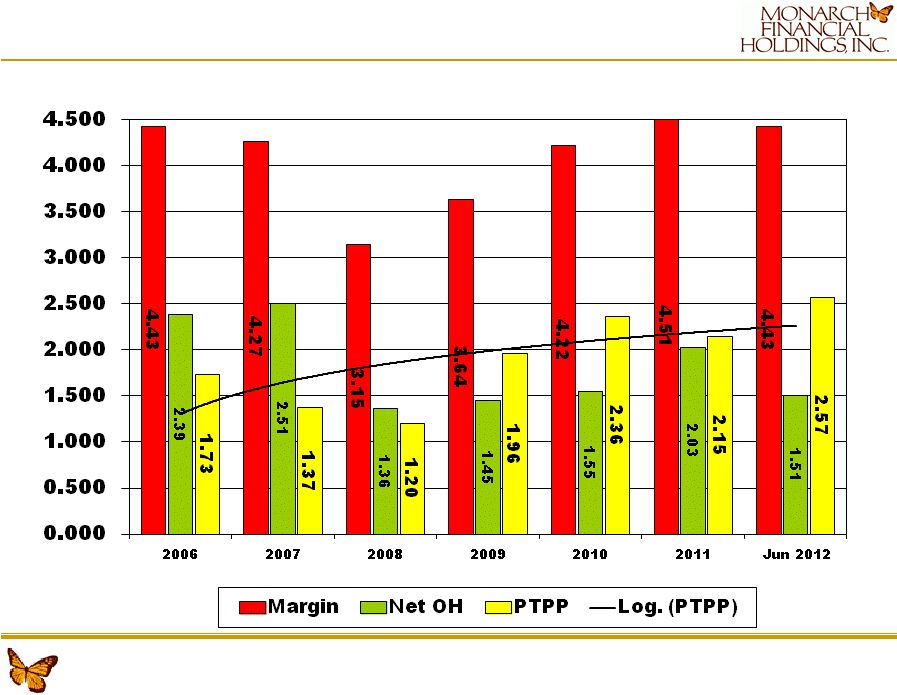 Page 21
Profitability Performance Trends |
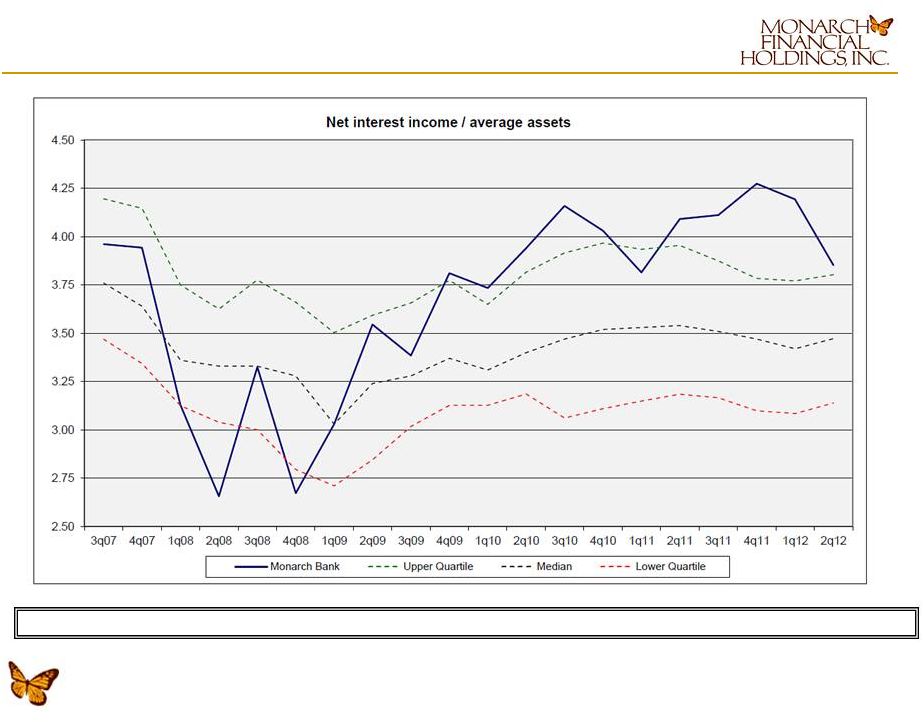 Page 22
Net
Interest
Income
–
Peer
Comparison
Bank
Only
–
FFIEC
Information |
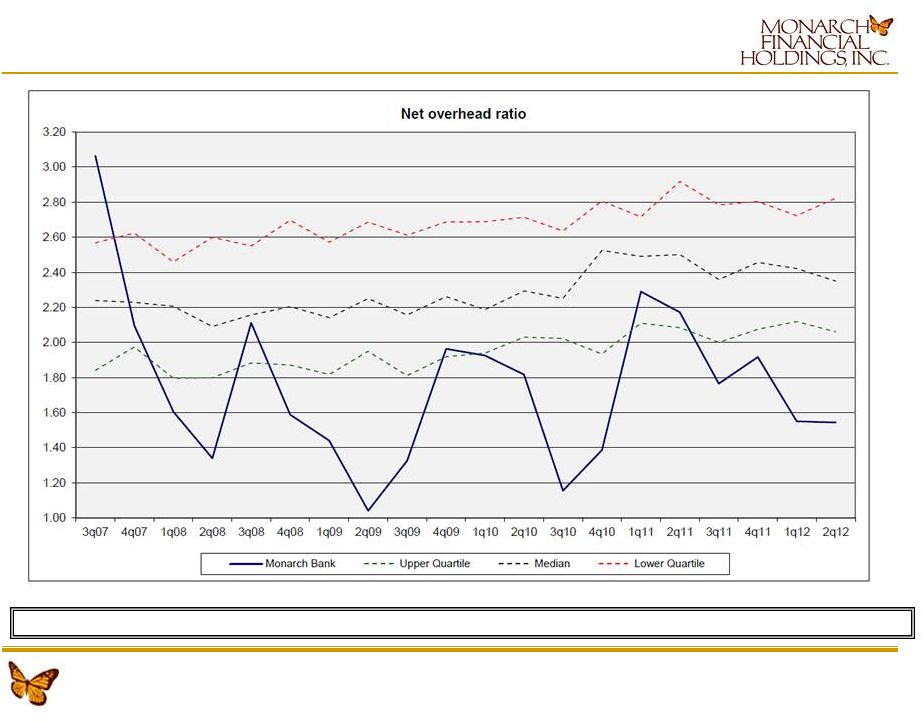 Page 23
Net
Overhead
–
Peer
Comparison
Bank only –
FFIEC Information |
 Page 24
Non-Interest Income Growth
Our strategy involves building and maintaining sustainable revenue
and net income sources in addition to traditional banking
spread income –
Monarch
Mortgage:
underwrites
permanent
prime
residential
mortgage
loans
to
be
sold
in the secondary market
–
Real
Estate
Security
Agency:
residential
and
commercial
title
and
settlement
–
Monarch
Capital:
provides
commercial
mortgage
brokerage
services
(in
mortgage
#’s)
–
Monarch
Bank
Private
Wealth
(NEW):
provides
investment,
trust,
financial
planning
* Operating Revenue defined as non-interest income plus
net-interest income Non-Interest Income
($ in 000s)
2008
2009
2010
2011
YTD 2012
Mortgage banking income
$18,080
$32,477
$50,506
$51,362
$36,736
Investment and insurance commissions
1,278
749
290
250
31
Service charges and fees
1,370
1,502
1,637
1,630
882
Title company income
230
309
599
618
283
Other
455
597
472
885
388
Total Non-Interest Income
$21,413
$35,634
$53,503
$54,745
$38,320
Non-Interest Income / Operating Revenue
55.1%
61.7%
63.7%
63.1%
63.6% |
 Page 25
Our Risk Management Focus Pays Off
All loans are risk rated with those ratings reviewed by an
independent third-party loan review service
Always enjoyed healthy relationship with our regulators, the
Richmond FRB and Virginia SCC Mortgage operations risks are
managed daily through a senior management team at Monarch
Mortgage along with oversight from Monarch Bank senior
management –
Duties include authority and oversight of underwriting and
regulatory compliance –
All correspondents and products are approved by our Board of
Directors to ensure no inappropriate products with excessive
risk are sold –
William Morrison, Monarch Mortgage CEO, previously served as a chief
credit officer for a local community bank
Other than credit risk our banking risk includes interest rate risk,
which we manage through our active Asset/Liability Management
Committee The credit risk within the company is overseen by our
Chief Risk Officer All loans are reviewed and loan
relationships that exceed $1,500,000 are approved by either a
management loan committee or a board of directors’
loan committee |
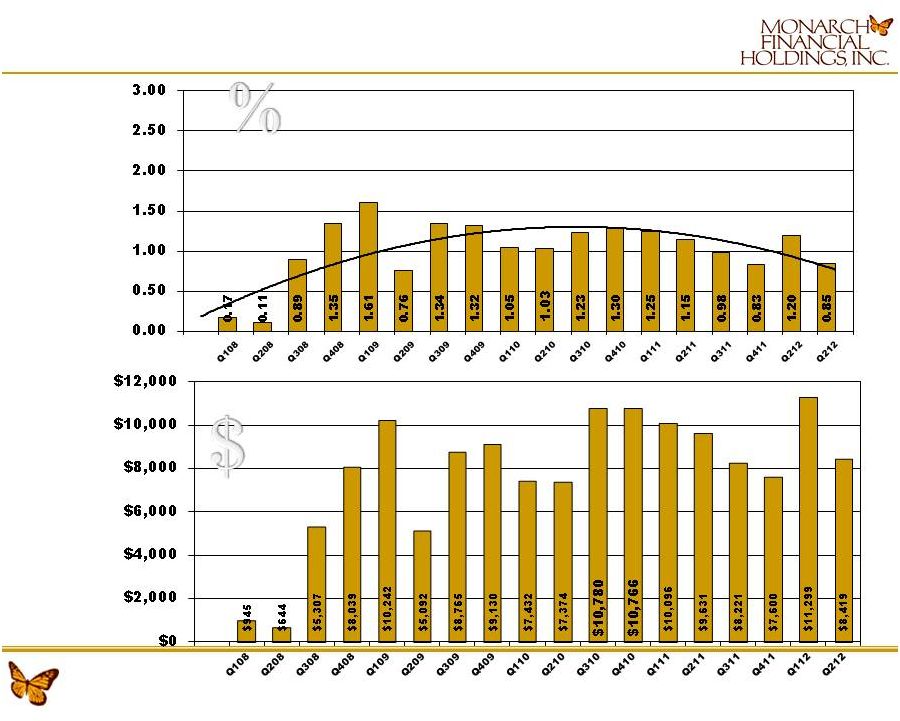
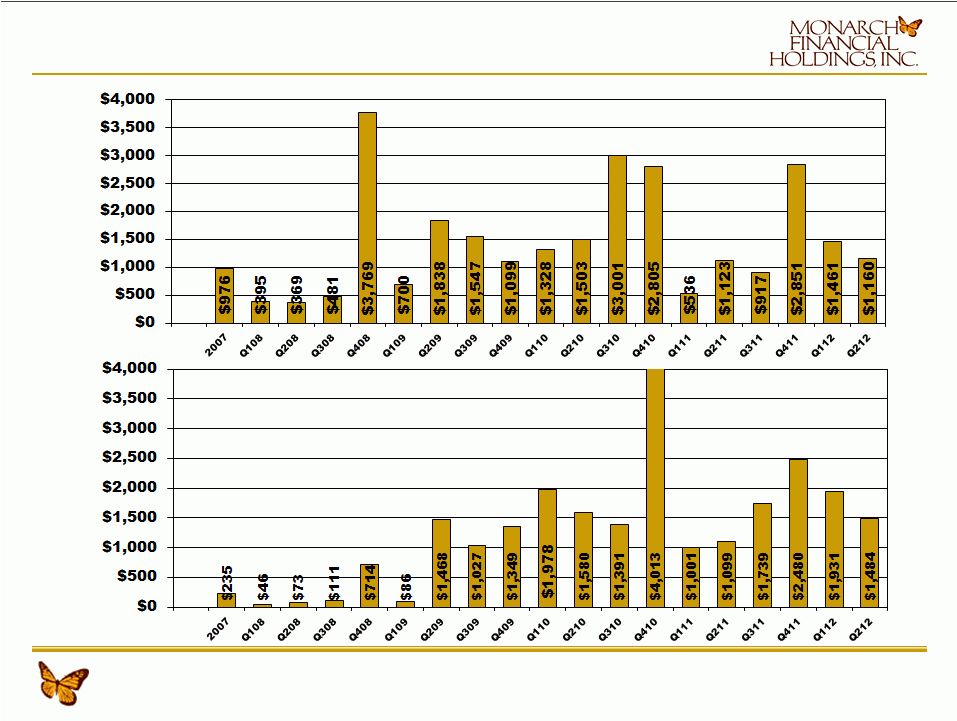 Aggressive Provision & Charge-off History
|
 Non-Performing
Assets
VA Q212 Median 2.49% |
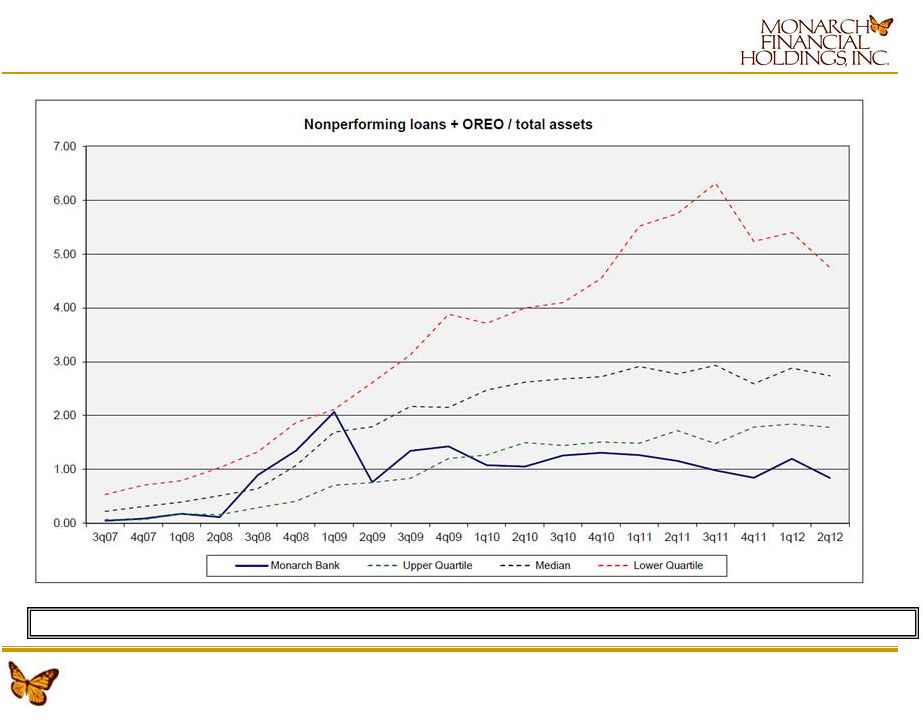 Non-Performing
Assets
–
Compared
to
Peers
Non-Performing Assets includes loans & debt securities past due 90 days or more
and those placed on non-accrual status, and non-investment OREO. |
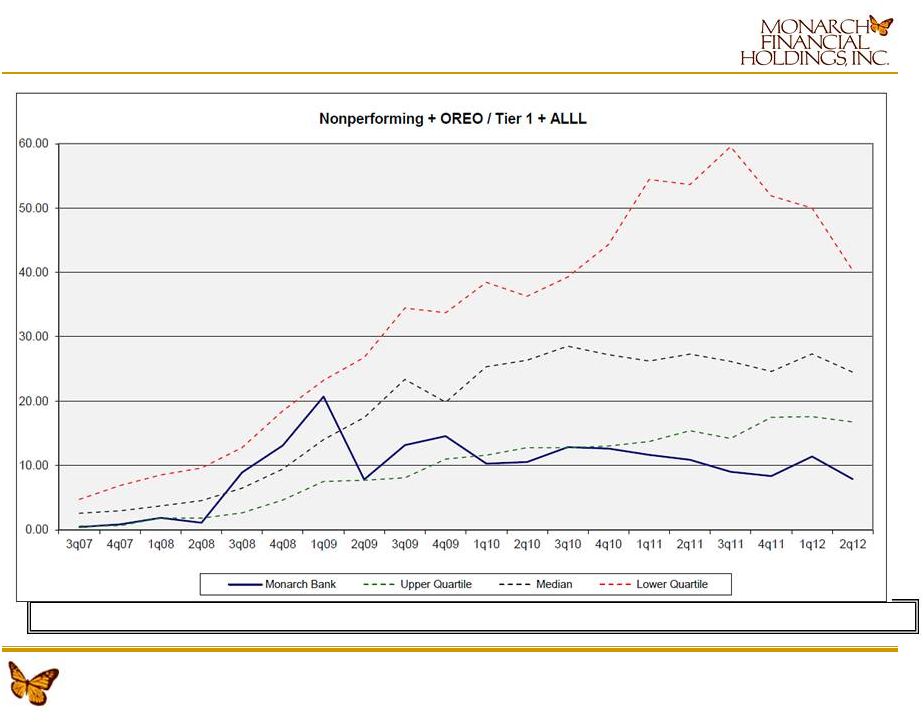 Our
Texas
Ratio
–
Compared
to
Peers
The Texas Ratio is defined as non-current loans & debt securities plus
non-investment OREO divided by tangible equity plus loan loss reserves. |
 High performing, diversified financial services company
Attractive franchise in one of the best demographic markets in the
country Strong, highly experienced senior management team and
bankers Conservative underwriting culture with better than
peer asset quality Significant
mortgage
operations
with
focus
on
growing
additional
non-
interest income lines of business
Outperform peers through disciplined growth and risk
management Continue to take advantage of market dysfunction
through client and employee acquisition growth
Page 30
Why Invest in Monarch? |
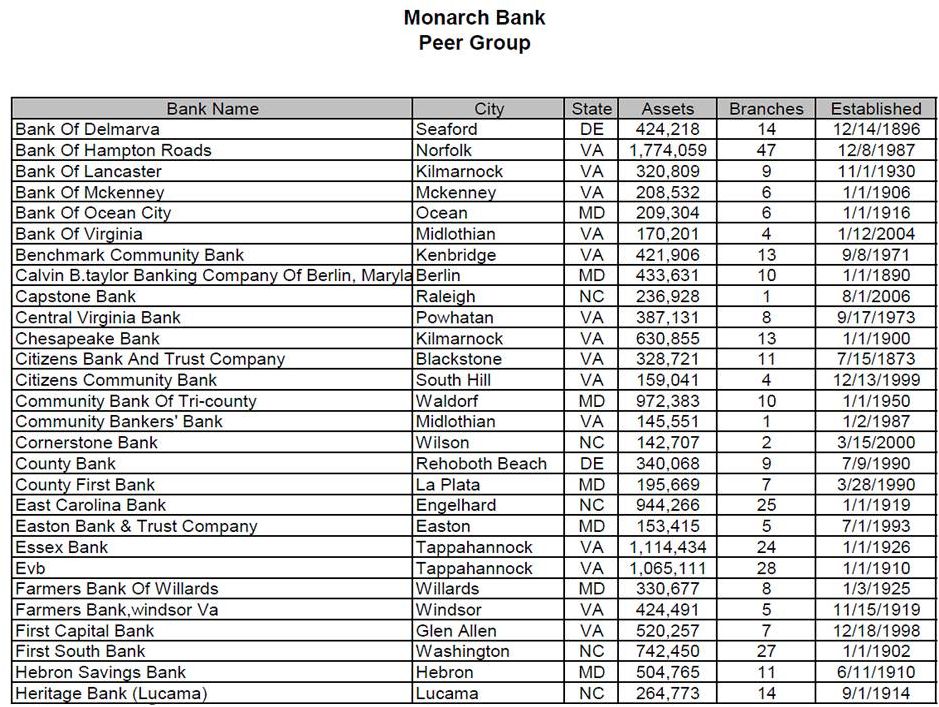 |
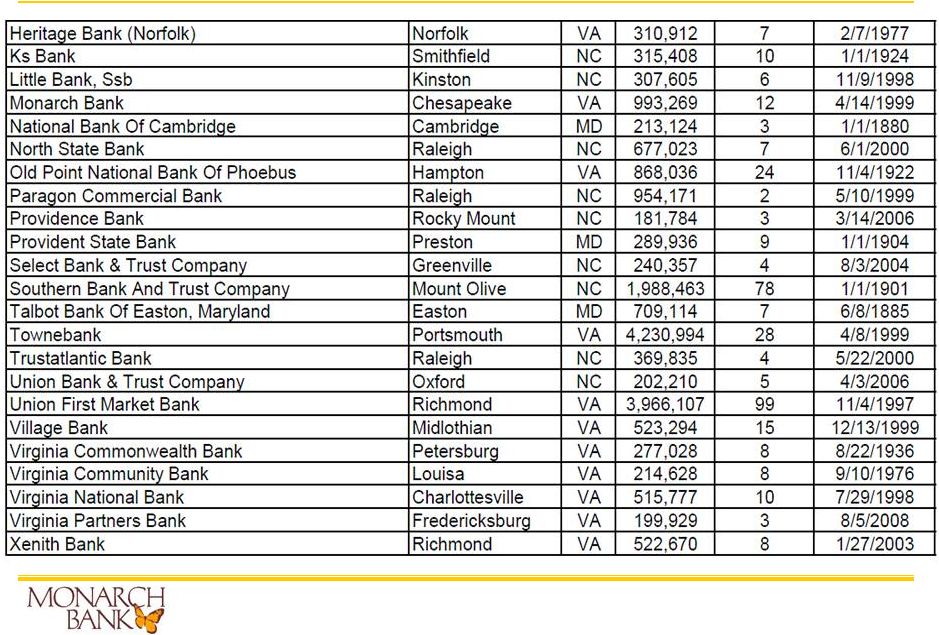 Peer
Group (continued) Page 32
|
 Thank You |