Attached files
| file | filename |
|---|---|
| EX-21.1 - EXHIBIT 21.1 - Monarch Financial Holdings, Inc. | mnrk-12312015xex211.htm |
| EX-31.2 - EXHIBIT 31.2 - Monarch Financial Holdings, Inc. | mnrk-12312015xex312.htm |
| EX-23.1 - EXHIBIT 23.1 - Monarch Financial Holdings, Inc. | mnrk-12312015xex231.htm |
| EX-32.2 - EXHIBIT 32.2 - Monarch Financial Holdings, Inc. | mnrk-12312015xex322.htm |
| EX-32.1 - EXHIBIT 32.1 - Monarch Financial Holdings, Inc. | mnrk-12312015xex321.htm |
| EX-31.1 - EXHIBIT 31.1 - Monarch Financial Holdings, Inc. | mnrk-12312015xex311.htm |
UNITED STATES
SECURITIES AND EXCHANGE COMMISSION
WASHINGTON, D.C. 20549
_______________________________________________
FORM 10-K
_______________________________________________
þ | ANNUAL REPORT PURSUANT TO SECTION 13 OR 15(d) OF THE SECURITIES EXCHANGE ACT OF 1934 |
For the fiscal year ended December 31, 2015
Commission File No. 001-34565
_______________________________________________
MONARCH FINANCIAL HOLDINGS, INC.
[EXACT NAME OF REGISTRANT AS SPECIFIED IN ITS CHARTER]
Virginia | 20-4985388 | |
(State or other jurisdiction of incorporation) | (I.R.S. Employer Identification Number) | |
1435 Crossways Blvd., Chesapeake, Virginia | 23320 | |
(Address of principal executive offices) | (Zip Code) | |
Registrant’s telephone number, including area code: (757) 389-5111
Securities registered pursuant to Section 12(b) of the Act:
Title of each class | Name of each exchange on which registered | |
Common Stock, $5.00 par value | The Nasdaq Stock Market, LLC | |
Securities registered pursuant to Section 12(g) of the Act:
None.
_______________________________________________
Indicate by check mark if the registrant is a well-known seasoned issuer, as defined in Rule 405 of the Securities Act. Yes ¨ No þ
Indicate by check mark if the registrant is not required to file reports pursuant to Section 13 or Section 15(d) of the Act. Yes ¨ No þ
Indicate by check mark whether the registrant (1) has filed all reports required to be filed by Section 13 or 15(d) of the Securities Exchange Act of 1934 during the preceding 12 months (or for such shorter period that the registrant was required to file such reports), and (2) has been subject to such filing requirements for the past 90 days. Yes þ No ¨
Indicate by check mark whether the registrant has submitted electronically and posted on its corporate Web site, if any, every Interactive Date File required to be submitted and posted pursuant to Rule 405 of Regulation S-T during the preceding 12 months (or for such shorter period that the registrant was required to submit and post such files). Yes þ No ¨
Indicate by check mark if disclosure of delinquent filers pursuant to Item 405 of Regulation S-K is not contained herein, and will not be contained, to the best of registrant’s knowledge, in definitive proxy or information statements incorporated by reference in Part III of this Form 10-K or any amendment to this Form 10-K. ¨
Indicate by check mark whether the registrant is a large accelerated filer, an accelerated filer, a non-accelerated filer, or a smaller reporting company. See the definitions of “accelerated filer,” “large accelerated filer” and “smaller reporting company” in Rule 12b-2 of the Exchange Act. (Check one):
Large accelerated filer | ¨ | Accelerated filer | þ | |||
Non-accelerated filer | o (Do not check if a smaller reporting company) | Smaller reporting company | o | |||
Indicate by check mark whether the registrant is a shell company (as defined in Rule 12b-2 of the Act). Yes ¨ No þ
The aggregate market value of the voting and non-voting common equity held by non-affiliates of the registrant as of June 30, 2015 was approximately $135,263,461.
The number of shares of common stock outstanding as of March 7, 2016 was 11,880,909.
_______________________________________________
DOCUMENTS INCORPORATED BY REFERENCE
None.
MONARCH FINANCIAL HOLDINGS, INC.
FORM 10-K
INDEX
Part I | ||
Item 1. | ||
Item 1A. | ||
Item 1B. | ||
Item 2. | ||
Item 3. | ||
Item 4. | ||
Part II | ||
Item 5. | ||
Item 6. | ||
Item 7. | ||
Item 7A. | ||
Item 8. | ||
Item 9. | ||
Item 9A. | ||
Item 9B. | ||
Part III | ||
Item 10. | ||
Item 11. | ||
Item 12. | ||
Item 13. | ||
Item 14. | ||
Part IV | ||
Item 15. | ||
2
PART I
Item 1. | Business. |
General
Monarch Financial Holdings, Inc. (sometimes referred to herein as the “Company” or “Monarch”) is a Virginia-chartered bank holding company headquartered in Chesapeake, Virginia engaged in commercial and retail banking, investment and insurance sales, and mortgage origination and brokerage. We conduct our operations through our wholly-owned subsidiary, Monarch Bank (sometimes referred to herein as the “Bank”), and its two wholly-owned subsidiaries, Monarch Investment, LLC and Monarch Capital, LLC. We also do business in some markets as OBX Bank, Monarch Bank Private Wealth, Monarch Mortgage and under various names via joint ventures with other partners.
History
Monarch was created on June 1, 2006 through a reorganization plan, under the laws of the Commonwealth of Virginia, in which Monarch Bank became its wholly-owned subsidiary. Monarch Bank was incorporated on May 1, 1998 and opened for business on April 14, 1999 as a Virginia-chartered bank and a member of the Federal Reserve banking system. The Company has grown through de novo expansion, acquisition and the hiring of seasoned banking professionals in our target markets. While Monarch has grown rapidly in recent years, the Company strategy has been to do so profitably and without compromising asset quality.
Monarch Bank serves the needs of local businesses, professionals, corporate executives and individuals in the Hampton Roads area of Southeastern Virginia and the Outer Banks region of Northeastern North Carolina. We operate ten banking offices, four commercial lending offices and eleven residential mortgage offices in the cities of Chesapeake, Norfolk, Newport News, Richmond, Williamsburg and Virginia Beach, Virginia. We have two full-service banking offices operating under the name “OBX Bank” and one residential mortgage office operating under the name of “OBX Bank Mortgage” in the Outer Banks region of Northeastern North Carolina in the towns of Kitty Hawk and Nags Head. We also operate twenty-nine additional residential mortgage offices and a loan production office outside of our primary banking market area.
We utilize a “Market President” approach to deliver products and services in each of our primary banking markets. We hire experienced bankers to serve in these leadership roles, and each Market President is responsible for building a strong team of bankers in their respective markets, developing and managing an advisory board of directors, managing sales and service delivery, and integrating our other lines of business in their communities. We believe this approach allows us to expand into new markets with fewer banking office locations and achieve profitability earlier than by utilizing the traditional banking model of opening a banking office and then looking for bankers to staff the location.
Our current capitalization enables us to provide loans in amounts responsive to the credit needs of a large portion of our targeted market. Our Board of Directors believes our capitalization supports current growth in loans and deposits.
We have two reportable segments that offer different products and services; community banking ("banking") and retail mortgage banking services ("mortgage banking"). Banking involves making loans to and generating deposits from individuals and businesses. Mortgage banking originates residential mortgage loans and subsequently sells them to investors. Further information on our reportable segments is contained in Note 20 to our Consolidated Financial Statements (included in Item 8. of this Form 10-K).
Proposed Merger with TowneBank
On December 17, 2015, the Company and Bank entered into a definitive agreement with TowneBank (“Towne”), pursuant to which Towne will acquire all of the common stock of Monarch in a stock transaction valued at approximately $221 million, based on Towne’s closing price December 16, 2015. Upon completion of the transaction, Town is expected to have approximately $7.3 billion in assets, $5.4 billion in loans and $5.8 billion in deposits.
Under the terms of the agreement, which has been approved by the Board of Directors of both companies, Monarch shareholders will be entitled to receive 0.8830 shares of Towne common stock for each share of Monarch stock at the closing date. The transaction, which is subject to regulatory approval, the approval of the shareholders of Monarch and Towne, and other customary conditions, is expected to close in the second quarter of 2016.
Banking
Monarch operates in several integrated lines of business. Our Business Banking Group has been a core line of business since we opened. This group supports our business/commercial clients and offers both secured and unsecured commercial loans for working capital (including inventory and receivables), business expansion (including acquisition of real estate and improvements) and the purchase of equipment and machinery, as well as loans secured by commercial real estate. This group also originates business deposits and related services. We have Business Banking groups in Chesapeake, Norfolk, Newport
3
News, Williamsburg,Virginia Beach and the Outer Banks, each led by a Market President, plus a loan production office in Richmond, Virginia.
Our Real Estate Finance Group has been a core line of business since we opened. This group provides the delivery of residential real estate construction, acquisition and development loans, with the majority of its focus in the 1-4 family residential markets of Hampton Roads and Northeastern North Carolina. This group supports this type of banking in all of our markets.
Monarch has a Commercial Real Estate Finance Group specializing in underwriting commercial real estate loans, which are either financed for our balance sheet or brokered to other investors. Non-owner occupied income producing real estate loans require a specialized approach to underwriting, structuring, and pricing. We formed this group to ensure proper risk management and customer relationships are retained with those clients that expect an experienced and well equipped banking platform. Our Commercial Real Estate Finance Group supports this type of banking in all our markets.
Our Private Wealth Group specializes in serving the needs of high net worth individuals. In addition to private banking and financial planning, the Bank's affiliation with Raymond James Financial Services, Inc. allows us to offer comprehensive investment and trust services.
Our Private Banking / Cash Management Group supports our deposit gathering and service operations, along with the delivery of consumer lending. Our dedicated cash management specialists focus on the acquisition, support and delivery of deposit products and services to our business banking clients. They deliver cash management services for small and moderate size businesses in all our markets. We offer a full range of deposit services including checking accounts, savings accounts and time deposits of various types, ranging from daily money market accounts to longer-term certificates of deposit. Consumer loans include home equity lines of credit, professional lines of credit, secured and unsecured loans for financing automobiles, home improvements, education and personal investments.
Monarch offers other services which include insurance sales, safe deposit boxes, check and bankcard services, online banking services, direct deposit of payroll and social security checks and automatic drafts for various accounts. We offer our clients access to their accounts and our banking services utilizing traditional in-office transactions as well as internet banking, mobile banking, remote deposit capture, online cash management, and through more than 50 automated teller machines (ATMs) located throughout South Hampton Roads and Northeastern North Carolina.
Monarch Investment, LLC, a wholly-owned subsidiary of Monarch Bank, offers investment advisory services through licensed investment advisors and its agreement with Raymond James Financial Services, Inc. Monarch Investment, LLC also has ownership interests in several subsidiaries. Monarch Investment owns a minority interest in Bankers Insurance, LLC, a joint venture with the Virginia Bankers’ Association and many other community banks in Virginia. This insurance agency offers a full line of commercial and personal lines of insurance to the general public and to our clients.
In March 2011, Monarch Investment, LLC, formed Crossways Holdings, LLC, a single member limited liability company. Crossways Holdings, LLC was formed for the purpose of acquiring, maintaining, utilizing and disposing of assets of Monarch Bank.
Mortgage Banking
Monarch Mortgage, a division of Monarch Bank, was formed in May 2007 when we hired a group of approximately 70 experienced mortgage professionals to staff the division. Monarch Mortgage is a retail residential mortgage lender with offices in Virginia, Maryland, North Carolina and South Carolina. We sell 99% of the mortgages we originate on a loan by loan basis to a large number of national banks, mortgage companies, and directly to certain governmental agencies. By maintaining correspondent and broker relationships with a number of companies, and by monitoring the financial condition of those companies, we feel we can limit the risk of our correspondents not purchasing loans we originate. We originate and sell primarily long-term fixed rate mortgage loans, both conventional and for government programs such as FHA, VA, and the Virginia Housing and Development Authority. A small portion of our loan clients select shorter term, variable rate loans. We do not securitize pools of loans.
Mortgage originations and sales have become a material source of revenue for the Company since the formation of Monarch Mortgage in 2007. The division stabilized in 2013 after significant growth in 2008 through 2012, due to a low interest rate environment coupled with government stimulus to the mortgage marketplace. We manage the majority of our interest rate risk by locking in the interest rate for each mortgage loan with our correspondents and borrowers at the same time. A portion of our mortgage loans have been included in a mandatory delivery program which utilizes pairing of agency securities with pools of loans to manage interest rate risk.
As a mortgage lender, Monarch Mortgage underwrites mortgage loans for our clients to be sold in the secondary market or booked on our balance sheet. Monarch Mortgage currently has offices with locations in Abingdon, Alexandria, Chesapeake, Fairfax, Fredericksburg, Glen Allen, Midlothian, Newport News, Norfolk, Oakton, Richmond, Virginia Beach and Woodbridge,
4
Virginia; Annapolis, Bel Air, Crofton, Dunkirk, Frederick, Greenbelt, Rockville, Towson, and Waldorf, Maryland; Charlotte, Fayetteville, Greenville, Indian Trail, Kitty Hawk, Mint Hill, Mooresville, Nags Head, and Wilmington, North Carolina; and Greenwood, South Carolina. Monarch Mortgage originates and sells loans under two different financial models. All the offices in Maryland, and the majority of the offices in Northern Virginia, North Carolina and South Carolina, operate as fee-based offices, with each office paying a per loan processing fee along with a percentage of net income to Monarch Mortgage, with the remaining net income or loss of each office the responsibility of each office’s manager or management team. The fee-based office model allows Monarch Mortgage to attract quality entrepreneurial leaders focused on their bottom line. The loan fees from these operations lower the cost basis and break-even volume for the Virginia operations while reducing the downside risk of startup and operating losses. The remaining Virginia and OBX Bank mortgage offices are traditional operations with the profits and losses accruing to Monarch Mortgage.
Monarch Capital, LLC, a wholly-owned subsidiary of Monarch Bank formed in 2004, provides commercial mortgage brokerage services in the placement of primarily long-term fixed-rate debt for the commercial, hospitality, and multi-family housing markets.
Monarch Investment, LLC also delivers mortgages and mortgage related services through other subsidiaries or investments as follows:
• | Coastal Home Mortgage, LLC became a subsidiary of Monarch Investment, LLC in July 2007 when a majority ownership interest in the company was purchased from another bank. Monarch Investment, LLC owns 50.01% of this joint venture with four unaffiliated individuals involved with residential construction in Hampton Roads. Its primary mission is to provide residential mortgage loan services for the builder’s end product. |
• | Real Estate Security Agency, LLC was formed in October 2007 to offer title insurance services to clients of Monarch Mortgage and Monarch Bank. This agency offers residential and commercial title insurance to our clients. Monarch Investment, LLC, owns 75% of this company with 25% owned by an unaffiliated party, TitleVentures, LLC. |
Monarch Investment, LLC purchased a 15% interest in Atlantic Real Estate Capital, LLC, a Richmond, Virginia based commercial brokerage company, in January 2015. There are four other partners in the company. Like Monarch Capital, LLC, the company provides commercial mortgage brokerage services in the placement of primarily long-term fixed-rate debt for the commercial, hospitality, and multi-family housing markets.
During 2014 Monarch Investment, LLC liquidated its 50% ownership in two joint ventures; Regional Home Mortgage, LLC and Monarch Home Funding LLC. Both companies had been formed to provide residential loan services to their clients and other consumers.
Employees
As of February 8, 2016, the Company and its subsidiaries had six hundred forty-three (643) full-time and eighteen (18) part-time employees. None of our employees are represented by any collective bargaining agreements, and relations with employees are considered excellent.
Commercial and Other Banking Lending Activities
Credit Policies
The principal risk associated with each of the categories of loans in our portfolio is the creditworthiness of our borrowers. Within each category, such risk is increased or decreased, depending on prevailing economic conditions. In an effort to manage the risk, our loan policy gives loan amount approval limits to individual loan officers based on their position and level of experience and to our loan committees based on the size of the lending relationship. The risk associated with real estate and construction loans, commercial loans and consumer loans varies, based on market employment levels, consumer confidence, fluctuations in the value of real estate and other conditions that affect the ability of borrowers to repay indebtedness. The risk associated with real estate construction loans varies, based on the supply and demand for the type of real estate under construction.
We have written policies and procedures to help manage credit risk. We utilize an external third party loan review process that includes annual portfolio reviews to establish loss exposure and to ascertain compliance with our loan policy.
We use a management loan committee and a directors’ loan committee to approve loans. The management loan committee is comprised of members of management, and the directors’ loan committee is composed of six directors, of which four are independent directors. Both committees approve new, renewed and or modified loans that exceed officer loan authorities.
5
Construction and Development Lending
We make construction loans, primarily residential, and land acquisition and development loans. The construction loans are secured by residential houses under construction and the underlying land for which the loan was obtained. The average life of a construction loan is typically less than 12 months. Construction lending entails significant additional risks, compared with residential mortgage lending. Construction loans often involve larger loan balances concentrated with single borrowers or groups of related borrowers. Another risk involved in construction lending is attributable to the fact that loan funds are advanced upon the security of the land or home under construction, for which value is estimated prior to the completion of construction. Therefore, it is more difficult to evaluate accurately the total loan funds required to complete a project and related loan-to-value ratios. To mitigate the risks associated with construction lending, we generally limit loan amounts to 75% to 85% of appraised value, in addition to analyzing the creditworthiness of our borrowers. We also obtain a first lien on the property as security for our construction loans and typically require personal guarantees from the borrower’s principal owners.
Commercial Real Estate Lending
Commercial real estate loans are secured by various types of commercial real estate in our market area, including multi-family residential buildings, commercial buildings and offices, shopping centers and churches. Commercial real estate lending entails significant additional risks, compared with residential mortgage lending. Commercial real estate loans typically involve larger loan balances concentrated with single borrowers or groups of related borrowers. Additionally, the payment experience on loans secured by income producing properties is typically dependent on the successful operation of a business or a real estate project and thus may be subject, to a greater extent, to adverse conditions in the real estate market or in the economy in general. Our commercial real estate loan underwriting criteria require an examination of debt service coverage ratios and the borrower’s creditworthiness, cash flow, prior credit history and reputation. We also evaluate the location of the property and typically require personal guarantees or endorsements of the borrower’s principal owners.
Business Lending
Business loans generally have a higher degree of risk than residential mortgage loans but typically have higher yields. To manage these risks, we generally obtain appropriate collateral and personal guarantees from the borrower’s principal owners and monitor the financial condition of our business borrowers. Business loans typically are made on the basis of the borrower’s ability to make repayment from cash flow of its business and are secured by business assets, such as real estate, accounts receivable, equipment and inventory. As a result, the availability of funds for the repayment of business loans is substantially dependent on the success of the business itself. Furthermore, the collateral for business loans may depreciate over time and generally cannot be appraised with as much precision as other forms of collateral.
Consumer Lending
We offer various consumer loans, including personal loans and lines of credit, investment margin loans, automobile loans, deposit account loans, installment and demand loans, and home equity lines of credit and loans. Such loans are generally made to clients with whom we have a pre-existing relationship. We currently originate all of our consumer loans in our geographic market area.
The underwriting standards we employ for consumer loans include a determination of the applicant’s payment history on other debts and an assessment of ability to meet existing obligations and payments on the proposed loan. The stability of the applicant’s monthly income may be determined by verification of gross monthly income from primary employment and additionally from any verifiable secondary income. Although creditworthiness of the applicant is of primary consideration, the underwriting process also includes an analysis of the value of the security in relation to the proposed loan amount. For home equity lines of credit and loans, our primary consumer loan category, we require title insurance, hazard insurance and, if required, flood insurance.
Mortgage Banking Lending Activities
Through our mortgage division Monarch Mortgage, for our own portfolio, we offer mortgages and construction loans to individual borrowers. Mortgages held for investment typically have initial resets in five years or less and are structured for a potential later sale on the secondary market. Our construction permanent loan program offers individual clients, typically working with a custom builder, a residential construction loan with the ability to sell the loan on the secondary market once complete through Monarch Mortgage. All other residential mortgage loans originated by Monarch Mortgage are sold to investors on the secondary market.
Competition
Commercial and Other Banking
The banking business is highly competitive. We encounter strong competition from a variety of bank and non-bank financial service providers. These competitors include commercial banks, savings banks, credit unions, consumer finance
6
companies, brokerage firms, money market mutual funds, mortgage banks, leasing, and finance companies. In addition, the delivery of financial services has changed significantly with personal computers, mobile smart phones, tablets and the Internet being used to access information and perform banking transactions.
Competition in our target market area for loans to businesses, professionals and consumers is very strong. Many of our competitors have substantially greater resources and lending limits and offer certain services, such as extensive and established banking office networks and other services, that we cannot provide. Moreover, larger institutions have access to borrowed funds at a lower costs. Several community banks are headquartered in our trade market areas. Several regional and super-regional banks, as well as a number of large credit unions, also have offices in our market area. Competition among institutions for deposits in the area remains strong.
Factors affecting the competition for bank loans and deposits are interest rates and terms offered, number and location of banking offices and types of products offered, as well as the reputation of the institution. The advantages we have over our competition include experienced and dedicated employees, our Market President structure, long-term customer relationships, strong historical financial performance, a commitment to excellent customer service, experienced management and directors, and the support and involvement in the communities that we serve. We focus on providing products and services to individuals, professionals, and small to medium-sized businesses within our communities.
Mortgage Banking
Factors affecting competition for our mortgage banking operations are our status as a mortgage lender as opposed to being a mortgage broker, the number and location of mortgage offices and types of loan programs offered, as well as the reputation of Monarch and our mortgage loan officers. Our advantages over the competition include experienced and dedicated employees, long-term customer and referral relationships, local and experienced underwriting, a commitment to excellent customer service, experienced management, and the support and involvement in the communities that we serve. We focus on residential mortgage loan origination and placement in the secondary market.
Supervision and Regulation
General
As a financial holding company, we are subject to regulation under the Bank Holding Company Act of 1956, as amended, and the examination and reporting requirements of the Federal Reserve. Other federal and state laws govern the activities of our bank subsidiary, Monarch Bank, including the activities in which it may engage, the investments that it makes, the aggregate amount of loans that it may grant to one borrower, the amount of capital it must retain, and the dividends it may declare and pay to us. Monarch Bank is also subject to various consumer and compliance laws. As a state-chartered bank, Monarch Bank is primarily subject to regulation, supervision and examination by the Bureau of Financial Institutions of the Virginia State Corporation Commission and the Federal Reserve Bank of Richmond. Monarch Bank also is subject to regulation, supervision and examination by the FDIC.
The following description summarizes the more significant federal and state laws applicable to us. To the extent that statutory or regulatory provisions are described, the description is qualified in its entirety by reference to that particular statutory or regulatory provision.
Bank Holding Company Act
To acquire the shares of Monarch Bank and thereby become a bank holding company within the meaning of the Bank Holding Company Act, we were required to obtain approval from, and register as a bank holding company, with the Federal Reserve, and are subject to ongoing regulation, supervision and examination by the Federal Reserve. As a condition to its approval, the Federal Reserve required that we obtain approval from the Federal Reserve Bank of Richmond prior to incurring any indebtedness. We are required to file with the Federal Reserve periodic and annual reports and other information concerning our business operations and those of our subsidiaries. In addition, the Bank Holding Company Act requires a bank holding company to obtain Federal Reserve approval before it acquires, directly or indirectly, ownership or control of any voting shares of a second or subsequent bank if, after such acquisition, it would own or control more than 5% of such shares, unless it already owns or controls a majority of such voting shares. Federal Reserve approval must also be obtained before a bank holding company acquires all or substantially all of the assets of another bank or merges or consolidates with another bank holding company. Any acquisition by a bank holding company of more than 5% of the voting shares, or of all or substantially all of the assets, of a bank located in another state may not be approved by the Federal Reserve unless such acquisition is specifically authorized by the laws of that second state.
A bank holding company is prohibited under the Bank Holding Company Act, with limited exceptions, from acquiring or obtaining direct or indirect ownership or control of more than 5% of the voting shares of any company that is not a bank, or from engaging in any activities other than those of banking or of managing or controlling banks or furnishing services to or performing services for its subsidiaries. An exception to these prohibitions permits a bank holding company to engage in, or
7
acquire an interest in a company which engages in, activities which the Federal Reserve, after due notice and opportunity for hearing, by regulation or order, has determined is so closely related to banking or of managing or controlling banks as to be a proper incident thereto. A number of such activities have been determined by the Federal Reserve to be permissible, including servicing loans, performing certain data processing services, and acting as a fiduciary, investment or financial adviser.
A bank holding company may not, without providing notice to the Federal Reserve, purchase or redeem its own stock if the gross consideration to be paid, when added to the net consideration paid by the company for all purchases or redemptions by the company of its equity securities within the preceding 12 months, will equal 10% or more of the company’s consolidated net worth, unless it meets the requirements of a well capitalized and well managed organization.
Dodd-Frank Act
The Dodd-Frank Wall Street Reform and Consumer Protection Act (the “Dodd-Frank Act”) was signed into law in July 2010, incorporating numerous financial institution regulatory reforms. Since the signing of the Dodd-Frank Act, a number of the reforms have been implemented, but additional reforms are in process and will be implemented in 2016 and beyond through regulations to be adopted by various federal banking and securities regulatory agencies. The Dodd-Frank Act implements far-reaching reforms of major elements of the financial landscape, particularly for larger financial institutions. Many of its provisions do not directly impact community-based institutions like the Bank. For instance, provisions that regulate derivative transactions and limit derivatives trading activity of federally-insured institutions, enhance supervision of “systemically significant” institutions, impose new regulatory authority over hedge funds, limit proprietary trading by banks, and phase-out the eligibility of trust preferred securities for Tier 1 capital are among the provisions that do not directly impact the Bank either because of exemptions for institutions below a certain asset size or because of the nature of the Bank’s operations. Provisions that impact the Bank include the following:
• | FDIC Assessments. The Dodd-Frank Act changes the assessment base for federal deposit insurance from the amount of insured deposits to average consolidated total assets less its average tangible equity. In addition, it increases the minimum size of the Deposit Insurance Fund (“DIF”) and eliminates its ceiling, with the burden of the increase in the minimum size on institutions with more than $10 billion in assets. |
• | Deposit Insurance. The Dodd-Frank Act makes permanent the $250,000 limit for federal deposit insurance. |
• | Interest on Demand Deposits. The Dodd- Frank Act also provides that, effective one year after the date of enactment, depository institutions may pay interest on demand deposits, including business transaction and other accounts. |
• | Consumer Financial Protection Bureau. The Dodd-Frank Act centralizes responsibility for consumer financial protection by creating a new agency, the Consumer Financial Protection Bureau, responsible for implementing federal consumer protection laws, although banks below $10 billion in assets will continue to be examined and supervised for compliance with these laws by their federal bank regulator. |
• | Mortgage Lending. New requirements are imposed on mortgage lending, including new minimum underwriting standards, prohibitions on certain yield-spread compensation to mortgage originators, special consumer protections for mortgage loans that do not meet certain provision qualifications, prohibitions and limitations on certain mortgage terms and various new mandated disclosures to mortgage borrowers. |
• | Holding Company Capital Levels. Bank regulators are required to establish minimum capital levels for holding companies that are at least as stringent as those currently applicable to banks. In addition, all trust preferred securities issued after May 19, 2010 will be counted as Tier 2 capital. |
• | De Novo Interstate Branching. National and state banks are permitted to establish de novo interstate branches outside of their home state, and bank holding companies and banks must be well-capitalized and well managed in order to acquire banks located outside their home state. |
• | Transactions with Affiliates. The Dodd-Frank Act enhances the requirements for certain transactions with affiliates under Section 23A and 23B of the Federal Reserve Act, including an expansion of the definition of “covered transactions” and increasing the amount of time for which collateral requirements regarding covered transactions must be maintained. |
• | Transactions with Insiders. Insider transaction limitations are expanded through the strengthening of loan restrictions to insiders and the expansion of the types of transactions subject to the various limits, including derivative transactions, repurchase agreements, reverse repurchase agreements and securities lending or borrowing transactions. Restrictions are also placed on certain asset sales to and from an insider to an institution, including requirements that such sales be on market terms and, in certain circumstances, approved by the institution’s board of directors. |
• | Corporate Governance. The Dodd-Frank Act includes corporate governance revisions that apply to all public companies, not just financial institutions, including with regard to executive compensation. |
8
Many aspects of the Dodd-Frank Act are subject to rule-making and will take effect over several years, and their impact on the Company or the financial industry is difficult to predict before such regulations are adopted and interpreted by the regulatory agencies.
Regarding Capital Requirements
The Dodd-Frank Act contains a number of provisions dealing with capital adequacy of insured depository institutions and their holding companies, which has resulted in more stringent capital requirements. Under the Collins Amendment to the Dodd-Frank Act, federal regulators established minimum leverage and risk-based capital requirements for, among other entities, banks and bank holding companies on a consolidated basis. In July 2013, the Federal Reserve published the Basel III Capital Rules establishing a new comprehensive capital framework for U.S. banking organizations. The rules implemented the Basel Committee’s December 2010 framework known as “Basel III” for strengthening international capital standards as well as certain provisions of the Dodd-Frank Act.
The Basel III Capital Rules substantially revised the risk-based capital requirements applicable to bank holding companies and depository institutions, including the Company and the Bank, compared to the previous U.S. risk-based capital rules. The Basel III Capital Rules defined the components of capital and addressed other issues affecting the numerator in banking institutions’ regulatory capital ratios. The Basel III Capital Rules also addressed risk weights and other issues affecting the denominator in banking institutions’ regulatory capital ratios and replaced the existing risk-weighting approach, which was derived from the Basel I capital accords of the Basel Committee, with a more risk-sensitive approach; based in part, on the standardized approach in the Basel Committee’s 2004 “Basel II” capital accords. The Basel III Capital Rules also implemented the requirements of Section 939A of the Dodd-Frank Act to remove references to credit ratings from the federal banking agencies’ rules. The Basel III Capital Rules were effective for the Company and the Bank, subject to a phase-in period, on January 1, 2015.
The Basel III Capital Rules, among other things, (i) introduced a new capital measure called “Common Equity Tier 1” (“CET1”), (ii) specified that Tier 1 capital consists of CET1 and “Additional Tier 1 capital” instruments meeting specified requirements, (iii) defined CET1 narrowly by requiring that most deductions/adjustments to regulatory capital measures be made to CET1 and not to the other components of capital and (iv) expanded the scope of the deductions/adjustments as compared to existing regulations.
When fully phased in on January 1, 2019, the Basel III Capital Rules will require the Company and the Bank to maintain (i) a minimum ratio of CET1 to risk-weighted assets of at least 4.5%, plus a 2.5% “capital conservation buffer” (which is added to the 4.5% CET1 ratio as that buffer is phased in, effectively resulting in a minimum ratio of CET1 to risk-weighted assets of at least 7% upon full implementation), (ii) a minimum ratio of Tier 1 capital to risk-weighted assets of at least 6.0%, plus the capital conservation buffer (which is added to the 6.0% Tier 1 capital ratio as that buffer is phased in, effectively resulting in a minimum Tier 1 capital ratio of 8.5% upon full implementation), (iii) a minimum ratio of total capital (that is, Tier 1 plus Tier 2) to risk-weighted assets of at least 8.0%, plus the capital conservation buffer (which is added to the 8.0% total capital ratio as that buffer is phased in, effectively resulting in a minimum total capital ratio of 10.5% upon full implementation), and (iv) a minimum leverage ratio of 4%, calculated as the ratio of Tier 1 capital to average assets (as compared to a current minimum leverage ratio of 3% for banking organizations that either have the highest supervisory rating or have implemented the appropriate federal regulatory authority’s risk-adjusted measure for market risk).
The Basel III Capital Rules also provided for a “countercyclical capital buffer” that is applicable to only certain covered institutions and is not expected to have any current applicability to the Company or the Bank. The capital conservation buffer was designed to absorb losses during periods of economic stress. Banking institutions with a ratio of CET1 to risk-weighted assets above the minimum but below the conservation buffer (or below the combined capital conservation buffer and countercyclical capital buffer, when the latter is applied) will face constraints on dividends, equity repurchases and compensation based on the amount of the shortfall.
Under the Basel III Capital Rules, the minimum capital ratios including the capital conservation buffer of 0.625%, as of January 1, 2016, are as follows:
• 5.125% CET1 to risk-weighted assets.
• 6.625% Tier 1 capital to risk-weighted assets.
• 8.625% Total capital to risk-weighted assets.
The Basel III Capital Rules provided for a number of deductions from and adjustments to CET1. These included, for example, the requirement that mortgage servicing rights, deferred tax assets arising from temporary differences that could not be realized through net operating loss carry-backs and significant investments in non-consolidated financial entities be deducted from CET1 to the extent that any one such category exceeds 10% of CET1 or all such categories in the aggregate exceed 15% of CET1. Under previous capital standards, the effects of accumulated other comprehensive income items included
9
in capital were excluded for the purposes of determining regulatory capital ratios. Under the Basel III Capital Rules, the effects of certain accumulated other comprehensive items are not excluded; however, non-advanced approaches banking organizations, including the Company and the Bank, were able to make a one-time permanent election to continue to exclude these items. The Company and the Bank made this election in order to avoid significant variations in the level of capital depending upon the impact of interest rate fluctuations on the fair value of the Company’s available-for-sale securities portfolio. The Basel III Capital Rules also precluded certain hybrid securities, such as trust preferred securities, as Tier 1 capital of bank holding companies, subject to phase-out. The rules do not require a phase-out of trust preferred securities issued prior to May 19, 2010, for holding companies of depository institutions with less than $15 billion in consolidated total assets, as of December 1, 2009, which includes the Company. Therefore, the Company’s trust preferred securities that were issued prior to May 19, 2010, are permanently grandfathered in as Tier 1 or Tier 2 capital instruments.
Implementation of the deductions and other adjustments to CET1 began on January 1, 2015 and will be phased in over a four-year period (beginning at 40% on January 1, 2015 and an additional 20% per year thereafter). The implementation of the capital conservation buffer began on January 1, 2016 at the 0.625% level and be phased in over a four-year period (increasing by that amount on each subsequent January 1, until it reaches 2.5% on January 1, 2019).
With respect to the Bank, the Basel III Capital Rules also revise the “prompt corrective action” regulations pursuant to Section 38 of the Federal Deposit Insurance Act, as discussed below under “Prompt Corrective Action.” The Basel III Capital Rules prescribed a standardized approach for risk weightings that expanded the risk-weighting categories from the previous four Basel I-derived categories (0%, 20%, 50% and 100%) to a much larger and more risk sensitive number of categories, depending on the nature of the assets, generally ranging from 0% for U.S. government and agency securities, to 600% for certain equity exposures, and resulting in higher risk weights for a variety of asset categories. Specific changes to the previous rules and impacting the Company’s determination of risk-weighted assets include, among other things:
• | Applying a 150% risk weight instead of a 100% risk weight for certain high volatility commercial real estate acquisition, development and construction loans. |
• | Assigning a 150% risk weight to exposures (other than residential mortgage exposures) that are 90 days past due. |
• | Providing for a 20% credit conversion factor for the unused portion of a commitment with an original maturity of one year or less that is not unconditionally cancellable (currently set at 0%). |
• | Providing for a risk weight, generally not less than 20% with certain exceptions, for securities lending transactions based on the risk weight category of the underlying collateral securing the transaction. |
• | Providing for a 100% risk weight for claims on securities firms. Eliminating the current 50% cap on the risk weight for OTC derivatives. |
In addition, the Basel III Capital Rules provided more advantageous risk weights for derivatives and repurchase-style transactions cleared through a qualifying central counter-party and increase the scope of eligible guarantors and eligible collateral for purposes of credit risk mitigation. Management believes that, as of December 31, 2015, the Company and the Bank meets, and will continue to meet, all capital adequacy requirements under the Basel III Capital Rules on a fully phased-in basis.
Regarding transactions with insiders
The Dodd-Frank Act also provides that banks may not “purchase an asset from, or sell an asset to” a bank insider (or their related interests) unless (i) the transaction is conducted on market terms between the parties, and (ii) if the proposed transaction represents more than 10 percent of the capital stock and surplus of the bank, it has been approved in advance by a majority of the bank’s non-interested directors.
Monarch Bank
The Federal Reserve and the Virginia Bureau of Financial Institutions regulate and monitor all significant aspects of Monarch Bank’s operations. The Federal Reserve requires quarterly reports on our financial condition, and both federal and state regulators conduct periodic examinations of the Bank. The cost of complying with these regulations and reporting requirements can be significant. In addition, some of these regulations, such as the ability to pay dividends, impact investors directly.
For member banks like Monarch Bank, the Federal Reserve has the authority to prevent the continuance or development of unsound and unsafe banking practices and to approve conversions, mergers and consolidations. Obtaining regulatory approval of these transactions can be expensive, time consuming, and ultimately may not be successful. The opening of any additional banking offices by the Bank requires prior regulatory approval, which takes into account a number of factors, including, among others, adequate capital to support additional expansion and a finding that public interest will be served by
10
such expansion. While we plan to seek regulatory approval to establish additional banking offices, there can be no assurance when, or if, we will be permitted to so expand.
As a member of the Federal Reserve, we are also required to comply with rules that restrict preferential loans by the Bank to “insiders,” requiring us to keep information on loans to principal stockholders and executive officers, and prohibit certain director and officer interlocks between financial institutions. Our loan operations, particularly for consumer and residential real estate loans, are also subject to numerous legal requirements, as are our deposit activities. In addition to regulatory compliance costs, these laws may create the risk of liability to us for noncompliance.
Dividends
The Company is a legal entity, separate and distinct from the Bank. A significant portion of the revenues of the Company result from the dividends paid to it by the Bank. The amount of cash dividends we are permitted to pay will depend upon our earnings and capital position and is limited by federal and state law, regulations and policies applicable to the payment of dividends by the Bank to the Company and to the payment of dividends by the Company to its shareholders. Virginia law imposes restrictions on the ability of all banks chartered under Virginia law to pay dividends. Under Virginia law, no dividend may be declared or paid that would impair a bank’s paid-in capital, and payments must be paid from retained earnings. Virginia banking regulators and the Federal Reserve have the general authority to limit dividends paid by the Bank or the Company if such payments are deemed to constitute an unsafe and unsound practice.
Under current supervisory practice, prior approval of the Federal Reserve is required if cash dividends of the Bank declared in any given year exceed the total of the Bank's net profits for such year plus retained net profits for the preceding two years. In addition, the Bank may not pay a dividend in an amount greater than its undivided profits then on hand after deducting current losses and bad debts. For this purpose, bad debts are generally defined to include the principal amount of all loans which are in arrears with respect to interest by six months or more, unless such loans are fully secured and in the process of collection. Federal law further provides that no insured depository institution may make any capital distribution (which would include a cash dividend) if, after making the distribution, the institution would not satisfy one or more of its minimum capital requirements. The Federal Reserve also has issued guidelines that bank holding companies should inform and consult with the Federal Reserve in advance of declaring or paying a dividend that exceeds earnings, for the period for which the dividend is being paid.
Federal Deposit Insurance Corporation
Our deposits are insured by the Deposit Insurance Fund ("DIF"), as administered by the FDIC, to the maximum amount permitted by law. The FDIC is required to maintain a designated minimum ratio of the DIF to insured deposits in the United States. The Dodd Frank Act requires the FDIC to assess insured depository institutions to achieve a DIF ratio of at least 1.35 percent by September 30, 2020. The FDIC has adopted new regulations that establish a long-term target DIF ratio of greater than two percent. Deposit insurance assessment rates are subject to change by the FDIC and will be impacted by the overall economy and the stability of the banking industry as a whole.
Pursuant to the Dodd Frank Act, FDIC insurance coverage limits were permanently increased from $100,000 to $250,000 per customer. The Dodd Frank Act also changed the methodology for calculating deposit insurance assessments by changing the assessment base from the amount of an insured depository institution’s domestic deposits to its total assets minus tangible equity. The FDIC implemented a risk-based deposit insurance assessment system under which the assessment rate for an insured institution may vary according to regulatory capital levels of the institution and other factors, including supervisory evaluations. On February 7, 2011, the FDIC issued a new regulation implementing revisions to the assessment system mandated by the Dodd Frank Act. The new regulation was effective April 1, 2011 and was reflected in the June 30, 2011 FDIC fund balance and the invoices for assessments due September 30, 2011. As a result of the regulations, our annual deposit insurance assessments were lower than before the regulation.
On January 21, 2016, the FDIC approved new assessment regulations which will be applied to banks with less than $10 billion in assets once the DIF exceeds 1.15% of estimated insured deposits, which is expected to occur in 2016. While the burden of replenishing the DIF has been placed primarily on institutions with assets of greater than $10 billion, these future changes in required deposit insurance premiums or other bank industry fees could have a significant adverse impact on our financial condition and results of operations.
Capital Requirements
Each of the FDIC and the Federal Reserve Board have issued risk-based and leverage capital guidelines applicable to the banking organizations it supervises. In 2015, under the risk-based capital requirements, we and our bank subsidiary were each generally required to maintain a minimum ratio of total capital to risk-weighted assets (including specific off-balance sheet activities, such as standby letters of credit) of 8%. In 2016 the addition of a phased-in capital conservation buffer increases the minimum ratio to 8.625%. At least half of the total capital must be Tier 1, which is defined as common equity, retained earnings, qualifying perpetual preferred stock and minority interests in common equity accounts of consolidated subsidiaries,
11
less certain intangibles. The remainder may consist of Tier 2 Capital, which is defined as specific subordinated debt, some hybrid capital instruments and other qualifying preferred stock and a limited amount of the loan loss allowance and pretax net unrealized holding gains on certain equity securities. In addition, each of the federal banking regulatory agencies has established minimum leverage capital requirements for banking organizations. Under these requirements, banking organizations must maintain a minimum ratio of Tier 1 capital to adjusted average quarterly assets equal to 4% to 5%, subject to federal bank regulatory evaluation of an organization's overall safety and soundness. See "Regarding Capital Requirements" in the "Dodd-Frank Act" section above.
The risk-based capital standards of each of the FDIC and the Federal Reserve Board explicitly identify concentrations of credit risk and the risk arising from non-traditional activities, as well as an institution's ability to manage these risks, as important factors to be taken into account by the agency in assessing an institution's overall capital adequacy. The capital guidelines also provide that an institution's exposure to a decline in the economic value of its capital due to changes in interest rates be considered by the agency as a factor in evaluating a banking organization's capital adequacy.
The FDIC may take various corrective actions against any under-capitalized bank and any bank that fails to submit an acceptable capital restoration plan or fails to implement a plan acceptable to the FDIC. These powers include, but are not limited to, requiring the institution to be recapitalized, prohibiting asset growth, restricting interest rates paid, requiring prior approval of capital distributions by any financial holding company that controls the institution, requiring divestiture by the institution of its subsidiaries or by the holding company of the institution itself, requiring new election of directors, and requiring the dismissal of directors and officers. We are considered “well-capitalized” at December 31, 2015 and, in addition, our bank subsidiary maintained sufficient capital to remain in compliance with capital requirements and is considered “well-capitalized” at December 31, 2015.
Affiliate Transactions and Branching
The Federal Reserve Act restricts loans, investments, asset purchases and other transactions between banks and their affiliates; including placing collateral requirements and requiring that those transactions are on terms and under conditions substantially the same as those prevailing at the time for comparable transactions with non-affiliates. Subject to receipt of required regulatory approvals, we may acquire banking offices without geographic restriction in Virginia, and we may acquire banking offices or banks or merge across state lines in most cases.
Community Reinvestment Act
The Community Reinvestment Act of 1977 requires that federal banking regulators evaluate the record of the financial institutions in meeting the credit needs of their local communities, including low and moderate income neighborhoods, consistent with the safe and sound operation of those institutions. These factors are also considered in evaluating mergers, acquisitions, and applications to open a banking office or facility. We received a “Satisfactory” CRA rating in our latest CRA examination.
Volcker Rule
The Dodd-Frank Act prohibits insured depository institutions and their holding companies from engaging in proprietary trading except in limited circumstances and prohibits them from equity ownership of private equity and hedge funds in excess of 3% of Tier 1 capital (known as the "Volcker Rule"). On December 10, 2013, the federal bank regulatory agencies adopted final rules implementing the Volcker Rule. These final rules prohibit banking entities from engaging in short-term proprietary trading for their own accounts and having certain ownership interests in and relationships with hedge funds or private equity funds. The final rules also provide some tiering of compliance and reporting obligations based on size. The final rules were effective April 1, 2014, but the conformance period was extended from its statutory end date of July 21, 2014 until July 21, 2015. The Company was not financially impacted by these rules.
Other Regulations
We are subject to a variety of other regulations. State and federal laws restrict interest rates on loans, potentially affecting our income. In 2015, the combination of the Truth in Lending Act ("TILA") and the Real Estate Settlement Procedures (RESPA) into the TILA RESPA Integrated Disclosures ("TRID") imposed new information requirements on us in making loans in addition to the existing Home Mortgage Disclosure Act. The Equal Credit Opportunity Act prohibits discrimination in lending on the basis of race, creed, or other prohibited factors. The Fair Credit Reporting Act and the Fair and Accurate Credit Transactions Act govern the use and release of information to credit reporting agencies. The Truth in Savings Act requires disclosure of yields and costs of deposits and deposit accounts. The Secure and Fair Enforcement for Mortgage Licensing Act requires that mortgage loan originators employed by “Agency-regulated” institutions be registered with the National Mortgage Licensing System and Registry. Other acts govern confidentiality of consumer financial records, automatic deposits and withdrawals, check settlement, endorsement and presentment, and disclosure of cash transactions exceeding $10 thousand to the Internal Revenue Service.
12
USA PATRIOT Act of 2001
In October 2001, the USA PATRIOT Act was enacted in response to the terrorist attacks in New York, Pennsylvania and Washington, D.C., which occurred on September 11, 2001. The USA PATRIOT Act is intended to strengthen the ability of U.S. law enforcement agencies and the intelligence communities to work cohesively to combat terrorism on a variety of fronts. The potential impact of the USA PATRIOT Act on financial institutions of all kinds is significant and wide ranging. The USA PATRIOT Act contains sweeping anti-money laundering and financial transparency laws and imposes various regulations, including standards for verifying client identification at account opening, and rules to promote cooperation among financial institutions, regulators and law enforcement entities in identifying parties that may be involved in terrorism or money laundering.
Governmental Monetary Policies
Our earnings and growth are affected not only by general economic conditions, but also by the monetary policies of various governmental regulatory authorities, particularly the Federal Reserve. The Federal Reserve Open Market Committee implements national monetary policy, control of the discount rate and establishment of reserve requirements against both member and nonmember financial institutions’ deposits. These actions have a significant effect on the overall growth and distribution of loans, investments and deposits, as well as the rates earned on loans, or paid on deposits.
Our management is unable to predict the effect of possible changes in monetary policies upon our future operating results.
Access to Filings
We make available all periodic and current reports, free of charge, on our website as soon as reasonably practicable after such material is electronically filed with, or furnished to the Securities and Exchange Commission (SEC). Monarch’s website address is www.monarchbank.com. After accessing the Website, the filings are available upon selecting the About Monarch & Investor Documents menu items. The contents of the website are not incorporated into this report or into Monarch’s other filings with the SEC.
The public may read and copy any materials Monarch Financial Holdings, Inc., files with the SEC at the SEC’s Public Reference Room at 100 F Street, NE, Washington, DC 20549. In addition the public may obtain information on the operation of the Public Reference Room by calling the SEC at 1-800-SEC-0330. The SEC maintains an Internet site that contains reports, proxy and information statements, and other information regarding issuers that file electronically with the SEC at its website (http://www.sec.gov).
Item 1A. | Risk Factors. |
An investment in our common stock involves risk, and you should not invest in our common stock unless you can afford to lose some or all of your investment. You should carefully read the risks described below before you decide to buy any of our common stock. Our business, prospects, financial condition and results of operations could be harmed by any of the following risks.
Risks Relating to the Company's Proposed Merger with Towne
Combining with Towne may be more difficult, costly or time consuming than expected, and the anticipated benefits and cost savings of the merger with Towne may not be realized.
The Company and Towne have operated and, until the completion of the merger, will continue to operate, independently. The success of the merger, including anticipated benefits and cost savings, will depend, in part, on Towne's and the Company's ability to successfully combine and integrate the business of the Company and Towne in a manner that permits growth opportunities and does not materially disrupt the existing client relations or result in decreased revenue due to loss of clients. It is possible that the integration process could result in the loss of key employees, the disruption of either company's ongoing businesses or inconsistencies in standards, controls, procedures and policies that adversely affect the combined company's ability to maintain relationships with clients, customers, depositors and employees or to achieve the anticipated benefits and cost savings of the merger. If the combined companies experience difficulties with the integration process, the anticipated benefits of the merger may not be realized fully or at all, or may take longer to realize than expected. There also may be business disruptions that cause the Company and /or Towne to lose clients or cause clients to remove their accounts from the Company and/or Towne and move their business to competing financial institutions. Integration efforts between the two companies will also divert management attention and resources. These integration matters could have an adverse effect on both the Company and Towne during the transition period and for an undetermined period after completion of the merger on the combined Company.
13
Additionally, the combined company may not be able to successfully achieve the level of cost savings, revenue enhancements and other synergies that it expects, and may not be able to capitalize upon the existing customer relationships of each party to the extent anticipated, or it may take longer, or be more difficult or expensive than expected, to achieve these goals. The circumstances could have an adverse effect on combined company business, results of operations and stock price.
If the merger with Towne is not completed, the Company will have incurred substantial expenses without realizing the expected benefits of the merger.
We have incurred and will continue to incur substantial expenses in connection with the negotiation and completion of the transactions contemplated by the merger agreement with Towne. If the merger is not completed, we would have to recognize these expenses without realizing the expected benefits of the merger.
We are subject to business uncertainties and contractual restrictions while the merger with Towne is pending.
Uncertainty about the effect of the merger with Towne on employees and clients may have an adverse effect on us. The uncertainties may impair our ability to attract, retain and motivate key personnel until the merger is completed, and could cause clients and others that deal with us to seek to change existing business relationships. Retention of certain employees by us may be challenging while the merger is pending, as certain employees may experience uncertainty about their future roles with the combined company. If key employees depart because of issues relating to the uncertainty and difficulty of integration or a desire not to remain with us, our business could be harmed. In addition, subject to certain exceptions, we have agreed to operate the Company's business in the ordinary course prior to closing.
The merger may distract management of the Company from its other responsibilities.
The merger could cause the management of the Company to focus its time and energies on matters related to the merger that otherwise would be directed to its business and operations. Any such distraction on the part of the Company's management, if significant, could affect its ability to service existing business and develop new business and adversely affect the business and earnings of the Company before the merger, or the business and earnings of Towne after the merger.
The merger Agreement limits the ability of the Company to pursue alternatives to the merger.
The merger agreement contains a "no-shop" provision that, subject to limited exceptions, limits the ability of the Company to facilitate competing third-party proposals to acquire all or a significant part of the Company. In addition, under certain circumstances, if the Merger Agreement is terminated and the Company, subject to certain restrictions, consummates a similar transaction other than the merger, the Company must pay to Towne a termination fee of $8.0 million. These provisions might discourage a potential competing acquirer that might have an interest in acquiring all or a significant part of the Company from considering or proposing the acquisition even if it were prepared to pay consideration, with respect to the Company, with a higher per share market price than the proposed merger.
Regulatory approvals may not be received, may take longer than expected, or may impose conditions that are not presently anticipated or that could have an adverse effect on the combined company following the merger.
Before the merger may be completed, Towne and the Company must obtain approvals from the FDIC, Virginia State Corporation Commission, Bureau of Financial Institutions and the Board of Governors of the Federal Reserve System. Other approvals, waivers or consents from regulators may also be required. These regulators may impose conditions on the completion of the merger or require changes to the terms of the merger. Although Towne and the Company do not currently expect that any such conditions or changes would be imposed, there can be no assurance that they will not be, and such conditions or changes could have the effect of delaying or preventing completion of the merger or imposing additional costs on or limiting the revenues of the combined company following the merger, any of which might have an adverse effect on the combined company following the merger.
Risks Relating to Our Business
Changes in interest rates may impact our net interest margin and profitability.
Our profitability depends in substantial part on our net interest margin, which is the difference between the rates we receive on loans and investments and the rates we pay for deposits and other sources of funds. Our net interest margin depends on many factors that are partly or completely outside of our control, including competition, monetary and fiscal policies, and economic conditions generally. Our net interest margin is impacted when the Federal Reserve increases or decreases interest rates, due to our loan and deposit maturities and structure. We try to minimize our exposure to interest rate risk, but we are unable to completely eliminate this risk.
14
Changes in our delivery method for loans held for sale may impact profitability.
We manage the majority of our interest rate risk by locking in the interest rate for each mortgage loan with our correspondents (investors) and borrowers at the same time, which is a “best efforts” delivery system. A smaller portion of our delivery system utilizes a “mandatory delivery” process. Under the mandatory delivery system the interest rate risk associated with a rate lock on a mortgage loan shifts from the investor back to our Company. Therefore, to the extent we adopt the mandatory delivery system our interest income could be adversely impacted if mortgage rates were to become volatile. We had $72.8 million in mortgage loans in the mandatory delivery system at year end.
Our profitability depends significantly on economic conditions in our market area.
Our success depends to a large degree on the general economic conditions in Greater Hampton Roads, Virginia. In recent years our market experienced a downturn in which we saw falling home prices, rising foreclosures, reduced economic activity, increased unemployment and an increased level of commercial and consumer delinquencies. Although the economy in the nation has seen improvement, our local economy is lagging because of military dependency and the impact of government cutbacks. If economic conditions in our market further deteriorate, we could experience any of the following consequences, each of which could further adversely affect our business:
• | demand for our products and services could decline; |
• | loan delinquencies may increase; and |
• | problem assets and foreclosures may increase. |
We could experience further adverse consequences in the event of a prolonged economic downturn in our market due to our exposure to commercial loans across various lines of business. A prolonged economic downturn could impact collateral values or cash flows of the borrowing businesses, and as a result our primary source of repayment could be insufficient to service the debt. In addition, adverse consequences to us in the event of a prolonged economic downturn in our market could be compounded by the fact that many of our commercial and real estate loans are secured by real estate located in our market area. A further significant decline in real estate values in our market would mean that the collateral for many of our loans would provide less security. As a result, we would be more likely to suffer losses on defaulted loans because our ability to fully recover on defaulted loans by selling the real estate collateral would be diminished. In addition, a number of our loans are dependent on successful completion of real estate projects and demand for homes, both of which could be affected adversely by a decline in the real estate markets.
Future economic conditions in our market will depend on factors outside of our control such as political and market conditions, broad trends in industry and finance, legislative and regulatory changes, changes in government, military and fiscal policies and inflation. Adverse changes in economic conditions in our market would likely impair our ability to collect loans and could otherwise have a negative effect on our financial condition.
If we experience greater loan losses than anticipated, it will have an adverse effect on our net income and our ability to fund our growth strategy.
While the risk of nonpayment of loans is inherent in banking, if we experience greater nonpayment levels than we anticipate, our earnings and overall financial condition, as well as the value of our Common Stock, could be adversely affected. We cannot assure you that our monitoring, procedures and policies will reduce certain lending risks or that our allowance for loan losses will be adequate to cover actual losses. In addition, as a result of the growth in our loan portfolio, loan losses may be greater than management’s estimates of the appropriate level for the allowance. Loan losses can cause insolvency and failure of a financial institution and, in such an event, our stockholders could lose their entire investment. In addition, future provisions for loan losses could materially and adversely affect our profitability. Any loan losses will reduce the loan loss allowance. A reduction in the loan loss allowance will be restored by an increase in our provision for loan losses. This would reduce our earnings, which could have an adverse effect on our stock price.
Our profitability depends on our ability to manage our balance sheet to minimize the effects of interest rate fluctuation on our net interest margin.
Our results of operations depend on the stability of our net interest margin, which is dependent in part on the difference between the rates we receive on loans and investments and the rates we pay for deposits and other sources of funds. Interest rates, because they are influenced by, among other things, expectations about future events, including the level of economic activity, federal monetary and fiscal policy and geo-political stability, are not predictable or controllable. In addition, the interest rates we can earn on our loan and investment portfolios and the interest rates we pay on our deposits are heavily influenced by competitive factors. Community banks are often at a competitive disadvantage in managing their cost of funds compared to the large regional, super-regional or national banks that have access to national and international capital markets. These factors influence our ability to maintain a stable net interest margin.
15
Our long-term goal is to maintain a neutral position in terms of the volume of assets and liabilities that mature or re-price during any period so that we may reasonably predict our net interest margin; however, interest rate fluctuations, loan prepayments, loan production and deposit flows are constantly changing and influence our ability to maintain this neutral position. Generally speaking, our earnings will be more sensitive to fluctuations in interest rates the greater the variance in the volume of assets and liabilities that mature or re-price in any period. The extent and duration of the sensitivity will depend on the cumulative variance over time, the velocity and direction of interest rates, and whether we are more asset sensitive or liability sensitive. Accordingly, we may not be successful in maintaining this neutral position and, as a result, our net interest margin may suffer, which will negatively impact our earnings. Based on our asset and liability position at December 31, 2015, a rise or decline in interest rates would have limited impact on our net interest income in the short term.
We rely heavily on our management team and the unexpected loss of any of those personnel could adversely affect our operations; we depend on our ability to attract and retain key personnel.
We are a client-focused and relationship-driven organization. We expect our future growth to be driven in a large part by the relationships maintained with our clients by our executive and senior lending officers. We have entered into employment agreements with Brad E. Schwartz, Chief Executive Officer of the Company, E. Neal Crawford, Jr., President of the Company, Andrew N. Lock, Executive Vice President and Chief Risk Officer of the Company, Lynette P. Harris, Executive Vice President and Chief Financial Officer of the Company, Denys D. Diaz, Executive Vice President and Chief Information Officer of the Company and William T. Morrison, Executive Vice President and Chief Executive Officer of Monarch Mortgage. The existence of such agreements, however, does not necessarily ensure that we will be able to continue to retain their services. Several other members of management currently have employment agreements to retain their services. The unexpected loss of key employees could have a material adverse effect on our business and possibly result in reduced revenues and earnings.
Also, our anticipated growth and success, in large part, will be due to the services provided by our mortgage banking officers and the employees of our residential mortgage division. The loss of services of one or more of these persons could have a material adverse effect on our operations, and our business could suffer. With the exception of Mr. Morrison, our mortgage loan originators are not a party to any employment agreement with us, and they could terminate their employment with us at any time and for any reason.
The implementation of our business strategy will also require us to continue to attract, hire, motivate and retain skilled personnel to develop new client relationships as well as new financial products and services. Many experienced banking professionals employed by our competitors are covered by agreements not to compete or solicit their existing clients if they were to leave their current employment. These agreements make the recruitment of these professionals more difficult. The market for these people is competitive, and we cannot assure you that we will be successful in attracting, hiring, motivating or retaining them.
Our operations depend upon third party vendors that perform services for us.
We outsource many of our operating and banking functions, including our data processing function, our item processing and the interchange and transmission services for our ATM network. As such, our success and our ability to expand our operations depend on the services provided by these third parties. Disputes with these third parties can adversely affect our operations. We may not be able to engage appropriate vendors to adequately service our needs, and the vendors we engage may not be able to perform successfully.
Revenue from our mortgage banking operations are sensitive to changes in economic conditions, decreased economic activity, a slowdown in the housing market, higher interest rates or new legislation and may adversely impact our profits.
Our mortgage banking division, Monarch Mortgage, has provided a significant portion of our consolidated revenue and maintaining our revenue stream in this segment is dependent upon our ability to originate loans and sell them to investors. Mortgage loan production levels are sensitive to changes in economic conditions and can suffer from decreased economic activity, a slowdown in the housing market or higher interest rates. Generally, any sustained period of decreased economic activity or higher interest rates could adversely affect Monarch Mortgage’s mortgage originations and, consequently, reduce its income from mortgage lending activities. New legislation could also adversely affect its operations.
Deteriorating economic conditions may also cause home buyers to default on their mortgages. In addition, if it is proven a borrower failed to provide full and accurate information on or related to their loan application or that appraisals have not been acceptable or the loan was not underwritten in accordance with the loan program specified by the loan investor, Monarch may be required to repurchase the loan or provide financial settlement to the investor. Such repurchases or settlements would also adversely affect our net income.
16
Periods of rising interest rates will adversely affect our income from our mortgage division.
In periods of rising interest rates, consumer demand for new mortgages and re-financings decreases which in turn, adversely impacts our mortgage banking division. Because interest rates depend on factors outside of our control, we cannot eliminate the interest rate risk associated with our mortgage operations.
We are subject to more stringent capital requirements, which could adversely affect our results of operations and future growth.
In June 2013, federal regulators issued final rules that revise their risk-based and leverage capital requirements and their method for calculating risk-weighted assets to implement the Basel III regulatory capital reforms and changes required by the Dodd-Frank Act. Many of these proposals are applicable to us when effective, and will add to and change the definitions of “capital” for regulatory purposes, the types and minimum levels of capital required under the prompt corrective action rules and for other regulatory purposes, and the right-weighting of various assets. These changes in capital requirements could result in lower returns on equity, require raising additional capital, or subject us to regulatory action if we are unable to comply, any of which could adversely affect our results of operations and future growth opportunities.
Our concentration in loans secured by real estate may increase our credit losses, which would negatively affect our financial results.
We offer a variety of secured loans, including commercial lines of credit, commercial term loans, real estate, construction, home equity, consumer and other loans. As of December 31, 2015, $664.9 million, or 80.2% of our loans held for investment were secured by real estate (both residential and commercial). A major change in the real estate market, such as deterioration in the value of this collateral, or in the local or national economy, could adversely affect our clients’ ability to pay these loans, which in turn could negatively impact us. Risk of loan defaults and foreclosures are unavoidable in the banking industry, and we try to limit our exposure to this risk by monitoring our extensions of credit carefully. We cannot fully eliminate credit risk, and as a result credit losses may occur in the future.
We may not be able to successfully manage our growth or implement our growth strategies, which may adversely affect our results of operations and financial condition.
A key aspect of our business strategy is our continued growth and expansion. Our ability to continue to grow depends, in part, upon our ability to:
• | open new banking offices; |
• | attract deposits to those locations; and |
• | identify attractive loan and investment opportunities. |
We may not be able to successfully implement our growth strategy if we are unable to identify attractive markets, locations or opportunities to expand in the future. Our ability to manage our growth successfully also will depend on whether we can maintain capital levels adequate to support our growth; maintain cost controls and asset quality and successfully integrate any new banking offices into our organization.
As we continue to implement our growth strategy by opening new banking and mortgage offices, we expect to incur construction costs and increased personnel, occupancy and other operating expenses. We generally must absorb those higher expenses while we continue to generate new deposits, and there is a further time lag involved in redeploying new deposits into attractively priced loans and other higher yielding earning assets. Thus, our plans to grow could depress our earnings in the short run, even if we efficiently execute this growth.
The soundness of other financial institutions could adversely affect us.
Our ability to engage in routine funding transactions could be affected adversely by the actions and commercial soundness of other financial institutions. Financial services institutions are interrelated as a result of trading, clearing, counter-party and other relationships. We have exposure to many different industries and counter-parties, and we routinely execute transactions with counter-parties in the financial industry. As a result, defaults by, or even rumors or questions about, one or more financial services institutions, or the financial services industry generally, have led to market-wide liquidity problems and could lead to losses or defaults by us or by other institutions. Many of these transactions expose us to credit risk in the event of default of our counterparty or client. In addition, our credit risk may be exacerbated when the collateral held by us cannot be realized upon or is liquidated at prices insufficient to recover the full amount of the financial instrument exposure due to us. There is no assurance that any such losses would not materially and adversely affect our results of operations.
Recent legislative regulatory initiatives to address difficult market and economic conditions could adversely affect us.
Banking regulations are primarily intended to protect depositors’ funds, federal deposit insurance funds and the banking system as a whole, not security holders. These regulations affect our lending practices, capital structure, investment practices,
17
dividend policy and growth, among other things. Congress and federal regulatory agencies continually review banking laws, regulations and policies for possible changes. The Dodd-Frank Act, enacted in July 2010, instituted major changes to the banking and financial institutions regulatory regimes in light of the recent performance of and government intervention in the financial services sector. Other changes to statutes, regulations or regulatory policies, including changes in interpretation or implementation of statutes, regulations or policies, could affect the Company in substantial and unpredictable ways. Such changes could subject us to additional costs, limit the types of financial services and products we may offer and/or increase the ability of non-banks to offer competing financial services and products, among other things. Failure to comply with laws, regulations or policies could result in sanctions by regulatory agencies, civil money penalties and/or reputation damage, which could have a material adverse effect on our business, financial condition and results of operations.
The repeal of federal prohibitions on payment of interest on demand deposits could increase our interest expense.
All federal prohibitions on the ability of financial institutions to pay interest on demand deposit accounts to businesses were repealed as part of the Dodd-Frank Act. As a result, financial institutions can now offer interest on demand deposits to compete for clients. Our interest expense may increase and our net interest margin may decrease if we begin paying interest on demand deposits to attract additional clients or to maintain current clients, which could have a material adverse effect on our business, financial condition and results of operations.
Our directors and executive officers own our common stock, and their interests may conflict with those of our other shareholders.
As of March 6, 2016, our directors and executive officers beneficially owned approximately 1,166,925 shares or 9.6% of our common stock. Accordingly, such persons will be in a position to exercise substantial influence over our affairs and may impede the acquisition of control by a third party. We cannot assure investors that the interests of our directors and executive officers will always align precisely with the interests of the holders of our common stock.
Our future success will depend on our ability to compete effectively in the highly competitive financial services industry.
The banking business is highly competitive, and we face substantial competition in all phases of our operations from a variety of different competitors. Our future growth and success will depend on our ability to compete effectively in this highly competitive financial services environment. Some of the financial services organizations with which we compete are not subject to the same degree of regulation as is imposed on bank holding companies and federally insured state-chartered banks, national banks and federal savings institutions. As a result, these non-bank competitors have certain advantages over us in accessing funding and in providing various services. Some of these competitors are subject to similar regulation but have the advantages of larger established client bases, higher lending limits, extensive banking office networks, numerous ATMs, greater advertising-marketing budgets and other factors.
Competition in our target market area for loans to businesses, professionals and consumers is very strong. Most of our competitors have substantially greater resources and lending limits than us and offer certain services, such as extensive and established banking office networks and trust services that we cannot provide. Moreover, larger institutions operating in Hampton Roads have access to borrowed funds at a lower cost than is available to us. Several community banks are headquartered in our trade areas. Several regional and super-regional banks, as well as a number of large credit unions, also have banking offices in our market area. Competition among institutions for checking and saving deposits in the area is intense.
Our legal lending limit may limit our growth.
We are limited in the amount we can lend to a single borrower by the amount of our capital. Generally, under current law, we may lend up to 15% of the unimpaired capital and surplus, of Monarch Bank, to any one borrower. As of December 31, 2015, we were allowed to lend approximately $20 million to any one borrower and maintained an in-house limit of approximately $16 million to any one borrower. This amount is significantly less than that of many of our competitors and may discourage potential borrowers who have credit needs in excess of our legal lending limit from doing business with us. Our legal lending limit also impacts the efficiency of our lending operation because it tends to lower our average loan size, which means we have to generate a higher number of transactions to achieve the same portfolio volume. We can accommodate larger loans by selling participations in those loans to other financial institutions, but this strategy is not efficient or always available. We may not be able to attract or maintain clients seeking larger loans or may not be able to sell participations in such loans on terms we consider favorable.
If our allowance for loan losses becomes inadequate, our results of operations may be adversely affected.
We maintain an allowance for loan losses that we believe is a reasonable estimate of known and inherent losses in our loan portfolio. Through a periodic review and consideration of the loan portfolio, management determines the amount of the allowance for loan losses by considering general market conditions, credit quality of the loan portfolio, the collateral supporting the loans and performance of our clients relative to their financial obligations with us. The amount of future losses is susceptible to changes in economic, operating and other conditions, including changes in interest rates that may be beyond our
18
control, and these losses may exceed our current estimates. Rapidly growing loan portfolios are, by their nature, unseasoned. As a result, estimating loan loss allowances is more difficult, and may be more affected by changes in estimates, and by losses exceeding estimates, than more seasoned portfolios. Although we believe the allowance for loan losses is a reasonable estimate of known and inherent losses in our loan portfolio, we cannot fully predict such losses or that our loan loss allowance will be adequate in the future. Excessive loan losses could have a material and adverse impact on our financial performance. Because of our growth strategy, we expect that our earnings will be negatively impacted by loan growth, which requires additions to our allowance for loan losses. Consistent with our loan loss reserve methodology, we expect to make additions to our loan loss reserve levels as a result of our growth strategy, which may affect our short-term earnings.
Federal and state regulators periodically review our allowance for loan losses and may require us to increase our provision for loan losses or recognize further loan charge-offs, based on judgments different than those of our management. Any increase in the amount of our provision or loans charged-off as required by these regulatory agencies could have a negative effect on our operating results.
The Company’s information systems may experience an interruption or breach in security.
We rely heavily on communications and information systems to conduct its business. In addition, as part of our business, we collect, process and retain sensitive and confidential client information. Our facilities and systems, and those of our third party service providers, may be vulnerable to security breaches, acts of vandalism, computer viruses, misplaced or lost data, programming and/or human errors, or other similar events. Any failure, interruption or breach in security of these systems could result in failures or disruptions in our client relationship management, general ledger, deposit, loan and other systems. While we have policies and procedures designed to prevent or limit the effect of the failure, interruption or security breach of our information systems, there can be no assurance that any such failures, interruptions or security breaches will not occur or, if they do occur, that they will be adequately addressed. The occurrence of any failures, interruptions or security breaches of our information systems could damage our reputation, result in a loss of client business, subject the Company and the Bank to regulatory scrutiny, or expose the Company and the Bank to civil litigation and possible financial liability, any of which could have a material adverse effect on our financial condition and results of operations.
Our ability to operate profitably may depend on our ability to implement various technologies into our operations.
The market for financial services, including banking services and consumer finance services is increasingly affected by advances in technology, including developments in telecommunications, data processing, computers, automation, Internet-based banking and telebanking. Our ability to compete successfully in our markets may depend on the extent to which we are able to exploit such technological changes. If we are not able to afford such technologies, properly or timely anticipate or implement such technologies, or properly train our staff to use such technologies, our business, financial condition or operating results could be adversely affected.
If we need additional capital in the future to continue our growth, we may not be able to obtain it on terms that are favorable. This could negatively affect our performance and the value of our Common Stock.
Our business strategy calls for continued growth. We anticipate that we will be able to support this growth through the generation of additional deposits at new banking locations as well as investment opportunities. However, we may need to raise additional capital in the future to support our continued growth and to maintain our capital levels. Our ability to raise capital through the sale of additional securities will depend primarily upon our financial condition and the condition of financial markets at that time. We may not be able to obtain additional capital in the amounts or on terms satisfactory to us. Our growth may be constrained if we are unable to raise additional capital as needed.
Continued growth may require raising additional capital which may dilute current stockholders’ ownership percentage.
In order to meet applicable regulatory capital requirements, we may, from time to time, need to raise additional capital to support continued growth. If selling our equity securities raises additional funds, the relative ownership interests of our existing stockholders would likely be diluted.
Regulatory Risks
Our need to comply with extensive and complex government regulation could have an adverse effect on our business.
The banking industry is subject to extensive regulation by state and federal banking authorities. Many of the banking regulations we are governed by are intended to protect depositors, the public or the insurance funds maintained by the FDIC, not stockholders. Banking regulations affect our lending practices, capital structure, investment practices, dividend policy and many other aspects of our business. These requirements may constrain our rate of growth and changes in regulations could adversely affect us. The burden imposed by these federal and state regulations may place banks in general, and us specifically, at a competitive disadvantage compared to less regulated competitors. In addition, the cost of compliance with regulatory requirements could adversely affect our ability to reduce losses or operate profitably.
19
In addition, because federal regulation of financial institutions changes regularly and is the subject of constant legislative debate, we cannot forecast how federal regulation of financial institutions may change in the future nor the impact those changes may have on our operations. We fully expect that the financial institution industry will remain heavily regulated in the near future and that additional laws or regulations may be adopted further regulating specific banking practices.
Compliance with the Dodd-Frank Act will increase our regulatory compliance burdens, and may increase our operating costs and/or adversely impact our earnings and/or capital ratios.
On July 21, 2010, President Obama signed the Dodd-Frank Act, which represented a significant overhaul of many aspects of the regulation of the financial services industry. Among other things, the Dodd-Frank Act created a new federal Consumer Financial Protection Bureau (“CFPB”), tightened capital standards, imposed clearing and margining requirements on many derivatives activities, and generally increased oversight and regulation of financial institutions and financial activities.
In addition to the self-implementing provisions of the statute, the Dodd-Frank Act calls for over 200 administrative rulemakings by numerous federal agencies to implement various parts of the legislation. While many rules have been finalized and/or issued in proposed form, additional rules have yet to be proposed. It is not possible at this time to predict when all such additional rules will be issued or finalized, and what the content of such rules will be. We will have to apply resources to ensure that we are in compliance with all applicable provisions of the Dodd-Frank Act and any implementing rules, which has and may continue to increase our costs of operations and adversely impact our earnings and/or capital.
The Dodd-Frank Act and any implementing rules that are ultimately issued could have adverse implications on the financial industry, the competitive environment, and/or our ability to conduct business.
Virginia law and the provisions of our articles of incorporation and bylaws could deter or prevent takeover attempts by a potential purchaser of our Common Stock that would be willing to pay you a premium for your shares of our Common Stock.
Our articles of incorporation and bylaws contain provisions that may be deemed to have the effect of discouraging or delaying uninvited attempts by third parties to gain control of us. These provisions include the division of our board of directors into classes with staggered terms, the ability of our board of directors to set the price, term and rights of, and to issue, one or more series of our preferred stock and the ability of our board of directors, in evaluating a proposed business combination or other fundamental change transaction, to consider the effect of the business combination on us and our stockholders, employees, customers and the communities which we serve. Similarly, the Virginia Stock Corporation Act contains provisions designed to protect Virginia corporations and employees from the adverse effects of hostile corporate takeovers. These provisions reduce the possibility that a third party could affect a change in control without the support of our incumbent directors. These provisions may also strengthen the position of current management by restricting the ability of stockholders to change the composition of the board of directors, to affect its policies generally and to benefit from actions which are opposed by the current board of directors.
Item 1B. | Unresolved Staff Comments. |
None.
Item 2. | Properties. |
The Company, through its subsidiaries, owns or leases buildings that are used in the normal course of business. The Company’s corporate headquarters is located at 1435 Crossways Blvd., Chesapeake, VA. This location also houses, Monarch Capital, LLC and Monarch Investments, LLC. The main banking center is located at 750 Volvo Parkway, Chesapeake, VA. Eight additional banking centers and two commercial lending centers are located primarily in southeastern Virginia, one loan production office is located in Richmond, VA. and two additional banking centers are located in northeastern North Carolina. The Company’s mortgage operation headquarters is located at 1635 Laskin Road, Virginia Beach, VA. Additionally, twenty-nine residential mortgage offices are located throughout Virginia, North Carolina, South Carolina and Maryland. Subsidiaries of Monarch Investment, LLC including; Coastal Home Mortgage and Real Estate Security Agency have offices in Virginia Beach, VA. See the Note 1 “Summary of Significant Accounting Policies” and Note 6 “Property and Equipment” contained in Item 8 of this Form 10-K for information with respect to the amounts at which Bank premises and equipment are carried and commitments under long-term leases. We believe our facilities are in good operating condition, suitable and adequate for our operational needs and are adequately insured.
20
Item 3. | Legal Proceedings. |
There are no material legal proceedings pending against the Company. In the ordinary course of our operations, we become party to various legal proceedings. Currently, we are not party to any material legal proceedings, and no such proceedings are, to management’s knowledge, threatened against us.
Item 4. | Mine Safety Disclosure – None. |
21
PART II
Item 5. | Market for Registrant’s Common Equity, Related Stockholder Matters and Issuer Purchases of Equity Securities. |
Our Common Stock is listed on the NASDAQ Capital Market under the symbol MNRK. As of March 7, 2016 there were approximately 2,140 known record holders of Common Stock.
The table below presents the high and low sales prices for our Common Stock for the past two years. All per share prices have been adjusted to reflect the 11 for 10 stock dividend on December 4, 2015. Market values are shown per share and are based on the shares outstanding, for 2015 and 2014.
Market Price for | 2015 | ||||||
Common Stock | High | Low | |||||
4th Quarter | $ | 18.22 | $ | 11.23 | |||
3rd Quarter | 12.16 | 11.09 | |||||
2nd Quarter | 11.85 | 10.78 | |||||
1st Quarter | 12.73 | 11.25 | |||||
Market Price for | 2014 | ||||||
Common Stock | High | Low | |||||
4th Quarter | $ | 13.49 | $ | 10.73 | |||
3rd Quarter | 11.59 | 10.33 | |||||
2nd Quarter | 11.35 | 10.14 | |||||
1st Quarter | 11.50 | 10.15 | |||||
Dividend Policy
We paid our first common stock cash dividend in 2010 and began paying quarterly cash dividends in the first quarter of 2012. The table below summarizes our common stock dividends for 2015 and 2014. Per share dividends have been adjusted in all years to reflect the 11 for 10 share stock dividend from December 4, 2015.
Common Stock Dividends | ||||||||
Payment Date | Per Share Dividend | Total Dividend | ||||||
November 30, 2015 | $ | 0.09 | $ | 967,907 | ||||
August 31, 2015 | $ | 0.08 | $ | 970,463 | ||||
June 12, 2015 | $ | 0.08 | $ | 969,267 | ||||
February 28, 2015 | $ | 0.07 | $ | 858,261 | ||||
Total 2015 | $ | 0.32 | $ | 3,765,898 | ||||
November 28, 2014 | $ | 0.07 | $ | 851,749 | ||||
August 29, 2014 | $ | 0.07 | $ | 850,803 | ||||
June 13, 2014 | $ | 0.07 | $ | 849,563 | ||||
February 28, 2014 | $ | 0.06 | $ | 742,447 | ||||
Total 2014 | $ | 0.27 | $ | 3,294,562 | ||||
On January 27, 2016, the Company's Board of Directors declared a quarterly cash dividend in the amount of $0.09 per share, payable on February 26, 2016 to shareholders of record on February 12, 2016.
On December 4, 2015, Monarch paid an 11 for 10 or 10% common stock dividend to shareholders of record on November 12, 2015. Cash was paid in lieu of fractional shares. This split resulted in an additional 1,045,433 shares being issued to shareholders.
We are subject to certain restrictions imposed by the reserve and capital requirements of Federal and Virginia banking statutes and regulations. See Item 1. Business – Supervision and Regulation – Dividends. The final determination of the timing,
22
amount and payment of dividends is at the discretion of our board of directors and is dependent upon our and our subsidiaries’ earnings, principally Monarch Bank, our financial condition and other factors, including general economic conditions and applicable governmental regulations and policies. Thus, there can be no assurance of when, and if, we will continue to pay cash dividends on our Common shares.
Under the terms of the merger agreement with Towne, the Company may not, without prior written consent of TowneBank, make, declare, pay, or set aside any dividends to its shareholders in excess of $0.09 per share per calendar quarter.
Comparative Stock Performance
The following graph compares the Company's cumulative total return to its shareholders with the returns of two indexes for the five-year period ended December 31, 2015. The cumulative total return was calculated taking into consideration changes in stock price, cash dividends, stock dividends and stock splits since December 31, 2010. The indexes are the NASDAQ Composite Index, the SNL Bank $1 Billion - $5 Billion Index, which includes bank holding companies with assets of $1 billion to $5 billion and is published by SNL Financial, LC.
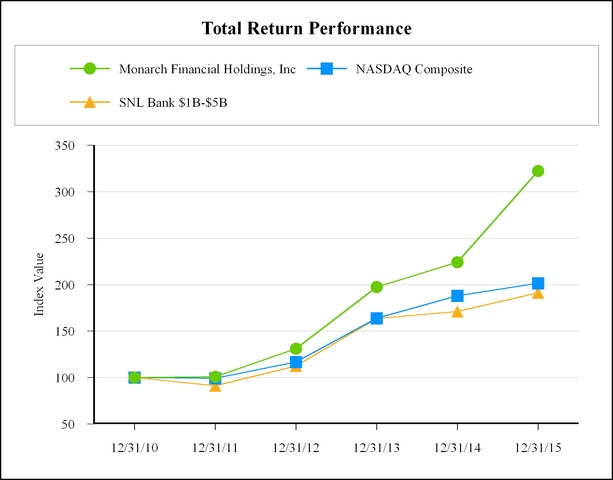
Period Ending | ||||||||||||||||||
Index | 12/31/2010 | 12/31/2011 | 12/31/2012 | 12/31/2013 | 12/31/2014 | 12/31/2015 | ||||||||||||
Monarch Financial Holdings, Inc. | 100.00 | 100.85 | 131.13 | 197.46 | 224.2 | 322.5 | ||||||||||||
NASDAQ Composite | 100.00 | 99.21 | 116.82 | 163.75 | 188.03 | 201.4 | ||||||||||||
SNL Bank $1B-$5B | 100.00 | 91.20 | 112.45 | 163.52 | 170.98 | 191.39 | ||||||||||||
On September 24, 2015 we announced the Board of Directors had approved the repurchase of up to five percent, or approximately 653,400 split adjusted shares, of the Company's outstanding common stock. The repurchase program, which will expire September 22, 2016, may be conducted through open market purchases or privately negotiated transactions. The timing and actual number of shares repurchased will depend on market conditions and other factors. Actual repurchase activity was
23
conducted between October 1, 2015 and November 23, 2015 at a total cost of $797,919. Split adjusted shares repurchased totaled 65,590 leaving 587,810 shares available for future repurchase.
Period 2015 | Total Number of Common Shares Repurchased | Total Remaining Common Shares Available for Repurchase | ||||
October 1 through October 31 | 23,290 | 630,110 | ||||
November 1 through November 23 | 42,300 | 587,810 | ||||
Information on equity compensation plans as part of our executive compensation is included in Item 11. of this Form 10-K.
24
Item 6. | Selected Financial Data. |
The following consolidated summary sets forth our selected financial data for the periods and at the dates indicated. The selected financial data have been derived from our audited financial statements for each of the five years that ended December 31, 2015, 2014, 2013, 2012 and 2011.
At or For the Years Ended December 31, | |||||||||||||||||||
2015 | 2014 | 2013 | 2012 | 2011 | |||||||||||||||
(in thousands, except ratios, shares and per share amounts) | |||||||||||||||||||
Balance Sheet Data: | |||||||||||||||||||
Assets | $ | 1,161,454 | $ | 1,066,737 | $ | 1,016,701 | $ | 1,215,578 | $ | 908,787 | |||||||||
Loans held for sale (HFS) | 169,345 | 147,690 | 99,718 | 419,075 | 211,555 | ||||||||||||||
Loans held for investment (HFI), net of unearned income | 829,269 | 772,590 | 712,671 | 661,094 | 607,612 | ||||||||||||||
Deposits | 999,094 | 919,414 | 893,118 | 901,782 | 740,092 | ||||||||||||||
Total common stockholders’ equity | 117,633 | 107,451 | 97,518 | 75,314 | 56,230 | ||||||||||||||
Total stockholders’ equity | 117,633 | 107,451 | 97,518 | 87,342 | 76,230 | ||||||||||||||
Average shares outstanding, basic (1) | 11,840,837 | 11,681,387 | 11,183,871 | 8,140,487 | 7,862,019 | ||||||||||||||
Average shares outstanding, diluted (1) | 11,853,128 | 11,724,460 | 11,329,418 | 11,299,061 | 11,181,615 | ||||||||||||||
Results of Operations: | |||||||||||||||||||
Interest Income | $ | 47,395 | $ | 42,991 | $ | 44,348 | $ | 46,468 | $ | 40,420 | |||||||||
Interest Expense | 3,147 | 3,661 | 4,786 | 5,916 | 6,797 | ||||||||||||||
Net Interest Income | 44,248 | 39,330 | 39,562 | 40,552 | 33,623 | ||||||||||||||
Provision for loan losses | — | — | — | 4,831 | 6,320 | ||||||||||||||
Net interest income after provision for loan losses | 44,248 | 39,330 | 39,562 | 35,721 | 27,303 | ||||||||||||||
Non-interest income | 85,114 | 67,079 | 69,882 | 89,761 | 54,746 | ||||||||||||||
Non-interest expenses | 108,372 | 88,480 | 90,911 | 104,256 | 71,044 | ||||||||||||||
Income before income taxes | 20,990 | 17,929 | 18,533 | 21,226 | 11,005 | ||||||||||||||
Income tax expense | 7,583 | 6,490 | 6,386 | 7,427 | 3,419 | ||||||||||||||
Net income | 13,407 | 11,439 | 12,147 | 13,799 | 7,586 | ||||||||||||||
Net income attributable to non-controlling interests | (192 | ) | (227 | ) | (1,056 | ) | (975 | ) | (460 | ) | |||||||||
Net income attributable to Monarch Financial Holdings, Inc. | 13,215 | 11,212 | 11,091 | 12,825 | 7,126 | ||||||||||||||
Dividends on preferred stock | — | — | — | 1,402 | 1,560 | ||||||||||||||
Net income available to common stockholders | 13,215 | 11,212 | 11,091 | 11,422 | 5,566 | ||||||||||||||
Per Common Share Data: | |||||||||||||||||||
Net income, basic (1) | $ | 1.12 | $ | 0.96 | $ | 0.99 | $ | 1.40 | $ | 0.73 | |||||||||
Net income, diluted (1) | 1.11 | 0.96 | 0.98 | 1.14 | 0.71 | ||||||||||||||
Book value at period end (1) | 9.89 | 9.17 | 8.44 | 8.00 | 7.10 | ||||||||||||||
Tangible book value at period end (1) | 9.82 | 9.10 | 8.36 | 7.89 | 6.97 | ||||||||||||||
Asset Quality Ratios: | |||||||||||||||||||
Non-performing assets to total assets (5) | 0.19 | % | 0.28 | % | 0.25 | % | 0.29 | % | 0.84 | % | |||||||||
Non-performing loans to period end loans (HFI) (5) | 0.27 | % | 0.37 | % | 0.31 | % | 0.54 | % | 0.71 | % | |||||||||
Net Charge-offs to average loans | 0.01 | % | 0.02 | % | 0.27 | % | 0.62 | % | 0.93 | % | |||||||||
Allowance for loan losses to period-end loans (HFI) | 1.07 | % | 1.16 | % | 1.27 | % | 1.65 | % | 1.63 | % | |||||||||
Allowance for loan losses to nonperforming loans (5) | 397.10 | % | 310.77 | % | 409.63 | % | 307.15 | % | 231.36 | % | |||||||||
Selected Ratios : | |||||||||||||||||||
Return on average assets | 1.20 | % | 1.13 | % | 1.07 | % | 1.26 | % | 0.89 | % | |||||||||
Return on average equity | 11.71 | % | 10.95 | % | 11.97 | % | 15.84 | % | 9.66 | % | |||||||||
Efficiency ratio (2) | 83.73 | % | 83.05 | % | 82.78 | % | 79.80 | % | 80.20 | % | |||||||||
Non-interest income to operating revenue (3) | 65.80 | % | 63.04 | % | 63.85 | % | 68.88 | % | 61.95 | % | |||||||||
Net interest margin (tax adjusted) (4) | 4.28 | % | 4.25 | % | 4.13 | % | 4.29 | % | 4.51 | % | |||||||||
Equity to assets | 10.14 | % | 10.08 | % | 9.59 | % | 7.19 | % | 8.39 | % | |||||||||
Tier 1 risk-based capital ratio | 12.80 | % | 12.81 | % | 12.82 | % | 10.85 | % | 11.17 | % | |||||||||
Total risk-based capital ratio | 13.69 | % | 13.79 | % | 13.91 | % | 12.05 | % | 12.42 | % | |||||||||
Dividend payout ratio | 28.50 | % | 29.39 | % | 22.00 | % | 20.09 | % | 35.27 | % | |||||||||
(1) | Amounts have been adjusted to reflect all Common Stock splits and dividends as of December 31, 2015. In 2012 and 2011 diluted shares assumes the conversion of our non-cumulative perpetual preferred shares to common stock. |
(2) | The efficiency ratio is a key performance indicator of the Company’s industry. We monitor this ratio in tandem with other key indicators for signals of potential trends that should be considered when making decisions regarding strategies related to such areas as asset liability management, business line development, and growth and expansion planning. The ratio is computed by dividing non-interest expense by the sum of net interest income on a tax equivalent basis and non-interest income, net of any securities gains or losses. It is a measure of the relationship between operating expenses to earnings. See “Critical Accounting Policies” on page 65 for additional information. |
(3) | Operating revenue is defined as net interest income plus non-interest income. |
(4) | Net interest margin is calculated as net interest income divided by total average earning assets and reported on a tax equivalent basis at a rate of 35% in 2015, 2014, 2013 and 2012 and 34% in 2011. |
(5) | For the purpose of these ratios, we have excluded performing restructured loans from the calculation. For more information please refer to Table 14- Nonperforming Assets included in Item 7 of this Form 10-K. |
Item 7. | Management’s Discussion and Analysis of Financial Condition and Results of Operations |
Risks and Cautionary Statement Concerning Forward Looking Statement.
The Private Securities Litigation Reform Act of 1995 (the “1995 Act”) provides a safe harbor for forward-looking statements made by or on our behalf. These forward-looking statements involve risks and uncertainties and are based on the beliefs and assumptions of our management and on information available at the time these statements and disclosures were prepared.
This report includes forward-looking statements within the meaning of the 1995 Act. These statements are included throughout this report and relate to, among other things, projections of revenues, earnings, earnings per share, cash flows, capital expenditures, or other financial items, expectations regarding acquisitions, discussions of estimated future revenue enhancements, potential dispositions, and changes in interest rates. These statements also relate to our business strategy, goals and expectations concerning our market position, future operations, margins, profitability, liquidity, and capital resources. Additional statements regarding the proposed merger with TowneBank relate to, among other things, the timing of the proposed merger and whether the proposed merger will occur, the benefits, results and effects of the proposed merger and the combined company's plans, objectives, expectations, costs, and the effect on earnings per share. The words “believe”, “anticipate”, “could”, “estimate”, “expect”, “intend”, “may”, “plan”, “predict”, “project”, “will”, and similar terms and phrases identify forward-looking statements in this report and in the documents incorporated by reference in this report.
Although we believe the assumptions upon which these forward-looking statements are based are reasonable, any of these assumptions could prove to be inaccurate and the forward-looking statements based on these assumptions could be incorrect. Our operations involve risks and uncertainties, many of which are outside of our control, and any one of which, or a combination of which, could materially affect our results of operations and whether the forward-looking statements ultimately prove to be correct.
Actual results and trends in the future may differ materially from those suggested or implied by the forward-looking statements depending on a number of factors. Factors that may cause actual results to differ materially from those expected include the following:
• | costs and difficulties related to the proposed merger, including, among other things, the integration of our business with TowneBank, the inability to retain key personnel, competitive response to the proposed merger, or potential adverse reactions of changes to business or employee relationships could be more significant than we anticipate, resulting in higher costs or reduced benefits; |
• | failure of the merger to be completed on the proposed terms and schedule, or at all; |
• | business uncertainties and contractual restrictions during the pendency of the merger and management distraction; |
• | changes in interest rates; |
• | changes in economic conditions in our market area; |
• | decline in the volume of mortgage loan originations due to the cyclical nature of mortgage banking; |
• | greater loan losses than anticipated; |
25
• | the effect on us and our industry of changes in market conditions, volatility and disruption in capital and credit markets and the soundness of other financial institutions; |
• | the effect of legislative regulatory initiatives; |
• | our ability to compete effectively in the highly competitive financial services industry; |
• | the effect of our concentration in loans secured by real estate; |
• | the adequacy of our allowance for loan losses; |
• | our ability to obtain additional capital in the future on terms that are favorable; |
• | our expansion and technology initiatives; |
• | our reliance on third parties for key services; |
• | other factors described under “Risk Factors” above. |
Because of these uncertainties, our actual future results may be materially different from the results indicated by these forward-looking statements. In addition, our past results of operations do not necessarily indicate our future results. Therefore, we caution you not to place undue reliance on our forward-looking information and statements. We will not update the forward-looking statements to reflect actual results or changes in the factors affecting the forward-looking statements.
OVERVIEW
The purpose of this discussion is to provide information about the major components of our results of operations and financial condition, liquidity and capital resources. The discussion and analysis should be read in conjunction with the audited consolidated financial statements and related notes to assist in the evaluation of our 2015 performance.
A significant amount of our income is generated from the net interest income earned by Monarch Bank. Net interest income is the difference between interest income and interest expense. Interest income depends on the amount of interest-earning assets outstanding during the period and the interest rates earned thereon. Monarch Bank’s cost of money is a function of the average amount of deposits and borrowed money outstanding during the period and the interest rates paid thereon. The quality of the assets further influences the amount of interest income lost on non-accrual loans and the amount of additions to the allowance for loan losses.
We also generate income from non-interest sources. Non-interest income sources include bank related service charges, fee income from residential mortgage sales, fee income from title insurance, fee income from the sale of investment and insurance services, income from bank owned life insurance (“BOLI”) and company owned life ("COLI") policies, as well as gains or losses from the sale or call of investment securities.
During the fourth quarter of 2015, the Company and Bank entered into a definitive agreement with TowneBank (“Towne”), pursuant to which Towne will acquire all of the common stock of Monarch in a stock transaction valued at approximately $221 million, based on Towne’s closing price December 16, 2015. Under the terms of the agreement, which has been approved by the Board of Directors of both companies, the share price and total deal value will be determined utilizing the conversion ratio of 0.8830 shares of Towne common stock for each share of Monarch common stock at the closing date. The transaction, which is subject to regulatory approval, the approval of the shareholders of Monarch and Towne, and other customary conditions, is expected to close in the second quarter of 2016.
We are pleased to join forces with Towne to provide enhanced and long-term value to our clients and community. We believe our combination with Towne, with expected total assets of $7.3 billion, will provide greater capital resources and operational scale that will allow us to grow and capture additional market share.
ANALYSIS OF OPERATING RESULTS
NET INCOME
Our consolidated financial statements include the accounts of the Company, the Bank and its subsidiaries, after all significant inter-company transactions have been eliminated. Net income attributable to our non-controlling interests of $191,787, $227,005 and $1,056,385, respectively, are deducted for the years ended December 31, 2015, 2014 and 2013, after the income tax provision, to arrive at net income attributable to Monarch Financial Holdings, Inc. The ensuing references and ratios are related to net income attributable to Monarch Financial Holdings, Inc., (hereon referred to as “net income”) after net income attributable to non-controlling interest has been deducted.
26
2015 | 2014 | 2013 | |||||||||
Income before taxes | $ | 20,990,428 | $ | 17,929,128 | $ | 18,533,432 | |||||
Income tax provision | (7,583,820 | ) | (6,490,273 | ) | (6,386,040 | ) | |||||
Net income | 13,406,608 | 11,438,855 | 12,147,392 | ||||||||
Less: Net income attributable to non-controlling interest | (191,787 | ) | (227,005 | ) | (1,056,385 | ) | |||||
Net income attributable to Monarch Financial Holdings, Inc. | $ | 13,214,821 | $ | 11,211,850 | $ | 11,091,007 | |||||
Net income per common share - basic | $ | 1.12 | $ | 0.96 | $ | 0.99 | |||||
Net income per common share - diluted | $ | 1.11 | $ | 0.96 | $ | 0.98 | |||||
Return on average assets | 1.20 | % | 1.13 | % | 1.07 | % | |||||
Return on average stockholders' equity | 11.71 | % | 10.95 | % | 11.97 | % | |||||
We reported net income for December 31, 2015 of $13,214,821, compared to $11,211,850 for December 31, 2014 and $11,091,007 for December 31, 2013. Our basic earnings per share were $1.12, $0.96 and $0.99 and diluted earnings per share were $1.11, $0.96 and $0.98 for the years ended December 31, 2015, 2014 and 2013, respectively.
Two important and commonly used measures of profitability are return on assets (net income as a percentage of average total assets) and return on stockholders’ equity (net income as a percentage of average stockholders’ equity). Our returns on average assets were 1.20%, 1.13% and 1.07% for the years ended December 31, 2015, 2014 and 2013, respectively. The returns on average stockholders’ equity were 11.71%, 10.95% and 11.97% for the same time periods.
Net income for the year ended December 31, 2015 was $13,214,821, an increase of $2,002,971, or 17.9% when compared to 2014. For the year ended December 31, 2014, net income was $11,211,850, an increase of $120,843 or 1.1% compared to 2013. The primary source of the fluctuation in net income between years is changes in volume related to our mortgage banking operations.
Net interest income increased $4.9 million, or 12.5% to $44.2 million, in 2015 after declining $232 thousand, or 0.6% to $39.3 million, in 2014. The primary source of growth in net interest income in 2015 was interest on our loans held for investment ("LHFI") and mortgage loans held for sale ("LHFS") portfolios. The primary source of the decline in net interest income in 2014 was a reduction in interest income on our LHFS portfolio. Interest expense decreased in all years presented.
Interest income on LHFI increased $3.1 million, or 8.2% to $40.4 million, while interest income on our LHFS increased $1.1 million, or 22.5% to $6.0 million, in 2015 compared to 2014. In contrast, interest income on LHFI increased $683 thousand, or 1.9% in 2014 and interest income on LHFS declined $2.2 million, or 30.7% when compared to 2013.
Changes in interest income levels are primarily volume driven as average loan rates on both our LHFI and LHFS portfolios have declined in all years presented. Average volume in our LHFI portfolio increased $73.4 million in 2015 compared to 2014 and $23.7 million in 2014 compared to 2013. Average volume on our LHFS portfolio increased $37.0 million in 2015 compared to 2014 after declining $74.1 million in 2014 compared to 2013. Average volume growth in our LHFI has been distributed relatively evenly between our commercial and real estate loan types.
Reductions in interest expense of $514 thousand, or 14.0% in 2015 compared to 2014 and $1.1 million, or 23.5% in 2014 compared to 2013, contributed to the improvement in net interest income. Average interest bearing deposits increased $36.7 million, or 5.7% in 2015 compared to 2014, but interest expense declined due to lower overall interest rates. Average interest bearing deposits declined $29.0 million in 2014 compared to 2013 and overall rates were lower. Average borrowing increased $14.9 million, to $26.8 million in 2015 compared to 2014, but interest rates were notably lower. Average borrowings declined $25.8 million in 2014 compared to 2013.
Non-interest income increased $18.0 million, to $85.1 million in 2015 compared to 2014 after declining $2.8 million, to $67.1 million in 2014 compared to 2013. Our primary source of non-interest income is mortgage banking income, which increased $17.1 million, to $79.6 million in 2015 after declining $3.2 million, to $62.4 million in 2014. Production by our mortgage division, operating under the name of Monarch Mortgage has fluctuated between years. Other non-interest income increased $896 thousand in 2015 and $429 thousand in 2014 compared to prior year.
Non-interest expense increased $19.9 million in 2015 to $108.4 million after declining $2.4 million, to $88.5 million in 2014 compared to 2013. Growth in salaries and benefits, commissions, loan origination expense and professional fees were the source of the increase in 2015 non-interest expense. In 2014, reductions in commissions and loan origination expenses were the the source of the decrease. These fluctuations were related primarily to our mortgage loan operations.
27
Our provision for loan losses was $0 in all years presented. Net charge offs were $62 thousand in 2015, $113 thousand in 2014 and $1.8 million in 2013. Our allowance for loan losses decreased $62 thousand in 2015 after declining $113 thousand in 2014 and $1.8 million in 2013. Through use of the provision, management seeks to provide for future losses inherent in the existing portfolio. This is achieved by utilizing various metrics including but not limited to loss history, economic conditions and industry trends. Provision and allowance management requires a great deal of judgment and is a primary focus of our team.
In 2015, income before tax and non-controlling interest increased $3,061,300, or 17.1% to $20,990,428. In 2014, income before tax and non-controlling interest decreased $604,304, or 3.3% to $17,929,128. In 2013, income before tax and non-controlling interest declined $2,692,859, or 12.69% to $18,533,432 compared to 2012.
NET INTEREST INCOME
Net interest income, which is the excess of interest income over interest expense, is a significant source of revenue. Net interest income is influenced by a number of factors, including the volume of interest-earning assets and interest-bearing liabilities, the mix of interest-earning assets and interest-bearing liabilities, the interest rates earned on earning assets and the interest rates paid to obtain funding to support the assets.
Net interest income was $44,248,047 for the year ended December 31, 2015, $39,329,743 for the year ended December 31, 2014 and $39,561,979 for the year ended December 31, 2013. This represents an increase of $4,918,304, or 12.5% in 2015 compared to 2014 and a decrease of $232,236, or 0.6% in 2014 compared to 2013.
The Federal Reserve Open Market Committee ("FOMC") sets the federal funds target rate, which is the backbone of short term borrowing rates in the United States ("US"). In addition to setting the target funds rate, the FOMC utilizes other tools to shape monetary policy and the supply of money. Late in 2007 the FOMC began to decrease the federal funds target in an effort to stabilize the economy and head-off a recession. Between September 2007 and December 2008 the FOMC decreased the target funds rate a total of 500 basis points which resulted in a federal funds rate of 0.25%, which was a historical low. During this same period, Wall Street Journal Prime (“WSJP”), which moves in tandem with the federal funds target rate, was at 3.25%. For the majority of the economic downturn the FOMC kept the money supply flowing and long term interest rates artificially low through the systematic purchase of longer term treasury bonds and mortgage-backed securities, in an effort to encourage banks to lend and businesses to borrow. In mid-2013 the FOMC added language to their meeting minutes and press releases indicating they would begin to curtail their long term mortgage-backed and treasury purchases. With this announcement, the market reaction was to sell off long term treasuries, which increased long term mortgage rates and had an immediate impact on the mortgage industry. A refinance boom, which had been driven by lower long term rates, ceased and the number of new home buyers dropped dramatically due to a form of "sticker shock" in response to the new, but not significantly higher, rates. In 2014, the FOMC began unwinding their long term mortgage-backed and treasury purchases with little or no additional impact to the economy.
In late 2014, economic indicators were showing signs of stability and health which led the FOMC to hint at an impending increase in the federal funds target rate. During 2015 economists and investors speculated about the timing of the increase in the federal funds rate prior to each successive FOMC meeting but an increase was not forthcoming. The impact of speculation hampered economic improvement. Inflation and jobless rates did not continue to perform as expected. Additionally, the concept of a world economy has become a reality as economic events in other countries had a detrimental impact on the US economy. Specific events such as loan defaults in Greece, which is a member of the European Union ("EU"), the devaluation of the Chinese yuan currency, and sharp declines in the price of oil in the Middle East, impacted the US economy by muting the actions of the FOMC, disrupting the balance of trade and creating angst among investors. The supply of money did not tighten with the unwinding of long term purchases as anticipated because a flight to safety led to the increase in foreign investment in US Treasuries. This created downward pressure on the long end of the Treasury Yield Curve, keeping it relatively flat .
Finally, the long awaited announcement by the FOMC of an increase in the federal funds target rate was made in December 2015. This was the first increase in rates since June 2006. However, the late timing of this 0.25% increase had little impact to our income statement.
We have focused on building non-maturity core deposits to support our LHFI. We define core deposits as non-brokered, in-market deposits. Our greatest area of core deposit growth has been in non-interest bearing demand deposits. Period end, non-interest bearing demand deposits grew $44.8 million, or 19.0% in 2015. On average, non-interest bearing demand deposits grew $44.0 million, or 19.3% in 2015. Period end, core interest bearing demand deposits declined $2.3 million, or 3.4% but average outstanding interest bearing demand deposits have increased $5.3 million, or 10.6% in 2015 compared to 2014. Ending core money market accounts increased $4.5 million, or 1.4% in 2015 and $9.2 million, or 2.8% on average in 2014. Core savings have declined $486 thousand ending and $3.4 million on average. Core time deposits have declined by design as non-maturity deposits have grown.
28
We utilize non-maturity non-core money market accounts, short term non-core brokered time deposits and borrowings at the Federal Home Loan Bank ("FHLB") to meet the volume demands of our LHFS portfolio. This utilization of non-core funding, while flexible, has resulted in fluctuations in our non-core funding sources.
Total interest income was $47,395,183 in 2015 compared to $42,990,907 in 2014 and $44,348,437 in 2013. Earning asset yield declined 6 basis points in 2015 to 4.59% compared to 4.65% in 2014. Earning asset yield increased 3 basis points in 2014 compared to 4.62% in 2013.
The combined yield of our loan portfolios decreased 16 basis points in 2015 to 4.99% after increasing 13 basis points in 2014 to 5.15% when compared to 2013. The yield on our LHFS portfolio decreased 32 basis points to 3.93% after increasing 53 basis points to 4.25% in 2014. Loan yield on our LHFI portfolio is the result of both the interest rate and any fees collected on the loans. Interest and fees on LHFI are the largest component of our interest income. Interest and fees on LHFI only, which excludes LHFS, decreased 10 basis points in 2015 to 5.20% and 9 basis points in 2014 to 5.30% when compared to 2013.
Mortgage loan activity was steady throughout 2015 with the majority of activity in purchase money. Rates were lower overall in 2015, with the lowest rates early in the year due to the impact of foreign investment in the 10 year Treasury note discussed previously. Refinancing activities were the highest early in the year. Mortgage loan activity was weak at the start of 2014 but gained momentum, mid-year. Early 2014 production was down following the production decline that began in 2013 when the historically low mortgage rates of 2012 all but dried up. 72% of our 2015 mortgage loan volume was purchase money, compared to 80% in 2014, and 63% in 2013. Our LHFS portfolio was $169.3 million at year end 2015, an increase of $21.6 million compared to $147.7 million at year end 2014. Average volume in our LHFS portfolio for 2015 was $151.7 million, compared to $114.6 million in 2014, and $188.7 million in 2013. Monarch originates and sells the residential mortgages in our LHFS portfolio. These loans typically stay on our books between the point the loans close and are delivered to an investor, an average of 28-35 days. During that time the loans earn interest. Interest income on LHFS was $6.0 million in 2015, $4.9 million in 2014, and $7.0 million in 2013.
Our LHFI strategy has been to support our existing client base, promote disciplined growth with regard to new clients with a focus on well seasoned borrowers, and promoting short term fixed and floating rate loan pricing where possible. As with prior years, in 2015, the lion's share of net growth in LHFI occurred in the fourth quarter. LHFI totaled $829.3 million at December 31, 2015 compared to $772.6 million at year end 2014, an increase of $56.7 million, or 7.3%. Our average outstanding LHFI increased $73.5 million, or 10.4% in 2015 to $777.5 million. Average volume in our LHFI portfolio in 2014 was $704.0 million, a $23.7 million, or 3.5% increase over 2013. During the first quarter of 2014, we took an interest adjustment of $417 thousand related to the payoff of a loan we had purchased at a discount, which had a positive impact on yield. Interest income from LHFI increased $3.1 million, or 8.2% in 2015 compared to 2014. Interest income from LHFI increased $683 thousand, or 1.9% in 2014 compared to 2013.
In 2015 the yield on our securities portfolio increased 20 basis points, to 1.73% compared to an increase of 18 basis points, to 1.53% in 2014, but income declined due to lower average balances. Security purchases in the form of callable and non-callable agencies totaled $21.9 million in 2015 and $15.3 million in 2014. Maturities and calls totaled $15.3 million in 2015 and $40.7 million in 2014. The increase in yield in 2015 compared to 2014 is related to a moderate increase in duration and more favorable offering rates on the agency portfolio in 2015.
Our restricted stock and deposits in other banks yield increased 32 basis points to 0.85% in 2015 after a decrease of 9 basis points to 0.53% in 2014. Included in deposits in other banks are fixed rate deposits that totaled $26.4 million at December 31, 2015 and $23.5 million at December 31, 2014. We have restricted stock with FHLB, the Federal Reserve and Community Bankers Bank which earn dividends. In 2015, we purchased $455 thousand in additional bank owned life insurance ("BOLI") and $225 thousand in company owned life insurance ("COLI"). In 2014, we purchased $2.0 million in additional BOLI. The tax effective yield on BOLI and COLI declined 53 basis points in 2015 to 4.11% and 30 basis points in 2014 to 4.64% due to the market sensitive nature of the yield on COLI. Income from BOLI and COLI is included in other non-interest income.
Total interest expense declined $514,028, or 14.0% to $3,147,136 in 2015, $1,125,294, or 23.5% to $3,661,164 in 2014 and $1,129,775, or 19.1%, in 2013. Interest expense declined 11 basis points in 2015 to 0.45%, 12 basis points in 2014 and 10 basis points in 2013. Interest bearing deposits, the largest component of interest expense, declined 8 basis points to 0.42% in 2015, 9 basis points in 2014 to 0.50% and 12 basis points in 2013 to 0.59%.
Our other borrowing cost decreased 294 basis points in 2015 to 1.04% after increasing 173 basis points in 2014 to 3.98% and 48 basis points in 2013. This fluctuation is due to changes in the level of low cost borrowing relative to total borrowing. We had a borrowing with a $100 thousand annual principal curtailment that we paid off in September 2015 but had totaled $1.1 million at December 31, 2014 with FHLB that bore a rate of 4.96%.
29
Additional analysis with regard to interest income will reference the following tables. For discussion purposes, our “net interest income analysis” and our “changes in net interest income (rate/volume analysis)” tables are adjusted to include tax equivalent income on BOLI and tax exempt municipal securities that is not calculated in accordance with Generally Accepted Accounting Principles (GAAP). The following table is a reconciliation of our income statement presentation to these tables.
RECONCILIATION OF NET INTEREST INCOME TO TAX EQUIVALENT NET INTEREST INCOME
For the Year Ended December 31, | |||||||||||
2015 | 2014 | 2013 | |||||||||
Non-GAAP | |||||||||||
Interest income | |||||||||||
Total interest income | $ | 47,395,183 | $ | 42,990,907 | $ | 44,348,437 | |||||
Bank owned life insurance | 273,943 | 247,366 | 236,377 | ||||||||
Tax equivalent adjustment (1) | |||||||||||
Bank owned life insurance | 147,507 | 133,197 | 127,280 | ||||||||
Municipal securities | 20,946 | 20,984 | 21,020 | ||||||||
Adjusted income on earning assets | 47,837,579 | 43,392,454 | 44,733,114 | ||||||||
Interest expense | |||||||||||
Total interest expense | 3,147,136 | 3,661,164 | 4,786,458 | ||||||||
Net interest income-adjusted | $ | 44,690,443 | $ | 39,731,290 | $ | 39,946,656 | |||||
(1) A tax rate of 35% was used in adjusting interest on BOLI, tax-exempt securities and loans to a fully taxable equivalent basis. The difference between rates earned on interest-earning assets (with an adjustment made to tax-exempt income to provide comparability with taxable income, i.e. the “FTE” adjustment) and the cost of the supporting funds is measured by the net interest margin.
Table 1 depicts interest income on average earning assets and related yields, as well as, interest expense on average interest-bearing liabilities and related rates paid for the periods indicated.
Our net yield on earning assets or net interest margin, which is calculated by dividing net interest income by average earning assets, was 4.28% in 2015, 4.25% in 2014, and 4.13% in 2013. Our earning asset yield declined 6 basis points to 4.59% in 2015, after increasing 3 basis points to 4.65% in 2014, and declining 29 basis points to 4.62% in 2013. During the same periods liability costs declined 11 basis points to 0.45% in 2015, 12 basis points to 0.56% in 2014, and 10 basis points to 0.68% in 2013. Our interest rate spread, which is the difference between the average yield on earning assets and the average cost on interest bearing liabilities, was 4.14% in 2015, 4.09% in 2014, and 3.94% in 2013. The result of these changes is a 3 basis point improvement in margin for 2015, 12 basis point improvement in margin for 2014, and a 16 basis point reduction in margin for 2013.
30
Table 1 - NET INTEREST INCOME ANALYSIS
(in thousands)
The following is an analysis of net interest income, on a taxable equivalent basis.
2015 | 2014 | 2013 | ||||||||||||||||||||||||||||||
Average Balance | Income/ Expense | Yield/ Rate | Average Balance | Income/ Expense | Yield/ Rate | Average Balance | Income/ Expense | Yield/ Rate | ||||||||||||||||||||||||
Assets | ||||||||||||||||||||||||||||||||
Loans held for investment: | ||||||||||||||||||||||||||||||||
Commercial | $ | 159,395 | $ | 7,948 | 4.99 | % | $ | 124,352 | $ | 6,755 | 5.43 | % | $ | 113,971 | $ | 5,913 | 5.19 | % | ||||||||||||||
Real estate | 610,962 | 32,076 | 5.25 | % | 575,417 | 30,317 | 5.27 | % | 563,464 | 30,471 | 5.41 | % | ||||||||||||||||||||
Consumer | 7,116 | 370 | 5.20 | % | 4,226 | 256 | 6.06 | % | 2,848 | 261 | 9.16 | % | ||||||||||||||||||||
Mortgage loans held for sale | 151,657 | 5,963 | 3.93 | % | 114,621 | 4,867 | 4.25 | % | 188,696 | 7,021 | 3.72 | % | ||||||||||||||||||||
Total loans | 929,130 | 46,357 | 4.99 | % | 818,616 | 42,195 | 5.15 | % | 868,979 | 43,666 | 5.02 | % | ||||||||||||||||||||
Securities: | ||||||||||||||||||||||||||||||||
Federal agencies | 16,056 | 232 | 1.44 | % | 21,441 | 270 | 1.26 | % | 14,860 | 126 | 0.85 | % | ||||||||||||||||||||
Mortgage-backed | 1,149 | 20 | 1.74 | % | 1,428 | 27 | 1.89 | % | 1,729 | 33 | 1.91 | % | ||||||||||||||||||||
Municipals | 2,776 | 94 | 3.39 | % | 1,944 | 83 | 4.27 | % | 1,769 | 83 | 4.69 | % | ||||||||||||||||||||
Other securities | — | — | — | % | — | — | — | % | 226 | 9 | 3.98 | % | ||||||||||||||||||||
Total securities | 19,981 | 346 | 1.73 | % | 24,813 | 380 | 1.53 | % | 18,584 | 251 | 1.35 | % | ||||||||||||||||||||
Restricted stock and deposits in other banks | 83,792 | 713 | 0.85 | % | 82,317 | 436 | 0.53 | % | 73,201 | 453 | 0.62 | % | ||||||||||||||||||||
Bank owned life insurance | 10,268 | 422 | 4.11 | % | 8,208 | 381 | 4.64 | % | 7,347 | 363 | 4.94 | % | ||||||||||||||||||||
Total interest-earning assets | 1,043,171 | $ | 47,838 | 4.59 | % | 933,954 | $ | 43,392 | 4.65 | % | 968,111 | $ | 44,733 | 4.62 | % | |||||||||||||||||
Less: Allowance for loan losses | (8,813 | ) | (9,084 | ) | (10,956 | ) | ||||||||||||||||||||||||||
Other non-earning assets | 71,176 | 71,470 | 78,455 | |||||||||||||||||||||||||||||
Total assets | $ | 1,105,534 | $ | 996,340 | $ | 1,035,610 | ||||||||||||||||||||||||||
Liabilities and Stockholders’ Equity | ||||||||||||||||||||||||||||||||
Deposits: | ||||||||||||||||||||||||||||||||
Demand | $ | 55,332 | 69 | 0.12 | % | $ | 50,027 | 78 | 0.16 | % | $ | 49,284 | 92 | 0.19 | % | |||||||||||||||||
Money market | 375,960 | 1,308 | 0.35 | % | 370,998 | 1,330 | 0.36 | % | 347,734 | 1,470 | 0.42 | % | ||||||||||||||||||||
Savings | 19,548 | 55 | 0.28 | % | 22,992 | 87 | 0.38 | % | 22,346 | 91 | 0.41 | % | ||||||||||||||||||||
Time | 225,264 | 1,436 | 0.64 | % | 195,391 | 1,691 | 0.87 | % | 249,071 | 2,283 | 0.92 | % | ||||||||||||||||||||
Total deposits | 676,104 | 2,868 | 0.42 | % | 639,408 | 3,186 | 0.50 | % | 668,435 | 3,936 | 0.59 | % | ||||||||||||||||||||
Other borrowings | 26,808 | 279 | 1.04 | % | 11,937 | 475 | 3.98 | % | 37,756 | 851 | 2.25 | % | ||||||||||||||||||||
Total interest-bearing liabilities | 702,912 | $ | 3,147 | 0.45 | % | 651,345 | $ | 3,661 | 0.56 | % | 706,191 | $ | 4,787 | 0.68 | % | |||||||||||||||||
Demand deposits | 271,586 | 227,600 | 210,325 | |||||||||||||||||||||||||||||
Other liabilities | 18,174 | 15,005 | 26,458 | |||||||||||||||||||||||||||||
Stockholders’ equity | 112,862 | 102,390 | 92,636 | |||||||||||||||||||||||||||||
Total liabilities and Stockholders’ equity | $ | 1,105,534 | $ | 996,340 | $ | 1,035,610 | ||||||||||||||||||||||||||
Interest rate spread | 4.14 | % | 4.09 | % | 3.94 | % | ||||||||||||||||||||||||||
Net yield on earning assets | 4.28 | % | 4.25 | % | 4.13 | % | ||||||||||||||||||||||||||
Reconciliation to GAAP | ||||||||||||||||||||||||||||||||
Net interest income tax equivalent | $ | 44,691 | $ | 39,731 | $ | 39,946 | ||||||||||||||||||||||||||
Less: Taxable equivalent adjustment - municipals | 21 | 21 | 21 | |||||||||||||||||||||||||||||
Less: Taxable equivalent adjustment - BOLI | 148 | 133 | 127 | |||||||||||||||||||||||||||||
Less: BOLI interest income | 274 | 247 | 236 | |||||||||||||||||||||||||||||
$ | 44,248 | $ | 39,330 | $ | 39,562 | |||||||||||||||||||||||||||
Table 2 presents changes in net interest income in a rate/volume analysis format. The goal of this rate/volume analysis is to compare two earning periods to determine whether the difference between the results of those periods is due to changes in rate, or volume, or some combination of the two. This is achieved through a “what if” analysis. We calculate what the potential
31
income would have been in the new period if the prior period rate had remained unchanged, and compare that result to what the potential income would have been in the prior period if the current rates were in effect. Through the analysis of these income potentials, we are able to determine how much of the dollar change between periods is due to the impact of differing rates and how much is volume driven. For this analysis net interest income has been adjusted to include income from BOLI and the tax effect of tax exempt municipal securities.
Net interest income increased $5.0 million in 2015 compared to 2014, driven by growth in assets and lower rates on interest bearing liabilities. Growth in loan volume was the primary contributor as that growth added $5.3 million to interest income which was reduced $1.1 million due to lower rates on that new volume. Average LHFI contributed a primarily volume driven net of $3.1 million to interest income. LHFS contributed a net $1.1 million to interest income which was also driven by growth in volume. Other interest bearing assets contributed a net $284 thousand in interest income. Interest expense related to growth in interest bearing liabilities was reduced by the impact of lower rates. Total deposit cost reductions contributed a net $318 thousand to net interest income while reductions in other borrowings cost provided a net savings of $196 thousand.
Net interest income declined $215 thousand in 2014 compared to 2013. Declines in interest income of $1.3 million were only partially recaptured through lower interest expense of $1.1 million. Lower average volume in our LHFS portfolio was the largest single source of reduced interest earnings. A $3.0 million reduction in interest earnings on our LHFS volume was reduced by $1.3 million due to increases in our LHFI volume, for a net reduction to interest earnings from loan volume changes of $1.7 million. Increased yield on LHFS provided an additional $888 thousand in interest income which was reduced due to lower interest yield on our real estate and consumer loans held for investment, for a net increase in interest income from loan rates of $276 thousand. Lower average volume coupled with lower interest cost combined for an interest expense savings of $750 thousand. Lower borrowing levels provided $792 thousand in interest savings that was partially reduced by higher rates for a net savings of $376 thousand.
Table 2 - CHANGES IN NET INTEREST INCOME (RATE/VOLUME ANALYSIS)
(in thousands)
2015 vs 2014 | |||||||||||
Interest Increase (Decrease) | Change Attributable to | ||||||||||
Rate | Volume | ||||||||||
Interest income | |||||||||||
Loans held for investment: | |||||||||||
Commercial | $ | 1,193 | $ | (590 | ) | $ | 1,783 | ||||
Real estate | 1,759 | (107 | ) | 1,866 | |||||||
Consumer | 114 | (41 | ) | 155 | |||||||
Mortgage loans held for sale | 1,096 | (382 | ) | 1,478 | |||||||
Total loans | 4,162 | (1,120 | ) | 5,282 | |||||||
Securities: | |||||||||||
Federal agencies | (38 | ) | 36 | (74 | ) | ||||||
Mortgage-backed | (7 | ) | (2 | ) | (5 | ) | |||||
Municipals | 11 | (20 | ) | 31 | |||||||
Total securities | (34 | ) | 14 | (48 | ) | ||||||
Restricted stock and deposits in other banks | 277 | 269 | 8 | ||||||||
Bank owned life insurance | 41 | (47 | ) | 88 | |||||||
Total interest income | 4,446 | (884 | ) | 5,330 | |||||||
Interest expense | |||||||||||
Deposits: | |||||||||||
Demand | (9 | ) | (17 | ) | 8 | ||||||
Money market | (22 | ) | (40 | ) | 18 | ||||||
Savings | (32 | ) | (20 | ) | (12 | ) | |||||
Time | (255 | ) | (489 | ) | 234 | ||||||
Total deposits | (318 | ) | (566 | ) | 248 | ||||||
Other borrowings | (196 | ) | (513 | ) | 317 | ||||||
Total interest expense | (514 | ) | (1,079 | ) | 565 | ||||||
Net interest income | $ | 4,960 | $ | 195 | $ | 4,765 | |||||
32
2014 vs 2013 | |||||||||||
Interest Increase (Decrease) | Change Attributable to | ||||||||||
Rate | Volume | ||||||||||
Interest income | |||||||||||
Loans held for investment: | |||||||||||
Commercial | $ | 842 | $ | 287 | $ | 555 | |||||
Real estate | (154 | ) | (793 | ) | 639 | ||||||
Consumer | (5 | ) | (106 | ) | 101 | ||||||
Mortgage loans held for sale | (2,154 | ) | 888 | (3,042 | ) | ||||||
Total loans | (1,471 | ) | 276 | (1,747 | ) | ||||||
Securities: | |||||||||||
Federal agencies | 144 | 75 | 69 | ||||||||
Mortgage-backed | (6 | ) | — | (6 | ) | ||||||
Municipals | — | (8 | ) | 8 | |||||||
Other securities | (9 | ) | — | (9 | ) | ||||||
Total securities | 129 | 67 | 62 | ||||||||
Restricted stock and deposits in other banks | (17 | ) | (70 | ) | 53 | ||||||
Bank owned life insurance | 18 | (23 | ) | 41 | |||||||
Total interest income | (1,341 | ) | 250 | (1,591 | ) | ||||||
Interest expense | |||||||||||
Deposits: | |||||||||||
Demand | (14 | ) | (15 | ) | 1 | ||||||
Money market | (140 | ) | (234 | ) | 94 | ||||||
Savings | (4 | ) | (6 | ) | 2 | ||||||
Time | (592 | ) | (122 | ) | (470 | ) | |||||
Total deposits | (750 | ) | (377 | ) | (373 | ) | |||||
Other borrowings | (376 | ) | 416 | (792 | ) | ||||||
Total interest expense | (1,126 | ) | 39 | (1,165 | ) | ||||||
Net interest income | $ | (215 | ) | $ | 211 | $ | (426 | ) | |||
MARKET RISK MANAGEMENT
We spend a great deal of time focusing on management of the balance sheet to maximize net interest income. Our primary component of market risk is interest rate volatility, and our primary objectives for managing interest rate volatility are to identify opportunities to maximize net interest income while ensuring adequate liquidity and carefully managing interest rate risk. The Asset/Liability Management Committee (“ALCO”), which is composed of executive officers, is responsible for:
• | Monitoring corporate financial performance; |
• | Meeting liquidity requirements; |
• | Establishing interest rate parameters, indices, and terms for loan and deposit products; |
• | Assessing and evaluating the competitive rate environment; |
• | Monitoring and measuring interest rate risk; |
• | Reporting our performance results to our Board. |
Interest rate risk refers to the exposure of our earnings and the market value of portfolio equity (“MVE”) to changes in interest rates. The magnitude of the change in earnings and MVE resulting from interest rate changes is impacted by the time remaining to maturity on fixed-rate obligations, the contractual ability to adjust rates prior to maturity, competition, and the general level of interest rates and customer actions.
There are several common sources of interest rate risk that must be effectively managed to limit impact on our earnings and capital.
• | Repricing risk which arises largely from timing differences in the pricing of assets and liabilities. |
• | Reinvestment risk which refers to the reinvestment of cash flows from interest payments and maturing assets at lower or higher rates. |
33
• | Basis risk which exists when different yield curves or pricing indices do not change at precisely the same time or in the same magnitude such that assets and liabilities with the same maturity are not all affected equally. |
• | Yield curve risk which refers to unequal movements in interest rates across a full range of maturities. |
In determining the appropriate level of interest rate risk, ALCO reviews the changes in net interest income and MVE given various changes in interest rates. We also consider the most likely interest rate scenarios, local economic conditions, liquidity needs, business strategies, and other factors in determining the appropriate levels of interest rate risk. To effectively measure and manage interest rate risk, simulation analysis is used to determine the impact on net interest income and MVE from changes in interest rates.
Interest rate sensitivity analysis presents the amount of assets and liabilities that are estimated to reprice through specified periods if there are no changes in balance sheet mix. The interest rate sensitivity analysis in Table 3 reflects our assets and liabilities on December 31, 2015 which will either be repriced in accordance with market rates, mature or are estimated to mature early or prepay within the periods indicated. Non-maturity deposits are treated as repricing immediately. This is a one-day position that is continually changing and is not necessarily indicative of our position at any other time.
Table 3 - INTEREST RATE SENSITIVITY ANALYSIS
(in thousands)
December 31, 2015 | |||||||||||||||||||||||
3 Months or Less | > 3 Months to 1 Year | > 1 Year to 3 Years | > 3 Years to 5 Years | > 5 Years | Total | ||||||||||||||||||
Interest sensitive assets: | |||||||||||||||||||||||
Interest bearing deposits and Federal funds sold | $ | 30,186 | $ | 8,499 | $ | 14,249 | $ | 7,000 | $ | — | $ | 59,934 | |||||||||||
Securities | — | 499 | 14,543 | 12,800 | 2,371 | 30,213 | |||||||||||||||||
Loans held for sale | 169,345 | — | — | — | — | 169,345 | |||||||||||||||||
Loans held for investment | 406,439 | 68,788 | 155,181 | 159,389 | 39,472 | 829,269 | |||||||||||||||||
Restricted equity securities | 1,640 | 2,107 | — | — | 134 | 3,881 | |||||||||||||||||
Bank Owned Life Insurance | — | — | — | — | 10,635 | 10,635 | |||||||||||||||||
Total interest sensitive assets | 607,610 | 79,893 | 183,973 | 179,189 | 52,612 | 1,103,277 | |||||||||||||||||
Interest sensitive liabilities: | |||||||||||||||||||||||
NOW and savings deposits | 88,480 | — | — | — | — | 88,480 | |||||||||||||||||
Money market deposits | 364,893 | — | — | — | — | 364,893 | |||||||||||||||||
Time deposits | 139,219 | 82,115 | 43,128 | 1,174 | 5 | 265,641 | |||||||||||||||||
Other borrowings | 16,000 | — | — | — | 10,000 | 26,000 | |||||||||||||||||
Total interest sensitive liabilities | 608,592 | 82,115 | 43,128 | 1,174 | 10,005 | 745,014 | |||||||||||||||||
Interest sensitivity gap | $ | (982 | ) | $ | (2,222 | ) | $ | 140,845 | $ | 178,015 | $ | 42,607 | $ | 358,263 | |||||||||
Cumulative interest sensitivity gap | $ | (982 | ) | $ | (3,204 | ) | $ | 137,641 | $ | 315,656 | $ | 358,263 | |||||||||||
Percentage cumulative gap to total interest sensitive assets | (0.1 | )% | (0.3 | )% | 12.5 | % | 28.6 | % | 32.5 | % | |||||||||||||
As illustrated in Table 3, we are asset sensitive in the long term, despite the large balances in our non-maturity deposits. As stated previously, this is a model of a one-day position. Because of their limited term before being delivered to investors, loans held for sale are treated as though it were a single duration asset, as opposed to a constantly renewing asset. Being asset sensitive means assets will reprice more quickly than deposits. This is an optimal position to be in when poised for rising rates.
Recognizing all modeling tools have some form of limitation, ALCO also utilizes a more sophisticated interest rate risk measurement tool. Simulation analysis is used to subject the current repricing conditions to rising interest rates in increments of 1%, 2%, 3% and 4% and falling interest rates in decrements of 1% and 2% to determine how net interest income changes for the next twelve and twenty-four months, with flat growth, under two rate assumptions. The assumptions are “shocked”, a scenario that assumes the entire rate change has occurred in a single month, and “ramped”, a scenario that assumes rate changes have occurred equally throughout the next twelve month period. ALCO also applies a “shocked” and “ramped” assumption when measuring the effects of changes in interest rates over a twelve month period on MVE by discounting future cash flows of interest bearing deposits and loans using new rates at which deposits and loans would be made to similar depositors and
34
borrowers. Market value changes in the investment portfolio are estimated by discounting future cash flows and using duration analysis. Loan and investment security prepayments are estimated using current market information. Tables 4 and 5 show the estimated impact of changes in interest rates up 1%, 2%, 3% and 4% and down 1% and 2%, on net interest income and on MVE as of December 31, 2015 (in thousands).
Change in Net Interest Income
Shocked Assumption Results: The projected change in net interest income due to changes in interest rates in both the twelve and twenty-four month projection at December 31, 2015, were compliant with internal guidelines. The internal guidelines are set by management and approved by our Board. These guidelines have been established to assist the Company in monitoring potential sensitivity to interest rate risk, but a non-compliant result is not an indication of excessive risk. It is merely an indicator that closer monitoring by management may be necessary.
Ramped Assumption Results: The projected change in net interest income due to changes in interest rates in the twelve month and twenty-four month projection at December 31, 2015, were in compliance with our established internal guidelines at all rate increments.
Earnings are projected to increase when rates increase. These results further support the results from Table 3 which indicated we are asset sensitive. However, these results should not be treated as a projection of our actual income when rates begin to rise. As stated previously, all models have limitations. This model makes two basic assumptions based on the source data being a snapshot of a single date, December 31, 2015. The first is: as rates move up or down asset and liability levels would remain constant and the second is: all assets and liabilities will reprice, at or close to, the same time. Actual asset and liability levels change daily with new loans, loan payoffs, new deposits, withdrawals, etc., occurring at regular intervals. With each addition, loan rates offered may vary from those in the model based on the financial strength of the borrower. Deposits may be added or withdrawn to types different from those projected in the model. The models assumption of either a smooth rate transition over the time periods indicated or an immediate change may differ from actual changes with regard to timing and velocity.
Table 4 - CHANGE IN NET INTEREST INCOME
SHOCKED | |||||||||||||
Change in Interest Rates(1) | 12 Months Changes in Net Interest Income(2) | 24 Months Changes in Net Interest Income(2) | |||||||||||
Amount | Percent | Amount | Percent | ||||||||||
Up 4% | $ | 6,679 | 16.65 | % | $ | 14,807 | 18.25 | % | |||||
Up 3% | 4,608 | 11.47 | 10,252 | 12.63 | |||||||||
Up 2% | 2,622 | 6.53 | 5,988 | 7.38 | |||||||||
Up 1% | 749 | 1.86 | 1,735 | 2.14 | |||||||||
Down 1% | 254 | 0.63 | 1,265 | 1.56 | |||||||||
Down 2% | (1,151 | ) | (2.86 | ) | (1,726 | ) | (2.13 | ) | |||||
RAMPED | |||||||||||||
Change in Interest Rates(1) | 12 Months Changes in Net Interest Income(2) | 24 Months Changes in Net Interest Income(2) | |||||||||||
Amount | Percent | Amount | Percent | ||||||||||
Up 4% | $ | 2,785 | 6.93 | % | $ | 11,367 | 14.01 | % | |||||
Up 3% | 2,578 | 6.42 | 8,648 | 10.66 | |||||||||
Up 2% | 1,617 | 4.03 | 5,155 | 6.35 | |||||||||
Up 1% | 601 | 1.50 | 1,614 | 1.99 | |||||||||
Down 1% | 236 | 0.59 | 1,202 | 1.48 | |||||||||
Down 2% | (636 | ) | (1.58 | ) | (1,265 | ) | (1.56 | ) | |||||
(1) | Our simulation model makes assumptions including the slope and timing of rate increases, the rates that drive certain financial instruments, prepayment assumptions, etc. |
35
(2) | Represents the difference between estimated net interest income for the next 12 and 24 months in the current rate environment. |
Market Value of Equity
Under both the “shocked” and “ramped” assumptions changes in the market value of equity for increases of 1%, 2%, 3%, and 4% were in compliance with our established internal guidelines. Under the "shocked" assumptions changes in the market value of equity for a decrease of 1% was also in compliance with guidelines. However for "shocked" decreases of 2% and "ramped" decreases of 1% and 2% the results were not within our internal guidelines. These projected changes in the MVE model are based on flat growth assumptions and no changes in the mix of assets or liabilities.
Table 5 - CHANGE IN MARKET VALUE OF PORTFOLIO EQUITY
SHOCKED | RAMPED | ||||||||||||
Change in Interest Rates(1) | Changes in Market Value of Portfolio Equity(2) | Changes in Market Value of Portfolio Equity(2) | |||||||||||
Amount | Percent | Amount | Percent | ||||||||||
Up 4% | $ | 16,369 | 8.60 | % | $ | 20,639 | 10.84 | % | |||||
Up 3% | 11,091 | 5.83 | 13,820 | 7.26 | |||||||||
Up 2% | 9,613 | 5.05 | 10,620 | 5.58 | |||||||||
Up 1% | 5,788 | 3.04 | 5,991 | 3.15 | |||||||||
Down 1% | (9,441 | ) | (4.96 | ) | (9,686 | ) | (5.09 | ) | |||||
Down 2% | (44,192 | ) | (23.22 | ) | (44,614 | ) | (23.44 | ) | |||||
(1) | Our simulation model makes assumptions including the slope and timing of rate increases, the rates that drive certain financial instruments, prepayment assumptions, etc. |
(2) | Represents the difference between market value of portfolio equity in the current interest rate environment. |
All model results indicate we are well positioned for potential rate increases. These models support the actions management has taken with regard to the length of maturities in our portfolio and the products we offer. We will continue to analyze our portfolio and modify our actions as needed to support Company growth in the future.
NON-INTEREST INCOME
Non-interest income increased $18,034,851 or 26.9% in 2015 when compared to 2014 and decreased $2,803,030 or 4.0% in 2014 when compared to 2013. The following table lists the major components of non-interest income for December 31, 2015, 2014, and 2013.
December 31, | |||||||||||
2015 | 2014 | 2013 | |||||||||
Mortgage banking income | $ | 79,578,461 | $ | 62,440,013 | $ | 65,672,402 | |||||
Service charges and fees | 2,227,224 | 2,058,262 | 1,941,926 | ||||||||
Title company income | 967,223 | 669,785 | 789,253 | ||||||||
Bank owned life insurance income | 273,943 | 247,366 | 236,377 | ||||||||
Investment and insurance commissions | 1,607,823 | 1,592,398 | 1,053,429 | ||||||||
(Loss) gain on sale of assets, net | 140,578 | (266 | ) | 58,460 | |||||||
Gain on sale of securities, net | 22,801 | 155 | — | ||||||||
Other | 296,039 | 71,528 | 130,424 | ||||||||
$ | 85,114,092 | $ | 67,079,241 | $ | 69,882,271 | ||||||
Mortgage banking income, which is the largest component of non-interest income, is the primary source of the increase in the years presented. In 2015, mortgage banking income increased $17.1 million, or 27.5% compared to 2014, which had declined $3.2 million, or 4.9% from 2013. Mortgage banking income represents fees from originating and selling residential mortgage loans. Fluctuation in production between years is the source of the changes in mortgage banking income. Production increased in 2015 after declining in both 2014 and 2013. Monarch Mortgage originated a total dollar volume of $2,089,619,153 in 2015, compared to $1,604,726,181 in 2014, and $1,977,423,402 in 2013. The total number of loans closed was 8,017 in
36
2015, 6,193 in 2014, and 7,201 in 2013. By dollar volume, purchase money mortgages represented 76% of loans closed in 2015, 80% of loans closed in 2014, and 63% of loans closed in 2013.
Service charges and fees increased $168,962 or 8.2% in 2015, $116,336 or 6.0% in 2014 and $111,908 or 6.1% in 2013. Increases are due to growth in credit card volume, credit card referral program and automated teller machine usage. Service charges include overdraft and non-sufficient funds fees, automated teller machine transaction fees, non-recurring loan fees and credit card and merchant fees. Service charge pricing on deposit accounts and loan fees are typically reevaluated annually to reflect current costs and competition.
Title income increased $298 thousand to $967 thousand in 2015, after a two year decline of $119 thousand in 2014 and $25 thousand in 2013. Title income is tied to loan closing activities which fluctuate with market conditions. Title income was generated through Real Estate Security Agency, LLC, a subsidiary of Monarch Investment, LLC, which owns 75% of the company.
In August 2014 Monarch purchased $2,000,000 in Bank owned life insurance (BOLI) in addition to the $6,000,000 purchased in October 2005. In 2015 we added Company owned life insurance (COLI) to our deferred compensation plan. Income from BOLI and COLI is not subject to tax. The tax-effective income earnings from BOLI and COLI are $421,450 in 2015, $380,560 in 2014, and $363,657 in 2013.
In August 2012, Monarch introduced a new division to meet the needs of high net worth individuals; Monarch Bank Private Wealth ("MBPW"). In addition, Monarch formed an affiliation with Raymond James Financial Services, Inc., to enable MBPW to offer their clients financial planning, trust and investment services. We also continue to offer investment services, through our investment division, Monarch Investment. MBPW continued to grow investment and insurance commissions for the third straight year. Year over year growth was $15 thousand, or .97% in 2015, $539 thousand or 51.2% in 2014 and $881 thousand or 510.0% in 2013.
In 2015 we sold four vehicles, several pieces of equipment, and removed fourteen pieces of equipment from service for a total net gain of $140,578. In 2014 we removed a piece of equipment from service and wrote off $266. In 2013 we sold two autos for a net gain of $21,904 and a parcel of land which had been carried in other assets at a gain of $36,556.
In 2015 four agency bonds were called for a total gain of $22,801. We recorded a $155 security gain on an agency bond that was called in 2014. There were no security gains in 2013. There were no security losses in any period presented.
Other income represents a variety of nominal recurring and non-recurring activities and transactions that have occurred throughout the years presented.
37
NON-INTEREST EXPENSE
Non-interest expense was $108,371,711 in 2015, an increase of $19,891,855 or 22.5% over 2014. In 2014 non-interest expense was $88,479,856, a decrease of $2,430,962, or 2.7% from 2013. The following table lists the major components of non-interest expense for December 31, 2015, 2014 and 2013.
Year Ended December 31, | |||||||||||
2015 | 2014 | 2013 | |||||||||
Salaries and employee benefits | $ | 39,349,089 | $ | 34,134,998 | $ | 34,112,834 | |||||
Commissions | 36,995,519 | 24,754,633 | 28,344,347 | ||||||||
Loan origination expenses | 7,382,476 | 6,652,007 | 7,891,835 | ||||||||
Occupancy expenses | 5,938,736 | 6,118,265 | 5,408,567 | ||||||||
Furniture and equipment expense | 3,503,532 | 3,430,278 | 3,041,345 | ||||||||
Marketing expense | 3,625,625 | 3,151,374 | 2,912,864 | ||||||||
Data processing services | 2,329,983 | 2,272,785 | 1,696,535 | ||||||||
Professional fees | 2,120,004 | 1,322,268 | 1,053,499 | ||||||||
Telephone | 1,373,579 | 1,226,389 | 1,184,894 | ||||||||
Stationary and supplies | 429,046 | 484,565 | 687,971 | ||||||||
FDIC insurance | 558,079 | 530,486 | 567,819 | ||||||||
Postage and delivery | 384,656 | 470,113 | 632,065 | ||||||||
Franchise Tax | 881,313 | 825,559 | 749,705 | ||||||||
Travel | 665,145 | 552,037 | 452,143 | ||||||||
ATM expense | 374,132 | 372,782 | 293,468 | ||||||||
Insurance | 336,135 | 311,681 | 202,776 | ||||||||
Amortization of intangible assets | — | 104,167 | 178,572 | ||||||||
Title | 146,405 | 102,666 | 106,853 | ||||||||
Valuation adjustments on repossessed property | 100,000 | — | — | ||||||||
Other real estate expense | 44,868 | 80,580 | 7,098 | ||||||||
Rental income, other real estate | (1,955 | ) | (9,620 | ) | — | ||||||
Loss on sale of other real estate | 51,036 | 6,976 | 3,020 | ||||||||
Other | 1,784,308 | 1,584,867 | 1,382,608 | ||||||||
$ | 108,371,711 | $ | 88,479,856 | $ | 90,910,818 | ||||||
Commissions, salaries and employee benefits are the the largest components of non-interest expense and the primary driver of annual changes. Commissions are typically a production based form of compensation while salaries are generally position related guaranteed payments. The variable portion of salaries is in the form of overtime. Employee benefits include social security taxes, Medicare taxes, health insurance premiums and a 401k retirement match. In 2015 the combined expense from commissions, salaries and employee benefits was $76,344,608 or 70.4% of non-interest expense. In 2014 the combined expense from commissions, salaries and employee benefits was $58,889,631, or 66.6% of non-interest expense. In 2013 the combined expense from commissions, salaries and employee benefits was $62,457,181, or 68.7% of non-interest expense.
Commissions, which are variable in nature, were the primary source of increase in non-interest expense for 2015 and the primary source of decrease for both 2014 and 2013. Mortgage banking is a commission based industry with the majority of employee income tied to production levels. The increase in production in 2015 resulted in a 49.5%, or $12.2 million increase in commission compared to 2014. The decline in production in 2014 resulted in a 12.7%, or $3.6 million decrease in commission compared to 2013. The decline in production in 2013 resulted in a 39.1%, or $18.2 million decrease in commissions compared to 2012.
Salaries and employee benefits increased in 2015 by $5.2 million or 15.3%. Salaries and employee benefits were relatively flat between 2014 and 2013. In 2015, $1.5 million of the increase in salary expense was attributable to a full year of lower deferred compensation due to a modification of our treatment of short term loan fees on loan originations that was made late in 2014. Although the number of employees has not changed significantly between years, along with normal annual increases, the mix and skill set of our employees has been elevated due to regulatory and compliance demands. The banking
38
industry, as a whole, has faced increased regulatory and compliance requirements in recent years, with mortgage banking the most heavily impacted. These requirements call for a more specialized skill set which is in high demand and translates to higher salaries. In addition, higher compensation related benefits such as social security tax and Medicare tax expenses contributed to the 2015 increase. As with regulatory and compliance, governmental changes to health care programs have impacted the Company. The cost of health insurance paid by the Company on behalf of our employees increased $558 thousand in 2015. The number of full and part-time employees at year end was 634 for 2015, 645 for 2014 and 664 for 2013.
Loan expense increased 11.0% in 2015 compared to 2014, after declining in 2014 by 15.7% compared to 2013. As with commissions, mortgage production is the primary source of the fluctuations between years. However, there is not a direct relationship between the decline in production and the decline in loan expense. Overall costs associated with mortgage lending have grown due to increased regulation and compliance. Included in loan expense are costs associated with underwriting and processing mortgage loans. Additionally, expense related to the shipping of mortgage loan packages to secondary market investors impacts postage. The telephone is a critical communication tool for the banking industry as a whole and our mortgage lenders in particular. Our bank and mortgage lenders spend a great deal of time out of the office meeting with clients and prospects. This expense has grown with our banking and mortgage operations.
We are committed to providing our clients with optimal service through our employees, facilities and technology. To that end we evaluate our branch locations, aesthetics, potential areas for expansion and operations continuously. Costs associated with occupancy expense, furniture and equipment and data processing fluctuate due to this commitment. In 2015 we relocated our Towne Center office. In 2014 we completed renovations on our Kempsville banking office, closed our Suffolk banking office and opened a permanent Williamsburg branch which included MBPW. In 2013 we opened a mortgage and commercial lending office in Newport News. Also in 2013 we relocated our Monarch Mortgage headquarters, Virginia Beach commercial lending and Oceanfront banking office. 2015 expenses remained flat despite the additions and improvements due to older assets being retired or fully depreciated. The additions and improvements noted previously contributed to the increases in both occupancy and furniture and equipment expense in 2014 and 2013. Technology changes and innovation are carefully monitored to ensure we provide our clients with secure, leading edge technology and service.
Professional fees which include legal, accounting, and consulting expenses increased in 2015 and 2014 after declining in 2013. Professional fees related to our pending merger with Towne are expected to remain elevated through the closing of the merger. During the fourth quarter of 2015, the Company and Bank entered into a definitive agreement with Towne, pursuant to which Towne will acquire all of the common stock of Monarch in a stock transaction. Professional fees directly related to this agreement totaled $431,919 for 2015. In 2014, the financial impact of the Company, subject to customary closing conditions including regulatory and shareholder approval, exceeding $1.0 billion in assets with its accompanying accounting and regulatory requirements is evident in our professional fees. Outsourcing of audits and system reviews to ensure compliance with stricter standards resulted in increased expense.
Monarch has focused on marketing our company brand and gaining exposure in the communities we serve through advertising, community activities and sponsorships. These activities included, media advertisement, higher visibility sponsorships, and greater community involvement. Our marketing expenses increased by $474,251 or 15.0% in 2015 over 2014 and $238,510 or 8.2% in 2014 over 2013
The Company typically enters into three year commitments for its larger insurance needs. In 2014 this coverage was renewed. Company growth since entering into the previous contract was the source of the increase in insurance expenses.
We did not have any properties in other real estate owned as of December 31, 2015. During 2015, two properties were moved to other real estate then subsequently sold at a net loss of $51,036. During 2014, three properties were moved to other real estate and three properties were subsequently sold. Two of the properties sold at a gain of $26,287 and one property sold at a loss of $33,263. During 2013 two properties were moved to other real estate, one of which was subsequently sold at a net loss of $3,020. Maintenance and selling costs associated with other real estate were $44,868 in 2015, $80,580 in 2014 and $7,098 in 2013. Rent collected on one property was $1,955 in 2015, $9,620 in 2014 and $0 in 2013.
We continue to focus on controlling overhead expenses in relation to income growth. Our efficiency ratio, a productivity measure used to determine how well non-interest expense is managed, was 83.8% in 2015, 83.1% in 2014 and 82.8% in 2013. Our “Bank only” efficiency ratio was 60.3% in 2015, 61.1% in 2014 and 60.4% in 2013. A lower efficiency ratio indicates more favorable expense efficiency. The efficiency ratio is calculated by dividing non-interest expense by the sum of taxable equivalent net interest income and non-interest income. Increased regulatory burden and expenses associated with our non-interest income lines of business have negatively impacted this ratio and the value it provides to investors.
39
The dollar and percentage change of listed expenses is provided below.
Year Ended December 31, | |||||||||||||
2015 vs. 2014 | 2014 vs. 2013 | ||||||||||||
Dollars | Percentage | Dollars | Percentage | ||||||||||
Commissions | $ | 12,240,886 | 49.5 | % | $ | (3,589,714 | ) | (12.7 | )% | ||||
Salaries and employee benefits | 5,214,091 | 15.3 | % | 22,164 | 0.1 | % | |||||||
Professional fees | 797,736 | 60.3 | % | 268,769 | 25.5 | % | |||||||
Loan origination expenses | 730,469 | 11.0 | % | (1,239,828 | ) | (15.7 | )% | ||||||
Marketing expense | 474,251 | 15.0 | % | 238,510 | 8.2 | % | |||||||
Telephone | 147,190 | 12.0 | % | 41,495 | 3.5 | % | |||||||
Travel | 113,108 | 20.5 | % | 99,894 | 22.1 | % | |||||||
Valuation adjustments on repossessed properties | 100,000 | 100.0 | % | — | — | % | |||||||
Furniture and equipment expense | 73,254 | 2.1 | % | 388,933 | 12.8 | % | |||||||
Data processing services | 57,198 | 2.5 | % | 576,250 | 34.0 | % | |||||||
Franchise Tax | 55,754 | 6.8 | % | 75,854 | 10.1 | % | |||||||
Loss (income) on sale of other real estate | 44,060 | 631.6 | % | 3,956 | 131.0 | % | |||||||
Title | 43,739 | 42.6 | % | (4,187 | ) | (3.9 | )% | ||||||
FDIC insurance | 27,593 | 5.2 | % | (37,333 | ) | (6.6 | )% | ||||||
Insurance | 24,454 | 7.9 | % | 108,905 | 53.7 | % | |||||||
Rental income, other real estate | 7,665 | (79.7 | )% | (9,620 | ) | 100.0 | % | ||||||
ATM expense | 1,350 | 36.0 | % | 79,314 | 27.0 | % | |||||||
Other | 199,441 | 12.6 | % | 202,259 | 14.6 | % | |||||||
Other real estate expense | (35,712 | ) | (44.3 | )% | 73,482 | 1,035.2 | % | ||||||
Postage and delivery | (85,457 | ) | (18.2 | )% | (161,952 | ) | (25.6 | )% | |||||
Stationary and supplies | (55,519 | ) | (11.5 | )% | (203,406 | ) | (29.6 | )% | |||||
Amortization of intangibles | (104,167 | ) | (100.0 | )% | (74,405 | ) | (41.7 | )% | |||||
Occupancy expenses | (179,529 | ) | (2.9 | )% | 709,698 | 13.1 | % | ||||||
Income Statement Impact of Forward Rate Commitments and Unrealized Hedge Gain (Loss)
Included in mortgage banking income, commissions and incentives, and loan expense are accruals for changes in income related to interest rate lock commitments, and fair value adjustments related to hedging. The offset for these accruals are found in the consolidated statements of condition. These accounting estimates, which are required by GAAP, create volatility in our financial statements because they accelerate earnings recognition and are driven by volume changes and market conditions. These estimates are made at a specified point in time and do not necessarily reflect the actual income or losses that will occur. Realized gains and losses from hedge activities are carried separately and included in mortgage banking income.
Interest rate lock commitments are a commitment at a specific rate to an identified potential borrower for a specified time period in the future. That specified time period is typically between 15 and 45 days from the date of initial lock. Although they represent a guaranteed commitment by the bank to a potential borrower, they do no represent an actual closed loan and that potential borrower may decide not to borrow from us at any time until the lock expires. Based on GAAP, unearned income and expenses related to these commitments must be recorded on our consolidated statements of income at quarter end, as if the loans had closed. Changes in the number and dollar volume of these commitments between quarters has a direct impact on earnings. If the number and dollar volume declines between measurement periods, rate lock income will most likely decline, whereas, an increase in number and dollar volume will most likely create an increase in income.
For mortgage loans committed to our mandatory delivery program, loans with interest rate locks are paired with the sale of a notional security bearing similar attributes. The assumption is the two products will move in direct correlation in opposite directions and thereby reduce the risk of pricing movements. Interim income or losses on the pairing of the loans and securities is recorded in mortgage banking income on our consolidated statements of income with offset in our consolidated statements of condition. As with forward rate commitments, volume changes can impact the dollar value of notional shares between periods and an uncoupling of the mortgage market with the securities market due to volatility can impact the fair value of the securities.
40
Loans in our mandatory delivery program that have closed but have not been committed to an investor are also required to be reported as if sold to an investor. A gain or loss on the loan is recorded in consolidated statements of income with offset to the consolidated statements of condition based on the market rate for a similar product at the measurement date.
The following summary identifies the components in non-interest income and non-interest expense related to forward rate commitments and hedge gain (loss) found in our consolidated statements of income with offset in our consolidated statements of condition.
Year Ended December 31, | ||||||||||||
Non-interest income: | 2015 | 2014 | 2013 | |||||||||
Hedge income (loss) | $ | (684,476 | ) | $ | 575,569 | $ | — | |||||
Mark to market hedge income (loss) | 341,528 | (394,666 | ) | — | ||||||||
Rate lock income (expense) | 1,029,698 | 1,645,572 | — | |||||||||
Change in non-interest income | 686,750 | 1,826,475 | — | |||||||||
Non-interest expense: | ||||||||||||
Rate lock commissions | (264,087 | ) | (730,686 | ) | — | |||||||
Rate lock loan expense | 64,037 | (374,512 | ) | — | ||||||||
Change in non-interest (expense) | (200,050 | ) | (1,105,198 | ) | — | |||||||
Forward rate commitments and hedge gain | $ | 486,700 | $ | 721,277 | $ | — | ||||||
INCOME TAXES
In 2015 we recognized $7,155,214 in federal income tax expense compared to federal income tax expense of $6,032,605 in 2014. Income tax as a percentage of pretax income may vary significantly from statutory rates due to permanent differences, which are items of income and expense excluded by law from the calculation of taxable income. Permanent differences generally include interest income from BOLI, municipal securities and dividends on federal reserve stock, and expenses related meals and entertainment, and certain dues. The resulting effective tax rate was 34.4% in 2015, 34.1% in 2014, compared to 33.7% in 2013. Differences between years are due to changes in permanent exclusions from income and expense. We pay state taxes related to Monarch Mortgage in Maryland, North Carolina and South Carolina. The following table provides state taxes the effective federal tax rate.
Income Tax Summary | |||||||||||
Year Ended December 31, | |||||||||||
2015 | 2014 | 2013 | |||||||||
Income tax provision | $ | 7,583,820 | $ | 6,490,273 | $ | 6,386,040 | |||||
Less: state tax provision | 428,606 | 457,668 | 487,572 | ||||||||
Federal tax provision | $ | 7,155,214 | $ | 6,032,605 | $ | 5,898,468 | |||||
Income attributable to Monarch Financial Holdings, Inc. | $ | 20,798,641 | $ | 17,702,123 | $ | 17,477,047 | |||||
Effective federal tax rate | 34.4 | % | 34.1 | % | 33.7 | % | |||||
SEGMENT REPORTING
Our reportable segments include community banking and mortgage banking services. Community banking involves making loans to and generating deposits from individuals and businesses in the markets where we have offices. Mortgage banking originates residential loans and subsequently sells them to investors. Our mortgage banking segment is a strategic business unit that is managed separately from the community banking segment because the mortgage banking services segment appeals to different markets and, accordingly, requires different technology and marketing strategies. We do not have other reportable operating segments. For discussion of our segment accounting policies, see Note 1 to our Consolidated Financial Statements (included in Item 8. of this Form-K).
Funding for retail mortgage banking services' loans held for sale (LHFS) portfolio is provided by community banking services. For segmentation purposes the community banking segment charges the mortgage banking segment interest on average LHFS balances outstanding at a rate of the three month average 30 day London Interbank Offered Rate (LIBOR) plus 250 basis points.
Segment information for the years 2015, 2014 and 2013 is shown in the following table.
41
Selected Financial Information
Community Banking Segment | |||||||||||
Year Ended December 31, | |||||||||||
2015 | 2014 | 2013 | |||||||||
Income: | |||||||||||
Interest income | $ | 45,674,497 | $ | 41,252,559 | $ | 43,282,961 | |||||
Non-interest income | 5,535,631 | 4,639,228 | 4,697,595 | ||||||||
Total operating income | 51,210,128 | 45,891,787 | 47,980,556 | ||||||||
Expenses: | |||||||||||
Interest expense | (3,147,136 | ) | (3,661,164 | ) | (4,786,458 | ) | |||||
Provision for loan losses | — | — | — | ||||||||
Personnel expense | (18,250,993 | ) | (15,178,262 | ) | (14,118,094 | ) | |||||
Other non-interest expenses | (13,392,789 | ) | (11,775,699 | ) | (10,357,092 | ) | |||||
Total operating expenses | (34,790,918 | ) | (30,615,125 | ) | (29,261,644 | ) | |||||
Income before income taxes | 16,419,210 | 15,276,662 | 18,718,912 | ||||||||
Provision for income taxes | (5,947,629 | ) | (5,530,091 | ) | (6,449,951 | ) | |||||
Less: Net income attributable to non-controlling interests | (62,957 | ) | (29,287 | ) | (47,305 | ) | |||||
Net income attributable to community banking segment | $ | 10,408,624 | $ | 9,717,284 | $ | 12,221,656 | |||||
Mortgage Banking Segment | |||||||||||
Year Ended December 31, | |||||||||||
2015 | 2014 | 2013 | |||||||||
Income: | |||||||||||
Interest income | $ | 5,963,440 | $ | 4,866,818 | $ | 7,021,186 | |||||
Non-interest income | 78,891,711 | 60,613,538 | 65,184,676 | ||||||||
Total operating income | 84,855,151 | 65,480,356 | 72,205,862 | ||||||||
Expenses: | |||||||||||
Interest expense | (4,242,754 | ) | (3,128,470 | ) | (5,955,710 | ) | |||||
Personnel expense | (57,829,528 | ) | (42,980,683 | ) | (48,339,087 | ) | |||||
Other non-interest expenses | (18,698,351 | ) | (17,440,014 | ) | (18,096,545 | ) | |||||
Total operating expenses | (80,770,633 | ) | (63,549,167 | ) | (72,391,342 | ) | |||||
Net operating income | 4,084,518 | 1,931,189 | (185,480 | ) | |||||||
Forward rate commitments and hedge gain | 486,700 | 721,277 | — | ||||||||
Income before taxes | 4,571,218 | 2,652,466 | (185,480 | ) | |||||||
Provision for income taxes | (1,655,859 | ) | (960,182 | ) | 63,911 | ||||||
Less: Net income attributable to non-controlling interests | (128,830 | ) | (197,718 | ) | (1,009,080 | ) | |||||
Net income (loss) attributable to mortgage banking segment | $ | 2,786,529 | $ | 1,494,566 | $ | (1,130,649 | ) | ||||
42
Consolidated Statements of Income | |||||||||||
Year Ended December 31, | |||||||||||
2015 | 2014 | 2013 | |||||||||
Income: | |||||||||||
Interest income | $ | 47,395,183 | $ | 42,990,907 | $ | 44,348,437 | |||||
Non-interest income | 85,114,092 | 67,079,241 | 69,882,271 | ||||||||
Total operating income | 132,509,275 | 110,070,148 | 114,230,708 | ||||||||
Expenses: | |||||||||||
Interest expense | (3,147,136 | ) | (3,661,164 | ) | (4,786,458 | ) | |||||
Provision for loan losses | — | — | — | ||||||||
Personnel expense | (76,344,608 | ) | (58,889,631 | ) | (62,457,181 | ) | |||||
Other non-interest expenses | (32,027,103 | ) | (29,590,225 | ) | (28,453,637 | ) | |||||
Total operating expenses | (111,518,847 | ) | (92,141,020 | ) | (95,697,276 | ) | |||||
Income before income taxes | 20,990,428 | 17,929,128 | 18,533,432 | ||||||||
Provision for income taxes | (7,583,820 | ) | (6,490,273 | ) | (6,386,040 | ) | |||||
Less: Net income attributable to non-controlling interests | (191,787 | ) | (227,005 | ) | (1,056,385 | ) | |||||
Net income attributable to Monarch Financial Holdings, Inc. | $ | 13,214,821 | $ | 11,211,850 | $ | 11,091,007 | |||||
Year Ended December 31, | |||||||||||
Elimination entries: | 2015 | 2014 | 2013 | ||||||||
Interest income | $ | (4,242,754 | ) | $ | (3,128,470 | ) | $ | (5,955,710 | ) | ||
Interest expense | 4,242,754 | 3,128,470 | 5,955,710 | ||||||||
Non-interest income | (686,750 | ) | (1,825,475 | ) | — | ||||||
Personnel expense | 264,087 | 730,686 | — | ||||||||
Other non-interest expenses | (64,037 | ) | 374,512 | — | |||||||
Forward rate commitments and hedge gain | 486,700 | 721,277 | — | ||||||||
Community Banking | Mortgage Banking | Elimination entries | Consolidated | ||||||||||||
Segment Assets | |||||||||||||||
2015 | $ | 996,432,802 | $ | 192,062,857 | $ | (27,047,504 | ) | $ | 1,161,448,155 | ||||||
2014 | $ | 915,521,105 | $ | 162,761,389 | $ | (11,545,520 | ) | $ | 1,066,736,974 | ||||||
Capital Expenditures | |||||||||||||||
2015 | $ | 1,359,215 | $ | 424,271 | $ | — | $ | 1,783,486 | |||||||
2014 | $ | 3,932,268 | $ | 352,505 | $ | — | $ | 4,284,773 | |||||||
FINANCIAL CONDITION, LIQUIDITY AND CAPITAL RESOURCES
GENERAL
Total assets were $1,161.4 million at December 31, 2015, an increase of $94.7 million, or 8.9% compared to $1,066.7 million at year-end 2014. This increase is attributable to a $21.7 million, or 114.7% increase in our loans held for sale portfolio which was $169.3 million at year end and loans held for investment which rose $56.7 million, or 7.3% to $829.3 million. Interest bearing bank balances grew $8.8 million or 17.8% to $58.6 million and available for sale investments increased $6.5 million, or 27.4% to $30.2 million.
Total liabilities increased $84.5 million, or 8.8% to $1,043.7 million at December 31, 2015, compared to $959.2 million at December 31, 2014. Total deposits were $999.1 million at year end 2015, an increase of 8.7% or $79.7 million when compared to $919.4 million at December 31, 2014. Total borrowings increased $4.9 million to $26.0 million at December 31, 2015. Total stockholders’ equity was $117.7 million at December 31, 2015, compared to $107.5 million at December 31, 2014, an increase of $10.2 million or 9.5%.
43
SECURITIES
Our securities portfolio consists primarily of securities for which a market exists. Our policy is to invest mainly in securities of the U. S. Government and its agencies and in other high grade fixed income securities to minimize credit risk. Our securities portfolio plays a limited role in the management of interest rate sensitivity and generates additional interest income. Our portfolio serves primarily as a source of liquidity and is used to meet collateral requirements for municipal deposits.
All of the securities in our portfolio are classified, available-for-sale. These securities are carried at estimated fair value and may be sold in response to changes in market interest rates, changes in securities’ prepayment risk, increases in loan demand, general liquidity needs, and other similar factors.
Table 6 - SECURITIES PORTFOLIO
(in thousands)
As of December 31, | |||||||||||
2015 | 2014 | 2013 | |||||||||
Securities available-for-sale, at fair value: | |||||||||||
U.S. government agency obligations | $ | 26,236 | $ | 20,454 | $ | 45,346 | |||||
Residential mortgage-backed securities | 998 | 1,283 | 1,567 | ||||||||
Municipal securities | 2,979 | 1,988 | 1,909 | ||||||||
Total Securities Portfolio | $ | 30,213 | $ | 23,725 | $ | 48,822 | |||||
The amortized cost and estimated fair value of securities, all of which are classified as available for sale, at December 31, 2015 by the earlier of contractual maturity or expected maturity, are shown below. Expected maturities will differ from contractual maturities because borrowers may have the right to prepay obligations with or without call or prepayment penalties.
Table 7 - ESTIMATED MATURITIES OF SECURITIES AS OF PERIOD INDICATED
(in thousands)
December 31, 2015 | |||||||||||||||||||
1 Year or Less | 1 to 5 Years | 5 to 10 Years | Over 10 Years | Total | |||||||||||||||
(Dollars In thousands) | |||||||||||||||||||
US agency securities: | |||||||||||||||||||
Amortized cost | $ | 23,374 | $ | 3,002 | $ | — | $ | — | $ | 26,376 | |||||||||
Fair value | $ | 23,241 | $ | 2,995 | $ | — | $ | — | $ | 26,236 | |||||||||
Weighted average yield | 1.38 | % | 1.09 | % | — | — | 1.35 | % | |||||||||||
Residential mortgage backed securities: | |||||||||||||||||||
Amortized cost | $ | — | $ | — | $ | — | $ | 995 | $ | 995 | |||||||||
Fair value | $ | — | $ | — | $ | — | $ | 998 | $ | 998 | |||||||||
Weighted average yield | — | — | — | 2.64 | % | 2.64 | % | ||||||||||||
Municipal securities: | |||||||||||||||||||
Amortized cost | $ | — | $ | 2,901 | $ | — | $ | — | $ | 2,901 | |||||||||
Fair value | $ | — | $ | 2,979 | $ | — | $ | — | $ | 2,979 | |||||||||
Weighted average yield | — | 2.84 | % | — | % | — | 2.84 | % | |||||||||||
Total securities: | |||||||||||||||||||
Amortized cost | $ | 23,374 | $ | 5,903 | $ | — | $ | 995 | $ | 30,272 | |||||||||
Fair value | $ | 23,241 | $ | 5,974 | $ | — | $ | 998 | $ | 30,213 | |||||||||
Weighted average yield | 1.38 | % | 1.95 | % | — | % | 2.64 | % | 1.54 | % | |||||||||
Total investment securities were $30.2 million at December 31, 2015, compared to $23.7 million in 2014. At year end, neither the aggregate book value nor the aggregate market value of the securities of any issuer exceeded ten percent of our stockholders’ equity. Additional information on our investment securities portfolio is in Note 2 to our Consolidated Financial Statements (included in Item 8. of this Form 10-K).
44
As of December 31, 2015, there was a net unrealized loss of $59,194 related to the available-for-sale investment portfolio compared to a net unrealized gain of $48,802 at year end 2014. Note 2 to our Consolidated Financial Statements (included in Item 8. of this Form 10-K) provides details of the amortized cost, unrealized gains and losses, and estimated fair value of each category of the investment portfolio as of December 31, 2015 and 2014.
LOAN PORTFOLIO
Our lending activities are our principal source of income. Loans held for investment, net of unearned income, increased $56,679,770 or 7.3% during 2015. Mortgage loans held for sale, loans originated for the secondary market by Monarch Mortgage that have closed but not funded with our investors, increased 14.7% or $21,654,929 to $169,345,205 on December 31, 2015 compared to $147,690,276 on December 31, 2014. This increase was due to the pick up in purchase money activity related to new home buying. Discussions below exclude mortgage loans held for sale.
Our loan portfolio is divided into three loan types; commercial, real estate, and consumer. At December 31, 2015, the commercial loan type represents 19.0%, the real estate loan type represents 80.2%, and the consumer loan type represents 0.8% of our loan portfolio.
Commercial loans increased $19.6 million or 14.2% in 2015 to $158.1 million. Commercial loan yield was 4.99% in 2015 compared to 5.43% in 2014 and 5.19% in 2013. Commercial loans are highly sought after in the current banking environment. Competition from the standpoint of both pricing and term is considerable while the number of opportunities available in the market are limited.
Real estate secured loans increased $36.7 million to $664.6 million in 2015 compared to 2014. The blended yield on this was 5.25% in 2015 compared to 5.27% in 2014 and 5.41% in 2013. Competition for this loan type has increased since early 2014 as more banks re-entered the market. Prior to this year, margin compression had not been as significant in the loan type because of the limited number of competitors. The real estate secured loan type is further divided into classes based on loan purpose and includes construction, 1-4 family residential properties, home equity lines, multifamily and real estate secured commercial loans. Commercial real estate loans are by far the largest class of loans in our loans held for investment portfolio, at 35.0% of total loans. This class represents 43.7% of total real estate secured loans and increased $33.5 million or 13.0%, to $290.5 million in 2015. Owner occupied commercial real estate loans comprise 40.4% of that total. Multifamily real estate loans represent 1.7% of total real estate secured loans, declining $10.2 million in 2015 to $11.6 million. Real estate construction increased $17.9 million in 2015. It was the second largest class of loans, at 23.0% of total loans held for investment and 28.6% of real estate loans, or $190.4 million. 1-4 family residential loans represented 17.0% of this segment and grew 3.6%, or $3.9 million in 2015 to $113.3 million. Home equity lines declined 12.4% or $8.4 million to $59.1 million in 2015.
Consumer loans, which comprise less than 1.0% of our loans held for investment, remained relatively flat with growth of only $0.4 million in 2015. The yield on consumer and installment loans was 5.20% in 2015, a decline from 6.06% in 2014.
We consider our overall loan portfolio diversified as it consists of 19.1% in commercial loans, 22.9% in construction loans, 13.7% in loans secured by 1-4 family residential properties, 7.1% in home equity lines, 14.1% in owner occupied commercial loans secured by real estate, 20.9% non-owner occupied commercial loans secured by real estate, 1.4% in multifamily loans and less than 1% in consumer loans as of December 31, 2015, as detailed in Table 8 (in thousands) classified by type.
Interest income on consumer, commercial, and real estate mortgage loans is computed on the principal balance outstanding. Most variable rate loans carry an interest rate tied to the Wall Street Journal Prime Rate, as published in the Wall Street Journal. Note 4 to our Consolidated Financial Statements (included in Item 8. of this Form 10-K) provides a schedule of loans by type and other information. We do not participate in highly leveraged lending transactions, as defined by the regulators, and there are no loans of this nature recorded in the loan portfolio. We do not have foreign loans in our portfolio. At December 31, 2015, we had two loan concentrations which exceeded 10% in the area of loans to borrowers who are principally engaged in acquisition, development and construction of multifamily homes and developments. A geographic concentration arises because we operate primarily in southeastern Virginia.
45
Table 8 - LOANS
(in thousands)
December 31, | |||||||||||||||||||
2015 | 2014 | 2013 | 2012 | 2011 | |||||||||||||||
Commercial | $ | 158,174 | $ | 138,511 | $ | 119,533 | $ | 91,889 | $ | 81,130 | |||||||||
Real estate | |||||||||||||||||||
Construction | 190,260 | 172,337 | 155,429 | 154,213 | 139,313 | ||||||||||||||
Residential (1-4 family) | 113,318 | 109,483 | 89,973 | 92,606 | 85,731 | ||||||||||||||
Home equity lines | 59,222 | 67,615 | 67,310 | 71,635 | 74,706 | ||||||||||||||
Multifamily | 11,592 | 21,809 | 27,356 | 20,021 | 26,780 | ||||||||||||||
Commercial | 290,211 | 256,749 | 250,065 | 227,621 | 196,370 | ||||||||||||||
Consumer | |||||||||||||||||||
Consumer and installment loans | 6,368 | 5,992 | 2,931 | 3,054 | 3,532 | ||||||||||||||
Overdraft protection loans | 124 | 94 | 74 | 55 | 50 | ||||||||||||||
Loans - net of unearned income (1) | $ | 829,269 | $ | 772,590 | $ | 712,671 | $ | 661,094 | $ | 607,612 | |||||||||
(1) | Loans - net of unamortized (costs) unearned fees include deferred loan (costs) fees. These (costs) fees were ($202) thousand in 2015, ($77) thousand in 2014 and $175 thousand in 2013. |
Table 9 - LOAN MATURITIES
(in thousands)
December 31, 2015 | |||||||||||||||||||||||||||
Due within one year | Due after one year but within five years | Due after five years | Total (1) | ||||||||||||||||||||||||
Amount | Yield | Amount | Yield | Amount | Yield | Amount | Yield | ||||||||||||||||||||
Commercial | $ | 91,361 | 4.25 | % | $ | 60,133 | 4.93 | % | $ | 6,680 | 4.59 | % | $ | 158,174 | 4.52 | % | |||||||||||
Real estate | |||||||||||||||||||||||||||
Construction | 159,789 | 5.00 | % | 29,297 | 4.72 | % | 1,174 | 4.63 | % | 190,260 | 4.96 | % | |||||||||||||||
Residential (1-4 family) | 40,778 | 5.43 | % | 50,581 | 5.21 | % | 21,959 | 4.20 | % | 113,318 | 5.09 | % | |||||||||||||||
Home equity lines | 133 | 5.26 | % | 4,688 | 3.54 | % | 54,401 | 3.58 | % | 59,222 | 3.58 | % | |||||||||||||||
Multifamily | 996 | 5.84 | % | 10,245 | 5.02 | % | 351 | 5.95 | % | 11,592 | 5.12 | % | |||||||||||||||
Commercial | 50,696 | 5.32 | % | 206,316 | 4.86 | % | 33,199 | 4.42 | % | 290,211 | 4.89 | % | |||||||||||||||
Consumer | |||||||||||||||||||||||||||
Consumer and installment loans | 4,502 | 3.95 | % | 1,815 | 10.24 | % | 51 | 18.12 | % | 6,368 | 5.85 | % | |||||||||||||||
Overdraft protection loans | 83 | 20.99 | % | 39 | 20.37 | % | 2 | 18.40 | % | 124 | 20.75 | % | |||||||||||||||
$ | 348,338 | 4.89 | % | $ | 363,114 | 4.93 | % | $ | 117,817 | 4.01 | % | $ | 829,269 | 4.78 | % | ||||||||||||
Fixed rate loans due | $ | 317,185 | $ | 48,118 | $ | 480,682 | |||||||||||||||||||||
Variable rate loans due | 45,929 | 69,699 | 348,587 | ||||||||||||||||||||||||
$ | 363,114 | $ | 117,817 | $ | 829,269 | ||||||||||||||||||||||
(1) | Total loans include unamortized (costs) unearned fees in the form of deferred loan (costs) fees. These (costs) fees were ($202) thousand in 2015, ($77) thousand in 2014 and $175 thousand in 2013. |
ALLOWANCE AND PROVISION FOR LOAN LOSSES
We have certain lending policies and procedures in place that are designed to balance loan growth and income with an acceptable level of risk, which management reviews and approves on a regular basis. Our review process is supported by a series of reports related to loan production, loan quality, credit concentrations, policy exceptions, loan delinquencies and non-performing and potential problem loans. We also utilize diversification in our loan portfolio as a means of managing risk.
Our allowance for loan losses is to provide for losses inherent in the loan portfolio. Management is responsible for determining the level of the allowance for loan losses, subject to review by our Board of Directors. Among other factors, we
46
consider on a monthly basis our historical loss experience, the size and composition of our loan portfolio, the value and adequacy of collateral and guarantors, non-performing credits including impaired loans, our risk-rating-based loan “watch list”, and local and national economic conditions. The economy of our trade area is well diversified. There are additional risks of future loan losses that cannot be precisely quantified or attributed to particular loans or classes of loans. Since those factors include general economic trends as well as conditions affecting individual borrowers, the allowance for loan losses is an estimate.
To determine the total allowance for loan losses, we estimate the reserves needed for each segment of the portfolio, including loans analyzed on both, a pooled basis and individually. Our allowance for loan losses consists of amounts applicable to the following loan types: (i) the commercial loan portfolio; (ii) the real estate loan portfolio; (iii) the consumer loan portfolio. In addition, loans within these portfolios are evaluated as a group or on an individual or relationship basis and assigned a risk grade based on the underlying characteristics.
The commercial loan portfolio includes commercial and industrial loans which are usually secured by the assets being financed or other business assets such as accounts receivable or inventory and normally incorporate a personal guarantee; however, some short-term loans may be made on an unsecured basis. Commercial loans are underwritten after evaluating and understanding the borrower’s ability to operate profitably and prudently expand its business.
The real estate loan portfolio includes all loans secured by real estate. This type is further broken down into the following classes: construction loans, residential 1-4 family loans, home equity lines, multifamily loans, and commercial real estate loans. Construction and multifamily loans are underwritten utilizing feasibility studies, independent appraisal reviews, sensitivity analysis of absorption and lease rates and financial analysis of the developers and property owners. Construction loans are generally based upon estimates of costs and value associated with the complete project. Residential 1-4 family and home equity loan originations utilize analytics to supplement the underwriting process. Commercial real estate loans are subject to underwriting standards and processes similar to commercial loans, in addition to those of real estate loans. These loans are viewed primarily as cash flow loans and secondarily as loans secured by real estate.
Commercial and real estate portfolio loans are evaluated on an individual or relationship basis and assigned a risk grade at the time the loan is made. Additionally, we perform periodic reviews of the loan or relationship to determine if there have been any changes in the original underwriting which would change the risk grade and/or impact the borrower’s ability to repay the loan.
The consumer loan portfolio includes consumer and installment loans and overdraft protection loans. These loans, which are in relatively small loan amounts, are spread across many individual borrowers. We utilize analytics to supplement general underwriting. Loans within the consumer type are assigned risk grades and evaluated as a pool, unless specifically identified through delinquency or other signs of credit deterioration, at which time the identified loan is individually evaluated. Additionally, loans that have been specifically identified as a credit risk due to circumstances that may affect the ability of the borrower to repay interest and/or principal are analyzed on an individual basis. Adverse circumstances may include loss of repayment source, deterioration in the estimated value of collateral, elevated trends of delinquencies, and charge-offs.
We evaluate the adequacy of the allowance for loan losses monthly in order to maintain the allowance at a level that is sufficient to absorb probable credit losses. Such factors as the level and trend of interest rates and the condition of the national and local economies are also considered. From time to time, events or economic factors may affect the loan portfolio, causing management to provide additional amounts to or release balances from the allowance for loan losses. Our allowance for loan losses is sensitive to risk ratings assigned to individually evaluated loans, economic assumptions, and delinquency trends driving statistically modeled reserves.
There are nine numerical risk grades that can be assigned to loans:
“Pass” | “Watch List” | |
1 Minimal | 6 Special mention | |
2 Modest | 7 Substandard | |
3 Average | 8 Doubtful | |
4 Acceptable | 9 Loss | |
5 Acceptable with care | ||
The following table delineates, in thousands, our loan portfolio by class and “pass” and “watch list” risk grade for the years ended December 31, 2015 and 2014.
47
Table 10 - LOANS BY RISK GRADE
(in thousands)
2015 | |||||||||||
Pass | Watch list | Total | |||||||||
Commercial | $ | 157,818 | $ | 254 | $ | 158,072 | |||||
Real estate | |||||||||||
Construction | 189,255 | 1,168 | 190,423 | ||||||||
Residential (1-4 family) | 108,693 | 4,585 | 113,278 | ||||||||
Home equity lines | 57,658 | 1,440 | 59,098 | ||||||||
Multifamily | 11,591 | — | 11,591 | ||||||||
Commercial | 288,533 | 1,998 | 290,531 | ||||||||
Real estate subtotal | 655,730 | 9,191 | 664,921 | ||||||||
Consumer | |||||||||||
Consumer and installment loans | 6,291 | 65 | 6,356 | ||||||||
Overdraft protection loans | 119 | 3 | 122 | ||||||||
Loans to individuals subtotal | 6,410 | 68 | 6,478 | ||||||||
Total gross loans | $ | 819,958 | $ | 9,513 | $ | 829,471 | |||||
Unamortized loan costs, net of deferred fees | (202 | ) | |||||||||
Total net loans | $ | 829,269 | |||||||||
2014 | |||||||||||
Pass | Watch list | Total | |||||||||
Commercial | $ | 135,293 | $ | 3,138 | $ | 138,431 | |||||
Real estate | |||||||||||
Construction | 171,137 | 1,365 | 172,502 | ||||||||
Residential (1-4 family) | 101,861 | 7,544 | 109,405 | ||||||||
Home equity lines | 66,282 | 1,204 | 67,486 | ||||||||
Multifamily | 19,616 | 2,193 | 21,809 | ||||||||
Commercial | 253,525 | 3,442 | 256,967 | ||||||||
Real estate subtotal | 612,421 | 15,748 | 628,169 | ||||||||
Consumer | |||||||||||
Consumer and installment loans | 5,893 | 76 | 5,969 | ||||||||
Overdraft protection loans | 97 | — | 97 | ||||||||
Loans to individuals subtotal | 5,990 | 76 | 6,066 | ||||||||
Total gross loans | $ | 753,704 | $ | 18,962 | $ | 772,666 | |||||
Unamortized loan costs, net of deferred fees | (77 | ) | |||||||||
Total net loans | $ | 772,589 | |||||||||
A loan risk graded a loss is charged-off when identified and a loan risk graded as doubtful is classified as a nonaccrual loan. At December 31, 2015 we did not have any loans risk graded as a loss or as doubtful. We do not have any potential problem loans which have not been evaluated and disclosed at December 31, 2015. Loans identified as special mention and substandard may or may not be classified as nonaccrual, based on current performance. “Watch list” loans are evaluated on an individual or relationship basis to determine if any, or all, of our loans to the borrower are at risk. We evaluate the collectability of both principal and interest when assessing the need for a loss accrual. For additional discussion on this evaluation refer to Note 1 and Note 4 to our Consolidated Financial Statements (included in Item 8. of this Form 10-K).
In September 2014, in order to maintain a true loss profile, we began to extend the "look-back" period by one quarter with a target of a five-year "look-back" period by June 2015. We believe this current year adjustment is a change within our methodology and not a change to the methodology itself. At December 31, 2015 "look-back" period is five years. We believe these changes provide a more accurate evaluation of the potential risk in our portfolio because it is a more granular approach that allows management to capture trends in the portfolio. The additional delineation by purpose establishes a stronger focus on areas of weakness and strength within the portfolio.
The allowance is subject to regulatory examinations and determination as to adequacy. This examination may take into account such factors as the methodology used to calculate the allowance and the size of the allowance in comparison to peer banks identified by regulatory agencies.
48
In 2015, 2014 and 2013 we expensed $0 in provision for loan losses. Based on the current economic environment and the composition of our loan portfolio, the level of our charged-off loans combined with our peer bank loss experience, we considered this provision to be a prudent allocation of funds for our loan loss allowance.
Loans charged off during 2015 totaled $955,423 compared to $551,968 in 2014, and recoveries totaled $893,785 and $439,436 in 2015 and 2014, respectively. The ratio of net charge-offs to average outstanding loans was 0.01% in 2015 compared to 0.02% in 2014.
In 2015, approximately $850 thousand in loans charged off were related to failed business activities and $105 thousand were related to residential properties. In 2014, approximately $225 thousand in loans charged off were related to failed business activities and $327 were related to residential properties. In both 2015 and 2014, the charge-off activities are related to singular events and are not indicative of any trends.
Table 11 presents our loan loss and recovery experience (in thousands) for the past five years.
The allowance for loan losses totaled $8,887,199 at December 31, 2015, a decrease of $61,638 or 0.69% from December 31, 2014. The ratio of the allowance to loans, less unearned income, was 1.07% at December 31, 2015 and 1.16% at December 31, 2014. We believe the allowance for loan losses is adequate to absorb any probable and inherent losses on existing loans in our loan portfolio at December 31, 2015. The allowance to loans ratio is supported by the level of non-performing loans, the seasoning of the loan portfolio, and the experience of the lending staff in the market. See Note 4 to our Consolidated Financial Statements (included in Item 8. of this Form 10-K) for more information concerning our loan loss and recovery experience.
Table 11 - LOAN LOSS ALLOWANCE AND LOSS EXPERIENCE
(in thousands)
December 31, | |||||||||||||||||||
2015 | 2014 | 2013 | 2012 | 2011 | |||||||||||||||
Balance at beginning of period | $ | 8,949 | $ | 9,061 | $ | 10,910 | $ | 9,930 | $ | 9,037 | |||||||||
Charge-offs: | |||||||||||||||||||
Commercial | (207 | ) | (22 | ) | (2,468 | ) | (835 | ) | (907 | ) | |||||||||
Real estate | |||||||||||||||||||
Construction | (18 | ) | (191 | ) | — | (533 | ) | (799 | ) | ||||||||||
Residential (1-4 family) | (659 | ) | (163 | ) | (149 | ) | (2,239 | ) | (983 | ) | |||||||||
Home equity Lines | (70 | ) | (174 | ) | (582 | ) | (602 | ) | (3,158 | ) | |||||||||
Multifamily | — | — | — | — | — | ||||||||||||||
Commercial | — | — | — | (134 | ) | (276 | ) | ||||||||||||
Consumer | |||||||||||||||||||
Consumer and installment loans | (2 | ) | — | (23 | ) | — | (1 | ) | |||||||||||
Overdraft protection loans | — | (2 | ) | (1 | ) | — | (2 | ) | |||||||||||
(956 | ) | (552 | ) | (3,223 | ) | (4,343 | ) | (6,126 | ) | ||||||||||
Recoveries: | |||||||||||||||||||
Commercial | 599 | 205 | 176 | 67 | 55 | ||||||||||||||
Real estate | |||||||||||||||||||
Construction | 70 | 80 | 1,040 | 151 | 65 | ||||||||||||||
Residential (1-4 family) | 28 | 32 | 40 | 197 | 197 | ||||||||||||||
Home equity Lines | 195 | 123 | 98 | 74 | 367 | ||||||||||||||
Multifamily | — | — | — | — | — | ||||||||||||||
Commercial | — | — | 20 | — | — | ||||||||||||||
Consumer | |||||||||||||||||||
Consumer and installment loans | — | — | — | 2 | 13 | ||||||||||||||
Overdraft protection loans | 2 | — | — | 1 | 2 | ||||||||||||||
894 | 440 | 1,374 | 492 | 699 | |||||||||||||||
Net charge-offs | (62 | ) | (112 | ) | (1,849 | ) | (3,851 | ) | (5,427 | ) | |||||||||
Provision for loan losses | — | — | — | 4,831 | 6,320 | ||||||||||||||
Balance at end of period | $ | 8,887 | $ | 8,949 | $ | 9,061 | $ | 10,910 | $ | 9,930 | |||||||||
Percent of net charge-offs to average total loans outstanding during the period | 0.01 | % | 0.02 | % | 0.27 | % | 0.62 | % | 0.93 | % | |||||||||
49
TABLE 12 - ALLOCATION OF THE ALLOWANCE FOR LOAN LOSSES
For the Years Ended December 31, 2015, 2014 and 2013
(in thousands)
Commercial | Real Estate | ||||||||||||||||||||||
Construction | Residential | Home Equity | Multifamily | Commercial | |||||||||||||||||||
2015 | |||||||||||||||||||||||
Allowance for credit losses: | |||||||||||||||||||||||
Beginning balance | $ | 1,158 | $ | 1,678 | $ | 2,456 | $ | 1,912 | $ | 85 | $ | 1,459 | |||||||||||
Charge-offs | (207 | ) | (18 | ) | (659 | ) | (70 | ) | — | — | |||||||||||||
Recoveries | 599 | 70 | 28 | 195 | — | — | |||||||||||||||||
Provision | (694 | ) | 67 | 52 | (382 | ) | (33 | ) | 719 | ||||||||||||||
Ending balance | $ | 856 | $ | 1,797 | $ | 1,877 | $ | 1,655 | $ | 52 | $ | 2,178 | |||||||||||
Individually evaluated for impairment | $ | 21 | $ | 113 | $ | 568 | $ | 689 | $ | — | $ | 644 | |||||||||||
Collectively evaluated for impairment | $ | 835 | $ | 1,684 | $ | 1,309 | $ | 966 | $ | 52 | $ | 1,534 | |||||||||||
Financing receivables: | |||||||||||||||||||||||
Ending balance | $ | 158,072 | $ | 190,423 | $ | 113,278 | $ | 59,098 | $ | 11,591 | $ | 290,531 | |||||||||||
Ending balance: individually evaluated for impairment | $ | 21 | $ | 1,148 | $ | 3,743 | $ | 1,440 | $ | — | $ | 2,902 | |||||||||||
Ending balance: collectively evaluated for impairment | $ | 158,051 | $ | 189,275 | $ | 109,535 | $ | 57,658 | $ | 11,591 | $ | 287,629 | |||||||||||
Consumer | Unallocated | Total | |||||||||||||||||||||
Consumer and Installment loans | Overdraft Protection | ||||||||||||||||||||||
Allowance for credit losses: | |||||||||||||||||||||||
Beginning balance | $ | 104 | $ | — | $ | 97 | $ | 8,949 | |||||||||||||||
Charge-offs | (2 | ) | — | — | (956 | ) | |||||||||||||||||
Recoveries | — | 2 | — | 894 | |||||||||||||||||||
Provision | (6 | ) | 1 | 276 | — | ||||||||||||||||||
Ending balance | $ | 96 | $ | 3 | $ | 373 | $ | 8,887 | |||||||||||||||
Individually evaluated for impairment | $ | 65 | $ | 3 | $ | — | $ | 2,103 | |||||||||||||||
Collectively evaluated for impairment | $ | 31 | $ | — | $ | 373 | $ | 6,784 | |||||||||||||||
Financing receivables: | |||||||||||||||||||||||
Ending balance | $ | 6,356 | $ | 122 | $ | — | $ | 829,471 | |||||||||||||||
Ending balance: individually evaluated for impairment | $ | 65 | $ | 3 | $ | — | $ | 9,322 | |||||||||||||||
Ending balance: collectively evaluated for impairment | $ | 6,291 | $ | 119 | $ | — | $ | 820,149 | |||||||||||||||
50
Commercial | Real Estate | ||||||||||||||||||||||
Construction | Residential | Home Equity | Multifamily | Commercial | |||||||||||||||||||
2014 | |||||||||||||||||||||||
Allowance for credit losses: | |||||||||||||||||||||||
Beginning balance | $ | 1,219 | $ | 1,978 | $ | 1,685 | $ | 2,133 | $ | 60 | $ | 1,305 | |||||||||||
Charge-offs | (22 | ) | (191 | ) | (163 | ) | (174 | ) | — | — | |||||||||||||
Recoveries | 205 | 80 | 32 | 123 | — | — | |||||||||||||||||
Provision | (244 | ) | (189 | ) | 902 | (170 | ) | 25 | 154 | ||||||||||||||
Ending balance | $ | 1,158 | $ | 1,678 | $ | 2,456 | $ | 1,912 | $ | 85 | $ | 1,459 | |||||||||||
Individually evaluated for impairment | $ | 441 | $ | 100 | $ | 1,262 | $ | 547 | $ | — | $ | 335 | |||||||||||
Collectively evaluated for impairment | $ | 717 | $ | 1,578 | $ | 1,194 | $ | 1,365 | $ | 85 | $ | 1,124 | |||||||||||
Financing receivables: | |||||||||||||||||||||||
Ending balance | $ | 138,431 | $ | 172,502 | $ | 109,404 | $ | 67,487 | $ | 21,809 | $ | 256,967 | |||||||||||
Ending balance: individually evaluated for impairment | $ | 1,550 | $ | 1,272 | $ | 7,198 | $ | 1,102 | $ | — | $ | 3,131 | |||||||||||
Ending balance: collectively evaluated for impairment | $ | 136,881 | $ | 171,230 | $ | 102,206 | $ | 66,385 | $ | 21,809 | $ | 253,836 | |||||||||||
Consumer | Unallocated | Total | |||||||||||||||||||||
Consumer and Installment loans | Overdraft Protection | ||||||||||||||||||||||
Allowance for credit losses: | |||||||||||||||||||||||
Beginning balance | $ | 99 | $ | 1 | $ | 581 | $ | 9,061 | |||||||||||||||
Charge-offs | — | (2 | ) | — | (552 | ) | |||||||||||||||||
Recoveries | — | — | — | 440 | |||||||||||||||||||
Provision | 5 | 1 | (484 | ) | — | ||||||||||||||||||
Ending balance | $ | 104 | $ | — | $ | 97 | $ | 8,949 | |||||||||||||||
Individually evaluated for impairment | $ | 75 | $ | — | $ | — | $ | 2,760 | |||||||||||||||
Collectively evaluated for impairment | $ | 29 | $ | — | $ | 97 | $ | 6,189 | |||||||||||||||
Financing receivables: | |||||||||||||||||||||||
Ending balance | $ | 5,969 | $ | 97 | $ | — | $ | 772,666 | |||||||||||||||
Ending balance: individually evaluated for impairment | $ | 76 | $ | — | $ | — | $ | 14,329 | |||||||||||||||
Ending balance: collectively evaluated for impairment | $ | 5,893 | $ | 97 | $ | — | $ | 758,337 | |||||||||||||||
51
Commercial | Real Estate | ||||||||||||||||||||||
Construction | Residential | Home Equity | Multifamily | Commercial | |||||||||||||||||||
2013 | |||||||||||||||||||||||
Allowance for credit losses: | |||||||||||||||||||||||
Beginning balance | $ | 1,750 | $ | 2,360 | $ | 1,545 | $ | 1,402 | $ | 291 | $ | 2,882 | |||||||||||
Charge-offs | (2,468 | ) | — | (149 | ) | (582 | ) | — | — | ||||||||||||||
Recoveries | 176 | 1,040 | 40 | 98 | — | 20 | |||||||||||||||||
Provision | 1,761 | (1,422 | ) | 249 | 1,215 | (231 | ) | (1,597 | ) | ||||||||||||||
Ending balance | $ | 1,219 | $ | 1,978 | $ | 1,685 | $ | 2,133 | $ | 60 | $ | 1,305 | |||||||||||
Individually evaluated for impairment | $ | 713 | $ | 736 | $ | 274 | $ | 510 | $ | — | $ | 616 | |||||||||||
Collectively evaluated for impairment | $ | 506 | $ | 1,242 | $ | 1,411 | $ | 1,623 | $ | 60 | $ | 689 | |||||||||||
Financing receivables: | |||||||||||||||||||||||
Ending balance | $ | 119,368 | $ | 155,551 | $ | 89,846 | $ | 67,177 | $ | 27,393 | $ | 250,179 | |||||||||||
Ending balance: individually evaluated for impairment | $ | 6,842 | $ | 7,095 | $ | 5,956 | $ | 1,386 | $ | 308 | $ | 5,716 | |||||||||||
Ending balance: collectively evaluated for impairment | $ | 112,526 | $ | 148,456 | $ | 83,890 | $ | 65,791 | $ | 27,085 | $ | 244,463 | |||||||||||
Consumer | Unallocated | Total | |||||||||||||||||||||
Consumer and Installment loans | Overdraft Protection | ||||||||||||||||||||||
Allowance for credit losses: | |||||||||||||||||||||||
Beginning balance | $ | 56 | $ | 1 | $ | 623 | $ | 10,910 | |||||||||||||||
Charge-offs | (23 | ) | (1 | ) | — | (3,223 | ) | ||||||||||||||||
Recoveries | — | — | — | 1,374 | |||||||||||||||||||
Provision | 66 | 1 | (42 | ) | — | ||||||||||||||||||
Ending balance | $ | 99 | $ | 1 | $ | 581 | $ | 9,061 | |||||||||||||||
Individually evaluated for impairment | $ | 84 | $ | — | $ | — | $ | 2,933 | |||||||||||||||
Collectively evaluated for impairment | $ | 15 | $ | 1 | $ | 581 | $ | 6,128 | |||||||||||||||
Financing receivables: | |||||||||||||||||||||||
Ending balance | $ | 2,911 | $ | 71 | $ | — | $ | 712,496 | |||||||||||||||
Ending balance: individually evaluated for impairment | $ | 88 | $ | — | $ | — | $ | 27,391 | |||||||||||||||
Ending balance: collectively evaluated for impairment | $ | 2,823 | $ | 71 | $ | — | $ | 685,105 | |||||||||||||||
52
Table 13 provides a breakdown of the allowance for loan losses by segment with the relative percentage of that allowance to the segment it represents.
TABLE 13 - Allocation of the Allowance for Loan Losses
2015 | 2014 | 2013 | ||||||||||||||||||
Amount | Percentage of loans in each category to total loans | Amount | Percentage of loans in each category to total loans | Amount | Percentage of loans in each category to total loans | |||||||||||||||
Commercial | $ | 855,813 | 19.1 | % | $ | 1,157,867 | 17.9 | % | $ | 1,219,255 | 16.8 | % | ||||||||
Real estate | ||||||||||||||||||||
Construction | 1,797,301 | 22.9 | % | 1,678,022 | 22.3 | % | 1,978,320 | 21.8 | % | |||||||||||
Residential (1-4 family) | 1,876,528 | 13.7 | % | 2,456,418 | 14.2 | % | 1,685,502 | 12.6 | % | |||||||||||
Home equity lines | 1,654,545 | 7.1 | % | 1,911,634 | 8.7 | % | 2,132,916 | 9.4 | % | |||||||||||
Multifamily | 52,158 | 1.4 | % | 85,056 | 2.8 | % | 59,586 | 3.9 | % | |||||||||||
Commercial | 2,177,890 | 35.0 | % | 1,458,664 | 33.3 | % | 1,305,131 | 35.1 | % | |||||||||||
Consumer | ||||||||||||||||||||
Consumer and installment loans | 96,025 | 0.8 | % | 104,661 | 0.8 | % | 99,271 | 0.4 | % | |||||||||||
Overdraft protection loans | 3,037 | — | % | 260 | — | % | 688 | — | % | |||||||||||
Unallocated | 373,902 | 96,255 | 580,700 | |||||||||||||||||
$ | 8,887,199 | 100.0 | % | $ | 8,948,837 | 100.0 | % | $ | 9,061,369 | 100.0 | % | |||||||||
Total loans held for investment outstanding * | $ | 829,269,305 | $ | 772,589,535 | $ | 712,671,467 | ||||||||||||||
Ratio of allowance for loan losses to total loans held for investment | 1.07 | % | 1.16 | % | 1.27 | % | ||||||||||||||
2012 | 2011 | |||||||||||||||||||
Amount | Percentage of loans in each category to total loans | Amount | Percentage of loans in each category to total loans | |||||||||||||||||
Commercial | $ | 1,749,641 | 13.9 | % | $ | 1,946,528 | 13.4 | % | ||||||||||||
Real estate | ||||||||||||||||||||
Construction | 2,360,707 | 23.3 | % | 1,426,135 | 22.9 | % | ||||||||||||||
Residential (1-4 family) | 1,545,315 | 14.0 | % | 2,733,263 | 14.1 | % | ||||||||||||||
Home equity lines | 1,402,448 | 10.8 | % | 1,070,309 | 12.3 | % | ||||||||||||||
Multifamily | 290,532 | 3.0 | % | 345,770 | 4.4 | % | ||||||||||||||
Commercial | 2,882,398 | 34.5 | % | 2,223,506 | 32.3 | % | ||||||||||||||
Consumer | ||||||||||||||||||||
Consumer and installment loans | 55,192 | 0.5 | % | 27,099 | 0.3 | % | ||||||||||||||
Overdraft protection loans | 501 | — | % | 4,370 | — | % | ||||||||||||||
Unallocated | 623,266 | 153,020 | ||||||||||||||||||
$ | 10,910,000 | 100.0 | % | $ | 9,930,000 | 100.0 | % | |||||||||||||
Total loans held for investment outstanding * | $ | 661,094,162 | $ | 607,612,446 | ||||||||||||||||
Ratio of allowance for loan losses to total loans held for investment | 1.65 | % | 1.63 | % | ||||||||||||||||
* | Total loans held for investment outstanding includes deferred fees net of unamortized loan (costs) of ($201,724) at December 31, 2015 and ($76,812) at December 31, 2014. |
ASSET QUALITY AND NON-PERFORMING LOANS
We identify specific credit exposures through periodic analysis of our loan portfolio and monitor general exposures from economic trends, market values and other external factors. We maintain an allowance for loan losses, which is available to absorb losses inherent in the loan portfolio. The allowance is increased by the provision for losses and by recoveries from losses. Charged-off loan balances are subtracted from the allowance. The adequacy of the allowance for loan losses is determined on a monthly basis. Various factors as defined in the previous section “Allowance and Provision for Loan Losses”
53
are considered in determining the adequacy of the allowance. Loans are generally placed on non-accrual status after they are past due for 90 days.
Non-performing loans include loans on which interest is no longer accrued, accruing loans that are contractually past due 90 days or more as to principal and interest payments, and loans classified as troubled debt restructurings. These loans are detailed in Table 14. Based on this definition total non-performing loans as a percentage of total loans were 0.53% and 0.73% at December 31, 2015 and December 31, 2014, respectively. At December 31, 2015 six of our ten troubled debt restructure loans were performing compared to all but one at December 31, 2014. Excluding performing troubled debt restructures the percentage of non-performing loans declines to 0.27% in 2015 and 0.37% in 2014.
There were twelve loans totaling $1,989,759 in non-accrual status at December 31, 2015 and thirteen loans totaling $2,704,572 in non-accrual status at December 31, 2014. All of these loans have been identified as impaired according to Accounting Standards Codification 310, Receivables. A loan is considered impaired if it is probable the lender will be unable to collect all amounts due under the contractual terms of the loan agreement. We have provided specific reserves for these non-accrual loans in our allowance for loan loss of $391,115 at December 31, 2015 and $434,058 in 2014. We recognized interest income on these loans of $11,124 and $102,265 in 2015 and 2014, respectively. Our average recorded investment in non-performing loans was $2,058,734 in 2015 and $2,403,208 in 2014.
There were two loans totaling $248,326 on accrual status and past due 90 days or more at December 31, 2015 and one loan for $174,976 at December 31, 2014. There were no assets classified as other real estate at December 31, 2015 and one asset in other real estate totaling $144,000 at December 31, 2014.
54
Table 14 - NONPERFORMING ASSETS
Amounts are in thousands, except ratios
December 31, | |||||||||||||||||||
2015 | 2014 | 2013 | 2012 | 2011 | |||||||||||||||
Non-accruing loans: | |||||||||||||||||||
Commercial | $ | 21 | $ | 582 | $ | — | $ | — | $ | 1,022 | |||||||||
Real estate | |||||||||||||||||||
Construction | 102 | 213 | 358 | 1,028 | 129 | ||||||||||||||
Residential (1-4 family) | 313 | 1,245 | 826 | 931 | 1,224 | ||||||||||||||
Home equity Lines | 484 | 250 | 552 | 586 | 857 | ||||||||||||||
Multifamily | — | — | — | — | — | ||||||||||||||
Commercial | 153 | 231 | — | 95 | 229 | ||||||||||||||
Consumer | |||||||||||||||||||
Consumer and installment loans | — | 1 | 4 | 142 | 20 | ||||||||||||||
Overdraft protection loans | — | — | — | — | — | ||||||||||||||
Total non-accruing loans | 1,073 | 2,522 | 1,740 | 2,782 | 3,481 | ||||||||||||||
Loans past due 90 days and accruing interest: | |||||||||||||||||||
Commercial | — | — | — | — | 39 | ||||||||||||||
Real estate | |||||||||||||||||||
Construction | — | — | — | — | — | ||||||||||||||
Residential (1-4 family) | 248 | 175 | 472 | — | 139 | ||||||||||||||
Home equity Lines | — | — | — | — | — | ||||||||||||||
Multifamily | — | — | — | — | — | ||||||||||||||
Commercial | — | — | — | 153 | — | ||||||||||||||
Consumer | |||||||||||||||||||
Consumer and installment loans | — | — | — | — | — | ||||||||||||||
Overdraft protection loans | — | — | — | — | — | ||||||||||||||
Total past due loans | 248 | 175 | 472 | 153 | 178 | ||||||||||||||
Restructured loans - non-accruing | |||||||||||||||||||
Commercial | — | — | — | 617 | 633 | ||||||||||||||
Real estate | |||||||||||||||||||
Construction | — | — | — | — | — | ||||||||||||||
Residential (1-4 family) | 696 | 183 | — | — | — | ||||||||||||||
Home equity Lines | — | — | — | — | — | ||||||||||||||
Multifamily | — | — | — | — | — | ||||||||||||||
Commercial | 221 | — | — | — | — | ||||||||||||||
Consumer | |||||||||||||||||||
Consumer and installment loans | — | — | — | — | — | ||||||||||||||
Overdraft protection loans | — | — | — | — | — | ||||||||||||||
Total restructured loans past due | 917 | 183 | — | 617 | 633 | ||||||||||||||
Foreclosed property | — | 144 | 302 | — | 3,369 | ||||||||||||||
Total non-accruing nonperforming assets | $ | 2,238 | $ | 3,024 | $ | 2,514 | $ | 3,552 | $ | 7,661 | |||||||||
Restructured loans - accruing | |||||||||||||||||||
Commercial | — | — | — | — | — | ||||||||||||||
Real estate | |||||||||||||||||||
Construction | — | — | — | — | — | ||||||||||||||
Residential (1-4 family) | 785 | 1,337 | 263 | 84 | 103 | ||||||||||||||
Home equity Lines | — | — | — | — | — | ||||||||||||||
Multifamily | — | — | — | — | — | ||||||||||||||
Commercial | 1,330 | 1,333 | 4,569 | 1,404 | 1,588 | ||||||||||||||
Consumer | |||||||||||||||||||
Consumer and installment loans | 65 | 74 | 84 | — | — | ||||||||||||||
Overdraft protection loans | — | — | — | — | — | ||||||||||||||
Accruing restructured loans carried in nonperforming assets | $ | 2,180 | $ | 2,744 | $ | 4,916 | $ | 1,488 | $ | 1,691 | |||||||||
Total nonperforming assets | $ | 4,418 | $ | 5,768 | $ | 7,430 | $ | 5,040 | $ | 9,352 | |||||||||
55
December 31, | ||||||||||||||
2015 | 2014 | 2013 | 2012 | 2011 | ||||||||||
Asset Quality Ratios: | ||||||||||||||
Allowance for loan losses to period-end loans | 1.07 | % | 1.16 | % | 1.27 | % | 1.65 | % | 1.63 | % | ||||
Allowance for loan losses to non-accruing nonperforming loans | 397.09 | % | 310.77 | % | 409.63 | % | 307.15 | % | 231.36 | % | ||||
Non-accruing nonperforming assets to total assets | 0.19 | % | 0.28 | % | 0.25 | % | 0.29 | % | 0.84 | % | ||||
Nonperforming assets to total assets | 0.38 | % | 0.54 | % | 0.73 | % | 0.41 | % | 1.03 | % | ||||
There were ten restructured loans at December 31, 2015 with an investment amount of $3,096,546. We have provided specific reserves in our allowance for loan loss of $794,803 for these loans. Four restructured loans in the amount of $916,662 were not accruing at December 31, 2015. There were eight restructured loans at December 31, 2014 with an investment amount of $2,927,561. We have provided specific reserves in our allowance for loan loss of $849,886 for these loans. One restructured loan in the amount of $183,400 was not accruing at December 31, 2014.
Table 15 - NON-PERFORMING LOANS
(in thousands)
Non-Performing Loan Balances | Loan Loss Provision for Non-Performing Loans | ||||||||||||||||||||||||||||||
Loans 90 Days Past Due And Still Accruing | Nonaccrual Loans | Non-accruing Restructured Loans | Accruing Restructured Loans | Total Non-Performing Loans | Loan Loss Allowance Provided | Loan Balance With Loan Loss Allowance | Loan Balance Without Loan Loss Allowance | ||||||||||||||||||||||||
December 31, 2015 | |||||||||||||||||||||||||||||||
Commercial | $ | — | $ | 21 | $ | — | $ | — | $ | 21 | $ | 21 | $ | 21 | $ | — | |||||||||||||||
Real estate | |||||||||||||||||||||||||||||||
Construction | — | 102 | — | — | 102 | 87 | 102 | — | |||||||||||||||||||||||
Residential (1-4 family) | 248 | 313 | 696 | 785 | 2,042 | 408 | 1,324 | 718 | |||||||||||||||||||||||
Home equity lines | — | 484 | — | — | 484 | 133 | 250 | 234 | |||||||||||||||||||||||
Multifamily | — | — | — | — | — | — | — | — | |||||||||||||||||||||||
Commercial | — | 153 | 221 | 1,330 | 1,704 | 326 | 1,550 | 154 | |||||||||||||||||||||||
Consumer | |||||||||||||||||||||||||||||||
Consumer and installment loans | — | — | — | 65 | 65 | 65 | 65 | — | |||||||||||||||||||||||
Overdraft protection loans | — | — | — | — | — | — | — | — | |||||||||||||||||||||||
Total | $ | 248 | $ | 1,073 | $ | 917 | $ | 2,180 | $ | 4,418 | $ | 1,040 | $ | 3,312 | $ | 1,106 | |||||||||||||||
December 31, 2014 | |||||||||||||||||||||||||||||||
Commercial | $ | — | $ | 582 | $ | — | $ | — | $ | 582 | $ | 172 | $ | 582 | $ | — | |||||||||||||||
Real estate | |||||||||||||||||||||||||||||||
Construction | — | 213 | — | — | 213 | 90 | 213 | — | |||||||||||||||||||||||
Residential (1-4 family) | 175 | 1,245 | 183 | 1,337 | 2,940 | 654 | 2,316 | 624 | |||||||||||||||||||||||
Home equity lines | — | 250 | — | — | 250 | 7 | 250 | — | |||||||||||||||||||||||
Multifamily | — | — | — | — | — | — | — | — | |||||||||||||||||||||||
Commercial | — | 231 | — | 1,333 | 1,564 | 330 | 1,564 | — | |||||||||||||||||||||||
Consumer | |||||||||||||||||||||||||||||||
Consumer and installment loans | — | 1 | — | 74 | 75 | 74 | 74 | 1 | |||||||||||||||||||||||
Overdraft protection loans | — | — | — | — | — | — | — | — | |||||||||||||||||||||||
Total | $ | 175 | $ | 2,522 | $ | 183 | $ | 2,744 | $ | 5,624 | $ | 1,327 | $ | 4,999 | $ | 625 | |||||||||||||||
56
Table 16 - NON-PERFORMING ASSETS
(in thousands)
Total Non-Performing Loans | Other Real Estate Owned | Total | |||||||||
December 31, 2015 | |||||||||||
Commercial | $ | 21 | $ | — | $ | 21 | |||||
Real estate | |||||||||||
Construction | 102 | — | 102 | ||||||||
Residential (1-4 family) | 2,042 | — | 2,042 | ||||||||
Home equity lines | 484 | — | 484 | ||||||||
Multifamily | — | — | — | ||||||||
Commercial | 1,704 | — | 1,704 | ||||||||
Consumer | |||||||||||
Consumer and installment loans | 65 | — | 65 | ||||||||
Overdraft protection loans | — | — | — | ||||||||
Total | $ | 4,418 | $ | — | $ | 4,418 | |||||
December 31, 2014 | |||||||||||
Commercial | $ | 582 | $ | — | $ | 582 | |||||
Real estate | |||||||||||
Construction | 213 | 144 | 357 | ||||||||
Residential (1-4 family) | 2,940 | — | 2,940 | ||||||||
Home equity lines | 250 | — | 250 | ||||||||
Multifamily | — | — | — | ||||||||
Commercial | 1,564 | — | 1,564 | ||||||||
Consumer | |||||||||||
Consumer and installment loans | 75 | — | 75 | ||||||||
Overdraft protection loans | — | — | — | ||||||||
Total | $ | 5,624 | $ | 144 | $ | 5,768 | |||||
DEPOSITS
Our major source of funds and liquidity is our deposit base. Deposits provide funding for our investment in loans and securities. Our primary objective is to increase core deposits as a means to fund asset growth at a lower cost. Interest paid for deposits must be managed carefully to control the level of interest expense. We offer individuals and small-to-medium sized businesses a variety of deposit accounts, including checking, savings, money market, and certificates of deposit.
Table 17 presents the average balances of deposits and the average rates paid on those deposits for the past two years (in thousands).
Table 17 - AVERAGE DEPOSITS
(in thousands)
2015 | 2014 | 2013 | ||||||||||||||||||
Average Balance | Average Rate | Average Balance | Average Rate | Average Balance | Average Rate | |||||||||||||||
Demand deposits non-interest bearing | $ | 271,586 | — | % | $ | 227,600 | — | % | $ | 210,325 | — | % | ||||||||
Demand accounts interest bearing | 55,332 | 0.12 | % | 50,027 | 0.16 | % | 49,284 | 0.19 | % | |||||||||||
Money market accounts | 375,960 | 0.35 | % | 370,998 | 0.36 | % | 347,734 | 0.42 | % | |||||||||||
Savings accounts | 19,548 | 0.28 | % | 22,992 | 0.38 | % | 22,346 | 0.41 | % | |||||||||||
Time deposits | 225,264 | 0.64 | % | 195,391 | 0.87 | % | 249,071 | 0.92 | % | |||||||||||
$ | 947,690 | 0.30 | % | $ | 867,008 | 0.37 | % | $ | 878,760 | 0.45 | % | |||||||||
57
Table 18 presents the ending balances of deposits, dollar and percentage change on those deposits for the past two years (in thousands).
Table 18 - ENDING DEPOSITS
(in thousands)
Change | |||||||||||||
2015 | 2014 | Dollar | Percent | ||||||||||
Demand deposits non-interest bearing | $ | 280,080 | $ | 235,301 | $ | 44,779 | 19.0 | % | |||||
Demand accounts interest bearing | 68,963 | 66,682 | 2,281 | 3.4 | % | ||||||||
Money market accounts | 364,893 | 369,221 | (4,328 | ) | (1.2 | )% | |||||||
Savings accounts | 19,517 | 20,003 | (486 | ) | (2.4 | )% | |||||||
Time deposits | 265,641 | 228,206 | 37,435 | 16.4 | % | ||||||||
$ | 999,094 | $ | 919,413 | $ | 79,681 | 8.7 | % | ||||||
We are continually evaluating the mix of our deposit base (time deposits versus demand, money market and savings) in relation to our funding needs and current market conditions. Demand deposit products are an area of focus due to their low cost.
Non-interest bearing demand deposits increased an average of $44.0 million, or 19.3% in 2015 and $44.8 million, or 19.0% on an annual basis. The majority of our non-interest bearing demand accounts are commercial, small business and attorney escrow accounts. Commercial accounts increased an average of $34.0 million in the past year. Small business and escrow checking increased an average of $4.0 million. On an annual basis commercial accounts increased $31.9 million, escrow checking increased $2.6 million and small business accounts declined $1.3 million. The small variation between the trending of average and ending balances in our demand accounts indicates consistent balances throughout the year. Monarch began focusing on growing low cost demand and interest bearing demand accounts several years ago. This focus has taken the form of developing a well trained, dedicated cash management team with a goal of providing high quality service and cost effective products to our commercial and small business clients, thereby growing business deposits and also obtaining their personal banking accounts in the process. Interest bearing checking accounts grew $5.3 million on average and $2.2 million year over year in 2015. The majority of the activity in interest bearing checking accounts was in personal accounts.
On average, savings account balances declined $3.4 million in 2015 but were level with prior year ending balances. The fluctuation is attributable to municipal savings. Savings accounts are typically utilized by municipalities with specific needs, such as court appointed accounts, for individuals with limited savings capacity or with specific short term goals. Both groups are looking for a place to set aside funds but are not particularly interest rate sensitive.
Money market accounts increased an average $5.0 million, or 1.3% and $4.3 million, or 1.2% on an annual basis in 2015. Our money market portfolio consists of both core and non-core accounts. Core money market accounts, which are in market individual client accounts, increased $9.2 million on average and $4.5 million annually, in 2015. Our core money market account is a multi-tiered product offering better rates than savings accounts but at higher deposit levels. It is a highly competitive product that offers more flexibility than time deposits with the benefit of rates comparable with short term time deposits. In 2015, we began increasing the rates on our core money market accounts. Our rates remain highly competitive, as is evidenced by the changes in our core money market accounts. Non-core money market account balances, which was two brokered money market accounts but decreased to one money market account late in 2015, decreased on average $4.3 million in 2015 compared to 2014, and $8.9 million on an annual basis. The balance and interest rate in the non-core money market account is controlled through contract.
Certificates of deposit of $100,000 or more are detailed in Table 19. More information on deposits $250,000 or more is contained in Note 9 to our Consolidated Financial Statements (included in Item 8. of this Form 10-K).
Certificates of deposit as of December 31, 2015 and 2014 in amounts of $100,000 and over were classified by maturity as follows:
58
Table 19 - CERTIFICATES OF DEPOSITS $100,000 AND OVER
(in thousands)
December 31, | |||||||||||||||||||||||
2015 | 2014 | ||||||||||||||||||||||
Combined | Core | Brokered | Combined | Core | Brokered | ||||||||||||||||||
3 months or less | $ | 122,704 | $ | 9,800 | $ | 112,904 | $ | 81,867 | $ | 24,163 | $ | 57,704 | |||||||||||
Over 3 through 6 months | 23,785 | 17,373 | 6,412 | 18,776 | 9,051 | 9,725 | |||||||||||||||||
Over 6 through 12 months | 29,516 | 28,542 | 974 | 29,087 | 22,976 | 6,111 | |||||||||||||||||
Over 12 months | 26,818 | 24,526 | 2,292 | 30,957 | 28,255 | 2,702 | |||||||||||||||||
$ | 202,823 | $ | 80,241 | $ | 122,582 | $ | 160,687 | $ | 84,445 | $ | 76,242 | ||||||||||||
At December 31, 2015, our brokered time deposits to total deposits ratio was 13.0% compared to 8.3% at December 31, 2014. Although brokered deposits are purchased as large denomination transactions, the majority of the underlying deposits are in denominations of less than $250,000, providing us with a balance of stability and flexibility. Brokered deposits include Certificate of Deposit Account Registry Service (“CDARS”) deposits used by municipalities and other depositors to ensure full FDIC insurance protection. We had $12.5 million in municipal deposits in CDARS at December 31, 2015 and $14.0 million one year prior. We use our brokered time deposits primarily to fund our loans held for sale portfolio. CDARS offers short term CD products called One-way Buys, which allow participants to bid weekly for available deposits at specified terms. At December 31, 2015 two of our brokered deposits totaling $60.0 million and at December 31, 2014 four of our brokered deposits totaling $54.3 million were in the form of CDARS One-way Buys with remaining terms of between 2 and 26 days. These deposits work well for Monarch because of their weekly availability, coupled with their short term, which allows us to more closely mirror the funding needs of our loans held for sale. As of December 31, 2015, our non-brokered deposits in excess of $250,000 totaled $23.0 million compared to $19.1 million one year prior.
LIQUIDITY
Liquidity represents an institution’s ability to meet present and future financial obligations through either the sale of existing assets or the acquisition of additional funds through short-term borrowings. Our liquidity is provided from cash and amounts due from banks, federal funds sold, interest-bearing deposits in other banks, repayments from loans, increases in deposits, lines of credit from the Federal Home Loan Bank and five correspondent banks, and maturing investments. As a result of our management of liquid assets, and our ability to generate liquidity through liability funding, we believe that we maintain overall liquidity sufficient to satisfy our depositors’ requirements and to meet clients’ credit needs. We also take into account any liquidity needs generated by off-balance sheet transactions such as commitments to extend credit, commitments to purchase securities and standby letters of credit.
We monitor and plan our liquidity position for future periods. Liquidity strategies are implemented and monitored by our Asset/Liability Committee (“ALCO”). Daily and monthly liquidity positions are also monitored.
Cash, cash equivalents and federal funds sold totaled $73.9 million as of December 31, 2015, an increase of $8.5 million from the year ended December 31, 2014. At December 31, 2015, cash, securities classified as available for sale and federal funds sold were $45.4 million or 4.1% of total earning assets, compared to $39.4 million or 3.2% of total earning assets at December 31, 2014.
We are members of the Promontory Network and have access to a program through their Certificate of Deposit Account Registry Service® (“CDARS”) to use their CDARS One Way BuySM to purchase cost-effective funding without collateralization (and in lieu of generating funds through “traditional” brokered CDs or the Federal Home Loan Bank). These funds are accessed through a weekly auction. The auction typically takes place on Wednesdays, with next day settlement. There are seven maturities available ranging from 4 weeks to 5 years. If we are allotted funds in the auction, we incur no transaction fees or commissions. Although the process to compete for these deposits is different from the process for traditional brokered CDs, they are still considered brokered for regulatory purposes. These funds are subject to discretionary limitations on volume that we normally would impose on traditional brokered deposits. Based on our “well capitalized” status, we are able to draw up to 30% of assets or $348.4 million from this program at December 31, 2015. We had $115.9 million in the CDARS One Way BuySM program on our balance sheet from this program at December 31, 2015 and $64.5 million at December 31, 2014.
We have additional sources of liquidity available to us including the capacity to borrow additional funds through several established arrangements. Further information on Borrowings is contained in Note 10 to our Consolidated Financial Statements (included in Item 8. of this Form 10-K).
In the course of operations, due to fluctuations in loan and deposit levels, we occasionally find it necessary to purchase federal funds on a short-term basis. We maintain unsecured federal funds line arrangements with five other banks, which allow
59
us to purchase funds totaling $68,000,000. These lines mature and reprice daily. There were no federal funds purchased at December 31, 2015 or December 31, 2014.
We also have access to the Federal Reserve Bank of Richmond’s discount window should a liquidity crisis occur. We have not used this facility in the past and consider it a backup source of funds.
We are a member of the Federal Home Loan Bank of Atlanta (“FHLB”) and as such, may borrow funds under a line of credit based on criteria established by the FHLB. This line of credit would allow us to borrow up to 30% of assets, or approximately $348.4 million, if collateralized, as of December 31, 2015. This line is secured by loans held for investment, investment securities and mortgage loans held for sale. Loans held for investment consists of blanket liens on our portfolio of 1-4 family residential loans, home equity lines of credit/loans and qualifying commercial real estate loans. Combined, this amounted to a borrowing capacity of $107.3 million at December 31, 2015 and $76.0 million at December 31, 2014 . The investment securities pledged had carrying values of $78.6 thousand at December 31, 2015 and $94 thousand at December 31, 2014. This line is reduced by $8.0 million, which has been pledged as collateral for public deposits. Should we ever desire to increase the line of credit beyond the 30% limit, the FHLB would allow borrowings of up to 40% of total assets once we met specific eligibility criteria.
The mortgage loans held for sale portfolio is pledged daily under the Residential Available For Sale ("RAFS") program which uses loans that have been sold to FHLB approved investors. We are allowed to borrow up to 88% of the pledged loan amount. The RAFS program went into effect in February 2014 after the previous program was discontinued. Based on pledged collateral we had a line of $49.2 million at December 31, 2015 and $120.7 million at December 31, 2014.
We had $16 million outstanding on our primary line as of December 31, 2015. This advance, which reprices daily, matures November 3, 2016 and carried an interest rate of 0.49% on December 31, 2015. We had $1,075,497 in a fixed-term advance contract outstanding on December 31, 2014. This advance, which was used to match-fund several amortizing longer-term fixed-rate loans, was paid in full at maturity, September 28, 2015.
CAPITAL RESOURCES
We review the adequacy of our capital on an ongoing basis with reference to the size, composition, and quality of our resources and consistent with regulatory requirements and industry standards. We seek to maintain a capital structure that will assure an adequate level of capital to support anticipated asset growth and absorb potential losses.
On September 24, 2015 we announced the Board of Directors had approved the repurchase of up to five percent, or approximately 653,400 split adjusted shares, of the Company's outstanding common stock. The repurchase program, which will expire September 22, 2016, may be conducted through open market purchases or privately negotiated transactions. The timing and actual number of shares repurchased will depend on market conditions and other factors. Actual repurchase activity was conducted between October 1, 2015 and November 23, 2015 at a total cost of $797,919. Split adjusted shares repurchased totaled 65,590 leaving 587,810 shares available for future repurchase.
Period 2015 | Total Number of Common Shares Repurchased | Total Remaining Common Shares Available for Repurchase | ||||
October 1 through October 31 | 23,290 | 630,110 | ||||
November 1 through November 23 | 42,300 | 587,810 | ||||
The Federal Reserve, the Comptroller of the Currency and the Federal Deposit Insurance Bank adopted capital guidelines to supplement the existing definitions of capital for regulatory purposes and to establish minimum capital standards. Specifically, the guidelines categorize assets and off-balance sheet items into four risk-weighted categories. At December 31, 2015, the required minimum ratio of qualifying total capital to risk-weighted assets was 8%, of which 6% must be tier-one capital. Tier-one capital includes stockholders’ equity, retained earnings and a limited amount of perpetual preferred stock, less certain goodwill items. At December 31, 2015, our total risk-based capital ratio was 13.69%, which is well above the regulatory minimum of 8% and the well capitalized minimum of 10%.
In July 2013, the Federal Reserve, the Comptroller of the Currency and the Federal Deposit Insurance Bank announced the final rules for implementing the principles of the BASEL III Accords. These rules impacted the capital standards listed previously. Specifically, beginning January 2015, in addition to existing capital measurements, a new common equity Tier-one capital requirement of 4.5% was introduced. At the same time the minimum Tier-one capital ratio was increased from 4% to 6%. A capital conservation buffer, which is added to the new minimum common equity Tier-one ratio, the minimum Tier-one capital ratio and the minimum total capital ratio, will be phased in beginning January 2016 at a rate of 0.625% per year until reaching 2.5% in 2019. Failure to meet the minimum standards plus the capital conservation buffer will limit a bank's ability to make capital distributions and discretionary bonus payments.
60
BASEL III impacts all regulated banks. We have evaluated our balance sheet in light of these standards and have concluded the impact on our capital ratios are expected to be minimal because current ratios are well above the minimums established by BASEL III. The table below lists our capital results for December 31, 2015 and 2014.
Table 20 - REGULATORY CAPITAL
(Dollars in Thousands)
Actual | For Capital Adequacy Purposes | To Be Well Capitalized Under Prompt Corrective Action | ||||||||||||||||||
Amounts | Ratio | Amounts | Ratio | Amounts | Ratio | |||||||||||||||
As of December 31, 2015 | ||||||||||||||||||||
Total Risk-Based Capital Ratio | ||||||||||||||||||||
Consolidated Company | $ | 135,955 | 13.69 | % | $ | 79,411 | 8.00 | % | N/A | N/A | ||||||||||
Bank | $ | 134,953 | 13.60 | % | $ | 79,386 | 8.00 | % | $ | 99,230 | 10.00 | % | ||||||||
(Total Risk-Based Capital to Risk-Weighted Assets) | ||||||||||||||||||||
Tier 1 Risk-Based Capital Ratio | ||||||||||||||||||||
Consolidated Company | $ | 127,068 | 12.80 | % | $ | 59,558 | 6.00 | % | N/A | N/A | ||||||||||
Bank | $ | 126,066 | 12.70 | % | $ | 59,539 | 6.00 | % | $ | 79,411 | 8.00 | % | ||||||||
(Tier 1 Capital to Risk-Weighted Assets) | ||||||||||||||||||||
Common Equity Risk-Based Capital (CETI) | ||||||||||||||||||||
Consolidated Company | $ | 117,068 | 11.79 | % | $ | 44,669 | 4.50 | % | N/A | N/A | ||||||||||
Bank | $ | 126,066 | 12.70 | % | $ | 44,655 | 4.50 | % | $ | 64,501 | 6.50 | % | ||||||||
(Total Comon Equity to Risk-Weighted Assets) | ||||||||||||||||||||
Tier 1 Leverage Ratio | ||||||||||||||||||||
Consolidated Company | $ | 127,068 | 11.56 | % | $ | 43,968 | 4.00 | % | N/A | N/A | ||||||||||
Bank | $ | 126,066 | 11.48 | % | $ | 43,925 | 4.00 | % | $ | 54,907 | 5.00 | % | ||||||||
(Tier 1 Capital to Average Assets) | ||||||||||||||||||||
As of December 31, 2014 | ||||||||||||||||||||
Total Risk-Based Capital Ratio | ||||||||||||||||||||
Consolidated Company | $ | 125,728 | 13.79 | % | $ | 72,925 | 8.00 | % | N/A | N/A | ||||||||||
Bank | $ | 125,807 | 13.81 | % | $ | 72,900 | 8.00 | % | $ | 91,125 | 10.00 | % | ||||||||
(Total Risk-Based Capital to Risk-Weighted Assets) | ||||||||||||||||||||
Tier 1 Risk-Based Capital Ratio | ||||||||||||||||||||
Consolidated Company | $ | 116,779 | 12.81 | % | $ | 36,462 | 4.00 | % | N/A | N/A | ||||||||||
Bank | $ | 116,858 | 12.82 | % | $ | 36,450 | 4.00 | % | $ | 54,675 | 6.00 | % | ||||||||
(Tier 1 Capital to Risk-Weighted Assets) | ||||||||||||||||||||
Tier 1 Leverage Ratio | ||||||||||||||||||||
Consolidated Company | $ | 116,779 | 11.44 | % | $ | 40,821 | 4.00 | % | N/A | N/A | ||||||||||
Bank | $ | 116,858 | 11.45 | % | $ | 40,821 | 4.00 | % | $ | 51,026 | 5.00 | % | ||||||||
(Tier 1 Capital to Average Assets) | ||||||||||||||||||||
OFF-BALANCE SHEET TRANSACTIONS
We enter into certain financial transactions in the ordinary course of performing traditional banking services that result in off-balance sheet transactions. Our off-balance sheet transactions recognized as of December 31, 2015 were a letter of credit to secure public funds, commitments to extent credit and standby letters of credit.
Our letter of credit to secure public funds was from the Federal Home Loan Bank, and was for $8.0 million at December 31, 2015 and 2014.
We have commitments to grant loans of $266.2 million and $284.4 million at December 31, 2015 and 2014, respectively. Commitments to extend credit and unfunded commitments under existing lines of credit amounted to $150.0 million at December 31, 2015 and $148.7 million at December 31, 2014, which represent legally binding agreements to lend to clients with fixed expiration dates or other termination clauses. Since many of the commitments are expected to expire without being funded, the total commitment amounts do not necessarily represent future liquidity requirements.
Standby letters of credit are conditional commitments we issue guaranteeing the performance of a client to a third party. Those guarantees are primarily issued to support public and private borrowing arrangements. At December 31, 2015 and
61
December 31, 2014, we had $33.1 million and $29.3 million respectively, in outstanding standby letters of credit. We do not have any off-balance sheet subsidiaries or special purpose entities. There were no commitments to purchase securities at December 31, 2015 or 2014.
We and our subsidiaries have thirty-three non-cancellable leases for premises. Further information on lease commitments is contained in Note 6 to our Consolidated Financial Statements (included in Item 8. of this Form 10-K).
CONTRACTUAL OBLIGATIONS
We maintain certain contractual cash obligations that require future cash payments. Management believes we have adequate resources to fund our outstanding commitments. The following table presents our contractual obligations as of December 31, 2015.
Contractual Obligations | Payment Due By Period | ||||||||||||||||||
Total | Less Than One Year | One to Three Years | Three to Five Years | More Than Five Years | |||||||||||||||
FHLB Advances | $ | 16,000,000 | $ | 16,000,000 | $ | — | $ | — | $ | — | |||||||||
Trust Preferred Subordinated Debt | 10,000,000 | — | — | — | 10,000,000 | ||||||||||||||
Leases | 15,736,435 | 3,045,531 | 4,370,659 | 1,034,895 | 7,285,350 | ||||||||||||||
Total | $ | 41,736,435 | $ | 19,045,531 | $ | 4,370,659 | $ | 1,034,895 | $ | 17,285,350 | |||||||||
CRITICAL ACCOUNTING POLICIES
Critical accounting policies are those applications of accounting principles or practices that require considerable judgment, estimation, or sensitivity analysis by management. In the financial service industry, examples, though not an all inclusive list, of disclosures that may fall within this definition are the determination of the adequacy of the allowance for loan losses, valuation of mortgage servicing rights, valuation of derivatives or securities without a readily determinable market value, and the valuation of the fair value of intangibles and goodwill. Except for the determination of the adequacy of the allowance for loan losses, derivative financial instrument estimations and fair value estimations related to foreclosed real estate, we do not believe there are other practices or policies that require significant sensitivity analysis, judgments, or estimations.
Our financial statements are prepared in accordance with GAAP. The financial information contained within our statements is, to a significant extent, financial information that is based on measures of the financial effects of transactions and events that have already occurred. A variety of factors could affect the ultimate value that is obtained when earning income, recognizing an expense, recovering an asset or relieving a liability. In addition, GAAP itself may change from one previously acceptable method to another method. Although the economics of our transactions would be the same, the timing of events that would impact our transactions could change.
Our critical accounting policies are listed below. A summary of our significant accounting policies is set forth in Note 1 to our Consolidated Financial Statements (included in Item 8. of this Form 10-K).
Allowance for Loan Losses
Our allowance for loan losses is an estimate of the losses that may be sustained in our loan portfolio. The allowance is based on GAAP guidance which requires that losses be accrued when they have a probability of occurring and are estimable and that losses be accrued based on the differences between the value of collateral, present value of future cash flows or values that are observable in the secondary market and the loan balance.
Our allowance for loan losses has three basic components: the formula allowance, the specific allowance and the unallocated allowance. Each of these components is determined based upon estimates that can and do change when the actual events occur. The formula allowance uses a historical loss view as an indicator of future losses along with various economic factors and, as a result, could differ from the loss incurred in the future. However, since this history is updated with the most recent loss information, the errors that might otherwise occur may be mitigated. The specific allowance uses various techniques to arrive at an estimate of loss for specifically identified loans. Historical loss information, expected cash flows and fair value of collateral are used to estimate these losses. The unallocated allowance captures losses whose impact on the portfolio have occurred but have yet to be recognized in either the formula or specific allowance. The use of these values is inherently subjective, and our actual losses could be greater or less than the estimates.
Derivative Financial Instruments
We may use derivatives to manage risks related to interest rate movements. Interest rate swap contracts designated and qualifying as cash flow hedges are reported at fair value. The gain or loss on the effective portion of the hedge initially is included as a component of other comprehensive income and is subsequently reclassified into earnings when interest on the related debt is paid. We document our risk management strategy and hedge effectiveness at the inception of and during the term
62
of each hedge. Our interest rate risk management strategy is to stabilize cash flow requirements by maintaining interest rate swap contracts to convert variable-rate debt to a fixed rate and vice versa. We do not hold any interest rate swap contracts at December 31, 2015 or 2014. We do not hold or issue derivative financial instruments for trading purposes.
Commitments to fund mortgage loans are Interest Rate Lock Commitment ("IRLC") to be sold into the secondary market and forward commitments for the future delivery of these mortgage loans are free standing derivatives. The fair value of the interest rate lock is recorded at the end of the financial reporting period and adjusted for the expected exercise of the commitment before the loan is funded. In order to hedge the change in interest rates resulting from its commitments to fund the loans, the Company enters into forward commitments for the future delivery of mortgage loans. Fair value of these mortgage derivatives are estimated based on changes in mortgage interest rates from the date the interest on the loan is locked. Changes in the fair value of these derivatives are included in net gains on sale of loans.
We participate in a “mandatory” delivery program for mortgage loans. Under the mandatory delivery system, loans with interest rate locks are paired with the sale of a notional security bearing similar attributes. Interim income or loss on the pairing of the loans and securities is recorded in mortgage banking income on our income statement. In addition, at the time the loan is delivered to an investor, matched securities are repurchased and a gain or loss on the pairing is recorded in mortgage banking income on our income statement. We had $72.8 million in the mandatory delivery program at December 31, 2015 and $48.6 million at December 31, 2014.
Fair Value Measurements
Under GAAP we are permitted to choose to measure many financial instruments and certain other items at fair value. The estimation of fair value is significant to certain assets, including loans held-for-sale, available-for-sale securities, and foreclosed real estate owned. These assets are recorded at fair value or lower of cost or fair value, as applicable. The fair values of loans held-for-sale are based on commitments from investors. The fair values of available-for-sale securities are based on published market or dealer quotes for similar securities. The fair values of rate lock commitments are based on net fees currently charged to enter into similar agreements. The fair value of foreclosed real estate owned is estimated based on our evaluation of fair value of similar properties.
Fair values can be volatile and may be influenced by a number of factors, including market interest rates, prepayment speeds, discount rates, and market conditions, among others. Since these factors can change significantly and rapidly, fair values are difficult to predict and subject to material changes that could impact our financial condition and results of operation.
IMPACT OF INFLATION AND CHANGING PRICES
The majority of assets and liabilities of a financial institution are monetary in nature and therefore differ greatly from most industrial companies that have significant investments in fixed assets. The primary effects of inflation on our balance sheet are minimal, meaning that there are no substantial increases or decreases in net purchasing power over time. The most significant effect of inflation is on other expenses that tend to rise during periods of general inflation. In management's opinion, the most significant impact on financial results is changes in interest rates and the Company's ability to react to those changes. As discussed previously, management is attempting to measure, monitor and control interest rate risk.
IMPACT OF PROSPECTIVE ACCOUNTING STANDARDS
For discussion regarding the impact of new accounting standards, refer to Recent Accounting Pronouncements in Note 1 to our Consolidated Financial Statements (included in Item 8. of this Form 10-K).
63
SELECTED QUARTERLY FINANCIAL DATA
The following table presents unaudited selected quarterly financial data for 2015 and 2014.
Selected Quarterly Financial Data - Unaudited | ||||||||||||
For the Quarter Ended | ||||||||||||
Earnings (in thousands) | December 31, 2015 | September 30, 2015 | June 30, 2015 | March 31, 2015 | ||||||||
Interest income | $ | 12,050 | $ | 11,936 | $ | 12,024 | $ | 11,385 | ||||
Interest expense | (790 | ) | (810 | ) | (810 | ) | (737 | ) | ||||
Net interest income | 11,260 | 11,126 | 11,214 | 10,648 | ||||||||
Provision for loan losses | 500 | — | (250 | ) | (250 | ) | ||||||
Non-interest income | 18,483 | 20,739 | 23,626 | 22,266 | ||||||||
Non-interest expense | (25,168 | ) | (26,873 | ) | (29,154 | ) | (27,178 | ) | ||||
Pre-tax net income | 5,075 | 4,992 | 5,436 | 5,486 | ||||||||
Non-controlling interest in net income | (68 | ) | (41 | ) | (51 | ) | (32 | ) | ||||
Income taxes | (1,805 | ) | (1,823 | ) | (1,961 | ) | (1,993 | ) | ||||
Net income available to common stockholders | $ | 3,202 | $ | 3,128 | $ | 3,424 | $ | 3,461 | ||||
Per Common Share | ||||||||||||
Earnings per share - basic | $ | 0.27 | $ | 0.26 | $ | 0.29 | $ | 0.29 | ||||
Earnings per share - diluted | 0.27 | 0.26 | 0.29 | 0.29 | ||||||||
Common stock - per share dividends | 0.09 | 0.08 | 0.08 | 0.07 | ||||||||
Average basic shares outstanding | 11,856,180 | 11,864,347 | 11,836,175 | 11,801,379 | ||||||||
Average diluted shares outstanding | 11,856,180 | 11,864,347 | 11,848,826 | 11,837,888 | ||||||||
For the Quarter Ended | ||||||||||||
Earnings (in thousands) | December 31, 2014 | September 30, 2014 | June 30, 2014 | March 31, 2014 | ||||||||
Interest income | $ | 11,361 | $ | 10,639 | $ | 10,557 | $ | 10,434 | ||||
Interest expense | (786 | ) | (928 | ) | (977 | ) | (971 | ) | ||||
Net interest income | 10,575 | 9,711 | 9,580 | 9,463 | ||||||||
Provision for loan losses | — | — | — | — | ||||||||
Non-interest income | 17,373 | 17,899 | 18,499 | 13,308 | ||||||||
Non-interest expense | (23,605 | ) | (23,121 | ) | (23,007 | ) | (18,747 | ) | ||||
Pre-tax net income | 4,343 | 4,489 | 5,072 | 4,024 | ||||||||
Non-controlling interest in net income | (44 | ) | (46 | ) | (121 | ) | (16 | ) | ||||
Income taxes | (1,616 | ) | (1,635 | ) | (1,767 | ) | (1,471 | ) | ||||
Net income available to common stockholders | $ | 2,683 | $ | 2,808 | $ | 3,184 | $ | 2,537 | ||||
Per Common Share | ||||||||||||
Earnings per share - basic | $ | 0.23 | $ | 0.24 | $ | 0.27 | $ | 0.22 | ||||
Earnings per share - diluted | 0.23 | 0.24 | 0.27 | 0.22 | ||||||||
Common stock - per share dividends | 0.07 | 0.07 | 0.07 | 0.06 | ||||||||
Average basic shares outstanding | 11,681,387 | 11,698,803 | 11,682,956 | 11,629,679 | ||||||||
Average diluted shares outstanding | 11,724,460 | 11,737,558 | 11,726,239 | 11,674,797 | ||||||||
Item 7A. | Quantitative and Qualitative Disclosures about Market Risk. |
Market risk is the risk of loss in a financial instrument arising from adverse changes in market rates or prices such as interest rates, foreign currency exchange rates, commodity prices and equity prices. Our primary market risk exposure is interest rate risk. The ongoing monitoring and management of this risk is an important component of our asset/liability
64
management process, which is governed by policies established by our board of directors that are reviewed and approved annually. Our board of directors delegates responsibility for carrying out asset/liability management policies to the Asset/Liability Management Committee (“ALCO”). In this capacity, this committee develops guidelines and strategies that govern our asset/liability management related activities, based upon estimated market risk sensitivity, policy limits and overall market interest rate levels and trends.
Interest rate risk represents the sensitivity of earnings to changes in market interest rates. As interest rates change, the interest income and expense streams associated with our financial instruments also change, affecting net interest income, the primary component of our earnings. ALCO uses the results of a detailed and dynamic simulation model to quantify the estimated exposure of net interest income to sustained interest rate changes. While this committee routinely monitors simulated net interest income sensitivity over a rolling 12 and 24 month horizon, it also employs additional tools to monitor potential longer-term interest rate risk.
The results of this simulation model are presented in tables 4 and 5 included in Item 7. of this Form 10-K. This model assumes flat growth and captures the impact of changing interest rates on the interest income received and interest expense paid on all assets and liabilities reflected on our balance sheet. The simulation model is prepared and updated four times each year. This sensitivity analysis is compared to ALCO policy limits, which specify a maximum internal tolerance level for net interest income exposure over a one and two year horizon given a 400, 300, 200 and 100 basis point (bp) upward shift or a 100, or 200 basis point downward shift in interest rates. The model does simulations using two assumptions; a sudden or “shocked” one month parallel and pro rata shift in rates and a “ramped” parallel and pro rata shift in rates over a 12 month period for changes in net interest income and for 12 months for Market value of Portfolio Equity Sensitivity.
All of the shocked and ramped 12 month and 24 month period results in the net interest income simulation met the approved internal limits of our Asset Liability Management Policy. The results of changes in Market Value of Portfolio Equity Sensitivity indicate that downward shifts 100 basis points in the ramped simulation and of 200 basis points under both simulations would yield results that were not within the approved internal policy limits. We continue to focus our efforts on complying with approved limits.
The model assumes flat growth and is a “snapshot” approach that attempts to capture how the assets and liabilities that are on our balance sheet at a specific point in time, which in this case is December 31, 2015, would perform under changing rate scenarios. This approach only focuses on management’s decisions about the pricing, structure and duration of assets and liabilities to that point, filtering out the impact of future decisions. It cannot capture the impact of shifts in volume and product. Despite this flaw in the flat growth model the overall simulation is beneficial because it allows management to evaluate current strategies and determine if changes need to be made in the future with regard to those strategies.
The potential impact of rising rates on net interest income and equity is a primary concern for most members of the banking industry today, because rates have finally begun to increase. This increase comes after rates sat at a historic low long enough for assets and liabilities to re-price to the low levels creating a potential for liability sensitivity. Borrowers want to “lock in” loan rates for a longer period when rates are low because it decreases their costs. At the same time, depositors want to keep time deposits and similar savings products short so that they are not locked in to lower earnings when rates rise. This combination, if allowed to occur would create liability sensitivity, resulting in margin compression when rates rise because rates on deposits and borrowings would increase at a faster pace than rates on loans and other earning assets. Monarch has attempted to balance the desires of our clients with the realities of positioning the Bank for protection from margin compression in the future. Based on model results, Monarch’s balance sheet appears to be asset sensitive and adequately positioned to avoid margin compression when rates begin to rise.
The preceding sensitivity analysis does not represent a Bank forecast and should not be relied upon as being indicative of expected operating results. These hypothetical estimates are based upon numerous assumptions, including the nature and timing of interest rate levels including yield curve shape, asset and liability growth, prepayments on loans and securities, deposit decay rates, pricing decisions on loans and deposits, reinvestment or replacement of asset and liability cash flow. While assumptions are developed based upon current economic and local market conditions, we cannot make any assurances about the predictive nature of these assumptions, including how customer preferences or competitor influences might change.
Also, as market conditions vary from those assumed in the sensitivity analysis, actual results will also differ due to factors such as prepayment and refinancing levels likely deviating from those assumed, the varying impact of interest rate change, caps or floors on adjustable rate assets, the potential effect of changing debt service levels on clients with adjustable rate loans, depositor early withdrawals and product preference changes, and other internal and external variables. Furthermore, the sensitivity analysis does not reflect actions that our ALCO Committee might take in response to or in anticipation of changes in interest rates.
65
Item 8. | Financial Statements and Supplementary Data. |
MANAGEMENT'S REPORT ON INTERNAL CONTROL OVER FINANCIAL REPORTING
Our management is responsible for establishing and maintaining adequate internal control over financial reporting as defined in Rule 13a-15(f) of the Exchange Act. Internal control is designed to provide reasonable assurance regarding the reliability of financial reporting and the preparation of financial statements for external purposes in accordance with accounting principles generally accepted in the United States of America. Management regularly monitors its internal control over financial reporting and takes appropriate action to correct any deficiencies that may be identified.
Management assessed the effectiveness of the Company's internal controls over financial reporting as of December 31, 2015. This assessment was based on criteria established in Internal Controls – Integrated Framework issued by the Commission of Sponsoring Organizations ("COSO") of the Treadway Commission in 2013. Based on this assessment, management concluded that the Company's internal control over financial reporting as of December 31, 2015 was effective.
Because of its inherent limitations, internal control over financial reporting may not prevent or detect misstatements. Further, because of changes in conditions, internal control effectiveness may vary over time.
Yount, Hyde & Barbour, P.C., an independent registered public accounting firm, has audited the effectiveness of our internal control over financial reporting as of December 31, 2015, as stated in their report which is included in this annual report on Form 10-K.
/s/ BRAD E. SCHWARTZ | |
Brad E. Schwartz | |
Chief Executive Officer | |
/s/ LYNETTE P. HARRIS | |
Lynette P. Harris | |
Executive Vice President and Chief Financial Officer | |
March 11, 2016
66

Certified Public Accountants and Consultants
REPORT OF INDEPENDENT REGISTERED PUBLIC ACCOUNTING FIRM
To the Board of Directors and Stockholders
Monarch Financial Holdings, Inc.
Chesapeake, Virginia
We have audited the accompanying consolidated statements of condition of Monarch Financial Holdings, Inc. and subsidiaries as of December 31, 2015 and 2014, and the related consolidated statements of income, comprehensive income, stockholders' equity, and cash flows for each of the three years in the period ended December 31, 2015. These financial statements are the responsibility of the Company's management. Our responsibility is to express an opinion on these financial statements based on our audits.
We conducted our audits in accordance with the standards of the Public Company Accounting Oversight Board (United States). Those standards require that we plan and perform the audit to obtain reasonable assurance about whether the financial statements are free of material misstatement. An audit includes examining, on a test basis, evidence supporting the amounts and disclosures in the financial statements. An audit also includes assessing the accounting principles used and significant estimates made by management, as well as evaluating the overall financial statement presentation. We believe that our audits provide a reasonable basis for our opinion.
In our opinion, the consolidated financial statements referred to above present fairly, in all material respects, the financial position of Monarch Financial Holdings, Inc. and subsidiaries as of December 31, 2015 and 2014, and the results of their operations and their cash flows for each of the three years in the period ended December 31, 2015, in conformity with U.S. generally accepted accounting principles.
We have also audited, in accordance with the standards of the Public Company Accounting Oversight Board (United States), Monarch Financial Holdings, Inc. and subsidiaries’ internal control over financial reporting as of December 31, 2015, based on criteria established in Internal Control - Integrated Framework issued by the Committee of Sponsoring Organizations of the Treadway Commission in 2013, and our report dated March 11, 2016 expressed an unqualified opinion on the effectiveness of Monarch Financial Holdings, Inc. and subsidiaries’ internal control over financial reporting.
/s/ Yount, Hyde & Barbour, P.C.
Winchester, Virginia
March 11, 2016
67
Certified Public Accountants and Consultants
REPORT OF INDEPENDENT REGISTERED PUBLIC ACCOUNTING FIRM
To the Board of Directors and Stockholders
Monarch Financial Holdings, Inc.
Chesapeake, Virginia
We have audited Monarch Financial Holdings, Inc. and subsidiaries' internal control over financial reporting as of December 31, 2015, based on criteria established in Internal Control - Integrated Framework issued by the Committee of Sponsoring Organizations of the Treadway Commission in 2013. Monarch Financial Holdings, Inc. and subsidiaries' management is responsible for maintaining effective internal control over financial reporting and for its assessment of the effectiveness of internal control over financial reporting included in the accompanying Management’s Report on Internal Control over Financial Reporting. Our responsibility is to express an opinion on the Company's internal control over financial reporting based on our audit.
We conducted our audit in accordance with the standards of the Public Company Accounting Oversight Board (United States). Those standards require that we plan and perform the audit to obtain reasonable assurance about whether effective internal control over financial reporting was maintained in all material respects. Our audit included obtaining an understanding of internal control over financial reporting, assessing the risk that a material weakness exists, and testing and evaluating the design and operating effectiveness of internal control based on the assessed risk. Our audit also included performing such other procedures as we considered necessary in the circumstances. We believe that our audit provides a reasonable basis for our opinion.
A company's internal control over financial reporting is a process designed to provide reasonable assurance regarding the reliability of financial reporting and the preparation of financial statements for external purposes in accordance with generally accepted accounting principles. A company's internal control over financial reporting includes those policies and procedures that (a) pertain to the maintenance of records that, in reasonable detail, accurately and fairly reflect the transactions and dispositions of the assets of the company; (b) provide reasonable assurance that transactions are recorded as necessary to permit preparation of financial statements in accordance with generally accepted accounting principles, and that receipts and expenditures of the company are being made only in accordance with authorizations of management and directors of the company; and (c) provide reasonable assurance regarding prevention or timely detection of unauthorized acquisition, use, or disposition of the company's assets that could have a material effect on the financial statements.
Because of its inherent limitations, internal control over financial reporting may not prevent or detect misstatements. Also, projections of any evaluation of effectiveness to future periods are subject to the risk that controls may become inadequate because of changes in conditions, or that the degree of compliance with the policies or procedures may deteriorate.
In our opinion, Monarch Financial Holdings, Inc. and subsidiaries maintained, in all material respects, effective internal control over financial reporting as of December 31, 2015, based on criteria established in Internal Control - Integrated Framework issued by the Committee of Sponsoring Organizations of the Treadway Commission in 2013.
We have also audited, in accordance with the standards of the Public Company Accounting Oversight Board (United States), the consolidated statements of condition as of December 31, 2015 and 2014, and the related consolidated statements of income, comprehensive income, stockholders’ equity, and cash flows for each of the three years in the period ended December 31, 2015 of Monarch Financial Holdings, Inc. and subsidiaries and our report dated March 11, 2016 expressed an unqualified opinion.
/s/ Yount, Hyde & Barbour, P.C.
Winchester , Virginia
March 11, 2016
68
MONARCH FINANCIAL HOLDINGS, INC.
CONSOLIDATED STATEMENTS OF CONDITION
December 31, | |||||||
2015 | 2014 | ||||||
ASSETS: | |||||||
Cash and due from banks | $ | 13,945,507 | $ | 14,503,072 | |||
Interest bearing bank balances | 58,637,565 | 49,790,751 | |||||
Federal funds sold | 1,296,438 | 1,135,151 | |||||
Total cash and cash equivalents | 73,879,510 | 65,428,974 | |||||
Investment securities available-for-sale, at fair value | 30,213,130 | 23,725,362 | |||||
Loans held for sale, at fair value | 169,345,205 | 147,690,276 | |||||
Loans held for investment, net of unearned income | 829,269,305 | 772,589,535 | |||||
Less: allowance for loan losses | (8,887,199 | ) | (8,948,837 | ) | |||
Loans, net | 820,382,106 | 763,640,698 | |||||
Property and equipment, net | 28,971,862 | 30,247,464 | |||||
Restricted equity securities, at cost | 3,881,200 | 3,632,500 | |||||
Bank owned life insurance | 10,634,814 | 9,656,803 | |||||
Goodwill | 775,000 | 775,000 | |||||
Other real estate owned | — | 144,000 | |||||
Other assets | 23,365,328 | 21,795,897 | |||||
Total assets | $ | 1,161,448,155 | $ | 1,066,736,974 | |||
LIABILITIES: | |||||||
Deposits: | |||||||
Demand deposits - non-interest bearing | $ | 280,079,558 | $ | 235,301,171 | |||
Demand deposits - interest bearing | 68,963,364 | 66,681,905 | |||||
Savings deposits | 19,516,673 | 20,003,086 | |||||
Money market deposits | 364,893,441 | 369,221,343 | |||||
Time deposits | 265,640,562 | 228,206,408 | |||||
Total deposits | 999,093,598 | 919,413,913 | |||||
Borrowings: | |||||||
Trust preferred subordinated debt | 10,000,000 | 10,000,000 | |||||
Federal Home Loan Bank advances | 16,000,000 | 11,075,497 | |||||
Total borrowings | 26,000,000 | 21,075,497 | |||||
Other liabilities | 18,632,147 | 18,710,247 | |||||
Total liabilities | 1,043,725,745 | 959,199,657 | |||||
STOCKHOLDERS’ EQUITY: | |||||||
Preferred stock, $5 par value, 1,185,300 shares authorized; none issued | — | — | |||||
Noncumulative perpetual preferred stock, series B, liquidation value of $20.0 million, $5 par value; 800,000 shares authorized, 0 issued and outstanding at December 31, 2015 and December 31, 2014 | — | — | |||||
Common stock, $5 par value: 20,000,000 shares authorized; issued and outstanding - 11,880,909 shares (includes non-vested shares of 441,040) at December 31, 2015 and 10,652,475 shares (includes non-vested shares of 279,750) at December 31, 2014 | 57,199,345 | 51,863,625 | |||||
Additional paid-in capital | 17,241,281 | 8,335,538 | |||||
Retained earnings | 43,349,447 | 47,354,407 | |||||
Accumulated other comprehensive loss | (156,594 | ) | (102,237 | ) | |||
Total Monarch Financial Holdings, Inc. stockholders’ equity | 117,633,479 | 107,451,333 | |||||
Non-controlling interests | 88,931 | 85,984 | |||||
Total equity | 117,722,410 | 107,537,317 | |||||
Total liabilities and stockholders’ equity | $ | 1,161,448,155 | $ | 1,066,736,974 | |||
The accompanying notes are an integral part of these consolidated financial statements.
69
MONARCH FINANCIAL HOLDINGS, INC.
CONSOLIDATED STATEMENTS OF INCOME
For the Year Ended December 31, | |||||||||||
2015 | 2014 | 2013 | |||||||||
Interest income: | |||||||||||
Interest and fees on loans held for investment | $ | 40,393,696 | $ | 37,327,978 | $ | 36,645,065 | |||||
Interest on mortgage loans held for sale | 5,963,440 | 4,866,818 | 7,021,186 | ||||||||
Interest on investment securities | 324,921 | 359,604 | 230,496 | ||||||||
Interest on federal funds sold | 33,661 | 84,850 | 115,963 | ||||||||
Dividends on equity securities | 194,313 | 106,955 | 277,700 | ||||||||
Interest on other bank accounts | 485,152 | 244,702 | 58,027 | ||||||||
Total interest income | 47,395,183 | 42,990,907 | 44,348,437 | ||||||||
Interest expense: | |||||||||||
Interest on deposits | 2,868,240 | 3,185,965 | 3,936,203 | ||||||||
Interest on trust preferred subordinated debt | 191,071 | 416,233 | 491,910 | ||||||||
Interest on borrowings | 87,825 | 58,966 | 358,345 | ||||||||
Total interest expense | 3,147,136 | 3,661,164 | 4,786,458 | ||||||||
Net interest income | 44,248,047 | 39,329,743 | 39,561,979 | ||||||||
Provision for loan losses | — | — | — | ||||||||
Net interest income after provision for loan losses | 44,248,047 | 39,329,743 | 39,561,979 | ||||||||
Non-interest income: | |||||||||||
Mortgage banking income | 79,578,461 | 62,440,013 | 65,672,402 | ||||||||
Service charges and fees | 2,227,224 | 2,058,262 | 1,941,926 | ||||||||
Title income | 967,223 | 669,785 | 789,253 | ||||||||
Investment and insurance income | 1,607,823 | 1,592,398 | 1,053,429 | ||||||||
Gain (loss) on sale of assets | 140,578 | (266 | ) | 58,460 | |||||||
Gain on sale/call of securities | 22,801 | 155 | — | ||||||||
Other | 569,982 | 318,894 | 366,801 | ||||||||
Total non-interest income | 85,114,092 | 67,079,241 | 69,882,271 | ||||||||
Non-interest expenses: | |||||||||||
Salaries and employee benefits | 39,349,089 | 34,134,998 | 34,112,834 | ||||||||
Commissions | 36,995,519 | 24,754,633 | 28,344,347 | ||||||||
Loan origination expenses | 7,382,476 | 6,652,007 | 7,891,835 | ||||||||
Occupancy expenses | 5,938,736 | 6,118,265 | 5,408,567 | ||||||||
Furniture and equipment expenses | 3,503,532 | 3,430,278 | 3,041,345 | ||||||||
Marketing expense | 3,625,625 | 3,151,374 | 2,912,864 | ||||||||
Data processing services | 2,329,983 | 2,272,785 | 1,696,535 | ||||||||
Professional fees | 2,120,004 | 1,322,268 | 1,053,499 | ||||||||
Telephone | 1,373,579 | 1,226,389 | 1,184,894 | ||||||||
Foreclosed property expense | 93,949 | 77,936 | 10,118 | ||||||||
Valuation adjustments on other assets held | 100,000 | — | — | ||||||||
FDIC insurance | 558,079 | 530,486 | 567,819 | ||||||||
Other | 5,001,140 | 4,808,437 | 4,686,161 | ||||||||
Total non-interest expenses | 108,371,711 | 88,479,856 | 90,910,818 | ||||||||
Income before income taxes | 20,990,428 | 17,929,128 | 18,533,432 | ||||||||
Income tax provision | (7,583,820 | ) | (6,490,273 | ) | (6,386,040 | ) | |||||
Net income | 13,406,608 | 11,438,855 | 12,147,392 | ||||||||
Less: Net income attributable to non-controlling interests | (191,787 | ) | (227,005 | ) | (1,056,385 | ) | |||||
Net income available to common stockholders | $ | 13,214,821 | $ | 11,211,850 | $ | 11,091,007 | |||||
Basic net income per share (1) | $ | 1.12 | $ | 0.96 | $ | 0.99 | |||||
Diluted net income per share (1) | $ | 1.11 | $ | 0.96 | $ | 0.98 | |||||
(1) All per share amounts have been adjusted to reflect the 11 for 10 stock split granted December 4, 2015. | |||||||||||
The accompanying notes are an integral part of these consolidated financial statements.
70
MONARCH FINANCIAL HOLDINGS, INC.
CONSOLIDATED STATEMENTS OF COMPREHENSIVE INCOME
Year Ended December 31, | ||||||||||||
2015 | 2014 | 2013 | ||||||||||
Net Income | $ | 13,406,608 | $ | 11,438,855 | $ | 12,147,392 | ||||||
Other comprehensive income (loss): | ||||||||||||
Change in unrealized gain on interest rate swap, net of income taxes | — | 146,537 | 191,332 | |||||||||
Change in unrealized (loss) gain on securities available for sale, net of income taxes and reclassification adjustments | (66,310 | ) | 165,365 | (271,491 | ) | |||||||
Change in unrealized gain (loss) on supplemental executive retirement plan, net of income taxes | 12,197 | 5,148 | (139,315 | ) | ||||||||
Change in unrealized (loss) gain on deferred compensation asset | (244 | ) | 209 | — | ||||||||
Other comprehensive (loss) income | (54,357 | ) | 317,259 | (219,474 | ) | |||||||
Total comprehensive income | 13,352,251 | 11,756,114 | 11,927,918 | |||||||||
Less: Comprehensive income attributable to non-controlling interests | (191,787 | ) | (227,005 | ) | (1,056,385 | ) | ||||||
Comprehensive income attributable to Monarch Financial Holdings, Inc. | $ | 13,160,464 | $ | 11,529,109 | $ | 10,871,533 | ||||||
Unrealized gain on interest rate swap | $ | 225,442 | $ | 286,481 | ||||||||
Income tax expense | — | (78,905 | ) | (95,149 | ) | |||||||
Net unrealized gain on interest rate swap | $ | — | $ | 146,537 | $ | 191,332 | ||||||
Unrealized holding (loss) gain on securities available for sale | $ | (79,214 | ) | $ | 254,563 | $ | (414,465 | ) | ||||
Reclassification adjustment for realized securities gains | (22,801 | ) | (155 | ) | — | |||||||
Income tax benefit (expense) | 35,705 | (89,043 | ) | 142,974 | ||||||||
Net unrealized (loss) gain on securities available for sale | $ | (66,310 | ) | $ | 165,365 | $ | (271,491 | ) | ||||
Unrealized gain (loss) on supplemental executive retirement plan | $ | 18,765 | $ | 7,920 | $ | (214,331 | ) | |||||
Income tax (expense) benefit | (6,568 | ) | (2,772 | ) | 75,016 | |||||||
Net unrealized gain (loss) on supplemental executive retirement plan | $ | 12,197 | $ | 5,148 | $ | (139,315 | ) | |||||
Unrealized (loss) gain on deferred compensation asset | $ | (244 | ) | $ | 209 | $ | — | |||||
Net unrealized (loss) gain on deferred compensation asset | $ | (244 | ) | $ | 209 | $ | — | |||||
The accompanying notes are an integral part of these consolidated financial statements.
71
MONARCH FINANCIAL HOLDINGS, INC.
CONSOLIDATED STATEMENTS OF STOCKHOLDERS’ EQUITY
Common Stock | Additional Paid-In | Preferred | Retained | Accumulated Other Comprehensive | Non-controlling | ||||||||||||||||||||
Shares | Amount | Capital | Stock | Earnings | Income (Loss) | Interests | Total | ||||||||||||||||||
Balance - December 31, 2012 | 8,326,479 | $ | 41,632,395 | $ | 12,717,727 | $ | 2,405,615 | $ | 30,786,208 | $ | (200,022 | ) | $ | 1,604,918 | $ | 88,946,841 | |||||||||
Net income for year ended December 31, 2013 | 11,091,007 | 1,056,385 | 12,147,392 | ||||||||||||||||||||||
Other comprehensive loss | (219,474 | ) | (219,474 | ) | |||||||||||||||||||||
Stock-based compensation expense, net of forfeitures and income tax benefit | 17,400 | 87,000 | 506,721 | 593,721 | |||||||||||||||||||||
Stock options exercised, including tax benefit for exercise of options | 115,359 | 576,795 | 318,365 | 895,160 | |||||||||||||||||||||
Series B noncumulative perpetual preferred shares converted to common stock, less fractional shares | 1,804,184 | 9,020,920 | (6,615,558 | ) | (2,405,615 | ) | (253 | ) | |||||||||||||||||
Cash dividend declared on common stock ($0.22 per share) | (2,440,096 | ) | (2,440,096 | ) | |||||||||||||||||||||
Common stock issued through dividend reinvestment | 22,941 | 114,705 | 141,460 | 256,165 | |||||||||||||||||||||
Distributions to non-controlling interests | (2,433,858 | ) | (2,433,858 | ) | |||||||||||||||||||||
Balance - December 31, 2013 | 10,286,363 | $ | 51,431,815 | $ | 7,068,715 | $ | — | $ | 39,437,119 | $ | (419,496 | ) | $ | 227,445 | $ | 97,745,598 | |||||||||
Net income for year ended December 31, 2014 | 11,211,850 | 227,005 | 11,438,855 | ||||||||||||||||||||||
Other comprehensive income | 317,259 | 317,259 | |||||||||||||||||||||||
Stock-based compensation expense, net of forfeitures and income tax benefit | 17,760 | 88,800 | 735,697 | 824,497 | |||||||||||||||||||||
Stock options exercised, including tax benefit for exercise of options | 42,414 | 212,070 | 344,055 | 556,125 | |||||||||||||||||||||
Cash dividend declared on common stock ($0.28 per share) | (3,294,562 | ) | (3,294,562 | ) | |||||||||||||||||||||
Common stock issued through dividend reinvestment | 26,188 | 130,940 | 187,071 | 318,011 | |||||||||||||||||||||
Contributions from non-controlling interests | 99 | 99 | |||||||||||||||||||||||
Distributions to non-controlling interests | (368,565 | ) | (368,565 | ) | |||||||||||||||||||||
Balance - December 31, 2014 | 10,372,725 | $ | 51,863,625 | $ | 8,335,538 | $ | — | $ | 47,354,407 | $ | (102,237 | ) | $ | 85,984 | $ | 107,537,317 | |||||||||
Net income for the year ended December 31, 2015 | 13,214,821 | 191,787 | 13,406,608 | ||||||||||||||||||||||
Other comprehensive loss | (54,357 | ) | (54,357 | ) | |||||||||||||||||||||
Stock-based compensation expense, net of forfeitures and income tax benefit | 1,385 | 6,925 | 826,326 | 833,251 | |||||||||||||||||||||
Stock options exercised, including tax benefit for exercise of options | 85,916 | 429,580 | 326,658 | 756,238 | |||||||||||||||||||||
Stock dividend 11 for 10 shares, net of cash in lieu of fractional shares | 1,045,433 | 5,227,165 | 8,222,728 | (13,453,884 | ) | (3,991 | ) | ||||||||||||||||||
Cash dividend declared on common stock ($0.32 per share) | (3,765,897 | ) | (3,765,897 | ) | |||||||||||||||||||||
Common stock repurchase | (65,590 | ) | (327,950 | ) | (469,969 | ) | (797,919 | ) | |||||||||||||||||
Distributions to non-controlling interests | (188,840 | ) | (188,840 | ) | |||||||||||||||||||||
Balance— December 31, 2015 | 11,439,869 | $ | 57,199,345 | $ | 17,241,281 | $ | — | $ | 43,349,447 | $ | (156,594 | ) | $ | 88,931 | $ | 117,722,410 | |||||||||
The accompanying notes are an integral part of these consolidated financial statements.
72
MONARCH FINANCIAL HOLDINGS, INC.
CONSOLIDATED STATEMENTS OF CASH FLOWS
Year Ended December 31, | |||||||||||
2015 | 2014 | 2013 | |||||||||
Operating activities: | |||||||||||
Net income | $ | 13,406,608 | $ | 11,438,855 | $ | 12,147,392 | |||||
Adjustments to reconcile to net cash (used in) provided by operating activities: | |||||||||||
Provision for loan losses | — | — | — | ||||||||
Depreciation | 2,977,243 | 2,886,838 | 2,424,478 | ||||||||
Accretion of discounts and amortization of premiums, net | 4,664 | 4,951 | 23,091 | ||||||||
Deferral of loan fees, net of deferred (costs) | 124,912 | 251,788 | (92,506 | ) | |||||||
Amortization of intangible assets | — | 104,167 | 178,572 | ||||||||
Stock-based compensation | 833,251 | 824,497 | 621,511 | ||||||||
Appreciation of bank-owned life insurance | (273,943 | ) | (247,367 | ) | (236,377 | ) | |||||
Net (gain) loss on sale of assets | (140,578 | ) | 266 | (58,460 | ) | ||||||
Net loss on sale of other real estate | 51,035 | 6,976 | 3,020 | ||||||||
Valuation adjustment of repossessed assets | 100,000 | — | — | ||||||||
Net gain on sale/call of securities | (22,801 | ) | (155 | ) | — | ||||||
Deferred income tax (benefit) expense | (48,909 | ) | (304,779 | ) | 849,060 | ||||||
Changes in: | |||||||||||
Loans held for sale | (21,654,929 | ) | (47,972,491 | ) | 319,357,304 | ||||||
Interest receivable | (22,228 | ) | 64,252 | (193,122 | ) | ||||||
Other assets | (1,392,757 | ) | (2,836,791 | ) | 8,800,567 | ||||||
Other liabilities | (192,723 | ) | 4,160,968 | (819,660 | ) | ||||||
Net cash (used in) provided by operating activities | (6,251,155 | ) | (31,618,025 | ) | 343,004,870 | ||||||
Investing activities: | |||||||||||
Purchases of available-for-sale securities | (21,894,721 | ) | (15,346,950 | ) | (38,567,095 | ) | |||||
Proceeds from sales and maturities of available-for-sale securities | 15,317,094 | 40,692,960 | 3,941,512 | ||||||||
Proceeds from sale of other real estate | 342,965 | 1,093,272 | 92,054 | ||||||||
Proceeds from sale of assets | 185,148 | — | 381,556 | ||||||||
Purchase of bank owned life insurance | (704,068 | ) | (2,000,000 | ) | — | ||||||
Purchases of premises and equipment | (1,783,486 | ) | (4,284,773 | ) | (5,894,911 | ) | |||||
Purchase of restricted equity securities, net of redemptions | (248,700 | ) | 50,750 | 8,679,950 | |||||||
Loan originations, net of principal repayments | (57,116,320 | ) | (61,224,673 | ) | (53,730,467 | ) | |||||
Net cash used in investing activities | (65,902,088 | ) | (41,019,414 | ) | (85,097,401 | ) | |||||
Financing activities: | |||||||||||
Net increase in non-interest-bearing deposits | 44,778,387 | 28,409,672 | 16,771,004 | ||||||||
Net (decrease) increase in interest-bearing deposits | 34,901,298 | (2,114,249 | ) | (25,434,386 | ) | ||||||
Cash dividends paid on common stock | (3,765,897 | ) | (3,294,562 | ) | (2,440,096 | ) | |||||
Net increase (decrease) in FHLB advances | 4,924,503 | 9,900,012 | (193,123,038 | ) | |||||||
Net decrease in short term borrowings | — | — | (5,000,000 | ) | |||||||
Contributions from non-controlling interests | — | 99 | — | ||||||||
Distributions to non-controlling interests | (188,840 | ) | (368,565 | ) | (2,433,858 | ) | |||||
Proceeds from issuance of common stock, net of issuance costs | — | 318,011 | 256,165 | ||||||||
Proceeds from exercise of stock options | 756,238 | 304,673 | 633,737 | ||||||||
Cash paid for fractional shares | (3,991 | ) | — | (253 | ) | ||||||
Repurchase of common stock, net of repurchase costs | (797,919 | ) | — | — | |||||||
Net cash provided by (used in) financing activities | 80,603,779 | 33,155,091 | (210,770,725 | ) | |||||||
CHANGE IN CASH AND CASH EQUIVALENTS | 8,450,536 | (39,482,348 | ) | 47,136,744 | |||||||
CASH AND CASH EQUIVALENTS AT BEGINNING OF YEAR | 65,428,974 | 104,911,322 | 57,774,578 | ||||||||
CASH AND CASH EQUIVALENTS AT END OF YEAR | $ | 73,879,510 | $ | 65,428,974 | $ | 104,911,322 | |||||
MONARCH FINANCIAL HOLDINGS, INC. | |||||||||||
CONSOLIDATED STATMENTS OF CASH FLOWS - CONTINUED | |||||||||||
SUPPLEMENTAL SCHEDULES AND CASH FLOW INFORMATION | 2015 | 2014 | 2013 | ||||||||
Cash paid for: | |||||||||||
Interest on deposits and other borrowings | $ | 3,085,899 | $ | 3,676,288 | $ | 4,958,111 | |||||
Income taxes | $ | 7,601,000 | $ | 5,351,700 | $ | 7,207,630 | |||||
Loans transferred to foreclosed real estate during the year | $ | 250,000 | $ | 942,285 | $ | 397,037 | |||||
Unrealized (loss) gain on securities available for sale | $ | (107,996 | ) | $ | 254,563 | $ | (414,465 | ) | |||
Unrealized gain on interest rate swap | $ | — | $ | 225,442 | $ | 286,481 | |||||
Unrealized gain (loss) on supplemental executive retirement plan | $ | 18,765 | $ | 7,920 | $ | (214,331 | ) | ||||
Unrealized (loss) gain on mutual fund | $ | (244 | ) | $ | 209 | $ | — | ||||
The accompanying notes are an integral part of these consolidated financial statements.
73
NOTE 1 – SUMMARY OF SIGNIFICANT ACCOUNTING POLICIES
Organization and Nature of Operations: Monarch Financial Holdings, Inc. (the “Company”, "we" or “Monarch”) is a Virginia chartered Bank Holding Company that offers a full range of banking services, primarily to individuals and businesses in the Hampton Roads area of southeastern Virginia and northeastern North Carolina. On June 1, 2006, the Company was created through a reorganization plan, under the laws of the Commonwealth of Virginia, in which Monarch Bank (the “Bank”) became a wholly-owned subsidiary of Monarch Financial Holdings, Inc. Monarch Bank was incorporated on May 1, 1998, and commenced operations on April 14, 1999.
In addition to banking services, we offer financial planning, trust and investment services, under the name Monarch Bank Private Wealth, to high net worth individuals. We originate mortgage loans in both the residential and commercial markets which are then sold with servicing released. Residential services are offered under the name Monarch Mortgage and through joint ventures between Monarch Investment, LLC and a minority partner under the name Coastal Home Mortgage, LLC. Commercial mortgages are offered by the Bank’s 100% owned subsidiary, Monarch Capital, LLC. Investment services are provided under the name Monarch Investments. Residential and commercial title insurance is offered to our clients through Real Estate Security Agency, LLC, a 75% owned subsidiary.
TowneBank Merger: On December 17, 2015, the Company and Bank entered into a definitive agreement with TowneBank (“Towne”), pursuant to which Towne will acquire all of the common stock of Monarch in a stock transaction valued at approximately $221 million, based on Towne’s closing price December 16, 2015. Upon completion of the transaction, Towne expected to have approximately $7.3 billion in assets, $5.4 billion in loans and $5.8 billion in deposits.
Under the terms of the agreement, which has been approved by the Board of Directors of both companies, the share price and total deal value will be determined utilizing the conversion ratio of 0.8830 shares of Towne common stock for each share of Monarch common stock at the closing date. The transaction, which is subject to regulatory approval, the approval of the shareholders of Monarch and Towne, and other customary conditions, is expected to close in the second quarter of 2016.
Principles of Consolidation: Our consolidated financial statements include the accounts of the Company, the Bank and its subsidiaries, collectively referred to as the “Company” or “Monarch”. All significant inter-company transactions have been eliminated.
Use of Estimates: Our consolidated financial statements are prepared in conformity with accounting principles generally accepted in the United States of America and general practices within the banking industry which requires management to make estimates and assumptions that affect the reported amounts of assets and liabilities and the disclosure of contingent assets and liabilities at the date of the financial statements and the reported amounts of revenues and expenses during the period. Our actual results could differ from those estimates. Material estimates that are particularly susceptible to significant change relate to the determination of the allowance for loan losses, the fair value of derivative financial instruments and the fair values of available for sale securities.
Cash and Cash Equivalents: We define cash and cash equivalents to include currency, balances due from banks (including non-interest bearing and interest bearing deposits) and federal funds sold. We are required to maintain certain reserve balances with the Federal Reserve Bank. These required reserves were $21.2 million at December 31, 2015 and $16.8 million at December 31, 2014.
Investment Securities: Investments classified as available-for-sale are stated at fair value with unrealized holding gains and losses excluded from earnings and reported, net of deferred tax, as a component of other comprehensive income until realized. Investments in debt securities classified as held-to-maturity are stated at cost, adjusted for amortization of premiums and accretion of discounts using the interest method. Management has the positive intent and ability to hold these securities to maturity and, accordingly, adjustments are not made for temporary declines in their fair value below amortized cost.
Gains and losses on the sale of securities are determined using the specific identification method. Other-than-temporary declines in the fair value of individual available-for-sale and held-to-maturity securities below their cost, if any, are included in earnings as realized losses.
Loans Held for Sale: Loans originated and intended for sale in the secondary market are carried at fair value. The Company made this election in fiscal year 2014. Net unrealized losses, if any, are recognized through charges to income.
Loans Held for Investment: Loans are reported at their recorded investment, which is the principal outstanding balance net of charge-offs, deferred loan fees and costs on originated loans, unearned income, and unamortized premiums or discounts, if any, on purchased loans. Interest income is recognized over the term of the loan and is calculated using the simple-interest method on principal amounts outstanding. Further information on loans is contained in Note 4 to our Consolidated Financial Statements.
Deferred Loan Fees and Costs: Certain fees and costs associated with loans held for investment originations are recognized as an adjustment to interest income over the contractual life of the loans.
74
Allowance for Loan Losses: The allowance for loan losses reflects management’s judgment of probable losses inherent in the portfolio at the balance sheet date. A loan is considered impaired, based on current information and events, if it is probable we will be unable to collect the scheduled payments of principal and/or interest when due, according to the contractual terms of the loan agreement. The measurement of impaired loans is generally based on the present value of expected future cash flows discounted at the historical effective interest rate, except in the case of collateral-dependent loans which may be measured for impairment based on the fair value of the collateral. Further information on loans is contained in Note 4 to our Consolidated Financial Statements.
The establishment of the allowance for loan losses relies on a consistent process that requires multiple layers of management review and judgment and responds to changes in economic conditions, client behavior, and collateral value, among other influences. Management uses a disciplined process and methodology to establish the allowance for loan losses on a monthly basis. To determine the total allowance for loan losses, the Company estimates the reserves needed for each class of the portfolio, including loans analyzed on a pooled basis and individually.
The allowance for loan losses consists of amounts applicable to three loan types: (i) commercial loans; (ii) real estate loans; (iii) consumer loans. Loans within these types are further separated into classes. Loans are pooled by loan class and modeled utilizing historical loss experience, probable and inherent risks, and quantitative techniques which management determined fit the characteristics of that class. Additionally, loans that have been specifically identified as a credit risk due to circumstances that may affect the ability of the borrower to repay interest and/or principal are analyzed on an individual basis. Adverse circumstances may include loss of repayment source, deterioration in the estimated value of collateral, elevated trends of delinquencies, and charge-offs.
We evaluate the adequacy of the allowance for loan losses monthly in order to maintain the allowance at a level that is sufficient to absorb probable credit losses. Such factors as the level and trend of interest rates and the condition of the national and local economies are also considered. From time to time, events or economic factors may affect the loan portfolio, causing management to provide additional amounts to or release balances from the allowance for loan losses. The Company’s allowance for loan losses is sensitive to risk ratings assigned to individually evaluated loans, economic assumptions, and delinquency trends driving statistically modeled reserves. In addition, various regulatory agencies, as an integral part of their examination process, periodically review our allowance for losses on loans. Such agencies may require that we recognize additions to the allowance based on their judgments of information available to them at the time of their examination.
The allowance for loan losses is established through charges to earnings in the form of a provision for loan losses. Increases and decreases in the allowance due to changes in the measurement of impaired loans, if applicable, are included in the provision for loan losses. Impairment is measured on a loan by loan basis, by either the present value of expected future cash flows discounted to the loan’s effective interest rate, the loan’s obtainable market price, or the fair value of the collateral less costs to sell, if the loan is collateral dependent. Loans continue to be classified as impaired unless they are brought fully current and the collection of scheduled interest and principal is considered probable.
When we determine a loan or portion of a loan is not collectible, that portion is charged against the allowance. Subsequent recoveries, if any, are credited to the allowance until fully recaptured, prior to the resumption of recording additional principal curtailments and/or interest.
Loan Charge-off Policies: Our loan charge-off policy delineates between secured and unsecured loans in addition to consumer, residential real estate, and commercial and construction loans.
• | Unsecured loans are to be charged-off when they become 120 days delinquent or when it is determined that the debt is uncollectible, whichever comes first. Overdrafts are to be charged-off when it is determined a recovery is not likely or the overdraft becomes 90 days old, whichever comes first. |
• | Secured consumer loans, except those secured by the borrower’s primary or secondary residence, are to be charged-off or charged-down to net recoverable value of collateral on or before becoming 120 days past due, or whenever collection is doubtful, whichever comes first. |
• | Residential real estate loans are to be charged-off when they become 365 days delinquent. Home equity and improvement loans are to be reviewed before they become 180 days past due and are to be charged off unless they are well-secured and in process of collection. |
• | Charge-offs on commercial, commercial real estate and construction loans are to be taken promptly upon determination that all or a portion of any loan balance is uncollectible. A loan is considered uncollectible when the borrower is delinquent in principal or interest repayment and: a) the loan becomes 90 days past due, b) the borrower is unlikely to have the ability to pay the debt in a timely manner, c) the collateral value of the securing asset is insufficient to cover the outstanding indebtedness, and/or d) the guarantors do not provide adequate support for the debt. |
75
• | Charge-offs are taken immediately on any loan graded a “9” or considered statutory bad debt. Statutory bad debt exists when interest on a loan is past due and unpaid for six months and the loan is not well secured and in process of collection. |
Income Recognition on Impaired and Nonaccrual Loans: Loans, including impaired loans, are generally classified as nonaccrual if they are past due as to maturity or payment of principal and/or interest for a period of more than 90 days, unless such loans are well-secured and in the process of collection. If a loan or a portion of a loan is classified as doubtful, or is partially charged off, the loan is generally classified as nonaccrual. Loans that are on a current payment status or past due less than 90 days may also be classified as nonaccrual, if repayment in full of principal and/or interest is in doubt.
Loans may be returned to accrual status when all principal and interest amounts contractually due (including arrearages) are reasonably assured of repayment within an acceptable period of time, and there is a sustained period of repayment performance by the borrower, in accordance with the contractual terms of interest and principal.
While a loan is classified as nonaccrual and the future collectability of the recorded loan balance is doubtful, collections of interest and principal are generally applied as a reduction to principal outstanding. When the future collectability of the recorded loan balance is expected, interest income may be recognized on a cash basis. In the case where a nonaccrual loan had been partially charged off, recognition of interest on a cash basis is limited to that which would have been recognized on the recorded loan balance at the contractual interest rate. Cash receipts of interest in excess of that amount are recorded as recoveries to the allowance for loan losses until prior charge-offs have been fully recovered.
Restructured Loans: A restructured loan is an impaired loan in which it has been determined the borrower’s financial difficulties will prevent performance under the original contractual terms of the loan agreement and a concession is made with regard to those terms which would not be considered under normal circumstances.
If the value of a restructured loan is determined to be less than the recorded investment in the loan, a specific reserve in our allowance for loan loss is established for the difference between the value of the restructured loan and the recorded investment. Measurement of the value of a restructured loan is generally based on the present value of expected future cash flows discounted at the loan’s effective interest rate. Restructured loans are periodically reevaluated to determine if additional adjustments to the carrying value are necessary.
Collections of interest and principal are recorded as recoveries to the allowance for loan losses until all charged-off balances have been fully recovered.
Other Real Estate Owned: Real estate properties acquired through or in lieu of loan foreclosure are initially recorded at the fair value less estimated selling costs at the date of foreclosure. Any write-downs based on the asset’s fair value at the date of acquisition are charged to the allowance for loan losses. After foreclosure, valuations are periodically performed by management and property held for sale is carried at the lower of the new cost basis or fair value less cost to sell. Property held and used is considered impaired when the carrying amount of a property exceeds its fair value. Costs of significant property improvements are capitalized, whereas costs relating to holding property are expensed. The portion of interest costs relating to development of real estate is capitalized. Valuations are periodically performed by management, and any subsequent write-downs are recorded as a charge to operations, if necessary, to reduce the carrying value of a property to the lower of its cost or fair value less cost to sell.
Bank Owned Life Insurance: The Company has purchased life insurance policies on certain key executives. Bank owned life insurance is recorded at the amount that can be realized under the insurance contract at the balance sheet date, which is the cash surrender value adjusted for other charges or other amounts due that are probable at settlement.
Goodwill and Other Intangible Assets: Goodwill resulting from business combinations prior to January 1, 2009 represents the excess of the purchase price over the fair value of the net assets of businesses acquired. Goodwill resulting from business combinations after January 1, 2009, is generally determined as the excess of the fair value of the consideration transferred, plus the fair value of any non-controlling interests in the acquiree, over the fair value of the net assets acquired and liabilities assumed as of the acquisition date. Goodwill and intangible assets acquired in a purchase business combination and determined to have an indefinite useful life are not amortized, but tested for impairment at least annually or more frequently if events and circumstances exist that indicate a goodwill impairment test should be performed. The Company has selected December 31, as the date to perform the annual impairment test. Intangible assets with definite useful lives are amortized over their estimated useful lives to their estimated residual values. Goodwill is the only intangible asset with an indefinite life on our balance sheet.
Property and Equipment: Land is carried at cost. Property and equipment are stated at cost less accumulated depreciation. Leasehold improvements are amortized over the terms of the respective leases or the estimated useful lives of the improvement, whichever is shorter. Repairs and maintenance costs are charged to operations as incurred and additions and improvements to premises and equipment are capitalized. For financial reporting purposes, assets are depreciated using the straight-line method over their estimated useful lives, which range from 3 years to 30 years, depending on the asset type and
76
any related contracts. For income tax purposes, the accelerated cost recovery system and the modified accelerated cost recovery system are used.
Restricted Equity Securities: As a requirement for membership, we invest in the stock of the Federal Home Loan Bank of Atlanta (“FHLB”), Community Bankers Bank (“CBB”), and the Federal Reserve Bank (“FRB”). These investments are carried at cost based on the redemption provisions of these entities.
Transfers of Financial Assets: Transfers of financial assets are accounted for as sales when control over the assets has been surrendered. Control over transferred assets is deemed to be surrendered when (1) the assets have been isolated from the Company, (2) the transferee obtains the right (free of conditions that constrain it from taking advantage of that right) to pledge or exchange the transferred assets, and (3) we do not maintain effective control over the transferred assets through an agreement to repurchase them before their maturity.
Credit Related Financial Instruments: In the ordinary course of business, we have entered into commitments to extend credit, including commercial letters of credit, and standby letters of credit. Such financial instruments are recorded when they are funded.
Mortgage Banking Income: We derive our mortgage banking income from discounted fees, or points, collected on loans originated, premiums received on the sale of mortgage loans and their related servicing rights to investors, and other fees. We recognize this income, including discount fees and points, when loan rates are locked. All of these components determine the gain on sale of the underlying mortgage loans to investors.
Rate Lock Commitments: Commitments to fund mortgage loans (interest rate locks) to be sold into the secondary market and forward commitments for the future delivery of these mortgage loans are accounted for as free standing derivatives. The fair value of the interest rate lock is recorded at the time the commitment to fund the mortgage loans is executed and is adjusted for the expected exercise of the commitment before the loan is funded. In order to hedge the change in interest rates resulting from its commitments to fund the loans, the Company enters into forward commitments for the future delivery of mortgage loans when interest rate locks are entered into. Fair value of these mortgage derivatives are estimated based on changes in mortgage interest rates from the date the interest on the loan is locked. Changes in the fair value of these derivatives are included in net gains on sale of loans. The period of time between the issuance of a loan commitment and closing and sale of the loan generally ranges between 15 to 90 days.
The majority of our loans are delivered to an investor in through "best efforts". Under "best efforts" the Company protects itself from changes in interest rates by entering into loan purchase agreements with third party investors that provide for the investor to purchase loans at the same terms, including interest rate, as committed to the borrower. Under the contractual relationship with these third party investors, the Company is obligated to sell the loan to the investor, and the investor is obligated to buy the loan, only if the loan closes. No other obligation exists.
When the market is favorable, we participate in a “mandatory” delivery program for a portion of our mortgage loans. Under the mandatory delivery program, we commit to deliver loans to an investor at a preset cost prior to the close of such loans. This differs from a “best efforts” delivery, which sets the cost to the investor on a loan by loan basis when the loan is locked. Mandatory delivery creates a higher level of risk for the Company because it relies on rate lock commitments rather than closed loans, thereby exposing the Company to fluctuations in interest rate and pricing. A rate lock commitment is a binding commitment for the Company but is not binding to the client. Our client could decide, at any time, between the time of the rate lock and actual closing on their mortgage loan, not to proceed with the commitment. There is a higher occurrence of this during periods of interest rate volatility. To mitigate this risk, we pair the rate lock commitment with the sale of a notional security bearing similar attributes. At the time the loan is delivered to the investor, matched securities are repurchased. Any gains or losses associated with this pairing are recorded in mortgage banking income on our income statement as incurred. We had $72.8 million in a mandatory delivery program at December 31, 2015 and $48.6 million at December 31, 2014.
Advertising: Advertising costs, which totaled $3,625,625 in 2015, $3,151,374 in 2014, and $2,912,864 in 2013, are expensed as incurred.
Income Taxes: Deferred income tax assets and liabilities are determined using the balance sheet method. Under this method, the net deferred tax asset or liability is determined based on the tax effects of the temporary differences between the book and tax basis of the various balance sheet assets and liabilities and includes recognition to changes in current tax rates and laws.
A tax position is recognized as a benefit only if it is "more likely than not" that the tax position will be sustained in a tax examination, with a tax examination being presumed to occur. The amount recognized is the largest amount of tax benefit that is greater than 50% likely of being realized on examination. For tax positions not meeting the "more likely than not" test, no tax benefit is recorded.
77
Segment Reporting: Public business enterprises are required to report information about operating segments in financial statements and selected information about operating segments in financial reports issued to shareholders. Operating segments are components of an enterprise about which separate financial information is available that is evaluated regularly by management in determining how to allocate resources and to assess effectiveness of the segments’ performance. Generally, financial information is required to be reported on the basis that is used internally for evaluating segment performance and deciding how to allocate resources to segments. We have two reporting segments, one for general banking services and one for mortgage banking operations.
Earnings Per Share: Basic earnings per share (EPS) excludes dilution, and is computed by dividing income available to common stockholders by the weighted-average number of shares outstanding for the period. Diluted EPS reflects the potential dilution that could occur if securities or other contracts to issue common stock were exercised, converted into common stock or resulted in the issuance of common stock that then shared in the earnings of the entity.
Reclassifications: Certain immaterial reclassifications have been made to prior year’s information to conform to the current year’s presentation. Reclassifications had no impact on prior year net income or stockholders equity.
Derivative Financial Instruments and Hedging Activities: At the inception of a derivative contract, the Company designates the derivative as one of three types based on the Company's intentions and belief as to the likely effectiveness as a hedge. These three types are (1) a hedge of the fair value of a recognized asset or liability or of an unrecognized firm commitment ("fair value hedge"), (2) a hedge of a forecasted transaction or the variability of cash flows to be received or paid related to a recognized asset or liability ("cash flow hedge"), or (3) an instrument with no hedging designation ("stand-alone derivative"). For a fair value hedge, the gain or loss on the derivative, as well as the offsetting loss or gain on the hedged item, are recognized in current earnings as fair values change. For a cash flow hedge, the gain or loss on the derivative is reported in other comprehensive income and is reclassified into earnings in the same periods during which the hedged transaction affects earnings. For both types of hedges, changes in the fair value of the derivatives that are not highly effective in hedging the changes in fair value or expected cash flows of the hedged item are recognized immediately in current earnings. Changes in the fair value of derivatives that do not qualify for hedge accounting are reported currently in earnings, as non-interest income.
Net cash settlements on derivatives that qualify for hedge accounting are recorded in interest income or interest expense, based on the item being hedged. Net cash settlements on derivatives that do not qualify for hedge accounting are reported in non-interest income. Cash flows on hedges are classified in the cash flow statement the same as the cash flows of the items being hedged.
The Company formally documents the relationship between derivatives and hedged items, as well as the risk-management objective and the strategy for undertaking hedge transactions at the inception of the hedging relationship. This documentation includes linking fair value or cash flow hedges to specific assets and liabilities on the balance sheet or to specific firm commitments or forecasted transactions. The Company also formally assesses, both at the hedge's inception and on an ongoing basis, whether the derivative instruments that are used are highly effective in offsetting changes in fair values or cash flows of the hedged items. The Company discontinues hedge accounting when it determines the derivative is no longer effective in offsetting changes in the fair value or cash flows of the hedged item, the derivative is settled or terminates, a hedged forecasted transaction is no longer probable, a hedged firm commitment is no longer firm, or treatment of the derivative as a hedge is not longer appropriate or intended.
When hedge accounting is discontinued, subsequent changes in fair value of the derivatives are recorded as non-interest income. When a fair value hedge is discontinued, the hedged asset or liability is no longer adjusted for changes in fair value and the existing basis adjustment is amortized or accreted over the remaining life of the asset or liability. When a cash flow hedge is discontinued but the hedged cash flows or forecasted transactions are still expected to occur, gains or losses that were accumulated in other comprehensive income are amortized into earnings over the same periods which the hedged transactions will affect earnings.
Comprehensive Income: Accounting principles generally require that recognized revenue, expenses, gains and losses be included in net income. Although certain changes in assets and liabilities, such as unrealized gains and losses on available-for-sale securities, are reported as a separate component of the equity section of the balance sheet, such items, along with net income, are components of comprehensive income. Components of other comprehensive income in 2015, which are reported in our consolidated statements of comprehensive income, consist of unrealized gains and losses on available-for-sale securities, unrealized gains and losses on SERP and unrealized gains and losses on mutual funds. Components of other comprehensive income in 2014, which are reported in our consolidated statements of comprehensive income, consist of unrealized gains and losses on available-for-sale securities, unrealized gains and losses on SERP and a derivative financial liability related to an interest rate swap.
Stock Compensation Plans: In May 2014, our shareholders ratified the adoption of a new stock-based compensation plan to succeed the Monarch Bank 2006 Equity Incentive Plan. The 2014 Equity Incentive Plan authorizes the compensation committee to grant options, stock appreciation rights, stock awards, performance stock awards, and stock units to designated
78
directors, officers, key employees, consultants and advisers to the Company and its subsidiaries. We are authorized through the Plan to issue up to 1,000,000 shares of our common stock plus the number of shares of our common stock outstanding under the 2006 and 1999 Plans. The Plan also provides that no award may be granted more than 10 years after the May 2014 ratification date.
On January 1, 2006, we adopted Accounting Standards Codification (“ASC”) 718-10, that addresses the accounting for share-based payment transactions in which a company receives employee services in exchange for either equity instruments of the company or liabilities that are based on the fair value of the company’s equity instruments or that may be settled by the issuance of such equity instruments. ASC 718-10 requires that such transactions be accounted for using a fair-value-based method and recognized as expense in the consolidated statement of income.
Fair Value Measurements: Fair Value is the exchange price in an orderly transaction, which is not a forced liquidation or distressed sale, between market participants to sell an asset or transfer a liability in the market in which the reporting entity would transact for the asset or liability, that is, the principal or most advantageous market for the asset/liability. The transaction to sell the asset or transfer the liability is a hypothetical transaction at the measurement date, considered from the perspective of a market participant that holds the asset/liability. Fair value focuses on exit price and prioritizes, within a measurement of fair value, the use of market-based inputs over entity-specific inputs. The framework for measuring fair value is comprised of a three-level hierarchy for fair value measurements based upon the transparency of inputs to the valuation of an asset or liability as of the measurement date. A financial instrument’s categorization within the valuation hierarchy is based upon the lowest level of input that is significant to the fair value measurement.
For additional information on Fair Value Measurements see Note 18.
We review the appropriateness of our classification of assets/liabilities within the fair value hierarchy on a quarterly basis, which could cause such assets/liabilities to be reclassified among the three hierarchy levels. We use inputs that are current as of the measurement date, which may include periods of market dislocation, during which price transparency may be reduced. While we believe our valuation methods are appropriate and consistent with other market participants, the use of different methodologies, or assumptions, to determine the fair value of certain financial instruments could result in a different estimate of fair value at the reporting date. The methods used to produce a fair value calculation may not be indicative of net realizable value or reflective of future fair values.
RECENT ACCOUNTING PRONOUNCEMENTS
In June 2014, the FASB issued ASU No. 2014-12, “Compensation - Stock Compensation (Topic 718): Accounting for Share-Based Payments When the Terms of an Award Provide That a Performance Target Could Be Achieved after the Requisite Service Period.” The new guidance applies to reporting entities that grant employees share-based payments in which the terms of the award allow a performance target to be achieved after the requisite service period. The amendments in the ASU require that a performance target that affects vesting and that could be achieved after the requisite service period be treated as a performance condition. Existing guidance in “Compensation - Stock Compensation (Topic 718),” should be applied to account for these types of awards. The amendments in this ASU are effective for annual periods and interim periods within those annual periods beginning after December 15, 2015. Early adoption is permitted and reporting entities may choose to apply the amendments in the ASU either on a prospective or retrospective basis. The Company is currently assessing the impact that ASU 2014-12 will have on its consolidated financial statements.
In August 2014, the FASB issued ASU No. 2014-15, “Presentation of Financial Statements - Going Concern (Subtopic 205-40): Disclosure of Uncertainties about an Entity’s Ability to Continue as a Going Concern.” This update is intended to provide guidance about management’s responsibility to evaluate whether there is substantial doubt about an entity’s ability to continue as a going concern and to provide related footnote disclosures. Management is required under the new guidance to evaluate whether there are conditions or events, considered in the aggregate, that raise substantial doubt about the entity’s ability to continue as a going concern within one year after the date the financial statements are issued when preparing financial statements for each interim and annual reporting period. If conditions or events are identified, the ASU specifies the process that must be followed by management and also clarifies the timing and content of going concern footnote disclosures in order to reduce diversity in practice. The amendments in this ASU are effective for annual periods and interim periods within those annual periods beginning after December 15, 2016. Early adoption is permitted. The Company does not expect the adoption of ASU 2014-15 to have a material impact on its consolidated financial statements.
In November 2014, the FASB issued ASU No. 2014-16, “Derivatives and Hedging (Topic 815): Determining Whether the Host Contract in a Hybrid Financial Instrument Issued in the Form of a Share Is More Akin to Debt or to Equity.” The amendments in ASU do not change the current criteria in U.S. GAAP for determining when separation of certain embedded derivative features in a hybrid financial instrument is required. The amendments clarify how current U.S. GAAP should be interpreted in evaluating the economic characteristics and risks of a host contract in a hybrid financial instrument that is issued in the form of a share. Specifically, the amendments clarify that an entity should consider all relevant terms and features, including the embedded derivative feature being evaluated for bifurcation, in evaluating the nature of the host contract. Furthermore, the amendments clarify that no
79
single term or feature would necessarily determine the economic characteristics and risks of the host contract. Rather, the nature of the host contract depends upon the economic characteristics and risks of the entire hybrid financial instrument. The amendments in this ASU also clarify that, in evaluating the nature of a host contract, an entity should assess the substance of the relevant terms and features (i.e., the relative strength of the debt-like or equity-like terms and features given the facts and circumstances) when considering how to weight those terms and features. The amendments in this ASU are effective for public business entities for fiscal years, and interim periods within those fiscal years, beginning after December 15, 2015. Early adoption, including adoption in an interim period, is permitted. The Company does not expect the adoption of ASU 2014-16 to have a material impact on its consolidated financial statements.
In January 2015, the FASB issued ASU No. 2015-01, “Income Statement-Extraordinary and Unusual Items (Subtopic 225-20): Simplifying Income Statement Presentation by Eliminating the Concept of Extraordinary Items.” The amendments in this ASU eliminate from U.S. GAAP the concept of extraordinary items. Subtopic 225-20, Income Statement - Extraordinary and Unusual Items, required that an entity separately classify, present, and disclose extraordinary events and transactions. Presently, an event or transaction is presumed to be an ordinary and usual activity of the reporting entity unless evidence clearly supports its classification as an extraordinary item. If an event or transaction meets the criteria for extraordinary classification, an entity is required to segregate the extraordinary item from the results of ordinary operations and show the item separately in the income statement, net of tax, after income from continuing operations. The entity also is required to disclose applicable income taxes and either present or disclose earnings-per-share data applicable to the extraordinary item. The amendments in this ASU are effective for fiscal years, and interim periods within those fiscal years, beginning after December 15, 2015. Early adoption is permitted provided that the guidance is applied from the beginning of the fiscal year of adoption. The Company does not expect the adoption of ASU 2015-01 to have a material impact on its consolidated financial statements.
In February 2015, the FASB issued ASU No. 2015-02, “Consolidation (Topic 810): Amendments to the Consolidation Analysis.” The amendments in this ASU are intended to improve targeted areas of consolidation guidance for legal entities such as limited partnerships, limited liability corporations, and securitization structures (collateralized debt obligations, collateralized loan obligations, and mortgage-backed security transactions). In addition to reducing the number of consolidation models from four to two, the new standard simplifies the FASB Accounting Standards Codification™ and improves current GAAP by placing more emphasis on risk of loss when determining a controlling financial interest, reducing the frequency of the application of related-party guidance when determining a controlling financial interest in a variable interest entity (VIE), and changing consolidation conclusions for public and private companies in several industries that typically make use of limited partnerships or VIEs. The amendments in this ASU are effective for public business entities for fiscal years, and interim periods within those fiscal years, beginning after December 15, 2015. Early adoption is permitted, including adoption in an interim period. ASU 2015-02 may be applied retrospectively in previously issued financial statements for one or more years with a cumulative-effect adjustment to retained earnings as of the beginning of the first year restated. The Company does not expect the adoption of ASU 2015-02 to have a material impact on its consolidated financial statements.
In April 2015, the FASB issued ASU No. 2015-03, “Interest - Imputation of Interest (Subtopic 835-30): Simplifying the Presentation of Debt Issuance Costs.” The amendments in this ASU are intended to simplify the presentation of debt issuance costs. These amendments require that debt issuance costs related to a recognized debt liability be presented in the balance sheet as a direct deduction from the carrying amount of that debt liability, consistent with debt discounts. The recognition and measurement guidance for debt issuance costs are not affected by the amendments in this ASU. The amendments in this ASU are effective for public business entities for financial statements issued for fiscal years beginning after December 15, 2015, and interim periods within those fiscal years. Early adoption is permitted for financial statements that have not been previously issued. The Company does not expect the adoption of ASU 2015-03 to have a material impact on its consolidated financial statements.
In April 2015, the FASB issued ASU No. 2015-05, “Intangibles - Goodwill and Other - Internal-Use Software (Subtopic 350-40): Customer’s Accounting for Fees Paid in a Cloud Computing Arrangement.” The amendments in this ASU provide guidance to customers about whether a cloud computing arrangement includes a software license. If a cloud computing arrangement includes a software license, then the customer should account for the software license element of the arrangement consistent with the acquisition of other software licenses. If a cloud computing arrangement does not include a software license, the customer should account for the arrangement as a service contract. The amendments do not change the accounting for a customer’s accounting for service contracts. As a result of the amendments, all software licenses within the scope of Subtopic 350-40 will be accounted for consistent with other licenses of intangible assets. The amendments in this ASU are effective for public business entities for annual periods, including interim periods within those annual periods, beginning after December 15, 2015. Early adoption is permitted. An entity can elect to adopt the amendments either: (1) prospectively to all arrangements entered into or materially modified after the effective date; or (2) retrospectively. The Company is currently assessing the impact that ASU 2015-05 will have on its consolidated financial statements.
In May 2015, the FASB issued ASU No. 2015-08, “Business Combinations (Topic 805): Pushdown Accounting - Amendments to SEC Paragraphs Pursuant to Staff Accounting Bulletin No. 115.” The amendments in ASU 2015-08 amend various SEC
80
paragraphs pursuant to the issuance of Staff Accounting Bulletin No. 115, Topic 5: Miscellaneous Accounting, regarding various pushdown accounting issues, and did not have a material impact on our (consolidated) financial statements.
In July 2015, the FASB issued ASU No. 2015-12, “Plan Accounting: Defined Benefit Pension Plans (Topic 960), Defined Contribution Pension Plans (Topic 962), and Health and Welfare Benefit Plans (Topic 965) - 1. Fully Benefit-Responsive Investment Contracts, 2. Plan Investment Disclosures, and 3. Measurement Date Practical Expedient.” The amendments within this ASU are in 3 parts. Among other things, Part 1 amendments designate contract value as the only required measure for fully benefit-responsive investment contracts; Part II amendments eliminate the requirement that plans disclose: (a) individual investments that represent 5 percent or more of net assets available for benefits; and (b) the net appreciation or depreciation for investments by general type requirements for both participant-directed investments and nonparticipant-directed investments. Part III amendments provide a practical expedient to permit plans to measure investments and investment-related accounts (e.g., a liability for a pending trade with a broker) as of a month-end date that is closest to the plan’s fiscal year-end, when the fiscal period does not coincide with month-end. The amendments in Parts 1 and 2 of this ASU are effective on a retrospective basis and Part 3 is effective on a prospective basis, for fiscal years beginning after December 15, 2015. Early adoption is permitted. The Company is currently assessing the impact that ASU 2015-12 will have on its consolidated financial statements.
In August 2015, the FASB issued ASU No. 2015-14, “Revenue from Contracts with Customers (Topic 606): Deferral of Effective Date.” The amendments in ASU 2015-14 defer the effective date of ASU 2014-09 for all entities by one year. Public business entities, certain not-for-profit entities, and certain employee benefit plans should apply the guidance in ASU 2014-09 to annual reporting periods beginning after December 15, 2017, including interim reporting periods within that reporting period. Earlier application is permitted only as of annual reporting periods beginning after December 15, 2016, including interim reporting periods within that reporting period. All other entities should apply the guidance in ASU 2014-09 to annual reporting periods beginning after December 15, 2018, and interim reporting periods within annual reporting periods beginning after December 15, 2019. All other entities may apply the guidance in ASU 2014-09 earlier as of an annual reporting period beginning after December 15, 2016, including interim reporting periods within that reporting period. All other entities also may apply the guidance in ASU 2014-09 earlier as of an annual reporting period beginning after December 15, 2016, and interim reporting periods within annual reporting periods beginning one year after the annual reporting period in which the entity first applies the guidance in ASU 2014-09. The Company does not expect the adoption of ASU 2015-14 (or ASU 2014-09) to have a material impact on its consolidated financial statements.
In August 2015, the FASB issued ASU 2015-15, “Interest - Imputation of Interest (Subtopic 835-30) - Presentation and Subsequent Measurement of Debt Issuance Costs Associated with Line-of-Credit Arrangements (Amendments to SEC Paragraphs Pursuant to Staff Announcement at June 18, 2015 EITF Meeting).” On April 7, 2015, the FASB issued ASU 2015-03, Interest-Imputation of Interest (Subtopic 835-30): Simplifying the Presentation of Debt Issuance Costs, which requires entities to present debt issuance costs related to a recognized debt liability as a direct deduction from the carrying amount of that debt liability. The guidance in ASU 2015-03 (see paragraph 835-30-45-1A) does not address presentation or subsequent measurement of debt issuance costs related to line-of-credit arrangements. Given the absence of authoritative guidance within ASU 2015-03 for debt issuance costs related to line-of-credit arrangements, the SEC staff stated that they would not object to an entity deferring and presenting debt issuance costs as an asset and subsequently amortizing the deferred debt issuance costs ratably over the term of the line-of-credit arrangement, regardless of whether there are any outstanding borrowings on the line-of-credit arrangement. ASU 2015-15 adds these SEC comments to the "S" section of the Codification. The Company does not expect the adoption of ASU 2015-15 to have a material impact on its consolidated financial statements.
In September 2015, the FASB issued ASU 2015-16, “Business Combinations (Topic 805): Simplifying the Accounting for Measurement-Period Adjustments.” The amendments in ASU 2015-16 require that an acquirer recognize adjustments to estimated amounts that are identified during the measurement period in the reporting period in which the adjustment amounts are determined. The amendments require that the acquirer record, in the same period’s financial statements, the effect on earnings of changes in depreciation, amortization, or other income effects, if any, as a result of the change to the estimated amounts, calculated as if the accounting had been completed at the acquisition date. The amendments also require an entity to present separately on the face of the income statement or disclose in the notes the portion of the amount recorded in current-period earnings by line item that would have been recorded in previous reporting periods if the adjustment to the estimated amounts had been recognized as of the acquisition date. The amendments in this ASU are effective for public business entities for fiscal years beginning after December 15, 2015, including interim periods within those fiscal years. For all other entities, the amendments are effective for fiscal years beginning after December 15, 2016, and interim periods within fiscal years beginning after December 15, 2017. The amendments should be applied prospectively to adjustments to provisional amounts that occur after the effective date with earlier application permitted for financial statements that have not been issued. The Company does not expect the adoption of ASU 2015-16 to have a material impact on its consolidated financial statements.
In January 2016, the FASB issued ASU 2016-01, “Financial Instruments - Overall (Subtopic 825-10): Recognition and Measurement of Financial Assets and Financial Liabilities.” The amendments in ASU 2016-01, among other things: 1) Requires equity investments (except those accounted for under the equity method of accounting, or those that result in consolidation of the
81
investee) to be measured at fair value with changes in fair value recognized in net income. 2) Requires public business entities to use the exit price notion when measuring the fair value of financial instruments for disclosure purposes. 3) Requires separate presentation of financial assets and financial liabilities by measurement category and form of financial asset (i.e., securities or loans and receivables). 4) Eliminates the requirement for public business entities to disclose the method(s) and significant assumptions used to estimate the fair value that is required to be disclosed for financial instruments measured at amortized cost. The amendments in this ASU are effective for public companies for fiscal years beginning after December 15, 2017, including interim periods within those fiscal years. The Company is currently assessing the impact that ASU 2016-01 will have on its consolidated financial statements.
In February 2016, the FASB issued ASU No. 2016-02, “Leases (Topic 842).” Among other things, in the amendments in ASU 2016-02, lessees will be required to recognize the following for all leases (with the exception of short-term leases) at the commencement date: (1) A lease liability, which is a lessee‘s obligation to make lease payments arising from a lease, measured on a discounted basis; and (2) A right-of-use asset, which is an asset that represents the lessee’s right to use, or control the use of, a specified asset for the lease term. Under the new guidance, lessor accounting is largely unchanged. Certain targeted improvements were made to align, where necessary, lessor accounting with the lessee accounting model and Topic 606, Revenue from Contracts with Customers. The amendments in this ASU are effective for fiscal years beginning after December 15, 2018, including interim periods within those fiscal years. Early application is permitted upon issuance. Lessees (for capital and operating leases) and lessors (for sales-type, direct financing, and operating leases) must apply a modified retrospective transition approach for leases existing at, or entered into after, the beginning of the earliest comparative period presented in the financial statements. The modified retrospective approach would not require any transition accounting for leases that expired before the earliest comparative period presented. Lessees and lessors may not apply a full retrospective transition approach. The Company is currently assessing the impact that ASU 2016-02 will have on its consolidated financial statements.
NOTE 2 – INVESTMENT SECURITIES
Securities available-for-sale consisted of the following:
Amortized Cost | Gross Unrealized Gains | Gross Unrealized Losses | Fair Value | ||||||||||||
December 31, 2015 | |||||||||||||||
U.S. government agency obligations | $ | 26,376,230 | $ | 17,635 | $ | (157,620 | ) | $ | 26,236,245 | ||||||
Mortgage-backed securities | 995,360 | 6,216 | (3,187 | ) | 998,389 | ||||||||||
Municipal securities | 2,900,734 | 90,294 | (12,532 | ) | 2,978,496 | ||||||||||
$ | 30,272,324 | $ | 114,145 | $ | (173,339 | ) | $ | 30,213,130 | |||||||
Amortized Cost | Gross Unrealized Gains | Gross Unrealized Losses | Fair Value | ||||||||||||
December 31, 2014 | |||||||||||||||
U.S. government agency obligations | $ | 20,498,822 | $ | 41,548 | $ | (86,495 | ) | $ | 20,453,875 | ||||||
Mortgage-backed securities | 1,271,166 | 13,449 | (982 | ) | 1,283,633 | ||||||||||
Municipal securities | 1,906,572 | 97,807 | (16,525 | ) | 1,987,854 | ||||||||||
$ | 23,676,560 | $ | 152,804 | $ | (104,002 | ) | $ | 23,725,362 | |||||||
The Company did not have any held-to-maturity or trading securities at December 31, 2015 or December 31, 2014.
The amortized cost and estimated fair value of securities, all of which are classified as available for sale at December 31, 2015, by contractual maturity are shown below. Expected maturities will differ from contractual maturities because borrowers may have the right to prepay obligations with or without call or prepayment penalties.
82
Securities available-for-sale:
Amortized Cost | Fair Value | ||||||
Due in one year or less | $ | 500,000 | $ | 498,759 | |||
Due from one to five years | 27,491,647 | 27,343,236 | |||||
Due from five to ten years | 793,860 | 833,474 | |||||
Due after ten years | 1,486,817 | 1,537,661 | |||||
Total | $ | 30,272,324 | $ | 30,213,130 | |||
The gross unrealized losses in our securities portfolio at December 31, 2015 and December 31, 2014 are as follows:
As of December 31, 2015 | Less than 12 months | 12 months or more | Total | ||||||||||||||||||||
Securities Description | Fair Value | Unrealized Loss | Fair Value | Unrealized Loss | Fair Value | Unrealized Loss | |||||||||||||||||
U.S. government agency obligations | $ | 15,761,617 | $ | (134,401 | ) | $ | 2,976,782 | $ | (23,219 | ) | $ | 18,738,399 | $ | (157,620 | ) | ||||||||
Mortgage-backed securities | 684,506 | (3,187 | ) | — | — | 684,506 | (3,187 | ) | |||||||||||||||
Municipal securities | 498,715 | (1,285 | ) | 504,170 | (11,247 | ) | 1,002,885 | (12,532 | ) | ||||||||||||||
Total temporarily impaired securities | $ | 16,944,838 | $ | (138,873 | ) | $ | 3,480,952 | $ | (34,466 | ) | $ | 20,425,790 | $ | (173,339 | ) | ||||||||
As of December 31, 2014 | Less than 12 months | 12 months or more | Total | ||||||||||||||||||||
Securities Description | Fair Value | Unrealized Loss | Fair Value | Unrealized Loss | Fair Value | Unrealized Loss | |||||||||||||||||
U.S. government agency obligations | $ | 7,482,955 | $ | (18,941 | ) | $ | 6,433,135 | $ | (67,554 | ) | $ | 13,916,090 | $ | (86,495 | ) | ||||||||
Mortgage-backed securities | 338,707 | (982 | ) | — | — | 338,707 | (982 | ) | |||||||||||||||
Municipal securities | — | — | 502,135 | (16,525 | ) | 502,135 | (16,525 | ) | |||||||||||||||
Total temporarily impaired securities | $ | 7,821,662 | $ | (19,923 | ) | $ | 6,935,270 | $ | (84,079 | ) | $ | 14,756,932 | $ | (104,002 | ) | ||||||||
There are twenty-eight investments in our securities portfolio that had unrealized losses as of December 31, 2015. Of these, seven investments have been in a continuous unrealized loss position for more than 12 months. Those seven securities are as follows:
Count | Amortized Cost | Fair Value | |||||||
U.S. government agency obligations | 6 | $ | 3,000,000 | $ | 2,976,782 | ||||
Municipal securities | 1 | 515,417 | 504,170 | ||||||
Total | 7 | $ | 3,515,417 | $ | 3,480,952 | ||||
We have the ability to carry these investments to the final maturity of the instruments. Other-than-temporarily impaired (“OTTI”) guidance for investments states that an impairment is OTTI if any of the following conditions exist: the entity intends to sell the security; it is more likely than not that the entity will be required to sell the security before recovery of its amortized cost basis; or, the entity does not expect to recover the security’s entire amortized cost basis (even if the entity does not intend to sell). An impaired security identified as OTTI should be separated and losses should be recognized in earnings.
We believe the unrealized losses in our portfolio are temporary impairments, caused by liquidity discounts and increases in the risk premiums required by market participants, rather than adverse changes in cash flows or fundamental weaknesses in the credit quality of the issuer or underlying assets as of December 31, 2015. There were no losses related to OTTI recognized in accumulated other comprehensive loss at either December 31, 2015 or 2014.
U.S. government agency obligations. The unrealized losses on our U.S. government agency obligations were caused by interest rate increases. The contractual cash flows of these investments are guaranteed by the U.S. government. Accordingly, it is expected the securities would not be settled at a price less than the amortized cost bases of our investment. Because we do not intend to sell the investments and it is not more likely than not we would be required to sell the investments before the recovery of their amortized bases, which may be maturity, we do not consider those investments to be OTTI at December 31, 2015.
Mortgage-backed securities. The unrealized losses on our mortgage-backed securities were caused by interest rate increases. The cash flows of these investments are based on the repayment schedule of the underlying mortgage loans. These securities are government agency issued. Accordingly, it is expected the securities would not be settled at a price less than the
83
amortized cost bases of our investment. Because we do not intend to sell the investments and it is not more likely than not we would be required to sell the investments before the recovery of their amortized bases, which may be maturity, we do not consider those investments to be OTTI at December 31, 2015.
Municipal securities. The unrealized loss on our investment in municipal securities which is related to one security was caused by interest rate increases. This security is guaranteed by the Virginia General Assembly and the General Fund of the Commonwealth of Virginia. Accordingly, it is expected the security will not be settled at a price less than the amortized cost basis of our investment. Because the decline in market value is attributable to changes in interest rates and not credit quality, and because we do not intend to sell the investment and it is not more likely than not we will be required to sell the investment before recovery of the amortized basis, which may be maturity, we do not consider this investment to be OTTI at December 31, 2015.
All of our mortgage-backed securities are government agency issued. The carrying value of our government agency issued mortgage backed securities was $998,389 or 100% of the total mortgage-backed securities at December 31, 2015 and $1,283,633 or 100% at December 31, 2014.
Securities with carrying values of $1,571,592 were pledged to secure public deposits and borrowings from the Federal Home Loan Bank of Atlanta at December 31, 2015 and securities with carrying values of $4,570,469 were pledged to secure public deposits and borrowings from the Federal Home Loan Bank of Atlanta at December 31, 2014.
We recorded gross realized gains on the call of an available-for-sale investment of $22,801, $155 and $0 in 2015, 2014 and 2013, respectively. Proceeds from maturities, sales, pay downs and calls of investment securities were $15,317,094, $40,692,960 and $3,941,512 for 2015, 2014 and 2013, respectively.
NOTE 3 – ACCUMULATED OTHER COMPREHENSIVE LOSS
The following table presents the changes in accumulated other comprehensive income (loss), by category, net of tax:
Accumulated Other Comprehensive Income (Loss) | |||||||||||||||||||
Unrealized Loss on Supplemental Executive's Retirement Plan | Unrealized (Loss) Gain on Securities | Unrealized Loss on Interest Rate Swap | Unrealized Gain on Mutual Funds | Accumulated Other Comprehensive Loss | |||||||||||||||
Balance at December 31, 2014 | $ | (134,167 | ) | $ | 31,721 | $ | — | $ | 209 | $ | (102,237 | ) | |||||||
Net change for the year ended December 31, 2015 | 12,197 | (66,310 | ) | — | (244 | ) | (54,357 | ) | |||||||||||
Balance at December 31, 2015 | $ | (121,970 | ) | $ | (34,589 | ) | $ | — | $ | (35 | ) | $ | (156,594 | ) | |||||
Balance at December 31, 2013 | $ | (139,315 | ) | $ | (133,644 | ) | $ | (146,537 | ) | $ | — | $ | (419,496 | ) | |||||
Net change for the year ended December 31, 2014 | 5,148 | 165,365 | 146,537 | 209 | 317,259 | ||||||||||||||
Balance at December 31, 2014 | $ | (134,167 | ) | $ | 31,721 | $ | — | $ | 209 | $ | (102,237 | ) | |||||||
Balance at December 31, 2012 | $ | — | $ | 137,847 | $ | (337,869 | ) | $ | — | $ | (200,022 | ) | |||||||
Net change for the year ended December 31, 2013 | (139,315 | ) | (271,491 | ) | 191,332 | — | (219,474 | ) | |||||||||||
Balance at December 31, 2013 | $ | (139,315 | ) | $ | (133,644 | ) | $ | (146,537 | ) | $ | — | $ | (419,496 | ) | |||||
An unrealized (loss) gain of ($35) and $209 on Mutual Funds associated with the Company's Executive Savings Plan was recorded in other comprehensive loss in 2015 and 2014. The offset for this gain is carried in the investment in mutual funds on the balance sheet. An unrealized loss of $143,176, net of tax, associated with a change in the discount rate on the Company's Supplemental Executive's Retirement Plan ("SERP") from 5.85% to 4.50%, was moved into other comprehensive loss in the second quarter of 2013. Expenses of $12,197, $5,148 and $3,861 related to SERP were re-classed out of other comprehensive loss into other expense in earnings during the years ended December 31, 2015, 2014 and 2013, respectively. Security gains of $22,801, $155 and $0 were re-classed out of accumulated other comprehensive loss into gain on sale/call of securities during the years ended December 31, 2015, 2014 and 2013.
84
NOTE 4 – LOANS RECEIVABLE AND ALLOWANCE FOR LOAN LOSSES
Loans held for investment consisted of the following at December 31:
2015 | 2014 | ||||||
Commercial | $ | 158,072,698 | $ | 138,430,999 | |||
Real estate | |||||||
Construction | 190,422,992 | 172,502,330 | |||||
Residential (1-4 family) | 113,278,318 | 109,404,283 | |||||
Home equity lines | 59,097,607 | 67,487,000 | |||||
Multifamily | 11,590,641 | 21,809,189 | |||||
Commercial | 290,531,083 | 256,966,820 | |||||
Real estate subtotal | 664,920,641 | 628,169,622 | |||||
Consumer | |||||||
Consumer and installment loans | 6,356,473 | 5,968,990 | |||||
Overdraft protection loans | 121,217 | 96,736 | |||||
Loans to individuals subtotal | 6,477,690 | 6,065,726 | |||||
Total gross loans | 829,471,029 | 772,666,347 | |||||
Unamortized loan (fees) costs, net | (201,724 | ) | (76,812 | ) | |||
Loans held for investment, net of unearned | 829,269,305 | 772,589,535 | |||||
Allowance for loan losses | (8,887,199 | ) | (8,948,837 | ) | |||
Total net loans | $ | 820,382,106 | $ | 763,640,698 | |||
We have certain lending policies and procedures in place that are designed to balance loan growth and income with an acceptable level of risk. Management reviews and approves these policies and procedures on a regular basis. A reporting system supplements the review process by providing management with frequent reports related to loan production, loan quality, credit concentrations, policy exceptions, loan delinquencies and non-performing and potential problem loans. Diversification in the loan portfolio is a means of managing risk associated with fluctuations in economic conditions.
Our loans held for investment portfolio is divided into three loan types; commercial, real estate and consumer. Some of these loan types are further broken down into classes. The commercial loan portfolio, which is not broken down further, includes commercial and industrial loans which are usually secured by the assets being financed or other business assets. The real estate loan portfolio is broken down into construction, residential 1-4 family, home equity lines, multifamily, and commercial real estate loan segments. The consumer loan portfolio is segmented into consumer and installment loans and overdraft protection loans.
Commercial loans are underwritten after evaluating and understanding the borrower’s ability to operate profitably and prudently expand its business. Underwriting standards are designed to promote relationship banking rather than transactional banking. Once it is determined the borrower’s management possesses sound ethics and solid business acumen, we examine current and projected cash flows to determine the ability of the borrower to repay their obligations as agreed. Commercial and industrial loans are primarily made based on the identified cash flows of the borrower and secondarily on the underlying collateral provided by the borrower. The cash flows of borrowers, however, may not be as expected and the collateral securing these loans may fluctuate in value. Most commercial and industrial loans are secured by the assets being financed or other business assets such as accounts receivable or inventory and normally incorporate a personal guarantee; however, some short-term loans may be made on an unsecured basis. In the case of loans secured by accounts receivable, the availability of funds for the repayment of these loans may be substantially dependent on the ability of the borrower to collect amounts due from its customers.
Commercial real estate loans are subject to underwriting standards and processes similar to commercial loans, in addition to those of real estate loans. These loans are viewed primarily as cash flow loans and secondarily as loans secured by real estate. Commercial real estate lending typically involves higher loan principal amounts and the repayment of these loans is generally largely dependent on the successful operation or sale of the income producing property securing the loan or the business conducted on the property securing the loan. Commercial real estate loans may be more adversely affected by conditions in the real estate markets or in the general economy. The properties securing our commercial real estate portfolio are diverse in terms of type. This diversity helps reduce our exposure to adverse economic events that affect any single market or industry. Management monitors and evaluates commercial real estate loans based on purpose, collateral, geography, cash flow, loan to value and risk grade criteria. As a general rule, we avoid financing special purpose projects unless other underwriting factors are present to help mitigate risk. In addition, management tracks the level of owner-occupied commercial real estate
85
loans versus non-owner occupied loans. At December 31, 2015, 40% and at December 31, 2014, 44% of the outstanding principal balance of our commercial real estate loan portfolio was secured by owner-occupied properties.
With respect to loans to developers and builders that are secured by non-owner occupied properties that we may originate from time to time, we generally require the borrower to have an existing relationship with the Company and a proven record of success. Construction loans are underwritten utilizing feasibility studies, independent appraisal reviews, sensitivity analysis of absorption and lease rates and financial analysis of the developers and property owners. Construction loans are generally based on estimates of costs and value associated with the complete project. These estimates may be inaccurate. Construction loans often involve the disbursement of considerable funds with repayment substantially dependent on the success of the ultimate project. Sources of repayment for these types of loans may be pre-committed permanent loans from approved long-term lenders, sales of developed property or an interim loan commitment from the Company until permanent financing is obtained. These loans are closely monitored by on-site inspections and are considered to have higher risks than other real estate loans due to their ultimate source of repayment being sensitive to interest rate changes, supply and demand, and governmental regulation of real property, general economic conditions and the availability of long-term financing.
We generally require multifamily real estate loan borrowers to have an existing relationship with the Company, a proven record of success and guarantor financial strength, commensurate with the project size. The underlying feasibility of a multifamily project is stress tested for sensitivity to both capitalization and interest rate changes. Each project is underwritten separately and additional underwriting standards are required for the guarantors, which include, but are not limited to, a maximum loan-to-value percentage, global cash flow analysis and contingent liability analysis. Sources of repayment for these types of loans may be rent rolls or sales of the developed property, either by unit or as a whole.
Consumer and residential loan originations, including home equity lines of credit, utilize analytics to supplement the underwriting process. To monitor and manage consumer loan risk, policies and procedures are developed and modified, as needed. This monitoring, coupled with relatively small loan amounts that are spread across many individual borrowers, minimizes risk. Additionally, trend, sensitivity analysis, shock analysis and outlook reports are reviewed by management on a regular basis. Underwriting standards for home equity loans are heavily influenced by statutory requirements, which include, but are not limited to, a maximum loan-to-value percentage of 80%, collection remedies, the number of such loans a borrower can have at one time and documentation requirements.
We perform periodic reviews on various segments of our loan portfolio in addition to presenting the majority of our loan relationships for loan committee review. We utilize an independent company to perform a periodic review to evaluate and validate our credit risk program. Results of these reviews are presented to management and our board. Additionally, we are subject to annual examination by our regulators. The loan review process complements and reinforces the risk identification and assessment decisions made by lenders and credit personnel, as well as our policies and procedures.
We have an established methodology to determine the adequacy of the allowance for loan losses that assesses the risks and losses inherent in the loan portfolio. This methodology begins with a look at the three loan types; commercial, real estate, and consumer. Loans within the commercial and real estate types are evaluated on an individual or relationship basis and assigned a risk grade based on the characteristics of the loan or relationship. Loans within the consumer type are assigned risk grades and evaluated as a pool, unless specifically identified through delinquency or other signs of credit deterioration, at which time the identified loan would be individually evaluated.
We designate loans within our loans held for investment portfolio as either "pass" or "watch list" based on nine numerical risk grades which are assigned to loans. These numeric designations represent, from best to worst: (1) minimal, (2) modest, (3) average, (4) acceptable, (5) acceptable with care, (6) special mention, (7) substandard, (8) doubtful and (9) loss. Special mention, substandard, doubtful and loss risk grades are watch list. A loan risk graded as loss is generally charged-off when identified. A loan risk graded as doubtful is considered watch list and classified as nonaccrual. There were no loans in our portfolio classified as doubtful or loss on December 31, 2015 or December 31, 2014. Special mention and substandard loans are considered watch list and may or may not be classified as nonaccrual, based on current performance. Watch list graded loans or relationships are evaluated individually to determine if all, or a portion, of our investment in the borrower is at risk. If a risk is quantified, a specific loss allowance will be assigned to the identified loan or relationship. We evaluate our investment in the borrower using either the present value of expected future cash flows, discounted at the historical effective interest rate of the loan, or for a collateral-dependent loan, the fair value of the underlying collateral.
Beginning with the quarter ended March 31, 2013, we changed the methodology for evaluating additional risk inherent in our satisfactory risk grade groups which should be included in our allowance for loan losses. The prior methodology had focused on our satisfactory risk grade groups as a whole and assigned a single loss factor to this group based on a three year "look-back" at actual net charge offs in the entire portfolio. This meant all loan segments were allocated the same loss factor and the distribution of the allowance for that segment was dependent on size rather than actual losses that had occurred within the segment. Under the new methodology, loans within this group are evaluated on a pool basis by loan segment which is further delineated by purpose. Each segment is assigned an expected loss factor which is based on a moving average “look-
86
back” at our historical losses for that particular segment. In 2013, management determined it was prudent to extend the "look-back" period to a four-year average of net charge offs or sixteen quarters. In 2014, with the continued decline in net charge offs, we reexamined our loss history and determined a five year "look-back" or twenty quarter history would be a more prudent approach to modeling historical losses. Therefore, at September 30, 2014 we began extending our "look-back" period by one quarter with a goal of twenty quarters or five years by June 30, 2015. We believe this current year adjustment is a change within our methodology and not a change of the methodology itself. We completed the extension of our "look-back" period during 2015, and at December 31, 2015 the adjustment created a $291,800 decrease in the unallocated component of the allowance for loan losses. We believe this methodology provides a more accurate evaluation of the potential risk in our portfolio because the additional delineation by purpose establishes a direct correlation to areas of weakness and strength within the portfolio. For example, under our old methodology, real estate commercial loans and home equity lines were evaluated the same despite the lower historical losses in our commercial real estate portfolio, resulting in too large of an allocation to the commercial real estate portfolio and too little to the home equity segment when considering actual losses.
The portfolio mix has also changed over the past five years, with growth occurring in segments that have historically experienced lower levels of charge offs. At December 31, 2010 home equity lines totaled $81 million, or 14% of the loan portfolio while commercial real estate loans totaled $163 million, or 29% of the loan portfolio. At December 31, 2015 home equity lines had decreased to $59 million, to 9% of the portfolio and commercial real estate loans had grown to $291 million, or 33% of the loan portfolio. Simultaneously, the five year average net charge offs for home equity lines total $746.0 thousand and for commercial real estate total $78 thousand, or 33% and 3% of the five year portfolio average for net charge offs, respectively.
With the change from a single loss factor based on actual net losses for all segments, under the old model, to a more granular approach based on actual net losses by loan segment, under the current model, these trends are captured. The change has impacted the distribution of the provision expense by appropriately shifting expense away from areas with lower historical net charge offs relative to portfolio size to those with higher risk and higher incurred losses. This resulted in minimal impact of the overall provision expense. This change in methodology for evaluating additional risk inherent in our satisfactory risk groups is applied to December 31, 2015, 2014 and 2013.
Additional metrics, in the form of environmental risk factors, may be applied to a specific class or risk grade of loans within the portfolio based on local or national trends, identifiable events or other economic factors. For the years ended December 31, 2015, 2014 and 2013, nine environmental factors; five internal and four external, were applied to the general risk grade groups. The five internal environmental factors took into consideration the potential risk due to changes within the Company. These factors addressed any changes in 1.) the strength and depth of management, 2.) lending policies and procedures, 3.) the nature, volume and terms of various portfolios, 4.) the quality of loan review and 5.) the effects of concentrations of credit and changes in those levels. The four external factors considered risks associated with events and circumstances outside of Company control. The first factor addressed the potential impact of legal change, regulatory change and new competition in the market. The second factor took into consideration changes in international, national and local economic conditions. The third looked at changes in risk taken due to competitive pressure. The final external environmental factor addressed the risk associated with the government's management of fiscal policy and its potential impact on our local economy.
The assumptions used to determine the allowance are reviewed to ensure that their theoretical foundation, data integrity, computational processes, and reporting practices are appropriate and properly documented.
We utilize various sources in assessing the economic conditions in our target markets and areas of concentration. We track unemployment trends in both Hampton Roads and Virginia compared to the national average. We monitor trends in our industry and among our peers through reports such as the Uniform Bank Performance Report which are made available to us through the Federal Financial Institutions Examination Council. Additionally, we utilize various industry sources that include information published by CB Richard Ellis, an international firm specializing in commercial real estate reporting and REIS, a provider of commercial real estate information and analytics to monitor local, state and national trends.
We evaluate the adequacy of our allowance for loan losses monthly. A degree of imprecision or uncertainty is inherent in our allowance estimates because it requires that we incorporate a range of probable outcomes which may change from period to period. It requires that we exercise judgment as to the risks inherent in our portfolios, economic uncertainties, historical loss and other subjective factors, including industry trends. No single statistic or measurement determines the adequacy of the allowance for loan loss. Changes in the allowance for loan loss and the related provision expense can materially affect net income.
A summary of our loan portfolio by class and delineated between pass and watch list as of December 31, 2015 and December 31, 2014 is as follows:
87
December 31, 2015 | ||||||||||||||||||
Watch List | Weighted Average | |||||||||||||||||
Pass | Special Mention | Substandard | Total | Risk Grade | ||||||||||||||
Commercial | $ | 157,818,177 | $ | 233,073 | $ | 21,448 | $ | 158,072,698 | 3.24 | |||||||||
Real estate | ||||||||||||||||||
Construction | 189,254,940 | 710,758 | 457,294 | 190,422,992 | 3.18 | |||||||||||||
Residential (1-4 family) | 108,692,612 | 1,075,477 | 3,510,229 | 113,278,318 | 3.71 | |||||||||||||
Home equity lines | 57,657,772 | — | 1,439,835 | 59,097,607 | 4.15 | |||||||||||||
Multifamily | 11,590,641 | — | — | 11,590,641 | 3.56 | |||||||||||||
Commercial | 288,533,180 | 1,007,152 | 990,751 | 290,531,083 | 3.39 | |||||||||||||
Real estate subtotal | 655,729,145 | 2,793,387 | 6,398,109 | 664,920,641 | 3.46 | |||||||||||||
Consumer | ||||||||||||||||||
Consumer and installment loans | 6,291,430 | — | 65,043 | 6,356,473 | 4.03 | |||||||||||||
Overdraft protection loans | 118,690 | — | 2,527 | 121,217 | 4.76 | |||||||||||||
Loans to individuals subtotal | 6,410,120 | — | 67,570 | 6,477,690 | 4.04 | |||||||||||||
Total gross loans | $ | 819,957,442 | $ | 3,026,460 | $ | 6,487,127 | $ | 829,471,029 | 3.42 | |||||||||
December 31, 2014 | ||||||||||||||||||
Watch List | Weighted Average | |||||||||||||||||
Pass | Special Mention | Substandard | Total | Risk Grade | ||||||||||||||
Commercial | $ | 135,292,747 | $ | 1,588,289 | $ | 1,549,963 | $ | 138,430,999 | 3.31 | |||||||||
Real estate | ||||||||||||||||||
Construction | 171,136,553 | 93,397 | 1,272,380 | 172,502,330 | 3.26 | |||||||||||||
Residential (1-4 family) | 101,860,683 | 177,735 | 7,365,865 | 109,404,283 | 3.93 | |||||||||||||
Home equity lines | 66,282,828 | 102,575 | 1,101,597 | 67,487,000 | 4.12 | |||||||||||||
Multifamily | 19,616,130 | 2,193,059 | — | 21,809,189 | 3.53 | |||||||||||||
Commercial | 253,525,106 | 2,029,203 | 1,412,511 | 256,966,820 | 3.54 | |||||||||||||
Real estate subtotal | 612,421,300 | 4,595,969 | 11,152,353 | 628,169,622 | 3.59 | |||||||||||||
Consumer | ||||||||||||||||||
Consumer and installment loans | 5,893,286 | — | 75,704 | 5,968,990 | 4.04 | |||||||||||||
Overdraft protection loans | 96,736 | — | — | 96,736 | 4.64 | |||||||||||||
Loans to individuals subtotal | 5,990,022 | — | 75,704 | 6,065,726 | 4.05 | |||||||||||||
Total gross loans | $ | 753,704,069 | $ | 6,184,258 | $ | 12,778,020 | $ | 772,666,347 | 3.55 | |||||||||
There were no loans classified as doubtful or loss included in our loan portfolio at December 31, 2015 or December 31, 2014.
88
An aging of our loan portfolio by class as of December 31, 2015 and December 31, 2014 is as follows:
Age Analysis of Past Due Loans
30-59 Days Past Due | 60-89 Days Past Due | Greater Than 90 Days | Total Past Due | Current | Recorded Investment > 90 days and Accruing | Recorded Investment Nonaccrual Loans | |||||||||||||||||||||
December 31, 2015 | |||||||||||||||||||||||||||
Commercial | $ | 99,291 | $ | — | $ | 21,448 | $ | 120,739 | $ | 157,951,959 | $ | — | $ | 21,448 | |||||||||||||
Real estate | |||||||||||||||||||||||||||
Construction | — | 101,677 | — | 101,677 | 190,321,315 | — | 101,677 | ||||||||||||||||||||
Residential (1-4 family) | 1,195,961 | 31,885 | 622,770 | 1,850,616 | 111,427,702 | 248,326 | 1,008,650 | ||||||||||||||||||||
Home equity lines | 316,425 | — | 249,987 | 566,412 | 58,531,195 | — | 483,859 | ||||||||||||||||||||
Multifamily | — | — | — | — | 11,590,641 | — | — | ||||||||||||||||||||
Commercial | — | 153,349 | 220,775 | 374,124 | 290,156,959 | — | 374,125 | ||||||||||||||||||||
Real estate subtotal | 1,512,386 | 286,911 | 1,093,532 | 2,892,829 | 662,027,812 | 248,326 | 1,968,311 | ||||||||||||||||||||
Consumer | |||||||||||||||||||||||||||
Consumer and installment loans | 97,135 | 56,287 | — | 153,422 | 6,203,051 | — | — | ||||||||||||||||||||
Overdraft protection loans | 64 | — | — | 64 | 121,153 | — | — | ||||||||||||||||||||
Loans to individuals subtotal | 97,199 | 56,287 | — | 153,486 | 6,324,204 | — | — | ||||||||||||||||||||
Total gross loans | $ | 1,708,876 | $ | 343,198 | $ | 1,114,980 | $ | 3,167,054 | $ | 826,303,975 | $ | 248,326 | $ | 1,989,759 | |||||||||||||
December 31, 2014 | |||||||||||||||||||||||||||
Commercial: | $ | — | $ | — | $ | 582,059 | $ | 582,059 | $ | 137,848,940 | $ | — | $ | 582,059 | |||||||||||||
Real estate | |||||||||||||||||||||||||||
Construction | 248,420 | — | 100,000 | 348,420 | 172,153,910 | — | 212,552 | ||||||||||||||||||||
Residential (1-4 family) | 761,696 | 2,412,128 | 1,252,644 | 4,426,468 | 104,977,815 | 174,976 | 1,427,931 | ||||||||||||||||||||
Home equity lines | 109,456 | — | 249,915 | 359,371 | 67,127,629 | — | 249,915 | ||||||||||||||||||||
Multifamily | — | — | — | — | 21,809,189 | — | — | ||||||||||||||||||||
Commercial | — | 166,618 | 230,994 | 397,612 | 256,569,208 | — | 230,994 | ||||||||||||||||||||
Real estate subtotal | 1,119,572 | 2,578,746 | 1,833,553 | 5,531,871 | 622,637,751 | 174,976 | 2,121,392 | ||||||||||||||||||||
Consumer | |||||||||||||||||||||||||||
Consumer and installment loans | 139,446 | — | — | 139,446 | 5,829,544 | — | 1,121 | ||||||||||||||||||||
Overdraft protection loans | — | — | — | — | 96,736 | — | — | ||||||||||||||||||||
Loans to individuals subtotal | 139,446 | — | — | 139,446 | 5,926,280 | — | 1,121 | ||||||||||||||||||||
Total gross loans | $ | 1,259,018 | $ | 2,578,746 | $ | 2,415,612 | $ | 6,253,376 | $ | 766,412,971 | $ | 174,976 | $ | 2,704,572 | |||||||||||||
89
A summary of the activity in the allowance for loan losses account is as follows:
Allocation of the Allowance for Loan Losses
For the Years Ended December 31, 2015, 2014 and 2013
Real Estate | |||||||||||||||||||||||
2015 | Commercial | Construction | Residential | Home Equity | Multifamily | Commercial | |||||||||||||||||
Allowance for credit losses: | |||||||||||||||||||||||
Beginning balance | $ | 1,157,867 | $ | 1,678,022 | $ | 2,456,418 | $ | 1,911,634 | $ | 85,056 | $ | 1,458,664 | |||||||||||
Charge-offs | (207,059 | ) | (17,500 | ) | (658,953 | ) | (70,042 | ) | — | — | |||||||||||||
Recoveries | 599,359 | 69,624 | 27,941 | 194,861 | — | — | |||||||||||||||||
Provision | (694,354 | ) | 67,155 | 51,122 | (381,908 | ) | (32,898 | ) | 719,226 | ||||||||||||||
Ending balance | $ | 855,813 | $ | 1,797,301 | $ | 1,876,528 | $ | 1,654,545 | $ | 52,158 | $ | 2,177,890 | |||||||||||
Ending balance | |||||||||||||||||||||||
Individually evaluated for impairment | $ | 21,448 | $ | 112,963 | $ | 568,424 | $ | 688,596 | $ | — | $ | 644,162 | |||||||||||
Collectively evaluated for impairment | $ | 834,365 | $ | 1,684,338 | $ | 1,308,104 | $ | 965,949 | $ | 52,158 | $ | 1,533,728 | |||||||||||
Financing receivables: | |||||||||||||||||||||||
Ending balance | $ | 158,072,698 | $ | 190,422,992 | $ | 113,278,318 | $ | 59,097,607 | $ | 11,590,641 | $ | 290,531,083 | |||||||||||
Ending balance: individually evaluated for impairment | $ | 21,448 | $ | 1,148,363 | $ | 3,743,313 | $ | 1,439,835 | $ | — | 2,901,513 | ||||||||||||
Ending balance: collectively evaluated for impairment | $ | 158,051,250 | $ | 189,274,629 | $ | 109,535,005 | $ | 57,657,772 | $ | 11,590,641 | $ | 287,629,570 | |||||||||||
Consumer | |||||||||||||||||||||||
Consumer and installment loans | Overdraft protection | Unallocated | Total | ||||||||||||||||||||
Allowance for credit losses: | |||||||||||||||||||||||
Beginning balance | $ | 104,661 | $ | 260 | $ | 96,255 | $ | 8,948,837 | |||||||||||||||
Charge-offs | (1,869 | ) | — | — | (955,423 | ) | |||||||||||||||||
Recoveries | — | 2,000 | — | 893,785 | |||||||||||||||||||
Provision | (6,767 | ) | 777 | 277,647 | — | ||||||||||||||||||
Ending balance | $ | 96,025 | $ | 3,037 | $ | 373,902 | $ | 8,887,199 | |||||||||||||||
Ending balance | |||||||||||||||||||||||
Individually evaluated for impairment | $ | 65,043 | $ | 2,527 | $ | — | $ | 2,103,163 | |||||||||||||||
Collectively evaluated for impairment | $ | 30,982 | $ | 510 | $ | 373,902 | $ | 6,784,036 | |||||||||||||||
Financing receivables: | |||||||||||||||||||||||
Ending balance | $ | 6,356,473 | $ | 121,217 | $ | — | $ | 829,471,029 | |||||||||||||||
Ending balance: individually evaluated for impairment | $ | 65,043 | $ | 2,527 | $ | — | $ | 9,322,042 | |||||||||||||||
Ending balance: collectively evaluated for impairment | $ | 6,291,430 | $ | 118,690 | $ | — | $ | 820,148,987 | |||||||||||||||
90
Real Estate | |||||||||||||||||||||||
2014 | Commercial | Construction | Residential | Home Equity | Multifamily | Commercial | |||||||||||||||||
Allowance for credit losses: | |||||||||||||||||||||||
Beginning balance | $ | 1,219,255 | $ | 1,978,320 | $ | 1,685,502 | $ | 2,132,916 | $ | 59,586 | $ | 1,305,131 | |||||||||||
Charge-offs | (21,789 | ) | (190,812 | ) | (163,048 | ) | (174,319 | ) | — | — | |||||||||||||
Recoveries | 205,200 | 79,922 | 31,505 | 122,809 | — | — | |||||||||||||||||
Provision | (244,799 | ) | (189,408 | ) | 902,459 | (169,772 | ) | 25,470 | 153,533 | ||||||||||||||
Ending balance | $ | 1,157,867 | $ | 1,678,022 | $ | 2,456,418 | $ | 1,911,634 | $ | 85,056 | $ | 1,458,664 | |||||||||||
Ending balance | |||||||||||||||||||||||
Individually evaluated for impairment | $ | 441,265 | $ | 100,159 | $ | 1,261,490 | $ | 547,172 | $ | — | $ | 335,033 | |||||||||||
Collectively evaluated for impairment | $ | 716,602 | $ | 1,577,863 | $ | 1,194,928 | $ | 1,364,462 | $ | 85,056 | $ | 1,123,631 | |||||||||||
Financing receivables: | |||||||||||||||||||||||
Ending balance | $ | 138,430,999 | $ | 172,502,330 | $ | 109,404,283 | $ | 67,487,000 | $ | 21,809,189 | $ | 256,966,820 | |||||||||||
Ending balance: individually evaluated for impairment | $ | 1,549,963 | $ | 1,272,380 | $ | 7,198,325 | $ | 1,101,597 | $ | — | $ | 3,130,893 | |||||||||||
Ending balance: collectively evaluated for impairment | $ | 136,881,036 | $ | 171,229,950 | $ | 102,205,958 | $ | 66,385,403 | $ | 21,809,189 | $ | 253,835,927 | |||||||||||
Consumer | |||||||||||||||||||||||
Consumer and installment loans | Overdraft protection | Unallocated | Total | ||||||||||||||||||||
Allowance for credit losses: | |||||||||||||||||||||||
Beginning balance | $ | 99,271 | $ | 688 | $ | 580,700 | $ | 9,061,369 | |||||||||||||||
Charge-offs | — | (2,000 | ) | — | (551,968 | ) | |||||||||||||||||
Recoveries | — | — | — | 439,436 | |||||||||||||||||||
Provision | 5,390 | 1,572 | (484,445 | ) | — | ||||||||||||||||||
Ending balance | $ | 104,661 | $ | 260 | $ | 96,255 | $ | 8,948,837 | |||||||||||||||
Ending balance | |||||||||||||||||||||||
Individually evaluated for impairment | $ | 74,582 | $ | — | $ | — | $ | 2,759,701 | |||||||||||||||
Collectively evaluated for impairment | $ | 30,079 | $ | 260 | $ | 96,255 | $ | 6,189,136 | |||||||||||||||
Financing receivables: | |||||||||||||||||||||||
Ending balance | $ | 5,968,990 | $ | 96,736 | $ | — | $ | 772,666,347 | |||||||||||||||
Ending balance: individually evaluated for impairment | $ | 75,704 | $ | — | $ | — | $ | 14,328,862 | |||||||||||||||
Ending balance: collectively evaluated for impairment | $ | 5,893,286 | $ | 96,736 | $ | — | $ | 758,337,485 | |||||||||||||||
91
Real Estate | |||||||||||||||||||||||
2013 | Commercial | Construction | Residential | Home Equity | Multifamily | Commercial | |||||||||||||||||
Allowance for credit losses: | |||||||||||||||||||||||
Beginning balance | $ | 1,749,641 | $ | 2,360,707 | $ | 1,545,315 | $ | 1,402,448 | $ | 290,532 | $ | 2,882,398 | |||||||||||
Charge-offs | (2,468,074 | ) | — | (148,766 | ) | (582,480 | ) | — | — | ||||||||||||||
Recoveries | 175,991 | 1,039,591 | 39,607 | 98,067 | — | 20,000 | |||||||||||||||||
Provision | 1,761,697 | (1,421,978 | ) | 249,346 | 1,214,881 | (230,946 | ) | (1,597,267 | ) | ||||||||||||||
Ending balance | $ | 1,219,255 | $ | 1,978,320 | $ | 1,685,502 | $ | 2,132,916 | $ | 59,586 | $ | 1,305,131 | |||||||||||
Ending balance | |||||||||||||||||||||||
Individually evaluated for impairment | $ | 712,699 | $ | 736,248 | $ | 274,259 | $ | 510,118 | $ | — | $ | 616,393 | |||||||||||
Collectively evaluated for impairment | $ | 506,556 | $ | 1,242,072 | $ | 1,411,243 | $ | 1,622,798 | $ | 59,586 | $ | 688,738 | |||||||||||
Financing receivables: | |||||||||||||||||||||||
Ending balance | $ | 119,367,962 | $ | 155,551,690 | $ | 89,846,277 | $ | 67,177,011 | $ | 27,392,561 | $ | 250,178,584 | |||||||||||
Ending balance: individually evaluated for impairment | $ | 6,842,132 | $ | 7,095,195 | $ | 5,956,407 | $ | 1,386,245 | $ | 308,053 | $ | 5,715,403 | |||||||||||
Ending balance: collectively evaluated for impairment | $ | 112,525,830 | $ | 148,456,495 | $ | 83,889,870 | $ | 65,790,766 | $ | 27,084,508 | $ | 244,463,181 | |||||||||||
Consumer | |||||||||||||||||||||||
Consumer and installment loans | Overdraft protection | Unallocated | Total | ||||||||||||||||||||
Allowance for credit losses: | |||||||||||||||||||||||
Beginning balance | $ | 55,192 | $ | 501 | $ | 623,266 | $ | 10,910,000 | |||||||||||||||
Charge-offs | (22,759 | ) | (416 | ) | — | (3,222,495 | ) | ||||||||||||||||
Recoveries | 587 | 21 | — | 1,373,864 | |||||||||||||||||||
Provision | 66,251 | 582 | (42,566 | ) | — | ||||||||||||||||||
Ending balance | $ | 99,271 | $ | 688 | $ | 580,700 | $ | 9,061,369 | |||||||||||||||
Ending balance | |||||||||||||||||||||||
Individually evaluated for impairment | $ | 83,792 | $ | — | $ | — | $ | 2,933,509 | |||||||||||||||
Collectively evaluated for impairment | $ | 15,479 | $ | 688 | $ | 580,700 | $ | 6,127,860 | |||||||||||||||
Financing receivables: | |||||||||||||||||||||||
Ending balance | $ | 2,911,397 | $ | 71,009 | $ | — | $ | 712,496,491 | |||||||||||||||
Ending balance: individually evaluated for impairment | $ | 88,143 | $ | — | $ | — | $ | 27,391,578 | |||||||||||||||
Ending balance: collectively evaluated for impairment | $ | 2,823,254 | $ | 71,009 | $ | — | $ | 685,104,913 | |||||||||||||||
A loan is considered impaired when, based on current information and events; it is probable that a creditor will be unable to collect all amounts due according to the contractual terms of the loan agreement. All amounts due according to the contractual terms means that both the contractual interest payments and the contractual principal payments of a loan will be collected as scheduled in the loan agreement. In addition to loans 90 days past due and still accruing and nonaccrual loans, all restructured loans, all loans risk graded doubtful or substandard and a portion of the loans risk graded special mention qualify, by definition, as impaired. Loans 90 days past due and still accruing totaling $248,326 and nonaccrual loans totaling $1,989,759 are included in impaired loans at December 31, 2015. Loans 90 days past due and still accruing totaling $174,976 and nonaccrual loans totaling $2,704,572 are included in impaired loans at December 31, 2014.
92
The following table summarizes our impaired loans at December 31, 2015 and 2014.
Impaired Loans | |||||||||||||||
With No Related Allowance | |||||||||||||||
Recorded Investment | Unpaid Principal Balance | Average Recorded Investment | Interest Income Recognized | ||||||||||||
December 31, 2015 | |||||||||||||||
Commercial | $ | — | $ | — | $ | — | $ | — | |||||||
Real estate | |||||||||||||||
Construction | 930,955 | 930,955 | 947,162 | 64,402 | |||||||||||
Residential (1-4 family) | 1,850,482 | 1,912,515 | 1,942,407 | 63,532 | |||||||||||
Home equity lines | 445,092 | 461,134 | 456,349 | 6,862 | |||||||||||
Multifamily | — | — | — | — | |||||||||||
Commercial | 894,603 | 899,189 | 921,147 | 50,773 | |||||||||||
Consumer | |||||||||||||||
Consumer and installment loans | — | — | — | — | |||||||||||
Overdraft protection loans | — | — | — | — | |||||||||||
Total | $ | 4,121,132 | $ | 4,203,793 | $ | 4,267,065 | $ | 185,569 | |||||||
December 31, 2014 | |||||||||||||||
Commercial | $ | — | $ | — | $ | — | $ | — | |||||||
Real estate | |||||||||||||||
Construction | 935,467 | 935,467 | 954,181 | 56,004 | |||||||||||
Residential (1-4 family) | 2,704,883 | 2,880,739 | 3,067,193 | 119,011 | |||||||||||
Home equity lines | 115,925 | 115,925 | 115,324 | 3,962 | |||||||||||
Multifamily | — | — | — | — | |||||||||||
Commercial | 1,430,533 | 1,430,533 | 1,317,972 | 79,891 | |||||||||||
Consumer | |||||||||||||||
Consumer and installment loans | 1,122 | 2,729 | 3,088 | — | |||||||||||
Overdraft protection loans | — | — | — | — | |||||||||||
Total | $ | 5,187,930 | $ | 5,365,393 | $ | 5,457,758 | $ | 258,868 | |||||||
93
With Related Allowance | |||||||||||||||||||
Recorded Investment | Unpaid Principal Balance | Related Allowance | Average Recorded Investment | Interest Income Recognized | |||||||||||||||
December 31, 2015 | |||||||||||||||||||
Commercial | $ | 21,448 | $ | 21,448 | $ | 21,448 | $ | 26,406 | $ | 568 | |||||||||
Real estate | |||||||||||||||||||
Construction | 217,408 | 244,963 | 112,963 | 228,737 | 10,325 | ||||||||||||||
Residential (1-4 family) | 1,892,831 | 2,032,255 | 568,424 | 1,909,161 | 66,605 | ||||||||||||||
Home equity lines | 994,743 | 994,743 | 688,596 | 997,110 | 42,663 | ||||||||||||||
Multifamily | — | — | — | — | — | ||||||||||||||
Commercial | 2,006,910 | 2,016,187 | 644,162 | 1,699,033 | 60,710 | ||||||||||||||
Consumer | |||||||||||||||||||
Consumer and installment loans | 65,043 | 65,043 | 65,043 | 70,199 | 2,461 | ||||||||||||||
Overdraft protection loans | 2,527 | 2,527 | 2,527 | 2,787 | 629 | ||||||||||||||
Total | $ | 5,200,910 | $ | 5,377,166 | $ | 2,103,163 | $ | 4,933,433 | $ | 183,961 | |||||||||
December 31, 2014 | |||||||||||||||||||
Commercial | $ | 1,549,963 | $ | 1,549,963 | $ | 441,265 | $ | 1,618,461 | $ | 93,073 | |||||||||
Real estate | |||||||||||||||||||
Construction | 336,913 | 441,459 | 100,159 | 408,460 | 12,358 | ||||||||||||||
Residential (1-4 family) | 4,493,442 | 4,535,549 | 1,261,490 | 4,564,008 | 232,522 | ||||||||||||||
Home equity lines | 985,672 | 985,672 | 547,172 | 988,494 | 46,161 | ||||||||||||||
Multifamily | — | — | — | — | — | ||||||||||||||
Commercial | 1,700,360 | 1,700,360 | 335,033 | 1,721,563 | 79,323 | ||||||||||||||
Consumer | |||||||||||||||||||
Consumer and installment loans | 74,582 | 74,582 | 74,582 | 79,632 | 2,792 | ||||||||||||||
Overdraft protection loans | — | — | — | — | — | ||||||||||||||
Total | $ | 9,140,932 | $ | 9,287,585 | $ | 2,759,701 | $ | 9,380,618 | $ | 466,229 | |||||||||
Interest received in cash and recognized on impaired loans was $369,530, $725,097 and $1,924,008 for 2015, 2014 and 2013, respectively.
Restructured loans are loans for which it has been determined the borrower will not be able to perform under the original terms of the loan agreement and a concession has been made to those terms that would not otherwise have been considered. If the value of a restructured loan is determined to be less than the recorded investment in the loan, a valuation allowance is created with a corresponding charge-off to the allowance for loan losses and any collection of interest and principal are recorded as recoveries to the allowance for loan losses until all charged-off balances are fully recovered. Measurement of the value of a restructured loan is generally based on the present value of expected future cash flows discounted at the loan’s effective interest rate, unless in the case of collateral-dependent loans, the observable market price, or the fair value of the collateral can be readily determined. Restructured loans are reevaluated periodically and additional adjustments to the carrying value may be made. In addition, if it is determined the borrower is unable to perform under the modified terms, further steps, such as a full charge-off or foreclosure may be taken. We did not have any commitments to lend additional funds on restructured loans at December 31, 2015 or 2014.
We currently have ten loans classified as restructured loans; seven residential 1-4 family loan for $1,481,143, two commercial real estate loans for $1,550,360 and one consumer loan for $65,043. At December 31, 2015, three residential 1-4 family restructured loans totaling $695,886 are not current, and one commercial real estate restructured loan for $220,775 is not current. All remaining restructured loans, which total $2,179,885 are current. There were three restructured loans added during the year ended December 31, 2015. We did not have any defaults on restructured loans within twelve months of restructuring during the years ended December 31, 2015 and 2014.
94
Additional information on restructured loans during the period is as follows:
Troubled Debt Restructurings
Number of Contracts | Pre-Modification Outstanding Recorded Investment | Post-Modification Outstanding Recorded Investment | |||||||
Year Ended December 31, 2015 | 3 | $ | 806,460 | $ | 806,460 | ||||
Year Ended December 31, 2014 | 4 | $ | 1,367,499 | $ | 1,304,499 | ||||
Troubled Debt Restructurings That Subsequently Defaulted
Number of Contracts | Recorded Investment | ||||||||
Year Ended December 31, 2015 | None | $ | — | $ | — | ||||
Year Ended December 31, 2014 | None | $ | — | $ | — | ||||
NOTE 5 – OTHER REAL ESTATE OWNED
Other real estate is real estate properties acquired through or in lieu of loan foreclosure. At foreclosure, these properties are recorded at their fair value less estimated selling costs as a nonperforming asset, with any write-downs to the carrying value of our investment charged to the allowance for loan loss. After foreclosure, periodic evaluations are performed to determine if any decrease in the fair value less estimated selling costs has occurred. Further adjustments to this fair value are charged to operations, in non-interest expense, when identified. Expenses associated with the maintenance of other real estate are charged to operations, as incurred. When a property is sold, any gain or loss on the sale is recorded as non-interest expense.
Information on other real estate:
2015 | 2014 | 2013 | ||||||||||||||||||
Balance | Number | Balance | Number | Balance | Number | |||||||||||||||
January 1, | $ | 144,000 | 1 | $ | 301,963 | 1 | $ | — | — | |||||||||||
Balance moved into other real estate | 250,000 | 2 | 942,285 | 3 | 397,037 | 2 | ||||||||||||||
394,000 | 3 | 1,244,248 | 4 | 397,037 | 2 | |||||||||||||||
Properties sold | (394,000 | ) | (3 | ) | (1,100,248 | ) | (3 | ) | (95,074 | ) | (1 | ) | ||||||||
Balance December 31, | $ | — | — | $ | 144,000 | 1 | $ | 301,963 | 1 | |||||||||||
Gross gains of sale of other real estate | $ | — | $ | — | $ | — | ||||||||||||||
Gross losses on sale of other real estate | (51,035 | ) | (6,976 | ) | (3,020 | ) | ||||||||||||||
Rental income, other real estate | 1,955 | 9,620 | — | |||||||||||||||||
Other real estate expense | (44,869 | ) | (80,580 | ) | (7,098 | ) | ||||||||||||||
Foreclosed property expense | $ | (93,949 | ) | $ | (77,936 | ) | $ | (10,118 | ) | |||||||||||
There was one residential real estate property totaling $45,844 in the process of foreclosure at December 31, 2015 and one residential real estate property totaling $182,256 in process of foreclosure at December 31, 2014.
95
NOTE 6 – PROPERTY AND EQUIPMENT
Property and equipment consist of the following at December 31:
2015 | 2014 | ||||||
Buildings | $ | 18,556,418 | $ | 18,221,806 | |||
Land | 7,747,480 | 7,747,480 | |||||
Leasehold improvements | 4,054,056 | 3,883,408 | |||||
Equipment, furniture and fixtures | 14,245,439 | 13,557,589 | |||||
44,603,393 | 43,410,283 | ||||||
Less accumulated depreciation | (15,631,531 | ) | (13,162,819 | ) | |||
Property and equipment, net | $ | 28,971,862 | $ | 30,247,464 | |||
Depreciation expense of $2,977,243, $2,886,838 and $2,424,478 was included in occupancy and equipment expense for 2015, 2014 and 2013, respectively.
We have thirty-three non-cancellable leases for premises. The lease terms are from one to thirty years and have various renewal dates. Rental expense was $3,846,737, $4,239,011 and $3,964,392 in 2015, 2014 and 2013, respectively. Minimum lease payments for succeeding years pertaining to these non-cancellable operating leases are as follows:
2016 | $ | 3,045,531 | |
2017 | 2,799,339 | ||
2018 | 1,571,320 | ||
2019 | 652,508 | ||
2020 | 382,387 | ||
Thereafter | 7,285,350 | ||
$ | 15,736,435 | ||
NOTE 7 – GOODWILL AND INTANGIBLE ASSETS
On August 10, 2007, we acquired a Maryland mortgage office plus certain other mortgage related assets from Resource Bank (now Fulton Bank), a Virginia Beach based bank owned by Fulton Financial of Lancaster, Pennsylvania. The assets and results of operations have been included in the consolidated financial statements since that date. The aggregate purchase price was $2.1 million including legal expenses of $53,000. The intangible assets had a weighted-average useful life of seven years.
Information concerning intangible assets and goodwill attributable to the Maryland mortgage office acquired on August 10, 2007 is presented in the following table:
December 31, | Acquisition | ||||||||||
2015 | 2014 | Cost | |||||||||
Amortizable intangible assets, net | $ | — | $ | — | $ | 1,250,000 | |||||
Goodwill | 775,000 | 775,000 | 775,000 | ||||||||
Amortization expense | — | 104,167 | |||||||||
Annual impairment review indicated that goodwill was not impaired in 2015 or 2014.
NOTE 8 – RESTRICTED EQUITY SECURITIES
Restricted equity securities are securities that do not have a readily determinable fair value and lack a market. Therefore, they are carried at cost. The following table represents balances as of December 31, 2015 and 2014, respectively:
2015 | 2014 | ||||||
Federal Reserve Bank Stock | $ | 2,107,700 | $ | 2,086,000 | |||
Federal Home Loan Bank Stock | 1,639,800 | 1,412,800 | |||||
Community Bankers Bank Stock | 133,700 | 133,700 | |||||
Total restricted equity securities | $ | 3,881,200 | $ | 3,632,500 | |||
96
As a member bank, our stock requirement with the Federal Reserve is based on our capital levels as reported on the most recent filing of our Consolidated Reports of Condition and Income and is subject to change when our capital levels increase or decrease. Our stock requirements with the Federal Home Loan Bank consists of two levels; membership stock based on total assets as of December 31st of each year, and collateral stock based on our highest borrowing levels which is evaluated for release on a periodic basis. The stock we hold with Community Bankers Bank is membership stock.
NOTE 9 – DEPOSITS
Interest-bearing deposits for the years ending December 31, 2015 and December 31, 2014 are as follows:
2015 | 2014 | ||||||
Interest bearing demand | $ | 68,963,364 | $ | 66,681,905 | |||
Money market accounts | 364,893,441 | 369,221,343 | |||||
Savings accounts | 19,516,673 | 20,003,086 | |||||
Certificates of deposit $250,000 and over | 23,069,895 | 20,581,794 | |||||
Other time deposits | 242,570,667 | 207,624,614 | |||||
Total interest-bearing deposits | $ | 719,014,040 | $ | 684,112,742 | |||
Scheduled maturities for time deposits as of December 31, 2015 are as follows:
Year Maturing | |||
2016 | $ | 221,960,807 | |
2017 | 41,470,682 | ||
2018 | 954,233 | ||
2019 | 726,279 | ||
2020 | 447,681 | ||
Thereafter | 80,880 | ||
$ | 265,640,562 | ||
Brokered money market balances included in money markets totaled $34,310,395 and $42,420,532 at December 31, 2015 and 2014, respectively. There were no CDARS balances over $250,000 at year end 2015 or 2014.
NOTE 10 – BORROWINGS
We have federal funds arrangements with five financial institutions that provide approximately $68.0 million of unsecured short-term borrowing capacity. As of December 31, 2015 and 2014, there were no outstanding balances on these federal funds lines of credits. Information concerning federal funds purchased is summarized, as follows:
2015 | 2014 | ||||||
Average balance during the year | $ | 365,562 | $ | 100,699 | |||
Average interest rate during the year | 0.61 | % | 1.26 | % | |||
Maximum month end balance during the year | $ | 20,000 | $ | — | |||
We are a member of the Federal Home Loan Bank of Atlanta (“FHLB”) and as such, may borrow funds based on criteria established by the FHLB. We are allowed under our lines of credit to borrow up to 30% of assets, or approximately $348,436,240, if collateralized, as of December 31, 2015. This line of credit is secured by loans held for investment, investment securities and loans held for sale. The loans held for investment consists of blanket liens on our portfolio of 1-4 family residential loans, home equity lines of credit/loans portfolio and qualifying commercial real estate loans. The investment securities are pledged with collateral fair values of $78,649 at December 31, 2015 and $97,249 at December 31, 2014. The loans held for sale portfolio is pledged daily under the Residential Available For Sale ("RAFS") program which uses loans that have been sold to FHLB approved investors. We are allowed to borrow up to 90% of the pledged loan amount. The RAFS program went into effect in February 2014 after the previous program was sundowned.
As of December 31, 2015 we could borrow approximately $107.3 million, and as of December 31, 2014 we could borrow approximately $120.7 million, under our line based upon collateral pledged. In both years this line is reduced by $8.0 million, which has been pledged as collateral for public funds. There were no fixed rate advances outstanding on the line as of December 31, 2015.
97
There was one fixed rate advance, which totaled $1,075,497 in 2014 that matured September 28, 2015.
Should we ever desire to increase the line of credit beyond the 30% limit, the FHLB would allow borrowings of up to 40% of total assets once we met specific eligibility criteria.
Other information concerning FHLB advances is summarized below:
2015 | 2014 | ||||||
Average balance during the year | $ | 16,442,629 | $ | 1,912,203 | |||
Average interest rate during the year | 0.52 | % | 3.02 | % | |||
Maximum month end balance during the year | $ | 46,025,500 | $ | 11,075,497 | |||
Outstanding balance at December 31, | $ | 16,000,000 | $ | 11,075,497 | |||
NOTE 11 – TRUST PREFERRED SUBORDINATED DEBT
Monarch Financial Holdings Trust is a wholly-owned special purpose finance subsidiary of Monarch Financial Holdings, Inc., operating in the form of a grantor trust (the Trust). The Trust was created in June 2006 to issue capital securities and remit the proceeds to the Company. We are the sole owner of the common stock securities of the Trust. On July 5, 2006 the Trust issued 10,000 shares of preferred stock capital securities with a stated value of $1,000 per share, bearing a variable dividend rate, reset per quarter, equal to 90 day LIBOR plus 1.60%. The Trust securities have a mandatory redemption date of September 30, 2036, and were subject to varying call provisions at our option beginning September 30, 2011.
We unconditionally guarantee the stated value of the Trust preferred stock on a subordinated basis. Through an inter-company lending transaction, proceeds received by the Trust from the sale of securities were lent to the Company for general corporate purposes.
The Trust preferred stock is senior to our common stock in event of claims against Monarch, but is subordinated to all senior and subordinated debt securities. The shares of the Trust preferred stock are capital securities, which are distinct from the common stock or preferred stock of the Company, and the dividends thereon are tax-deductible. Dividends accrued for payment by the Trust are classified as interest expense on long-term debt in our consolidated statement of income. The Trust preferred stock is shown as “Trust preferred subordinated debt” and classified as a liability in the consolidated balance sheets.
NOTE 12 – DERIVATIVE FINANCIAL INSTRUMENTS AND HEDGING ACTIVITIES
We entered into an interest rate swap agreement with PNC Bank (“PNC”) of Pittsburgh, PA on July 29, 2009, for our $10,000,000 Trust preferred borrowing, which carries a floating interest rate of 90 day LIBOR plus 160 basis points. The terms of this hedge allowed us to mitigate our exposure to interest-rate fluctuations by swapping our floating rate obligation for a fixed rate obligation. The notional amount of the swap agreement was $10,000,000, and expired on September 30, 2014. Under the terms of our agreement, at the end of each quarter we swapped our floating rate for a fixed rate of 3.26%. Including the additional 160 basis points, the effective fixed rate of interest cost was 4.86% on our $10,000,000 Trust Preferred borrowing for five years.
The fixed-rate payment feature of this swap was structured to mirror the provisions of the hedged borrowing agreement. The swap qualified as a cash flow hedge and the underlying liability was carried at fair value in other liabilities, with the tax-effective changes in the fair value of the instrument included in Stockholders’ Equity in accumulated other comprehensive income (loss). This swap was not renewed when it expired on September 30, 2014.
Commitments to fund certain mortgage loans (interest rate locks) to be sold into the secondary market and forward commitments for the future delivery of mortgage loans to third party investors are considered derivatives. It is the Company's practice to enter into forward commitments for the future delivery of residential mortgage loans when interest rate lock commitments are entered into in order to economically hedge the effect of changes in interest rates resulting from its commitments to fund the loans. These mortgage derivatives are not designated in hedge relationships. At year-end 2015, the Company had approximately $131 million of interest rate lock commitments and $244 million of forward commitments for the future delivery of residential mortgage loans. The fair value of these mortgage banking derivatives was reflected by a derivative asset of $2,105,204 and a derivative liability of $368,577. At year-end 2014, the Company had approximately $113 million of interest rate lock commitments and $216 million of forward commitments for the future delivery of residential mortgage loans. The fair value of these mortgage banking derivatives was reflected by a derivative asset of $1,514,083 and a derivative liability of $1,195,405. Fair values were estimated based on changes in mortgage interest rates from the date of the commitments. Changes in the fair values of these mortgage banking derivatives are included in net gains on sales of loans.
The net gains (losses) relating to free-standing derivative instruments used for risk management are summarized below as of December 31:
98
Location | 2015 | 2014 | 2013 | |||||||
Forward contracts related to mortgage loans held for sale | Mortgage banking revenue | $ | (342,948 | ) | $ | 180,903 | $ | — | ||
Interest rate lock commitments | Mortgage banking revenue | $ | 829,648 | $ | 540,374 | $ | — | |||
The following table reflects the amount and market value of mortgage banking derivatives included in the Consolidated Statements of Condition as of December 31:
2015 | 2014 | ||||||||||||||
Notional | Fair | Notional | Fair | ||||||||||||
Amount | Value | Amount | Value | ||||||||||||
Included in other assets (1) | |||||||||||||||
Forward contracts related to mortgage loans held for sale (2) | $ | 145,232,095 | $ | 615,123 | $ | 54,955,693 | $ | 153,506 | |||||||
Interest rate lock commitments | 130,510,306 | 1,370,022 | 113,867,190 | 1,115,944 | |||||||||||
Loans held for sale (2) | 57,475,606 | 120,059 | 70,013,297 | 244,633 | |||||||||||
Total included in other assets | $ | 2,105,204 | $ | 1,514,083 | |||||||||||
Included in other liabilities (1) | |||||||||||||||
Forward contracts related to mortgage loans held for sale (2) | $ | 98,680,765 | $ | 238,583 | $ | 161,072,280 | $ | 757,906 | |||||||
Loans held for sale (2) | 38,765,086 | 76,856 | 23,030,231 | 42,833 | |||||||||||
Hedge positions | $ | 76,632,817 | 53,138 | $ | 49,280,193 | $ | 394,666 | ||||||||
Total included in other assets | $ | 368,577 | $ | 1,195,405 | |||||||||||
(1) | The Notional amount of mortgage banking derivatives is an off balance sheet time and only the fair value of the derivatives is recorded within the Consolidated Statements of Condition. |
(2) | Loans held for sale and certain forward sales commitments do no qualify under applicable accounting guidance as derivative instruments; however, the Company has elected the fair value option under ASC 825-10-15-4(b) for the loans held for sale portfolio and thus fair value adjustments have been recorded in the derivative asset and derivative liability as presented above. |
NOTE 13 – INCOME TAXES
The principal components of income tax expense for 2015, 2014 and 2013 are as follows:
2015 | 2014 | 2013 | |||||||||
Current | |||||||||||
Federal | $ | (7,218,432 | ) | $ | (6,351,028 | ) | $ | (5,051,832 | ) | ||
State | (414,297 | ) | (444,024 | ) | (485,148 | ) | |||||
(7,632,729 | ) | (6,795,052 | ) | (5,536,980 | ) | ||||||
Deferred | |||||||||||
Federal | 63,218 | 318,422 | (846,636 | ) | |||||||
State | (14,309 | ) | (13,643 | ) | (2,424 | ) | |||||
48,909 | 304,779 | (849,060 | ) | ||||||||
Total | |||||||||||
Federal | (7,155,214 | ) | (6,032,606 | ) | (5,898,468 | ) | |||||
State | (428,606 | ) | (457,667 | ) | (487,572 | ) | |||||
$ | (7,583,820 | ) | $ | (6,490,273 | ) | $ | (6,386,040 | ) | |||
Differences between income tax expense calculated at the statutory rate and that shown in the statement of income for 2015, 2014 and 2013 are summarized, as follows:
99
2015 | 2014 | 2013 | |||||||||
Federal income tax expense at statutory rate | $ | (7,279,524 | ) | $ | (6,195,743 | ) | $ | (6,116,966 | ) | ||
Tax effect of: | |||||||||||
BOLI cash surrender value (decrease) increase | 99,949 | 86,578 | 82,732 | ||||||||
Meals and entertainment | (131,015 | ) | (121,212 | ) | (115,058 | ) | |||||
State and local income taxes | (287,635 | ) | (305,893 | ) | (321,475 | ) | |||||
Other | 14,405 | 45,997 | 84,727 | ||||||||
Income tax expense | $ | (7,583,820 | ) | $ | (6,490,273 | ) | $ | (6,386,040 | ) | ||
We have the following deferred tax assets and liabilities at December 31, 2015, 2014 and 2013:
December 31, | |||||||||||
2015 | 2014 | 2013 | |||||||||
Deferred tax assets: | |||||||||||
Bad debt provision | $ | 3,223,241 | $ | 3,257,838 | $ | 3,320,139 | |||||
Available for sale securities | 84,301 | 55,163 | 225,883 | ||||||||
Deferred compensation | 1,035,137 | 777,567 | 651,386 | ||||||||
Reserve for available for sale loan repurchase | 1,192,383 | 1,097,032 | 1,162,199 | ||||||||
Premium amortization on securities | 10,608 | 9,640 | 8,557 | ||||||||
Other | 1,040,870 | 1,171,886 | 744,806 | ||||||||
Total deferred tax assets | 6,586,540 | 6,369,126 | 6,112,970 | ||||||||
Deferred tax liabilities: | |||||||||||
Fixed assets | (1,208,541 | ) | (1,426,903 | ) | (1,644,419 | ) | |||||
Other | (827,124 | ) | (469,393 | ) | (129,781 | ) | |||||
Total deferred tax liabilities | (2,035,665 | ) | (1,896,296 | ) | (1,774,200 | ) | |||||
Net deferred tax assets | $ | 4,550,875 | $ | 4,472,830 | $ | 4,338,770 | |||||
Deferred tax assets and liabilities are recognized for the future tax consequences attributable to differences between the financial statement carrying amount of existing assets and liabilities and their respective tax basis. Deferred tax assets and liabilities are measured using enacted tax rates expected to apply to taxable income in the years in which those temporary differences are expected to be recovered in income. Deferred tax assets are reduced by a valuation allowance if it is more likely than not that the tax benefits will not be realized. Management has evaluated the effect of the guidance provided by U.S. GAAP on Accounting for Uncertainty in Income Taxes, and all other tax positions that could have a significant effect on the financial statements and determined the Company had no uncertain material income tax positions at December 31, 2015 or 2014.
We file income tax returns in the U.S. federal jurisdiction and the states of Virginia, Maryland, North Carolina and South Carolina. With few possible exceptions, we are no longer subject to U.S. or state income tax examinations by tax authorities for the years prior to 2012.
NOTE 14 – COMMITMENTS, CONTINGENCIES AND CONSIDERATIONS
We have outstanding at any time a significant dollar amount of commitments to extend credit. To accommodate major customers, we also provide standby letters of credit and guarantees to third parties. Those arrangements are subject to strict credit control assessments. Guarantees and standby letters of credit specify limits to our obligations. The amounts of loan commitments, guarantees and standby letters of credit are set out in the following table as of December 31, 2015 and 2014. Because many commitments and almost all standby letters of credit and guarantees expire without being funded, in whole or in part, the contract amounts are not estimates of future cash flows. The majority of commitments to extend credit have terms up to one year. Interest rates on fixed-rate commitments range from 2.5% to 21.0%. All of the guarantees written and the standby letters of credit at December 31, 2015 expire during 2016.
Commitments | |||||||
2015 | 2014 | ||||||
Commitments to grant loans | $ | 157,554,990 | $ | 205,003,879 | |||
Interest Rate Lock Commitments | $ | 108,635,768 | $ | 79,415,083 | |||
Unfunded commitments under lines of credit and similar arrangements | $ | 149,977,483 | $ | 148,660,017 | |||
Standby letters of credit and guarantees written | $ | 33,062,276 | $ | 29,328,041 | |||
100
Loan commitments, standby letters of credit and guarantees written have off-balance-sheet credit risk because only origination fees and accruals for probable losses, if any, are recognized in the statement of financial position, until the commitments are fulfilled or the standby letters of credit or guarantees expire. Credit risk represents the accounting loss that would be recognized at the reporting date if counterparties failed completely to perform as contracted. The credit risk amounts are equal to the contractual amounts, assuming that the amounts are fully advanced and that, in accordance with the requirements of FASB guidance for Disclosure of Information about Financial Instruments with Off-Balance-Sheet Risk and Financial Instruments with Concentrations of Credit Risk, collateral or other security is of no value. Our policy is to require customers to provide collateral prior to the disbursement of approved loans. For retail loans, we usually retain a security interest in the property or products financed, which provides repossession rights in the event of default by the customer. For business loans and financial guarantees, collateral is usually in the form of inventory or marketable securities (held in trust) or property (notations on title).
Concentrations of credit risk relative to capital (whether on or off balance sheet) arising from financial instruments exist in relation to certain groups of customers. A group concentration arises when a number of counterparties have similar economic characteristics that would cause their ability to meet contractual obligations to be similarly affected by changes in economic or other conditions. At December 31, 2015, we had two loan concentrations which exceeded 10% in the area of loans to borrowers who are principally engaged in acquisition, development and construction of residential homes and developments. A geographic concentration arises because we operate primarily in southeastern Virginia.
The credit risk amounts represent the maximum accounting loss that would be recognized at the reporting date if counterparties failed completely to perform as contracted and any collateral or security proved to be of no value. We have experienced little difficulty in accessing collateral when required. The amounts of credit risk shown, therefore, greatly exceed expected losses, which are included in the allowance for loan losses.
Various legal claims also arise from time to time in the normal course of business that, in the opinion of management, will have no material effect on our consolidated financial statements.
NOTE 15 – STOCK COMPENSATION AND BENEFIT PLANS
In May 2014, Monarch shareholders ratified the adoption of the Monarch Bank 2014 Equity Incentive Plan ("2014EIP"), a stock-based compensation plan which succeeds the Monarch Bank 2006 Equity Incentive Plan (“2006EIP”). The 2006EIP had succeeded the 1999 Incentive Stock Plan ("99ISO") and was the only plan under which equity-based compensation could be awarded. Like the 2006EIP, the 2014EIP authorizes the compensation committee to grant options, stock appreciation rights, stock awards, performance stock awards, and stock units to designated directors, officers, key employees, consultants and advisers to the Company and its subsidiaries.
The 2014EIP authorized the Company to issue up to 1,100,000 shares of Monarch Common Stock plus the number of shares of our Common Stock outstanding under the predecessor plans. The Plan provides that no award may be granted more than 10 years after the May 2014 ratification. As of December 31, 2015, 114,299 shares were available for grants under the predecessor plans. A total of 441,040 shares are subject to outstanding awards under the 2006EIP and 1999ISO, including 0 stock options and 441,040 shares of non-vested restricted stock.
The following is a summary of our stock option activity, and related information. All shares and per share prices have been restated for stock splits and dividends in the years presented:
2015 | 2014 | ||||||||||||||
Options | Number of Options | Weighted Average Exercise Price | Aggregate Intrinsic Value | Number of Options | Weighted Average Exercise Price | ||||||||||
Outstanding - Beginning of year | 114,526 | 7.13 | 161,181 | 6.95 | |||||||||||
Granted | — | — | — | — | |||||||||||
Exercised | (114,526 | ) | (7.13 | ) | (46,655 | ) | 6.53 | ||||||||
Forfeited | — | — | — | — | |||||||||||
Outstanding - End of year | — | — | $ | — | 114,526 | 7.13 | |||||||||
Options exercisable at year-end | — | — | $ | — | 114,526 | 7.13 | |||||||||
The aggregate intrinsic value is calculated as the difference between the exercise price of the underlying awards and the quoted price of our common stock for those awards that have an exercise price currently below the closing price. There were 114,526 options exercised during the year ended December 31, 2015 and 46,655 options exercised during the year ended December 31, 2014. All remaining options were exercised prior to December 31, 2015. The total intrinsic value of options exercised during the year ended December 31, 2015 was $484,860. No options were granted under the plan in 2015 or 2014.
101
Cash received for option exercise under share-based payment arrangements for 2015 and 2014 was $756,238 and $304,673, respectively. Tax benefits of $170,415 and $251,452 were recognized in 2015 and 2014, respectively. There were no options outstanding at December 31, 2015.
A summary of the status of the our non-vested shares in relation to our restricted stock awards as of December 31, 2015 and 2014, and changes during the years ended December 31, 2015 and 2014, is presented below; the weighted average price is the weighted average fair value at the date of grant:
2015 | 2014 | ||||||||||||
Restricted Share Awards | Shares | Weighted Average Price | Shares | Weighted Average Price | |||||||||
Non-vested - Beginning of year | 360,525 | $ | 7.50 | 355,036 | $ | 6.45 | |||||||
Granted | 152,180 | 11.96 | 96,525 | 10.12 | |||||||||
Vested | (54,065 | ) | 6.06 | (84,216 | ) | 6.11 | |||||||
Forfeited | (17,600 | ) | 7.21 | (6,820 | ) | 7.45 | |||||||
Non-vested - End of year | 441,040 | $ | 9.84 | 360,525 | $ | 7.50 | |||||||
Compensation expense related to the restricted stock awards was $833,251, $824,497 and $593,721 for 2015, 2014 and 2013, respectively. The total fair value of awards vested during 2015 and 2014 was $689,773 and $1,010,592, respectively. As of December 31, 2015 and 2014, there was $2,469,548 and $1,587,427, respectively, of total unrecognized cost related to the non-vested share-based compensation arrangements granted under the 2006EIP. That cost is expected to be recognized over a weighted-average period of 2.6 years. The grant date fair value of common stock is used in determining unused compensation cost.
Other information pertaining to restricted stock at December 31, 2015 is as follows:
Range of Issuance Prices | Number Outstanding | Remaining Contractual Life | ||
$5.83 to $12.79 | 441,040 | 2.47 | ||
We have a 401(k) defined contribution plan applicable to all eligible employees. Contributions to the plan are made at the employee’s election. Employees may contribute up to 91% of their salaries up to IRS limits. We began making contributions in April 2001. We match 37.5% of the first 6.0% of employee contributions in 2015. We matched 50% of the first 6.0% of employee contributions in 2014 and 2013. Our expense for 2015, 2014 and 2013 was $740,848, $893,516 and $960,102, respectively.
In addition, Monarch has supplemental retirement benefits provided to its executives under a supplemental executive retirement plan ("SERP") executed in 2006. Although technically unfunded, insurance policies on the lives of the covered executives are also available to finance future benefits. The Bank is the owner and beneficiary of these policies. The expense for 2015 and 2014 was $384,750 and $381,993, respectively. Total expected expense for 2016 is $278,003. The following were significant actuarial assumptions used to determine benefit obligations:
102
December 31, 2015 | December 31, 2014 | |||||||
Actuarial Assumptions | ||||||||
Weighted average assumed discount rate | 4.50 | % | 4.50 | % | ||||
Changes in Projected Benefit Obligation | ||||||||
Projected benefit obligation, January 1 | $ | 2,110,746 | $ | 1,777,773 | ||||
Service cost | 278,004 | 322,080 | ||||||
Interest cost | 101,869 | 90,893 | ||||||
Benefits paid | (125,000 | ) | (80,000 | ) | ||||
Projected benefit obligation, December 31, | $ | 2,365,619 | $ | 2,110,746 | ||||
Amounts Recognized in Accumulated Other Comprehensive Income | ||||||||
Actuarial gain due to change in discount rate | $ | 18,765 | $ | 7,920 | ||||
Deferred income tax expense | (6,568 | ) | (2,772 | ) | ||||
$ | 12,197 | $ | 5,148 | |||||
The SERP liability, equal to the projected benefit obligation above, is included in other liabilities on the Company's consolidated statements of condition. SERP payments for executives or their beneficiaries are in pre-determined fixed annual payments that begin at age 65 and continue for 10 years.
In July 2014, Monarch established an executive savings plan. A grantor or Rabbi Trust was established as a vehicle for accumulating assets to pay benefits under the plan. The balance in Rabbi Trust was $2,780,642 at December 31, 2015 and $2,018,154 at December 31, 2014. Participants in the executive savings plan are allowed to defer up to 70% of their base salary and100% of bonuses, which can be invested in a pre-determined list of investments. Participants may also defer up to 100% of vested restricted stock into the plan. These shares remain in share form and move with the market value of the shares. The table below summarizes the activities associated with the executive savings plan in 2015 and 2014.
Deferred Liability | 2015 | 2014 | ||||||
Balance January 1, | $ | 29,914 | $ | — | ||||
Employee deferrals | 535,930 | 29,469 | ||||||
Employer contributions | 566,790 | — | ||||||
Employee distributions | (24,311 | ) | — | |||||
Gain (loss) in value of investments | 139,481 | 445 | ||||||
Balance December 31, | $ | 1,247,804 | $ | 29,914 | ||||
Rabbi Trust | 2015 | 2014 | ||||||
Balance January 1, | $ | 2,018,154 | $ | — | ||||
Additional asset purchases | 704,068 | 2,000,000 | ||||||
Gain in asset value | 58,240 | 18,154 | ||||||
$ | 2,780,462 | $ | 2,018,154 | |||||
NOTE 16 – RELATED PARTY TRANSACTIONS
We have loan transactions with our executive officers and directors, and with companies in which our executive officers and directors have a financial interest. Management believes these transactions occurred in the ordinary course of business on substantially the same terms as those prevailing at the time for persons not related to the lender. A summary of related party loan activity is as follows during 2015 and 2014.
103
2015 | 2014 | ||||||
Outstanding - Beginning of year | $ | 27,802,991 | $ | 26,514,743 | |||
Originations | 21,749,863 | 23,634,933 | |||||
Repayments | (18,003,462 | ) | (22,346,685 | ) | |||
Outstanding - End of year | $ | 31,549,392 | $ | 27,802,991 | |||
Commitments to extend credit and letters of credit to related parties amounted to $16,435,765 and $14,816,690 at December 31, 2015 and 2014, respectively.
At December 31, 2015 and 2014 total deposits held by related parties were $10,061,209 and $7,515,201, respectively.
NOTE 17 – REGULATORY CAPITAL REQUIREMENTS
The Company and the Bank are subject to various regulatory capital requirements administered by the federal banking agencies. Failure to meet minimum capital requirements can initiate certain mandatory and possibly additional discretionary actions by regulators that, if undertaken, could have a direct material effect on our financial statements. Under capital adequacy guidelines and the regulatory framework for prompt corrective action, banks must meet specific capital guidelines that involve quantitative measures of the bank’s assets, liabilities, and certain off-balance-sheet items as calculated under regulatory accounting practices. Capital amounts and classification are also subject to qualitative judgments by the regulators about components (such as interest rate risk), risk weighting, and other factors.
The Bank, as a Virginia banking corporation, may only pay dividends from retained earnings. In addition, regulatory authorities may limit payment of dividends by any bank, when it is determined that such limitation is in the public interest and necessary to ensure financial soundness of the Bank. Regulatory agencies place certain restrictions on dividends paid and loans and loans or advances made by the Bank to the Company. The amount of dividends the Bank may pay to the Company, without prior approval, is limited to current year earnings, plus retained net profits for the two preceding years. At December 31, 2015, the amount available was approximately $30.0 million. Loans and advances are limited to 15% of the Bank’s common stock and capital surplus plus estimated allowance for loan losses. As of December 31, 2015, funds available for loans or advances by the Bank to the Company were approximately $20.3 million.
Quantitative measures established by regulation to ensure capital adequacy require that the Bank maintain minimum amounts and ratios (set forth in the table below) of total and Tier 1 capital (as defined in the regulations) to risk-weighted assets (as defined), and of Tier 1 capital (as defined) to average assets (as defined). Management believes, as of December 31, 2015, the Bank meets all capital adequacy requirements to which it is subject.
As of December 31, 2015 the Bank was categorized as “well capitalized”, the highest level of capital adequacy. To be categorized as well capitalized, the Bank must maintain minimum total risk-based, Tier 1 risk-based, Common Equity Tier I Capital and Tier 1 leverage ratios as set forth in the table. The Company is also subject to certain capital adequacy ratio requirements. The Company and Bank’s actual capital amounts and ratios are also presented in the table as of December 31, 2015 and 2014.
The final rules implementing Basel Committee on Banking Supervision's capital guidelines for U.S. banks ("Basel III rules") became effective on January 1, 2015, with full compliance with all of the requirements being phased in over a multi-year schedule, and fully phased in by January 1, 2016. As part of the new requirements, the Common Equity Tier I Capital ("CETI") is calculated and utilized in the assessment of capital for all institutions. Capital amounts and ratios for December 31, 2014 were calculated using the Basel I rules, which were effective until January 1, 2015.
104
Actual | For Capital Adequacy Purposes | To Be Well Capitalized Under Prompt Corrective Action | ||||||||||||||||||
Amounts | Ratio | Amounts | Ratio | Amounts | Ratio | |||||||||||||||
(Dollars in Thousands) | ||||||||||||||||||||
As of December 31, 2015 | ||||||||||||||||||||
Total Risk-Based Capital Ratio | ||||||||||||||||||||
Consolidated Company | $ | 135,955 | 13.69 | % | $ | 79,411 | 8.00 | % | N/A | N/A | ||||||||||
Bank | $ | 134,953 | 13.60 | % | $ | 79,386 | 8.00 | % | $ | 99,230 | 10.00 | % | ||||||||
(Total Risk-Based Capital to Risk-Weighted Assets) | ||||||||||||||||||||
Tier 1 Risk-Based Capital Ratio | ||||||||||||||||||||
Consolidated Company | $ | 127,068 | 12.80 | % | $ | 59,558 | 6.00 | % | N/A | N/A | ||||||||||
Bank | $ | 126,066 | 12.70 | % | $ | 59,539 | 6.00 | % | $ | 79,411 | 8.00 | % | ||||||||
(Tier 1 Capital to Risk-Weighted Assets) | ||||||||||||||||||||
Common Equity Risk-Based Capital (CETI) | ||||||||||||||||||||
Consolidated Company | $ | 117,068 | 11.79 | % | $ | 44,669 | 4.50 | % | N/A | N/A | ||||||||||
Bank | $ | 126,066 | 12.70 | % | $ | 44,655 | 4.50 | % | $ | 64,501 | 6.50 | % | ||||||||
(Total Comon Equity to Risk-Weighted Assets) | ||||||||||||||||||||
Tier 1 Leverage Ratio | ||||||||||||||||||||
Consolidated Company | $ | 127,068 | 11.56 | % | $ | 43,968 | 4.00 | % | N/A | N/A | ||||||||||
Bank | $ | 126,066 | 11.48 | % | $ | 43,925 | 4.00 | % | $ | 54,907 | 5.00 | % | ||||||||
(Tier 1 Capital to Average Assets) | ||||||||||||||||||||
As of December 31, 2014 | ||||||||||||||||||||
Total Risk-Based Capital Ratio | ||||||||||||||||||||
Consolidated Company | $ | 125,728 | 13.79 | % | $ | 72,925 | 8.00 | % | N/A | N/A | ||||||||||
Bank | $ | 125,807 | 13.81 | % | $ | 72,900 | 8.00 | % | $ | 91,125 | 10.00 | % | ||||||||
(Total Risk-Based Capital to Risk-Weighted Assets) | ||||||||||||||||||||
Tier 1 Risk-Based Capital Ratio | ||||||||||||||||||||
Consolidated Company | $ | 116,779 | 12.81 | % | $ | 36,462 | 4.00 | % | N/A | N/A | ||||||||||
Bank | $ | 116,858 | 12.82 | % | $ | 36,450 | 4.00 | % | $ | 54,675 | 6.00 | % | ||||||||
(Tier 1 Capital to Risk-Weighted Assets) | ||||||||||||||||||||
Tier 1 Leverage Ratio | ||||||||||||||||||||
Consolidated Company | $ | 116,779 | 11.44 | % | $ | 40,821 | 4.00 | % | N/A | N/A | ||||||||||
Bank | $ | 116,858 | 11.45 | % | $ | 40,821 | 4.00 | % | $ | 51,026 | 5.00 | % | ||||||||
(Tier 1 Capital to Average Assets) | ||||||||||||||||||||
NOTE 18 – FAIR VALUE OF FINANCIAL INSTRUMENTS
Fair Value Hierarchy and Fair Value Measurement
We group our assets and liabilities that are recorded at fair value in three levels, based on the markets in which the assets and liabilities are traded and the reliability of the assumptions used to determine fair value. These levels are:
• | Level 1 – Valuations based on quoted prices in active markets for identical assets or liabilities. Since valuations are based on quoted prices that are readily and regularly available in an active market, valuation of these products does not entail a significant degree of judgment. |
• | Level 2 – Valuations based on quoted prices for similar instruments in active markets; quoted prices for identical or similar instruments in markets that are not active; and model-based valuations for which all significant assumptions are observable or can be corroborated by observable market data. |
• | Level 3 – Valuations based on unobservable inputs that are supported by little or no market activity and that are significant to the fair value of the assets or liabilities. Valuations are determined using pricing models and discounted cash flow models and includes management judgment and estimation which may be significant. |
The methods we use to determine fair value on an instrument specific basis are detailed in the section titled “Valuation Methods” below.
105
The following table presents the carrying amounts and fair value of our financial instruments at December 31, 2015 and December 31, 2014. GAAP defines the fair value of a financial instrument as the amount at which the instrument could be exchanged in a current transaction between willing parties, other than through a forced or liquidation sale for purposes of this disclosure. The carrying amounts in the table are included in the consolidated balance sheet under the indicated captions.
Estimation of Fair Values
Fair Value Measurements at December 31, 2015 using | |||||||||||||||||||
Quoted Prices in Active Markets for Identical Assets | Significant Other Observable Inputs | Significant Unobservable Inputs | |||||||||||||||||
Carrying Value | Level 1 | Level 2 | Level 3 | Fair Value | |||||||||||||||
Assets | |||||||||||||||||||
Cash and cash equivalents | $ | 73,879,510 | $ | 73,879,510 | $ | — | $ | — | $ | 73,879,510 | |||||||||
Investment securities available for sale | 30,213,130 | — | 30,213,130 | — | 30,213,130 | ||||||||||||||
Mortgage loans held for sale | 169,345,205 | — | 169,345,205 | — | 169,345,205 | ||||||||||||||
Loans held for investment (net) | 820,382,106 | — | — | 834,345,931 | 834,345,931 | ||||||||||||||
Accrued interest receivable | 2,110,108 | — | 2,110,108 | — | 2,110,108 | ||||||||||||||
Bank owned life insurance | 10,634,814 | — | 10,634,814 | — | 10,634,814 | ||||||||||||||
Derivative financial assets | 2,105,204 | — | 2,105,204 | — | 2,105,204 | ||||||||||||||
Liabilities | |||||||||||||||||||
Deposits | $ | 999,093,598 | $ | — | $ | 996,519,992 | $ | — | $ | 996,519,992 | |||||||||
Borrowings | 26,000,000 | — | 16,000,000 | 6,184,750 | 22,184,750 | ||||||||||||||
Accrued interest payable | 104,517 | — | 104,517 | — | 104,517 | ||||||||||||||
Derivative financial liability | 368,577 | — | 368,577 | — | 368,577 | ||||||||||||||
Fair Value Measurements at December 31, 2014 using | |||||||||||||||||||
Quoted Prices in Active Markets for Identical Assets | Significant Other Observable Inputs | Significant Unobservable Inputs | |||||||||||||||||
Carrying Value | Level 1 | Level 2 | Level 3 | Fair Value | |||||||||||||||
Assets | |||||||||||||||||||
Cash and cash equivalents | $ | 65,428,974 | $ | 65,428,974 | $ | — | $ | — | $ | 65,428,974 | |||||||||
Investment securities available for sale | 23,725,362 | — | 23,725,362 | — | 23,725,362 | ||||||||||||||
Mortgage loans held for sale | 147,690,276 | — | 147,690,276 | — | 147,690,276 | ||||||||||||||
Loans held for investment (net) | 763,640,698 | — | — | 776,974,812 | 776,974,812 | ||||||||||||||
Accrued interest receivable | 2,087,880 | — | 2,087,880 | — | 2,087,880 | ||||||||||||||
Bank owned life insurance | 9,656,803 | — | 9,656,803 | — | 9,656,803 | ||||||||||||||
Derivative financial assets | 1,514,083 | — | 1,514,083 | — | 1,514,083 | ||||||||||||||
Liabilities | |||||||||||||||||||
Deposits | $ | 919,413,913 | $ | — | $ | 917,008,847 | $ | — | $ | 917,008,847 | |||||||||
Borrowings | 21,075,497 | — | 11,109,566 | 5,641,087 | 16,750,653 | ||||||||||||||
Accrued interest payable | 43,280 | — | 43,280 | — | 43,280 | ||||||||||||||
Derivative financial liability | 1,195,405 | — | 1,195,405 | — | 1,195,405 | ||||||||||||||
The following notes summarize the significant assumptions used in estimating the fair value of financial instruments:
Short-term financial instruments are valued at their carrying amounts included in the Company’s statement of condition, which are reasonable estimates of fair value due to the relatively short period to maturity of the instruments. This approach applies to cash and cash equivalents and overnight borrowings.
Loans held for sale are recorded at their fair value when originated, based on our expected return from the secondary market.
Loans held for investment are valued on the basis of estimated future receipts of principal and interest, which are discounted at various rates. Loan prepayments are assumed to occur at the same rate as in previous periods when interest rates were at levels similar to current levels. Future cash flows for homogeneous categories of consumer loans, such as motor vehicle loans, are estimated on a portfolio basis and discounted at current rates offered for similar loan terms to new borrowers with similar credit profiles.
106
The carrying amounts of accrued interest approximate fair value.
Interest rate lock commitments ("IRLC") are recorded at fair value, which is based on estimated future receipts net of estimated future expenses when the underlying loan is sold on the secondary market, using observable Level 2 market inputs, reflecting current market inputs as of the measurement date.
Bank owned life insurance represents insurance policies on officers of the Bank. The cash values of the policies are estimated using information provided by insurance carriers. These policies are carried at their cash surrender value, which approximates the fair value.
The fair value of demand deposits and deposits with no defined maturity is taken to be the amount payable on demand at the reporting date. The fair value of fixed-maturity deposits is estimated using rates currently offered for deposits of similar remaining maturities. The intangible value of long-term relationships with depositors is not taken into account in estimating the fair values disclosed.
The fair value of all borrowings is based on discounting expected cash flows at the interest rate of debt with the same or similar remaining maturities and collateral requirements.
Derivative financial instruments are recorded at fair value, which is based on the income approach using observable Level 2 market inputs related to:
Loans held for sale forward sales commitments are recorded at their fair value based on the estimated number of days remaining in the IRLC at the measurement date and expected return from the secondary market. Forward mortgage loan sales commitments are recorded at their fair value based on the gain or loss that would occur if the loan were paired off with an investor at measurement date.
It is not practicable to separately estimate the fair values for off-balance-sheet credit commitments, including standby letters of credit and guarantees written, due to the lack of cost-effective reliable measurement methods for these instruments.
The following table presents our assets and liabilities, which are measured at fair value on a recurring basis for each of the fair value hierarchy levels, as of December 31, 2015 and December 31, 2014:
Fair Value Measurements at Reporting Date Using | |||||||||||||||
Fair Value | Quoted Prices in Active Markets for Identical Assets (Level 1) | Significant Other Observable Inputs (Level 2) | Significant Unobservable Inputs (Level 3) | ||||||||||||
Description | |||||||||||||||
December 31, 2015 | |||||||||||||||
Investment securities - available for sale | |||||||||||||||
U.S. government agency obligations | $ | 26,236,245 | $ | — | $ | 26,236,245 | $ | — | |||||||
Mortgage-backed securities | 998,389 | — | 998,389 | — | |||||||||||
Municipal securities | 2,978,496 | — | 2,978,496 | — | |||||||||||
Loans held for sale | 169,345,205 | — | 169,345,205 | — | |||||||||||
Derivative financial asset | 2,105,204 | — | 2,105,204 | — | |||||||||||
Derivative financial liability | $ | 368,577 | $ | — | $ | 368,577 | $ | — | |||||||
December 31, 2014 | |||||||||||||||
Investment securities - available for sale | |||||||||||||||
U.S. government agency obligations | $ | 20,453,875 | $ | — | $ | 20,453,875 | $ | — | |||||||
Mortgage-backed securities | 1,283,633 | — | 1,283,633 | — | |||||||||||
Municipal securities | 1,987,854 | — | 1,987,854 | — | |||||||||||
Loans held for sale | 147,690,276 | — | 147,690,276 | — | |||||||||||
Derivative financial asset | 1,514,083 | — | 1,514,083 | — | |||||||||||
Derivative financial liability | $ | 1,195,405 | $ | — | $ | 1,195,405 | $ | — | |||||||
The following table provides quantitative disclosures about the fair value measurements of our assets related to continuing operations which are measured at fair value on a nonrecurring basis as of December 31, 2015 and 2014:
107
Fair Value Measurements at Reporting Date Using | |||||||||||||||
Description | Fair Value | Quoted Prices in Active Markets for Identical Assets (Level 1) | Significant Other Observable Inputs (Level 2) | Significant Unobservable Inputs (Level 3) | |||||||||||
At December 31, 2015 | |||||||||||||||
Restructured and impaired loans | $ | 3,097,747 | $ | — | $ | — | $ | 3,097,747 | |||||||
At December 31, 2014 | |||||||||||||||
Real estate owned | $ | 144,000 | $ | — | $ | — | $ | 144,000 | |||||||
Restructured and impaired loans | $ | 6,381,231 | $ | — | $ | — | $ | 6,381,231 | |||||||
The following table displays quantitative information about Level 3 Fair Value Measurements for December 31, 2015 and 2014.
Fair Value Measurement at December 31, 2015 | ||||||||
Fair Value | Valuation Technique | Unobservable Inputs | Weighted Average | |||||
Commercial | $ | — | Market comparables | Discount applied to market comparables (1) | 100% | |||
Real Estate | ||||||||
Construction | 104,445 | Market comparables | Discount applied to market comparables (1) | 35% | ||||
Residential (1-4 family) | 1,324,407 | Market comparables | Discount applied to market comparables (1) | 18% | ||||
Home equity lines | 306,147 | Market comparables | Discount applied to market comparables (1) | 20% | ||||
Multifamily | — | Market comparables | Discount applied to market comparables (1) | 100% | ||||
Commercial | 1,362,748 | Market comparables | Discount applied to market comparables (1) | 30% | ||||
Consumers | ||||||||
Consumer and installment loans | — | Market comparables | Discount applied to market comparables (1) | 100% | ||||
Total restructures and impaired loans | $ | 3,097,747 | ||||||
Fair Value Measurement at December 31, 2014 | ||||||||
Fair Value | Valuation Technique | Unobservable Inputs | Weighted Average | |||||
Commercial | $ | 1,108,698 | Market comparables | Discount applied to market comparables (1) | 34% | |||
Real Estate | ||||||||
Construction | 236,754 | Market comparables | Discount applied to market comparables (1) | 36% | ||||
Residential (1-4 family) | 3,231,952 | Market comparables | Discount applied to market comparables (1) | 22% | ||||
Home equity lines | 438,500 | Market comparables | Discount applied to market comparables (1) | 22% | ||||
Multifamily | — | Market comparables | Discount applied to market comparables (1) | —% | ||||
Commercial | 1,365,327 | Market comparables | Discount applied to market comparables (1) | 13% | ||||
Consumers | ||||||||
Consumer and installment loans | — | Market comparables | Discount applied to market comparables (1) | —% | ||||
Total restructures and impaired loans | $ | 6,381,231 | ||||||
Real estate owned | $ | 144,000 | Market comparables | Discount applied to market comparables (1) | 11% | |||
(1) A discount percentage is applied based on age of independent appraisals, current market conditions, and experience within the local markets.
Valuation Methods
Investment securities – available-for-sale are recorded at fair value on a recurring basis. Fair value measurement is based upon quoted market prices, when available (Level 1). If quoted market prices are not available, fair values are measured utilizing independent valuation techniques of identical or similar securities for which significant assumptions are derived primarily from or corroborated by observable market data (Level 2). If the inputs used to provide the evaluation for certain securities are unobservable and/or there is little, if any, market activity then the security would fall to the lowest level of hierarchy (Level 3).
The Company's investment portfolio is primarily valued using fair value measurements that are considered to be Level 2. The Company has contracted a third party portfolio accounting service vendor for valuation of its securities. The vendor's primary source for security valuation is Interactive Data Corporation ("IDC"), which evaluates securities based on market data. IDC utilizes evaluated pricing models that vary by asset class and include available trade, bid, and other market information.
108
Generally, the methodology includes broker quotes, proprietary modes, vast descriptive terms and conditions databases, as well as extensive quality control programs.
The vendor utilized proprietary valuation matrices for valuing all municipal securities. The initial curves for determining the price, movement, and yield relationships within the municipal matrices are derived from industry benchmark curves or sourced from a municipal trading desk. The securities are further broken down according to issuer, credit support, state of issuance and rating to incorporate additional spreads to the industry benchmark curves.
Real estate owned is carried at the lower of carrying value or fair value less estimated selling costs. Upon foreclosure and through liquidation, we evaluate the property’s fair value as compared to its carrying amount and record a valuation adjustment when the carrying amount exceeds fair value less selling costs. Any valuation adjustments at the time a loan becomes real estate owned is charged to the allowance for loan losses. Fair value is determined through an appraisal conducted by an independent, licensed appraiser outside of the Bank using observable market data. When evaluating fair value, management may discount the appraisal further if, based on their understanding of the market conditions, it is determined the collateral is further impaired below the appraised value (Level 3). Any subsequent valuation adjustments are applied to earnings in our consolidated statements of income. We recorded $0 losses due to valuation adjustments on real estate owned within foreclosed property expense in non-interest expense in December 31, 2015 and 2014, respectively. The Company had no properties in real estate owned at December 31, 2015 and one property in real estate owned at December 31, 2014.
Restructured and impaired loans are generally valued based on the present value of expected future cash flows discounted at the loan’s effective interest rate, unless in the case of collateral-dependent loans, the observable market price, or the fair value of the collateral can be readily determined. The value of real estate collateral is determined utilizing an income or market valuation approach based on an appraisal conducted by an independent, licensed appraiser outside of the Bank using observable market data. When evaluating fair value, management may discount the appraisal further if, based on their understanding of the market conditions, it is determined the collateral is further impaired below the appraised value (Level 3). The value of business equipment is based upon an outside appraisal if deemed significant, or the net book value on the applicable business's financial statements if not considered significant using observable market data. Likewise, values for inventory and accounts receivables collateral are based on financial statement balances or aging reports (Level 3). Restructured and impaired loans are periodically reevaluated to determine if additional adjustments to the carrying value are necessary.
NOTE 19 – EARNINGS PER SHARE RECONCILIATION
The following is a reconciliation of the numerators and denominators of the basic and diluted earnings per share computations.
2015 | 2014 | 2013 | |||||||||
Net Income available for common stock (numerator, basic) | $ | 13,214,821 | $ | 11,211,850 | $ | 11,091,007 | |||||
Weighted average shares outstanding (denominator) | 11,840,837 | 11,681,387 | 11,183,871 | ||||||||
Income per common share - basic | $ | 1.12 | $ | 0.96 | $ | 0.99 | |||||
Net income | $ | 13,214,821 | $ | 11,211,850 | $ | 11,091,007 | |||||
Weighted average shares - diluted (denominator) | 11,853,128 | 11,724,460 | 11,329,418 | ||||||||
Income per common share - diluted | $ | 1.11 | $ | 0.96 | $ | 0.98 | |||||
Dilutive effect - average number of common shares | 12,291 | 43,073 | 67,099 | ||||||||
Dilutive effect - average number of convertible non-cumulative perpetual preferred, if converted | — | — | 78,448 | ||||||||
Dilutive effect - average number of shares | 12,291 | 43,073 | 145,547 | ||||||||
Share and per share amounts have been restated to include the 11 for 10 stock dividend announced October 22, 2015 and payable December 4, 2015. The dilutive effect of stock options is 12,291, 43,073 and 67,099 shares for 2015, 2014 and 2013 respectively. The dilutive effect of the conversion to common stock of our convertible non-cumulative perpetual preferred stock was 78,448 in 2013. There were no anti-dilutive options excluded from the dilutive earnings per share calculation in 2015, 2014 and 2013.
NOTE 20 – SEGMENT REPORTING
Reportable segments include community banking and mortgage banking services. Community banking involves making loans to and generating deposits from individuals and businesses in the markets where the Bank has offices. Mortgage banking originates residential loans and subsequently sells them to investors. The mortgage banking segment is a strategic business unit that offers different products and services. It is managed separately because the segment appeals to different markets and, accordingly, requires different technology and marketing strategies.
109
The financial presentation for reportable segments has been modified to assist the reader in understanding the components of the segments. Funding for mortgage banking services' loans held for sale (LHFS) portfolio is provided by community banking services. For segmentation purposes the community banking segment charges the mortgage banking segment interest on average LHFS balances outstanding at a rate of the three month average 30 day London Interbank Offered Rate (LIBOR) plus 250 basis points.
The mortgage banking segment's most significant revenue and expense is non-interest income and non-interest expense, respectively. Under the mortgage banking segment we have broken out "forward rate commitments and unrealized hedge gain (loss)" because these represent changes in our derivative position. Our derivative position is impacted by the number and dollar volume of loans locked with a borrower but not closed, changes in the market value of notional security sales, and the delivery method utilized for closed but not committed loans.
In the event of early payment default, mortgage banking services has recorded a reserve for loan repurchases which was $3,287,667 at December 31, 2015 and $3,013,396 at December 31, 2014, which is not a part of our loan loss reserve and is carried in other liabilities. This reserve is an estimate of the potential for losses at any given time based on investor contracts and are not an indication such loss will occur.
The Bank does not have other reportable operating segments. The accounting policies of the segment are the same as those described in the summary of significant accounting policies. All inter-segment sales prices are market based.
Segment information for the years 2015, 2014 and 2013 is shown in the following table.
Selected Financial Information
Community Banking Segment | |||||||||||
Twelve Months Ended December 31, | |||||||||||
Income: | 2015 | 2014 | 2013 | ||||||||
Interest income | $ | 45,674,497 | $ | 41,252,559 | $ | 43,282,961 | |||||
Non-interest income | 5,535,631 | 4,639,228 | 4,697,595 | ||||||||
Total operating income | 51,210,128 | 45,891,787 | 47,980,556 | ||||||||
Expenses: | |||||||||||
Interest expense | (3,147,136 | ) | (3,661,164 | ) | (4,786,458 | ) | |||||
Provision for loan losses | — | — | — | ||||||||
Personnel expense | (18,250,993 | ) | (15,178,262 | ) | (14,118,094 | ) | |||||
Other non-interest expenses | (13,392,789 | ) | (11,775,699 | ) | (10,357,092 | ) | |||||
Total operating expenses | (34,790,918 | ) | (30,615,125 | ) | (29,261,644 | ) | |||||
Income before income taxes | 16,419,210 | 15,276,662 | 18,718,912 | ||||||||
Provision for income taxes | (5,947,629 | ) | (5,530,091 | ) | (6,449,951 | ) | |||||
Less: Net income attributable to non-controlling interests | (62,957 | ) | (29,287 | ) | (47,305 | ) | |||||
Net income attributable to community banking segment | $ | 10,408,624 | $ | 9,717,284 | $ | 12,221,656 | |||||
110
Mortgage Banking Segment | |||||||||||
Twelve Months Ended December 31, | |||||||||||
Income: | 2015 | 2014 | 2013 | ||||||||
Interest income | $ | 5,963,440 | $ | 4,866,818 | $ | 7,021,186 | |||||
Non-interest income | 78,891,711 | 60,613,538 | 65,184,676 | ||||||||
Total operating income | 84,855,151 | 65,480,356 | 72,205,862 | ||||||||
Expenses: | |||||||||||
Interest expense | (4,242,754 | ) | (3,128,470 | ) | (5,955,710 | ) | |||||
Personnel expense | (57,829,528 | ) | (42,980,683 | ) | (48,339,087 | ) | |||||
Other non-interest expenses | (18,698,351 | ) | (17,440,014 | ) | (18,096,545 | ) | |||||
Total operating expenses | (80,770,633 | ) | (63,549,167 | ) | (72,391,342 | ) | |||||
Net operating income | 4,084,518 | 1,931,189 | (185,480 | ) | |||||||
Forward rate commitments and hedge gain | 486,700 | 721,277 | — | ||||||||
Income before income taxes | 4,571,218 | 2,652,466 | (185,480 | ) | |||||||
Provision for income taxes | (1,655,859 | ) | (960,182 | ) | 63,911 | ||||||
Less: Net income attributable to non-controlling interests | (128,830 | ) | (197,718 | ) | (1,009,080 | ) | |||||
Net income (loss) attributable to mortgage banking segment | $ | 2,786,529 | $ | 1,494,566 | $ | (1,130,649 | ) | ||||
Consolidated Statements of Income | |||||||||||
Twelve Months Ended December 31, | |||||||||||
Income: | 2015 | 2014 | 2013 | ||||||||
Interest income | $ | 47,395,183 | $ | 42,990,907 | $ | 44,348,437 | |||||
Non-interest income | 85,114,092 | 67,079,241 | 69,882,271 | ||||||||
Total operating income | 132,509,275 | 110,070,148 | 114,230,708 | ||||||||
Expenses: | |||||||||||
Interest expense | (3,147,136 | ) | (3,661,164 | ) | (4,786,458 | ) | |||||
Provision for loan losses | — | — | — | ||||||||
Personnel expense | (76,344,608 | ) | (58,889,631 | ) | (62,457,181 | ) | |||||
Other non-interest expenses | (32,027,103 | ) | (29,590,225 | ) | (28,453,637 | ) | |||||
Total operating expenses | (111,518,847 | ) | (92,141,020 | ) | (95,697,276 | ) | |||||
Income before income taxes | 20,990,428 | 17,929,128 | 18,533,432 | ||||||||
Provision for income taxes | (7,583,820 | ) | (6,490,273 | ) | (6,386,040 | ) | |||||
Less: Net income attributable to non-controlling interests | (191,787 | ) | (227,005 | ) | (1,056,385 | ) | |||||
Net income attributable to Monarch Financial Holdings, Inc. | $ | 13,214,821 | $ | 11,211,850 | $ | 11,091,007 | |||||
Elimination entries: | ||||||||
Interest income | (4,242,754 | ) | (3,128,470 | ) | (5,955,710 | ) | ||
Interest expense | 4,242,754 | 3,128,470 | 5,955,710 | |||||
Non-interest income | (686,750 | ) | (1,825,475 | ) | — | |||
Personnel expense | 264,087 | 730,686 | — | |||||
Other non-interest expenses | (64,037 | ) | 374,512 | — | ||||
Forward rate commitments and hedge gain | 486,700 | 721,277 | — | |||||
111
Community Banking | Mortgage Banking | Elimination entries | Consolidated | ||||||||||||
Segment Assets | |||||||||||||||
December 31, 2015 | $ | 996,432,802 | $ | 192,062,857 | $ | (27,047,504 | ) | $ | 1,161,448,155 | ||||||
December 31, 2014 | $ | 915,521,105 | $ | 162,761,389 | $ | (11,545,520 | ) | $ | 1,066,736,974 | ||||||
Capital Expenditures | |||||||||||||||
December 31, 2015 | $ | 1,359,215 | $ | 424,271 | $ | — | $ | 1,783,486 | |||||||
December 31, 2014 | $ | 3,932,268 | $ | 352,505 | $ | — | $ | 4,284,773 | |||||||
NOTE 21 – CONDENSED PARENT COMPANY ONLY FINANCIAL INFORMATION
The condensed financial position as of December 31, 2015 and December 31, 2014 and the condensed results of operations and cash flows for Monarch Financial Holdings, Inc., parent company only, for the years ended December 31, 2015, 2014 and 2013 are presented below.
CONDENSED BALANCE SHEET
December 31, 2015 | December 31, 2014 | ||||||
ASSETS | |||||||
Cash | $ | 999,929 | $ | 76,549 | |||
Investment in Monarch Bank | 126,632,039 | 117,444,721 | |||||
Investment in Trust | 310,000 | 310,000 | |||||
Other assets | 1,511 | 1,436 | |||||
Total assets | $ | 127,943,479 | $ | 117,832,706 | |||
LIABILITIES AND STOCKHOLDERS’ EQUITY | |||||||
Floating rate subordinated debenture (trust preferred securities) | $ | 10,310,000 | $ | 10,310,000 | |||
Valuation adjustment for trust preferred securities | — | — | |||||
Due to related parties | — | 71,373 | |||||
Other liabilities | — | — | |||||
Total stockholders’ equity | 117,633,479 | 107,451,333 | |||||
Total liabilities and stockholders’ equity | $ | 127,943,479 | $ | 117,832,706 | |||
CONDENSED STATEMENT OF INCOME STATEMENT AND COMPREHENSIVE INCOME
December 31, 2015 | December 31, 2014 | December 31, 2013 | |||||||||
INCOME | |||||||||||
Dividends from subsidiaries | $ | 3,956,969 | $ | 3,710,806 | $ | 2,932,006 | |||||
Dividend from non-bank subsidiary | 5,923 | 5,773 | 5,906 | ||||||||
Total income | 3,962,892 | 3,716,579 | 2,937,912 | ||||||||
EXPENSES | |||||||||||
Interest on borrowings | 196,994 | 422,017 | 552,548 | ||||||||
Miscellaneous expense | — | 14 | 2,500 | ||||||||
Total expenses | 196,994 | 422,031 | 555,048 | ||||||||
INCOME BEFORE EQUITY IN UNDISTRIBUTED NET INCOME OF SUBSIDIARIES | 3,765,898 | 3,294,548 | 2,382,864 | ||||||||
Equity in undistributed net income of subsidiaries | 9,448,923 | 7,917,302 | 8,708,143 | ||||||||
NET INCOME | $ | 13,214,821 | $ | 11,211,850 | $ | 11,091,007 | |||||
(1)Refer to the consolidated statements of comprehensive income for other comprehensive income details.
112
CONDENSED STATEMENTS OF CASH FLOWS
December 31, 2015 | December 31, 2014 | December 31, 2013 | |||||||||
Operating activities: | |||||||||||
Net income | $ | 13,214,821 | $ | 11,211,850 | $ | 11,091,007 | |||||
Adjustments to reconcile net cash provided by operating activities: | |||||||||||
Equity in undistributed net income of subsidiaries | (9,448,923 | ) | (7,917,302 | ) | (8,708,143 | ) | |||||
Stock-based compensation | 833,251 | 824,497 | 593,721 | ||||||||
Changes in: | |||||||||||
Other assets and other liabilities | 135,800 | (2,127,248 | ) | 3,209,616 | |||||||
Net cash from operating activities | 4,734,949 | 1,991,797 | 6,186,201 | ||||||||
Investing activities: | |||||||||||
None noted | — | — | — | ||||||||
Net cash from investing activities | — | — | — | ||||||||
Financing activities: | |||||||||||
Dividends paid on common stock | (3,765,897 | ) | (3,294,562 | ) | (2,440,096 | ) | |||||
Cash in lieu of fractional shares on common stock dividend | (3,991 | ) | — | (253 | ) | ||||||
Repurchase of common stock | (797,919 | ) | — | — | |||||||
Net (decrease) increase in short term borrowing | — | — | (5,000,000 | ) | |||||||
Proceeds from issuance of common stock | 756,238 | 874,136 | 1,151,325 | ||||||||
Net cash from financing activities | (3,811,569 | ) | (2,420,426 | ) | (6,289,024 | ) | |||||
CHANGE IN CASH AND CASH EQUIVALENTS | 923,380 | (428,629 | ) | (102,823 | ) | ||||||
CASH AND CASH EQUIVALENTS AT BEGINNING OF PERIOD | 76,549 | 505,178 | 608,001 | ||||||||
CASH AND CASH EQUIVALENTS AT END OF YEAR | $ | 999,929 | $ | 76,549 | $ | 505,178 | |||||
NOTE 22 - SUBSEQUENT EVENTS - COMMON STOCK DIVIDEND
On January 26, 2016 the Company announced that the Board of Monarch Financial Holdings, Inc., had approved a quarterly cash dividend of $0.09 per share for shareholders of record on February 12, 2016, payable on February 26, 2016. The total dollar value of this dividend was $1,069,282.
Item 9. | Changes in and Disagreements with Accountants on Accounting and Financial Disclosure. |
None.
Item 9A. | Controls and Procedures. |
We maintain “disclosure controls and procedures,” as such term is defined in Rule 13a-15(e) under the Securities Exchange Act of 1934 (the “Exchange Act”), which are designed to ensure that information required to be disclosed in reports that we file or submit under the Exchange Act is recorded, processed, summarized, and reported within the time periods specified in the Securities and Exchange Commission rules and forms, and that such information is accumulated and communicated to management, including the Chief Executive Officer and the Chief Financial Officer, as appropriate to allow timely decisions regarding required disclosure. In designing and evaluating its disclosure controls and procedures, management recognized that disclosure controls and procedures, no matter how well conceived and operated, can provide only reasonable assurance that the objectives of the disclosure controls and procedures are met. The design of any disclosure controls and procedures also is based in part upon certain assumptions about the likelihood of future events, and there can be no assurance that any design will succeed in achieving its stated goals under all potential future conditions.
Based on their evaluation as of the end of the period covered by this Annual Report on Form 10-K, the Chief Executive Officer and Chief Financial Officer have concluded that the disclosure controls and procedures were effective.
Management’s Report On Internal Control Over Financial Reporting is incorporated herein from Item 8. of this Form 10-K. Yount, Hyde & Barbour, an independent registered public accounting firm, has audited the effectiveness of our internal control over financial reporting as of December 31, 2015, as stated in their report which is included in this annual report on Form 10-K.
There was no change in the internal control over financial reporting that occurred during the quarter ended December 31, 2015 that has materially affected, or is reasonably likely to materially affect, the internal control over financial reporting.
113
Item 9B. | Other Information. |
None.
PART III
Item 10. | Directors, Executive Officers and Corporate Governance. |
DIRECTORS
The following biographical information discloses each director’s age, business experience in the past five years and the year each individual was first elected to the Board of Directors of the Company or previously to the Board of Directors of Monarch Bank, the predecessor to and now a wholly-owned subsidiary of the Company. In addition, this information includes the experience, qualifications, attributes, or skills that led to the conclusion that each of the Company’s directors should serve as a director at this time. Unless otherwise specified, each director has held his or her current position for at least five years.
Class I Directors, Whose Terms Will Expire in 2018
TAYLOR B. GRISSOM, 50, served as a director since Monarch Bank was founded in 1998. He is a native of Chesapeake, Virginia. He graduated from Great Bridge High School in 1983 and received a Bachelor of Arts in Business Administration from Virginia Wesleyan College in 1987, having served on their Alumni Advisory Council. Mr. Grissom served as President of State Line Sand, Inc. and was the managing partner in Higgerson Sand Company. He was a founder of VisuTel, Inc. and served as its Vice President. He is a member of Tidewater Builders Association where he currently serves as a Director. He is a founder of Blue Water Pools, Inc. and currently serves as the managing member. He is a partner in Davenport Land Management, Inc., a residential real estate development company located in Tidewater. Mr. Grissom brings value and insight into our business banking focus and the residential and commercial construction trades. These skills add great value as a board member and as a member of the Director's Loan Committee.
WILLIAM T. MORRISON, 53, joined Monarch Bank in May 2007 and was named Chief Executive Officer of Monarch Mortgage in August 2011, having previously served as Executive Vice President and Chief Operating Officer of Monarch Mortgage. Mr. Morrison is a resident of Virginia Beach, Virginia and he holds an undergraduate degree in Business Administration from Old Dominion University. He has approximately 30 years of banking experience and previously served at other local banks as Chief Operating Officer and Chief Credit Officer. Mr. Morrison’s civic and community activities include having served on the Old Dominion University Executive Advisory Council for the College of Business and Public Administration, Virginia Beach Community Service Board, the United Way Funds Distribution Committee, the Virginia Beach Youth Foundation, and the Virginia Beach Forum. Mr. Morrison’s experience, leadership, and skills in the financial and mortgage lending industries are critical in leading our mortgage division as well as his role in the many management teams and committees.
ELIZABETH T. PATTERSON, 67, and a native of Hampton Roads, has served as a director since the formation of Monarch Bank in 1998. A Certified Financial Planner (CFP), Beth is President of Waypoint Advisors, a family office specializing in wealth management, legacy and philanthropic services for families and foundations. She graduated Summa Cum Laude with a BS degree and an MBA from Old Dominion University where she also earned memberships in Phi Kappa Phi, Beta Gamma Sigma and Psi Chi National Honorary Fraternities. Beth’s current civic activities include Trustee of Chesapeake Bay Academy and Advisory Board Member of Horizons Hampton Roads. In addition, Beth serves on the Hampton Roads Leadership Council of the Chesapeake Bay Foundation, and the Advisory Board of Envest III, LLC, a private equity fund. Her past professional and civic activities are varied and numerous. She resides in Virginia Beach with her husband, Tom Bertrand. Ms. Patterson brings investment experience, analytical ability and leadership skills to her role as Director, as Chair of the Nominating and Corporate Governance Committee, and as a member of the Audit and Compliance Committee.
BRAD E. SCHWARTZ, 53, served as a director since he joined Monarch Bank in May 2004, and as a director of the Company since its formation in 2005. He was named Chief Executive Officer of the Monarch Bank in 2009 and Chief Executive Officer of the Company in 2010, having previously served as Executive Vice President and Chief Operating and Financial Officer; and Corporate Secretary. He is a resident of Virginia Beach Virginia. Mr. Schwartz has an undergraduate degree in Business Administration from Longwood University, a Masters of Business Administration from the University of Richmond’s Robins School of Business, and is a graduate of the American Bankers Association’s Stonier Graduate School of Banking at Georgetown University. Mr. Schwartz is also a certified public accountant. He has approximately 30 years of banking experience and has held past positions at other community banks as Chief Executive Officer, Chief Operating Officer, Chief Financial Officer, and Chief Information Officer. Mr. Schwartz also served as a safety and soundness examiner for the
114
Virginia State Corporation Commission’s Bureau of Financial Institutions, the primary regulator of Virginia-chartered financial institutions. He recently served on the Board of Directors for the Federal Reserve Bank of Richmond, and currently serves on the board of the Virginia Bankers Association, and the Board of Visitors for Longwood University. Mr. Schwartz’s experience, leadership and skills in the financial services industry add value as the leader of our Executive Management team and as a Director. These skills add value as a leader and contributor to our committees, as a member of the Director’s Loan Committee, as well as his role in the many management teams and committees.
Class II Directors Whose Terms Will Expire in 2016
LAWTON H. BAKER, CPA, 72, Vice Chairman, has served as a director of the Company since Monarch Bank was founded in 1998. He is a resident of Portsmouth, Virginia. He has served as the President of Baker & McNiff, Certified Public Accountants and Business Consultants, P.C. in Virginia Beach since 1977. His firm provides accounting, financial planning and consulting services to businesses throughout the Hampton Roads area, and he has served as President of the Tidewater Chapter of Virginia Society of CPA’s. He serves as Vice President of FOCUS Asset Management Company, a registered investment advisory company in Virginia Beach, since January 1999. Mr. Baker has served on the Board for StoneBridge School in Chesapeake for 22 years, and is currently their Treasurer and Finance Committee Chairman. Mr. Baker has served on the Boards of Furmanite of America, Inc. in Virginia Beach, Foundation of American Christian Education in Chesapeake, as President of Big Brothers/Big Sisters of Tidewater, Kiwanis Club of Churchland, and as Treasurer of the Elizabeth Manor Golf and Country Club in Portsmouth. He is an active member at St. Andrews United Methodist Church, and has served on the church council as a Sunday school teacher and as Finance Committee Chair. Mr. Baker provides accounting and auditing experience, as well as investment and business advisory skills which are critical for Monarch. He currently uses these skills as Vice Chairman of our Board of Directors, Chairman of our Audit and Compliance Committee, member of the Compensation Committee, and as a past member of the Board of Directors’ Loan Committee.
JEFFREY F. BENSON, 54, Chairman, has served as a director of the Company since Monarch Bank was founded in 1998 and as Chairman of the Company since 2006. He resides in Chesapeake, Virginia. For over twenty-five years, he has served as a partner of the Overton Family Partnership and their related companies. Mr. Benson’s companies are involved in the development and management of commercial real estate, residential development and construction, as well as office and industrial development. Mr. Benson is very active in local youth activities. He attends River Oak Church where he currently serves as a Trustee. Mr. Benson also serves on the Board of Young Life Chesapeake and on the Board of Directors at Liberty University. Mr. Benson’s involvement in the residential and commercial real estate markets adds great value and insight to the Company. His qualifications are utilized in his role as Chairman of the Board of Directors, Chairman of the Director’s Loan Committee and as a member of the Compensation Committee.
VIRGINIA S. CROSS, 58, has served as a Director since November 2010. She was a member of the Bank’s Virginia Beach Advisory Board of Directors since it was formed in 2002, and served as the chairperson of that board for four years. She is a resident of Virginia Beach, Virginia. Mrs. Cross served as the President/Broker/Owner of Progressive Realty, a real estate firm representing some of the top builders in the local market area with a sales force of over 70 and two office locations (Virginia Beach and Cape Charles on the Eastern Shore), before selling the company in 2004. More recently, Mrs. Cross has formed a development company and serves as a partner in Atlantic Land and Development Company. She still serves as a real estate marketing consultant for Ashdon Builders, is a partner and involved with the management of commercial real estate, and is the President of Surety Title. She has been an active member of the community, serving as vice chair of the regional board of the Hampton Roads Chamber of Commerce and chair of the Virginia Beach Division of the Hampton Roads Chamber of Commerce. Mrs. Cross also served on the Virginia Beach Educational Foundation Board and was a founding member of the 500-Year Forest Foundation. Cross was honored with the ‘Outstanding Professional Woman of Hampton Roads’ award given for her outstanding achievements, leadership and integrity. She is a member of Trinity Church in Virginia Beach. Mrs. Cross’s experience and involvement in the real estate brokerage and building community provides insight into our real estate, residential construction, and mortgage lending areas, as well as the community. Her skills add great value as a board member and as a member of the Audit and Compliance Committee.
ROBERT M. “BOB” OMAN, 61, has served as a director of the Company since Monarch Bank was founded in 1998. He is a Chesapeake, Virginia native and has served as the President of Oman Funeral Homes, Inc. since 1985; he also serves as President of Hampton Roads Crematory, Simply Cremation, Inc., O & O Properties and Oman Insurance Agency. Mr. Oman currently is President of the Virginia State Funeral Directors Association where he also serves as Chairman of its Legislative Committee; Mr. Oman has the distinct honor of having been named a recipient of “Virginia’s Outstanding Funeral Director of the Year” by the Virginia Funeral Directors Association; he is a former member and Past-President of the Virginia State Board of Funeral Directors and Embalmers and is a guest lecturer and instructor at Old Dominion University, Tidewater Community College, and the Chesapeake Public School System. Mr. Oman is a former four-term Chairman and currently serves as the senior member and Chairman of the Chesapeake Hospital Authority which governs Chesapeake Regional Medical Center. He is a former President of the Tidewater Funeral Directors Association and is past president and member of the board of the Chesapeake Hospice Council. He currently serves as a member of the Board of Deacons at Great Bridge Baptist Church and is
115
a Past President of the Chesapeake East Camp of Gideon’s International. As a small business owner and native of our headquarters city, Mr. Oman brings value and insight into our business banking focus as well as the community. These skills add great value as a board member and as a member of the Director’s Loan Committee.
Class III Directors Whose Terms Will Expire in 2017
JOE P. COVINGTON, JR., 65, has served as a director since 2005. He resides in Norfolk, Virginia. Mr. Covington is the Chairman of Covington & Associates Realtors, Inc. and Covington Contracting, Inc. He has been actively involved in the real estate field since 1977. Covington & Associates is a full service real estate company which handles the brokerage of properties and through its property management division, oversees many of the projects developed by Covington Contracting. Covington Contracting has developed both single-family and multi-family projects since it was formed in 1981, and now primarily focuses on the building and renovation of custom homes in Virginia Beach, Norfolk, and Suffolk. He has served on numerous boards and organizations in the Tidewater area including the Tidewater Builders Association, Kiwanis Club of Ghent, East Carolina University Foundation Board of Directors, Downtown Norfolk YMCA, Tidewater March of Dimes, and the City of Norfolk Real Estate Appeals Board, where he served as Chairman. A native of Edenton, North Carolina, Mr. Covington graduated from East Carolina University with a B.S. Degree in social work. Mr. Covington’s involvement in the residential and multi-family real estate markets adds great value and insight to the Company. His qualifications are utilized in his role as a board member, as a member of the Director’s Loan Committee, and as a member of the Compensation Committee.
E. NEAL CRAWFORD, JR., 53, has served as a director of the Company since January 2008 and joined the company in 2003. He is a resident of Norfolk, Virginia and was named President of Monarch Bank in 2009 and the Company in 2010, having previously served as Norfolk Regional President. He has worked in the banking industry for over 25 years and prior to joining Monarch he was President of Norfolk Capital, LLC, a commercial mortgage brokerage company in Norfolk. He also served as Senior Vice President and Community President-Norfolk for a large regional banking company. Mr. Crawford’s civic and community activities include serving as treasurer for the East Carolina University Alumni Foundation, serving on the board of visitors of East Carolina University, serving on the Board and Executive Committee of the Greater Norfolk Company, and serving on the Boards of Virginia Beach Vision, Visit Norfolk, and Retail Alliance. Mr. Crawford is a member of First Presbyterian Church in Norfolk. He is a 1985 graduate of East Carolina University with a degree in finance and is a graduate of the American Bankers Association’s Stonier Graduate School of Banking at the University of Pennsylvania. Mr. Crawford’s experience, leadership and skills in the banking field add value as a member of our Executive Management team and as a Director. These skills are critical as the leader of our banking sales teams, as a member of the board and Director’s Loan Committee, as well as his role in the many management teams and committees.
DWIGHT C. SCHAUBACH, 73, has served as a director since 2005. He resides in Suffolk, Virginia. Mr. Schaubach is currently Chief Executive Officer of Bay Disposal and Recycling, a waste management and recycling business, and President of Johns Brothers Security, Inc., a security system installation and monitoring company. As both an owner of several small and medium sized businesses and an entrepreneur, Mr. Schaubach brings value and insight into our business banking focus as well as the community. These skills add great value as a board member and as the Chairman of the Compensation Committee.
There are no current arrangements between any director and any other person pursuant to which the director was selected to serve. No family relationships exist among any of the directors or between any of the directors and executive officers of the Company. None of the directors are directors of other publicly-traded companies, or have been within the last five years.
NON-DIRECTOR EXECUTIVE OFFICERS (INCLUDING NAMED EXECUTIVE OFFICERS)
The following individuals are executive officers of the Company who are not also directors. This list excludes Executive Officers Schwartz, Crawford, and Morrison, who all serve as directors. Unless otherwise specified, each officer has held their current position for at least five years.
Name | Principal Occupation | Age | Since |
Denys J. Diaz | Executive Vice President, Chief Information Officer. | 49 | 2011 |
Lynette P. Harris | Executive Vice President, Chief Financial Officer and Secretary of the Company since 2010. | 58 | 2004 |
Andrew N. Lock | Executive Vice-President & Chief Risk Officer since 2011. Previously served as Executive Vice President and Chief Credit Officer for Monarch Bank. | 52 | 2005 |
Audit Committee
The Board of Directors has established a standing Audit Committee composed of Mr. Baker (Chairmen), Mrs. Cross and Mrs. Patterson. Mr. Baker has been designated as an "audit committee financial expert" as advised by applicable SEC rules.
Code of Ethics
116
The Audit and Compliance Committee of the Board of Directors has approved a Code of Business Conduct and Ethics for directors, officers and all employees of the Company and its subsidiaries, and an addendum to the Code of Ethics applicable to select Executive Officers including the Chief Executive Officer, Chief Financial Officer and other principal financial officers. The Code addresses such topics as protection and proper use of Company assets, compliance with applicable laws and regulations, accuracy and preservation of records, accounting and financial reporting and conflicts of interest. Requests for a copy of the Company’s Code of Ethics may be sent to lharris@monarchbank.com or by visiting the Company’s website at www.monarchbank.com/about-us/investor-relations/.
Section 16(a) Beneficial Ownership Reporting Compliance
Section 16(a) of the Securities Exchange Act of 1934, as amended, requires the Company’s directors and executive officers and any persons who own more than 10% of the outstanding shares of Common Stock to file with the Securities and Exchange Commission (“SEC”) reports of ownership and changes in ownership of Common Stock. Directors and executive officers are required by SEC regulations to furnish the Company with copies of all Section 16(a) reports that they file. Based solely on a review of the copies of such forms furnished to the Company, the Company believes that all reporting requirements, under Section 16(a) for 2015 were met in a timely manner by its directors, officers and greater than 10% beneficial owners.
Item 11. | Executive Compensation. |
COMPENSATION DISCUSSION AND ANALYSIS
Compensation Philosophy and General Objectives
The overall objective of the Company’s various compensation programs is to attract and retain skilled personnel. The Company believes the attraction and retention of skilled professionals has been the single most important contributing factor to the Company’s success. The Company recruits for and places high performance expectations upon its personnel. In order to attract highly skilled personnel, the Company aims to provide attractive compensation plans that allow top performing personnel to be well compensated when compared to local and peer bank competitors.
The Compensation Committee periodically assesses the overall compensation provided to its employees, executives and directors against a variety of benchmarks to provide points of reference. The Compensation Committee examines compensation composites of publicly traded banking companies in the company’s primary trade area and for similar companies in the mid-Atlantic region. The Compensation Committee examines and considers not only the absolute value of each element of compensation and the total compensation, but also the allocation of each element within the total. The Compensation Committee does not rely upon any single source or formula to explicitly benchmark and determine the pay of its employees and executives.
Although only an advisory vote, the Compensation Committee and Board of Directors also considered the results of the most recent shareholder advisory vote on executive compensation that occurred at the 2015 Annual Meeting of Shareholders. Approximately 99% of the shareholder votes cast were FOR approval of the compensation of the Company’s named executive officers as disclosed in the 2015 Proxy Statement. In consideration of affirmative shareholder approval as well as other factors addressed in this discussion, the Compensation Committee and Board of Directors have maintained the same compensation program for the Company’s executives, which it believes to be appropriate under its philosophy of aligning the interests of the executives with the interests of its shareholders.
For this discussion, compensation benefits may be characterized as current compensation and long-term compensation. The Company’s current compensation is designed to provide employees with current cash compensation that is viewed favorably and competitively by the employee. Examples of current compensation are base salaries and cash bonuses. Long-term compensation benefits are designed to provide each employee with the opportunity to create long-term wealth and financial security. Examples of long-term compensation include stock awards and retirement plan contributions. Select long-term compensation benefits also serve to align the employee’s long-term interests with those of the Company’s shareholders.
Compensation of executive officers is based upon the Compensation Committee’s review of the performance and qualifications of each executive in the context of the business environment, defined job responsibilities, and goals and objectives. Total compensation of each executive is comprised of base salary and performance-based compensation consisting of cash bonuses, scheduled and variable contributions to retirement savings, and stock awards. In addition, each executive is entitled to participate in all other Company-provided benefits such as health and life insurance coverage and the retirement savings plan. The basic compensation arrangement, as well as other covenants and terms designed to protect and benefit the interests of both parties, may be set forth in employment contracts.
Under the terms of the merger agreement with Towne, the Company may not, without prior written consent of Towne, make certain adjustments to its compensation policies and practices.
117
Compensation Programs as They Relate to Risk Management
The Compensation Committee and Board review compensation in December of each year and believe the Company’s compensation policies and practices do not create risks that are reasonably likely to have a material adverse effect on the Company, do not encourage imprudent risk-taking behavior, and are consistent with maintaining the organization’s safety and soundness. The business of banking and the delivery of financial services involves a high degree of risk, and risk management is an integral ingredient to a successful enterprise in this industry. The Company places a priority on fundamental building blocks to guard against excessive risk taking as follows: 1) Comprehensive Board approved policies and procedures are in place that define risk limits, approval authorities, exception processes and reporting thereof; 2) An effective audit program is in place that includes an enterprise-wide risk management assessment, monitoring and testing program; and 3) Employees and management are held to standards of personal and professional conduct and standards with respect to industry sanctions or investigations, adverse personal financial circumstances, credit, issues with creditors or criminal backgrounds.
The Company does not have any compensation arrangements whereby any individual at any level has direct or individual authority over policy decisions that directly enriches their income. There are enhanced quality control and oversight that monitor the quality and performance of business generated by such individuals to guard against potential abuse of such programs.
Committee and Board Process
The Compensation Committee of the Company’s Board of Directors is responsible for recommending and administering compensation of the Company’s executive officers, including the named executive officers, and directors. The Committee is comprised of non-employee “independent” directors; as such terms are defined by the SEC and the Nasdaq listing standards. The Committee operates pursuant to a written charter adopted by the Board of Directors. The Committee reviews and reassesses this charter annually and recommends any changes to the Board of Directors for approval.
The Committee historically has not used the services of a compensation consultant with respect to executive and/or director compensation matters, and did not use consultants in 2015 to establish compensation committee practices. The company last used consultants for peer compensation reviews in 2013.
The Compensation Committee monitors the compensation environment by reviewing information from time to time from peers and other industry sources. The CEO prepares data for each executive officer, and with that, the Committee commences its work to prepare for cash and deferred bonus awards, salary adjustments, and stock grants in the fourth quarter of each year. With the assistance of the CEO, the Committee reviews the recommendation for each named executive officer, and independently determines the compensation components for the CEO.
The Company pays an annual cash bonus available to the named executives based on performance. In 2015 cash bonus levels, variable retirement contributions to a deferred compensation account, and the awarding of stock grants for executive officers were determined by the Compensation Committee based on the Company exceeding financial performance goals and meeting its overall strategic objectives. In 2015 the Committee recommended no base salary increases for the named executive officers for 2016.
The committee has determined it was in the best interest of the Company to enter into management contracts with the named executive officers. The most recent version of these contracts guarantees certain levels of compensation for the executives, and in return all have agreed to non-competition and non-solicitation provisions should they leave the company. All of these contracts supersede their previous contracts. See “Employment Agreements” and “Severance and Change in Control Benefits” for further discussion.
The Company’s policy on the tax deductibility of compensation for the named executive officers is to maximize the deductibility, to the extent possible, while preserving the Company’s flexibility to maintain a competitive compensation program. The Company expects all executive compensation paid or awarded during 2015 to be fully deductible.
The Company presently utilizes the following elements of compensation that are discussed generally and specifically as it relates to its named executive officers. With respect to base salary increases and awards of stock, which are granted at the discretion of the Board, the Committee subjectively evaluates the factors in their totality and does not employ a formula which predetermines the relative weighting of the factors.
Base Salaries
As the practice is customary in the financial services industry, the Company chooses to pay base salaries on regular intervals to reward employees for their qualifications and the discharge of duties in tending to the daily affairs of the Company. The Company expects base salaries to provide its employees with adequate cash flow to afford a lifestyle commensurate with
118
their professional status and accomplishments. Certain sales personnel receive commissions as their primary compensation in lieu of salaries in order to reward successful sales efforts. The Company determines base salaries within the framework of general practices within the industry and considers individual duties and responsibilities in making salary determinations. Salary adjustments are made from time to time to reward performance against periodic goals and expanding the scope of activity and responsibility. Base salaries are the most important element of compensation as many other elements discussed in this Compensation Discussion and Analysis are determined based upon the underlying base salary of the employee or executive.
For officers and employees other than the named executive officers, salaries are administered under policies and guidelines set forth by management that are deemed reasonable for the nature of each employee’s responsibility, business conditions, skills, and performance. Generally, all employees receive a competitive base salary commensurate with their skills, experience and responsibilities.
The evaluation criteria for named executive officer base salary adjustments are substantially similar to and reviewed at the same time as the performance factors described under the Cash Bonuses and Non-Equity Incentive Payments section that follows.
Cash Bonuses and Non-Equity Incentive Payments
The Company’s practice is to award cash bonuses to its officers and other select employees based upon satisfaction of performance objectives during the preceding year. This practice is designed to encourage executives and employees to reach and exceed financial and non-financial goals in the continuing development of the Company’s business. The Company pays this compensation element to motivate performance that advances the ongoing interests of its shareholders.
With respect to cash bonuses, the named executive officers of the Company (other than the CEO of the Mortgage division) are primarily evaluated based upon the overall profitability and performance of the Company. In 2015 the following measures were utilized: targeted net income, targeted net interest margin, asset quality, closed mortgage loans, growth of investment assets under management, net loans held for investment growth, net core deposit growth, and net demand deposit growth. These eight financial targets, along with subjective evaluations of the company and officers contributions, are utilized to determine if any cash bonuses are available for payout, and at what level, at the full discretion of the Compensation Committee.
Category | Below Target | Target | Exceptional |
Net income | < $12,000,000 | > $12,000,000 | >12,600,000 |
Net interest margin | < 4.00% | > 4.00% | > 4.25% |
Asset quality / Non-performing assets | >1.0% | <1.0% > 0.5% | < 0.5% |
Mortgage loans closed | < $1.5 billion | > $1.5 billion | > $1.65 billion |
Assets under management | < $275 million | > $275 million | > $300 million |
Net loans held for investment growth | < $50,000,000 | > $50,000,000 | > $60,000,000 |
Net core deposit growth | < $40,000,000 | > $40,000,000 | > $50,000,000 |
Net core demand deposit growth | < $20,000,000 | > $20,000,000 | > $24,000,000 |
The employment agreement of the Chief Executive Officer provides that he is eligible to receive an annual cash bonus based upon a performance evaluation by the Board of Directors and in an amount determined in the discretion of the Compensation Committee. Based upon the Committee’s evaluation of 2015 performance, Mr. Schwartz was awarded a cash bonus of $175,000 and a $50,000 contribution to the Company’s non-qualified deferred compensation plan for a total of $225,000. His bonus recognized his contributions on achieving Company financial performance, as well as his performance at a subjective level. The cash bonus was paid in December 2015 and the deferred compensation was paid in January 2016.
The employment agreement of the President provides that he is eligible to receive an annual cash bonus based upon a performance evaluation by the Chief Executive Officer and in an amount determined at the discretion of the Compensation Committee with a recommendation from the Chief Executive Officer. For 2015 performance, Mr. Crawford was awarded a cash bonus of $175,000 and a $40,000 contribution to a non-qualified deferred compensation plan for a total of $215,000. His bonus recognized his performance in achieving Company financial performance as well as his performance in positive loan and core deposit growth. The cash bonus was paid in December 2015 and the deferred compensation was paid in January 2016.
The employment agreement of the Mortgage division CEO provides that he is eligible to receive quarterly non-equity incentive plan compensation payments based on mortgage division profitability. His contract stipulates he receives ten percent of the overall pre-tax operating profitability, including the net interest income earnings on loans held for sale, and ten percent of pre-tax net income of mortgage division title and closing income of subsidiary Real Estate Security Agency, LLC. Based upon
119
the employment agreement formula for 2015 performance, Mr. Morrison was awarded non-equity incentive plan compensation payments of $966,371. Quarterly payments were made in April, July, and October of 2015, and in January of 2016.
The employment agreement of the Executive Vice President & Chief Risk Officer provides that he is eligible to receive an annual cash bonus based upon a performance evaluation by the Chief Executive Officer and in an amount determined at the discretion of the Compensation Committee with a recommendation from the Chief Executive Officer. For 2015 performance, Mr. Lock was awarded a cash bonus of $90,000 and a $25,000 cash contribution to a non-qualified deferred compensation plan for a total of $105,000. Mr. Lock’s bonus recognized his performance contributing to the Company’s financial performance as well as his performance in the areas of enterprise risk management, asset quality management, and regulatory and compliance oversight. The bonus was paid in December 2015.
The employment agreement of the Executive Vice President & Chief Financial Officer provides that she is eligible to receive an annual cash bonus based upon a performance evaluation by the Chief Executive Officer and in an amount determined at the discretion of the Compensation Committee with a recommendation from the Chief Executive Officer. For 2015 performance, Ms. Harris was awarded a cash bonus of $75,000 and a $20,000 cash contribution to a non-qualified deferred compensation plan for a total of $95,000. Ms. Harris’ bonus recognized her performance contributing to the Company’s financial performance as well as her performance related to financial management and reporting effectiveness. The bonus was paid in December 2015.
The cash bonuses, deferred compensation payments, and non-equity incentive plan compensation payments as described above are also reported in the Summary Compensation Table under the columns “Bonus” and ”Non-Equity Incentive Plan Compensation”, and “Change in Pension Value Nonqualified Deferred Compensation Earnings”.
Stock Awards
In May 2014 the shareholders of the Company approved the Monarch Financial Holdings, Inc. 2014 Equity Incentive Plan (the “Incentive Plan”). The purpose of the Incentive Plan is to promote the interest of the Company and its shareholders by enabling the Company to recruit, reward and retain employees and outside directors. The Incentive Plan is administered and interpreted by the Board, unless the Board chooses to delegate its administration duties to a committee of the Board composed solely of two or more Non-Employee Directors as “Non-Employee” director is defined in Rule 16b-3 under the Securities Exchange Act of 1934. The number of shares of Common Stock that are subject to award under the Incentive Plan may not exceed a currently adjusted initial 1,327,653 shares of the issued and outstanding Common Stock, to be adjusted for any additional future stock dividends, splits or issuances. In administering the Incentive Plan to employees, the Board has the authority to determine the terms and conditions upon which awards may be made and exercised, to construe and interpret the Incentive Plan and to make all determinations and actions with respect to all awards under the plan. This Incentive Plan succeeded the 2006 Equity Incentive Plan.
The Company makes restricted stock awards to select officers and employees, typically in early December of each year. The objective of the stock awards is to provide long-term compensation that aligns the officers’ and employees’ interests with those of the shareholders in building share value. The Company has chosen to pay this element of compensation as it finds it desirable for its employees to build ownership and wealth due to the favorable performance of the Company’s stock in the future. Furthermore, this long-term benefit helps the Company attract and retain high caliber professionals.
The following is a summary of the restricted stock awards made to each named executive officer for the year ended December 31, 2015.
Grant of Plan-Based Awards | |||||||||
Fiscal Year 2015 | |||||||||
Named Executive | Grant Date | All Other Stock Awards: Number of Shares of Stock or Units (#) | Grant Date Fair Value of Stock and Option Awards ($) (1) | ||||||
Brad E. Schwartz | 12/8/2015 | 5,000 | $ | 63,950 | |||||
E. Neal Crawford, Jr. | 12/8/2015 | 4,000 | $ | 51,160 | |||||
William T. Morrison | 12/8/2015 | 4,000 | $ | 51,160 | |||||
Andrew N. Lock | 12/8/2015 | 2,000 | $ | 25,580 | |||||
Lynette P. Harris | 12/8/2015 | 2,000 | $ | 25,580 | |||||
(1) Based on stock closing price of $12.79 as of date of grant. All grants vest five years from date of grant.
120
Stock awards for officers and select employees other than the named executive officers are administered in a similar manner. The terms are generally the same. The non-executive officer and employee awards are directed towards line personnel and other key support positions. Awards are predicated upon the employee’s specific performance for the prior year just ended, as well as the overall Company performance compared against set goals.
Pension and Retirement Benefits
The Company implemented a Supplemental Executive Retirement Plan in 2006 to provide supplemental payments upon the retirement at age 65 of each named executive. The Company also implemented a non-qualified deferred compensation program in 2014.
Mr. Schwartz has two supplemental executive retirement plans. The initial 2006 plan provides payments of $30,000 per year for 10 years beginning at age 65, with vesting in the plan occurring at 10% per year for 10 years. The initial plan was 100% vested as of December 31, 2015. The second plan, signed in December 2010 and effective January 1, 2011, provides an additional payment of $70,000 per year for 10 years beginning at age 65, with vesting in the plan occurring one-third in five years, two-thirds in ten years, and full vesting occurring in fifteen years from January 1, 2011. The second plan was 33% vested as of 12/31/2015. Mr. Schwartz is also a participant in the 2014 non-qualified deferred compensation program.
Mr. Crawford has two supplemental executive retirement plans. The initial 2006 plan provides payments of $30,000 per year for 10 years beginning at age 65, with vesting in the plan occurring at 10% per year for 10 years. The initial plan was 90% vested as of 12/31/2014. The second plan, signed in December 2010 and effective January 1, 2011, provides an additional payment of $70,000 per year for 10 years beginning at age 65, with vesting in the plan occurring one-third in five years, two-thirds in ten years, and full vesting occurring in fifteen years from January 1, 2011. The second plan was 33% vested as of 12/31/2015. Mr. Crawford is also a participant in the 2014 non-qualified deferred compensation program.
Mr. Morrison has two supplemental executive retirement plans. The initial 2008 plan provides payments of $30,000 per year for 10 years beginning at age 65, with vesting in the plan occurring at 10% per year for 10 years. The initial plan was 70% vested as of 12/31/2015. The second plan, signed in December 2010 and effective January 1, 2011, provides an additional payment of $45,000 per year for 10 years beginning at age 65, with vesting in the plan occurring one-third in five years, two-thirds in ten years, and full vesting occurring in fifteen years from January 1, 2011. The second plan was 33% vested as of 12/31/2015. Mr. Morrison is also a participant in the 2014 non-qualified deferred compensation program.
Mr. Lock has two supplemental executive retirement plans. The initial 2006 plan provides payments of $30,000 per year for 10 years beginning at age 65, with vesting in the plan occurring at 10% per year for 10 years. The initial plan was 90% vested as of 12/31/2014. The second plan, signed in December 2010 and effective January 1, 2011, provides an additional payment of $30,000 per year for 10 years beginning at age 65, with vesting in the plan occurring one-third in five years, two-thirds in ten years, and full vesting occurring in fifteen years from January 1, 2011. The second plan was 33% vested as of 12/31/2015. Mr. Lock is also a participant in the 2014 non-qualified deferred compensation program.
Mrs. Harris has a supplemental executive retirement plan. The plan, signed in December 2010 and effective January 1, 2011, provides payments of $50,000 per year for 10 years beginning at age 65, with vesting in the plan occurring one-third in five years, two-thirds in ten years, and full vesting occurring in fifteen years from January 1, 2011. The plan was 33% vested as of 12/31/2015. Mrs. Harris is also a participant in the 2014 non-qualified deferred compensation program.
Each Supplemental Executive Retirement Plan fully vests upon a change in control of the Company based on the current present value of benefits to be received at retirement. The Supplemental Executive Retirement Plan assumes each participant retires at age 65, and uses a 4.35% discount rate and a 34% tax rate in the assumptions used to accrue for the eventual payments.
In 2014 the Company implemented a non-qualified deferred compensation program that differs from the previous Supplemental Executive Retirement Plan. The new plan, administered by a third-party under a trust agreement, allows both the employee and the employer to contribute funds to provide for a deferred tax long-term benefit. This benefit allows the employee to designate a portion of any salary, bonus income, restricted stock, or non-equity incentive payments to this plan, yet does not commit the Company to guaranteed payments to fund this benefit. Contributions in any year do not represent the continued commitment by the Company to provide future contributions, which provides greater flexibility and shareholder alignment when compared to the previous Supplemental Executive Retirement Plans. Participants are encouraged to defer a portion of their cash compensation to this plan with no commitment by the company to match any funds contributed.
Changes in Nonqualified Deferred Compensation
The following table shows the changes in the balance of the named executive officers’ nonqualified deferred income plans during 2015:
121
Nonqualified Deferred Compensation Fiscal Year 2015 | ||||||||||||||||||||
Name | Executive Contributions in Last Fiscal Year ($) | Registrant Contributions in Last Fiscal Year ($) | Aggregate Earnings in Last Fiscal Year ($) | Aggregate Withdrawals/ Distributions ($) | Aggregate Balance at Last Fiscal Year End ($) | |||||||||||||||
Brad E. Schwartz | $ | 84,612 | $ | 385,043 | $ | 35,499 | $ | — | $ | 505,154 | ||||||||||
E. Neal Crawford, Jr. | 109,612 | 360,043 | 33,964 | — | 503,619 | |||||||||||||||
William T. Morrison | 96,637 | 204,784 | (2,324 | ) | — | 299,097 | ||||||||||||||
Andrew N. Lock | 74,767 | 241,633 | 19,061 | — | 335,461 | |||||||||||||||
Lynette P. Harris | 50,767 | 171,586 | 18,566 | — | 240,919 | |||||||||||||||
Employment Agreements
The Company does not have any employment agreements with its executives. All executive officer employment agreements are with Monarch Bank (Bank), our wholly-owned subsidiary, which are described below.
On December 31, 2010, the Bank entered into an Employment Agreement with Mr. Schwartz (the “Schwartz Employment Agreement”), pursuant to which Mr. Schwartz serves as Chief Executive Officer of the Company and the Bank. The Schwartz Employment Agreement, which had an initial term of two years, provides that it will be renewed for two year successive periods unless the Bank gives notice at least twelve months prior to the expiration of the agreement. It was renewed for an additional two year period on December 31, 2015. During the term of the Schwartz Employment Agreement, Mr. Schwartz’s base salary must be at least his salary in effect each year prior. Mr. Schwartz will be entitled to annual cash bonuses and stock-based awards in such amounts as may be determined by the Board of Directors and in accordance with the terms and conditions of the applicable management incentive plans adopted by the Board of Directors of the Bank. He will also be entitled to participate in other benefit plans and programs for which he is or will be eligible. Under the Schwartz Employment Agreement, Mr. Schwartz is eligible to receive an automobile or automobile allowance and reimbursement for certain expenses. Mr. Schwartz will be subject to repayment, or “claw back,” rights that allow the Bank or Company to require repayment of incentive compensation attributable to material noncompliance with financial reporting requirements that result in a restatement. The Company may terminate Mr. Schwartz’s employment at any time for “Cause” (as defined in the Schwartz Employment Agreement), with a 2/3 vote of the Company’s Board of Directors, without incurring any additional obligations to him. If the Bank terminates Mr. Schwartz’s employment without Cause (which also requires a 2/3 vote of the Company’s Board of Directors) he will be entitled to twelve months of continuation of his salary and twelve months of the Company’s then-current contribution to its welfare plan benefits in the Company’s health and welfare plans plus any vested benefits. If Mr. Schwartz terminates his employment for any reason other than disability or retirement he will be entitled to twelve months of continuation of his salary and twelve months of the Company’s then-current contribution to its group health plan plus any vested benefits. On retirement (defined as a departure at or after the age of 65) Mr. Schwartz shall not be entitled to any further compensation or benefits pursuant to the Schwartz Employment Agreement. Upon the termination of his employment, Mr. Schwartz will be subject to certain noncompetition and non-solicitation restrictions unless termination results from a non-renewal of the term of the Schwartz Employment Agreement.
On December 31, 2010, the Bank entered into an Employment Agreement with Mr. Crawford (the “Crawford Employment Agreement”), pursuant to which Mr. Crawford serves as Executive Vice President of the Company and President of the Bank. The Crawford Employment Agreement, which had an initial term of two years, provides that it will be renewed for two year successive periods unless the Bank gives notice at least twelve months prior to the expiration of the agreement. It was renewed for an additional two year period on December 31, 2015. During the term of the Crawford Employment Agreement, Mr. Crawford’s base salary must be at least his salary in effect each year prior. Mr. Crawford will be entitled to annual cash bonuses and stock-based awards in such amounts as may be determined by the Board of Directors and in accordance with the terms and conditions of the applicable management incentive plans adopted by the Board of Directors of the Bank. He will also be entitled to participate in other benefit plans and programs for which he is or will be eligible. Under the Crawford Employment Agreement, Mr. Crawford is eligible to receive an automobile or automobile allowance and reimbursement for certain expenses. Mr. Crawford will be subject to repayment, or “claw back,” rights that allow the Bank or Company to require repayment of incentive compensation attributable to material noncompliance with financial reporting requirements that result in a restatement. The Company may terminate Mr. Crawford’s employment at any time for “Cause” (as defined in the Crawford Employment Agreement), with a 2/3 vote of the Company’s Board of Directors, without incurring any additional obligations to him. If the Bank terminates Mr. Crawford’s employment without Cause (which also requires a 2/3 vote of the Company’s Board of Directors) he will be entitled to twelve months of continuation of his salary and twelve months of the Company’s then-current contribution to its welfare plan benefits in the Company’s health and welfare plans plus any vested benefits. If Mr. Crawford terminates his employment for any reason other than disability or retirement he will be
122
entitled to twelve months of continuation of his salary and twelve months of the Company’s then-current contribution to its group health plan plus any vested benefits. On retirement (defined as a departure at or after the age of 65) Mr. Crawford shall not be entitled to any further compensation or benefits pursuant to the Crawford Employment Agreement. Upon the termination of his employment, Mr. Crawford will be subject to certain noncompetition and non-solicitation restrictions unless termination results from a non-renewal of the term of the Crawford Employment Agreement.
On February 5, 2015, the Bank entered into a new Employment Agreement with Mr. Morrison. The Morrison Employment Agreement, which has an initial term of two years, provides that it will be renewed for two year successive periods unless the Bank gives notice at least twelve months prior to the expiration of the agreement. During the term of the Agreement, Mr. Morrison’s base salary must be at least his salary in effect each year prior. Mr. Morrison is entitled to certain incentive compensation payments. Each quarter he shall control a bonus pool equal to twenty percent of the quarterly pre-tax profit of Monarch Mortgage. Mr. Morrison shall distribute such pool among the officers of Monarch Mortgage, including himself, subject to the approval of the Company’s Chief Executive Officer. Mr. Morrison is also entitled to participate in benefit plans and programs for which he is or will be eligible. Mr. Morrison is eligible to receive an automobile or automobile allowance and reimbursement for certain expenses. Mr. Morrison will be subject to repayment, or “claw back,” rights that allow the Bank or Company to require repayment of incentive compensation attributable to material noncompliance with financial reporting requirements that result in a restatement. The Bank may terminate Mr. Morrison’s employment at any time for “Cause” as defined in the Morrison Employment Agreement, with a 2/3 vote of the Company’s Board of Directors, without incurring any additional obligations to him. If the Bank terminates Mr. Morrison’s employment without Cause, which also requires a 2/3 vote of the Company’s Board of Directors, he will be entitled to twelve months of continuation of his salary and twelve months of the Company’s then-current contribution to its welfare plan benefits in the Company’s health and welfare plans plus any vested benefits. If Mr. Morrison terminates his employment for any reason other than disability or retirement he will be entitled to twelve months of continuation of his salary and twelve months of the Bank’s then-current contribution to its group health plan plus any vested benefits. On retirement (defined as a departure at or after the age of 65) Mr. Morrison shall not be entitled to any further compensation or benefits. Upon the termination of his employment, Mr. Morrison will be subject to certain noncompetition and nonsolicitation restrictions unless termination results from a non-renewal of the term of the Agreement.
On May 28, 2014, the Bank entered into an Employment Agreement with Mr. Lock. The Lock Employment Agreement, which has an initial term of two years, provides that it will be renewed for two year successive periods unless the Bank gives notice at least twelve months prior to the expiration of the agreement. It was renewed for an additional two year period on May 28, 2015. During the term of the Agreement, Mr. Lock’s base salary must be at least his salary in effect as of May 28, 2014. Mr. Lock is also entitled to participate in benefit plans and programs for which he is or will be eligible. Mr. Lock is eligible to receive an automobile allowance and reimbursement for certain expenses. Mr. Lock will be subject to repayment, or “claw back,” rights that allow the Bank or Company to require repayment of incentive compensation attributable to material noncompliance with financial reporting requirements that result in a restatement. The Bank may terminate Mr. Lock’s employment at any time for “Cause” as defined in the Morrison Employment Agreement, with a 2/3 vote of the Company’s Board of Directors, without incurring any additional obligations to him. If the Bank terminates Mr. Lock’s employment without Cause, which also requires a 2/3 vote of the Company’s Board of Directors, he will be entitled to twelve months of continuation of his salary and twelve months of the Company’s then-current contribution to its welfare plan benefits in the Company’s health and welfare plans plus any vested benefits. If Mr. Lock terminates his employment for any reason other than disability or retirement he will be entitled to twelve months of continuation of his salary and twelve months of the Bank’s then-current contribution to its group health plan plus any vested benefits. On retirement (defined as a departure at or after the age of 65) Mr. Lock shall not be entitled to any further compensation or benefits. Upon the termination of his employment, Mr. Lock will be subject to certain noncompetition and nonsolicitation restrictions unless termination results from a non-renewal of the term of the Agreement.
On December 31, 2010, the Bank entered into an Employment Agreement with Mrs. Harris (the “Harris Employment Agreement”), pursuant to which Mrs. Harris will continue as Chief Financial Officer of the Company and the Bank. The Harris Employment Agreement, which had an initial term of two years, provides that it will be renewed for two year successive periods unless the Bank gives notice at least twelve months prior to the expiration of the agreement. It was renewed for an additional two year period on December 31, 2015. During the term of the Harris Employment Agreement, Mrs. Harris’s base salary must be at least her salary in effect each year prior. Mrs. Harris will be entitled to annual cash bonuses and stock-based awards in such amounts as may be determined by the Board of Directors and in accordance with the terms and conditions of the applicable management incentive plans adopted by the Board of Directors of the Bank. She will also be entitled to participate in other benefit plans and programs for which she is or will be eligible. Under the Harris Employment Agreement, Mrs. Harris is eligible to receive an automobile allowance and reimbursement for certain expenses. Mrs. Harris will be subject to repayment, or “claw back,” rights that allow the Bank or Company to require repayment of incentive compensation attributable to material noncompliance with financial reporting requirements that result in a restatement. The Company may terminate Mrs. Harris’s employment at any time for “Cause” (as defined in the Harris Employment Agreement), with a 2/3 vote of the
123
Company’s Board of Directors, without incurring any additional obligations to her. If the Bank terminates Mrs. Harris’s employment without Cause (which also requires a 2/3 vote of the Company’s Board of Directors) she will be entitled to twelve months of continuation of her salary and twelve months of the Company’s then-current contribution to its welfare plan benefits in the Company’s health and welfare plans plus any vested benefits. If Mr. Harris terminates her employment for any reason other than disability or retirement she will be entitled to twelve months of continuation of her salary and twelve months of the Company’s then-current contribution to its group health plan plus any vested benefits. On retirement (defined as a departure at or after the age of 65) Mrs. Harris shall not be entitled to any further compensation or benefits pursuant to the Harris Employment Agreement. Upon the termination of her employment, Mrs. Harris will be subject to certain noncompetition and non-solicitation restrictions unless termination results from a non-renewal of the term of the Harris Employment Agreement.
The Company also has agreements with the named executive officers that become effective upon a change in control. Under the terms of these agreements, as modified, the Company or its successor agrees to continue the named executive officers in its employ for a term of three years after the date of a change in control. During the term of the contracts, the named executive officers will retain commensurate authority and responsibilities and compensation benefits. They will receive base salaries at least equal to that paid in the immediate prior year and bonuses at least equal to the annual bonuses paid prior to the change in control. If the employment of a named executive officer is terminated during the three years other than for "Cause" or "Disability" as defined in the agreement, or if a named executive officer should terminate employment for "Good Reason" as defined in the agreement, such terminating officer will be entitled to two times the sum of his base salary, highest last two year annual bonus and equivalent benefits. The Company has agreed to establish and fund a trust within 10 days of a change in control transaction close to ensure payment of this contingent obligation in compliance with Internal Revenue Service guidelines and rules.
All Other Compensation
The Company has a 401(k) defined contribution plan available to all employees subject to qualifications under the plan. The plan allows officers and employees of all levels to contribute earnings into a retirement account on a pre-tax basis. In addition, it has been the Company’s practice to make matching contributions to the plan. In 2015, the Company made matching discretionary contributions to participant accounts equal to 50% of the employees’ contributions. Employer matching contributions are made in the form of shares of Common Stock purchased on the open market, unless another option is selected by the participant. This element of compensation is designed to reward long-term savings and encourage financial security. The Company thinks it is in its best interest to encourage its employees to attain long-term financial security through active savings. This compensation benefit is consistent with that philosophy. Furthermore, an attractive retirement plan helps the Company attract and retain high caliber professionals. In 2015, each of the Company’s named executive officers participated in the 401(k) plan and received matching contributions that are reported under the “All Other Compensation” column of the Summary Compensation Table as well as in the All Other Compensation table.
Certain positions within the Company require the Company’s officers and employees to travel. The Company provides either Company owned vehicles, or expense allowances that are commensurate with the requirements of the duties and role of the individual within the Company’s business and the community. Under their employment agreements, Messrs. Schwartz, Crawford, Morrison and Lock, and Mrs. Harris receive either the use of a vehicle or an automobile allowance. The aggregate amount of the personal benefits are reported on the employee’s Form W-2 and included in the taxable income reported by the Company for the employee. These auto expense amounts for the Company’s named executive officers for 2015 are reported under the “All Other Compensation” column of the Summary Compensation Table as well as detailed in the All Other Compensation table.
Severance and Change in Control Benefits
The Company recognizes, as a publicly held Company in the financial services industry, there exists the possibility of a change in the control of the Company. The Company has chosen to make change in control benefits available in order to attract and retain the executives. Such benefits are customary in the financial services industry and are designed to align executives with shareholders is a sale event that maximizes shareholder value while providing executives with a liquidity event that can assist them in maintaining their lifestyle while seeking new employment. The re-employment time for high level executives is generally longer than for other professionals. This element of compensation is an important long-term compensation component that facilitates retention in an industry segment that is characterized by high volumes of merger and acquisition activity. A “change of control” is defined with reference to a change in the composition of the Board of Directors, a change in the ownership of a majority of the Company’s voting stock or a sale of a majority of the Company’s assets.
The following table shows the value of estimated Company payments pursuant to the employment agreements, change of control agreements, equity plans and other non-qualified plans described below, upon a termination of employment for the
124
named executives. All termination events are assumed to occur on December 31, 2015, as required by the SEC disclosure rules, and do not address the potential effect of the pending Towne merger. A termination upon a change of control is assumed to be involuntary by the Company or its successor. Company payments to a terminated executive may be more or less than the amounts shown in the table if the termination of employment occurs in a later year or because of contingencies contained in the various agreements and plans. In addition, certain amounts currently are vested and, thus, do not represent an increased amount of benefits. The amounts reflected in the following table are estimates, as the actual amounts to be paid to or received by a named executive officer can only be determined at the time of termination or change in control. There were no severance payments or change in control payments in 2015 for any of the named executive officers.
At termination, a named executive officer is entitled to receive all amounts accrued and vested under our 401(k) plan according to the same terms as other employees participating in those plans, so these benefits are not reflected in the table below. A named executive officer is also entitled to receive amounts earned during his term of employment regardless of the manner in which the named executive officer’s employment is terminated. These amounts include earned and unpaid base salary and vested restricted stock or stock option awards and are not reflected in the table below. As a benefit to all employees, the Bank provides life insurance in the amount of 2 times the employee’s annual salary at the time of death. These amounts are not included in the table below as the benefit is available to all full-time employees on the same basis.
Estimated Current Value of Severance and Change-in-Control Benefits | ||||||||||
Name and Principal Position (1) | Estimated Current Severance Amount ($)(2) | Supplemental Executive Retirement Plan Enhancement (3) | Early Vesting of Restricted Stock (4) | Other ($)(5) | Total ($)(6) | |||||
Termination of Employment by Executive For Good Reason or Company Without Cause | ||||||||||
Brad E. Schwartz | 1,250,000 | — | — | 27,952 | 1,277,952 | |||||
E. Neal Crawford, Jr. | 1,150,000 | — | — | 22,577 | 1,172,577 | |||||
William T. Morrison | 1,000,000 | — | — | 28,687 | 1,028,687 | |||||
Andrew N. Lock | 660,000 | — | — | 29,425 | 689,425 | |||||
Lynette P. Harris | 550,000 | — | — | 22,475 | 572,475 | |||||
Termination of Employment by Executive Without Good Reason | ||||||||||
Brad E. Schwartz | 450,000 | — | — | 13,976 | 463,976 | |||||
E. Neal Crawford, Jr. | 400,000 | — | — | 11,289 | 411,289 | |||||
William T. Morrison | 300,000 | — | — | 14,344 | 314,344 | |||||
Andrew N. Lock | 240,000 | — | — | 14,713 | 254,713 | |||||
Lynette P. Harris | 200,000 | — | — | 11,238 | 211,238 | |||||
Termination of Employment due to Employee Death | ||||||||||
Brad E. Schwartz | 225,000 | — | — | — | 225,000 | |||||
E. Neal Crawford, Jr. | 200,000 | — | — | — | 200,000 | |||||
William T. Morrison | 150,000 | — | — | — | 150,000 | |||||
Andrew N. Lock | 120,000 | — | — | — | 120,000 | |||||
Lynette P. Harris | 100,000 | — | — | — | 100,000 | |||||
Company Payment upon a Qualifying Termination of Employment After a Change in Control | ||||||||||
Brad E. Schwartz | 1,250,000 | 429,975 | 792,460 | 83,856 | 2,556,291 | |||||
E. Neal Crawford, Jr. | 1,150,000 | 429,975 | 616,158 | 67,731 | 2,263,864 | |||||
William T. Morrison | 1,000,000 | 322,481 | 536,791 | 86,061 | 1,945,333 | |||||
Andrew N. Lock | 660,000 | 278,571 | 431,760 | 88,275 | 1,458,606 | |||||
Lynette P. Harris | 550,000 | 246,946 | 431,760 | 67,425 | 1,296,131 | |||||
(1) | Principal position for Mr. Schwartz is Chief Executive Officer. Principal position for Mr. Crawford is President. Principal position for Mr. Morrison is Executive Vice President of the Company and Chief Executive Officer, Monarch Mortgage. Principal position for Mr. Lock is Executive Vice President and Chief Risk Officer. Principal position for Mrs. Harris is Executive Vice President and Chief Financial Officer. |
(2) | Severance amount for all Executive Officers upon a termination of employment by the company without cause, by the executive for reasons other than for disability or retirement, is one year’s salary and benefits paid in exchange for an agreement |
125
not to compete and not to solicit employees of the company for a one year period. Severance for Messrs. Schwartz, Crawford, Lock and Mrs. Harris upon a termination by the Company without cause or by the executive for good reason following a change in control is equal to two times the executive’s current salary and highest bonus over the previous two years. Severance for Mr. Morrison upon a change in control is equal to two times the executive’s current salary and highest bonus, up to a maximum of $1,000,000.
(3) | Upon a change in control the Supplemental Executive Retirement Plan vesting accelerates to 100% of the present value of the full retirement benefit. This acceleration is immediate and not dependent on a qualifying termination of employment. |
(4) | Upon a change in control restricted stock grants fully vest. This acceleration is immediate and not dependent on a qualifying termination of employment. |
(5) | Other estimated expenses for the Executive Officers upon a termination of employment by executive with good reason or by the company without cause or by the executive for reasons other than disability or retirement is based on a December 31, 2015 date, comprised of health and life insurance premiums, auto allowance or equivalent, and defined contribution plan contributions. If employment is terminated by the Company without cause or by the executive for reasons other than disability or retirement, then one year’s salary and the value of the Company’s welfare benefits are paid in exchange for an agreement not to compete and not to solicit employees of the company for a one year period. |
(6) | The Company does not pay for any tax-gross ups of payments exceeding certain IRS payout limits. |
Compensation Committee Interlocks and Insider Participation
No member of the Compensation Committee is a current or former officer or employee of the Company or any of our subsidiaries. In addition, there are no Compensation Committee interlocks with other entities with respect to any such member.
Compensation Committee Report
The Compensation Committee has reviewed the Compensation Discussion and Analysis required by Item 402(b) of Regulation S-K with management and, based on such review and discussion, subsequently recommended to the Board that the Compensation Discussion and Analysis be included in the Company’s Proxy Statement.
Compensation Committee: |
Dwight C. Schaubach, Chair |
Lawton H. Baker |
Jeffrey F. Benson |
Joe P. Covington, Jr. |
Annual Compensation
The following table provides, for the fiscal years ended December 31, 2015, December 31, 2014 and December 31, 2013, information on the total compensation paid or accrued to the Principal Executive Officer, Chief Financial Officer, and the three other most highly compensated executive officers of the Company whose total compensation exceeded $100,000 (the “named executive officers”).
126
Summary Compensation Table | |||||||||||||||
Name and Principal Position | Year | Salary ($) | Bonus ($) | Stock Award ($)(1) | Non-Equity Incentive Plan Compensation ($) | Change in Pension Value Nonqualified Deferred Compensation on Earnings ($)(2) | All Other Compensation ($)(3) | Total ($) | |||||||
Brad E. Schwartz | 2015 | 433,333 | 175,000 | 63,950 | — | 96,969 | 19,452 | 788,704 | |||||||
CEO | 2014 | 391,667 | 125,000 | 55,200 | — | 118,406 | 20,563 | 710,836 | |||||||
2013 | 361,667 | 175,000 | 83,475 | — | 40,063 | 21,978 | 682,183 | ||||||||
E. Neal Crawford, Jr. | 2015 | 383,333 | 175,000 | 51,160 | — | 86,969 | 14,077 | 710,539 | |||||||
President | 2014 | 341,667 | 125,000 | 48,300 | — | 108,406 | 14,632 | 638,005 | |||||||
2013 | 310,000 | 175,000 | 55,650 | — | 40,063 | 17,045 | 597,758 | ||||||||
William T. Morrison | 2015 | 300,000 | — | 41,160 | 966,371 | 40,870 | 20,187 | 1,368,588 | |||||||
Mortgage CEO | 2014 | 250,000 | — | 48,300 | 302,091 | 33,420 | 20,400 | 654,211 | |||||||
2013 | 200,000 | — | 55,650 | 494,998 | 30,827 | 19,932 | 801,407 | ||||||||
Andrew N. Lock | 2015 | 235,000 | 90,000 | 22,580 | — | 59,339 | 20,925 | 427,844 | |||||||
EVP & CRO | 2014 | 220,000 | 60,000 | 34,500 | — | 61,760 | 30,440 | 406,700 | |||||||
2013 | 206,667 | 75,000 | 44,520 | — | 29,338 | 15,012 | 370,537 | ||||||||
Lynette P. Harris | 2015 | 195,000 | 75,000 | 25,580 | — | 49,678 | 3,975 | 349,233 | |||||||
EVP & CFO | 2014 | 178,333 | 50,000 | 34,500 | — | 52,358 | 14,105 | 329,296 | |||||||
2013 | 160,000 | 65,000 | 44,520 | — | 25,180 | 13,518 | 308,218 | ||||||||
(1) | The Company granted restricted stock awards pursuant to the Company’s 2014 Equity Incentive Plan, which was approved by shareholders at the 2014 annual meeting. All shares have been adjusted for any previous stock dividends/stock splits prior to December 31, 2015. Stock award valuations are calculated by multiplying the number of shares awarded by the grant date fair value in accordance with FASB ASC Topic 718. |
(2) | These amounts represent the aggregate change in the actuarial present value of each officer’s accumulated benefit under the Company’s Supplemental Executive Retirement Plan. |
(3) | Includes life insurance premiums, personal use of a Company-owned vehicle or vehicle allowance, club and 401(k) benefit match. See Summary Perquisite Table below for further detail by named executive officer. |
(4) | Mr. Morrison received $966,371 in 2015 in profit sharing directly related to the profitability of Monarch Mortgage and Real Estate Settlement Agency, LLC as explained in more detail under Employment Agreements. These profit-based awards are included in the column above titled Non-equity incentive plan compensation ($) for Mr. Morrison. |
Summary Perquisite Table
The following table provides, for the fiscal year ended December 31, 2015, information on compensation in the form of perquisites and other personal benefits paid to named executive officers.
127
Name and Principal Position | Company Vehicle ($) Use or Allowance | Company Contributions to 401(K)($) | Club Membership ($) | Life Insurance Premiums ($) | Total ($) | |||||
Brad E. Schwartz | 5,991 | 6,513 | 6,048 | 900 | 19,452 | |||||
Chief Executive Officer | ||||||||||
E. Neal Crawford, Jr. | 4,947 | 5,250 | 3,060 | 820 | 14,077 | |||||
President | ||||||||||
William T. Morrison | 5,999 | 6,858 | 5,820 | 1,510 | 20,187 | |||||
Monarch Mortgage CEO | ||||||||||
Andrew N. Lock | 8,400 | 6,225 | 5,820 | 480 | 20,925 | |||||
EVP & CRO | ||||||||||
Lynette P. Harris | 8,400 | 5,175 | — | 400 | 13,975 | |||||
EVP & CFO | ||||||||||
Option Exercises and Stock Vested
In the table below, we list information on the vesting of stock awards during the year ended December 31, 2015, for each of the named executive officers.
Options Exercises and Stock Vested | ||||||||||||
Fiscal Year 2015 | ||||||||||||
Option Awards | Stock Awards | |||||||||||
Name | Number of Shares Acquired on Exercise (#) | Value Realized on Exercise ($) | Number of Shares Acquired on Vesting (#) | Value Realized on Vesting ($)(1) | ||||||||
Brad E. Schwartz | 10,890 | 44,475 | 6,600 | 84,150 | ||||||||
E. Neal Crawford, Jr. | 10,890 | 44,882 | 6,600 | 84,150 | ||||||||
William T. Morrison | — | 6,600 | 84,150 | |||||||||
Andrew N. Lock | 15,246 | 66,042 | 3,960 | 50,490 | ||||||||
Lynette P. Harris | 3,267 | 15,734 | 3,960 | 50,490 | ||||||||
(1) Based on stock closing price of $12.75 on December 10, 2015 vesting date.
128
Outstanding Equity Awards
The following table lists information on the holdings of unexercised stock options and unvested stock awards as of December 31, 2015 for each of the named executive officers.
Outstanding Equity Awards at Fiscal Year End | ||||
Stock Awards | ||||
Nam and Principal Position (1) | Number of Shares of Stock That Have Not Vested (#)(2)(3) | Market Value of Shares of Stock That Have Not Vested ($)(4) | ||
Brad E. Schwartz | 44,050 | 792,460 | ||
E. Neal Crawford, Jr. | 34,250 | 616,158 | ||
William T. Morrison | 30,950 | 556,791 | ||
Andrew N. Lock | 24,000 | 431,760 | ||
Lynette P. Harris | 24,000 | 431,760 | ||
(1) | Principal position for Mr. Schwartz is Chief Executive Officer. Principal position for Mr. Crawford is President. Principal position for Mr. Morrison is Executive Vice President of the Company and Chief Executive Officer, Monarch Mortgage. Principal position for Mr. Lock is Executive Vice President and Chief Risk Officer. Principal position for Mrs. Harris is Executive Vice President and Chief Financial Officer. |
(2) | The number of unvested restricted stock shares reflect a 6:5 stock split in 2003, a 6:5 stock split in 2004, an 11:10 stock dividend in 2005, a 5:4 stock split in 2006, a 6:5 stock split in 2007, a 6:5 stock split in 2012, and an 11:10 stock split in 2015. All stock awards have been adjusted for stock splits/dividends. |
(3) | Each restricted stock grant vests at the end of five years, or upon a change of control, whichever occurs first. |
Mr. Schwartz was granted 9,900 shares on 12/31/2011 that will vest on 12/31/2016; 16,500 shares on 12/13/2012 that will vest on 12/10/2017; 8,250 shares on 12/12/2013 that will vest on 12/10/2018; 4,400 shares on 12/8/2014 that will vest on 12/9/2019; and 5,000 shares on 12/8/2015 that will vest on 12/9/2020.
Mr. Crawford was granted 9,900 shares on 12/31/2011 that will vest on 12/31/2016; 11,000 shares on 12/13/2012 that will vest on 12/10/2017; 5,500 shares on 12/12/2013 that will vest on 12/10/2018; 3,850 shares on 12/8/2014 that will vest on 12/9/2019; and 4,000 shares on 12/8/2015 that will vest on 12/9/2020.
Mr. Morrison was granted 6,600 shares on December 31, 2011 that will vest on December 31, 2016; 11,000 shares on 12/13/2012 that will vest on 12/10/2017; 5,500 shares on 12/12/2013 that will vest on 12/10/2018; 3,850 shares on 12/8/2014 that will vest on 12/9/2019; and 4,000 shares on 12/8/2015 that will vest on 12/9/2020.
Mr. Lock was granted 6,600 shares on December 31, 2011 that will vest on December 31, 2016; 8,250 shares on 12/13/2012 that will vest on 12/10/2017; 4,400 shares on 12/12/2013 that will vest on 12/10/2018; 2,750 shares on 12/8/2014 that will vest on 12/9/2019, and 2,000 shares on 12/8/2015 that will vest on 12/9/2020.
Mrs. Harris was granted 6,600 shares on December 31, 2011 that will vest on December 31, 2016; 8,250 shares on 12/13/2012 that will vest on 12/10/2017; 4,400 shares on 12/12/2013 that will vest on 12/10/2018; 2,750 shares on 12/8/2014 that will vest on 12/9/2019, and 2,000 shares on 12/8/2015 that will vest on 12/9/2020.
(4) Based on closing price of $17.99 of the Company’s common stock as of December 31, 2015.
Director Compensation
During 2015, the Company paid non-employee directors for meeting attendance at a rate of $1,000 for monthly Monarch Bank Board of Director meetings and $500 for all committee meetings except director loan committee meetings, which paid $400 per meeting, all paid in cash. All meetings of the Monarch Financial Holdings, Inc. board were held at the same time and place as Monarch Bank board of directors meetings in 2015, with no additional compensation paid if the meetings were held on the same day. Executive Committee meetings were also held with no additional compensation paid. Mr. Schwartz, Mr. Crawford, and Mr. Morrison, all employee directors, have not been paid any director’s fees.
A single cash payment and restricted stock grant was provided as an annual retainer to all non-employee directors in 2015. The cash payment was $15,000 for each non-employee director. Each director has been granted a restricted stock award pursuant to the Monarch Financial Holdings, Inc. 2014 Equity Incentive Plan. Grants of 1,500 shares per non-employee director were made for 2015 on December 8, 2015 at the closing market price on the day issued, with the exception of the
129
Chairman, Mr. Benson, to whom a grant of 3,000 shares was made for 2015 on December 8, 2015. Shares vest approximately two years from issuance.
The following table sets forth certain information relating to compensation of directors in Fiscal 2015:
Director Compensation for 2015 | ||||||||||
Name | Fees Earned or Paid in Cash ($)(1)(2) | Stock Awards ($)(3) | Option Awards ($) | All Other Compensation ($) | Total ($) | |||||
Lawton H. Baker | 29,650 | 19,185 | — | — | 48,835 | |||||
Jeffrey F. Benson | 42,050 | 37,370 | — | — | 79,420 | |||||
Joe P. Covington, Jr. | 40,650 | 19,185 | — | — | 59,835 | |||||
Virginia S. Cross | 29,250 | 19,185 | — | — | 48,435 | |||||
Taylor B. Grissom | 42,450 | 19,185 | — | — | 61,635 | |||||
Robert M. Oman | 41,250 | 19,185 | — | — | 60,435 | |||||
Elizabeth T. Patterson | 28,250 | 19,185 | — | — | 47,435 | |||||
Dwight C. Schaubach | 26,650 | 19,185 | — | — | 45,835 | |||||
(1) | All meeting fees are paid in cash on a monthly basis. |
(2) | Based on the Company’s financial performance in 2015, a cash retainer of $15,000 was paid to each non-employee director. |
(3) | Each of the directors named above were granted 1,500 shares of restricted stock as a retainer that vest December 9, 2017 with the exception of Mr. Benson whom was granted 3,000 shares of restricted stock as a retainer that vest December 9, 2017. The valuation is based on the Company stock price of $12.79 per share at the grant date of December 8, 2015. |
Item 12. | Security Ownership of Certain Beneficial Owners and Management and Related Stockholder Matters. |
SECURITY OWNERSHIP OF MANAGEMENT
The following table sets forth information relating to the beneficial ownership of Common Stock as of March 1, 2016, by (i) each of the Company’s directors and the named executive officers listed in the Summary Compensation Table below and (ii) all of the Company’s directors and executive officers as a group. Each of the Company’s directors and named executive officers currently receive mail at the Company at 1435 Crossways Boulevard, Suite 301, Chesapeake, VA 23320. Beneficial ownership includes shares, if any, held in the name of a spouse, minor children or other relatives of a director living in such person’s home, as well as shares, if any, held in the name of another person under an arrangement whereby the director or executive officer can vest title in themselves at once or at some future time.
130
Name | Number of Shares Beneficially Owned (1)(2)(3)(4) | Percent of Outstanding Shares | |||||
Lawton H. Baker | 56,203 | * | |||||
Jeffrey F. Benson | 105,267 | * | |||||
Joe P. Covington, Jr. | 73,984 | * | |||||
E. Neal Crawford, Jr. | 103,901 | * | |||||
Virginia S. Cross | 18,843 | * | |||||
Taylor B. Grissom | 56,008 | * | |||||
Lynette P. Harris | 47,101 | * | |||||
Andrew N. Lock | 51,173 | * | |||||
William T. Morrison | 125,056 | 1.05 | % | ||||
Robert M. Oman | 75,742 | * | |||||
Elizabeth T. Patterson | 95,545 | * | |||||
Dwight C. Schaubach | 193,041 | 1.62 | % | ||||
Brad E. Schwartz | 141,771 | 1.19 | % | ||||
Directors and Executive Officers as a Group (15 persons) | 1,166,925 | 9.63 | % | ||||
*Indicates ownership interest of less than 1%
(1) For purposes of this table, beneficial ownership has been determined in accordance with the provisions of Rule 13d-3 of the Securities Exchange Act of 1934 under which, in general, a person is deemed to be the beneficial owner of a security if he or she has or shares the power to vote or direct the voting of the security, the power to dispose of or direct the disposition of the security, or the right to acquire beneficial ownership of the security within 60 days.
(2) | Includes shares held by affiliated corporations, close relatives and children, and shares held jointly with spouses or as custodians or trustees, as follows: Mr. Baker, 13,949 shares; Mr. Benson, 65,184 shares; Mr. Covington, 70,763; Mr. Crawford, 42,541; Mrs. Cross, 135; Mr. Grissom, 1,251; Mrs. Harris, 8,194 shares; Mr. Oman, 62,715 shares; Mr. Schaubach, 3,326 shares; and Mr. Schwartz 1,465 shares. |
(3) | Includes shares of common stock that are restricted stock holdings as follows: Mr. Baker, 2,820 shares; Mr. Benson, 5,640 shares; Mr. Covington, 2,820 shares; Mr. Crawford, 34,250 shares; Mrs. Cross, 2,820 shares; Mr. Grissom, 2,820 shares; Mrs. Harris, 24,000 shares; Mr. Lock, 24,000 shares; Mr. Morrison, 30,950; Mr. Oman, 2,820 shares; Mrs. Patterson, 2,820. Mr. Schaubach, 2,820 shares; and Mr. Schwartz 44,050 shares. The shares are subject to a vesting schedule, forfeiture risk and other restrictions. |
(4) | Includes 182,630 shares of common stock that are restricted stock holdings. |
Security Ownership of Certain Beneficial Owners
As of February 15, 2016, the most recent date available, no shareholders reported beneficial ownership of 5% or more of Common Stock in Schedule 13G filings with the SEC.
Securities Authorized for Issuance under Equity Compensation Plans
The following table shows certain information with respect to the Equity Compensation Plans as of December 31, 2015.
131
Plan category | Number of securities to be issued upon exercise of outstanding options, warrants and rights | Weighted-average exercise price of outstanding options, warrants and rights | Number of securities remaining available for future issuance under equity compensation plans |
Equity compensation plans approved by security holders: 1999 Stock Option Plan (1) | — | — | — |
Equity compensation plans approved by security holders: 2014 Equity Incentive Plan | — | N/A | 1,214,299 |
Equity compensation plans not approved by security holders | N/A | N/A | N/A |
Total | — | — | 1,214,299 |
(1) | Consists entirely of shares of Common Stock underlying previously granted stock options that have not been exercised. All of these options were granted pursuant to Monarch Bank’s 1999 stock option plan, a predecessor plan to the 2014 Equity Incentive Plan. There are no remaining options outstanding. |
Item 13. | Certain Relationships and Related Transactions, and Director Independence. |
Related Party Transactions
Some of the directors and officers of the Company are at present, as in the past, customers of the Company and its subsidiaries, and the Company and its subsidiaries have had, and expect to have in the future, banking transactions in the ordinary course of their business with directors, officers, principal shareholders and their associates, on substantially the same terms, including interest rates and collateral on loans, as those prevailing at the same time for comparable transactions with persons not related to Monarch Bank. These transactions do not involve more than the normal risk of collectability or present other unfavorable features. The balance of loans to directors, executive officers and their associates totaled $31,549,392 at December 31, 2015, or 27% of the Company’s equity capital at that date. All loans to directors are approved at the Directors Loan Committee and also approved at the Board of Directors meeting, with the director receiving the loan abstaining from the vote. The Board of Directors reviews all such transactions and has approved all related party transactions with members of the Board of Directors.
Other than as set forth above, or under “Corporate Governance and the Board of Directors - Independence of Directors,” there were no transactions during 2015 between the Company’s directors or officers and the Company or its subsidiaries, nor are there any proposed transactions. Additionally, there are no legal proceedings to which any director, officer or principal shareholder, or any affiliate thereof, is a party that would be material and adverse to the Company.
Corporate Governance and the Board of Directors
The business and affairs of the Company are managed under the direction of the Board of Directors in accordance with the Virginia Stock Corporation Act and the Company’s Articles of Incorporation and Bylaws. Members of the Board are kept informed of the Company’s business through discussions with the Chairman, Chief Executive Officer, President, and other officers, by reviewing materials provided to them and by participating in meetings of the Board of Directors and its committees.
Our board structure and practices allow us to monitor and manage risks inherent in our business. We have an independent board chairman, and eight of our eleven current board members are independent of management. Each board member of Monarch Financial Holdings, Inc. also serves as a director of our sole subsidiary, Monarch Bank. All members attended more than 75% of our board and applicable committee meetings in 2015. We consider our largest risk to be credit risk, and as such a majority of our board members serve on the Directors Loan Committee, which reviews larger exposure lending and our overall loan policy and direction. Our Audit and Compliance Committee and Compensation Committee were also active in their oversight and management of risks within their area of responsibility in 2015. Our directors were also actively involved in our strategic planning process.
132
Independence of the Directors
The Board of Directors in its business judgment has determined that the following eight of its eleven members are independent as defined by the listing standards of the Nasdaq Stock Market (“NASDAQ”): Mrs. Cross, Mrs. Patterson, and Messrs. Baker, Benson, Oman, Covington, Schaubach, and Grissom. In reaching this conclusion, the Board considered that the Company and its subsidiaries from time to time provide services to, and otherwise conduct business with, companies of which certain members of the Board or members of their immediate families are or were directors or officers.
Consistent with the NASDAQ listing standards, our Corporate Governance Guidelines (established and monitored by the Company’s Nominating and Corporate Governance Committee) establish categorical standards under which the Board views the following as impairing a director’s independence:
a director who is our employee, or whose immediate family member is an executive officer;
a director who receives, or whose immediate family member receives, more than $120,000 per year in direct compensation from the Company, other than director and committee fees and pension or other forms of deferred compensation for prior service;
a director who is affiliated with or employed by, or whose immediate family member is affiliated with or employed in a professional capacity by, the Company’s present or former internal or external auditor;
a director who is employed, or whose immediate family member is employed, as an executive officer of another company where any of the Company’s present executives serve on that company’s compensation committee; and
a director who is an executive officer or an employee, or whose immediate family member is an executive officer, of a company that makes payments to, or receives payments from, the Company for property or services in an amount which, in any single fiscal year, exceeds the greater of $200,000 or 5% of the recipient’s consolidated gross revenues.
None of our non-employee directors, their immediate family members or employers is engaged in such relationships with the Company.
Executive Sessions
Independent directors meet periodically outside of regularly scheduled Board meetings. The Company held ten formal executive sessions that included only independent directors in 2015. Mr. Benson served as chairman for these executive sessions.
Committees of the Board
The Board of Directors has five standing committees: Audit and Compliance Committee, Compensation Committee, Executive Committee, Director’s Loan Committee and Governance and Nominating Committee. At its first Board of Directors meeting following the annual Board of Directors election, the Board elects each Committee. Committee members serve for a one year term or until the first meeting of the Board following the annual Board of Directors election. Information on the committees and the committee members is detailed below:
Audit and Compliance Committee
The Audit and Compliance Committee (the “Audit Committee”) of the Board of Directors is responsible for providing independent, objective oversight of the Company’s independent auditors, accounting functions and internal controls. The specific functions of the Audit Committee are to (i) recommend selection of independent certified public accountants; (ii) approve the scope of the accountants’ examination; (iii) review internal accounting procedures; (iv) review reports of examination by the accountants and by regulatory agencies having jurisdiction over the Company; (v) monitor internal programs to ensure compliance with the law and avoidance of conflicts of interest; and (vi) aid the Board in fulfilling its responsibilities for financial reporting to the public. During 2015, the Company’s internal audit function was carried out by its internal auditors. The Audit Committee is directly responsible for the appointment, compensation, retention and oversight of the work of both the internal auditor and the independent auditor engaged for the purpose of preparing or issuing an audit report or performing other audit, review or attestation services for the Company. The Audit Committee has a written Audit and Compliance Committee Charter (the “Charter”). This Charter is published at https://www.monarchbank.com/about-us/investor-relations/.
The members of the Audit Committee are Mr. Baker (Chairman), Mrs. Cross, and Mrs. Patterson, all of whom the Board in its business judgment have determined are independent as defined by NASDAQ’s listing standards and the requirements of the SEC. The Board of Directors has determined all of the Audit Committee members have sufficient knowledge in financial and auditing matters to serve on the Audit Committee, and Mr. Baker qualifies as an Audit Committee financial expert as defined by NASDAQ’s listing standards and the requirements of the SEC.
133
The Audit Committee met four times in 2015. For additional information regarding the Audit Committee, see “Audit Information - Audit and Compliance Committee Report” in this Proxy Statement.
Compensation Committee
The Compensation Committee reviews the performance and compensation of the overall company, reviews compensation risk, sets guidelines for compensation of executive officers and addresses human resources issues and policies. All decisions by the Compensation Committee relating to the compensation of the Company’s executive officers are reported to the full Board of Directors. The Compensation Committee has a separate written Charter. This Charter is published at https://www.monarchbank.com/about-us/investor-relations/.
The members of the Compensation Committee are Messrs. Schaubach (Chairman), Baker, Benson and Covington. The Board of Directors in its business judgment has determined that all members are independent as defined by NASDAQ’s listing standards and all meet the requirements established by the Securities and Exchange Commission. The Compensation Committee met once in 2015 to review compensation mix and perform a review of the Company’s compensation policies and actions. For additional information regarding the Compensation Committee, see “Executive Compensation - Compensation Committee” in this Proxy Statement.
Executive Committee
When the Board is not in session, the Executive Committee is authorized to exercise all of the Board’s power except for certain Board responsibilities, such as approval of an amendment of the Articles of Incorporation, a plan of merger or consolidation or the issuance of stock. The members of the Executive Committee are Messrs. Benson (Chairman), Baker, Crawford, and Schwartz. The Executive Committee met once in 2015.
Director’s Loan Committee
The functions of the Loan Committee are to (i) approve and ratify new loans over a predetermined dollar limit; (ii) provide oversight of the Company’s lending policies; and (iii) monitor the overall quality of the Company’s loan portfolio. The members of the Loan Committee are Messrs. Benson (Chairman), Covington, Crawford, Grissom, Oman, and Schwartz. The Loan Committee met 39 times in 2015
Nominating and Corporate Governance Committee
The Nominating and Corporate Governance Committee (the “Nominating Committee”) consists of Mrs. Patterson (Chair), and Messrs. Benson, Oman, and Schaubach. The Board in its business judgment has determined all members are independent as defined by NASDAQ’s listing standards. The Nominating Committee is responsible for developing and implementing policies and practices relating to corporate governance, including reviewing and monitoring implementation of the Company’s Governance Guidelines. In addition, the Nominating Committee develops and reviews background information on candidates for the Board and makes recommendations to the Board regarding such candidates. The Company does not have a separate charter for the Nominating Committee. The Nominating Committee did not meet in 2015.
Item 14. | Principal Accounting Fees and Services. |
The Audit and Compliance Committee operates under a written charter that it has adopted. The members of the Audit and Compliance Committee are independent as that term is defined in the listing standards of NASDAQ and applicable rules of the SEC.
Fees of Independent Public Accountants
Audit Fees
The aggregate fees billed by Yount, Hyde and Barbour, PC for professional services rendered for the audit of the Company’s annual financial statements for the fiscal year ended December 31, 2015 and December 31, 2014, and for the review of the consolidated financial statements included in the Company’s Quarterly Reports on Form 10-Q, and services that are normally provided in connection with statutory and regulatory filings and engagements, for 2015 were $142,300 and for 2014 were $147,275.
Audit-Related Fees
The aggregate fees billed by Yount, Hyde and Barbour, PC for professional services for assurance and related services that are reasonably related to the performance of the audit or review of the Company’s consolidated financial statements and not reported under the heading “Audit Fees” above for the fiscal years ended December 31, 2015 were $10,300 and December 31, 2014 were $4,150.
134
Tax Fees
The aggregate fees billed by Yount, Hyde and Barbour, PC for professional services for tax compliance, tax advice and tax planning for the fiscal years ended December 31, 2015 were $21,000 and December 31, 2014 were zero. Tax services including the preparation of federal and state tax returns, and general tax matters will be performed by Yount, Hyde and Barbour, PC for the year ended December 2015. Tax services including the preparation of federal and state tax returns, and general tax matters were performed by the accounting firm of Cherry Beakert & Holland for the year ended December 31, 2014.
All Other Fees
The aggregate fees billed by Yount, Hyde and Barbour, PC for all other fees was zero for the fiscal year ended December 31, 2015 and zero for the fiscal year ended December 31, 2014.
The aggregate fees billed by Yount, Hyde and Barbour, PC, for all services rendered to the Company for the fiscal year ended December 31, 2015 were $173,600, and for the fiscal year ended December 31, 2014 were $151,425.
Pre-Approved Policies and Procedures
All audit related services, tax services and other services were pre-approved by the Audit Committee, which concluded that the provision of such services by Yount, Hyde and Barbour, PC, was compatible with the maintenance of that firm’s independence in the conduct of its auditing functions. Generally, services are pre-approved by the Audit and Compliance Committee through its annual review of the engagement letter. Subsequently, as the need for additional services arise, detailed information regarding the specific audit, audit-related, tax and permissible non-audit services are submitted to the Audit and Compliance Committee for its review and approval prior to the provision of such services. In the event that the Audit and Compliance Committee cannot meet prior to the provision of such services, the Audit and Compliance Committee has delegated to its Chair the authority to pre-approve such services. All such pre-approvals are then reported to the Audit and Compliance Committee at its next regularly scheduled meeting.
PART IV
Item 15. | Exhibits, Financial Statements Schedules. |
(a) | (1) and (2). The response to this portion of Item 15 is included in Item 8 above. |
(3). Exhibits
(a.)The following exhibits are filed on behalf of the Registrant as part of this report:
No. | Description | |
2.1 | Agreement and Plan of Reorganization, dated as of December 16, 2015, by and among TowneBank, Monarch Financial Holdings, Inc. and Monarch Bank, attached as Exhibit 2.1 to the Registrant's Current Report on Form 8-K, filed with the Commission on December 22, 2015, incorporated by reference herein. | |
3.1 | Articles of Incorporation of Monarch Financial Holdings, Inc., attached as Exhibit 3.1 to the Registrant’s Current Report on Form 8-K, filed with the Commission on October 14, 2009, incorporated by reference herein. | |
3.2 | Form of Articles of Amendment to the Articles of Incorporation of Monarch Financial Holdings, Inc. establishing the Series B Noncumulative Convertible Perpetual Preferred Stock, attached as Exhibit 3.2 to the Registrant’s Amendment No. 2 to Form S-1, filed with the Commission on November 25, 2009, incorporated by reference herein. | |
3.3 | Bylaws of Monarch Financial Holdings, Inc., attached as Exhibit 3.1 to the Registrant’s Current Report on Form 8-K, filed with the Commission on December 17, 2015, incorporated by reference herein. | |
4.1 | Form of Registration Rights Agreement, attached as Exhibit 4.1 to the Registrant’s Current Report on Form 8-K, filed with the Commission on June 12, 2008, incorporated by reference herein. | |
4.2 | Form of Subscription Agreement, attached as Exhibit 99.1 to the Registrant’s Current Report on Form 8-K, filed with the Commission on June 12, 2008, incorporated by reference herein. | |
4.3 | Junior Subordinated Debenture between Monarch Financial Holdings, Inc. and Wilmington Trust Company dated as of July 5, 2006, attached as Exhibit 10.1 to the Registrant’s Current Report on Form 8-K, filed with the Commission on July 10, 2006, incorporated by reference herein. | |
135
4.4 | Monarch Bank 2014 Equity Incentive Plan attached as Exhibit 4.5 to the Registrant's Registration Statement on Form S-8, filed with the Commission on August 15, 2014, incorporated by reference herein. | |
10.1 | Guaranty Agreement between Monarch Financial Holdings, Inc. and Wilmington Trust Company dated as of July 5, 2006, attached as Exhibit 10.2 to the Registrant’s Current Report on Form 8-K, filed with the Commission on July 10, 2006, incorporated by reference herein. | |
10.2 | Amended and Restated Trust Agreement among Monarch Financial Holdings, Inc., Wilmington Trust Company, and the Administrative Trustees Named herein dated as of July 5, 2006, attached as Exhibit 10.3 to the Registrant’s Current Report on Form 8-K, filed with the Commission on July 10, 2006, incorporated by reference herein. | |
10.3 | Employment Agreement entered into between Monarch Bank and Brad E. Schwartz attached as Exhibit 10.2 to the Registrant’s Current Report on Form 8-K, filed with the Commission on January 6, 2011, incorporated by reference herein. | |
10.4 | Employment Agreement entered into between Monarch Bank and E. Neal Crawford, Jr. attached as Exhibit 10.3 to the Registrant’s Current Report on Form 8-K, filed with the Commission on March 11, 2008, incorporated by reference herein. | |
10.5 | Employment Agreement entered into between Monarch Bank and William T. Morrison attached as Exhibit 10.1 to the Registrant’s Current Report on Form 8-K, filed with the Commission on February 6, 2015, incorporated by reference herein. | |
10.6 | Form of Change in Control Agreement between Monarch Bank and Brad E. Schwartz attached as Exhibit 10.3 to the Registrant’s Current Report on Form 8-K, filed with the Commission on January 6, 2011, incorporated by reference herein. | |
10.7 | Form of Change in Control Agreement between Monarch Bank and William T. Morrison attached as Exhibit 10.2 to the Registrant’s Current Report on Form 8-K, filed with the Commission on February 6, 2015, incorporated by reference herein. | |
10.8 | Form of Change in Control Agreement between Monarch Bank and E. Neal Crawford attached as Exhibit 10.1 to the Registrant’s Current Report on Form 8-K, filed with the Commission on October 28, 2011, incorporated by reference herein. | |
10.9 | Form of Change in Control Agreement between Monarch Bank and Lynette P. Harris attached as Exhibit 10.3 to the Registrant’s Current Report on Form 8-K, filed with the Commission on October 28, 2011, incorporated by reference herein. | |
10.10 | Supplemental Executive Retirement Plan effective January 1, 2011, by and between Monarch Bank and Brad E. Schwartz attached as Exhibit 10.4 to the Registrant’s Current Report on Form 8-K, filed with the Commission on January 6, 2011, incorporated by reference herein. | |
10.11 | Supplemental Executive Retirement Plan effective January 1, 2011, by and between Monarch Bank and Brad E. Schwartz attached as Exhibit 10.5 to the Registrant’s Current Report on Form 8-K, filed with the Commission on January 6, 2011, incorporated by reference herein. | |
10.12 | Supplemental Executive Retirement Plan effective January 1, 2011, by and between Monarch Bank and William T. Morrison attached as Exhibit 10.12 to the Registrant’s Current Report on Form 8-K, filed with the Commission on January 6, 2011, incorporated by reference herein. | |
10.13 | Supplemental Executive Retirement Plan effective January 1, 2011, by and between Monarch Bank and William T. Morrison attached as Exhibit 10.13 to the Registrant’s Current Report on Form 8-K, filed with the Commission on January 6, 2011, incorporated by reference herein. | |
10.14 | Supplemental Executive Retirement Plan effective January 1, 2011, by and between Monarch Bank and E. Neal Crawford attached as Exhibit 10.2 to the Registrant’s Current Report on Form 8-K, filed with the Commission on October 28, 2011, incorporated by reference herein. | |
10.15 | Supplemental Executive Retirement Plan effective January 1, 2011, by and between Monarch Bank and Lynette P. Harris attached as Exhibit 10.4 to the Registrant’s Current Report on Form 8-K, filed with the Commission on October 28, 2011, incorporated by reference herein. | |
21.1 | Subsidiaries of Registrant, attached as Exhibit 21.1, filed herewith. | |
23.1 | Consent of Yount, Hyde & Barbour, PC., filed herewith. | |
31.1 | Certification of the Chief Executive Officer pursuant to Rule 13a-14(a), filed herewith. | |
31.2 | Certification of the Principal Financial Officer pursuant to Rule 13a-14(a), filed herewith. | |
136
32.1 | Certification of the Chief Executive Officer pursuant to Section 906 of the Sarbanes-Oxley Act of 2002, filed herewith. | |
32.2 | Certification of the Principal Financial Officer pursuant to Section 906 of the Sarbanes-Oxley Act of 2002, filed herewith. | |
101 | Financial statements and schedules in interactive data format, filed herewith. | |
(b) | Exhibits |
See Item 15(a)(3) above.
(c) | Financial Statement Schedules |
See Item 15(a)(2) above.
137
SIGNATURES
Pursuant to the requirements of Section 13 or 15(d) of the Securities Exchange Act of 1934, the registrant has duly caused this Report to be signed on its behalf by the undersigned, thereunto duly authorized.
MONARCH FINANCIAL HOLDINGS, INC. March 11, 2016 | |||
By: | /s/ LYNETTE P. HARRIS | ||
Lynette P. Harris Executive Vice President, Secretary, Treasurer & Chief Financial Officer (On behalf of the Company and as principal financial and accounting officer) | |||
Pursuant to the requirements of the Securities Exchange Act of 1934, this Report has been signed below by the following persons on behalf of the registrant and in the capacities indicated on March 11, 2016.
/s/ LAWTON H. BAKER | March 11, 2016 | |
Lawton H. Baker, Director | ||
/s/ JEFFREY F. BENSON | March 11, 2016 | |
Jeffrey F. Benson, Director | ||
/s/ JOE P. COVINGTON, JR. | March 11, 2016 | |
Joe P. Covington, Jr., Director | ||
/s/ E. NEAL CRAWFORD, JR. | March 11, 2016 | |
E. Neal Crawford, Jr., President and Director | ||
/s/ VIRGINIA S. CROSS | March 11, 2016 | |
Virginia S. Cross, Director | ||
/s/ TAYLOR B. GRISSOM | March 11, 2016 | |
Taylor B. Grissom, Director | ||
/s/ WILLIAM T. MORRISON | March 11, 2016 | |
William T. Morrison, Executive Vice President and Director | ||
/s/ ROBERT M. OMAN | March 11, 2016 | |
Robert M. Oman, Director | ||
/s/ ELIZABETH T. PATTERSON | March 11, 2016 | |
Elizabeth T. Patterson, Director | ||
/s/ DWIGHT C. SCHAUBACH | March 11, 2016 | |
Dwight C. Schaubach, Director | ||
/s/ BRAD E. SCHWARTZ | March 11, 2016 | |
Brad E. Schwartz, Director, Chief Executive Officer (as principal executive officer) | ||
138
EXHIBIT INDEX
Number | Description | |
2.1 | Agreement and Plan of Reorganization, dated as of December 16, 2015, by and among TowneBank, Monarch Financial Holdings, Inc. and Monarch Bank, attached as Exhibit 2.1 to the Registrant's Current Report on Form 8-K, filed with the Commission on December 22, 2015, incorporated by reference herein. | |
3.1 | Articles of Incorporation of Monarch Financial Holdings, Inc., attached as Exhibit 3.1 to the Registrant’s Current Report on Form 8-K, filed with the Commission on October 14, 2009, incorporated by reference herein. | |
3.2 | Form of Articles of Amendment to the Articles of Incorporation of Monarch Financial Holdings, Inc. establishing the Series B Noncumulative Convertible Perpetual Preferred Stock, attached as Exhibit 3.2 to the Registrant’s Amendment No. 2 to Form S-1, filed with the Commission on November 25, 2009, incorporated by reference herein. | |
3.3 | Bylaws of Monarch Financial Holdings, Inc., attached as Exhibit 3.1 to the Registrant’s Current Report on Form 8-K, filed with the Commission on December 17, 2015, incorporated by reference herein. | |
4.1 | Form of Registration Rights Agreement, attached as Exhibit 4.1 to the Registrant’s Current Report on Form 8-K, filed with the Commission on June 12, 2008, incorporated by reference herein. | |
4.2 | Form of Subscription Agreement, attached as Exhibit 99.1 to the Registrant’s Current Report on Form 8-K, filed with the Commission on June 12, 2008, incorporated by reference herein. | |
4.4 | Junior Subordinated Debenture between Monarch Financial Holdings, Inc. and Wilmington Trust Company dated as of July 5, 2006, attached as Exhibit 10.1 to the Registrant’s Current Report on Form 8-K, filed with the Commission on July 10, 2006, incorporated by reference herein. | |
4.5 | Monarch Bank 2014 Equity Incentive Plan attached as Exhibit 4.5 to the Registrant's Registration Statement on Form S-8, filed with the Commission on August 15, 2014, incorporated by reference herein. | |
10.1 | Guaranty Agreement between Monarch Financial Holdings, Inc. and Wilmington Trust Company dated as of July 5, 2006, attached as Exhibit 10.2 to the Registrant’s Current Report on Form 8-K, filed with the Commission on July 10, 2006, incorporated by reference herein. | |
10.2 | Amended and Restated Trust Agreement among Monarch Financial Holdings, Inc., Wilmington Trust Company, and the Administrative Trustees Named herein dated as of July 5, 2006, attached as Exhibit 10.3 to the Registrant’s Current Report on Form 8-K, filed with the Commission on July 10, 2006, incorporated by reference herein. | |
10.3 | Employment Agreement entered into between Monarch Bank and Brad E. Schwartz attached as Exhibit 10.2 to the Registrant’s Current Report on Form 8-K, filed with the Commission on January 6, 2011, incorporated by reference herein. | |
10.4 | Employment Agreement entered into between Monarch Bank and E. Neal Crawford, Jr. attached as Exhibit 10.3 to the Registrant’s Current Report on Form 8-K, filed with the Commission on March 11, 2008, incorporated by reference herein. | |
10.5 | Employment Agreement entered into between Monarch Bank and William T. Morrison attached as Exhibit 10.1 to the Registrant’s Current Report on Form 8-K, filed with the Commission on February 5, 2015, incorporated by reference herein. | |
10.6 | Form of Change in Control Agreement between Monarch Bank and Brad E. Schwartz attached as Exhibit 10.3 to the Registrant’s Current Report on Form 8-K, filed with the Commission on January 6, 2011, incorporated by reference herein. | |
10.7 | Form of Change in Control Agreement between Monarch Bank and William T. Morrison attached as Exhibit 10.2 to the Registrant’s Current Report on Form 8-K, filed with the Commission on February 5, 2015, incorporated by reference herein. | |
10.8 | Form of Change in Control Agreement between Monarch Bank and E. Neal Crawford attached as Exhibit 10.1 to the Registrant’s Current Report on Form 8-K, filed with the Commission on October 28, 2011, incorporated by reference herein. | |
10.9 | Form of Change in Control Agreement between Monarch Bank and Lynette P. Harris attached as Exhibit 10.3 to the Registrant’s Current Report on Form 8-K, filed with the Commission on October 28, 2011, incorporated by reference herein. | |
10.10 | Supplemental Executive Retirement Plan effective January 1, 2011, by and between Monarch Bank and Brad E. Schwartz attached as Exhibit 10.4 to the Registrant’s Current Report on Form 8-K, filed with the Commission on January 6, 2011, incorporated by reference herein. | |
139
10.11 | Supplemental Executive Retirement Plan effective January 1, 2011, by and between Monarch Bank and Brad E. Schwartz attached as Exhibit 10.5 to the Registrant’s Current Report on Form 8-K, filed with the Commission on January 6, 2011, incorporated by reference herein. | |
10.12 | Supplemental Executive Retirement Plan effective January 1, 2011, by and between Monarch Bank and William T. Morrison attached as Exhibit 10.12 to the Registrant’s Current Report on Form 8-K, filed with the Commission on January 6, 2011, incorporated by reference herein. | |
10.13 | Supplemental Executive Retirement Plan effective January 1, 2011, by and between Monarch Bank and William T. Morrison attached as Exhibit 10.13 to the Registrant’s Current Report on Form 8-K, filed with the Commission on January 6, 2011, incorporated by reference herein. | |
10.14 | Supplemental Executive Retirement Plan effective January 1, 2011, by and between Monarch Bank and E. Neal Crawford attached as Exhibit 10.2 to the Registrant’s Current Report on Form 8-K, filed with the Commission on October 28, 2011, incorporated by reference herein. | |
10.15 | Supplemental Executive Retirement Plan effective January 1, 2011, by and between Monarch Bank and Lynette P. Harris attached as Exhibit 10.4 to the Registrant’s Current Report on Form 8-K, filed with the Commission on October 28, 2011, incorporated by reference herein. | |
21.1 | Subsidiaries of Registrant, attached as Exhibit 21.1, filed herewith. | |
23.1 | Consent of Yount, Hyde & Barbour, PC., filed herewith. | |
31.1 | Certification of the Chief Executive Officer pursuant to Rule 13a-14(a), filed herewith. | |
31.2 | Certification of the Principal Financial Officer pursuant to Rule 13a-14(a), filed herewith. | |
32.1 | Certification of the Chief Executive Officer pursuant to section 906 of the Sarbanes-Oxley Act of 2002, filed herewith. | |
32.2 | Certification of the Principal Financial Officer pursuant to Section 906 of the Sarbanes-Oxley Act of 2002, filed herewith. | |
101.0 | Financial statements and schedules in interactive data format, filed herewith. | |
140