Attached files
| file | filename |
|---|---|
| EX-99.1 - JOINT PRESS RELEASE - HERITAGE FINANCIAL CORP /WA/ | d412181dex991.htm |
| 8-K - FORM 8-K - HERITAGE FINANCIAL CORP /WA/ | d412181d8k.htm |
 Acquisition
of
Northwest
Commercial
Bank
September
2012
Heritage
Financial
Corporation
Exhibit 99.2 |
 2
This presentation includes forward-looking statements within the meaning of
the Private Securities Litigation Reform Act of 1995, which can be
identified by words such as “may,” “expected,”
“anticipate,”
“continue,”
or other comparable words. In addition, all
statements other than statements of historical facts that address activities
that Heritage Financial Corporation (“HFWA”) expects or
anticipates will or may occur in the future are forward-looking
statements. Readers are encouraged to read the SEC reports of HFWA,
particularly its Form 10-K for the fiscal year ended December 31, 2011, for
meaningful cautionary language discussing why actual results may vary
materially from those anticipated by management. Specific risks in this
presentation include whether Northwest Commercial Bank (“NCB”)
shareholders approve the merger, whether the companies receive
regulatory approval for the merger, whether the conditions to closing are satisfied,
the timing of the closing and management’s ability to effectively
integrate the companies, whether the companies have accurately predicted
acquisition and consolidation expenses, the timing and amount of savings
from consolidation, and the expected earnings contributions of both
companies. Forward Looking Statement |
 3
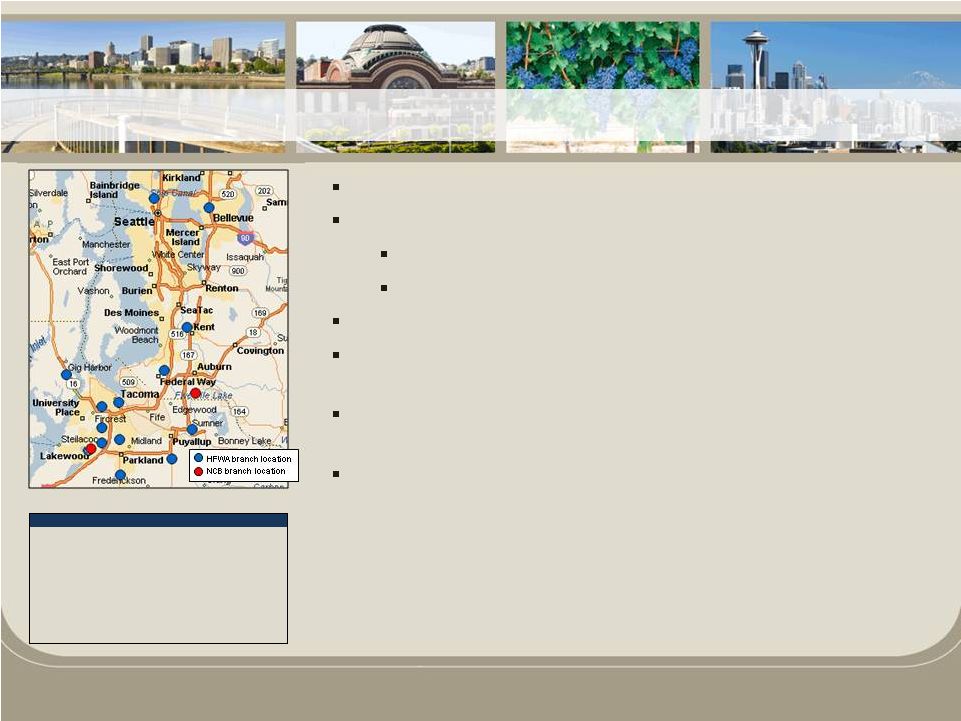
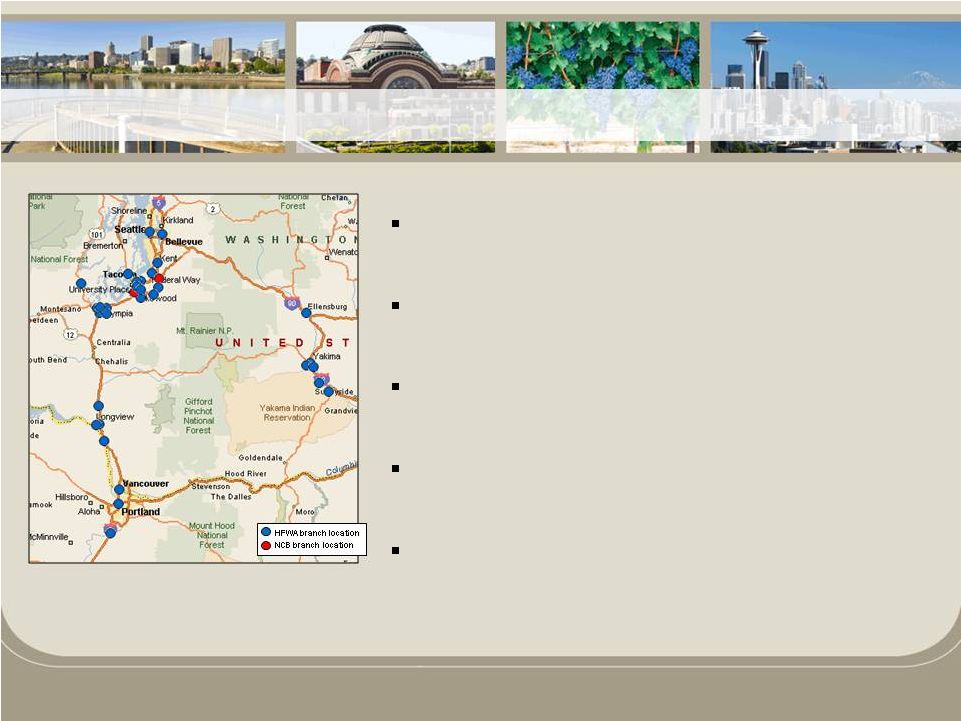
NCB will be merged into Heritage Bank
Fill-in footprint in Puget Sound Region
Expansion into the Auburn market
Consolidation of Lakewood branches
Fits HFWA’s overall growth strategy in the Pacific Northwest
Attractive NCB loan portfolio mix, which is 76% Commercial
Real Estate and Commercial & Industrial loans
Deposit base with 18% non-interest bearing demand
deposits
Financially attractive deal pricing and structure with
conservative modeling assumptions
Source: SNL Financial, NCB regulatory call report data, as of 6/30/2012
NCB Financial Overview (6/30/2012):
Total Assets ($000s)
72,153
$
Total Loans ($000s)
52,697
$
Total Deposits ($000s)
63,206
$
Total Equity ($000s)
8,373
$
Tangible Common Equity ($000s)
6,321
$
Loans / Deposits (%)
83.4%
Date Established
7/29/2002
# of Branches
2
Expanding Pacific Northwest Franchise |
 4
Consideration Mix at Closing
100% cash
Purchase Price Per
Common Share
$5.50
Aggregate Deal Value at Closing
(Common Shareholders)
$3.0 million
Earn-Out/Contingent Consideration
Approximately $1.8 million based
on sale of certain OREO assets
Earn-Out Period
Prior to 12/31/2013
Required Approvals
Customary regulatory approvals and
approval of NCB shareholders
Anticipated Closing
Q4 2012
Due Diligence
Comprehensive due diligence completed, including
preliminary
3
rd
party
fair
value
assessment
EPS Impact
Immediately accretive
(excluding one-time deal costs)
Tangible Book Value
Per Share Impact
Less than 2.00% dilution
Transaction Overview |
 5
Deal Value /
Tangible Book Value*
47%
Preliminary Loan
Fair Value Adjustment
Approximately -8.0%
Potential contingent cash consideration based on proceeds from sale of certain
OREO assets prior to 12/31/2013
HFWA will establish a contingent liability on day-1 for potential
earn-out consideration NCB’s $2.0 million of TARP preferred
securities held by U.S. Treasury will be redeemed prior to closing
* Consideration at closing, exclusive of potential contingent consideration.
Tangible book value as of 6/30/2012
Transaction Pricing & Additional Details |
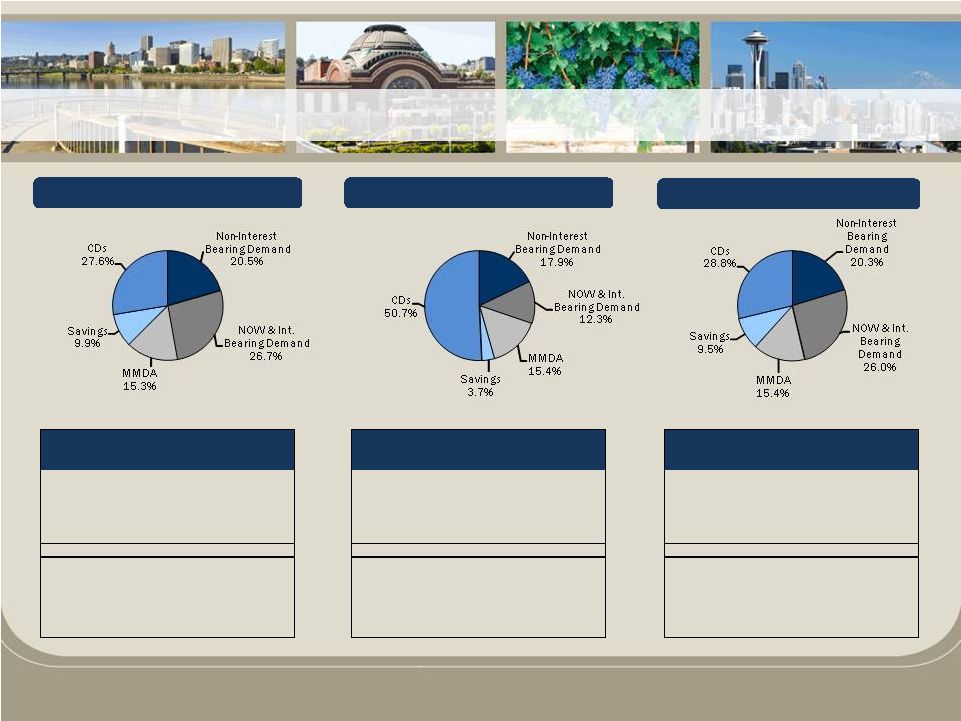 Balance
($000s)
% of
Total
Deposits
Non-Interest Bearing Demand
239,058
$
20.3%
NOW & Int. Bearing Demand
305,594
$
26.0%
MMDA
180,646
$
15.4%
Savings
112,240
$
9.5%
CDs
339,014
$
28.8%
Total Deposits
1,176,552
$
100.0%
Int. Bearing Deposits
937,494
$
79.7%
Non-CDs
837,538
$
71.2%
Cost of Deposits
0.44%
Cost of Interest Bearing Deposits
0.55%
Balance
($000s)
% of
Total
Deposits
Non-Interest Bearing Demand
11,292
$
17.9%
NOW & Int. Bearing Demand
7,848
$
12.3%
MMDA
9,737
$
15.4%
Savings
2,309
$
3.7%
CDs
32,020
$
50.7%
Total Deposits
63,206
$
100.0%
Int. Bearing Deposits
51,914
$
82.1%
Non-CDs
31,186
$
49.3%
Cost of Deposits
0.79%
Cost of Interest Bearing Deposits
0.96%
Balance
($000s)
% of
Total
Deposits
Non-Interest Bearing Demand
227,766
$
20.5%
NOW & Int. Bearing Demand
297,746
$
26.7%
MMDA
170,909
$
15.3%
Savings
109,931
$
9.9%
CDs
306,994
$
27.6%
Total Deposits
1,113,346
$
100.0%
Int. Bearing Deposits
885,580
$
79.5%
Non-CDs
806,352
$
72.4%
Cost of Deposits
0.42%
Cost of Interest Bearing Deposits
0.53%
6
HFWA
NCB
Pro-Forma
Source: HFWA 10-Q and SNL Financial, NCB regulatory call report data, as of
6/30/2012 Note: Pro-Forma does not include purchase accounting or
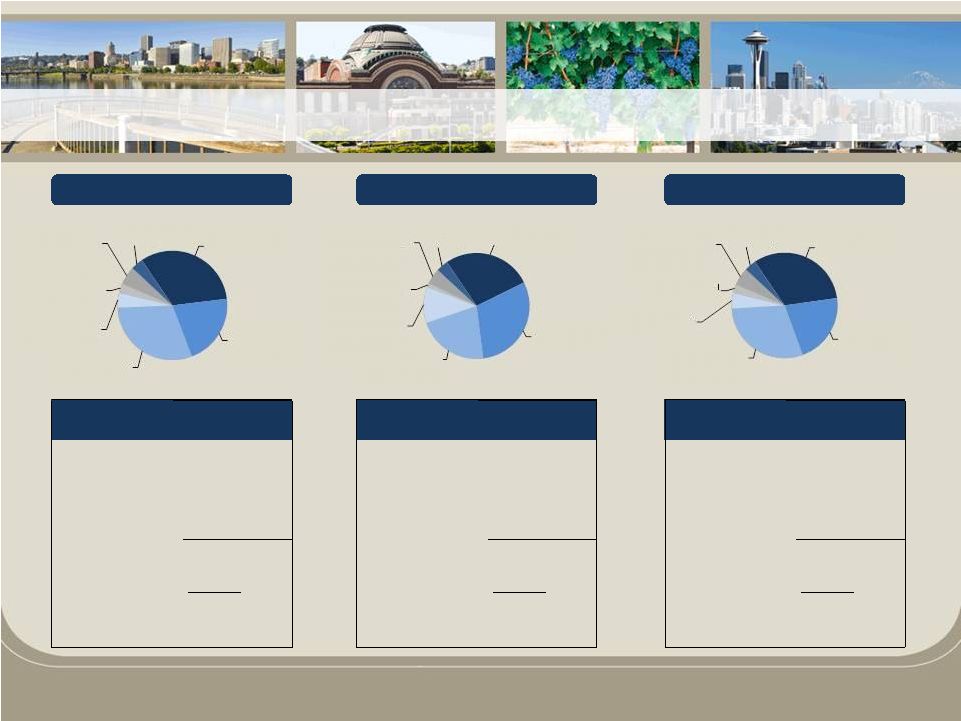
merger related adjustments Pro-Forma Deposit Mix (6/30/2012)
|
 7
HFWA
NCB
Pro-Forma
Source: HFWA 10-Q and SNL Financial, NCB regulatory call report data, as of
6/30/2012 Note: Pro-Forma does not include purchase accounting or
merger related adjustments * Loans acquired in FDIC-assisted
transactions Pro-Forma Loan Mix (6/30/2012)
C & I
32.2%
CRE -
OO
21.7%
CRE -
NOO &
Multi.
29.6%
1-
4 Fam.
4.8%
Constr. (1 -
4)
2.7%
Constr. & Land
(Other)
5.4%
Consumer &
Other
3.6%
C & I
27.1%
CRE -
OO
30.3%
CRE -
NOO &
Multi.
21.8%
1-4 Fam.
11.1%
Constr. (1 -
4)
1.2%
Constr. & Land
(Other)
4.8%
Consumer &
Other
3.7%
C & I
32.5%
CRE -
OO
21.2%
CRE -
NOO &
Multi.
30.1%
1-
4 Fam.
4.4%
Constr. (1 -
4)
2.8%
Constr. & Land
(Other)
5.4%
Consumer &
Other
3.6%
Balance
($000s)
% of
Total
Loans
Commercial & Industrial
278,194
$
32.5%
Owner-Occupied CRE
180,982
$
21.2%
Non-Own. Occ. CRE & Multifam.
257,263
$
30.1%
1 -
4 Family Residential
37,752
$
4.4%
Construction (1 -
4 Family)
24,132
$
2.8%
Construction & Land (Other)
46,457
$
5.4%
Consumer & Other
30,749
$
3.6%
Total Originated Loans
855,529
$
100.0%
Net Deferred Loan Fees
(1,896)
$
Plus: Acquired Loans*
178,270
$
Gross Loans
1,031,903
$
Yield on Loans
6.63%
Gross Loans / Deposits (%)
92.7%
Balance
($000s)
% of
Total
Loans
Commercial & Industrial
14,311
$
27.1%
Owner-Occupied CRE
16,051
$
30.3%
Non-Own. Occ. CRE & Multifam.
11,496
$
21.8%
1 -
4 Family Residential
5,844
$
11.1%
Construction (1 -
4 Family)
649
$
1.2%
Construction & Land (Other)
2,527
$
4.8%
Consumer & Other
1,943
$
3.7%
Total Originated Loans
52,821
$
100.0%
Net Deferred Loan Fees
(124)
$
Plus: Acquired Loans*
-
$
Gross Loans
52,697
$
Yield on Loans
5.94%
Gross Loans / Deposits (%)
83.4%
Balance
($000s)
% of
Total
Loans
Commercial & Industrial
292,505
$
32.2%
Owner-Occupied CRE
197,033
$
21.7%
Non-Own. Occ. CRE & Multifam.
268,759
$
29.6%
1 -
4 Family Residential
43,596
$
4.8%
Construction (1 -
4 Family)
24,781
$
2.7%
Construction & Land (Other)
48,984
$
5.4%
Consumer & Other
32,692
$
3.6%
Total Originated Loans
908,350
$
100.0%
Net Deferred Loan Fees
(2,020)
$
Plus: Acquired Loans*
178,270
$
Gross Loans
1,084,600
$
Yield on Loans
6.59%
Gross Loans / Deposits (%)
92.2% |
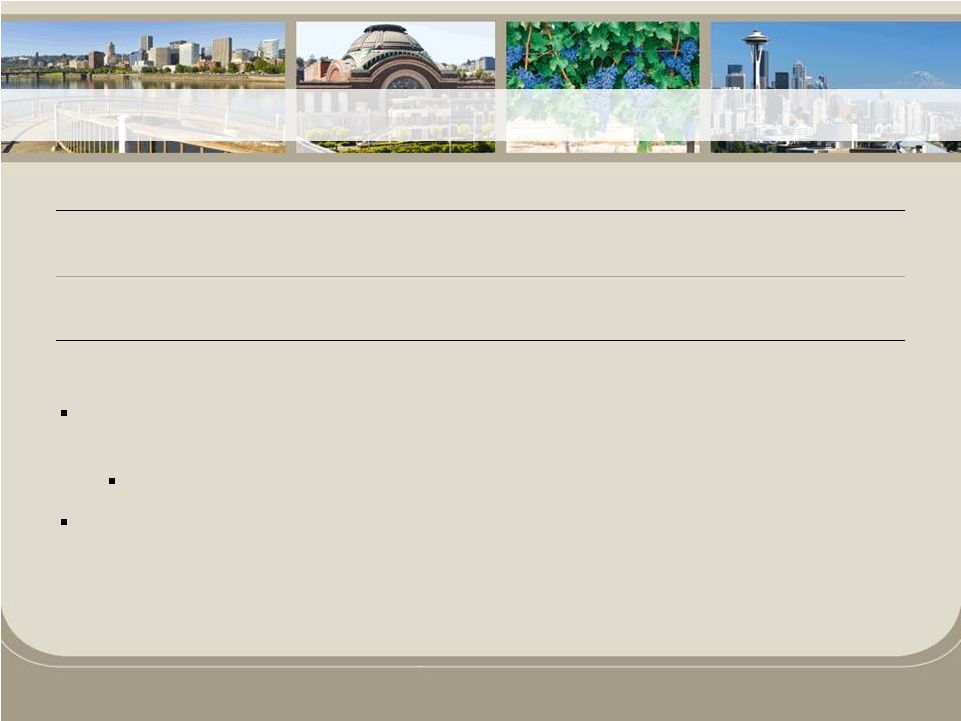
 8
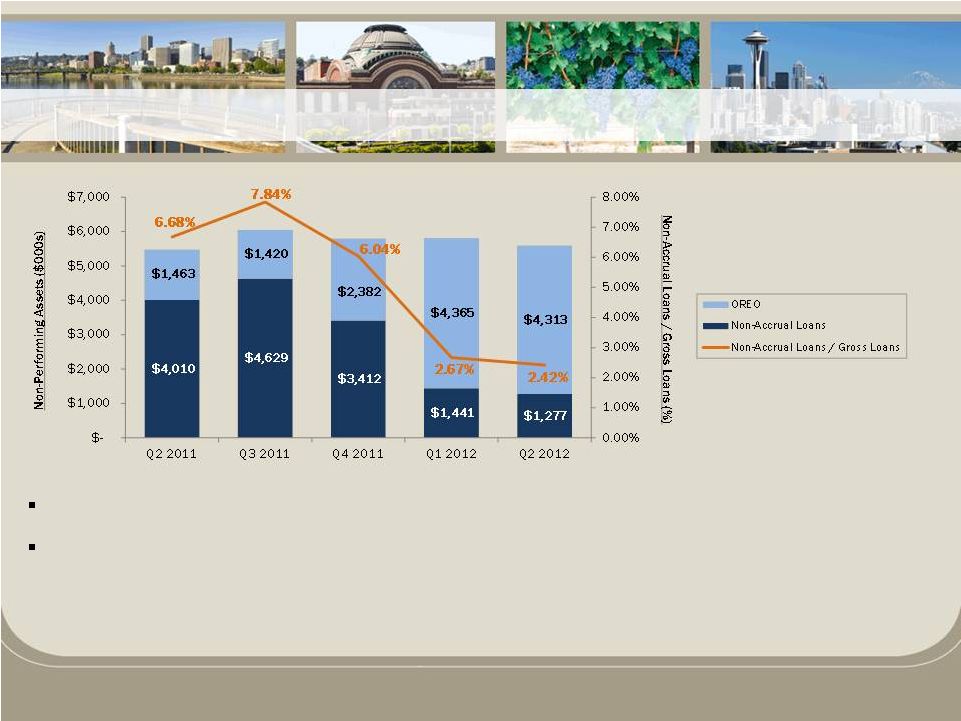
Significant credit resolution over the last twelve months, resulting with
migration to OREO Currently 22.8% of total non-performing assets from
non-accrual loans and 77.2% from OREO Source: SNL Financial, NCB
regulatory call report data Note: Non-performing assets excludes
restructured loans NCB -
Meaningful Credit Progress |
 9
Fits into HFWA’s acquisition strategy to enhance
Pacific Northwest footprint
Financially attractive deal pricing and structure with
conservative modeling assumptions
HFWA tangible common equity to tangible assets
estimated to be 13.2% post closing
HFWA management team will continue to prudently
evaluate future acquisition opportunities
Continue strategy to build one of the premier
banking franchises in the Pacific Northwest
Concluding Thoughts |