Attached files
| file | filename |
|---|---|
| 8-K - FORM 8-K - CYS Investments, Inc. | d411637d8k.htm |
 JMP
Securities Financial Services and Real Estate Conference September 13, 2012
Investment Outlook
September 2012
Exhibit 99.1 |
 Forward
Looking Statements
This presentation contains forward-looking statements, within the meaning of Section 27A
of the Securities Act of 1933, as amended, and Section 21E of the Securities Exchange
Act of 1934, as amended, that are based on management’s beliefs and assumptions, current
expectations, estimates and projections. Such statements, including information relating to
the Company’s expectations for future distributions and market conditions, are not
considered historical facts and are considered forward-looking information under the federal
securities laws. This information may contain words such as “believes,”
“plans,” “expects,” “intends,” “estimates” or similar expressions.
This information is not a guarantee of the Company’s future performance and is subject to
risks, uncertainties and other important factors that could cause the Company’s
actual performance or achievements to differ materially from those expressed or implied by this forward-
looking information and include, without limitation, changes in the Company’s
distribution policy, changes in the Company’s ability to pay distributions,
changes in the market value and yield of our assets, changes in interest rates and the yield curve, net interest margin, return on
equity, availability and terms of financing and hedging and various other risks and
uncertainties related to our business and the economy, some of which are described in
our filings with the SEC. Given these uncertainties, you should not rely on forward-looking information. The
Company undertakes no obligations to update any forward-looking information, whether as a
result of new information, future events or otherwise. |
 CYS: Overview
Agency Residential Mortgage Backed Securities
Financing lines with 34
lenders
Swap agreements with 18 counterparties
Self managed: highly scalable
Kevin Grant, CEO, President, Chairman
Frances Spark, CFO
Company intends to distribute all or substantially all of its REIT
taxable income
2
A Real Estate Investment Trust formed in January 2006
Target Assets
Senior
Management
Focus on Cost
Efficiency
Ample Financing
Sources
Dividend Policy |
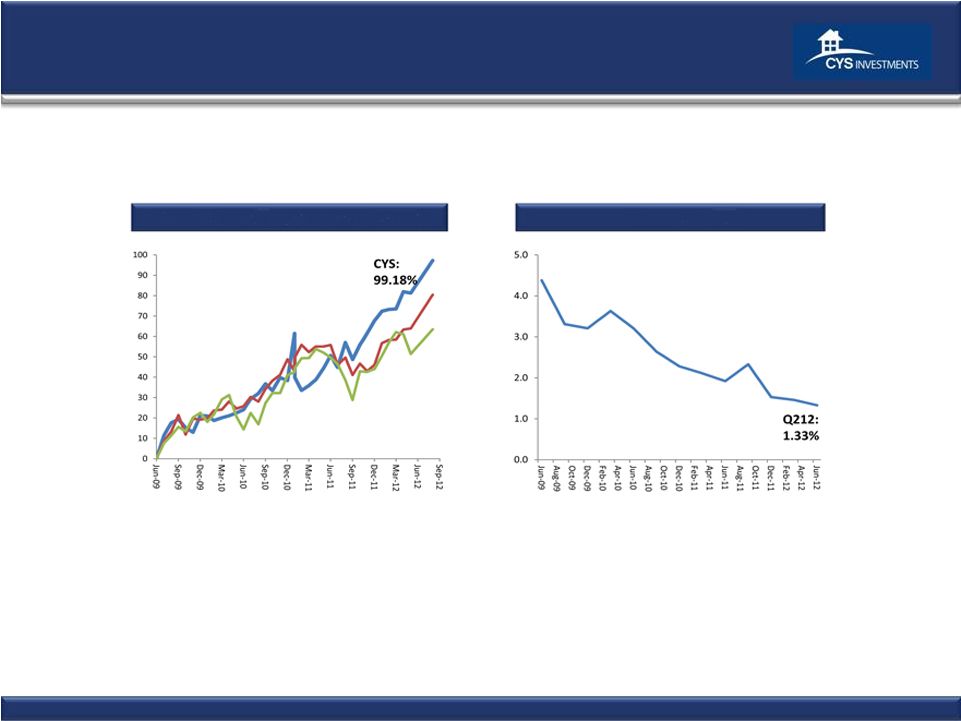 CYS Goal: Deliver
Competitive Total Return through Dividends
CYS
vs.
Bloomberg
REIT
Index,
S&P
500¹
(%)
CYS Expense Ratio²
(%)
3
1
June
11,
2009 —
Sept
7,
2012
2
June
11,
2009 —
June 30, 2012
Source: Company filings, Bloomberg |
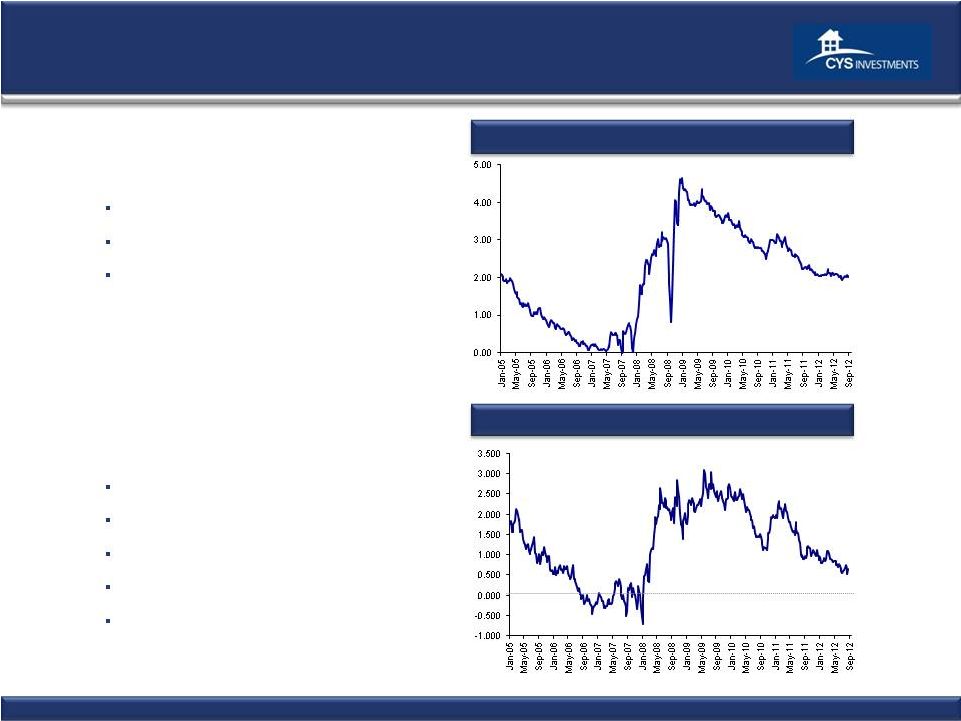 Spread
Environment Becoming More Challenging, However, Hedging Rates Remain Historically
Low Mortgage Yields at All Time Lows
Par-Priced
7/1
hybrid
rates
now
1.38%
(1)
30
Year
fixed
rates
now
2.60%
(1)
15 Year fixed rates now 2.16%
(1)
5 Year Swap vs. 1 Month LIBOR: 1/2005 –
9/2012
5/1 Hybrid Net Interest Margin: 1/2005 –
9/2012
Source; Bloomberg
(1) September 7, 2012
September 7, 2012
September 7, 2012
4
Steep Curve
Creates positive carry
Very low cost of financing
Good ROE
Hedge flexibility very important
Fed still fighting deflation |
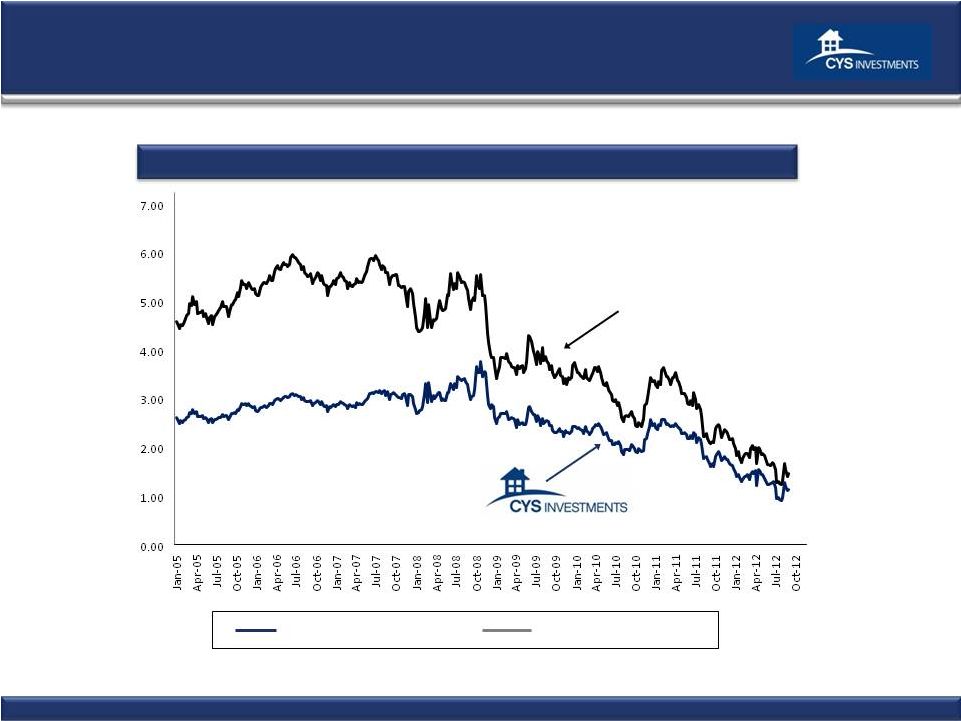 Investment
Environment 15 Year Hedged
(i)
15 Year Unhedged
(ii)
Borrow Short
Invest Long
September 7, 2012
Source: Bloomberg.
Note: Spreads calculated as: (i) 15 year Current
Coupon Index = 50% 4 year swap, and (ii) 15 year Current Coupon Index 5
15
Year
Fixed
Hedged
with
Swaps:
1/1/2005
–
9/07/2012 |
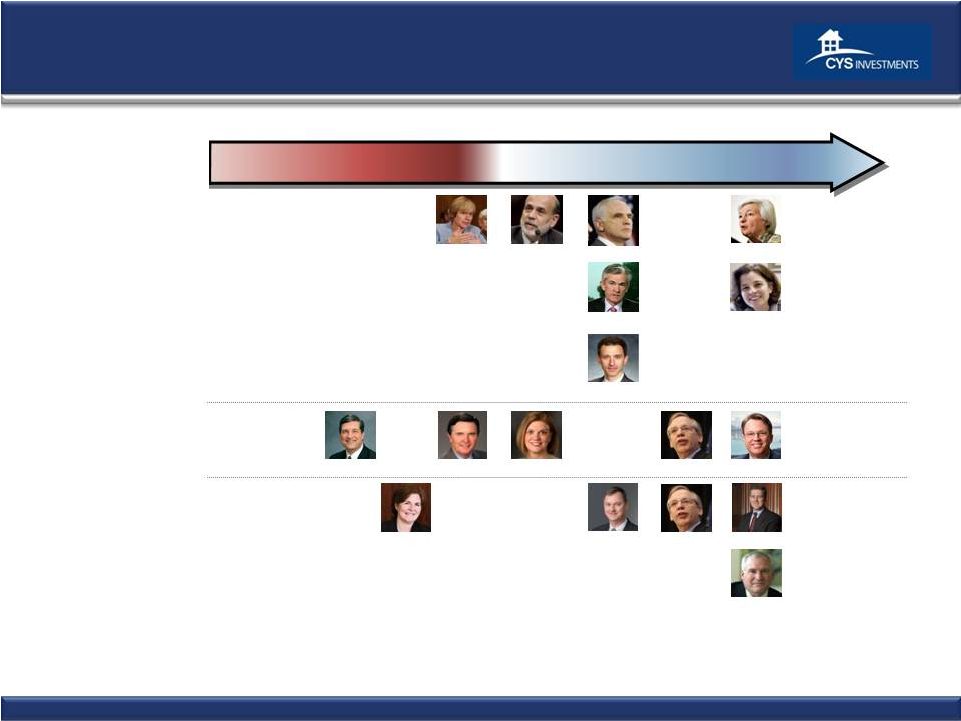 Fed Voters More
Dovish Hawkish
Dovish
Neutral
Lacker
Duke
Tarullo
Lockhart
Pianalto
Yellen
Raskin
Bernanke
Governors
2012 Voters
Williams
2013 Voters
Dudley
Evans
Rosengren
Bullard
Powell
Stein
Dudley
George
6
Source: federalreserve.gov, Macroeconomic Advisers, LLC, Bank of America Merrill Lynch,
Bloomberg, Wall Street Journal, Indiana University, Marketwatch, Thomson Reuters, Federal Reserve Bank
of Atlanta, Federal Reserve Bank of Chicago, Federal Reserve Bank of Cleveland, Maryland
Consumer Rights Coalition, Boston Globe, Businessweek, Newsweek, Washington Post, CNBC. |
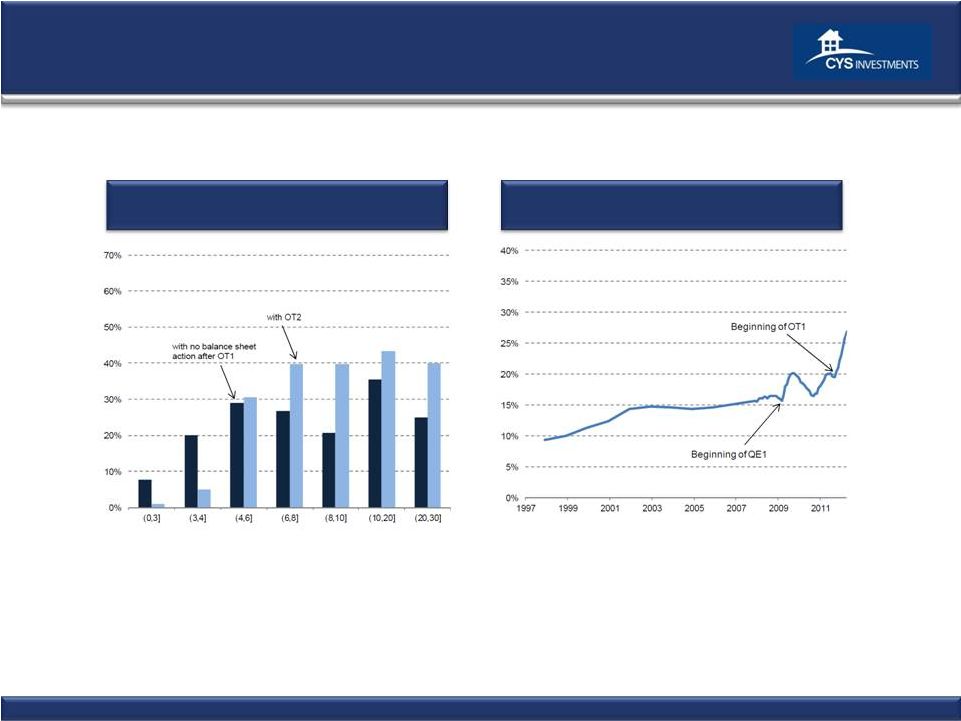 The Fed’s
Tools: Forward Rate Guidance; OT2; QE3 Fed Ownership Shares of Nominal Notes
and Bonds in March 2013 with and without OT2
•
With no operations after OT1, the Fed would own nearly 30% of the 10+ sector.
•
With OT2, that share would increase to over 40%.
Fed Ownership of Treasuries Outstanding
Maturing in Over Ten Years
Source: Macroeconomic Advisers, U.S. Treasury, Federal Reserve. Updated May 24, 2012.
7 |
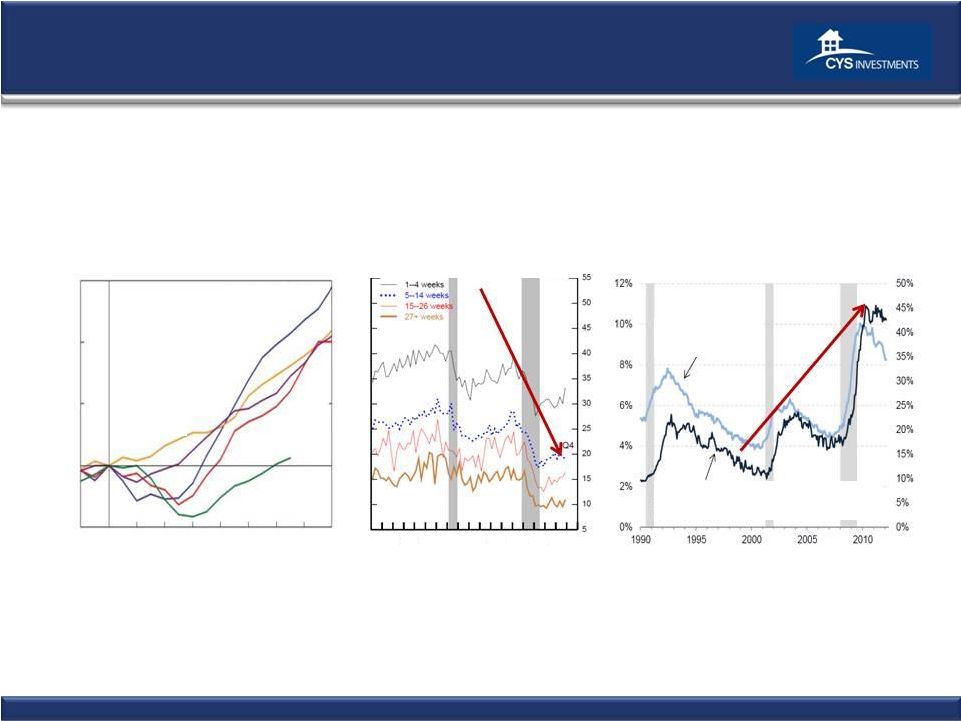 Will the Fed
Rationalize High Unemployment? hys•ter•e•sis
(his/t
re/sis),
n.
Economics.
1.
a
process
whereby
a
high
unemployment
rate
during
and
after
recessions raises the long run equilibrium or structural unemployment rate, otherwise known
as non- accelerating inflation rate of unemployment (NAIRU).
Probability of Reemployment by
Duration of Unemployment, 1995-2012
In %
Longer Duration
Unemployment, 1990-2012
In %
Unemployment
Rate (Left Axis)
Unemployed for 27 Weeks over % of
Unemployed (Right Axis)
0.95
1.00
1.05
1.10
1.15
-2
0
2
4
6
8
10
12
1981-82 Cycle
1990-1991 Cycle
2001 Cycle
1973-75
Cycle
Current Cycle
14
16
Real GDP Growth in Recoveries
(series set to 1.00 at NBER peak)
1995
1999
2003
2007
2011
Note: Shaded bars indicate business recession, as defined by National Bureau of Economic
Research 8
Source: BEA, Recent Developments in the Labor Market: Remarks by Ben S. Bernanke to the
National Association of Business Economists, March 26, 2012, Macroeconomic Advisors,
U.S. Department of Labor, BLS, Haver Analytics |
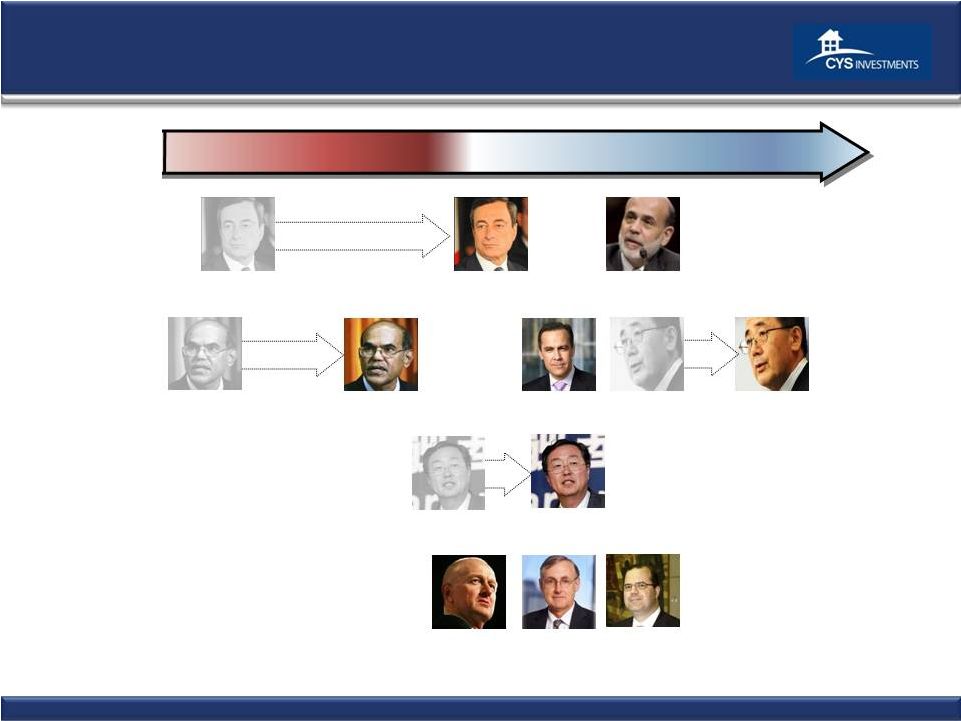 Central Banks
Globally Decidedly More Accommodative Xiaochuan
China
Bernanke
USA
Shirakawa
Japan
Canada
Carney
Australia
Stevens
New Zealand
Bollard
Draghi
EU
Tombini
Brazil
Subbarao
India
Central Banks are Focused on Global Deflation Risk
Hawkish
Dovish
Neutral
Draghi
EU
Shirakawa
Japan
Subbarao
India
Xiaochuan
China
9 |
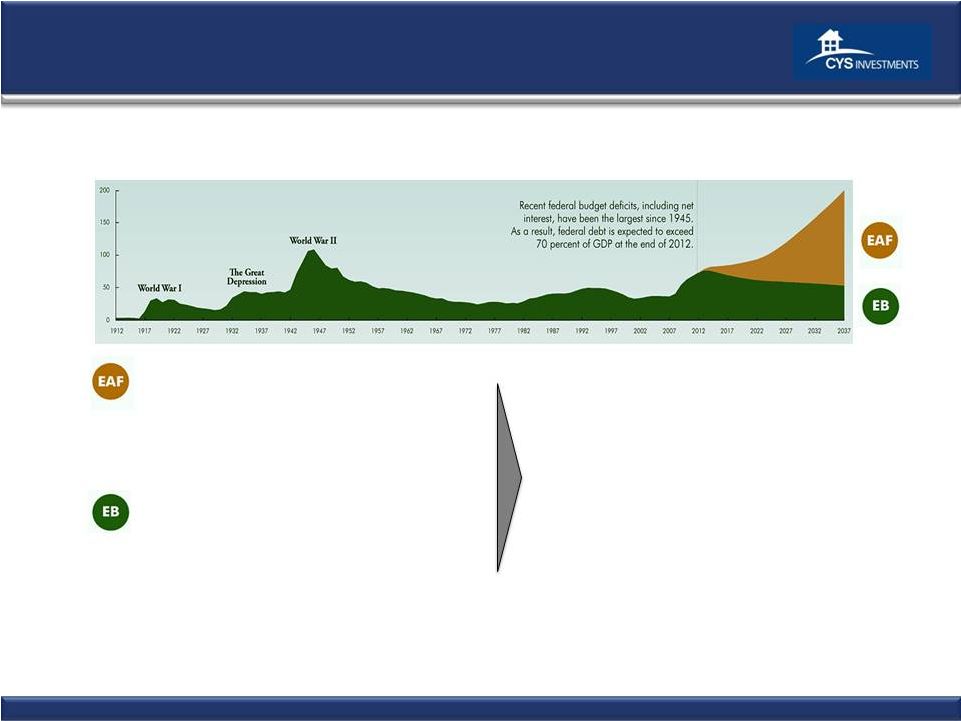 Long Term
Budget Outlook vs. The Fiscal Cliff Publically Held Federal Debt,
Historically and Projected under Two Policy Scenarios
In % by year
Extended Alternative Fiscal Scenario
Extended Baseline Scenario
-
Maintains current policies
-
Extends expiring Tax Cuts and other forms of Tax Relief
-
Prevents automatic spending reductions and spending
restraints
-
Current laws remain unchanged
-
Scheduled Tax Increases and Spending Cuts occur
Revenues remain near historical average
Gap between non interest spending and revenues
widens
Noninterest spending continues to rise, but is
pushed up due to population aging, rising
healthcare costs
Source: Congressional Budget Office, June 2012
10 |
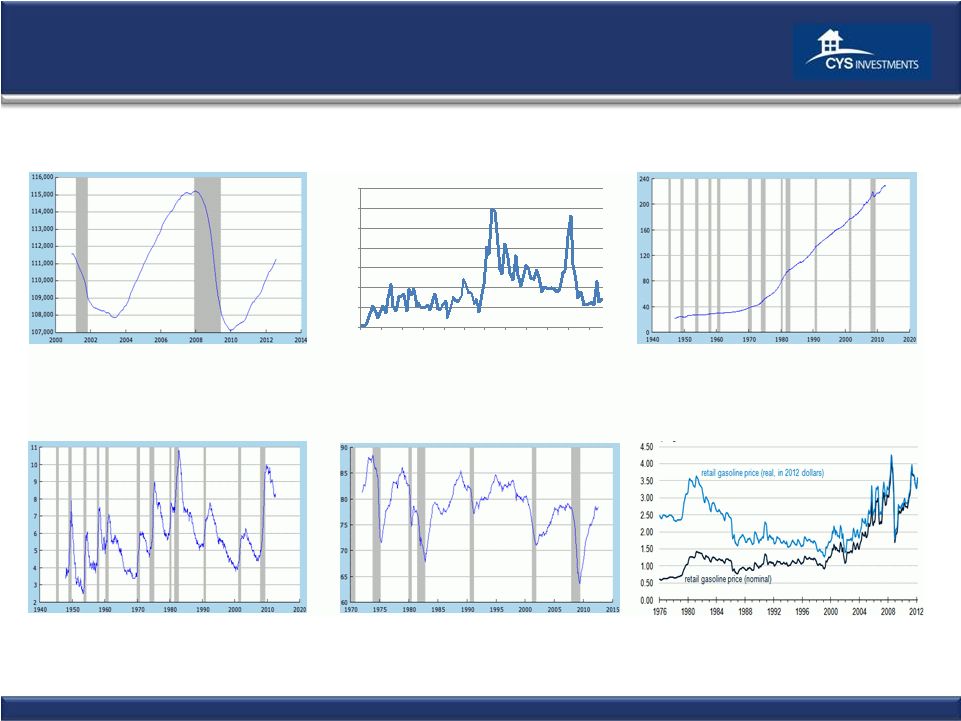 Economic
Recovery Below Normal Pace U.S. Retail Gasoline Price, Regular Grade
1976 –
Present
Capacity Utilization: Manufacturing
1970 –
Present
%
Civilian Unemployment Rate
1940 -
present
%
CPI-U All Items, Core
1940 –
Present
%
Change
-
Year
to
Year
Total Nonfarm Private Payroll Employment
2000-present
000’s
Challenger, Gray & Christmas, Inc.
Job Cut Announcement Report
1/2007 –
6/2012, by Quarter
Source: S&P, Federal Reserve Bank of St. Louis, Fiserv, and Macromarkets LLC / Haver
Analytics, BLS, Challenger, Gray & Christmas, US Dept. of Energy, NYMEX
11
0
100,000
200,000
300,000
400,000
500,000
600,000
700,000
Q1 89
Q1 91
Q1 93
Q1 95
Q1 97Q1 99
Q1 01
Q1 03
Q1 05
Q1 07
Q1 09
Q1 11 |
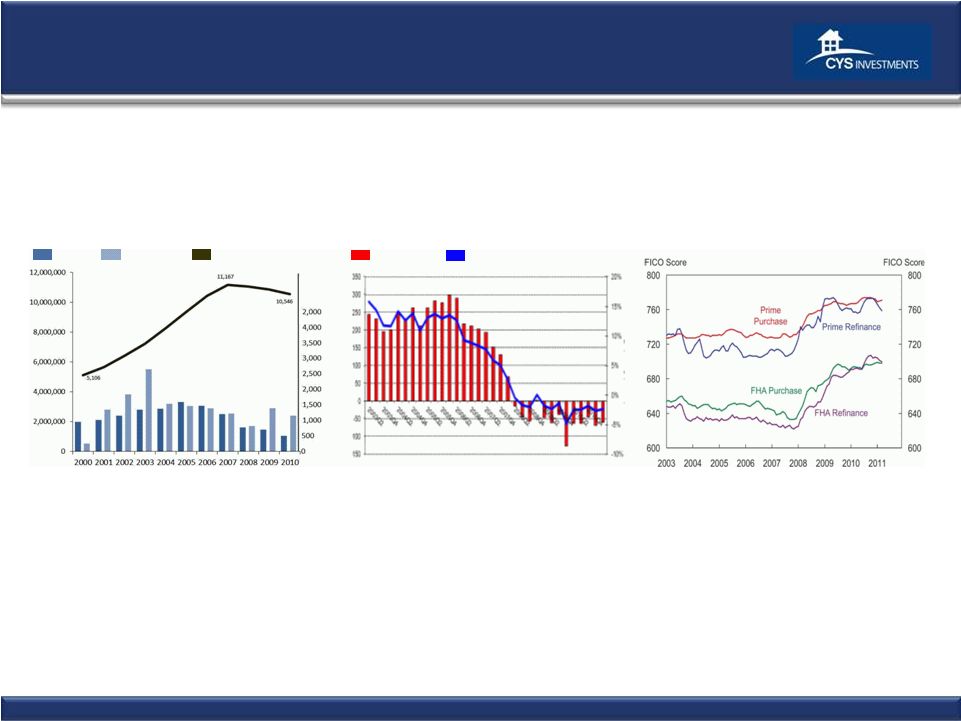 Mortgage Market
Shrinkage Likely to Continue Residential Mortgage Debt Decline Driven By:
1.
Declining home prices
2.
Delevering Consumers/Homeowners
3.
Psychology of lower leverage
4.
Low volume of new and existing home sales
5.
All-cash home purchase transactions, and higher downpayments
6.
Scheduled principal payments
7.
High percentage of cash-in refis versus cash-out refis.
Quarterly Growth in
Residential Mortgage
Debt
Q2 2003 –
Q4 2010
Growth
Home Mortgage
Originations
2000 -
2010
In billions
Refinance
Purchase
Home Mortgage Debt
Outstanding
2000 -
2010
In millions
Total Home Mortgage Debt
Median Credit Score at
Mortgage Origination
2003-2012
Source: BLS, LPS Applied Analytics, Financial Stability Oversight Council 2011 Annual
Report 12
Net Issuance |
 Iowa Electronic
Futures Market: Obama re-elected and a Republican Congress
Source: The Iowa Electronic Markets
Romney
Obama
Republican House/
Democrat Senate
Democrat House/
Democrat Senate
Democrat House/
Republican Senate
Republican House/
Republican Senate
2012 US Presidential Election Winner Takes All Market
As of September 6
2012 Congressional Control Winner-Takes-All Market
As of September 6
13 |
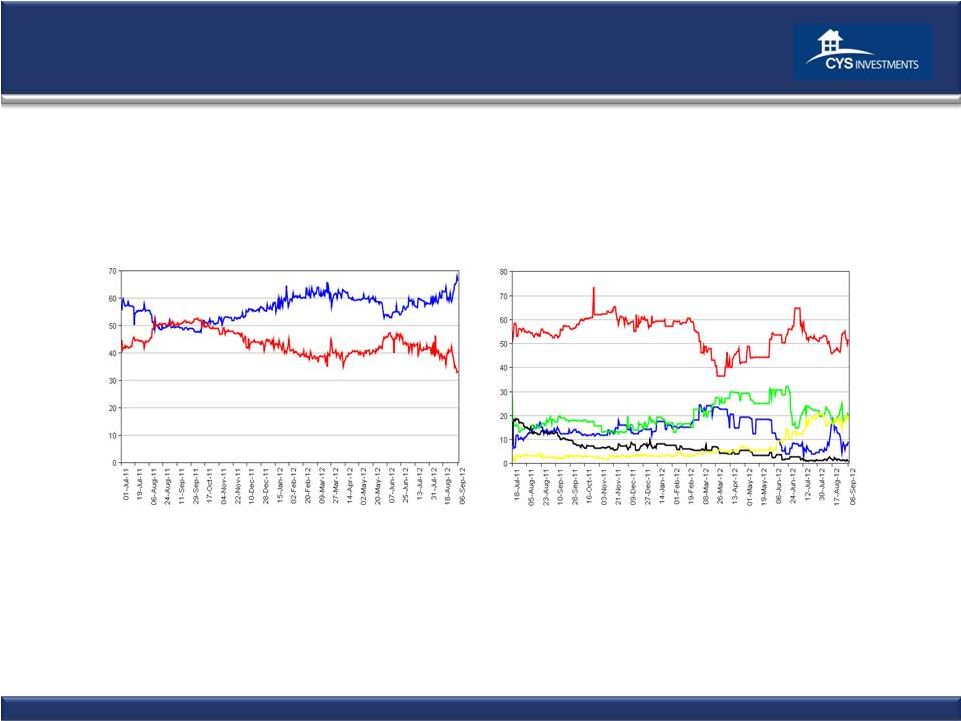
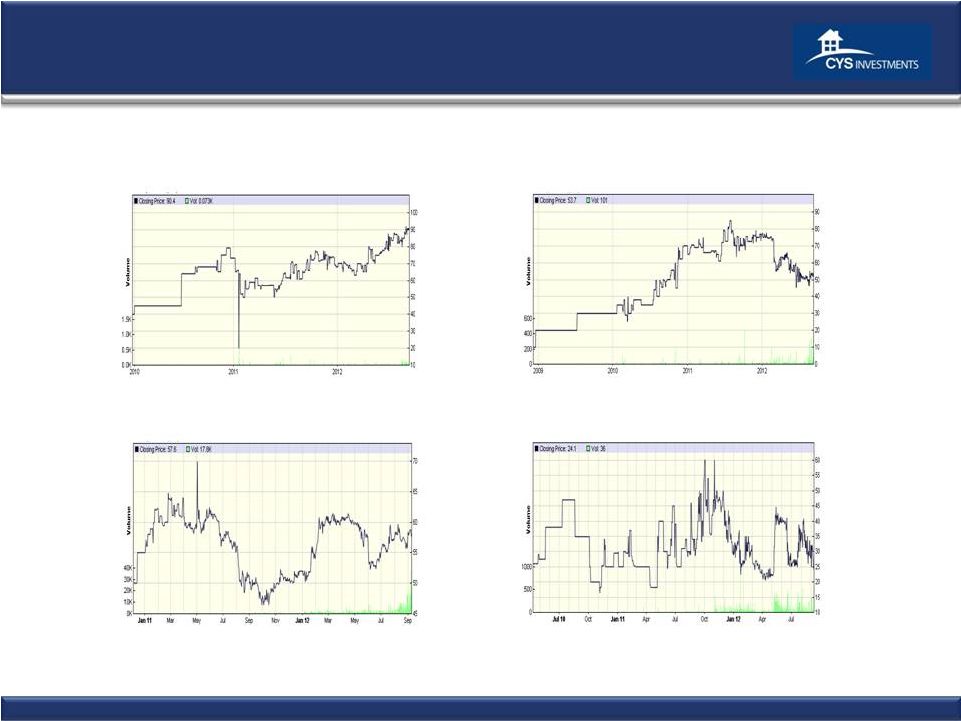 Intrade:
Obama re-elected and a Republican Congress
US
House
of
Representatives
–
Republican
Control
Nov 13, 2008 –
Sep 9, 2012
Source: www.intrade.com
US Senate –
Republican Control
Dec 8, 2008 –
Sep 9, 2012
Obama Re-election
Dec 6, 2008 –
Sep 9, 2012
57.6%
90.4%
53.7%
24.1%
14
A European Country Leaves the Eurozone before 31 Dec
2012 |
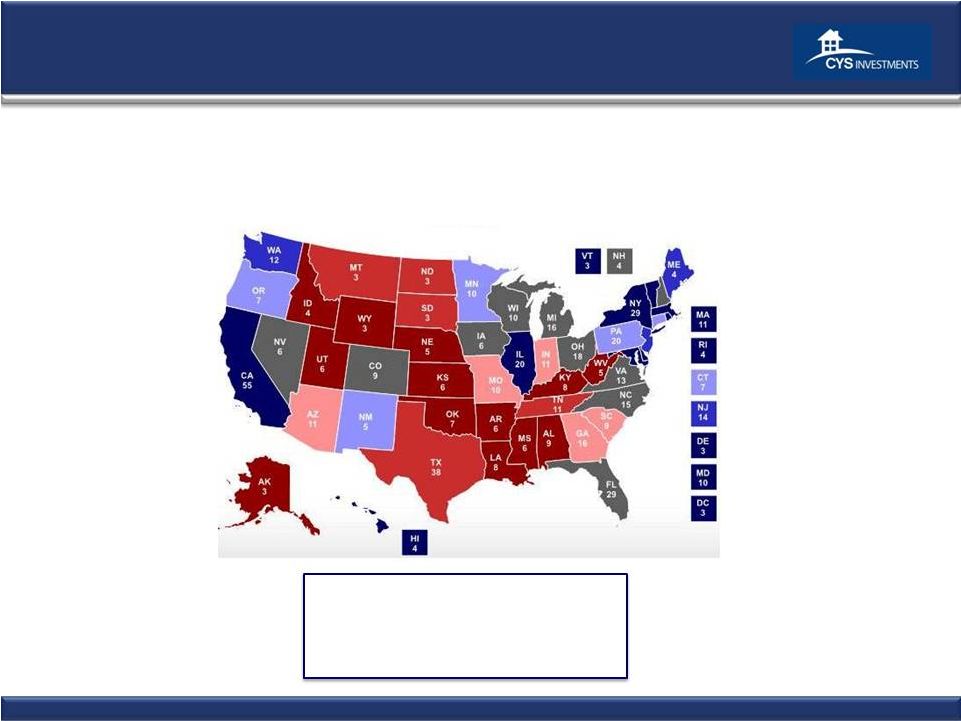 Electoral
Mapping Connecticut (7)
Minnesota (10)
New Mexico (5)
Oregon (7)
Pennsylvania
(20)
Leans Obama:
49
Arizona (11)
Georgia (16)
Indiana (11)
Missouri (10)
South Carolina (9)
Leans Romney:
57
Colorado (9)
Florida (29)
Iowa (6)
Nevada (6)
Michigan (16)
New Hampshire (4)
North Carolina (15)
Ohio (18)
Virginia (13)
Wisconsin (10)
Maine (4)
New Jersey (14)
Washington (12)
Likely Obama:
30
221
191
Toss Up: 126
Source: realclearpolitics.com
9/7/12
Solid Obama:
142
California (55)
District of Columbia
(3)
Illinois (20)
Massachusetts (11)
Rhode Island (4)
Delaware (3)
Hawaii (4)
Maryland (10)
New York (29)
Vermont (3)
Likely Romney:
58
Montana (3)
North Dakota (3)
South Dakota (3)
Tennessee (11)
Texas (38)
Solid Romney:
76
Alabama (9)
Alaska (3)
Arkansas (6)
Idaho (4)
Kansas (6)
Kentucky (8)
Louisiana (8)
Mississippi (6)
Nebraska (5)
Oklahoma (7)
Utah (6)
West Virginia (5)
Wyoming (3)
15 |
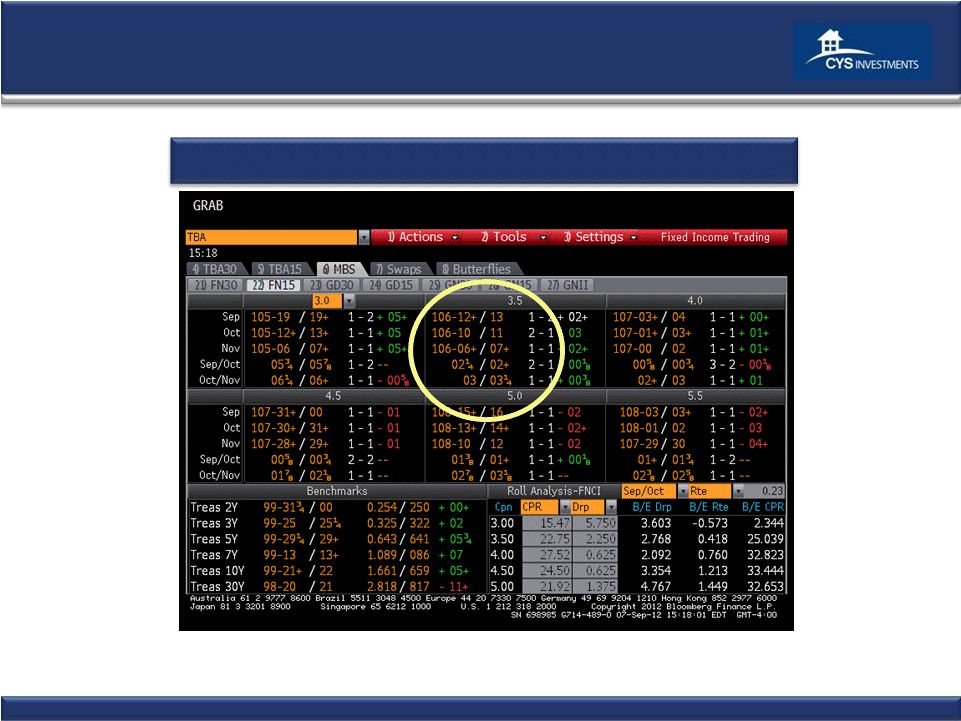 Economics of
Forward Purchase 16
Example: 15 yr. 2
1/4
% drop = ~3/32 pt. per month
1
Source: Bloomberg
09/07/12
3/32 represents a discount to the purchase price of the security of approximately $0.30 per
month from trade date to settlement date.
1 |
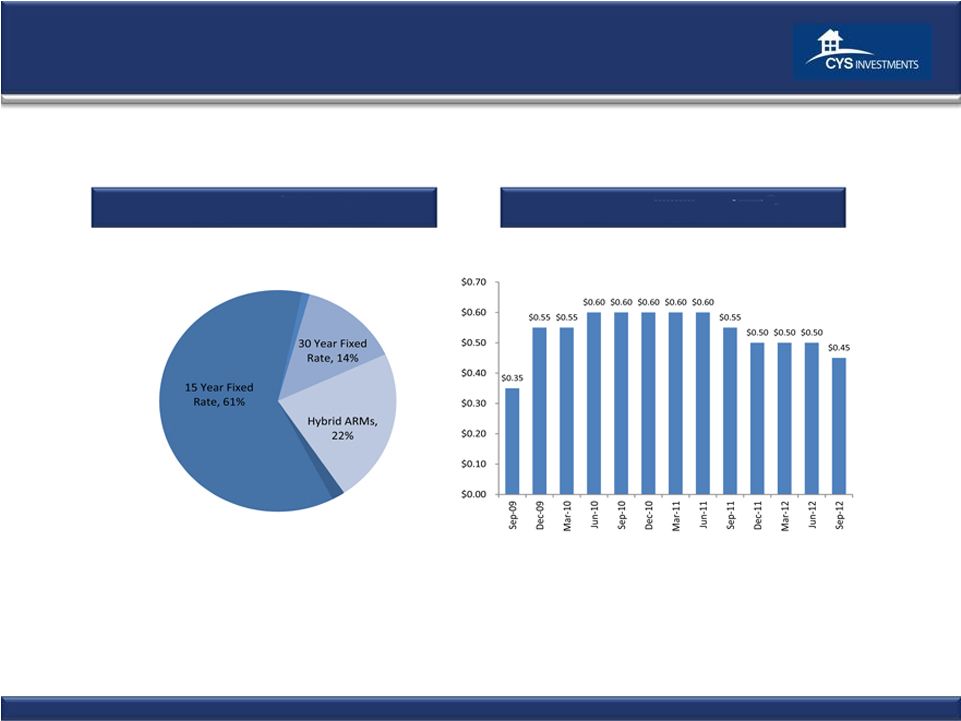 Portfolio
Composition and Results CYS Agency RMBS Portfolio
1
CYS Common Stock Dividends
2
: 9/09 –
9/12
Total Agency RMBS: $14,078.1
million
20 Year Fixed
Rate, 1%
10 Year Fixed
Rate, 2%
1
As of 6/30/12
2
On
August
3,
2012,
the
Company
issued
shares
of
7.75%
Series
A
Preferred
Stock,
for
which
dividends
are
paid
quarterly
at
a
rate
of
$1.9375
per
annum
per
share.
17 |
 Portfolio
Characteristics * As of 6/30/12
Par Value
Fair Value
Weighted Average
Asset Type
(in thousands)
Cost/Par
Fair
Value/Par
MTR
(1)
Coupon
CPR
(2)
10 Year Fixed Rate
$239,966
$253,746
$103.79
$105.74
N/A
3.50%
15.70%
15 Year Fixed Rate
8,130,084
8,575,298
103.34
105.48
N/A
3.38%
14.40%
20 Year Fixed Rate
138,700
149,688
103.14
107.92
N/A
4.50%
21.10%
30 Year Fixed Rate
1,832,303
1,937,542
105.43
105.74
N/A
3.87%
—%
Hybrid ARMs
3,015,667
3,161,861
102.63
104.85
67.4
3.09%
18.60%
Total/Weighted
Average
$13,356,720
$14,078,135
$103.47
$105.40
67.4
(3)
3.40%
15.80%
18
CYS Agency RMBS Portfolio Characteristics*
(1) MTR, or “Months to Reset,” is the number of months remaining before the fixed
rate on a hybrid ARM becomes a variable rate. At the end of the fixed period, the variable rate will be determined
by the margin and the pre-specified caps of the ARM. After the fixed period, the interest
rates on 100% of our hybrid ARMs reset annually.
(2) CPR, or “Constant Prepayment Rate,” is a method of expressing the prepayment
rate for a mortgage pool that assumes that a constant fraction of the remaining principal is prepaid each month or
year. Specifically, the CPR is an annualized version of the prior three month prepayment
rate. Securities with no prepayment history are excluded from this calculation.
(3) Weighted average months to reset of our hybrid ARM portfolio.
|
 History of
Transparent and Consistent Financial Reporting CYS uses Financial Reporting for
Investment Companies CYS
Financial
Reporting
-
Best
in
Class
Schedule of investments
NAVs have reflected mark-to-market accounting since inception
No OCI account on balance sheet
Realized and unrealized losses taken through income statement
Losses expensed in period incurred
19 |
 Historical
Financials (1) Core Earnings is defined as net income (loss) excluding net gain (loss)
on investments, net realized gain (loss) on termination of swap contracts and unrealized appreciation (depreciation)
on swap and cap contracts.
(2) Our average yield on Agency RMBS for the period was calculated by dividing our interest
income from Agency RMBS by our average Agency RMBS. (3) Our average cost of funds and
hedge for the period was calculated by dividing our total interest expense, including our net swap and cap interest income (expense), by our average repurchase agreements.
(4) Our interest rate spread net of hedge for the period was calculated by subtracting our
average cost of funds and hedge from our average yield on Agency RMBS. (5) Our operating
expense ratio is calculated by dividing operating expenses by average net assets. (6)
Our leverage ratio was calculated by dividing (i) the Company’s repurchase agreements balance plus payable for securities purchased minus receivable for securities sold by (ii) net assets.
* All percentages are annualized.
20
Three Months Ended
6/30/2012
3/31/2012
Income Statement Data
(in
000's)
Investment Income –
Interest Income
$71,747
$65,369
Total expenses
14,272
11,972
Net Investment Income
57,475
53,397
Net gain (loss) from investments
61,113
33,150
Net gain (loss) from swap and cap contracts
(24,356)
(17,429)
Net Income
$101,705
$69,118
Net Income Per Common Share (diluted)
$0.87
$0.66
Distributions per Common Share
$0.50
$0.50
Non-GAAP Measure
(in
000's)
Core Earnings
(1)
$44,788
$41,891
Non-GAAP Reconciliation
(in
000's)
NET INCOME
$101,705
$69,118
Net (gain) loss from investments
(68,586)
(33,150)
Net (gain) loss on termination of swap contracts
--
--
Net unrealized (appreciation) depreciation on swap and cap
contracts
11,669
5,923
Core Earnings
$ 44,788
$ 41,891
Core Earnings per Common Share (diluted)
$
0.38
$
0.39 Three Months Ended
6/30/2012
3/31/2012
Key Portfolio Statistics*
Average yield on Agency RMBS
(2)
2.62%
2.78%
Average cost of funds and hedge
(3)
0.91%
0.90%
Interest rate spread net of hedge
(4)
1.71%
1.88%
Operating expense ratio
(5)
1.33%
1.46%
Leverage ratio (at period end)
(6)
7.6:1
7.7:1
As of
Balance Sheet Data
(in
000's)
6/30/2012
3/31/2012
Cash and Cash Equivalents
$13,486
$10,643
Total Assets
$14,623,128
$13,555,905
Repurchase Agreements
$9,763,313
$8,234,669
Net assets
$1,629,854
$1,525,792
Net assets per common share
$13.52
$13.14 |
 Financial
Highlights Steep yield curve and attractive spreads in target assets
Tailwinds likely to continue
Fed Transparency very helpful
Investment Company accounting provides transparency
21 |
 Investment
Outlook September 2012
JMP Securities Financial Services and Real Estate Conference
September 13, 2012 |