Attached files
| file | filename |
|---|---|
| EX-32.2 - EXHIBIT 32.2 - Tri-Tech Holding, Inc. | v320488_ex32-2.htm |
| EX-32.1 - EXHIBIT 32.1 - Tri-Tech Holding, Inc. | v320488_ex32-1.htm |
| EX-31.1 - EXHIBIT 31.1 - Tri-Tech Holding, Inc. | v320488_ex31-1.htm |
| EX-31.2 - EXHIBIT 31.2 - Tri-Tech Holding, Inc. | v320488_ex31-2.htm |
U. S. SECURITIES AND EXCHANGE COMMISSION
WASHINGTON, DC 20549
FORM 10-Q
| x | Quarterly report pursuant to Section 13 or 15(d) of the Securities Exchange Act of 1934 |
For the quarterly period ended June 30, 2012
| ¨ | Transition report pursuant to Section 13 or 15(d) of the Securities Exchange Act of 1934 |
For the transition period from ___________ to ___________.
Commission File Number 001-34427
Tri-Tech Holding Inc.
(Exact name of registrant as specified in its charter)
| Cayman Islands | Not Applicable | |
| (State or other jurisdiction of | (I.R.S. employer | |
| incorporation or organization) | identification number) |
16th Floor of Tower B, Renji Plaza
101 Jingshun Road, Chaoyang District
Beijing 100102 China
(Address of principal executive offices and zip code)
+86 (10) 5732-3666
(Registrant’s telephone number, including area code)
Indicate by check mark whether the registrant (1) has filed all reports required to be filed by Section 13 or 15(d) of the Securities Exchange Act of 1934 during the preceding 12 months (or for such shorter period that the registrant was required to file such reports) and (2) has been subject to such filing requirements for the past 90 days. Yes x No ¨
Indicate by check mark whether the registrant has submitted electronically and posted on its corporate Web site, if any, every Interactive Data File required to be submitted and posted pursuant to Rule 405 of Regulation S-T (§232.405 of this chapter) during the preceding 12 months (or for such shorter period that the registrant was required to submit and post such files). Yes x No ¨
Indicate by check mark whether the registrant is a large accelerated filer, an accelerated filer, a non-accelerated filer, or a smaller reporting company.
| Large accelerated filer | ¨ | Accelerated filer | ¨ | ||
| Non-accelerated filer (Do not check if a smaller reporting company) | ¨ | Smaller reporting company | x |
Indicate by check mark whether the registrant is a shell company (as defined in Rule 12b-2 of the Exchange Act). Yes ¨ No x
Indicate the number of shares outstanding of each of the issuer’s classes of common stock, as of the latest practicable date.
The Company is authorized to issue 30,000,000 ordinary shares, $0.001 par value per share. As of August 14, the Company has 8,218,406 ordinary shares outstanding, excluding 21,100 treasury shares.
TRI-TECH HOLDING INC.
FORM 10-Q
INDEX
| SPECIAL NOTE REGARDING FORWARD-LOOKING STATEMENTS | ii | ||
| PART I. | FINANCIAL INFORMATION | I-1 | |
| Item 1. | Financial Statements | I-1 | |
| Item 2. | Management’s Discussion and Analysis of Financial Condition and Results of Operations | I-1 | |
| Item 3. | Quantitative and Qualitative Disclosures about Market Risk | I-20 | |
| Item 4. | Controls and Procedures | I-20 | |
| PART II. | OTHER INFORMATION | II-1 | |
| Item 1. | Legal Proceedings | II-1 | |
| Item 1A. | Risk Factors | II-1 | |
| Item 2. | Unregistered Sales of Equity Securities and Use of Proceeds | II-1 | |
| Item 3. | Defaults Upon Senior Securities | II-1 | |
| Item 4. | Mine Safety Disclosures | II-1 | |
| Item 5. | Other Information | II-1 | |
| Item 6. | Exhibits | II-1 | |
| FINANCIAL STATEMENTS | F-1 | ||
SPECIAL NOTE REGARDING FORWARD-LOOKING STATEMENTS
This document contains certain statements of a forward-looking nature. Such forward-looking statements, including but not limited to projected growth, trends and strategies, future operating and financial results, financial expectations and current business indicators are based upon current information and expectations and are subject to change based on factors beyond the control of the Company. Forward-looking statements typically are identified by the use of terms such as “look,” “may,” “should,” “might,” “believe,” “plan,” “expect,” “anticipate,” “estimate” and similar words, although some forward-looking statements are expressed differently. The accuracy of such statements may be impacted by a number of business risks and uncertainties that could cause actual results to differ materially from those projected or anticipated, including but not limited to the following:
| • | the timing of the development of future products; |
| • | projections of revenue, earnings, capital structure and other financial items; |
| • | statements of the Company’s plans and objectives; |
| • | statements regarding the capabilities of its business operations; |
| • | statements of expected future economic performance; |
| • | statements regarding competition in its market; and |
| • | assumptions underlying statements regarding the Company or its business. |
Readers are cautioned not to place undue reliance on these forward-looking statements, which speak only as of the date hereof. The Company undertakes no obligation to update this forward-looking information. Nonetheless, the Company reserves the right to make such updates from time to time by press release, periodic report or other method of public disclosure without the need for specific reference to this Report. No such update shall be deemed to indicate that other statements not addressed by such update remain correct or create an obligation to provide any other updates.
| ii |
PART I. FINANCIAL INFORMATION
| Item 1. | Financial Statements |
See the financial statements following the signature page of this report, which are incorporated herein by reference.
| Item 2. | Management’s Discussion and Analysis of Financial Condition and Results of Operations |
The following discussion contains, in addition to historical information, forward-looking statements that involve risks and uncertainties. The actual results could differ materially from those described herein.
Company Overview
Tri-Tech Holding Inc. (the “Company” or “we”) is a leading provider of integrated solutions, products and technologies to water resource management and environmental protection industries. The Company has successfully implemented projects in both Chinese and overseas markets such as India, the Middle East and North America.
The Company aims to provide tailored solutions to complex environmental challenges faced by both public and private sectors in China and beyond. Its clientele consists of a combination of government agencies, municipalities, and industrial entities located in China, India, the Middle East and North America. To maintain a leading position in its domestic market, the Company’s strategy is to reinforce customer recognition and to offer diversified proprietary products to exceed the expectations of its expanding client base. Internationally, the Company also continues to further its geographic reach in India, the Middle East and North America in the water and wastewater treatment industry. To implement the three engineering-procurement-construction contracts in India and to develop market further, the Company made a capital injection in the amount of Indian National Rupee (“INR”) 1,917,000 (or $35,273), in Tri-Tech Infrastructure (India) Pvt., Ltd (“TII”) on May 19, 2012. As a result of the capital injection, the Company increased its equity ownership in TII to 76% and became the controlling shareholder. The Company’s total investment in TII amounts to INR 2,217,000, or $55,886. The amount consists of two parts: the initial investment of INR 300,000 on October 19, 2011, which was adjusted to $20,613 due to TII’s earnings from the beginning of TII’s operation through May 19, 2012; and the investment of INR 1,917,000, or $35,273, on May 19, 2012.
The Company’s principal executive offices are located at the 16th Floor of Tower B, Renji Plaza, 101 Jingshun Road, Chaoyang District, Beijing 100102 China. The telephone number at this address is +86 (10) 5732-3666. Its ordinary shares are traded on the NASDAQ Capital Market under the symbol “TRIT.” The Company’s website, www.tri-tech.cn, provides a variety of information. Its annual reports on Form 10-K, quarterly reports on Form 10-Q and current reports on Form 8-K filed with the United States Securities and Exchange Commission (the “SEC”) are available, as soon as practicable after filing, under the investor relations tab on its website, or by a direct link to its filings on the SEC’s website.
Principal Products, Services and Their Markets
The Company operates in three segments: (i) Water, Wastewater Treatment and Municipal Infrastructure (“WWTM”), (ii) Water Resource Management System and Engineering Services (“WRME”), and (iii) Industrial Pollution Control and Safety (“IPCS”). Through its subsidiaries, variable interest entities (“VIE”) and joint venture partnership, the Company provides proprietary and third-party products, integrated systems and other services for the purposes of water resource monitoring, development, utilization and protection. The Company designs water works and customized facilities for reclaiming and reusing water and sewage treatment for China’s municipalities. These systems integrate process equipment, software, controls and instruments, information management systems, resource planning and local and distant networking hardware that includes sensors, control systems, programmable logic controllers, and supervisory control and data collection systems. The Company designs systems that track natural waterway levels for flood and drought control, monitor groundwater quality, manage water resources and irrigation systems. It also provides systems for volatile organic compound (“VOC”) abatement, odor control, water and wastewater treatment, water recycling facilities design, project engineering, procurement and construction for petroleum refineries, petrochemical and power plants as well as safe and clean production technologies for oil and gas field exploration and pipelines. With the acquisitions of J&Y International Inc. (“J&Y”) and Beijing Huaxia Yuanjie Water Technology Co., Ltd (“Yuanjie”), the Company expanded its product lines by adding thermal seawater desalination systems, zero liquid discharge (“ZLD”) systems, and secondary water supply systems targeting high-rise buildings.
Core Technologies and Solutions
ZLD Solution for Industrial Wastewater Treatment. The ZLD systems provide an optimal solution for wastewater treatment as no liquid pollutants are discharged into the environment and water is completely recycled. Solid by-products can be produced by treating wastewater with liquid evaporation concentration (mechanical vapor compression-horizontal spraying film evaporator) and crystallization (forced circulation crystallization system), which are key components of the ZLD solution. The Company can tailor ZLD solutions to its customers’ individual needs and requirements, and ensure reliability of technology and stability of system operation. Besides desalination, the technologies can also be used to treat high-concentration wastewater such as landfill leachate and high-salinity wastewater. The industries and companies served by the technologies include oil and gas exploration companies, petrochemical refineries and fertilizer plants, coal-fired and thermal power plants, pulp and paper mills, municipal water treatment facilities, and pharmaceutical and food-processing companies.
| I-1 |
Seawater Desalination Solution. There is a growing market for the business of seawater desalination due to fresh water resource shortage. The Company is capable of providing tailored seawater desalination solutions for different types of customers. These solutions include the thermal seawater desalination technology featuring low temperature multi-effect evaporation and multi-flash evaporation, typically for projects with easy access to low-cost heat source such as superheated vapor and hot liquid, and the membrane seawater desalination technology for projects with easy access to cheap electrical power. The Company also specializes in small skid-mounted seawater desalination units such as the mechanical vapor compression-spraying film evaporator.
VOC Treatment. In the industrial production process, some plants produce large volumes of volatile organic gases that are hazardous to the environment if discharged untreated. The Company’s thermal oxidation technology thoroughly treats these toxic, harmful and non-recyclable organic waste gases. The Company developed different thermal oxidation technologies such as regenerative thermal oxidizer, thermal oxidizer, regenerative catalytic oxidizer and catalytic oxidizer based on specific parameters for different waste gases.
Forward Osmosis Technology. The forward osmosis technology can turn muddy contaminated water into pure and potable water. It can also be used to treat industrial wastewater which contains toxic wastes that are not readily degradable. The Company’s products do not have the clogging or fouling problems seen in the reverse osmosis technology.
Flash Flood Disaster Warning Information Dissemination System. The disaster warning information dissemination platform is part of the flash flood monitoring and warning system. As the center of information distribution, it is the most important part of the integrated system. The platform timely and accurately transmits disaster warning information to areas threatened by flash flood through early warning programs and channels which receive instructions from county-level flood control offices, allowing recipients to take necessary precautionary measures to minimize casualties and property losses. The platform can be used to receive feedback from early warning stations to monitor the effectiveness of information dissemination.
Business Segments
The Company’s business segments are grouped according to the types of services provided and the types of clients served. The total sales and costs are divided into three segments accordingly. The Company assesses each segment’s performance based on net revenue and gross profit on contribution margin. More detailed descriptions of the three reportable operating segments follow:
Segment 1: Water, Wastewater Treatment and Municipal Infrastructure (“WWTM”)
WWTM focuses on municipal water supply and distribution, wastewater treatment and gray water recycling, through the procurement and construction of proprietary build-transfer-operation (“BTO”) processing equipment and processing control systems. The Company also provides municipal facilities engineering and operation management services for related infrastructure construction projects. This segment has historically provided the majority of its contract revenues. Representative projects in the China market include the expansion phase of the water treatment plant for the City of Ordos valued at approximately $20 million, which started in June 2011 and is expected to be completed by the end of 2012, and the recycled water quality upgrade project for Tianjin Airport Economic Zone with a total contract value of $1.46 million, which started in June 2011 and is expected to be operational by the end of 2012. Representative international projects include three Indian engineering-procurement-construction (“EPC”) contracts for sewage collection and treatment plants in three municipalities with a total contract value of $39 million, which started in November 2011 and are expected to be completed by the end of 2013.
Segment 2: Water Resource Management System and Engineering Service (“WRME”)
WRME involves projects relating to water resource management, flood control and forecasting, irrigation systems, and similar ventures through system integration of proprietary and third-party hardware and software products. For government agencies, the Company designs systems that track natural waterway levels for drought control, monitor groundwater quality, and generally manage water resources and irrigation systems. Representative projects include flash flood early warning and hydrologic monitoring projects for multiple counties in Heilongjiang, Fujian, Guizhou, Anhui and Shanxi provinces, with a total contract value of $7.02 million, which commenced in April of 2012 and are expected to be completed at different points in time from October to November, 2012.
| I-2 |
Segment 3: Industrial Pollution Control and Safety (“IPCS”)
IPCS focuses on industrial water, wastewater treatment and seawater desalination for industrial production and pollution control in the petroleum and power industries applying a variety of technologies such as ZLD, multi-effect evaporation, multi-flash evaporation, as well as emissions control. Projects in this segment include traditional EPC of equipment and modules, and the operation and maintenance of industrial wastewater treatment plants. For petroleum refineries, petrochemical factories and power plants, the Company provides systematic solutions for volatile organic compound abatement, odor control, water and wastewater treatment, and water recycling. The Company also provides safe and clean production technologies for oil and gas field exploration and pipeline transportation. Representative projects include the Dawangdian Industrial Park wastewater plant and pipeline project in Xushui County of Hebei Province, with a total contract value of $7.9 million, which is expected to be delivered by November 2012; the seawater desalination project for the utility plant of Qatar Petrochemical Co. Ltd. in Qatar, with a contract value of $8.3 million, which started in December 2011 and is expected to be delivered by November 2012; the Wuhan natural gas distribution network control system project, with a contract value of $1.5 million, which began in January 2012 and is expected to be completed by May 2013; and the water processing unit project for a steel plant in Mexico to be completed and delivered by early April 2013.
Revenues by Segment
In the three months ended June 30, 2012, our total revenues were $23.0 million, including $8.3 million from Segment 1, $8.4 million from Segment 2, and $6.3 million from Segment 3. The table below shows the performance of each business segment for the second quarter of 2012. Segment 1 contributed 36.3% of the total revenues; Segment 2 contributed 36.6%; and Segment 3 contributed the remaining 27.1%.
| Three Months Ended June 30, 2012 | ||||||||||||||||||||||||||||||||
| Segment 1: | % | Segment 2: | % | Segment 3: | % | Total: | % | |||||||||||||||||||||||||
| System Integration | $ | 8,354,428 | 100.0 | % | $ | 7,441,871 | 88.2 | % | $ | 5,945,471 | 95.1 | % | $ | 21,741,770 | 94.4 | % | ||||||||||||||||
| Hardware Products | $ | — | — | % | $ | 994,129 | 11.8 | % | $ | 304,635 | 4.9 | % | $ | 1,298,764 | 5.6 | % | ||||||||||||||||
| Software Products | $ | — | — | % | $ | — | — | % | $ | — | — | % | $ | — | — | % | ||||||||||||||||
| Total Revenues | $ | 8,354,428 | 36.3 | % | $ | 8,436,000 | 36.6 | % | $ | 6,250,106 | 27.1 | % | $ | 23,040,534 | 100 | % | ||||||||||||||||
The following table provides revenue percentage for each segment and category for the six months ended June 30, 2012. The total revenues increased by 11.9% comparing with the same period in 2011.
| Six Months Ended June 30, 2012 | ||||||||||||||||||||||||||||||||
| Segment 1: | % | Segment 2: | % | Segment 3: | % | Total: | % | |||||||||||||||||||||||||
| System Integration | $ | 16,761,401 | 100.0 | % | $ | 13,395,148 | 91.2 | % | $ | 10,117,883 | 93.6 | % | $ | 40,274,432 | 95.3 | % | ||||||||||||||||
| Hardware Products | $ | — | — | % | $ | 1,295,442 | 8.8 | % | $ | 691,972 | 6.4 | % | $ | 1,987,414 | 4.7 | % | ||||||||||||||||
| Software Products | $ | — | — | % | $ | — | — | % | $ | — | — | % | $ | — | — | % | ||||||||||||||||
| Total Revenues | $ | 16,761,401 | 39.7 | % | $ | 14,690,590 | 34.8 | % | $ | 10,809,855 | 25.5 | % | $ | 42,261,846 | 100 | % | ||||||||||||||||
Backlog and Pipeline for 2012
The Company’s backlog represents the amount of contract work remaining to be completed, that is, revenues from existing contracts and work in progress expected to be recorded in 2012 and onwards, based on the assumption that these projects will be completed on time according to the project schedules. As of June 30, 2012, the Company had a total backlog of $79.2 million, including $41.9 million in Segment 1, $12.2 million in Segment 2 and $25.1 million in Segment 3.
As of June 30, 2012, the Company expected potential projects in the pipeline with a total contract value of $152.2 million, of which approximately $89.7 million is in Segment 1, $23.1 million in Segment 2, and $39.4 million in Segment 3.
With a strong backlog, the Company anticipates that its revenues will reach a range between $103 million and $128 million, and its net income between $9.7 million and $12.1 million, in 2012.
Operational Results Overview and Business Trends
General
China experienced slower growth during the second quarter of 2012. To soften the impact of the lowered growth rate, China has made adjustments in government sponsored investments in infrastructures, which decreased market demand for our products and services. The weakened demand, combined with the increasing costs of financing, labor and raw materials, presented unprecedented challenges to our sales. However, the Company was able to secure a moderate growth under the circumstances.
| I-3 |
To address the slowing growth rate without compromising its environmental initiatives, the Chinese government recently issued several key environment development programs in fields such as water conservancy, energy conservation, urban water supply, water treatment and seawater desalination. At a macro level, the government has pushed through specific policies to loosen monetary constrains, to reduce taxes and to increase investment on key projects to stabilize the economic growth.
To address the challenges, the Company focused on its profitability through enhancing its cost efficiencies. On the other hand, it emphasized strategic developments in markets where its core technologies have a competitive advantage against its competitors. In the meantime, the Company continued its efforts to develop its overseas market shares in water and waste water treatment sector to optimize the revenue growth of its portfolio.
In general, the Company expects the market demand of the overall industry to continue its stable growth in the next few quarters. The company anticipates a moderate growth through maximizing its income and minimizing its costs and expenses.
Segment 1: Water, Wastewater Treatment and Municipal Infrastructure
During the second quarter, revenue from our WWTM segment decreased by 50.2% compared to the same period last year. The decline was primarily due to the delay in execution of the expansion phase of Ordos Water Treatment Plant and three India Bihar Sewage System projects. In the second quarter, we nearly completed the civil construction and equipment procurement for the expansion phase of the Ordos project, when partial equipment has been delivered to the project site and the equipment installation has started. The India Bihar project made some progress in the second quarter, nearly completing the investigation of proposed sewerage pipe network and sewage treatment plants, soil testing, pipeline design and engineering of sewerage treatment plants. However, the overall project fell behind schedule. Currently, we are undergoing negotiation and inquiry of subcontracting and materials procurement. For the Tianjin Airport Economic Zone Wastewater Treatment Plant expansion project, we delivered part of the equipment such as pumps and conducted preparation work on project site. The Canada Jasper Lodge water treatment project was completed for a trial run. In addition, we made a recent breakthrough by winning a water quality testing equipment procurement contract for Water Quality Testing Center of Zhongwei City, Ningxia. The contract value totaled $1.78 million. We expect more success in marketing and bidding for water and wastewater treatment projects in the domestic and oversea markets and we expect our WWTM segment to continue its solid growth in the upcoming quarters.
![]()
Pic-1 Initial Phase of Ordos Drinking Water Plant
![]()
Pic-2 Initial Phase of Ordos Drinking Water Plant
| I-4 |
![]()
Pic-3 Canada Fairmont Jasper Lodge UF Water Treatment System
Segment 2: Water Resources Management Systems and Engineering Services
During the second quarter, sales from our WRME segment experienced a growth of 264.5%, compared to the same period last year. The significant increase was mainly attributable to the implementation of flash flood and small river hydrologic monitoring projects awarded in the second quarter and the execution of projects awarded in previous quarters. In the second quarter, the order backlog for the WRME segment continued to increase. We won $8.6 million flash flood and small river hydrologic monitoring contracts in six Chinese provinces, of which 70% are completed and part of the completed projects are in the stage of customer testing and acceptance. In mid-July, we were awarded $8.06 million contracts in flash flood and small river hydrologic monitoring projects in ten Chinese provinces and municipality.
In the upcoming quarters, we anticipate strong performance from our flash flood and hydrologic monitoring offerings as a result of the growing market demand. We are also focusing on the implementation of awarded projects out of the growing backlog. In addition, we will pursue opportunities in new business sectors such as information system upgrading for irrigation systems in China and overseas markets. In that regard, we recently won contracts worth $1.3 million for agricultural water conservation irrigation systems in Yelaman Township, Xinjiang.
Segment 3: Industrial Pollution Control and Safety
Our IPCS segment recorded a 459.2% increase of revenue during the second quarter of 2012 over the same period last year. The increase was mainly due to the implementation of the Dawangdian Industrial Park Wastewater Treatment project, the Qatar Seawater Desalination Unit project and the Mexico Steel Plant Wastewater Treatment project. Following the award of wastewater treatment plant construction project for the Dawangdian Industrial Park we were awarded a $5.5 million contract for wastewater pipeline network construction for the Dawangdian Industrial Park. Currently, we have completed the specific design of the Dawangdian project and have commenced the pipeline construction and equipment procurement. For the Qatar project, we have completed the majority of detailed engineering for the seawater desalination unit. For the water treatment project for the Mexico steel plant, we have submitted the engineering drawing to the customer for review and approval. For Wuhan Natural Gas High-Pressure Pipeline Co., we have completed the equipment procurement and system design for phases 1 and 2 of the automated control system project and started construction. For the South Yolotan-Osman project in Turkmenistan, we have completed the design for the security component and material orders for communication equipment. Next quarter, we will continue to expand our IPCS business in the China market, particularly in the thermal seawater desalination and zero liquid discharge technologies, which are our core strengths in industrial wastewater treatment. We anticipate sales from the segment to continue steady growth.
Strategies for Growth
Segment 1: Water, Wastewater Treatment and Municipal Infrastructure
For the WWTM segment, we will reinforce our leading position and continue to strengthen our core compatibility as an EPC contractor and BTO provider for municipal water treatment projects. Specifically, we will continue to develop water and wastewater treatment business in domestic market, focusing mainly on the construction and retrofit of municipal water and wastewater treatment facilities in small- to medium-sized cities in Central and West China. We will select projects with favorable payment terms and maintain tight controls over costs. Overseas, we will continue municipal project development in South Asia and North America to further diversify our customer base and optimize our revenue portfolio. In terms of our products, our main focus in the following quarters will be on research and development of membrane technology and products in municipal water and wastewater treatment field. To that end, we actively seek partnerships with leading European membrane products manufacturers and conduct research and development on the membrane treatment technology. Part of our research and development and manufacturing facilities in Baoding have started operation. Moreover, we will continue our domestic market development for forward osmosis membrane technology and explore the feasibility of applying forward osmosis membrane technology in industrial use. Lastly, we are looking at potential domestic acquisition opportunities emphasizing on proprietary membrane technologies. As a whole, we plan to further enhance our water and wastewater treatment technology by independent research and development, cooperative development, and mergers and acquisitions.
| I-5 |
Segment 2: Water Resources Management Systems and Engineering Services
For the WRME business segment, we will continue to expand our market share in flash flood and small river hydrologic monitoring. We will closely monitor market demands driven by the government policies and fund allocation. We have launched market survey and preparing several water resources management programs such as national water resources monitoring program and irrigation area information system program. We intend to capture a larger market share by partnering with international leading water conservancy information solution providers and importing competitive technologies from overseas. In addition, we are expanding the WRME business to the South Asian market. Starting in the second quarter of fiscal 2012, we have participated in several project biddings there.
Segment 3: Industrial Pollution Control and Safety
In the IPCS segment, we are refocusing on domestic market development. We conducted pilot testing of specialties industrial wastewater ZLD and thermal seawater desalination technologies and accelerated the commercialization of core technologies in the China market, prioritizing especially on the petrochemical industry. We believe higher effluent standards emphasizing on resource recovery and lower energy consumption present vast market opportunities. Moreover, we continue to explore the application of membrane technology in industrial wastewater treatment, through research and development and introduction of the technology to municipal governments. Overseas, we continue to undertake cutting-edge projects of industrial wastewater ZLD and thermal seawater desalination. Our competitive pricing structure, reliable operation and lower energy consumption enable us to compete effectively with international peers.
Funding for Continuous Growth
Funding is critical to maintaining our growth momentum, especially as we explore potential projects using the BTO business model. We are actively working with local Chinese banks to secure financial support. We renewed the credit line with Bank of Hangzhou totaling $12.7 million. In September 2011, we secured a credit line of $9.6 million from CITIC Bank. We also secured credit lines of $6.4 million and $2.4 million from ICBC Bank in February 2012 in June 2012, respectively, the latter of which was currently used to fund our payment to suppliers. Our total credit line from ICBC therefore amounted to 8.8 million. These credit lines provide us the liquidity to expand and grow our operations in a non-dilutive manner, to increase our financial flexibility and to optimize the efficiency of our capital structure. We also explore other project finance approaches to dovetail our BTO business model.
Competition
We operate in a highly competitive industry characterized by rapid technological development and evolving industrial standards. Given the stimulus initiatives in China, we expect the competition to intensify as more companies enter the market, notwithstanding relatively high barriers to entry in the need for technical expertise and funding.
We compete primarily on the basis of customer recognition, industry reputation, product innovation and a competitive pricing structure. Through mergers and acquisitions, we are able to offer advanced technologies at an attractive price when competing with domestic and international rivals. Due to our nationwide distribution and customer service network and knowledge of the local market, we enjoy an advantage in China over international competitors who typically appoint only one distributor in the Chinese market responsible for selling and servicing their products. In addition, we provide a more comprehensive set of products than most of our international or local competitors. If competition in the industry intensifies, we may see these advantages decrease or disappear. In order to maintain and enhance our competitive advantage, we must continue to focus on competitive pricing, technological innovation, market trends, as well as improvement in proprietary products.
Although we believe our competitive strengths provide us with advantages over many of our competitors, some of our international rivals have better brand recognition, longer operating histories, longer or more established relationships with their customers, stronger research and development capabilities and greater marketing budgets and other resources. Most of our international competitors are substantially larger and have greater access to capital than we do. Some of our domestic competitors have stronger customer bases, better access to government resources and stronger industry-based background. In areas such as the ZLD solution and seawater desalination, we anticipate fierce competition from multi-national competitors.
| I-6 |
Principal Suppliers
Our suppliers vary from project to project. Often, they are specifically appointed by the clients. Most of the materials or equipment we purchase are not unique and are easily available in the market. The prices for those purchases, although increasing, are relatively consistent and predictable. A specific supplier might constitute a significant percentage of our total purchases at a certain time for a large contract. The dependence on a specific supplier usually ends when the project is completed. We do not rely on any single supplier in the long term.
As planned, we have deployed ERP modules to centralize our supply chain management for some of our subsidiaries. In addition, we are furthering the deployment of the ERP modules to integrate all subsidiaries.
Customers and Marketing/Distribution Methods
We operate on a project basis, and this particular nature does not usually allow us to create a long-term relationship with our customers. We negotiate with various government agencies, municipalities, industrial enterprises and/or their general contractors in order to secure and undertake our various contracts. Our major customers usually account for a certain percentage of our total sales. Our top five customers collectively represented approximately 56.3% and 86.7% of our total revenue for the three months ended June 30, 2012 and 2011, respectively. Although we are dependent on our large clients to a certain degree, unlike other commercial businesses, collectability of accounts receivables are relatively secure because our client base consists primarily of government agencies or large state-owned enterprises.
Patents and Proprietary Rights
As of June 30, 2012, we owned 11 product patents and 39 software copyrights.
Government Regulation and Approval
As described in greater detail above in the discussion of our business segments, government policies and initiatives in the various industries we serve have a considerable impact on our potential for growth in domestic market. We generally undertake projects for government entities and enterprises, and must complete the projects in accordance with the terms of the contracts in which we enter with those entities.
Employees
As of June 30, 2012, we had a total headcount of 446, of which 233 (52%) were in technical support and project management, 97 (22%) in sales, 13 (3%) in research and development, 44 (10%) in finance, and the remaining 59 (13%) in general and administrative functions. The increase of our headcount was mainly in the project management department, which grew by 69 during the second quarter. In the general and administrative department, headcount decreased by 27. In the sales department, headcount increased by 11. In the research and development department, headcount was the same as that on March 31, 2012. Total headcount increased by 56 from that on March 31, 2012. Our teams are very stable compared to our peers.
Research and Development
We focus our research and development efforts on improving our development efficiency and the quality of our products and services. Some of our technical support team regularly participate in research and development programs. There are five major on-going software research and development projects and one hardware research and development project. These projects are expected to be completed in 2012.
As our research and development base, Tianjin Baoding Environmental Technology Co., Ltd. (“Baoding”) focuses on technology development, software development, pilot testing, manufacturing and pre-installation/pre-assembly of our proprietary products. The Baoding research, development and production facility construction officially started in June 2011. Part I of phase one of the construction is for odor control system manufacturing and automatic control box assembly workshops, which has been completed. The main construction of Part II of phase one has been completed in August 2012, and is expected to be in use by the end of 2012. Phase two and phase three are scheduled to be completed by the end of 2013.
Properties
Our primary office location is the 15th and 16th Floor of Tower B, Renji Plaza, 101 Jingshun Road, Chaoyang District, Beijing. The rental space for the two floors is 908 square meters for the 15th floor and 986 square meters for the 16th floor. The lease contract for this location is from September 1, 2010 to August 31, 2013. We also have a 1,300 square meter rental office in Tianjin, located at 4th Floor, Kaide A Complex, 7 Rongyuan Road, Huayuan Property Management Zone, Tianjin, with a rental term that runs until December 2014. In April 2012, we rented a 1,1398 square meter office in Beijing to relocate our subsidiary Yanyu, located at 10th Floor of Tower B, Baoneng Center, Futong East Road, Chaoyang District, Beijing, with a rental term that runs until March 2015. In addition, we have three other rental office locations in various areas of Beijing, for which the lease contracts are to expire at different points in time during the third quarter.
| I-7 |
Baoding, one of the Company’s subsidiaries, is located at West Tianbao Road, Baodi Economic Development Zone in Tianjin. The subsidiary occupies an area of 158,954 square meters and has a 50-year land use right starting on January 18, 2011.
Results of Operations
Overview for the Three and Six Months Ended June 30, 2012 and 2011
Our operating revenues are primarily derived from system design and integration, hardware product design and manufacturing and sales. Our second quarter results reflected stable growth. Highlights of our financial results during the three months ended June 30, 2012 include:
| · | Total revenues increased to $23,040,534 in the second quarter of 2012, an increase of $2,838,647, or 14.1%, from $20,201,887 in the same period of 2011. This increase is primarily attributable to the following factors: |
| o | Systems integration revenue increased from $19,883,553 in the second quarter of 2011 to $21,741,770 in the same period in 2012, an increase of $1,858,217, or 9.3%. |
| o | Hardware products revenue totaled $1,298,764 in the second quarter of 2012, an increase of $980,430, or 308.0%, from $318,334 in the second quarter of 2011. |
| · | Total cost of revenues increased by $2,318,799 from $14,897,669 in the second quarter of 2011 to $17,216,468 in the second quarter of 2012, a 15.6% increase. This increase is attributable to the increase in system integration cost by $1,986,382 and the increase in hardware product cost by $332,417. |
| · | Total operating expenses were $4,194,927 for the second quarter of 2012, or 18.2% of total revenues, compared with $2,381,341, or 11.8%, of total revenues, in the same period of 2011. This represents an increase of $1,813,586, or 76.2%. |
| · | Operating income decreased to $1,629,139 in the second quarter of 2012, by 44.3%, from $2,922,877 in the second quarter of 2011, representing 7.1% and 14.5% of total revenues in the second quarter of 2012 and 2011, respectively. |
| · | Net income attributable to TRIT decreased to $1,370,887, or by 22.2%, for the second quarter of 2012, from $1,761,688 for the second quarter of 2011. |
The following are the operating results for the three months ended June 30, 2012 and 2011:
| Three Months Ended June 30, 2012 ($) | % of Sales | Three Months Ended June 30, 2011 ($) | % of Sales | Change ($) | Change (%) | |||||||||||||||||||
| Revenue | 23,040,534 | 100.0 | % | 20,201,887 | 100.0 | % | 2,838,647 | 14.1 | % | |||||||||||||||
| Cost of Revenues | 17,216,468 | 74.7 | % | 14,897,669 | 73.7 | % | 2,318,799 | 15.6 | % | |||||||||||||||
| Selling and Marketing Expenses | 935,853 | 4.1 | % | 472,150 | 2.3 | % | 463,703 | 98.2 | % | |||||||||||||||
| General and Administrative Expenses | 3,247,546 | 14.1 | % | 1,882,432 | 9.3 | % | 1,365,114 | 72.5 | % | |||||||||||||||
| Research and Development | 11,528 | 0.1 | % | 26,759 | 0.1 | % | (15,231 | ) | (56.9 | )% | ||||||||||||||
| Total Operating Expenses | 4,194,927 | 18.2 | % | 2,381,341 | 11.8 | % | 1,813,586 | 76.2 | % | |||||||||||||||
| Operating Income | 1,629,139 | 7.1 | % | 2,922,877 | 14.5 | % | (1,293,738 | ) | (44.3 | )% | ||||||||||||||
| Other Expenses | (34,350 | ) | (0.1 | )% | (93,067 | ) | (0.5 | )% | 58,717 | (63.1 | )% | |||||||||||||
| Income before Provision for Income Taxes | 1,594,789 | 6.9 | % | 2,829,810 | 14.0 | % | (1,235,021 | ) | (43.6 | )% | ||||||||||||||
| Provision for Income Taxes | 287,062 | 1.2 | % | 439,423 | 2.2 | % | (152,361 | ) | (34.7 | )% | ||||||||||||||
| Net Income | 1,307,727 | 5.7 | % | 2,390,387 | 11.8 | % | (1,082,660 | ) | (45.3 | )% | ||||||||||||||
| Less: Net (Loss) Income Attributable to Noncontrolling Interests | (63,160 | ) | (0.3 | )% | 628,699 | 3.1 | % | (691,859 | ) | (110.0 | )% | |||||||||||||
| Net Income Attributable to TRIT | 1,370,887 | 5.9 | % | 1,761,688 | 8.7 | % | (390,801 | ) | (22.2 | )% | ||||||||||||||
Performance highlights for the six months ended June 30, 2012 include:
| · | Total revenues increased to $42,261,846 from $37,755,098, an increase of $4,506,748, or 11.9%. |
| · | Cost of revenues increased to $31,220,280 in the six-month period in 2012 from $27,440,700 for the same period last year, an increase of $3,779,580, or 13.8%. |
| I-8 |
| · | Total operating expenses increased to $7,956,150 in the first six months of 2012 from $4,802,293 in the same period 2011, an increase of $3,153,857, or 65.7%. The most significant contributor to this increase is general and administrative expenses, which increased by $2,151,680, or 54.5%, from the six-month period in 2011. |
| · | Operating income for the six months ended June 30, 2012 was $3,085,416, or 7.3%, of the total revenues, compared to $5,512,105 for the same period last year, representing a decrease of $2,426,689, or 44.0%. |
| · | Net income attributable to TRIT was $2,809,012, or 6.6% of total revenues, a decrease of $651,657, or 18.8%, from $3,460,669 for the same period last year. |
The following are the operating results for the six months ended June 30, 2012 and 2011:
| Six Months Ended June 30, 2012 ($) | % of Sales | Six Months Ended June 30, 2011 ($) | % of Sales | Change ($) | Change (%) | |||||||||||||||||||
| Revenue | 42,261,846 | 100.0 | % | 37,755,098 | 100.0 | % | 4,506,748 | 11.9 | % | |||||||||||||||
| Cost of Revenues | 31,220,280 | 73.9 | % | 27,440,700 | 72.7 | % | 3,779,580 | 13.8 | % | |||||||||||||||
| Selling and Marketing Expenses | 1,774,846 | 4.2 | % | 786,323 | 2.1 | % | 988,523 | 125.7 | % | |||||||||||||||
| General and Administrative Expenses | 6,100,906 | 14.4 | % | 3,949,226 | 10.5 | % | 2,151,680 | 54.5 | % | |||||||||||||||
| Research and Development | 80,398 | 0.2 | % | 66,744 | 0.2 | % | 13,654 | 20.5 | % | |||||||||||||||
| Total Operating Expenses | 7,956,150 | 18.8 | % | 4,802,293 | 12.7 | % | 3,153,857 | 65.7 | % | |||||||||||||||
| Operating Income | 3,085,416 | 7.3 | % | 5,512,105 | 14.6 | % | (2,426,689 | ) | (44.0 | )% | ||||||||||||||
| Other Income (expenses) | 256,555 | 0.6 | % | (97,134 | ) | (0.3 | )% | 353,689 | (364.1 | )% | ||||||||||||||
| Income before Provision for Income Taxes | 3,341,971 | 7.9 | % | 5,414,971 | 14.3 | % | (2,073,000 | ) | (38.3 | )% | ||||||||||||||
| Provision for Income Taxes | 601,555 | 1.4 | % | 845,059 | 2.2 | % | (243,504 | ) | (28.8 | )% | ||||||||||||||
| Net Income before Allocation to Noncontrolling Interests | 2,740,416 | 6.5 | % | 4,569,912 | 12.1 | % | (1,829,496 | ) | (40.0 | )% | ||||||||||||||
| Less: Net (Loss) Income Attributable to Noncontrolling Interests | (68,596 | ) | (0.2 | )% | 1,109,243 | 2.9 | % | (1,177,839 | ) | (106.2 | )% | |||||||||||||
| Net Income Attributable to TRIT | 2,809,012 | 6.6 | % | 3,460,669 | 9.2 | % | (651,657 | ) | (18.8 | )% | ||||||||||||||
Revenues
Our revenues are subject to value added tax (“VAT”), business tax, urban maintenance and construction tax and additional education surcharges. Among the above taxes, VAT has been deducted from the calculation of revenues.
Our total revenues for the second quarter of 2012 were $23,040,534, an increase of $2,838,647, or 14.1%, compared with the same period last year. This increase is primarily attributable to an increase in the system integration category, from $19,883,553 in the second quarter of 2011 to $21,741,770 in the same period for 2012, or an increase of 9.3%. Revenue from Segment 1 constituted 36.3% of total revenues. Revenue from Segment 2 totaled $8,436,000, or 36.6% of total revenues. Revenue from Segment 3 totaled $6,250,106, constituting 27.1% of total revenues for the second quarter, mostly in the system integration category.
For the six months ended June 30, 2012, total revenues reached $42,261,846, of which 39.7%, or $16,761,401, was from Segment 1, 34.8%, or $14,690,590, was from Segment 2, and 25.5%, or $10,809,855, was from Segment 3. The system integration category constituted 95.3% of the total revenue, or $40,274,432. Hardware product sales revenue totaled $ 1,987,414, constituting the remaining 4.7%.
Cost of Revenues
Cost of revenues is based on total actual costs incurred plus estimated costs to completion applied to the percentage of completion as measured at different stages. It includes material costs, equipment costs, transportation costs, processing costs, packaging costs, quality inspection and control, outsourced construction service fees and other costs that directly relate to the execution of the services and delivery of projects. Cost of revenues also includes freight charges, purchasing and receiving costs and inspection costs when they are incurred.
Total cost of revenues was $17,216,468 for the second quarter of 2012, an increase of $2,318,799, or 15.6%, from $14,897,669 in the second quarter of 2011. The system integration category, which was the largest contributor to the revenue increase, was also the largest contributor to the increase in cost of revenues, totaling $16,608,958. The increase in cost of revenues in the system integration category was $1,986,382, or 13.6%, from $14,622,576 in the second quarter of 2011 to $16,608,958 in the second quarter of 2012. The increase is mainly a result of the increase in total revenues.
| I-9 |
Total cost of revenues for the six months ended June 30, 2012 was $31,220,280, an increase of $3,779,580, or 13.8%, compared to $27,440,700 for the same period in 2011. The cost for system integration category, totaling $30,193,175, had an increase of $3,919,850, or 14.9%, from $26,273,325 in the same period 2011, while the total hardware products cost decreased from $1,167,375 in the same period last year to $1,027,105.
Our gross margin decreased from 26.3% in the second quarter of 2011 to 25.3% in the second quarter of 2012. The most important reason for this decrease is the lower gross margin of the Indian project at 20%, which constituted 17.3% of our total revenues for this quarter. We accepted the project despite its lower gross margin as a first step to opening the India market.
The gross margin for the six months ended June 30, 2012 and 2011 was 26.1% and 27.3%, respectively.
Our strategy is to carefully choose higher-margin projects. In the next two to three years, we will continue to look for ways to minimize the negative impact on our gross margin through optimizing product and system design, leveraging bargaining power in procurement, and exploring supply chain financing and local equipment sourcing.
Selling and Marketing Expenses
Selling and marketing expenses consist primarily of compensation, marketing, travel and business entertainment expenses. In the second quarter of 2012, total selling and marketing expenses increased by $463,703, or 98.2%, from $472,150 in the second quarter of 2011 to $935,853 in the same period of 2012. This was a result of an increase in compensation-related expenses of $217,226, or 121.3%, from $179,065 in the second quarter of 2011 to $396,291 in the same period of 2012, an increase in other selling expenses of $120,742, or 95.5%, from $126,430 in the second quarter of 2011 to $247,172 in the same period of 2012, an increase in travel expenses of $112,856, or 162.4%, from $69,501 in the second quarter of 2011 to $182,357 in the same period of 2012, and an increase in entertainment expenses of $12,879, or 13.3%, from $97,154 in the second quarter of 2011 to $110,033 in the same period of 2012.
The selling and marketing expenses for the six months ended June 30, 2012 totaled $1,774,846, an increase of $988,523, or 125.7%, from $786,323 for the same period last year. This increase was mainly due to headcount increase in sales and rapid geographic expansion. Compensation-related costs increased from $294,890 for the six-month period ended June 30, 2011 to $708,791 for the same period this year, an increase of $413,901, or 140.4%. Travel expenses increased from $135,772 for the six-month period ended June 30, 2011 to $239,260 for the same period this year, an increase of $103,488, or 76.2%. Other selling expenses increased from $207,909 for the six-month period ended June 30, 2011 to $608,550 for the same period this year, an increase of $400,641, or 192.7%. Consisting mainly of employee benefits, business promotion, office expenses, vehicle maintenance and bidding expenses, the significant increase in other selling and marketing expenses came mainly from business promotion and bidding expenses. Entertainment expenses increased by $70,494, or 47.7%, from $147,751 in the first half of 2011 to $218,245 for the same period of 2012.
Selling and marketing expenses for the three months and six months ended June 30, 2012 took up approximately 4.1% and 4.2% of total revenues, respectively. We anticipate its continued increase during the second half of the year.
General and Administrative Expenses
General and administrative expenses consist primarily of compensation costs, rental expenses, professional fees, and other overhead expenses. General and administrative expenses increased by $1,365,114, or 72.5%, from $1,882,432 in the second quarter of 2011 to $3,247,546 in the second quarter of 2012. Of this increase, $188,085 was for officers’ salaries, which increased from $180,415 in the second quarter of 2011 to $368,500 in the second quarter of 2012. Salaries for mid-level management, technical support team, and other office staff increased by $159,148, or 33.2%, from $479,400 in the second quarter of 2011 to $638,548 in the second quarter of 2012. Of other human resource expenses, endowment and social insurance increased by 14.3% and 159.2%, respectively, to $62,497 and $124,668, in the second quarter of 2012. Rent increased by $103,480, or 58.7%, from $176,326 in the second quarter of 2011 to $279,806 in the second quarter of 2012 due to office relocation. Professional fees increased by $150,688, or 90.2%, from $167,151 to $317,839, which was mainly for consulting and legal services. Amortization of intangible assets and software increased by $89,125, from $124,811 in the second quarter of 2011 to $213,936 in the same period of 2012. This increase was due to the purchase of certain software and intangible assets in our acquired subsidiaries and the amortization of land use rights. Depreciation expense increased by $23,891, or 40.4%, from $59,204 in the second quarter of 2011 to $83,095 in the second quarter of 2012. Other general and administrative expenses increased by $566,331, or 95.6%, from $592,326 to $1,158,657 in the second quarter of 2012, including mainly office expenses, utilities, travel, communication, other services and option expense.
| I-10 |
In the first six months of 2012, we strengthened our administrative support, including human resources and finance functions. Many highly qualified professionals joined us to support the revenue growth. Total general and administrative expenses for the six months ended June 30, 2012 was $6,100,906, an increase of $2,151,680, or 54.5%, from $3,949,226 for the same period last year. Of this increase, $590,431 was for compensation-related costs. Of other human resource expenses, endowment and social insurance increased by 42.0% and 102.9% respectively, to $44,842 and $131,885, in the first six months of 2012. Rent increased by $167,704, or 46.6%, from $359,613 in the first six months of 2011 to $527,317 in the same period of 2012. Professional fee increased by $220,565, or 62.8%, from $351,037 in the first six month of 2011 to $571,602 for the same period of 2012, mainly due to consulting services exploring new business opportunities. Amortization and depreciation increased by $158,048 and $38,674, or 58.6% and 33.4%, respectively. Other general and administrative overhead increased by $799,530 for the first six months of 2012, or 63.5%, compared to the same period last year.
General and administrative expenses for the three months and six months ended June 30, 2012 took up approximately 14.1% and 14.4% of total revenues. We anticipate it to continue its increase but at a lower speed in the future.
Provision for Income Tax
We provide for deferred income taxes using the asset and liability method. Under this method, we recognize deferred income taxes for tax credits, net operating losses available for carry-forwards and significant temporary differences. We classify deferred tax assets and liabilities as current or non-current based upon the classification of the related asset or liability in the financial statements or the expected timing of their reversal if they do not relate to a specific asset or liability. We provide a valuation allowance to reduce the amount of deferred tax assets if it is considered more likely than not that some portion or all of the deferred tax assets will not be realized.
Our operations are subject to income and transaction taxes of China since most of our business activities take place there. Significant estimates and judgments are required in determining our provision for income taxes. Some of these estimates are based on interpretations of existing tax laws or regulations, as well as predictions related to future changes in these laws and regulations. The ultimate amount of tax liability may be uncertain as a result. We do not anticipate any events which could change these uncertainties.
We, including our subsidiaries and VIEs, are subject to income taxes on an entity level for income arising in or derived from the tax jurisdictions in which each entity is domiciled. According to the New Enterprise Income Tax Law in China, the unified enterprise income tax (“EIT”) rate is 25%. However, five of our subsidiaries are eligible for certain favorable tax policies for being high-tech companies.
| EIT | ||||||||
| Three Months Ended June 30, | ||||||||
| 2012 | 2011 | |||||||
| % | % | |||||||
| TTB | 15 | 7.5 | ||||||
| BSST | 15 | 15 | ||||||
| Yanyu | 15 | 15 | ||||||
| Tranhold | 25 | 25 | ||||||
| TTA | 25 | 25 | ||||||
| Baoding | 15 | 15 | ||||||
| Yuanjie | 15 | — | ||||||
| Buerjin | 25 | — | ||||||
| Xushui | 25 | — | ||||||
| Consolidated Effective EIT | 18 | 16 | ||||||
The favorable income tax treatment for TTB at 7.5% expired at the end of 2011. Thereafter, the EIT rate became 15%, since TTB continues to qualify as a high-tech company. The provision for income tax for the second quarter of 2012 was $287,062.
We have not recorded tax provision for U.S. tax purposes as they have no assessable profits arising in or derived from the United States and we intend to permanently reinvest accumulated earnings in the PRC operations.
Net Income before Income Taxes
In the quarter ended June 30, 2012, our net income before provision for income taxes was $1,594,789, a decrease of $1,235,021, or 43.6%, compared to $2,829,810 in the same period in 2011. Our provision for income taxes decreased by $152,361, from $439,423 in the second quarter of 2011 to $287,062 in the same period of 2012. In the second quarter of 2012, net income attributable to shareholders of TRIT was $1,370,887, a decrease of $390,801, or 22.2%, from $1,761,688 for the same period of 2011.
| I-11 |
For the six months ended June 30, 2012, our net income before provision for income taxes decreased by 38.3%, or $2,073,000, from $5,414,971 for the same period last year to $3,341,971. The provision for income taxes decreased by $243,504, or 28.8%, from $845,059 to $601,555. The net income attributable to the shareholders of TRIT was $2,809,012, a decrease of $651,657, or 18.8%, from $3,460,669 for the same period in 2011. The net income decreased because revenues did not increase whereas expenses grew quickly to meet increasing business demands. Moreover, we granted options in the second quarter which led to option expense of $0.35 million.
Liquidity and Capital Resources
As highlighted in the consolidated statements of cash flows, our liquidity and available capital resources are impacted by four key components: (i) cash and cash equivalents, (ii) operating activities, (iii) financing activities, and (iv) investing activities.
Consolidated cash flows for the six months ended June 30, 2012 and 2011 were as follow:
| Six Months Ended June 30, | ||||||||||||
| 2012 ($) | 2011($) | Change($) | ||||||||||
| Net Cash (Used in) Operating Activities | (8,297,972 | ) | (10,385,697 | ) | 2,087,725 | |||||||
| Net Cash Provided by (Used in) Investing Activities | 106,389 | (2,914,949 | ) | 3,021,338 | ||||||||
| Net Cash Provided by Financing Activities | 5,409,603 | 2,524,703 | 2,884,900 | |||||||||
| Effects of Exchange Rate Changes on Cash and Cash Equivalents | 408,797 | 499,908 | (91,111 | ) | ||||||||
| Net Decrease in Cash and Cash Equivalents | (2,373,183 | ) | (10,276,035 | ) | 7,902,852 | |||||||
| Cash and Cash Equivalents, Beginning of Period | 11,935,746 | 23,394,995 | (11,459,249 | ) | ||||||||
| Cash and Cash Equivalents, End of Period | 9,562,563 | 13,118,960 | (3,556,397 | ) | ||||||||
Cash and Cash Equivalents
As of June 30, 2012, our cash and cash equivalents amounted to $9,562,563. The restricted cash as of June 30, 2012 and December 31, 2011 amounted to $4,278,156 and $4,629,878, respectively, which are not included in the total amount of cash and cash equivalents. The restricted cash consisted of deposits as collaterals for the issuance of letters of credit. Our subsidiaries that own these deposits do not have material cash obligations to any third parties. Therefore, the restriction does not impact our liquidity.
Operating Activities
Net cash used in operating activities was $8,297,972 for the six months ended June 30, 2012, compared with $10,385,697 in the same period 2011. The decrease of $2,087,725 in operating cash outflow was mainly attributable to our rapid growth and aggressive expansion in new markets in forms of accounts receivables and unbilled receivables. Net accounts receivable increased from $19.9 million on December 31, 2011 to $23.0 million on June 30, 2012, an increase of $3.1 million. Unbilled receivables increased from $7.3 million on December 31, 2011 to $21.0 million on June 30, 2012, an increase of $13.7 million. Prepayments to suppliers and subcontractors increased from $4.9 million on December 31, 2011 to $8.7 million on June 30, 2012, an increase of $3.7 million. Deposits on projects decreased from $1.2 million on December 31, 2011 to $1.1 million on June 30, 2012, a decrease of $0.1 million.
| June 30, 2012 ($) (unaudited) | December 31, 2011 ($) | Change ($) | Change (%) | |||||||||||||
| Cash | 9,562,563 | 11,935,746 | (2,373,183 | ) | (19.9 | ) | ||||||||||
| Restricted cash | 1,723,780 | 2,087,920 | (364,140 | ) | (17.4 | ) | ||||||||||
| Accounts and notes receivable | 23,899,980 | 20,507,146 | 3,392,834 | 16.5 | ||||||||||||
| Allowance for doubtful accounts | (859,405 | ) | (619,062 | ) | (240,343 | ) | 38.8 | |||||||||
| Accounts and notes receivable, net | 23,040,575 | 19,888,084 | 3,152,491 | 15.9 | ||||||||||||
| Unbilled revenue | 21,011,695 | 7,254,830 | 13,756,865 | 189.6 | ||||||||||||
| Prepayments to suppliers and subcontractors | 8,654,805 | 4,908,697 | 3,746,108 | 76.3 | ||||||||||||
| Deposits on projects | 1,053,579 | 1,212,691 | (159,112 | ) | (13.1 | ) | ||||||||||
Investing Activities
Net cash provided by investing activities was $106,389 during the six months ended June 30, 2012, an increase of $3,021,338 from net cash used in investing activities of $2,914,949 in the same period of 2011. This increase was mainly due to the collection of restricted cash and collection of loans to third-party companies.
| I-12 |
Financing Activities
The cash provided by financing activities was $5,409,603 in the six months ended June 30, 2012, compared to $2,524,703 in the same period of 2011. The increase was due to increased bank borrowings.
Effect of Exchange Rate Changes on Cash and Cash Equivalents
Net cash gain due to currency exchange was $408,797 in the six months ended June 30, 2012, a decrease of $91,111 compared to that of $499,908 in the same period of 2011.
Restricted Net Assets
Our ability to pay dividends is primarily dependent on receiving distributions of funds from our subsidiaries, VIEs and other affiliates entities, which is restricted by certain regulatory requirements. Relevant Chinese statutory laws and regulations permit payments of dividends by our Chinese affiliates only out of their retained earnings, if any, as determined in accordance with PRC accounting standards and regulations. In addition, our PRC affiliates are required to set aside at least 10% of their after-tax profit after deducting any accumulated deficit based on PRC accounting standards each year to our general reserves until the accumulated amount of such reserves reach 50% of our registered capital. These reserves are not distributable as cash dividends. Our off-shore subsidiaries, TIS and Tri-Tech International Investment, Inc. (“TTII”), do not have material cash obligations to third parties. Therefore, the dividend restriction does not impact our liquidity. There is no significant difference between accumulated profit calculated pursuant to PRC accounting standards and that pursuant to U.S. GAAP. As of June 30, 2012 and December 31, 2011, restricted retained earnings were $1,866,994 for both, and restricted net assets were $4,446,696 and $4,553,729, respectively. Unrestricted retained earnings as of June 30, 2012 and December 31, 2011 were $22,491,398 and $19,682,386, respectively, which were the amounts available for distribution in the form of dividends or for reinvestment.
Working Capital and Cash Flow Management
As of June 30, 2012, our working capital was $8,920,490, with current assets totaling $75,746,975 and current liabilities totaling $66,826,485. Of the current assets, cash and cash equivalents was $9,562,563.
However, we may require additional cash to undertake larger projects or to complete strategic acquisitions in the future. In the event our current capital is insufficient to fund these and other business plans, we may take the following actions to meet such working capital needs:
| · | We may look into the possibility of optimizing our funding structure by obtaining short- and/or long-term debt through commercial loans. We are actively exploring opportunities with major Chinese banks, such as ICBC Bank, CITIC Bank, Hangzhou Bank and CMBC Bank we expect to acquire additional lines of credit and tap into other financing channels to take on more projects in the future. Other financing instruments into which we are currently looking include supply chain financing, project financing, trust fund financing, commercial loan and capital leasing. |
| · | We may improve our collection of accounts receivable. Most of our clients are central, provincial and local governments. We believe that our clients are in good financial conditions. Therefore, we expect good collectability from relatively high accounts receivables. The accounts receivable collection should catch up with our rapid growth in the near future. Given the high interest rate on unpaid contract price for long-term projects, it is possible that some clients may choose to pay before interests start to accrue. |
Segment Information
We have three reportable operating segments. The segments are grouped according to the types of goods and services provided and the types of clients that use such goods and services. Total sales and costs are divided among these three segments. We assess each segment’s performance based on net revenue and gross profit on contribution margin.
Segment 1: Water, Wastewater Treatment and Municipal Infrastructure
The following are the operating results for the three months ended June 30, 2012 and 2011 for Segment 1:
| I-13 |
Three months ended June 30,
| 2012 ($) | 2011($) | Change ($) | Change (%) | ||||||||
| Revenues | 8,354,428 | 16,769,633 | (8,415,205 | ) | (50.2 | )% | |||||
| Cost of Revenues | 6,327,955 | 12,589,753 | (6,261,798 | ) | (49.7 | )% | |||||
| Operating Expenses: | |||||||||||
| Selling and Marketing Expenses | 222,521 | 143,878 | 78,643 | 54.7 | % | ||||||
| General and Administrative Expenses | 1,389,852 | 1,196,760 | 193,092 | 16.1 | % | ||||||
| Research and Development | 6,167 | 7,936 | (1,769 | ) | (22.3 | )% | |||||
| Total Operating Expenses | 1,618,540 | 1,348,574 | 269,966 | 20.0 | % | ||||||
| Other Income (Expenses) | 100,754 | (34,363 | ) | 135,117 | (393.2 | )% | |||||
| Income before Provision for Income Taxes | 508,687 | 2,796,943 | (2,288,256 | ) | (81.8 | )% |
Revenues for Segment 1 were $8,354,428 for the three months ended June 30, 2012, a decrease of $8,415,205, or 50.2%, from $16,769,633 in the same period of 2011. This decrease was mainly attributable to the Ordos drinking water plant project, on which we recognized revenue of $16 million in the second quarter of 2011 and $1.9 million in the second quarter of 2012. Although we recognized revenue of $3.98 million on the Indian project in the second quarter of 2012, the revenue increase from the Indian project did not entirely offset the revenue decrease from Ordos. Revenue from segment 1 is expected to increase next quarter.
Cost of revenues for Segment 1 was $6,327,955 in the second quarter of 2012, a decrease of $6,261,798, or 49.7%, from that of $12,589,753 in the second quarter of 2011. As the Company recognizes revenue following the percentage-of-completion method, measured by different stages of completion, the decrease in cost of revenues was mainly due to the recognized completion stages of our projects during the periods.
Total operating expenses in Segment 1 were $1,618,540, an increase of $269,966, or 20.0%, compared with $1,348,574 in the second quarter of 2011. The selling and marketing expenses increased from $143,878 in the second quarter of 2011 to $222,521 in the same period of 2012, an increase of $78,643, or 54.7%. The increase was mainly due to the increase in headcount and travel expenses. The general and administrative expenses for the second quarter of 2012 were $1,389,852, an increase of $193,092, or 16.1%, compared with $1,196,760 for the same period in 2011. The increase was caused by increases in salaries, rent and professional service expenses.
Other income was $100,754 in the second quarter of 2012, a $135,117 increase compared to other expense of $34,363 in the same period of 2011. The increase was mainly due to unrecognized financing income in the second quarter of 2012.
Income before provision for income taxes was $508,687 in the quarter ended June 30, 2012, a decrease of $2,288,256, or 81.8%, from that of $2,796,943 in the same period of 2011.
The following are the operating results for the six months ended June 30, 2012 and 2011 for Segment 1:
Six months ended June 30,
| 2012 ($) | 2011($) | Change ($) | Change (%) | ||||||||
| Revenues | 16,761,401 | 29,674,019 | (12,912,618 | ) | (43.5 | )% | |||||
| Cost of Revenues | 12,252,219 | 22,211,750 | (9,959,531 | ) | (44.8 | )% | |||||
| Operating Expenses: | |||||||||||
| Selling and Marketing Expenses | 448,147 | 252,935 | 195,212 | 77.2 | % | ||||||
| General and Administrative Expenses | 2,920,267 | 1,937,901 | 982,366 | 50.7 | % | ||||||
| Research and Development | 11,918 | 7,936 | 3,982 | 50.2 | % | ||||||
| Total Operating Expenses | 3,380,332 | 2,198,772 | 1,181,560 | 53.7 | % | ||||||
| Other Income (Expenses) | 448,169 | (40,016 | ) | 488,185 | (1,220.0 | )% | |||||
| Income before Provision for Income Taxes | 1,577,019 | 5,223,481 | (3,646,462 | ) | (69.8 | )% |
In Segment 1, revenues were $16,761,401 for the six months ended June 30, 2012, a decrease of $12,912,618, or 43.5%, from $29,674,019 in the same period of 2011. The decrease was attributable to the declining revenue from the Ordos project as it approached the end, which decrease other projects did not offset.
Cost of revenues for Segment 1 was $12,252,219 for the six months ended June 30, 2012, a decrease of $9,959,531, or 44.8%, from that of $22,211,750 in the same period of 2011. The six-month gross margin for Segment 1 was 26.9%, compared to 25.1% for the same period of 2011, due to the higher gross margin of newly acquired projects by Yuanjie.
Total operating expenses in Segment 1 were $3,380,332, an increase of $1,181,560, or 53.7%, compared with $2,198,772 in the same period of 2011. The selling and marketing expenses increased by $195,212, or 77.2%, from $252,935 for the six months ended June 30, 2011 to $448,147 in the same period of 2012. The general and administrative expenses for the six months ended June 30, 2012 were $2,920,267, an increase of $982,366, or 50.7%, compared with $1,937,901 for the same period in 2011. This growth was mainly caused by the expansion of geographic reach of our business.
| I-14 |
Other expenses were $448,169 for the six months ended June 30, 2012, a $488,185 increase compared to that of $(40,016) in the same period of 2011.
Income before provision for income taxes was $1,577,019 for the six months ended June 30, 2012, a decrease of $3,646,462, or 69.8%, from that of $5,223,481 in the same period in 2011.
Segment 2: Water Resource Management System and Engineering Services
The following are the operating results for the three months ended June 30, 2012 and 2011 for Segment 2:
Three months ended June 30,
| 2012 ($) | 2011($) | Change ($) | Change (%) | ||||||||
| Revenues | 8,436,000 | 2,314,470 | 6,121,530 | 264.5 | % | ||||||
| Cost of Revenues | 6,089,299 | 1,576,744 | 4,512,555 | 286.2 | % | ||||||
| Operating Expenses: | |||||||||||
| Selling and Marketing Expenses | 457,484 | 215,005 | 242,479 | 112.8 | % | ||||||
| General and Administrative Expenses | 908,000 | 247,098 | 660,902 | 267.5 | % | ||||||
| Research and Development | 5,361 | 8,263 | (2,902 | ) | (35.1 | )% | |||||
| Total Operating Expenses | 1,370,845 | 470,366 | 900,479 | 191.4 | % | ||||||
| Other Expenses | 21,326 | 30,230 | (8,904 | ) | (29.5 | )% | |||||
| Income before Provision for Income Taxes | 954,530 | 237,130 | 717,400 | 302.5 | % |
In Segment 2, revenues were $8,436,000 for the three months ended June 30, 2012, an increase of $6,121,530, or 264.5%, from $2,314,470 in the same period of 2011. Revenues in this segment increased significantly because Yanyu had previously won many contracts in 2011 and 2012, the revenue stream from which is starting to be recognized in the second quarter of 2012.
Cost of revenues in Segment 2 was $6,089,299 in the quarter ended June 30, 2012, an increase of $4,512,555, or 286.2%, from $1,576,744 in the same period of 2011. This increase was mainly due to the increase of projects.
Total operating expenses in Segment 2 were $1,370,845 for the quarter ended June 30, 2012, an increase of $900,479, or 191.4%, compared with $470,366 in the second quarter of 2011. The selling and marketing expenses increased from $215,005 in the second quarter of 2011 to $457,484 in the second quarter of 2012, an increase of $242,479, or 112.8%. The increase was mainly due to increases in headcount and travel expenses. The general and administrative expenses for the second quarter of 2012 were $908,000, an increase of $660,902, or 267.5%, compared with $247,098 for the same period in 2011. The increase was mainly caused by the rents for the new office and increased professional and consulting fees.
Other expenses were $21,326 in the quarter ended June 30, 2012, a decrease of $8,904 from $30,230 in the same period of 2011. The decrease was mainly due to interest expense.
Income before provision for income taxes was $954,530 in the quarter ended June 30, 2012, an increase of $717,400 from $237,130 in the same period of 2011.
The following are the operating results for the six months ended June 30, 2012 and 2011 for Segment 2:
Six months ended June 30,
| 2012 ($) | 2011($) | Change ($) | Change (%) | ||||||
| Revenues | 14,690,590 | 3,955,529 | 10,735,061 | 271.4 | % | ||||
| Cost of Revenues | 10,610,453 | 2,445,352 | 8,165,101 | 333.9 | % | ||||
| Operating Expenses: | |||||||||
| Selling and Marketing Expenses | 883,774 | 365,733 | 518,041 | 141.6 | % | ||||
| General and Administrative Expenses | 1,530,294 | 742,334 | 787,960 | 106.1 | % | ||||
| Research and Development | 68,480 | 48,248 | 20,232 | 41.9 | % | ||||
| Total Operating Expenses | 2,482,548 | 1,156,315 | 1,326,233 | 114.7 | % | ||||
| Other Expenses | 62,242 | 30,295 | 31,947 | 105.5 | % | ||||
| Income before Provision for Income Taxes | 1,535,347 | 323,567 | 1,211,780 | 374.5 | % |
Segment 2 revenues were $14,690,590 for the six months ended June 30, 2012, an increase of $10,735,061, or 271.4%, compared with $3,955,529 in the same period of 2011. The increase was mainly attributable to Yanyu’s business expansion.
| I-15 |
Cost of revenues in Segment 2 was $10,610,453 for the six months ended June 30, 2012, an increase of $8,165,101, or 333.9%, from $2,445,352 in the same period of 2011. The six-month gross margin for this segment was 27.8%, compared to 38.2% for the same period of 2011. The decline was mainly due to newly acquired projects by Yanyu with lower gross margins. We expect the decline to reverse in the following quarters.
Total operating expenses in Segment 2 were $2,482,548, an increase of $1,326,233, or 114.7%, compared with $1,156,315 in the six months of 2011. The selling and marketing expenses increased from $365,733 for the six months ended June 30, 2011 to $883,774 in the same period of 2012, an increase of $518,041, or 141.6%. The increase was mainly due to increases in employees, travel expenses and other contractual service fees. As the result of Yanyu’s business expansion, the Company’s general and administrative expenses for the six months ended June 30, 2012 were $1,530,294, an increase of $787,960, or 106.1%, compared with $742,334 for the same period in 2011.
Other expenses were $62,242 for the six months ended June 30, 2012, a decrease of $31,947, compared with other expenses of $30,295 in the same period of 2011. The decrease was primarily due to the scrap of inventory and interest expenses on credit lines.
Income before provision for income taxes was $1,535,347 for the six months ended June 30, 2012, an increase of $1,211,780, or 374.5%, compared with $323,567 in the same period of 2011.
Segment 3: Industrial Pollution Control and Safety
The following are the operating results for the three months ended June 30, 2012 and 2011 for Segment 3:
Three months ended June 30,
| 2012 ($) | 2011($) | Change($) | Change (%) | ||||||||
| Revenues | 6,250,106 | 1,117,784 | 5,132,322 | 459.2 | % | ||||||
| Cost of Revenues | 4,799,214 | 731,172 | 4,068,042 | 556.4 | % | ||||||
| Operating Expenses: | |||||||||||
| Selling and Marketing Expenses | 255,848 | 113,267 | 142,581 | 125.9 | % | ||||||
| General and Administrative Expenses | 949,694 | 438,574 | 511,120 | 116.5 | % | ||||||
| Research and Development | — | 10,560 | (10,560 | ) | (100.0 | )% | |||||
| Total Operating Expenses | 1,205,542 | 562,401 | 643,141 | 114.4 | % | ||||||
| Other Expenses | 113,778 | 28,474 | 85,304 | 299.6 | % | ||||||
| Income (Loss) before Provision for Income Taxes | 131,572 | (204,263 | ) | 335,835 | (164.4 | )% |
Revenues in Segment 3 were $6,250,106 for the three months ended June 30, 2012, an increase of $5,132,322, or 459.2%, from $1,117,784 in the same quarter of 2011. The increase was mainly due to the Qatar project, the Canadian project and the Mexican project.
Cost of revenues for the second quarter was $4,799,214, an increase of $4,068,042, or 556.4%, from $731,172 in the second quarter of 2011. The increase was in line with the revenue increase.
Total operating expenses were $1,205,542, an increase of $643,141, or 114.4%, from $562,401 in the second quarter of 2011. Selling and marketing expenses increased by $142,581 compared to the second quarter of 2011. General and administrative expenses increased from $438,574 in the second quarter of 2011 to $949,694, an increase of $511,120, or 116.5%. The increase mainly came from project implementation, including the Xushui project.
Income before provision for income taxes for the second quarter 2012 was $131,572, compared to a loss before provision for income taxes of $204,263 for the same period of 2011, an increase of $335,835, or 164.4 %.
The following are the operating results for the six months ended June 30, 2012 and 2011 for Segment 3:
Six months ended June 30,
| 2012 ($) | 2011($) | Change ($) | Change (%) | |||||||||
| Revenues | 10,809,855 | 4,125,550 | 6,684,305 | 162.0 | % | |||||||
| Cost of Revenues | 8,357,608 | 2,783,598 | 5,574,010 | 200.2 | % | |||||||
| Operating Expenses: | ||||||||||||
| Selling and Marketing Expenses | 442,925 | 167,655 | 275,270 | 164.2 | % | |||||||
| General and Administrative Expenses | 1,650,345 | 1,268,991 | 381,354 | 30.1 | % | |||||||
| Research and Development | — | 10,560 | (10,560 | ) | (100.0 | )% | ||||||
| Total Operating Expenses | 2,093,270 | 1,447,206 | 646,064 | 44.6 | % | |||||||
| Other Expenses | 129,372 | 26,823 | 102,549 | 382.3 | % | |||||||
| Income (Loss) before Provision for Income Taxes | 229,605 | (132,077 | ) | 361,682 | (273.8 | )% |
| I-16 |
Revenues in Segment 3 for the six months ended June 30, 2012 were $10,809,855, an increase of 6,684,305, or 162.0%, compared to $4,125,550 in the same period of 2011. The Xushui project was 40% completed by June 30, 2012, which led to recognition of revenue in the amount of $5.0 million.
Cost of revenues for the six months ended June 30, 2012 was $8,357,608, an increase of $5,574,010, or 200.2%, compared with $2,783,598 for the same period last year. The six-month gross margin for this segment was 22.7% compared to 32.5% for the same period last year, due to the lower gross margin of Xushui projects.
Total operating expenses for the six months ended June 30, 2012 were $2,093,270, an increase of $646,064 compared to $1,447,206 for the six months ended June 30, 2011. Selling and marketing expenses increased by $275,270, compared to the six months ended June 30, 2011. General and administrative expenses were $1,650,345, an increase of $381,354 compared to $1,268,991 for the six months ended June 30, 2011. These increases were mainly due to increases in headcount and compensation, rent, professional fees and amortization of intangible assets.
Other expenses in Segment 3 increased from $26,823 for the six months ended June 30, 2011 to $129,372 for the same period of 2012, an increase of $102,549, or 382.3%, mainly due to the growing interest expenses from bank borrowings.
Income before provision for income taxes was $229,605 for the six months ended June 30, 2012, an increase of $361,682, or 273.8%, compared with a loss of $132,077 in the same period of 2011.
Assets attributable to each segment as of June 30, 2012 and 2011 are shown below:
| Segment 1 | Segment 2 | Segment 3 | Total | |||||||||||||
| As of June 30, 2012 | $ | 87,289,312 | $ | 38,127,464 | $ | 28,945,358 | $ | 154,362,134 | ||||||||
| As of December 31, 2011 | $ | 84,910,147 | $ | 26,081,474 | $ | 27,659,057 | $ | 138,650,678 | ||||||||
Contractual Obligations and Commercial Commitments
Operating Leases
As of June 30, 2012, we had commitments under certain operating leases, which require annual minimum rental payments as follows:
| For the Years Ended December 31, | Amount | |||
| 2012 | $ | 618,614 | ||
| 2013 | 852,341 | |||
| 2014 | 518,550 | |||
| 2015 | 92,345 | |||
| Total | $ | 2,081,850 | ||
Our leased properties are principally located in Beijing and are used for administration and research and development purposes. The terms of these operating leases vary from one to five years. Pursuant to the lease terms, when the contracts expire, we have the right to extend them with new negotiated prices. The leases are renewable subject to negotiation. Rental expenses were $279,806 and $176,326 for the quarters ended June 30, 2012 and 2011, respectively, and $527,317 and $359,613 for the six-month period ended June 30, 2012 and 2011, respectively.
Product Warranties
Our warranty policy generally is to replace parts at no additional charge if they become defective within one year after deployment. Historically, failure of product parts due to materials used or workmanship has not been significant. We have not incurred any material unexpected costs associated with servicing warranties. We continuously evaluate and estimate our potential warranty obligations, and record the related warranty obligation when the estimated amount becomes material at the time revenue is recorded.
Capital Expenditures
In the past, the capital expenditures were mainly for purchases of computers and other office equipment to support our daily business activities. Our capital expenditures will increase in the near term as our business continues to grow and as the construction of our research and development facilities in Tianjin progresses. The construction of the research and development center consists of three phases. Phase one has been completed. Completion of phases two and three of the construction are planned towards the end of 2013. The total capital investment is expected to be $20 million.
| I-17 |
Seasonality
The Company’s operating revenues normally tend to fluctuate due to different project stages and U.S. GAAP requirements on revenue recognition. As the scope of our business extended to the civil construction activities, certain destructive weather conditions that tend to occur during the winter often impact the progress of our projects. Certain weather conditions, including severe winter storms, may result in the temporary suspension of outdoor operations, which can significantly affect the operating results of the affected regions.
Off-Balance Sheet Arrangements
We did not have any off-balance sheet arrangements for the three and six months ended June 30, 2012 or 2011.
Taxation
Pursuant to the new EIT Law and supplementary regulations, only high-tech companies that have been re-certified as such under the new criteria are granted the preferential enterprise income tax rate of 15%. TTB received a preferential income tax rate of 7.5% from January 1, 2009 to December 31, 2011, after which the EIT rate became 15% as TTB continues to qualify as a high-tech company.
Sales tax varies from 3% to 5% depending on the nature of the revenue, and VAT is 17%. For revenues generated from those parts of our software solutions which are recognized by and registered with government authorities and meet government authorities’ requirements to be treated as software products, we are entitled to receive a refund of 14% on the total VAT paid at a rate of 17%. Revenues from software products other than the above are subject to full VAT at 17%. In addition, we are currently exempted from sales tax for revenues generated from development and transfer of tailor-made software solutions for clients. Further, revenues from consulting services are subject to a 5% sales tax. Qualified to issue VAT invoices, we need to maintain a certain amount of revenue that is taxable by VAT. As such, we may have to refuse some of the tax exemption benefits in our tailor-made software development business and pay VAT for those parts of the revenue in order to maintain minimum VAT revenue thresholds. This practice may cease to apply if more of the software products become recognized and registered as software products in the PRC.
Significant Accounting Policies
Estimates and Assumptions
The preparation of financial statements requires management to make numerous estimates and assumptions that affect the amounts reported in the consolidated financial statements and accompanying notes. Changes in these estimates and assumptions may have financial impacts on recognition and disclosure of assets, liabilities, equity, revenues and expenses. However, we believe that these estimates used in preparing our financial statements are based on our best professional judgment, and are reasonable and prudent.
The most complex and subjective estimates and assumptions that present the greatest amount of uncertainty relate to the recognition of revenue under the percentage of completion method recording, business combination, the allowance for doubtful accounts, long term contract collectability, impairment of fixed assets and intangible assets, and income tax. We evaluate all of these estimates and judgments on an on-going basis. Below are the most critical estimates and assumptions we make in preparing the consolidated financial statements.
Revenue Recognition
Our revenues consist primarily of three categories: (i) System Integration, (ii) Hardware Product Sales, and (iii) Software Product Sales. The Company recognizes revenue when the consideration to be received is fixed or determinable, products delivered, or services rendered, and collectability ensured.
For system integration, sales contracts are structured with fixed price. The contract periods range from two months to approximately three years in length. We recognize revenue of these contracts following the percentage-of-completion method, measured by different stages in accordance with ASC 605-35, “Construction-Type and Production-Type Contracts.” Only if the actual implementation status meets the established stages of completion will we recognize the relevant portion of the revenue. There are four major stages for the system integration revenue recognition: (a) the completion of project design, (b) the delivery of products, (c) the completion of debugging, and (d) inspection and acceptance.
| I-18 |
For hardware product sales, we recognize revenue only when all products are delivered and the acceptance confirmations are signed by the customers, according to ASC 605-10, “Revenue Recognition.” We are not obligated for any repurchase or return of the goods.
We also sell software products. These software product sales do not include any additional services such as maintenance or technical support. We recognize revenue under ASC 985-605, “Software Revenue Recognition” according to the acceptance of delivery revenue recognition method. At the end of each reporting period, we recognize the contract amount as revenue only if all software products have been delivered and the customer acceptance confirmation has been signed.
If unapproved change orders or claims occur in the future, in accounting for contracts, we follow paragraphs 30 and 31 of ASC 605-35-25, “Construction-Type and Production-Type Contracts.” We recognize revenue from unapproved change orders or claims only to the extent that contract costs relating to the unapproved change orders or claims have been incurred, and only if it is probable that such unapproved change orders or claims will result in additional contract revenue and the amount of such additional revenue can be reliably estimated. To date, we have not experienced any unapproved change orders in our ordinary business operation.
We present all sales revenue net of VAT. Our products sold in China are generally subject to Chinese VAT of 17% of the sales price, except for certain proprietary software sales which will only be subject to an effective tax rate of 3%. The VAT payable may be offset by VAT paid by us on purchased raw materials and other materials included in the cost of projects or producing the finished product.
We record revenue in excess of billings as “unbilled revenue”. For revenues accounted for under this account, we expect the amounts to be collected within one year. For those with collection periods in excess of one year, we classify them under “long-term unbilled revenue” on the consolidated balance sheets.
The Company obtained several contracts with a billing cycle of over three years in the past two years. The discounted revenues from those contracts are recorded and the discount rate is the 3-year nominal interest rate of 5.4%, set by the People’s Bank of China, China’s central bank. For the contract where a discount rate is specified, such specified rate is applied. These projects are funded by local governments with central government project appropriations, so the Company does not ascribe any collection risk on such projects.
Accounts Receivable
Given the characteristics of the clientele, we are confident that our accounts receivable are of good quality even though our accounts receivable days are relatively long compared with companies in other industries. Our finance team is constantly monitoring the accounts receivable quality and the process and assumptions used in bad debt provision. In case of any event that indicates accounts receivable quality deterioration, management will reassess the bad debt provision within the period such event occurs.
We recognize accounts receivable initially at fair value less an allowance for doubtful accounts. We make an allowance for doubtful accounts based on the aging of accounts receivable and on any specifically identified accounts receivable that may become uncollectible. We maintain allowances for doubtful accounts for estimated losses resulting from the failure of customers to make required payments in the relevant time periods. We review the accounts receivable on a periodic basis and make general and specific allowances when there is doubt as to the collectability of individual balances. In evaluating the collectability of individual receivable balances, we consider many factors, including the age of the balance, the customer’s historical payment history and current credit-worthiness and current economic trends. The amount of the provision, if any, is recognized in the consolidated statement of operations within “general and administrative expenses.”
While the collection period for some of the long-term contracts, such as the build-and-transfer projects, can be as long as two years, given that our clients are primarily government agencies supported by provincial budgets and large state-owned enterprises with sufficient liquidity, we believe the collectability of accounts receivable is secure, long-term or short-term.
Impairment of Assets and Intangible Assets
We monitor the carrying value of our long-lived assets for potential impairment whenever events or changes in circumstances indicate that their carrying amounts may not be recoverable. To the extent the estimated undiscounted future cash inflows attributable to the asset, less estimated undiscounted future cash outflows, are less than the carrying amount, we recognize an impairment loss in an amount equal to the difference between the carrying value of such assets and fair value. No impairment indicator is noted in the prior or current periods.
We evaluate the periods of depreciation and amortization to determine whether subsequent events and circumstances warrant revised estimates of useful lives. Estimating future cash flows require significant judgment, and projections may vary from the cash flows eventually realized which could impact our ability to accurately assess whether an asset has been impaired.
| I-19 |
For goodwill, we assess for impairment at period end or whenever events or changes indicate that, more likely than not, the carrying value of goodwill has been impaired. We use the income approach to estimate the fair value of the goodwill. The income approach is based on the long-term projected future cash flows of the operating segments. We discount the estimated cash flows to present value using a weighted-average cost of capital that considers factors such as the timing of the cash flows and the risks inherent in those cash flows. We believe that this approach is the most reasonable because it provides a fair value estimate based upon the operating segments’ expected long-term performance considering the economic and market conditions that generally affect our business.
| Item 3. | Quantitative and Qualitative Disclosures about Market Risk |
Not applicable.
| Item 4. | Controls and Procedures |
Disclosure Controls and Procedures
As of June 30, 2012, the Company carried out an evaluation, under the supervision of and with the participation of management, including the Company’s chief executive officer and chief financial officer, of the effectiveness of the design and operation of the Company’s disclosure controls and procedures. Based on the foregoing, the chief executive officer and chief financial officer concluded that the Company’s disclosure controls and procedures (as defined in Rules 13a-15(e) and 15d-15(e) under the Securities Exchange Act of 1934) were effective.
Changes in Internal Control over Financial Reporting
There were no changes in the Company’s internal control over financial reporting (as defined in Rule 13a-15(f) of the Securities Exchange Act of 1934) during the three month ended June 30, 2012 that have materially affected, or are reasonably likely to materially affect, the Company’s internal control over financial reporting.
| I-20 |
PART II. OTHER INFORMATION
| Item 1. | Legal Proceedings |
None.
| Item 1A. | Risk Factors |
Not applicable.
| Item 2. | Unregistered Sales of Equity Securities and Use of Proceeds |
| (a) | None. |
| (b) | The section entitled “Use of Proceeds” from the registration statement filed on January 8, 2010, as amended (the “Registration Statement”) is incorporated herein by reference. The effective date of the Registration Statement is April 14, 2010, and the Commission file number assigned to the Registration Statement is 333-164273. The Registration Statement registers the offering of up to 2,366,833 ordinary shares (subject to amendment in accordance with the Securities Act of 1933 and the rules and regulations promulgated thereunder) (the “Offering”). As of June 30, 2012, the Company has spent proceeds from the Offering in accordance with the following chart: |
| Description of Use | Proposed Expenditure Amount | ActualExpenditures Through June 30, 2012 | ||||||||||
| Working Capital | $ | 18,973,000 | $ | 18,973,000 | 100.00 | % | ||||||
| Mergers & Acquisitions | 6,120,000 | 3,520,858 | 57.53 | % | ||||||||
| New Product Development | 3,366,000 | 2,738,678 | 81.36 | % | ||||||||
| Sales & Marketing | 2,142,000 | 2,142,000 | 100.00 | % | ||||||||
| Total | $ | 30,601,000 | $ | 27,374,536 | 89.46 | % | ||||||
(c) None.
| Item 3. | Defaults Upon Senior Securities |
None.
| Item 4. | Mine Safety Disclosures. |
Not applicable.
| Item 5. | Other Information |
None.
| Item 6. | Exhibits |
The following exhibits are filed herewith:
| Exhibit | ||
| Number | Document | |
| 3(i).1 | Amended and Restated Articles of Association of the Registrant (1) | |
| 3(ii).1 | Amended and Restated Memorandum of Association of the Registrant (1) | |
| 4.1 | Specimen Share Certificate (1) | |
| 10.1 | Translation of Form of Employment Agreement between Registrant and Executive Officer of the Registrant (1) | |
| 10.2 | Translation of Exclusive Technical and Consulting Service Agreement for Tranhold (1) |
| II-1 |
| 10.3 | Translation of Management Fee Payment Agreement for Tranhold (1) | |
| 10.4 | Translation of Proxy Agreement for Tranhold (1) | |
| 10.5 | Translation of Equity Interest Pledge Agreement for Tranhold (1) | |
| 10.6 | Translation of Exclusive Equity Interest Purchase Agreement for Tranhold (1) | |
| 10.7 | Translation of Exclusive Technical and Consulting Service Agreement for Yanyu (1) | |
| 10.8 | Translation of Management Fee Payment Agreement for Yanyu (1) | |
| 10.9 | Translation of Proxy Agreement for Yanyu (1) | |
| 10.10 | Translation of Equity Interest Pledge Agreement for Yanyu (1) | |
| 10.11 | Translation of Exclusive Equity Interest Purchase Agreement for Yanyu (1) | |
| 10.14 | Translation of Operating Agreement for Yanyu (1) | |
| 10.15 | Translation of Operating Agreement for Tranhold (1) | |
| 10.16 | Translation of Exclusive Technical and Consulting Service Agreement for BSST (2) | |
| 10.17 | Translation of Management Fee Payment Agreement for BSST (2) | |
| 10.18 | Translation of Operating Agreement for BSST (2) | |
| 10.19 | Translation of Equity Interest Pledge Agreement for BSST (2) | |
| 10.20 | Translation of Exclusive Equity Interest Purchase Agreement for BSST (2) | |
| 10.21 | Translation of Proxy Agreement for BSST (2) | |
| 10.22 | 2011 Stock Option Plan (3) | |
| 21.1 | Subsidiaries of the Registrant (5) | |
| 31.1 | Certifications pursuant to Rule 13a-14(a) or 15(d)-14(a) under the Securities Exchange Act of 1934, as amended, as adopted pursuant to Section 302 of the Sarbanes-Oxley Act of 2002 (6) | |
| 31.2 | Certifications pursuant to Rule 13a-14(a) or 15(d)-14(a) under the Securities Exchange Act of 1934, as amended, as adopted pursuant to Section 302 of the Sarbanes-Oxley Act of 2002 (6) | |
| 32.1 | Certifications pursuant to 18 U.S.C. Section 1350, as adopted pursuant to Section 906 of the Sarbanes-Oxley Act of 2002 (6) | |
| 32.2 | Certifications pursuant to 18 U.S.C. Section 1350, as adopted pursuant to Section 906 of the Sarbanes-Oxley Act of 2002 (6) | |
| 99.2 | Audit Committee Charter (7) | |
| 101.INS | XBRL Instance Document (8) | |
| 101.SCH | XBRL Taxonomy Extension Schema Document (8) | |
| 101.CAL | XBRL Taxonomy Extension Calculation Linkbase Document (8) | |
| 101.LAB | XBRL Taxonomy Extension Label Linkbase Document (8) | |
| 101.PRE | XBRL Taxonomy Extension Presentation Linkbase Document (8) |
| II-2 |
| 101.DEF | XBRL Taxonomy Extension Definition Linkbase Document (8) |
| (1) | Incorporated by reference to the registrant’s registration statement on Form S-1, File no. 333-158393, filed on April 3, 2009, as amended. |
| (2) | Incorporated by reference to the registrant’s Form 10-K, SEC Accession No. 0001193125-11-080197, filed on March 29, 2011. |
| (3) | Incorporated by reference to the registrant’s Form 10-K, SEC Accession No. 0001144204-12-017170, filed on March 26, 2012. |
| (4) | Incorporated by reference to the registrant’s Form 10-Q, SEC Accession No. 0001144204-11-064756, filed on November 15, 2011. |
| (5) | Incorporated by reference to the registrant’s Form 10-Q, SEC Accession No. 0001144204-12-028710, filed on May 15, 2012. |
| (6) | Filed herewith. |
| (7) | Incorporated by reference to the registrant’s Form 10-K, SEC Accession No. 0001193125-10-065797, filed on March 24, 2010. |
| (8) | Furnished herewith. In accordance with Rule 406T of Regulation S-T, the information in these exhibits shall not be deemed to be “filed” for purposes of Section 18 of the Securities Exchange Act of 1934, as amended, or otherwise subject to liability under that section, and shall not be incorporated by reference into any registration statement or other document filed under the Securities Act of 1933, as amended, except as expressly set forth by specific reference in such filing. |
| II-3 |
SIGNATURE
In accordance with the requirements of the Exchange Act, the registrant caused this report to be signed on its behalf by the undersigned, thereunto duly authorized.
| Tri-Tech Holding Inc. | ||
| August 14, 2012 | By: | /s/ Peter Dong |
| Peter Dong | ||
| Chief Financial Officer | ||
| (Principal Financial and Accounting Officer) and | ||
| Duly Authorized Officer |
TRI-TECH HOLDING INC. AND SUBSIDIARIES
Consolidated Financial Statements
For the quarters ended June 30, 2012 and 2011
TRI-TECH HOLDING INC. AND SUBSIDIARIES
Index to Financial Statements
| Page | |||
| CONSOLIDATED BALANCE SHEETS | F-1 | ||
| CONSOLIDATED STATEMENTS OF INCOME AND COMPREHENSIVE INCOME | F-2 – F-3 | ||
| CONSOLIDATED STATEMENTS OF CASH FLOWS | F-4 | ||
| NOTES TO CONSOLIDATED FINANCIAL STATEMENTS | F-5 – F-29 |
TRI-TECH HOLDING INC. AND SUBSIDIARIES
CONSOLIDATED BALANCE SHEETS
| June 30, 2012 | December 31, | |||||||
| (Unaudited) | 2011 | |||||||
| ASSETS | ||||||||
| Current assets | ||||||||
| Cash | $ | 9,562,563 | $ | 11,935,746 | ||||
| Restricted cash | 1,723,780 | 2,087,920 | ||||||
| Accounts and notes receivable, net of allowance for doubtful accounts of $859,405 and $619,062 as of June 30, 2012 and December 31, 2011, respectively | 23,040,575 | 19,888,084 | ||||||
| Unbilled revenue | 21,011,695 | 7,254,830 | ||||||
| Other receivables | 4,183,816 | 2,761,548 | ||||||
| Inventories | 6,516,162 | 7,705,752 | ||||||
| Deposits on projects | 1,053,579 | 1,212,691 | ||||||
| Prepayments to suppliers and subcontractors | 8,654,805 | 4,908,697 | ||||||
| Total current assets | 75,746,975 | 57,755,268 | ||||||
| Long-term unbilled revenue | 57,183,407 | 59,298,740 | ||||||
| Plant and equipment, net | 1,542,846 | 1,436,838 | ||||||
| Construction in progress | 4,713,277 | 4,566,934 | ||||||
| Intangible assets, net | 11,179,975 | 11,609,662 | ||||||
| Long-term restricted cash | 2,554,376 | 2,541,958 | ||||||
| Goodwill | 1,441,278 | 1,441,278 | ||||||
| Total Assets | $ | 154,362,134 | $ | 138,650,678 | ||||
| LIABILITIES AND EQUITY | ||||||||
| Current liabilities | ||||||||
| Accounts payable | $ | 8,049,201 | $ | 11,401,187 | ||||
| VIE notes payable | 302,313 | 1,176,197 | ||||||
| Costs accrual on projects | 23,860,658 | 19,402,047 | ||||||
| Advance from customers | 3,144,861 | 1,886,607 | ||||||
| Other payables | 1,828,578 | 1,659,532 | ||||||
| Amount due to noncontrolling interest investor | 7,247,545 | 6,057,250 | ||||||
| Other taxes payable | 5,551,460 | 3,067,350 | ||||||
| Accrued liabilities | 418,103 | 379,357 | ||||||
| Payable on investment consideration | 582,966 | 895,000 | ||||||
| Income taxes payable | 73,337 | 154,519 | ||||||
| Deferred income taxes | 1,021,991 | 358,519 | ||||||
| Short-term bank borrowing (including VIE short-term borrowing of the consolidated VIEs without recourse to Tri-Tech Holdings of $3,678,103 and $2,296,895 as of June 30, 2012 and December 31, 2011, respectively) | 14,745,472 | 8,010,365 | ||||||
| Total current liabilities | 66,826,485 | 54,447,930 | ||||||
| Long-term bank borrowing | 20,406 | — | ||||||
| Noncurrent deferred income taxes | 3,264,929 | 3,455,823 | ||||||
| Total Liabilities | 70,111,820 | 57,903,753 | ||||||
| Equity | ||||||||
| Tri-Tech Holding Inc. shareholders' equity | ||||||||
| Ordinary shares ($0.001 par value, 30,000,000 shares authorized; 8,233,506 and 8,203,299 shares issued as of June 30, 2012 and December 31, 2011, respectively) | 8,233 | 8,203 | ||||||
| Additional paid-in-capital | 49,532,740 | 48,772,307 | ||||||
| Statutory reserves | 1,866,994 | 1,866,994 | ||||||
| Retained earnings | 22,491,398 | 19,682,386 | ||||||
| Treasury shares (21,100 shares in treasury as of June 30, 2012 and December 31, 2011, respectively) | (193,750 | ) | (193,750 | ) | ||||
| Accumulated other comprehensive income | 4,682,402 | 4,593,046 | ||||||
| Total Tri-Tech Holding Inc. shareholders' equity | 78,388,017 | 74,729,186 | ||||||
| Noncontrolling interests | 5,862,297 | 6,017,739 | ||||||
| Total shareholders' equity | 84,250,314 | 80,746,925 | ||||||
| Total liabilities and equity | $ | 154,362,134 | $ | 138,650,678 | ||||
See notes to consolidated financial statements
| F-1 |
TRI-TECH HOLDING INC. AND SUBSIDIARIES
CONSOLIDATED STATEMENTS OF INCOME AND COMPREHENSIVE INCOME
| For The Three Months Ended June 30, | ||||||||
| 2012 | 2011 | |||||||
| (Unaudited) | (Unaudited) | |||||||
| Revenues: | ||||||||
| System integration | $ | 21,741,770 | $ | 19,883,553 | ||||
| Hardware products | 1,298,764 | 318,334 | ||||||
| Total revenues | 23,040,534 | 20,201,887 | ||||||
| Cost of revenues | ||||||||
| System integration | 16,608,958 | 14,622,576 | ||||||
| Hardware products | 607,510 | 275,093 | ||||||
| Total cost of revenues | 17,216,468 | 14,897,669 | ||||||
| Gross profit | 5,824,066 | 5,304,218 | ||||||
| Operating expenses: | ||||||||
| Selling and marketing expenses | 935,853 | 472,150 | ||||||
| General and administrative expenses | 3,247,546 | 1,882,432 | ||||||
| Research and development expenses | 11,528 | 26,759 | ||||||
| Total operating expenses | 4,194,927 | 2,381,341 | ||||||
| Income from operations | 1,629,139 | 2,922,877 | ||||||
| Other expense: | ||||||||
| Other income (expense) | 410,889 | (132,558 | ) | |||||
| Interest income | 40,770 | 46,446 | ||||||
| Interest expense | (559,158 | ) | (6,955 | ) | ||||
| Investment gain | 73,149 | — | ||||||
| Total other expenses | (34,350 | ) | (93,067 | ) | ||||
| Income before provision for income taxes | 1,594,789 | 2,829,810 | ||||||
| Provision for income taxes | 287,062 | 439,423 | ||||||
| Net income | 1,307,727 | 2,390,387 | ||||||
| Less: Net (loss) income attributable to noncontrolling interests | (63,160 | ) | 628,699 | |||||
| Net income attributable to Tri-Tech Holding Inc. shareholders | $ | 1,370,887 | $ | 1,761,688 | ||||
| Net income | 1,307,727 | 2,390,387 | ||||||
| Other comprehensive income | ||||||||
| Foreign currency translation adjustment | 95,884 | 833,706 | ||||||
| Comprehensive income | 1,403,611 | 3,224,093 | ||||||
| Less: Comprehensive income attributable to noncontrolling interests | (56,632 | ) | 721,172 | |||||
| Comprehensive income attributable to Tri-Tech Holding Inc. | $ | 1,460,243 | $ | 2,502,921 | ||||
| Net income attributable to Tri-Tech Holding Inc. shareholders per share are: | ||||||||
| Basic | $ | 0.17 | $ | 0.22 | ||||
| Diluted | $ | 0.17 | $ | 0.21 | ||||
| Weighted average number of ordinary shares outstanding: | ||||||||
| Basic | 8,207,427 | 8,133,130 | ||||||
| Diluted | 8,207,427 | 8,202,784 | ||||||
See notes to consolidated financial statements
| F-2 |
TRI-TECH HOLDING INC. AND SUBSIDIARIES
CONSOLIDATED STATEMENTS OF INCOME AND COMPREHENSIVE INCOME
| For The Six Months Ended June 30, | ||||||||
| 2012 | 2011 | |||||||
| (Unaudited) | (Unaudited) | |||||||
| Revenues: | ||||||||
| System integration | $ | 40,274,432 | $ | 35,754,047 | ||||
| Hardware products | 1,987,414 | 2,001,051 | ||||||
| Total revenues | 42,261,846 | 37,755,098 | ||||||
| Cost of revenues | ||||||||
| System integration | 30,193,175 | 26,273,325 | ||||||
| Hardware products | 1,027,105 | 1,167,375 | ||||||
| Total cost of revenues | 31,220,280 | 27,440,700 | ||||||
| Gross profit | 11,041,566 | 10,314,398 | ||||||
| Operating expenses: | ||||||||
| Selling and marketing expenses | 1,774,846 | 786,323 | ||||||
| General and administrative expenses | 6,100,906 | 3,949,226 | ||||||
| Research and development expenses | 80,398 | 66,744 | ||||||
| Total operating expenses | 7,956,150 | 4,802,293 | ||||||
| Income from operations | 3,085,416 | 5,512,105 | ||||||
| Other income (expenses): | ||||||||
| Other income (expense) | 1,083,384 | (150,787 | ) | |||||
| Interest income | 82,544 | 60,608 | ||||||
| Interest expense | (994,931 | ) | (6,955 | ) | ||||
| Investment gain | 78,558 | — | ||||||
| Fair value change on contingent investment consideration | 7,000 | — | ||||||
| Total other income (expenses), net | 256,555 | (97,134 | ) | |||||
| Income before provision for income taxes | 3,341,971 | 5,414,971 | ||||||
| Provision for income taxes | 601,555 | 845,059 | ||||||
| Net income | 2,740,416 | 4,569,912 | ||||||
| Less: Net (loss) income attributable to noncontrolling interests | (68,596 | ) | 1,109,243 | |||||
| Net income attributable to Tri-Tech Holding Inc. shareholders | $ | 2,809,012 | $ | 3,460,669 | ||||
| Net income | 2,740,416 | 4,569,912 | ||||||
| Other comprehensive income | ||||||||
| Foreign currency translation adjustment | 289,237 | 1,347,203 | ||||||
| Comprehensive income | 3,029,653 | 5,917,115 | ||||||
| Less: Comprehensive income attributable to noncontrolling interests | (48,203 | ) | 1,175,406 | |||||
| Comprehensive income attributable to Tri-Tech Holding Inc. | $ | 3,077,856 | $ | 4,741,709 | ||||
| Net income attributable to Tri-Tech Holding Inc. shareholders per share: | ||||||||
| Basic | $ | 0.34 | $ | 0.43 | ||||
| Diluted | $ | 0.34 | $ | 0.42 | ||||
| Weighted average number of ordinary shares outstanding: | ||||||||
| Basic | 8,194,813 | 8,094,639 | ||||||
| Diluted | 8,194,813 | 8,164,293 | ||||||
See notes to consolidated financial statement
| F-3 |
TRI-TECH HOLDING INC. AND SUBSIDIARIES
CONSOLIDATED STATEMENTS OF CASH FLOWS
| For The Six Months Ended June 30, | ||||||||
| 2012 | 2011 | |||||||
| (Unaudited) | (Unaudited) | |||||||
| Cash flows from operating activities: | ||||||||
| Net income | $ | 2,740,416 | $ | 4,569,912 | ||||
| Adjustments to reconcile net income to net cash used in operating activities: | ||||||||
| Amortization of option share-based compensation | 530,588 | 183,977 | ||||||
| Amortization of warrants share-based payments | — | 30,327 | ||||||
| Depreciation and amortization | 582,513 | 385,846 | ||||||
| Provision for doubtful accounts | 243,367 | 183,428 | ||||||
| Fair value change on contingent investment consideration | (7,000 | ) | — | |||||
| Gain on investment in joint venture | (78,558 | ) | — | |||||
| Deferred income taxes | 472,578 | 363,266 | ||||||
| Changes in operating assets and liabilities: | ||||||||
| Accounts and notes receivable | (3,492,534 | ) | 3,720,721 | |||||
| Unbilled revenue | (11,925,515 | ) | (28,535,572 | ) | ||||
| Other receivables | (907,482 | ) | (663,056 | ) | ||||
| Inventories | 1,164,228 | (1,543,043 | ) | |||||
| Prepaid expenses | (145,032 | ) | — | |||||
| Prepayments | (3,513,501 | ) | (2,590,183 | ) | ||||
| Accounts payable | (3,495,129 | ) | 553,880 | |||||
| Notes payable | (871,833 | ) | — | |||||
| Cost accrual on projects | 4,560,906 | 7,827,724 | ||||||
| Customer deposits | 1,392,326 | 963,528 | ||||||
| Other payables | 2,336,813 | 2,829,968 | ||||||
| Other taxes payable | 2,248,544 | 591,346 | ||||||
| Accrued liabilities | (67,136 | ) | (54,171 | ) | ||||
| Taxes payable | (66,531 | ) | 796,405 | |||||
| Net cash used in operating activities | (8,297,972 | ) | (10,385,697 | ) | ||||
| Cash flows from investing activities: | ||||||||
| Restricted cash | 348,969 | (541,012 | ) | |||||
| Payment in business acquisition | (35,273 | ) | (488,000 | ) | ||||
| Cash acquired from business acquisition. | 31,336 | — | ||||||
| Payable on investment consideration | (75,159 | ) | — | |||||
| Payment to purchase plant and equipment | (205,204 | ) | (67,962 | ) | ||||
| Payment to purchase intangible assets | (36,970 | ) | (164,952 | ) | ||||
| Addition of construction in progress | (164,126 | ) | (241,612 | ) | ||||
| Collection of loan to third-party companies | 665,885 | — | ||||||
| Payment of loan to third-party companies | (423,069 | ) | (1,411,411 | ) | ||||
| Net cash provided by (used in) investing activities | 106,389 | (2,914,949 | ) | |||||
| Cash flows from financing activities: | ||||||||
| Proceeds from exercising options into ordinary shares | — | 454,009 | ||||||
| Proceeds from bank borrowing | 8,538,745 | 540,825 | ||||||
| Payment of bank borrowing | (1,753,987 | ) | — | |||||
| Capital injection by minority shareholder | — | 1,545,213 | ||||||
| Payment of installment of purchasing vehicle | — | (15,344 | ) | |||||
| Proceeds from loan from third-party companies | 215,620 | — | ||||||
| Payment of loan from third-party companies | (379,499 | ) | — | |||||
| Proceeds from amount due to noncontrolling interest investor | 776,865 | — | ||||||
| Payment of amount due to noncontrolling interest investor | (1,988,141 | ) | — | |||||
| Net cash provided by financing activities | 5,409,603 | 2,524,703 | ||||||
| Effect of exchange rate fluctuation on cash and cash equivalents | 408,797 | 499,908 | ||||||
| Net decrease in cash and cash equivalents | (2,373,183 | ) | (10,276,035 | ) | ||||
| Cash and cash equivalents, beginning of period | $ | 11,935,746 | $ | 23,394,995 | ||||
| Cash and cash equivalents, end of period | $ | 9,562,563 | $ | 13,118,960 | ||||
| Supplemental disclosure of cash flow information: | ||||||||
| Income taxes paid | $ | 154,361 | $ | 93,040 | ||||
| Interest paid on debt | $ | 386,107 | $ | 6,955 | ||||
| Supplemental disclosure of noncash investing activity: | ||||||||
| Addition in land use right by transferring from long-term prepayment | $ | — | $ | 5,547,907 | ||||
| Payable to purchase intangible assets during the business combination | $ | — | $ | 735,000 | ||||
| Issued 30,207 and 35,974 ordinary shares as one of the consideration in business combination | $ | 229,875 | $ | 277,000 | ||||
| Fair value change on contingent consideration payable | $ | 7,000 | $ | — | ||||
| Gain on long-term investment to India Joint Venture | $ | 78,558 | $ | — | ||||
See notes to consolidated financial statement
| F-4 |
| 1. | Company Background |
Tri-Tech Holding Inc. (“TRIT”), incorporated in the Cayman Islands, through its subsidiaries and contractually-controlled variable interest entities (“VIE”) (collectively the “Company”), provides self-manufactured, proprietary or third-party products, system integration and other services in the following three segments: Water, Wastewater Treatment and Municipal Infrastructure, Water Resource Management System and Engineering Service, and Industrial Pollution Control and Safety.
TRIT currently has twelve subsidiaries and VIEs: (1) Tri-Tech International Investment, Inc. (“TTII”), (2) Tri-Tech (Beijing) Co., Ltd. (“TTB”), (3) Beijing Satellite Science & Technology Co. (“BSST”), (4) Tianjin Baoding Environmental Technology Co., Ltd. (“Baoding”), (5) Tranhold Environmental (Beijing) Tech Co., Ltd. (“Tranhold”), (6) Beijing Yanyu Water Tech Co., Ltd. (“Yanyu”), (7) Tri-Tech Infrastructure LLC, a Delaware limited liability company (“TIS”), (8) Ordos Tri-Tech Anguo Investment Co., Ltd. (“TTA”), (9) Beijing Huaxia Yuanjie Water Technology Co., Ltd (“Yuanjie”), (10) Buerjin Tri-Tech Industrial Co. Ltd. (“Buerjin”), (11) Tri-Tech Infrastructure (India) Pvt., Ltd. (“TII”), and (12) Xushui Tri-Tech Sheng Tong Investment Co.,Ltd (“Xushui”). The corporate structure is as follow:
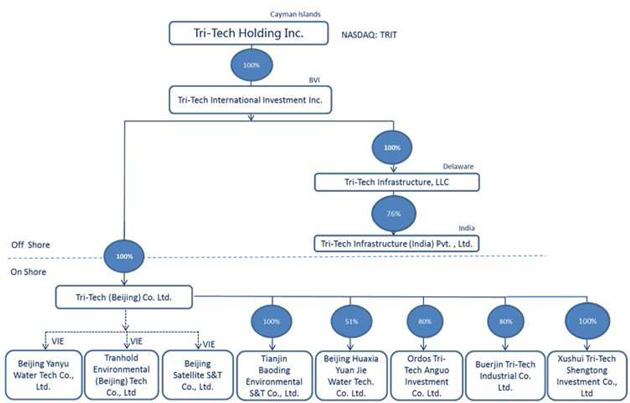
Through a series of contractual agreements entered into in 2008 and 2010, the Company is deemed to be the sole indirect interest holder of Tranhold and BSST, and the indirect interest holder of 92.86% equity ownership in Yanyu. According to the provisions of ASC 810, “Consolidation”, Tranhold, Yanyu and BSST are consolidated in the Company’s financial statements. For BSST, the Company also applied the consolidation procedures required by ASC 805 “Business Combinations”.
To expand its technical and geological market profile, on June 9, 2011, the Company acquired the total operating assets of J&Y International Inc. (“J&Y”), inclusive of its technical know-how, design prints, etc. J&Y subsequently became the J&Y Water Division of the Company’s US subsidiary, TIS, according to the terms. J&Y’s business, including design and production of industrial chemical water recovery, desalination plants, domestic and industrial wastewater treatment systems and reverse osmosis filtration systems, are integrated into that of TIS.
| F-5 |
On June 18, 2011, TTB entered into an investment agreement with Yuanjie and Yuanjie’s original shareholder to increase the capital investment in Yuanjie. The total investment from TTB was RMB10,990,500, or approximately $1,704,085, and TRIT acquired 51% of control over Yuanjie after increasing its capital investment in Yuanjie.
On August 23, 2011, Buerjin was established for projects in the Xinjiang province, especially in Buerjin County. The registered capital amount is RMB10,000,000, or $1,573,589, and RMB6,000,000, or $937,690, has been paid in. The Company has 80% of control over this newly established subsidiary.
On March 8, 2012, Xushui was established in Hebei Province. The registered capital amount is RMB15,000,000, or $2,372,104. TTB has 100% of control over Xushui. RMB3,000,000, or $474,421, has been paid.
On May 19, 2012, TIS increased its equity ownership in TII from 30% to 76%, and became the controlling shareholder. The total investment from TIS was INR 2,217,000, or $55,886. The amount included initial investment of INR300,000 on October 19, 2011, which was adjusted to $20,613 due to the gain of TII from October 19, 2011 to May 19, 2012 and investment consideration of INR1,917,000, or $35,273 on May 19, 2012. TII was established for the purpose to support the India project business.
The Company’s principal geographic market is the People’s Republic of China (“PRC”). As PRC laws and regulations prohibit or restrict non-PRC companies to engage in certain government-related businesses, the Company provides its services in the PRC through Tranhold and Yanyu, both Chinese legal entities holding qualifications and permits necessary to conduct government-related services in the PRC. In order to avoid any restrictions that Tranhold or Yanyu might encounter during future business development, the Company concluded that TTII does not have parent-subsidiary relationship with either Tranhold or Yanyu.
By November 28, 2008, the Company had completed two stages of reorganization. The Company first recalled its shares from the original shareholders of Tranhold and Yanyu. These shareholders are major shareholders, directors, executives, officers and key employees of the Company. From a legal perspective, Tranhold and Yanyu returned to their status prior to the acquisitions in 2007. Concurrently, on November 28, 2008, the Company signed and executed with Tranhold and Yanyu a series of contractual agreements with a 25-year, renewable term. These contractual agreements require the pledge of the original shareholders’ equity interests and share certificates of the VIEs. At any time during the agreement period, the Company has absolute rights to acquire any portion of the equity interests of those VIEs under no-cost conditions. In addition, the Company has absolute rights to appoint directors and officers of those VIEs and to obtain the profits from those VIEs.
| 2. | Summary of Significant Accounting Policies |
Principles of consolidation and basis of presentation
The accompanying consolidated balance sheet as of December 31, 2011, which has been derived from audited financial statements, and the unaudited interim consolidated financial statements as of June 30, 2012 and for the three month and six month periods ended June 30, 2012 and 2011 have been prepared pursuant to the rules and regulations of the Securities and Exchange Commission (the “SEC”). Certain information and footnote disclosures, which are normally included in financial statements prepared in accordance with accounting principles generally accepted in the United States of America, have been condensed or omitted pursuant to such rules and regulations, although we believe that the disclosures made are adequate to provide for fair presentation. The interim financial information should be read in conjunction with the Financial Statements and the notes thereto, included in the Company’s Annual Report on Form 10-K for the fiscal year ended December 31, 2011, previously filed with the SEC.
In the opinion of management, all adjustments (which include normal recurring adjustments) necessary to present a fair statement of the Company’s consolidated financial position as of June 30, 2012, its consolidated results of operations and cash flows for the three month and six month periods ended June 30, 2012 and 2011, as applicable, have been made. The interim results of operations are not necessarily indicative of the operating results for the full fiscal year or any future periods.
The Company compiles its daily financial records in accordance with the generally accepted accounting principles of the PRC (“PRC GAAP”) and converts its financial statements according to accounting principles generally accepted in the United States of America (“US GAAP”) when reporting.
| F-6 |
Use of Estimates
The preparation of financial statements in conformity with US GAAP requires management to make estimates and assumptions that affect the amounts reported in the consolidated financial statements and accompanying notes. Management believes that the estimates used in preparing its financial statements are reasonable and prudent. Actual results could differ from these estimates.
Certain of the Company’s accounting policies require higher degrees of professional judgment than others in their application. These include the recognition of revenue under the percentage of completion method, the allowance for doubtful accounts, long term contract collectability, impairment of fixed assets and intangible assets, income tax and contingent investment payables. Management evaluates all of its estimates and judgments on an on-going basis.
Cash and Cash Equivalents
The Company considers all highly liquid investments with an original maturity of three months or less when purchased to be cash equivalents. Cash equivalents are composed primarily of time deposits and investments in money market accounts and are stated at cost which approximates fair value.
Restricted Cash
The current restricted cash balance at June 30, 2012 and December 31, 2011 was $1,723,780 and $2,087,920, respectively. The long-term restricted cash balance at June 30, 2012 and December 31, 2011 was $2,554,376 and $2,541,958, respectively. The restricted cash was deposited as collateral in exchange of the issuance of letters of credit.
Accounts and Notes Receivable
Accounts and notes receivable are recorded at net realizable value consisting of the carrying amount less an allowance for uncollectible accounts as needed. The allowance for doubtful accounts is the Company’s best estimate of the amount of probable credit losses in the Company’s existing accounts receivable. The Company makes an allowance for doubtful accounts based on the aging of accounts receivable and on any specifically identified accounts receivable that may become uncollectible.
Inventories
The Company values inventory at the lower of cost or net realizable value and determines inventory using the weighted average cost method. Inventory consists of raw materials, finished goods, and work-in-progress, which includes the cost of direct labor, materials and direct overhead costs related to the projects.
Long-term Unbilled Receivables
The Company obtained several Build-Transfer (“BT”) contracts with billing cycles of over three years in recent years. Due to the nature of the BT projects, the related revenue has been discounted and recorded as long-term unbilled receivables and the discount rate is the 3-year nominal interest rate of 5.4%, set by the People’s Bank of China, the PRC’s central bank. For the contract that a specific discount rate is agreed in the contract, that specific rate is applied. These projects are funded by local governments with central government project appropriation, so the Company does not have any collection risk on such projects.
Plant and Equipment
The Company states plant and equipment at cost less accumulated depreciation. The Company computes depreciation using the straight-line method over the estimated useful lives of the assets with a 3%-5% estimated residual value.
Estimated useful lives of the Company’s assets are as follows:
| Asset | Useful Life | |
| Buildings and improvements | 40-50 years | |
| Transportation equipment | 5-10 years | |
| Machinery | 10 years | |
| Office equipment | 5 years | |
| Furniture | 5 years |
| F-7 |
The Company eliminates the cost and related accumulated depreciation of assets sold or otherwise retired from the accounts and includes any gain or loss in the statement of income as an offset or increase to other income (expense) for the period. The Company charges maintenance, repairs and minor renewals directly to expenses as incurred, and capitalize major additions and betterment to buildings and equipment.
Valuation of Long-Lived Assets
The Company reviews the carrying value of its long-lived assets, including plant and equipment, and finite life intangibles whenever events or changes in circumstances indicate that the carrying value may not be recoverable. To the extent the estimated undiscounted future cash inflows attributable to the asset, less estimated undiscounted future cash outflows, are less than the carrying amount, the Company recognizes an impairment loss in an amount equal to the difference between the carrying value of such assets and fair value. No impairment indicator is noted in the prior or current years. The Company reports assets for which there is a committed disposition plan, whether through sale or abandonment, at the lower of carrying value or fair value less costs to sell. No such assets are identified in prior and current years.
The Company evaluates the periods of depreciation and amortization to determine whether subsequent events and circumstances revised estimates of useful lives.
Intangible Assets
The Company amortizes acquired intangible assets with definite lives on a straight-line basis over their expected useful economic lives. The company also performs impairment test if events or changes in circumstances indicate that the assets might be impaired.
| Useful Life | ||
| Proprietary technology relating to sewage, municipal solid waste treatment and tail gas purification | 20 years | |
| Proprietary technology relating to low energy consumption data transmission system | 20 years | |
| Large region environmental management system | 10 years | |
| Mobile web management system | 10 years | |
| Database management system | 10 years | |
| Pollution reduction checking assistant | 10 years | |
| Water pollution control infrastructure | 10 years | |
| Software-gas flow | 20 years | |
| Software-oil mixing | 20 years | |
| Software-crude blending | 10 years | |
| Customer relationship | 5 years | |
| Land use right | 50 years | |
| Know-how | 8-10 years | |
| Contract backlog | 1 year |
| F-8 |
Goodwill
Goodwill represents the excess of the fair value of consideration transferred (plus the fair value of the non-controlling interest, if any) over fair value of the net assets acquired (including recognized intangibles). Goodwill is not amortized; rather, impairment tests are performed at least annually or more frequently if circumstances indicate impairment may have occurred. If impairment exists, goodwill is immediately written down to fair value and the loss is recognized in the consolidated income statements. The Company assesses impairment at period end or whenever events or changes indicate that, more likely than not, the carrying value of goodwill has been impaired. The Company uses the income approach to estimate the fair value of the reporting unit of the goodwill. The income approach is based on the long-term projected future cash flows of the operating segments. The Company discounts the estimated cash flows to present value using a weighted-average cost of capital that considers factors such as the timing of the cash flows and the risks inherent in those cash flows.
Revenue Recognition
The Company’s revenues consist primarily of three categories: (i) System Integration, (ii) Hardware Product Sales, and (iii) Software Product Sales. The Company recognizes revenue when there is evidence of arrangement, the consideration to be received is fixed or determinable, products delivered, or services rendered, and collectability ensured.
For System Integration, sales contracts are usually structured with fixed price or fixed unit price. The contract periods range from two months to approximately three years in length. The Company recognizes revenue from these contracts following the percentage-of-completion method, measured by different stages of completion in accordance with ASC 605-35, “Construction-Type and Production-Type Contracts”. Only if the actual implementation status meets the established stage will the Company recognize the relevant portion of the revenue. There are four major stages for the System Integration revenue recognition: (a) the completion of project design, (b) the delivery of products, (c) the completion of debugging, and (d) inspection and acceptance. For BT projects, such as the Ordos drinking water plant project, the Company recognizes the project revenue using the man-power hours as the measurement for percentage of completion.
Provided unapproved change orders or claims occur in the future, in accounting for contracts, we follow Paragraphs 30 and 31 of ASC 605-35-25, “Construction-Type and Production-Type Contracts”. The Company recognizes revenue from unapproved change orders or claims only to the extent that contract costs relating to the unapproved change orders or claims have been incurred, and only if it is probable that such unapproved change orders or claims will result in additional contract revenue and the amount of such additional revenue can be reliably estimated. Until today, no unapproved change order have been experienced in the ordinary business operation.
For Hardware Product Sales, the Company recognizes the revenue only when all products are delivered and the acceptance confirmations are signed by the customers, according to ASC 605-10, “Revenue Recognition”. The Company is not obligated for any repurchase or return of the goods.
The Company also sells software products. These software product sales do not include any additional services such as maintenance or technical support. The Company recognizes revenue under ASC 985-605, “Software Revenue Recognition” according to acceptance of delivery revenue recognition method. At the end of each reporting period, the Company recognizes the contract amount as revenue only if all software products have been delivered and the customer acceptance confirmation has been signed.
The Company presents all sales revenue net of a value-added tax (“VAT”). The Company’s products sold in China are generally subject to a Chinese VAT of 17% of the sales price, except for certain proprietary software sales which will only be subject to an effective tax rate of 3%. The VAT payable may be offset by VAT paid by the Company on purchased raw materials and other materials included in the cost of projects or producing the finished product.
The Company records revenue in excess of billings as “unbilled revenue”. For revenues accounted for under this account, we expect the amounts to be collected within one year. For those with a collection period longer than one year, we classify them under “Long-term unbilled revenue” on the consolidated balance sheets.
Research and Development (R&D)
Research and development expenses include salaries for R&D staff, consultant fees, supplies and materials, as well as other overhead such as depreciation, facilities, utilities, and other R&D related expenses. The Company expenses costs for the development of new software products and substantial enhancements to existing software products as incurred until technological feasibility has been established, at which time any additional costs are capitalized. The management of the Company is responsible for assessing the establishment of technological feasibility in accordance with ASC 985-20, “Costs of Software to Be Sold, Leased, or Marketed”.
Foreign Currency Translation
The Company uses the United States dollar (“USD”) as its reporting currency. The functional currency of TRIT, TTII and TIS is USD, the functional currency of TII is India National Rupee (“INR”), the functional currency of TRIT’s subsidiaries in China is Renminbi (“RMB”). The Company translates monetary assets and liabilities denominated in currencies other than United States dollars into USD at the exchange rate ruling at the balance sheet date. The Company converts non-USD transactions during the year into USD with the prevailing exchange rate on the transaction dates.
| F-9 |
The Chinese subsidiaries of TRIT maintain their financial records in RMB. The value of the assets and liabilities were converted with the exchange rate on the balance sheet date; and their revenue and expenses with a weighted average exchange rate for the reporting period. The Company reflects translation adjustments as “Accumulated other comprehensive income (loss)” in shareholders’ equity.
Transaction gains and losses that arise from exchange rate fluctuations on transactions in a currency other than the functional currency are recognized as foreign currency transaction gain or loss in the result of operations as incurred.
Translation adjustments amounted to $4,682,402 and $4,593,046 as of June 30, 2012 and December 31, 2011, respectively. The Company translated balance sheet amounts with the exception of equity at June 30, 2012 at RMB6.3249 to US$1.00 and INR55.5556 to US$1.00 as compared to RMB6.3009 to US$1.00 at December 31, 2011 and INR54.3478 to US$1.00 at May 19, 2012. The Company stated equity accounts at their historical rate. The average translation rates applied to income statement accounts for the three-month periods ended June 30, 2012 and 2011 were RMB6.3074 and RMB6.5011 to US$1.00, respectively. The average translation rates applied to income statement accounts for the six-month periods ended June 30, 2012 and 2011 were RMB6.3074 and RMB6.5411 to US$1.00, respectively. The average translation rates applied to income statement accounts from May 19, 2012 to June 30, 2012 was INR55.8204 to US$1.00.
The translation rates between RMB and USD are according to State Administration of Foreign Exchange. The translation rates between INR and USD are according to Oanda.
Income Taxes
The Company provides for deferred income taxes using the asset and liability method. Under this method, the Company recognizes deferred income taxes for tax credits and net operating losses available for carry-forwards and significant temporary differences. The Company classifies deferred tax assets and liabilities as current or non-current based upon the classification of the related asset or liability in the financial statements or the expected timing of their reversal if they do not relate to a specific asset or liability. The Company provides a valuation allowance to reduce the amount of deferred tax assets if it is considered more likely than not that some portion or all of the deferred tax assets will not be realized.
The Company adopted Financial Accounting Standards Board (“FASB”) accounting standard codification 740 (ASC 740), as of January 1, 2007. The Company recognizes a tax position as a benefit only if it is “more likely than not” that the tax position would be sustained in a tax examination, with a tax examination being presumed to occur. The amount recognized is the largest amount of tax benefit that the Company believes is more than 50% likely to be realized on examination. For tax positions not meeting the “more likely than not” test, the Company does not record it as a tax benefit. The Company also adopts ASC 740 guidance on de-recognition, classification, interest and penalties, accounting in interim periods, disclosures, and transition. It had no effect on the Company’s financial statements as of June 30, 2012 and December 31, 2011. The Company did not have any significant unrecognized uncertain tax positions as of June 30, 2012 and December 31, 2011.
The Company’s operations are subject to income and transaction taxes in China since most of the business activities take place in China. Significant estimates and judgments are required in determining the Company’s provision for income taxes. Some of these estimates are based on interpretations of existing tax laws or regulations. The ultimate amount of tax liability may be uncertain as a result. The Company does not anticipate any events which could change these uncertainties.
Share-based Compensation
The Company adopted the fair value recognition provisions of ASC 718, “Compensation—Stock Compensation” and ASC 505-50, “Equity-Based Payments to Non-Employees”.
The Company recognizes compensation expense for all share-based payment awards made to the employees and directors. The fair value of share-based compensation cost is measured at the grant date based on the value of the award and is recognized as expense over the vesting period. Determining the fair value of share-based awards at the grant date requires considerable judgment, including estimating expected volatility, expected term and risk-free rate. The expected term is based upon the period of time for which the share option is expected to be outstanding. The expected volatility of the share options is based upon the historical volatility of our share price. The risk-free interest rate assumption is based upon China international bond rates for a comparable period. If factors change and we employ different assumptions, share-based compensation expense may differ significantly from what we have recorded in the past.
| F-10 |
Earnings per Share
Basic EPS excludes dilution and is computed by dividing net income (loss) attributable to ordinary shareholders by the weighted average number of ordinary shares outstanding for the period. Diluted EPS reflects the potential dilution that could occur if securities or other contracts to issue ordinary shares (convertible preferred stock, forward contract, warrants to purchase ordinary share, contingently issuable shares, ordinary share options and warrants and their equivalents using the treasury stock method) were exercised or converted into ordinary shares. The Company excludes potential ordinary shares in the diluted EPS computation in periods of losses from continuing operations, as their effect would be anti-dilutive.
The Company has granted 975,516 options to our key employees and 185,000 warrants to the placement agent in our IPO and to our investor relations consultant, all of which are included when calculating the diluted earnings per share. As of June 30, 2012, 93,700 options had been exercised at a price equal to $6.75 per share, and 170,000 warrants had been exercised at a price equal to $8.10 per share.
During the first financing after IPO, the Company has also agreed to issue the underwriters a warrant to purchase a number of ordinary shares equal to an aggregate of 10% of the ordinary shares sold in the offering, excluding over-allotments. The warrants will have an exercise price equal to 145% of the offering price. Accordingly, in April 2010, the Company issued 214,275 warrants with exercise price per share of $20.30. These warrants have anti-dilutive effect due to the fact that the weighted average exercise price per share of these warrants is higher than the weighted average market price per share of ordinary share during the three-month and six-month periods ended June 30, 2012 and 2011.
Comprehensive Income
Comprehensive income includes all changes in equity except those resulting from investments by owners and distributions to owners. The Company has chosen to report comprehensive income in the statements of income and comprehensive income.
Financial Instruments
The Company carries financial instruments, which consists of cash and cash equivalents, accounts receivable, accounts payable, short-term bank borrowings and other payables at cost, which approximate fair value due to the short-term nature of these instruments. The Company does not use derivative instruments to manage risks.
Segments
The Company identifies segments by reference to its internal organization structure and the factors that management uses to make operating decisions and assess performance.
Recently Issued Accounting Pronouncements
In July 2012, the FASB issued ASU 2012-02, “Intangibles-Goodwill and Other (Topic 350): Testing Indefinite-Lived Intangible Assets for Impairment." This ASU simplifies how entities test indefinite-lived intangible assets for impairment which improve consistency in impairment testing requirements among long-lived asset categories. These amended standards permit an assessment of qualitative factors to determine whether it is more likely than not that the fair value of an indefinite-lived intangible asset is less than its carrying value. For assets in which this assessment concludes it is more likely than not that the fair value is more than its carrying value, these amended standards eliminate the requirement to perform quantitative impairment testing as outlined in the previously issued standards. The guidance is effective for annual and interim impairment tests performed for fiscal years beginning after September 15, 2012, early adoption is permitted. The adoption of this standard is not expected to have a material impact on the Company’s (consolidated) financial position and results of operations.
| 3. | Business Combinations |
J&Y International Inc.
To expand its technical and geological market profile, on June 9, 2011, the Company acquired the total operating assets of J&Y International Inc. (“J&Y”), a water treatment company based in Wisconsin, USA, inclusive of its technology know-how, design prints, etc. The total purchase price was estimated to be $1,500,000 in the form of cash and ordinary shares as of the acquisition date, of which $488,000 payment in cash and 35,974 ordinary shares, at the price on the trading day prior to the closing at $7.61 per share with a total amount of $277,000, should be paid and issued at closing. The remaining payment of $735,000 subject to adjustment was deferred and paid by the issuance of ordinary shares, including:
| F-11 |
| 1) | $200,000 payable upon a specific contract granted. In November 2011, the Company earned the specific contract. The amount was paid in April 2012, by issuing 30,207 ordinary shares at a price equal to $7.61 per share. |
| 2) | $200,000 payable upon a specific contract completion and receipt of payment excluding retainer. The contract is expected to complete by the end of year 2012. |
| 3) | $335,000 payable based on the specific threshold of performance EBITDA generated in connection with a specific contract. By the date of issuing financial statements, the amount was not paid. The amount will be subject to the performance EBITDA. |
| 4) | If the seller sells the issued shares at a price less than $7.61 within one calendar year after the expiration of the restriction period, the Company shall pay the seller shortfall in cash as the make good amount. |
The above contingent consideration was classified as a liability as of June 9, 2011, the closing date. The fair value of the contingent consideration as of June 30, 2012 and December 31, 2011was estimated at $888,000 and $895,000 pursuant to the official appraisal reports from an assessment agency. $305,034 was paid during the six-month period ended June 30, 2012, out of which $75,159 was paid in cash and $229,875 was paid by issuing 30,207 ordinary shares at a price equal to $7.61 per share. The outstanding contingent consideration payable as of June 30, 2012 and December 31, 2011 was $582,966 and $895,000, respectively.
Tri-Tech Infrastructure (India) Pvt., Ltd.
On October 19, 2011, the Company invested INR 300,000, or US$6,985 to TII, to obtain 30% of the equity interest. TII was a joint venture partnership of the Company, and the investment was accounted for using equity method. The carrying value of the investment was adjusted to $20,613 at May 19, 2012, due to the gain of TII’s financial results from October 19, 2011 to May 19, 2012.
On May 19, 2012, the Company acquired additional 46% of TII’s equity interest, and became the controlling shareholder of TII. The total investment from TIS was INR 2,217,000, or $55,886. The amount included initial investment of INR300,000 on October 19, 2011, which was adjusted to $20,613 due to the gain of TII from October 19, 2011 to May 19, 2012 and investment consideration of INR1,917,000, or $35,273 on May 19, 2012.
The fair value of TII's identifiable net asset as of May 19, 2012 was:
| Cash and cash equivalents | $ | 42,256 | ||
| Prepayments to suppliers | 317,955 | |||
| Plant and equipment, net | 62,224 | |||
| Other assets | 2,240 | |||
| Accounts payable | (197,713 | ) | ||
| Other liabilities | (77,185 | ) | ||
| Total identifiable net assets | $ | 149,777 |
The following table represents the consideration allocation based on fair value on May 19, 2012:
| Total identifiable net assets attributed to TRIT | $ | 113,831 | ||
| Noncontrolling interest | 35,946 | |||
| Total consideration from WOFE and noncontrolling shareholder | $ | 149,777 |
The excess of identifiable net assets attributed to TRIT over total investment consideration, $57,945, was recorded as gain in the investment. No goodwill was recognized in this investment.
| F-12 |
The unaudited pro forma financial information shown below does not attempt to project the future results of operations of the combined entity.
| Revenue | Earnings | |||||||
| Actual amount from May 19 to June 30, 2012 generated from TII (Unaudited) | $ | 478,560 | $ | 115,652 | ||||
| Supplemental pro forma from January 1 to June 30, 2012 (Unaudited) | $ | 42,261,846 | $ | 2,397,281 | ||||
| Supplemental pro forma from January 1 to June 30, 2011 (Unaudited) | $ | 37,755,098 | $ | 4,569,912 | ||||
Supplemental pro forma in revenue:
| Revenue | TII | TRIT Group | Elimination | Combined | ||||||||||||
| January 1, 2012–June 30, 2012 (Unaudited) | $ | 1,036,600 | $ | 42,261,846 | $ | (1,036,600 | ) | $ | 42,261,846 | |||||||
| January 1, 2011–June 30, 2011 (Unaudited) | $ | N/A | $ | 37,755,098 | $ | — | $ | 37,755,098 | ||||||||
Supplemental pro forma in earnings:
| Earnings | TII | TRIT Group | Elimination | Combined | ||||||||||||
| January 1, 2012–June 30, 2012 (Unaudited) | $ | 227,093 | $ | 2,377,508 | $ | (207,320 | ) | $ | 2,397,281 | |||||||
| January 1, 2011–June 30, 2011 (Unaudited) | $ | N/A | $ | 4,569,912 | $ | — | $ | 4,569,912 | ||||||||
| 4. | Variable Interest Entities |
VIEs are entities that have either a total equity investment that is insufficient to permit the entity to finance its activities without additional subordinated financial support, or whose equity investors lack the characteristics of a controlling financial interest, such as through voting rights, right to receive the expected residual returns of the entity or obligation to absorb the expected losses of the entity. The variable interest holder, if any, that has a controlling financial interest in a VIE is deemed to be the primary beneficiary and must consolidate the VIE. TRIT is deemed to have a controlling financial interest and be the primary beneficiary of the entities mentioned in Note 1 above, because it has both of the following characteristics:
1. power to direct activities of a VIE that most significantly impact the entity’s economic performance, and
2. obligation to absorb losses of the entity that could potentially be significant to the VIE or right to receive benefits from the entity that could potentially be significant to the VIE.
TRIT’s VIEs include: Tranhold, Yanyu and BSST. TRIT is involved in each VIE and understands the purpose and design of these entities. It also performs a significant role in these entities’ ongoing business. It is obligated to absorb losses of the VIE entities as well as benefit from them. Therefore, the VIEs are consolidated in the Company’s 2011 and 2010 consolidated financial statements. These VIEs are continually monitored by the Company to determine if any events have occurred that could cause its primary beneficiary status to change.
On July 26, 2010, the Company signed and executed with BSST a series of contractual agreements with a 25-year, renewable term. These contractual agreements require the pledge of the original shareholders’ equity interests and share certificates of the VIEs. At any time during the agreement period, the Company has absolute rights to acquire any portion of the equity interests of those VIEs under no-cost conditions. On August 6, 2010, the effective date of the agreements, the Company became the primary beneficiary of BSST. At the same time, the Company paid the consideration of $3.8 million, including $1,447,000 in cash and 260,000 in the Company’s ordinary shares at the market value of $8.98 per share in the amount of $2,334,800. The Company will expand its market in the petrochemical industries through BSST since it is a consulting, engineering, design, system integration and project management services company specializing in the fields of control and instrument automation, safety and emergency response for the oil, gas and petrochemical industries.
| F-13 |
These agreements consist of the following:
Exclusive Technical and Consulting Service Agreement — Each of Yanyu, Tranhold and BSST has entered into an Exclusive Technical and Consulting Service Agreement with TTB, which agreement provides that TTB will be the exclusive provider of technical and consulting services to Yanyu, Tranhold and BSST, as appropriate, and that each of them will in turn pay 90% of its profits (other than net profits allocable to the State-Owned Entities (“SOE”) Shareholder of Yanyu) to TTB for such services. In addition to such payment, Yanyu, Tranhold and BSST agree to reimburse TTB for TTB’s expenses (other than TTB’s income taxes) incurred in connection with its provision of services under the agreement. Payments will be made on a quarterly basis, with any overpayment or underpayment to be reconciled once each of Tranhold’s, Yanyu’s and BSST’s annual net profits, as applicable, are determined at its fiscal year end. Any payment from TTB to TTII would need to comply with applicable Chinese laws affecting payments from Chinese companies to non-Chinese companies. Although based on this agreement TTB is only entitled to 90% of net profits (other than net profits allocable to the SOE Shareholder of Yanyu), TTB also entitled the remaining share of the net profits of the VIEs through dividends per the Proxy Agreement as discussed below. The Company relies on dividends paid by TTB for its cash needs, and TTB relies on payments from Yanyu, Tranhold and BSST to be able to pay such dividends to the Company.
Management Fee Payment Agreement — Each of the shareholders of Yanyu, Tranhold and BSST (other than Beijing Yanyu Communications Telemetry United New Technology Development Department, a Chinese State Owned Entity (the “SOE Shareholder”) of Yanyu) has entered into a Management Fee Payment Agreement, which provides that, in the event TTB exercises its rights to purchase the equity interests of the Yanyu or Tranhold or BSST shareholders (other than those owned by the SOE Shareholder of Yanyu) under the Equity Interest Purchase Agreements, such shareholders shall pay a Management Fee to TTB in an amount equal to the amount of the Transfer Fee received by the such shareholders under the Equity Interest Purchase Agreement.
Proxy Agreement — Each of the shareholders of Yanyu, Tranhold and BSST (other than the SOE Shareholder of Yanyu) has executed a Proxy Agreement authorizing TTB to exercise any and all shareholder rights associated with his ownership in Yanyu or Tranhold or BSST, as appropriate, including the right to attend shareholders’ meetings, the right to execute shareholders’ resolutions, the right to sell, assign, transfer or pledge any or all of the equity interest in Yanyu or Tranhold or BSST, as appropriate, and the right to vote such equity interest for any and all matters.
Equity Interest Pledge Agreement — TTB and the shareholders of each of Tranhold, BSST and Yanyu, (other than the SOE Shareholder of Yanyu) have entered in Equity Interest Pledge Agreements, pursuant to which each such shareholder pledges all of his shares of Tranhold, Yanyu or BSST, as appropriate, to TTB. If Tranhold, Yanyu or BBST or any of its respective shareholders (other than the SOE Shareholder of Yanyu) breaches its respective contractual obligations, TTB, as pledgee, will be entitled to certain rights, including the right to foreclose on the pledged equity interests. Such Tranhold, BSST and Yanyu shareholders have agreed not to dispose of the pledged equity interests or take any actions that would prejudice TTB’s interest. According to this agreement, TTB has absolute rights to obtain any and full dividends related to the equity interest pledged during the term of the pledge.
Exclusive Equity Interest Purchase Agreement — Each of the shareholders of Tranhold, Yanyu and BSST (other than the SOE Shareholder of Yanyu) has entered into an Exclusive Equity Interest Purchase Agreement, which provides that TTB will be entitled to acquire such shares from the current shareholders upon certain terms and conditions, if such a purchase is or becomes allowable under PRC laws and regulations. The Exclusive Equity Interest Purchase Agreement also prohibits the current shareholders of each of Tranhold, Yanyu and BSST, (other than the SOE Shareholder of Yanyu) from transferring any portion of their equity interests to anyone other than TTB. TTB has not yet taken any corporate action to exercise this right of purchase, and there is no guarantee that it will do so or will be permitted to do so by applicable law at such time as it may wish to do so.
Operating Agreements — TTB, Tranhold, Yanyu and each of their respective shareholders (other than the SOE Shareholder of Yanyu) have entered into an Operating Agreement on July 3, 2009, TTB, BSST and each of their respective shareholders have entered into an Operating Agreement on July 26, 2010, which requires TTB to guarantee the obligations of each of Tranhold, Yanyu and BSST in their business arrangements with third parties. Each of Tranhold, Yanyu and BSST, in return, agrees to pledge its accounts receivable and all of its assets to TTB. Moreover, each of Tranhold, Yanyu and BSST, agrees that without the prior consent of TTB, such company will not engage in any transactions that could materially affect its assets, liabilities, rights or operations, including, without limitation, incurrence or assumption of any indebtedness, sale or purchase of any assets or rights, incurrence of any encumbrance on any of its assets or intellectual property rights in favor of a third party or transfer of any agreements relating to its business operation to any third party. Pursuant to these operating agreements, TTB provides guidance and instructions on each of Tranhold, Yanyu and BSST’s daily operations and financial affairs. The contracting shareholders of each of Tranhold, Yanyu and BSST, must designate the candidates recommended by TTB as their representatives on their respective boards of directors. TTB has the right to appoint and remove senior executives of each of Tranhold, Yanyu and BSST.
| F-14 |
Assets recognized as a result of consolidating VIEs do not represent additional assets that could be used to satisfy claims against the Company’s general assets. Conversely, liabilities recognized as a result of consolidating these VIEs do not represent additional claims on the Company’s general assets; rather, they represent claims against the specific assets of the consolidated VIEs.
The Company is the primary beneficiary of Tranhold, Yanyu and BSST, VIEs. Accordingly, the assets and liabilities of VIEs are included in the accompanying consolidated balance sheets.
Only the assets of the VIE can be used to settle the obligation of the VIE. Conversely, liabilities recognized by the consolidated VIE do not represent additional claims on the Company’s assets.
The total assets and liabilities of our consolidated VIEs as of June 30, 2012 and December 31, 2011 are shown as below, which exclude intercompany balances that are eliminated among the VIEs.
| June 30, 2012 | ||||||||
| (Unaudited) | December 31, 2011 | |||||||
| ASSETS | ||||||||
| Current assets | ||||||||
| Cash | $ | 1,906,222 | $ | 4,414,701 | ||||
| Restricted cash | 848,209 | 1,192,134 | ||||||
| Accounts and notes receivable, net | 23,428,838 | 19,310,636 | ||||||
| Unbilled revenue | 4,955,649 | 4,361,317 | ||||||
| Other receivables | 16,884,007 | 8,790,816 | ||||||
| Inventories | 5,638,287 | 5,950,510 | ||||||
| Deposits on projects | 872,678 | 983,013 | ||||||
| Prepayments to suppliers and subcontractors | 8,162,325 | 1,387,119 | ||||||
| Total current assets | 62,696,215 | 46,390,246 | ||||||
| Long-term unbilled revenue | 2,146,491 | 2,154,667 | ||||||
| Plant and equipment, net | 493,942 | 511,160 | ||||||
| Intangible assets, net | 3,952,738 | 4,138,012 | ||||||
| Long-term investment | — | 5,855,566 | ||||||
| Long-term restricted cash | 48,796 | 26,834 | ||||||
| Total Assets | $ | 69,338,182 | $ | 59,076,485 | ||||
| LIABILITIES AND EQUITY | ||||||||
| Current liabilities | ||||||||
| Accounts payable | 6,700,534 | 1,394,883 | ||||||
| Notes payable | 302,313 | 1,176,197 | ||||||
| Costs accrual on projects | 7,871,204 | 8,104,579 | ||||||
| Customer deposits | 8,539,838 | 1,920,597 | ||||||
| Other payables | 22,204,212 | 19,944,048 | ||||||
| Income taxes payable | 573,240 | 10,096 | ||||||
| Deferred income taxes | — | 328,419 | ||||||
| Short-term bank borrowing | 3,678,103 | 2,296,895 | ||||||
| Total current liabilities | 49,869,444 | 35,175,714 | ||||||
| Total Liabilities | $ | 49,869,444 | $ | 35,175,714 | ||||
| F-15 |
For the six-month period ended June 30, 2012, the financial performance of the VIEs reported in the consolidated statements of income and comprehensive income includes sales of approximately US$21,896,713, cost of sales of approximately US$17,131,745, operating expenses of approximately US$3,798,806 and net income of approximately US$576,092.
| 5. | Restricted Cash |
As of June 30, 2012, the Company has made deposits several times totaling $4,278,156 as collateral in exchange of the issuance of letters of credit. The restricted cash aggregating $1,723,780 will expire within the next 12 months. The remaining balance of $2,554,376 expires after June 2013, and is classified under long-term restricted cash.
| 6. | Accounts and Notes Receivable, Net |
Based on the Company’s assessment, management believes the net balance on each balance sheet date herein was collectable. The gross balance and bad debt provision as of June 30, 2012 and December 31, 2011 are as the following:
| June 30, 2012 | December 31, | |||||||
| (Unaudited) | 2011 | |||||||
| Accounts receivable, gross | $ | 23,809,860 | $ | 20,507,146 | ||||
| Less bad debt provision | (859,405 | ) | (619,062 | ) | ||||
| Notes receivable | 90,120 | — | ||||||
| Accounts and notes receivable, net | $ | 23,040,575 | $ | 19,888,084 | ||||
The Company records revenue from system integration contracts using the percentage-of-completion method. As of June 30, 2012 and December 31, 2011, the Company had $21,386,299 and $19,826,397 respectively, of accounts receivables using the percentage-of-completion method. All of the Company’s accounts receivable as of June 30, 2012 is expected to be collected within the next twelve months.
The allowance is based on the age of receivables and a specific identification of receivables considered at risk of collection. The following analysis details the changes in the Company’s allowances for doubtful accounts:
| June 30, 2012 | December 31, | |||||||
| (Unaudited) | 2011 | |||||||
| Balance at beginning of the period | $ | 619,062 | $ | 427,020 | ||||
| Increase in allowances during the period | 240,545 | 219,456 | ||||||
| Reversal in allowances during the period | (202 | ) | (27,135 | ) | ||||
| Write-offs during the period | — | (279 | ) | |||||
| Balance at the end of the period | $ | 859,405 | $ | 619,062 | ||||
| 7. | Unbilled Revenue |
For revenues accounted for under this account, we expect the amounts to be collected within one year. For those with a collection period longer than one year, we classify them under “Long-term unbilled revenue” on the consolidated balance sheets.
The unbilled revenue as of June 30, 2012 and December 31, 2011 are as the following:
| June 30, 2012 | December 31, | |||||||
| (Unaudited) | 2011 | |||||||
| Current unbilled revenue | $ | 21,011,695 | $ | 7,254,830 | ||||
| Long-term unbilled revenue | 57,183,407 | 59,298,740 | ||||||
| Total unbilled revenue | $ | 78,195,102 | $ | 66,553,570 | ||||
As of June 30, 2012, $4,743,158, or 23% of the current unbilled revenue, and $45,787,635, or 80% of the long-term unbilled revenue was related to the Ordos project. The remaining balance was for various other on-going projects. All of the balances are considered collectible.
| F-16 |
| 8. | Other Receivables |
Other receivables consisted of the following:
| June 30, 2012 | December 31, | |||||||
| (Unaudited) | 2011 | |||||||
| Advances to staff | $ | 1,440,376 | $ | 772,770 | ||||
| Loan to third-party companies | 921,898 | 1,207,119 | ||||||
| Rental Deposit | 316,914 | 186,710 | ||||||
| Prepaid expenses | 338,182 | 191,845 | ||||||
| Others | 1,166,446 | 403,104 | ||||||
| Total | $ | 4,183,816 | $ | 2,761,548 | ||||
Advances to staff were mainly for staff with long term assignment overseas for sales and project related work.
Loans to third-party companies were made to business partners for working capital purpose. $500,000 is due before the end of 2012 with 6% annualized interest rate, $158,105 is for one year with annualized interest rate of 12%, the remaining $263,793 is for period less than one year without interest. The interest income for these loans was $31,423 as of June 30, 2012, which was included in others.
Of the other receivables, $422,983 was related to tax refund due to the purchases for overseas projects. The tax refund was approved by local tax bureau in the quarter ended June 30, 2012, and the amount is expected to be collected in early 2013.
| 9. | Inventories |
Inventories consisted of the following:
| June 30, 2012 | December 31, | |||||||
| (Unaudited) | 2011 | |||||||
| Raw materials | $ | 2,013,592 | $ | 1,835,715 | ||||
| Finished goods | 880,151 | 589,887 | ||||||
| Project work-in-progress | 3,622,419 | 5,280,150 | ||||||
| Total | $ | 6,516,162 | $ | 7,705,752 | ||||
The Company reviews its inventory periodically for possible obsolete goods and to determine if any reserves are necessary for potential obsolescence. As of June 30, 2012 and December 31, 2011, the Company determined that no reserves were necessary.
| 10. | Deposits on Projects |
Deposits on Projects consisted of the following:
| June 30, 2012 | December 31, | |||||||
| (Unaudited) | 2011 | |||||||
| Current: | ||||||||
| Contract deposit | $ | 737,161 | $ | 659,568 | ||||
| Bidding deposit | 316,418 | 553,123 | ||||||
| Total | $ | 1,053,579 | $ | 1,212,691 | ||||
Contract deposits are paid to customers for the promise that the service or products will be properly and timely provided. Bidding deposits are paid as a deposit for project bidding process. All of the deposits will be collected within one year.
| F-17 |
| 11. | Plant and Equipment, Net |
Plant and equipment consist of the following:
| June 30, 2012 | December 31, | |||||||
| (Unaudited) | 2011 | |||||||
| Transportation equipment | $ | 1,012,619 | $ | 857,812 | ||||
| Office equipment | 518,960 | 435,952 | ||||||
| Furniture | 426,353 | 402,842 | ||||||
| Buildings | 270,486 | 271,515 | ||||||
| Machinery and equipment | 138,250 | 137,217 | ||||||
| Total plant and equipment | 2,366,668 | 2,105,338 | ||||||
| Less accumulated depreciation | (823,822 | ) | (668,500 | ) | ||||
| Plant and equipment, net | $ | 1,542,846 | $ | 1,436,838 | ||||
The depreciation expense for the quarters ended June 30, 2012 and 2011 amounted to $83,095 and $59,204, respectively. The depreciation expense for the six month ended June 30, 2012 and 2011 amounted to $154,638 and $115,964, respectively.
| 12. | Construction in Progress |
The construction in progress account captures the balance of construction in progress for the Company’s Baoding research, development and production base in Baodi, Tianjin area. Baoding focuses on technology development, software development, pilot testing, manufacturing and pre-installation/pre-assembly preparation of its proprietary products. The construction of the Baoding research, development and production facility officially started in June 2011, and is expected to complete by end of year 2013. As of June 30 2012, the construction in progress of the Baoding facility totaled at $4,713,277.
| 13. | Intangible Assets, Net |
Intangible assets mainly consist of patents, software, customer lists, land use right and know-how. The patents were invested as capital contribution by the shareholders of Tranhold and Yanyu, and were recorded at the appraisal value as stipulated by the local regulatory authority. According to ASC 845-10-S99, transfers of nonmonetary assets to a company by its promoters or shareholders in exchange for shares prior to or at the time of the company’s initial public offering normally should be recorded at the transferors’ historical cost basis determined under US GAAP. The effect from the inclusion of the contributed patents at its fair value instead of historical cost was immaterial. Software was purchased from third parties at the acquisition cost.
All the intangible assets have definite lives, and are amortized on a straight-line basis over their expected useful economic lives. The original costs and accumulated amortization as of June 30, 2012 and December 31, 2011 are as follows:
| June 30, 2012 | December 31, | |||||||
| (Unaudited) | 2011 | |||||||
| Patents | $ | 2,050,573 | $ | 2,021,375 | ||||
| Software | 2,868,030 | 2,878,954 | ||||||
| Customer list | 1,277,758 | 1,280,378 | ||||||
| Land use right | 5,702,462 | 5,724,181 | ||||||
| Know-how | 1,216,491 | 1,218,496 | ||||||
| Contract backlog | 58,498 | 58,722 | ||||||
| Total intangible assets | 13,173,812 | 13,182,106 | ||||||
| Less accumulated amortization | (1,993,837 | ) | (1,572,444 | ) | ||||
| Intangible assets, net | $ | 11,179,975 | $ | 11,609,662 | ||||
| F-18 |
In November 2010, $5,284,854 was paid for a land use right, the amount of which was recorded as long-term prepayment on land use right purchased as of December 31, 2010. On January 18, 2011, the land use right was transferred and accepted by the Company, and the amount started to be included in intangible assets. The amortization of the land use right for 50 years started in January 2011.
The amortization expense for the quarters ended June 30, 2012 and 2011 amounted to $213,936 and $124,811, respectively. The amortization expense for six months ended June 30, 2012 and 2011 amounted to $427,875 and $269,827, respectively.
The amortization expense for the following five years and thereafter is expected to be as follows:
| For the Year Ending December 31, | Amount | |||
| 2012 | $ | 410,967 | ||
| 2013 | 812,184 | |||
| 2014 | 812,184 | |||
| 2015 | 754,871 | |||
| 2016 | 605,480 | |||
| Thereafter | 7,784,289 | |||
| Total | $ | 11,179,975 | ||
| 14. | Investment in Joint Venture |
On October 18, 2011, TIS entered into an agreement to establish a joint venture, Tri-Tech Infrastructure (India), Pvt. Ltd., with Allied Energy Systems Pvt. Ltd., for the purpose of market development in India.
On October 19, 2011, the capital injection in the amount of INR 300,000, or US$6,985, was made to the joint venture. Total registered capital of the joint venture is INR1,000,000, or $20,833. TIS took up 30% of the ownership. Equity method is adopted for the long-term investment.
For the year ended December 31, 2011, net loss for the India joint venture was INR3,385,463, or $66,017. TIS should bear the net loss of INR1,015,639, or $19,805. Since the net loss is more than the long-term investment, only $6,985 was offset and the remaining loss of $12,820 will be net-off against earnings in the future.
For the quarter ended March 31, 2012, net profit for the India joint venture was INR3,053,119, or $60,762. TIS should earn the net profit of INR915,936, or $18,229. After net off $12,820 of the loss brought forward from prior year, $5,409 was recognized as gain on investment in the joint venture for the quarter ended March 31, 2012.
For the period from April 1 to May 19, 2012, net profit for the India joint venture was INR2,655,392, or $50,679. TIS should earn the net profit of INR796,618, or $15,204, which was recognized as gain on investment in the joint venture for the period.
On May 19, 2012, TIS acquired additional 46% of TII’s equity interest, and became the controlling shareholder of TII. The additional investment consideration was INR1,917,000, or $35,273. TII was consolidated into TIS since that day.
| 15. | Accounts Payable and Costs Accrual on Projects |
This account contains the accounts payable to suppliers and accruals of costs incurred in the projects in accordance with the percentage of completion method.
| F-19 |
Accounts payable and project accruals based on progress consisted of the following:
| June 30, 2012 | December 31, | |||||||
| (Unaudited) | 2011 | |||||||
| Accounts payable | $ | 8,049,201 | $ | 11,401,187 | ||||
| Costs accrual on projects | 23,860,658 | 19,402,047 | ||||||
| Total | $ | 31,909,859 | $ | 30,803,234 | ||||
Of the total accounts payable, 25%, or $1,987,360, was related to building new factories and warehouses in Tianjin. The remaining balance was for various other on-going projects.
Of the total costs accrual on projects, 22%, or $5,286,623, was related to the Ordos projects, which was also the main reason for the increase of the ending balance, and 29%, or $7,012,810 was related to the India projects. The remaining balance was for various other on-going projects.
| 16. | Other Payables |
Other payables were non-project related as shown below:
| June 30, 2012 | December 31, | |||||||
| (Unaudited) | 2011 | |||||||
| Loan from third-party companies | $ | 579,053 | $ | 972,196 | ||||
| Interest expenses payable to third-party companies and noncontrolling interest investor | 1,082,256 | 500,298 | ||||||
| Others | 167,269 | 187,038 | ||||||
| Total Other Payables | $ | 1,828,578 | $ | 1,659,532 | ||||
The loan from third-party companies, $579,053 was with interest of 1.0% per month and due before the end of 2012. The accrued interest expense was $49,057 as of June 30, 2012, which was included in interest expenses payable.
| 17. | Amount due to noncontrolling interest investor |
The amount due to noncontrolling interest investor as of June 30, 2012 and December 31, 2011 were::
| June 30, 2012 | December 31, | |||||||
| (Unaudited) | 2011 | |||||||
| Amount due to noncontrolling interest investor | $ | 7,247,545 | $ | 6,057,250 | ||||
| Amount due to noncontrolling interest investor | $ | 7,247,545 | $ | 6,057,250 | ||||
The amount due to noncontrolling interest investor, $7,247,545, was principal amount for short-term loan from the minority interest investor from TTA, with interest of 1.5% per month due before the end of 2012. The accrued interest expense was $1,033,199 as of June 30, 2012, which was included in other payables. The purpose of this short-term loan was mainly to reduce temporary operational cash pressure.
| 18. | Other Taxes payable |
Other taxes payable were as shown below:
| June 30, 2012 (Unaudited) | December 31, 2011 | |||||||
| Value-added tax payable | $ | 3,785,221 | $ | 1,367,517 | ||||
| Business tax payable | 1,547,152 | 1,228,441 | ||||||
| Others | 219,087 | 471,392 | ||||||
| Total other taxes payable | $ | 5,551,460 | $ | 3,067,350 | ||||
The increase of value-added tax payable balance was due to the increase of revenue for the six months ended June 30, 2012.
| F-20 |
| 19. | Bank Borrowings |
The below table presents the bank borrowing interest rates and the amount borrowed as of June 30, 2012 and December 31, 2011.
| Bank Name | Interest rate | Terms | As of June 30, 2012 (Unaudited) | As of December 31, 2011 | ||||||||||||
| Bank of Hangzhou | 7.216 | % | 04/15/2011 - 04/14/2012 | $ | — | $ | 555,476 | |||||||||
| Bank of Hangzhou | 7.216 | % | 06/27/2011 - 06/26/2012 | — | 952,245 | |||||||||||
| Bank of Hangzhou | 7.216 | % | 07/27/2011 - 07/26/2012 | 786,179 | 789,174 | |||||||||||
| Citic Bank | 8.528 | % | 09/27/2011 - 09/27/2012 | 4,743,158 | 4,761,225 | |||||||||||
| Bank of Hangzhou | 7.872 | % | 11/30/2011 - 11/29/2012 | 948,632 | 952,245 | |||||||||||
| Industrial and Commercial Bank of China | 7.320 | % | 02/13/2012 - 08/10/2012 | 148,129 | — | |||||||||||
| Bank of Hangzhou | 7.872 | % | 03/20/2012 - 03/19/2013 | 632,421 | — | |||||||||||
| Industrial and Commercial Bank of China | 6.560 | % | 03/31/2012 - 03/29/2013 | 2,371,579 | — | |||||||||||
| Industrial and Commercial Bank of China | 6.560 | % | 04/06/2012 - 03/29/2013 | 1,581,053 | — | |||||||||||
| Bank of Hangzhou | 7.872 | % | 04/19/2012 - 04/18/2013 | 36,269 | — | |||||||||||
| Bank of Hangzhou | 7.216 | % | 04/28/2012 - 04/26/2013 | 335,947 | — | |||||||||||
| Industrial and Commercial Bank of China | 6.560 | % | 05/25/2012 - 03/29/2013 | 790,526 | — | |||||||||||
| Industrial and Commercial Bank of China | 6.435 | % | 06/27/2012 - 12/26/2012 | 2,371,579 | — | |||||||||||
| Short-term bank borrowings | 14,745,472 | 8,010,365 | ||||||||||||||
| Industrial Credit and Investment Corporation of India Bank LTD | 12.25 | % | 01/15/2012 – 01/14/2015 | 9,961 | — | |||||||||||
| Industrial Credit and Investment Corporation of India Bank LTD | 11.99 | % | 05/01/2012 - 04/30/2016 | 10,445 | — | |||||||||||
| Long-term bank borrowings | 20,406 | — | ||||||||||||||
| Total bank borrowings | $ | 14,765,878 | $ | 8,010,365 | ||||||||||||
$1,753,987 of the short-term bank borrowings was repaid by the Company during the six month period ended June 30, 2012, out of which $1,507,721 was to repay the outstanding balance as of December 31, 2011, and the remaining amount was to repay the bank borrowings, which occurred in the first quarter of 2012. $786,179 of the short-term bank borrowings was due and repaid by the Company in July 2012.
| 20. | Income Taxes |
We are subject to income taxes on the entity level for income arising in or derived from the tax jurisdictions in which each entity is domiciled. According to the New Enterprise Income Tax Law (“NEITL”) in China, unified Enterprise Income Tax rate is 25%. However, five of our eight subsidiaries and VIEs in China are subject to certain favorable tax policies as high-tech companies. The effective income tax rate for the three and six months ended June 30, 2012 was 18%.
The Company has not recorded tax provision for U.S. tax purposes as it has no assessable profits arising in or derived from the United States and intends to reinvest accumulated earnings in its PRC operations.
| F-21 |
The applicable statutory tax rates for our subsidiaries and VIEs in the PRC are as follows:
| Three Months Ended June 30, (Unaudited) | ||||||||
| 2012(%) | 2011(%) | |||||||
| TTB | 15 | 7.5 | ||||||
| BSST | 15 | 15 | ||||||
| Yanyu | 15 | 15 | ||||||
| Tranhold | 25 | 25 | ||||||
| TTA | 25 | 25 | ||||||
| Baoding | 15 | 15 | ||||||
| Yuanjie | 15 | — | ||||||
| Buerjin | 25 | — | ||||||
| Xushui | 25 | — | ||||||
| Consolidated Effective Income Tax Rate | 18 | 16 | ||||||
| Six Months Ends June 30, | ||||||||
| (Unaudited) | ||||||||
| 2012(%) | 2011(%) | |||||||
| TTB | 15 | 7.5 | ||||||
| BSST | 15 | 15 | ||||||
| Yanyu | 15 | 15 | ||||||
| Tranhold | 25 | 25 | ||||||
| TTA | 25 | 25 | ||||||
| Baoding | 15 | 15 | ||||||
| Yuanjie | 15 | — | ||||||
| Buerjin | 25 | — | ||||||
| Xushui | 25 | — | ||||||
| Consolidated Effective income tax rate | 18 | 16 | ||||||
The provision for income tax expense (benefit) from operations consists of the following:
| Three Months Ended June 30, | ||||||||
| (Unaudited) | ||||||||
| 2012 | 2011 | |||||||
| Current: | ||||||||
| PRC | $ | — | $ | — | ||||
| India | 72,989 | — | ||||||
| Deferred: | ||||||||
| PRC | 214,073 | 439,423 | ||||||
| Total income tax expense | $ | 287,062 | $ | 439,423 | ||||
| F-22 |
| Six Months Ends June 30, | ||||||||
| (Unaudited) | ||||||||
| 2012 | 2011 | |||||||
| Current: | ||||||||
| PRC | $ | — | $ | — | ||||
| India | 72,989 | — | ||||||
| Deferred: | ||||||||
| PRC | 528,566 | 845,059 | ||||||
| Total income tax expense | $ | 601,555 | $ | 845,059 | ||||
Significant components of the Company’s deferred tax liabilities are as follows:
| June 30, 2012 (Unaudited) | December 31, 2011 | |||||||
| Current: | ||||||||
| Deferred income taxes: | ||||||||
| Revenue recognition based on percentage of completion | 1,021,991 | 358,519 | ||||||
| Total net deferred tax liabilities | $ | 1,021,991 | $ | 358,519 | ||||
| Long-term: | ||||||||
| Noncurrent deferred income taxes: | ||||||||
| Revenue recognition based on percentage of completion | 2,781,352 | 2,930,427 | ||||||
| Intangible assets valuation in business combination | 483,577 | 525,396 | ||||||
| Total net deferred tax liabilities | $ | 3,264,929 | $ | 3,455,823 | ||||
Income tax reconciliation for the three months and six months ended June 30, 2012 and 2011 are as follows:
| Three Months Ended June 30, | ||||||||
| 2012 | 2011 | |||||||
| (Unaudited) | (Unaudited) | |||||||
| PRC statutory tax rate | 25 | % | 25 | % | ||||
| Taxable income | $ | 1,594,789 | $ | 2,829,810 | ||||
| Computed expected income tax expense | 398,697 | 707,453 | ||||||
| Effect of preferential tax rates | (111,635 | ) | (268,030 | ) | ||||
| Income tax expense | $ | 287,062 | $ | 439,423 | ||||
| Six Months Ended June 30, | ||||||||
| 2012 | 2011 | |||||||
| (Unaudited) | (Unaudited) | |||||||
| PRC statutory tax rate | 25 | % | 25 | % | ||||
| Taxable income | $ | 3,341,971 | $ | 5,414,971 | ||||
| Computed expected income tax expense | 835,493 | 1,353,743 | ||||||
| Effect of preferential tax rates | (233,938 | ) | (508,684 | ) | ||||
| Income tax expense | $ | 601,555 | $ | 845,059 | ||||
| F-23 |
| 21. | Warrants |
As of June 30, 2012 and December 31, 2011, the Company has 229,274 warrants outstanding for ordinary shares. None of these warrants were exercised by June 30, 2012. During the quarters ended June 30, 2012 and 2011, the Company recorded warrant expenses as general and administrative expenses with $0 and $30,327, respectively. During the six month ended June 30, 2012 and 2011, the Company recorded warrants as general and administrative expense with $0 and $30,327, respectively.
| 22. | Options Issued to Employees |
TRIT’s 2009 Share Incentive Plan approved by its shareholders permits the Company to offer up to 525,500 shares, options and other securities to its employees and directors. On September 9, 2009, TRIT granted 525,500 share options with an exercise price equal to $6.75 to its senior management and employees. The options will vest on a schedule spanning 5 years contingent upon continuous service and will have 10-year contractual terms from September 9, 2009. The options will vest over five years at a rate of 20% per year, with the first 20% vesting on September 9, 2010. Certain options provide for accelerated vesting upon a change in control (as defined in the employee share option plan).
The fair value of options on the grant-date of September 9, 2009 was $3.53 per share, which was estimated by using the Black-Scholes Model. The total fair value of the options was $1,855,015. 210,200 and 210,200 options were vested as of June 30, 2012 and December 31, 2011, respectively. 93,700 and 93,700 options were exercised as of June 30, 2012 and December 31, 2011, respectively. A total of 9,000 and 5,400 options were forfeited as of June 30, 2012 and December 31, 2011, respectively. The Company recognized compensation cost for awards with graded vesting on a straight-line basis over the requisite service period for the award.
On June 5, 2012, TRIT granted 450,016 share options to its senior management and directors, out of which 225,008 share options were with an exercise price equal to $7.63, the exercise price for the remaining 225,008 share options will be the closing price of the Company’s ordinary shares on January 1, 2013. 225,008 share options were vested immediately at the grant date, the remaining 225,008 share options will be vested on January 1, 2013.
The fair value of the 255,008 share options on the grant-date June 5, 2012 was $1.55 per share, which was estimated by Binominal Model. The total fair value of the options was $348,762. The fair value of the remaining 225,008 options, which will be vested on January 1, 2013, will be estimated at the vesting date because the exercise price was agreed to be the closing price of the Company's ordinary shares on that day.
The option compensation expenses recognized were $439,675 and $96,846 for three months ended June 30, 2012 and 2011, respectively. The option compensation expenses recognized were $530,588 and $183,977 for six months ended June 30, 2012 and 2011, respectively. Another $797,263 will be recognized as general and administrative expense over the 800 days thereafter.
The following table summarizes the outstanding options, related weighted average fair value and life information as of June 30, 2012.
| Options Outstanding | Options Exercisable | |||||||||||||||||||||||||
| Range of Exercise Price Per Share | Number outstanding as of June 30, 2012 | Weighted Average Fair Value | Weighted Average Remaining Life (Years) | Number Exercisable as of June 30, 2012 | Weighted Average Exercise Price | |||||||||||||||||||||
| $ | 6.75 – 7.63 | 872,816 | $ | 2.69 | 6.32 | 337,908 | $ | 7.20 | ||||||||||||||||||
A summary of option activity under the employee share option plan as of June 30, 2012 and 2011, and changes during the periods then ended is presented below:
| F-24 |
| Options | Number of shares | Exercise Price | Remaining Life(Years) | Aggregated Intrinsic Value | ||||||||||||
| Outstanding as of January 01, 2012 | 426,400 | $ | 6.75 | 2.69 | $ | — | ||||||||||
| Granted during the period | 450,016 | 7.63 | 9.73 | |||||||||||||
| Exercised during the period | — | |||||||||||||||
| Forfeited during the period | (3,600 | ) | 6.75 | 2.57 | ||||||||||||
| Outstanding as of June 30, 2012 | 872,816 | $ | 7.20 | 6.32 | $ | — | ||||||||||
| Options | Number of shares | Exercise Price | Remaining Life(Years) | Aggregated Intrinsic Value | ||||||||||||
| Outstanding as of January 01, 2011 | 525,500 | $ | 6.75 | 3.69 | $ | 2,107,255 | ||||||||||
| Granted during the period | — | |||||||||||||||
| Exercised during the period | (93,700 | ) | 6.75 | 3.51 | ||||||||||||
| Forfeited during the period | — | |||||||||||||||
| Outstanding as of June 30, 2011 | 431,800 | $ | 6.75 | 3.73 | $ | 552,704 | ||||||||||
A summary of unvested options under the employee share option plan as of June 30, 2012 and 2011, and changes during the periods then ended is presented below:
| Options | Number of Shares | Weighted Average Fair Value | ||||||
| Unvested as of January 01, 2012 | 309,900 | $ | 3.53 | |||||
| Granted during the period | 450,016 | 1.55 | ||||||
| Exercised during the period | (225,008 | ) | 1.55 | |||||
| Forfeited during the period | (3,600 | ) | 3.53 | |||||
| Unvested as of June 30, 2012 | 531,308 | $ | 2.69 | |||||
| Expected to vest thereafter | 531,308 | $ | 2.69 | |||||
| Options | Number of Shares | Fair Value | ||||||
| Unvested as of January 01, 2011 | 420,400 | $ | 3.53 | |||||
| Granted during the period | — | |||||||
| Exercised during the period | — | |||||||
| Forfeited during the period | — | |||||||
| Unvested as of June 30, 2011 | 420,400 | $ | 3.53 | |||||
| Expected to vest thereafter | 420,400 | $ | 3.53 | |||||
| F-25 |
| 23. | Net Income per Ordinary Share |
The following table presents a reconciliation of basic and diluted net income per share:
| Three Months Ended June 30, | ||||||||
| (Unaudited) | ||||||||
| 2012 | 2011 | |||||||
| Net income attributable to Tri-Tech Holding Inc | $ | 1,370,887 | $ | 1,761,688 | ||||
| Weighted-average shares of ordinary share used to compute basic net income per share | 8,207,427 | 8,133,130 | ||||||
| Effect of dilutive ordinary share equivalents: | ||||||||
| Dilutive effect of warrants | — | 3,975 | ||||||
| Dilutive effect of employee stock options | — | 65,679 | ||||||
| Shares used in computing diluted net income per ordinary share | 8,207,427 | 8,202,784 | ||||||
| Basic net income per ordinary share | $ | 0.17 | $ | 0.22 | ||||
| Diluted net income per ordinary share | $ | 0.17 | $ | 0.21 | ||||
| Six Months Ended June 30, | ||||||||
| (Unaudited) | ||||||||
| 2012 | 2011 | |||||||
| Net income attributable to Tri-Tech Holding Inc | $ | 2,809,012 | $ | 3,460,669 | ||||
| Weighted-average shares of ordinary share used to compute basic net income per share | 8,194,813 | 8,094,639 | ||||||
| Effect of dilutive ordinary share equivalents: | ||||||||
| Dilutive effect of warrants | — | 3,975 | ||||||
| Dilutive effect of employee stock options | — | 65,679 | ||||||
| 8,194,813 | 8,164,293 | |||||||
| Shares used in computing diluted net income per ordinary share | 8,194,813 | 8,164,293 | ||||||
| Basic net income per ordinary share | $ | 0.34 | $ | 0.43 | ||||
| Diluted net income per ordinary share | $ | 0.34 | $ | 0.42 | ||||
All warrants and options have anti-dilutive effect due to the fact that the weighted average exercise price per share of these warrants and options are higher than the weighted average market price per share of ordinary shares during the three-month and six-month periods ended June 30, 2012. 229,275 warrants and 872,816 options will have dilutive effect if the weighted average exercise prices are lower than the weighted average market price.
| 24. | Certain Significant Risks and Uncertainty |
The Company’s substantial operations are carried out in the PRC. Accordingly, the Company’s business, financial condition and results of operations may be influenced by the political, economic and legal environments in the PRC and by the general state of the PRC economy. The Company’s operations in the PRC are subject to specific considerations and significant risks not typically associated with companies in North America and West Europe. These include risks associated with, among others, the political, economic and legal environments and foreign currency exchange. The Company’s results may be adversely affected by changes in governmental policies with respect to laws and regulations, anti-inflationary measures, currency conversion and remittance abroad, and rates and methods of taxation, among other things.
| F-26 |
The Company has two major customers who collectively represented approximately 35.1 % of the Company’s revenue for the quarter ended June 30, 2012. One is for India project, the unbilled revenue with this customer was $9,921,720 and $1,991,902 as of June 30, 2012 and December 31, 2011, respectively. The other is for a BT project in Xushui, the unbilled revenue balance was $5,807,714 and $857,114 as of June 30, 2012 and December 31, 2011, respectively. The five major customers represented approximately 56.3 % and 52.8% of the Company’s sales for the three and six months ended June 30, 2012.
Our suppliers vary from project to project. Many times, they are specifically appointed by the clients. Most of the material or equipment we purchase is non-unique and easily available in the market. The prices for those purchases, although increasing, are relatively consistent and predictable. A specific supplier might take up a significant percentage of our total purchase at a certain time for a large contract. However, the dependence on a specific supplier usually ends when the project is completed. We do not rely on any single supplier for our long-term needs.
| 25. | Commitments and Contingencies |
Operating Leases
As of June 30, 2012, the Company had commitments under certain operating leases, requiring annual minimum rentals as follows:
| For the Years Ended December 31, | Amount | |||
| 2012 | $ | 618,614 | ||
| 2013 | 852,341 | |||
| 2014 | 518,550 | |||
| 2015 | 92,345 | |||
| Total | $ | 2,081,850 | ||
The leased properties are principally located in the PRC and are used for administration and research and development purposes. The terms of these operating leases vary from one to five years. Pursuant to the contracts, when they expire, we have the rights to extend them with new negotiated prices. Rental expenses were $279,806 and $176,326 for the quarters ended June 30, 2012 and 2011, respectively. Rental expenses were $527,317 and $359,613 for the six months ended June 30, 2012 and 2011, respectively.
Product Warranties
The Company’s warranty policy generally is to replace parts if they become defective within one year after deployment at no additional charge. Historically, failure of product parts due to materials or workmanship has not been significant. The Company has not incurred any material unexpected costs associated with servicing its warranties. The Company continuously evaluates and estimates its potential warranty obligations, and records the related warranty obligation when the estimated amount becomes material at the time revenue is recorded.
| 26. | Segment Information |
The Company has three reportable operating segments. The segments are grouped with references to the types of services provided and the types of clients that use those services. As TTB and its subsidiaries and VIEs conduct business under the three segments, the total sales and costs are divided accordingly into three segmental portions. The Company’s Chief Executive Officer is the chief operating decision maker, and he assesses each segment’s performance based on net revenues and gross profit on contribution margin. The three reportable operating segments are:
Segment 1: Water, Wastewater Treatment and Municipal Infrastructure
Municipal water supply and distribution, wastewater treatment and gray water reuse engineering, procurement, and construction (EPC), build-transfer (BT); proprietary process control systems, process equipment integrated, and proprietary odor control systems, and other municipal facilities engineering, operation management, and related infrastructure construction projects.
Segment 2: Water Resource Management System and Engineering Service
Water resources protection and allocation, flood control and forecasting, irrigation systems, related system integration, proprietary hardware and software products, etc.
Segment 3: Industrial Pollution Control and Safety
| F-27 |
Provide systems for volatile organic compounds (VOC) abatement, odor control, water and wastewater treatment, water recycling facilities design, engineering, procurement and construction for oil, gas, petrochemical and power industries, safety and clean production technologies for oil, gas exploration and pipeline.
| For the Three Months Ended June 30, 2012 and 2011 (Unaudited) | ||||||||||||||||||||||||||||||||
| Segment 1 | Segment 2 | Segment 3 | Total | |||||||||||||||||||||||||||||
| 2012 | 2011 | 2012 | 2011 | 2012 | 2011 | 2012 | 2011 | |||||||||||||||||||||||||
| Revenues | $ | 8,354,428 | 16,769,633 | 8,436,000 | 2,314,470 | 6,250,106 | 1,117,784 | $ | 23,040,534 | $ | 20,201,887 | |||||||||||||||||||||
| Cost of revenues | 6,327,955 | 12,589,753 | 6,089,299 | 1,576,744 | 4,799,214 | 731,172 | 17,216,468 | 14,897,669 | ||||||||||||||||||||||||
| Operating expenses: | ||||||||||||||||||||||||||||||||
| Selling and Marketing Expenses | 222,521 | 143,878 | 457,484 | 215,005 | 255,848 | 113,267 | 935,853 | 472,150 | ||||||||||||||||||||||||
| General and Administrative Expenses | 1,389,852 | 1,196,760 | 908,000 | 247,098 | 949,694 | 438,574 | 3,247,546 | 1,882,432 | ||||||||||||||||||||||||
| Research and Development | 6,167 | 7,936 | 5,361 | 8,263 | — | 10,560 | 11,528 | 26,759 | ||||||||||||||||||||||||
| Total operating expenses | 1,618,540 | 1,348,574 | 1,370,845 | 470,366 | 1,205,542 | 562,401 | 4,194,927 | 2,381,341 | ||||||||||||||||||||||||
| Other income (expenses), net | 100,754 | (34,363 | ) | (21,326 | ) | (30,230 | ) | (113,778 | ) | (28,474 | ) | (34,350 | ) | (93,067 | ) | |||||||||||||||||
| Income (loss) before income taxes | $ | 508,687 | 2,796,943 | 954,530 | 237,130 | 131,572 | (204,263 | ) | $ | 1,594,789 | $ | 2,829,810 | ||||||||||||||||||||
| For the Six Months Ended June 30, 2012 and 2011 (Unaudited) | ||||||||||||||||||||||||||||||||
| Segment 1 | Segment 2 | Segment 3 | Total | |||||||||||||||||||||||||||||
| 2012 | 2011 | 2012 | 2011 | 2012 | 2011 | 2012 | 2011 | |||||||||||||||||||||||||
| Revenues | $ | 16,761,401 | 29,674,019 | 14,690,590 | 3,955,529 | 10,809,855 | 4,125,550 | $ | 42,261,846 | $ | 37,755,098 | |||||||||||||||||||||
| Cost of revenues | 12,252,219 | 22,211,750 | 10,610,453 | 2,445,352 | 8,357,608 | 2,783,598 | 31,220,280 | 27,440,700 | ||||||||||||||||||||||||
| Operating expenses: | ||||||||||||||||||||||||||||||||
| Selling and Marketing Expenses | 448,147 | 252,935 | 883,774 | 365,733 | 442,925 | 167,655 | 1,774,846 | 786,323 | ||||||||||||||||||||||||
| General and Administrative Expenses | 2,920,267 | 1,937,901 | 1,530,294 | 742,334 | 1,650,345 | 1,268,991 | 6,100,906 | 3,949,226 | ||||||||||||||||||||||||
| Research and Development | 11,918 | 7,936. | 68,480 | 48,248 | — | 10,560. | 80,398 | 66,744 | ||||||||||||||||||||||||
| Total operating expenses | 3,380,332 | 2,198,772 | 2,482,548 | 1,156,315 | 2,093,270 | 1,447,206 | 7,956,150 | 4,802,293 | ||||||||||||||||||||||||
| Other income (expenses), net | 448,169 | (40,016 | ) | (62,242 | ) | (30,295 | ) | (129,372 | ) | (26,823 | ) | 256,555 | (97,134 | ) | ||||||||||||||||||
| Income (loss) before income taxes | $ | 1,577,019 | 5,223,481 | 1,535,347 | 323,567 | 229,605 | (132,077 | ) | $ | 3,341,971 | $ | 5,414,971 | ||||||||||||||||||||
| F-28 |
Assets by Segment
The Company evaluates its assets by segment to generate information needed for internal control, resource allocation and performance assessment. This information also helps management to establish a basis for asset realization, determine insurance coverage, assess risk exposure, and meet requirements for external financial reporting.
Segment assets of the Company are as follows:
| Segment Assets | Segment 1 | Segment 2 | Segment 3 | Total | ||||||||||||
| As of June 30, 2012 (Unaudited) | $ | 87,289,312 | $ | 38,127,464 | $ | 28,945,358 | $ | 154,362,134 | ||||||||
| As of December 31, 2011 | $ | 84,910,147 | $ | 26,081,474 | $ | 27,659,057 | $ | 138,650,678 | ||||||||
| 27. | Subsequent Events |
Management has considered all events occurring through the date the financial statements have been issued, and has determined that there are no such events that are material to the financial statements.
| F-29 |