Attached files
| file | filename |
|---|---|
| EX-32.1 - EXHIBIT 32.1 - Tri-Tech Holding, Inc. | v222033_ex32-1.htm |
| EX-31.2 - EXHIBIT 31.2 - Tri-Tech Holding, Inc. | v222033_ex31-2.htm |
| EX-31.1 - EXHIBIT 31.1 - Tri-Tech Holding, Inc. | v222033_ex31-1.htm |
| EX-32.2 - EXHIBIT 32.2 - Tri-Tech Holding, Inc. | v222033_ex32-2.htm |
|
U. S. SECURITIES AND EXCHANGE COMMISSION
|
WASHINGTON, DC 20549
FORM 10-Q
|
x
|
Quarterly report pursuant to Section 13 or 15(d) of the Securities Exchange Act of 1934
|
For the quarterly period ended June 30, 2011
|
¨
|
Transition report pursuant to Section 13 or 15(d) of the Securities Exchange Act of 1934
|
For the transition period from ___________ to ___________.
Commission File Number 001-34427
|
Tri-Tech Holding Inc.
|
|
(Exact name of registrant as specified in its charter)
|
|
Cayman Islands
|
Not Applicable
|
|
|
(State or other jurisdiction of
|
(I.R.S. employer
|
|
|
incorporation or organization)
|
identification number)
|
|
16th Floor of Tower B, Renji Plaza No. 101
|
|
Jingshun Road, Chaoyang District
|
|
Beijing, People’s Republic of China 100102
|
|
(Address of principal executive offices and zip code)
|
+86 (10) 5732-3666
(Registrant’s telephone number, including area code)
Indicate by check mark whether the registrant (1) has filed all reports required to be filed by Section 13 or 15(d) of the Securities Exchange Act of 1934 during the preceding 12 months (or for such shorter period that the registrant was required to file such reports) and (2) has been subject to such filing requirements for the past 90 days.
Yes x No ¨
Indicate by check mark whether the registrant has submitted electronically and posted on its corporate Web site, if any, every Interactive Data File required to be submitted and posted pursuant to Rule 405 of Regulation S-T (§232.405 of this chapter) during the preceding 12 months (or for such shorter period that the registrant was required to submit and post such files).
Yes ¨ No ¨
Indicate by check mark whether the registrant is a large accelerated filer, an accelerated filer, a non-accelerated filer, or a smaller reporting company.
|
Large accelerated filer
|
¨
|
Accelerated filer
|
¨
|
|
Non-accelerated filer (Do not check if a smaller reporting company)
|
¨
|
Smaller reporting company
|
x
|
Indicate by check mark whether the registrant is a shell company (as defined in Rule 12b-2 of the Exchange Act).
Yes ¨ No x
Indicate the number of shares outstanding of each of the issuer’s classes of common stock, as of the latest practicable date. The Company is authorized to issue 30,000,000 ordinary shares, $0.001 par value per share. As of the date of this report, the Company has 8,160,407 outstanding ordinary shares, excluding 21,100 treasury shares.
TRI-TECH HOLDING INC.
FORM 10-Q
|
SPECIAL NOTE REGARDING FORWARD-LOOKING STATEMENTS
|
ii
|
||||
|
PART I.
|
FINANCIAL INFORMATION
|
1 | |||
|
Item 1.
|
Financial Statements
|
1 | |||
|
Item 2.
|
Management’s Discussion and Analysis of Financial Condition and Results of Operations
|
1 | |||
|
Item 3.
|
Quantitative and Qualitative Disclosures about Market Risk
|
24 | |||
|
Item 4.
|
Controls and Procedures
|
24 | |||
|
PART II.
|
OTHER INFORMATION
|
26 | |||
|
Item 1.
|
Legal Proceedings
|
26 | |||
|
Item 1A.
|
Risk Factors
|
26 | |||
|
Item 2.
|
Unregistered Sales of Equity Securities and Use of Proceeds
|
26 | |||
|
Item 3.
|
Defaults Upon Senior Securities
|
26 | |||
|
Item 4.
|
(Removed and Reserved)
|
26 | |||
|
Item 5.
|
Other Information
|
26 | |||
|
Item 6.
|
Exhibits
|
26 | |||
i
SPECIAL NOTE REGARDING FORWARD-LOOKING STATEMENTS
This document contains certain statements of a forward-looking nature. Such forward-looking statements, including but not limited to projected growth, trends and strategies, future operating and financial results, financial expectations and current business indicators are based upon current information and expectations and are subject to change based on factors beyond the control of the Company. Forward-looking statements typically are identified by the use of terms such as “look,” “may,” “should,” “might,” “believe,” “plan,” “expect,” “anticipate,” “estimate” and similar words, although some forward-looking statements are expressed differently. The accuracy of such statements may be impacted by a number of business risks and uncertainties that could cause actual results to differ materially from those projected or anticipated, including but not limited to the following:
|
|
•
|
the timing of the development of future products;
|
|
|
•
|
projections of revenue, earnings, capital structure and other financial items;
|
|
|
•
|
statements of the Company’s plans and objectives;
|
|
|
•
|
statements regarding the capabilities of its business operations;
|
|
|
•
|
statements of expected future economic performance;
|
|
|
•
|
statements regarding competition in its market; and
|
|
|
•
|
assumptions underlying statements regarding the Company or its business.
|
Readers are cautioned not to place undue reliance on these forward-looking statements, which speak only as of the date hereof. The Company undertakes no obligation to update this forward-looking information. Nonetheless, the Company reserves the right to make such updates from time to time by press release, periodic report or other method of public disclosure without the need for specific reference to this Report. No such update shall be deemed to indicate that other statements not addressed by such update remain correct or create an obligation to provide any other updates.
ii
PART I. FINANCIAL INFORMATION
|
Item 1.
|
Financial Statements
|
See the financial statements following the signature page of this report, which are incorporated herein by reference.
|
Item 2.
|
Management’s Discussion and Analysis of Financial Condition and Results of Operations
|
The following discussion contains, in addition to historical information, forward-looking statements that involve risks and uncertainties. The actual results could differ materially from those described herein.
Company Overview
We (“Tri-Tech Holding Inc.,” “TRIT,” “our” or “us”) are a leading provider of integrated solutions to China’s water resource management and environmental protection industries. Headquartered in Beijing, China, we have 302 employees among our eight subsidiaries and controlled companies as of June 30, 2011: (1) Tri-Tech International Investment, Inc. (“TTII”), (2) Tri-Tech (Beijing) Co., Ltd. (“TTB”), (3) Beijing Satellite Science & Technology Co. (“BSST”), (4) Ordos Tri-Tech Anguo Investment Co., Ltd. (“TTA”), (5) Tianjin Baoding Environmental Technology Co., Ltd. (“Baoding”), (6) Tranhold Environmental (Beijing) Tech Co., Ltd. (“Tranhold”), (7) Beijing Yanyu Water Tech Co., Ltd. (“Yanyu”) and (8) Tri-Tech Infrastructure LLC, a Delaware limited liability company located in the United States (“TIS”). Since our incorporation in 2002, we have successfully implemented more than 800 projects throughout China.
We aim to provide reliable, workable solutions to complex environmental challenges faced by governments and large state-owned enterprises. Our major clients are a combination of government agencies, municipalities, and industrial companies located throughout China. Our strategy for maintaining a leading position in the market is to earn positive customer recognition, to continually improve our reputation in the industry and to strengthen our customer relations with government agencies and industrial clients by providing diverse products and services based on proprietary technology, tailored projects and turnkey solutions to our diversified customer base.
Our principal executive offices are located at 16th Floor of Tower B, Renji Plaza, 101 Jingshun Road, Chaoyang District, Beijing 100102 China. The telephone number at this address is +86 (10) 5732-3666. Our ordinary shares are traded on the NASDAQ Capital Market under the symbol “TRIT.”
Our Internet website, www.tri-tech.cn, provides a variety of information about us. Our annual reports on Form 10-K, quarterly reports on Form 10-Q and current reports on Form 8-K filed with the United States Securities and Exchange Commission (the “SEC”) are available, as soon as practicable after filing, under the investor relations tab on our website, or by a direct link to our filings on the SEC’s free website.
Principal Products or Services and Their Markets
Tri-Tech operates in three segments: (i) water, wastewater treatment and municipal infrastructure, (ii) water resource management system and engineering services, and (iii) industrial pollution control and safety. Through our subsidiaries and contractual controlled companies, we provide self-manufactured and proprietary, as well as third-party, products, system integration and other services in the fields of environmental protection, and water resource monitoring, development, utilization and protection. We design water works and customized facilities for reclaiming and reusing water, treating sewage and disposing of solid waste for China’s municipalities and larger cities. These systems combine process equipment, controls and instruments, information management systems, resource allocation, local and distant networking hardware, and software. They include sensors, control systems, programmable logic controllers, and supervisory control and data acquisition systems. For government agencies, we design systems that track natural waterway levels for drought control, monitor groundwater quality, and generally manage water resources. For petroleum refineries, petrochemical factories and power plants, we provide systems for volatile organic compound (“VOC”) abatement, odor control, water and wastewater treatment, and water recycling through project engineering, procurement and construction. We also provide safety and clean production technologies for oil and gas field exploration and pipelines.
1
Our business is divided into three segments according to the types of services provided and the clients served. We assess the performance of each segment based on the segment net revenue and gross profit on contribution margin. More detailed descriptions of the three reportable operating segments follow:
Segment 1: Water, Wastewater Treatment and Municipal Infrastructure
This segment includes projects involving municipal water supply and distribution, wastewater treatment and gray water reuse engineering, procurement and construction; build-and-transfer; proprietary process control systems; process equipment integration, and proprietary odor control systems; and other municipal facilities engineering, operation management and related infrastructure construction projects.
In June 2011, we entered into an agreement with Beijing Huaxia Yuanjie Water Technology Co., Ltd (“Yuanjie Water”) to acquire a majority stake in Yuanjie Water. According to the terms of the agreement, Yuanjie became a subsidiary of TRIT for majority control of the ownership, effective on July 22, 2011.Directly targeting the consumer use market, Yuanjie Water is engaged in water system integration for large high-rise buildings, through research and development, manufacturing, installation and sales and operation of water treatment equipment systems. Under the terms of the agreement, TTB will invest approximately RMB 11 million (approximately $1.69 million) into Yuanjie Water. This includes RMB 10 million (approximately $1.55 million) in cash and intellectual property valued at RMB 1 million (approximately $0.15 million). In return, TTB will receive 51% of the equity of Yuanjie Water.
Segment 2: Water Resource Management System and Engineering Services
This segment involves projects relating to water resource protection and allocation, flood control and forecasting, irrigation systems, related system integration, proprietary hardware and software products and similar ventures.
Segment 3: Industrial Pollution Control and Safety
This segment focuses on industrial wastewater treatment using zero liquid discharge technology, seawater desalination, air pollution and odor control, and industrial safety and emergency response for the oil, gas, petrochemical and power industries. Business models in this segment include the traditional engineering, procurement and construction, and construction and operation of wastewater treatment plant.
In June 2011, we acquired the operating assets of J&Y International Inc. (“J&Y”) for a total consideration of approximately $1.5 million. Based in Wisconsin, USA, J&Y is a water treatment company that designs and manufactures industrial chemical water recovery systems, desalination plants, domestic and industrial wastewater treatment systems and reverse osmosis filtration systems. J&Y formulates innovative solutions to solve water treatment and chemical concentration problems. It uses various treatment technologies such as evaporators, reverse osmosis, filtration, and ion exchange, among other biological, physical and chemical methods and processes, to meet customers’ demands.
Revenues by Segment
In the quarter ended June 30, 2011, our total revenue was $20.2 million, including $16.8 million in Segment 1, $2.3 million in Segment 2, and $1.1 million in Segment 3. The tables presented below show the performance of each of the business segments for the third-month and six-month periods ended June 30, 2011. For the quarter ended June 30, 2011, Segment 1 contributed 83% of the total revenues; Segment 2 contributed 11.5%; and Segment 3 contributed the remaining 5.5%.
2
|
Three Months Ended June 30, 2011
|
||||||||||||||||||||||||||||||||
|
Segment 1:
|
%
|
Segment 2:
|
%
|
Segment 3:
|
%
|
Total
|
%
|
|||||||||||||||||||||||||
|
System Integration
|
$ | 16,769,633 | 100.0 | % | $ | 2,057,254 | 88.9 | % | $ | 1,056,666 | 94.5 | % | $ | 19,883,553 | 98.4 | % | ||||||||||||||||
|
Hardware Products
|
— | — | % | 257,216 | 11.1 | % | 61,118 | 5.5 | % | 318,334 | 1.6 | % | ||||||||||||||||||||
|
Software Products
|
— | — | % | — | — | % | — | — | % | — | — | % | ||||||||||||||||||||
|
Total Revenues
|
$ | 16,769,633 | 83.0 | % | $ | 2,314,470 | 11.5 | % | $ | 1,117,784 | 5.5 | % | $ | 20,201,887 | 100.0 | % | ||||||||||||||||
The following table provides revenue percentage for each segment and category for the six months ended June 30, 2011. Total revenue has reached 55% of the expected guideline for 2011.
|
Six Months Ended June 30, 2011
|
||||||||||||||||||||||||||||||||
|
Segment 1:
|
%
|
Segment 2:
|
%
|
Segment 3:
|
%
|
Total
|
%
|
|||||||||||||||||||||||||
|
System Integration
|
$ | 29,674,019 | 100.0 | % | $ | 2,183,221 | 55.2 | % | $ | 3,896,807 | 94.5 | % | $ | 35,754,047 | 94.7 | % | ||||||||||||||||
|
Hardware Products
|
— | — | % | 1,772,308 | 44.8 | % | 228,743 | 5.5 | % | 2,001,051 | 5.3 | % | ||||||||||||||||||||
|
Software Products
|
— | — | % | — | % | — | — | % | — | — | % | |||||||||||||||||||||
|
Total Revenues
|
$ | 29,674,019 | 78.6 | % | $ | 3,955,529 | 10.5 | % | $ | 4,125,550 | 10.9 | % | $ | 37,755,098 | 100.0 | % | ||||||||||||||||
Backlog and Pipeline for 2011
For the remaining two quarters of 2011, we anticipate that our revenues will reach a range of $75 million to $80 million. Net income for this period will likely be between $11 million and $12.8 million. Assuming the number of total outstanding shares remains at 8,160,407, excluding the 21,100 shares held in treasury, we expect our earnings-per-share to range from $1.35 to $1.58. The fully diluted earnings-per-share for the second quarter of 2011 was $0.21. The earnings-per-share for the six months ended June 30, 2011 was $0.42.
Our backlog represents the amount of contract work remaining to be completed, including revenues from existing contracts and work in progress expected to be recognized in 2011, based on the assumption that these projects will be completed on time according to the project schedules. As of June 30, 2011, we had a total backlog of $48.3 million, including $39.3 million in Segment 1, $2.3 million in Segment 2, and the remaining $6.7 in Segment 3.
We are currently expecting potential projects in the pipeline with a total expected value of $147.2 million, of which approximately $95.1 million is for Segment 1, $21.8 million for Segment 2, and $30.3 million for Segment 3.
Macro-Economic Factors and Business Trends
China’s gross domestic product (“GDP”) maintained steady growth in the second quarter of 2011. According to the China State Bureau of Statistics, China’s GDP for the six months ended June 30, 2011 reached RMB 20.4 trillion (or $3.2 trillion), an increase of 9.6% over the same period in 2010. The increase for the second quarter was 9.5% compared to the same period last year. The GDP for the second quarter increased by 2.2% compared to the first quarter in 2011. It is believed that the moderate slowdown in the Chinese economy will reduce China’s domestic inflation pressure and that the Chinese economic growth will continue in the upcoming quarters.
In addition, the industrial production growth (“IPG”) and fixed asset investment (“FAI”) in China also saw stable growth as enterprises revenue continue to grow during the first six months of 2011. The industrial production growth rate was 14.3% for the six months ended June 30, 2011. By region, the IPG rates for East China, Central China and West China in the six months ended June 30, 2011 were 12.4%, 17.8% and 17.3%, respectively. The FAI reached RMB 12.5 trillion (or $1.9 trillion) in the six months ended June 30, 2011, an increase of 25.6% over the same period in 2010. By region, urban FAI for East China, Central China and West China in the six months ended June 30, 2011 were 22.6%, 31% and 29.2%, respectively. The relatively higher IPG and FAI growth rates in Central and West China helped stimulate our expansion in these areas.
Finally, local investments have been active in the first year of the 12th Five-Year Plan, with a growth rate of 28.1% during the first six months of 2011.
3
Based on the data shown above, we believe we are likely to continue our rapid growth during the remaining quarters of 2011 and beyond.
New Opportunities in Business
According to the Guidelines to the Environmental Industry Development Program issued recently, during the 12th Five-Year Plan the government will give top priority in developing environmental industry to the retrofit and construction of wastewater treatment infrastructure in small- to medium-sized cities, high concentration and non-biodegradable industrial wastewater treatment, and sludge disposal. During the 12th Five-Year Plan, the government plans to further its efforts in water conservation and the use of recycled water. Compared to the 70% utilization ratio of recycled water for developed countries, China’s water reuse is still in its infancy. Recycled water as a resource has tremendous potential in China, as most cities in China are in need of water. Over 400 out of 655 cities are in water shortage, and 200 of these 400 cities are in severe water shortage.
China Association of Environmental Protection Industry estimates investment in industrial wastewater treatment plants and municipal wastewater treatment plants to be over RMB 1 trillion during the 12th Five-Year Plan period. The wastewater treatment market is likely to maintain a high growth rate in the next 10 years also due to the accelerated industrialization process. It is estimated that the waste water treatment capacity in China will increase by 63% from 2011 to 2015, a compound annual growth rate (“CAGR”) of 10%. In light of the high market demand on wastewater treatment solutions, we believe that opportunities abound for up-stream wastewater pipeline manufacturers and mid-stream wastewater treatment plant builders.
China’s most stringent water resources management regulation was published earlier this year, which combines a series of documents such as the State Council Circular No. 1 and Action Program on Implementation of the Most Stringent Water Resources Management Work Plan. We believe that the strict regulations bring opportunities for the water recycle industry. In recent years, local governments and large industrial enterprises have started their water recycle projects. Gradually, such projects become less dominated by government investment and function more as market-oriented operations, especially in cities in water shortage such as Beijing and Tianjin. Residential water prices have risen significantly due to higher cost. Therefore, recycled water is becoming increasingly competitive for the low cost. The Ministry of Industry and Information Technology has also set the target that industrial water consumption shall be reduced by 30% by 2015.
China’s seawater desalination has made remarkable progress in technology and in equipment. According to the State Oceanic Administration, China’s seawater desalination capacity increased to 600,000 tons daily from 30,000 tons daily 10 years ago, an increase of 20 times. It is estimated that the capacity will further quadruple in the next 10 years. According to the target set forth in Seawater Desalination Special Plan issued by the government, China’s seawater desalination capacity will reach 2.5 million tons to 3 million tons daily by 2020.
Government financial support is the primary driving force behind the development of water resource infrastructure construction. According to the Ministry of Water Resources, the Ministry of Finance has invested RMB 3.8 billion ($587 million) in 1,100 counties across the country. The newly built projects in Hunan, Jiangxi and Yunnan Provinces have proven to be instrumental in reducing casualties and property damages during this year’s flood season. The Office of State Flood Control and Drought Relief recently held a flood prevention conference to encourage acceleration of construction progress in every province. Special water resource funds are anticipated for various stages with different focus. By 2013, the fund will be allocated in favor of bottleneck projects such as small- to medium-sized river improvements.
Strategies for Growth
Segment 1: Water, Wastewater Treatment and Municipal Infrastructure
We are continuously working on expanding our geographical reach from the existing bases of operations in Beijing, Tianjin, Hubei, Hunan, Ningxia, Inner Mongolia, Xinjiang, Shaanxi, Sichuan, and Heilongjiang Municipalities, Provinces and Autonomous Regions. Recently, the expansion has reached Anhui, Shanxi and Shandong Provinces.
4
The recent investment in Yuanjie Water was a part of our strategic growth plan in this segment. Founded in 2007, Yuanjie Water is a systems integrator specializing in water equipment sales and installation for high-rise building, and management and operation of water treatment facilities. With its headquarters and production based in Beijing, the company has a corporate advisory team composed of water industry experts from prestigious universities in China, the United States and Taiwan. Its main business includes water system integration services, and the manufacturing and maintenance of water treatment facilities. The company has six major product lines, including residential building secondary water supply products, drinking water treatment products, wastewater treatment and water recycle products, tanks, disinfectors and membrane treatment products. It has altogether more than 20 products and 10 patents. Yuanjie Water’s core technology includes integrated pressurized purification, and dissolved oxygen biochemical technology. Its products have obtained international certifications from quality control, environmental control and occupational health safety management institutes. It also has obtained China Compulsory Certificate and seven hygiene licenses for drinking water equipment and supplies. Yuanjie’s products are widely used in universities, hospitals, government buildings, hotels, shopping malls, office buildings and residences. They have also received a number of awards. Yuanjie is strategically focused on becoming an industry leader in water system integration, providing know-how, technology and service to customers.
We are building up our capacity to transform from a sub-contractor to a general contractor. We have grown from a provider of hardware and system integration to a full-service company capable of the engineering, procurement and construction of municipal wastewater and solid waste disposal facilities. As we continue to grow, we intend to expand through winning larger contracts and higher-level build-and-transfer projects.
In addition to the traditional engineering, procurement and construction business, we started to engage in the build-and-transfer business model, for instance, through our current project of the Ordos drinking water treatment plant. The build-and-transfer model is a contractual arrangement where the project proponent undertakes the financing and construction of a given facility and after its completion turns it over to a government agency or a local government department, which pays the proponent its total investment on the project plus a reasonable rate of return thereon on an agreed schedule. Under a build-and-transfer contract, a developer or project company provides the financing for the project and receives in turn a medium- to long-term municipal payment obligation, typically of two to three years in the case of our projects. As the Ordos project progresses, we are gaining experience in the build-and-transfer project process, which enables us to help cities create better environmental and financial strategies, to deliver value-added solutions to government agencies, and to better position ourselves in exploring further business opportunities under this business model.
In June 2011, we were awarded a contract for the expansion phase of the water treatment plant for the City of Ordos valued at approximately RMB 130 million ($20 million). The expansion project is a follow-up contract to the initial phase project ($40 million) we won in 2010. We are to provide services including design optimization, procurement, installation, pilot testing and commissioning, owner’s personnel training, operation and maintenance manual preparation, and other services as needed. The expansion phase of the project is scheduled for initial test runs no later than June 30, 2012.
Segment 2: Water Resources Management Systems and Engineering Services
In this segment, we are gradually transforming from a specialty solution provider to a full-service solution provider for larger scale river basin projects. The Chinese government’s decision to initiate new programs and allocate significant investment to these projects offers us significant business opportunities. We have been investing resources to developing water quantity and quality monitoring technologies and upgrading our proprietary products. To ensure our leading position in the water sector in China, we recently introduced state-of-the-art water quantity and quality monitoring instruments to our application development.
Segment 3: Industrial Pollution Control and Safety
In this segment, we are strengthening our industrial pollution services for the energy sector such as the oil and petrochemical industry. While we have previously implemented the air pollution control systems for the petrochemical industry, we believe that there are significant business opportunities, such as water and wastewater treatment and safety, in related industries. Through BSST, our subsidiary, we have set up a new business unit in the first quarter of 2011 to focus on the business of water and wastewater treatment specifically for the oil and petrochemical industry.
5
With the recent acquisition of J&Y, we are aggressively expanding our business reach into seawater desalination and industrial water treatment businesses overseas. J&Y contributes to us its cutting edge technologies, including desalination, zero liquid discharge technology, evaporators, reverse osmosis, filtration, and ion exchange, among other biological, physical and chemical methods.
Potential Acquisitions of Complementary Businesses
During the past quarter, we have been active in acquisitions and business investments. During the remaining quarters of 2011, we continue to look for acquisition targets to further our growth. The markets in which we operate are highly fragmented with small competitors. We are aiming for targets believed to add significant value to our business. These potential targets may have strong customer relations but limited market access, or may possess specialized technologies but their business size might not allow them to fully utilize their specialties. When evaluating potential acquisition targets, the management team uses a disciplined, conservative approach to ensure the acquisitions are strategic and beneficial to our business.
Competition
We operate in a highly competitive industry characterized by rapid technological development and evolving industrial standards. Given the stimulus initiatives in China, we expect the competition to intensify as more companies enter the market, notwithstanding relatively high barriers to entry in terms of technical expertise and financial investment.
We compete primarily on the basis of customer recognition and industry reputation, research and development strengths, comprehensive product offerings and a competitive pricing structure. The low cost we have been striving to achieve provides us with advantages in competing with international competitors. With local rivals, our superior technology ensures top quality services and repeat customers. Our established nationwide distribution and customer service network and our knowledge of local markets allow us an advantage over international competitors who typically appoint only one distributor in the China market responsible for selling and servicing their products. In addition, we provide a more comprehensive offering of products than most of our international or local competitors. In order to maintain and enhance our competitive advantage, we must continue to focus on competitive pricing, technological innovation, staying at the forefront of the market trends, as well as improving our proprietary manufacturing processes.
As a result of our leading position in the industry, we are actively participating in the drafting of industrial standards and guidelines with the state ministries of China. We have participated in drafting technical regulations for automatic hydrologic measurement and reporting systems promulgated by the Ministry of Water Resources, as well as technical guidelines of municipal sewage treatment plant operation, management and safety for the Ministry of Construction. In the first quarter of 2011, we were invited to participate in the Water Information Forum in Fujian Province held by the Disaster Reduction Committee of the China Hydraulic Engineering Society, where we presented our Yanyu mountain torrent monitoring and forecasting products and system platform.
Although we believe that our competitive strengths provide us with advantages over many of our competitors, some of the international competitors have stronger brand names, longer operating histories, more established relationships with their customers, more research and development capabilities and greater marketing budgets, among other resources. Most of our international competitors are substantially larger and have greater access to capital than we do. Some of the domestic competitors have broader customer bases, better access to government authorities and stronger industry-based background.
Principal Suppliers
Our suppliers vary from project to project. Often, they are specifically appointed by the clients. Most of the materials or equipment we purchase are not unique and are easily available in the market. The prices for those purchases, although increasing, are relatively consistent and predictable. A specific supplier might constitute a significant percentage of our total purchase at a certain time for a large contract. The dependence on a specific supplier usually ends when the project is completed. We do not rely on any single supplier in the long term.
6
Customers and Marketing
We operate on a project basis, which do not usually allow us to create a long term relationship with our customers. We negotiate with various government agencies, municipalities, industrial enterprises and/or their prime contractors in order to secure and undertake our various contracts. Our major customers usually account for a high percentage of our total sales. The top customer represented approximately 79.5% of the total revenues of the second quarter of 2011, while in the same period last year our top five customers represented 31% of the total revenue. Although we are dependent on our large clients to a certain degree, unlike other commercial businesses, the collectability for our accounts receivables are relatively secure due to the nature of our client bases, consisting predominantly of government agencies and large nation-owned enterprises.
Patents and Proprietary Rights
In the quarter ended June 30, 2011, we have obtained three new software copyrights in China. Currently, we have a total of 27 software copyrights, two product patents and two registered trademarks.
Government Regulation and Approvals
As described in greater detail above in the discussion of our business segments, government policies and initiatives in the various industries we serve have a considerable impact on our potential for growth. We generally undertake projects for government entities and enterprises and must complete the projects in accordance with the terms of the contracts in which we enter with those entities.
Employees
As of June 30, 2011, our total headcount was 302, of which 120 (40%) are in technical support and project management, 79 (26%) are in sales, 28 (9%) are in research and development, 25 (8%) are in finance, and 50 (17%) are in general and administrative functions. The increase of our headcount is mainly attributable to the project management department, which grew by 19, and in the sales department, which grew by 21. Total headcount increased by 63 compared to the end of March 31, 2011. Our teams are very stable compared to our peers.
Research and Development
We focus our research and development efforts on improving our development efficiency and the quality of our products and services. Currently, our research and development team consists of 28 experienced researchers, engineers, software developers and programmers, 9 headcount increase compared to 19 by the end of the first quarter 2011. In addition, some of the technical support team regularly participates in research and development programs. There are five major on-going software research and development projects and one hardware research and development project. The development phase projects are expected to be completed in the second half of 2011.
As our research and development base, Baoding focuses on technology development, software development, pilot testing, manufacturing and pre-installation/pre-assembly of our proprietary products. The Baoding research, development and production facility construction started officially in June 2011. Part I of phase one of the constructions is for the odor control system fabrication and automatic control box assembly workshop, which is scheduled to be completed towards the end of September 2011. The design for part II of the phase one construction, the main office building and the dormitory, has been submitted for government approval. Phase one is to be completed around May 2012. Phases two and three of the construction are scheduled to be completed by the end of 2013. The total capital budget is $18 million for phases one and two. For the quarter ended June 30, 2011, total spending on the Baoding construction project was approximately $115,894. The total spending on the project as of June 30, 2011 was $5.83 million inclusive of the consideration of $5.3 million for the land use right.
7
In addition to our current research and development projects, we are also pursuing cooperative opportunities with several industrial companies in the U.S. and Europe. The technologies we are pursuing include the membrane bioreactor technology, forward osmosis membrane technology, the latest ecological engineering for wastewater treatment and advanced solid-liquid separation technology.
We entered into a license agreement for the new forward osmosis technology with Hydration Technology Innovations, LLC (“HTI”) in 2010. We will construct and operate one or more forward osmosis pilot units incorporating the licensed technology. We are authorized and licensed to construct and operate such pilot units in both municipal and industrial sites for wastewater treatment testing, demonstration and evaluation. The HTI personal hydration products are at the development stage, and are undergoing design changes for localization.
Properties
Our primary office location is the 15th and 16th Floor of Tower B, Renji Plaza, 101 Jingshun Road, Chaoyang District, Beijing 100102 China. The total rental space for the two floors is 908 square meters for the 15th floor and 986 square meters for the 16th floor. The lease contract for this location is from September 1, 2010 to August 31, 2013. We also have a 1,300 square meter rental office in Tianjin, located at Huayuan Property Management Zone, 4th Floor, Kaide A Complex, 7 Rongyuan Road, Tianjin, with a rental term to expire in December 2014. In addition, we have three other rental office locations in various areas of Beijing, for which the lease contracts expire at various times no later than August 26th, 2012.
TTB entered into a land use right purchase agreement with a local government agency, Tianjin Land Resource Bureau Baodi Branch on November 26, 2010. The agreement was for the land use right of an area of 158,954 square meters in exchange for the consideration of RMB 35 million (US $5.3 million). The consideration has been fully paid as of December 31, 2010. The land is located at West Tianbao Road, Baodi Economic Development Zone in Tianjin. The land use right is for 50 years starting on January 18, 2011. The official land use right application process has been completed in June 2011 and land use right certificated obtained in July 2011. We have confirmed the transfer of the land use right and the acceptance letter was signed on January 18, 2011. Therefore, the amortization of the land use right over the expected duration of 50 years has started since January 2011 with RMB 180,338, or $27,740 per quarter. The first phase of the construction is in progress and expected to be completed by 2012.
Operating Performance Overview for the Three and Six Months Ended June 30, 2011 and 2010
Our operating revenues are primarily derived from system design and integration, hardware product design, manufacturing and sales, and software design and sales. The software sales have been combined into the system integration category. Our 2011 second quarter results reflected stable growth. Highlights of our financial results include:
|
|
·
|
Total revenue increased to $20,201,887 in the second quarter of 2011, an increase of $12,099,109, or 149.3%, from $8,102,778 in the same period 2010. This increase is primarily attributable to the following factors:
|
|
|
o
|
Systems integration revenue increased from $5,587,132 in the second quarter of 2010 to $19,883,553 in the same period in 2011, an increase of $14,296,421, or 255.9%.
|
|
|
o
|
Revenue from hardware products totaled $318,334 in the second quarter of 2011, a decrease of $1,609,426, or 83.5%, from $1,927,760 in the second quarter of 2010.
|
|
|
o
|
Work related to software products development was done as part of system integration projects. Therefore, it has been accounted for in the category of system integration revenue.
|
|
|
·
|
Total cost of revenue increased by $9,799,110 from $5,098,559 in the second quarter of 2010 to $14,897,669 in the second quarter of 2011, a 192.2% increase compared with the same period in 2010. This increase is attributable to the increase in system integration by 325.3%, and the decrease in hardware products by 83.3%.
|
|
|
·
|
Total operating expenses were $2,381,341 for the second quarter of 2011, or 11.8% of the total revenue, compared with $1,231,843, or 15.2% of the total revenue, in the same period of 2010. This represents an increase of $1,149,498, or 93.3%. The following factors contributed to the increase of total operating expenses:
|
8
|
|
o
|
Selling and marketing expenses increased by $172,058, or 57.3%, from $300,092 in the second quarter of 2010 to $472,150 in the same period for 2011. Such expenses represent 2.3% of the total revenue for the second quarter of 2011 and were primarily due to the growth of the sales force and the implementation of strategic growth plans and initiatives.
|
|
|
o
|
General and administrative expenses increased by $1,004,254, or 114.4%, from $878,178 in the second quarter of 2010 to $1,882,432 in the same period for 2011. The general and administrative expenses represent 9.3% and 10.8% of the total revenue in the second quarter of 2011 and 2010, respectively.
|
|
|
·
|
Operating income increased to $2,922,877 in the second quarter of 2011, by 64.9%, from $1,772,376 in the second quarter of 2010, representing 14.5% and 21.9% of the total revenue in the second quarter of 2011 and 2010, respectively.
|
|
|
·
|
Other income (expenses) decreased by $110,580, or 631.4%, from income of $17,513 in the second quarter of 2010 to expense of $93,067 in the second quarter of 2011.
|
|
|
·
|
Net income attributable to TRIT increased to $1,761,688, or $0.21 per diluted share, for the second quarter of 2011, from $1,421,587, or $0.19 per diluted share, for the second quarter of 2010.
|
Performance highlights for the six months ended June 30, 2011 and 2010 include:
|
|
·
|
Total revenue increased to $37,755,098 from $12,340,892, an increase of $25,414,206, or 205.9%.
|
|
|
·
|
Cost of revenue increased to $27,440,700 in the six-month period in 2011 from $7,569,797 for the same period last year, an increase of $19,870,903, or 262.5%.
|
|
|
·
|
Total operating expenses increased to $4,802,293 in the first six months of 2011 from $2,170,987 in the same period 2010, an increase of $2,631,306, or 121.2%. The most significant contributor to this increase is the general and administrative expenses. The increase was $2,329,472, or 143.8%, comparing the six-month periods in 2011 and 2010.
|
|
|
·
|
Operating income for the six months ended June 30 2011 was $5,512,105 or 14.6% of the total revenue. Compared to $2,600,108 for the same period in the prior year, it was an increase of $2,911,997, or 112%.
|
|
|
·
|
Net income attributable to TRIT was $3,460,669, or 9.2% of total revenue, an increase of $1,221,467, or 54.5%, from $2,239,202 for the same period last year.
|
9
Results of Operations
The following are the operating results for the three months ended June 30, 2011 and 2010:
|
Three Months
Ended June 30,
2011 ($)
|
% of
Sales
|
Three Months
Ended June 30,
2010 ($)
|
% of
Sales
|
Change
($)
|
%
Change
|
|||||||||||||||||||
|
Revenue
|
20,201,887 | 100.0 | % | 8,102,778 | 100.0 | % | 12,099,109 | 149.3 | % | |||||||||||||||
|
Cost of Revenues
|
14,897,669 | 73.7 | % | 5,098,559 | 62.9 | % | 9,799,110 | 192.2 | % | |||||||||||||||
|
Selling and Marketing Expenses
|
472,150 | 2.3 | % | 300,092 | 3.7 | % | 172,058 | 57.3 | % | |||||||||||||||
|
General and Administrative Expenses
|
1,882,432 | 9.3 | % | 878,178 | 10.8 | % | 1,004,254 | 114.4 | % | |||||||||||||||
|
Research and Development
|
26,759 | 0.1 | % | 53,573 | 0.7 | % | (26,814 | ) | (50.1 | )% | ||||||||||||||
|
Total Operating Expenses
|
2,381,341 | 11.8 | % | 1,231,843 | 15.2 | % | 1,149,498 | 93.3 | % | |||||||||||||||
|
Operating Income
|
2,922,877 | 14.5 | % | 1,772,376 | 21.9 | % | 1,150,501 | 64.9 | % | |||||||||||||||
|
Other Income (expenses)
|
(93,067 | ) | (0.5 | ) % | 17,513 | 0.2 | % | (110,580 | ) | (631.4 | )% | |||||||||||||
|
Income before Provision for Income Taxes
|
2,829,810 | 14.0 | % | 1,789,889 | 22.1 | % | 1,039,921 | 58.1 | % | |||||||||||||||
|
Provision for Income Taxes
|
439,423 | 2.2 | % | 351,647 | 4.3 | % | 87,776 | 25.0 | % | |||||||||||||||
|
Net Income
|
2,390,387 | 11.8 | % | 1,438,242 | 17.7 | % | 952,145 | 66.2 | % | |||||||||||||||
|
Less: Net Income Attributable to Noncontrolling Interests
|
628,699 | 3.1 | % | 16,655 | 0.2 | % | 612,044 | 3,674.8 | % | |||||||||||||||
|
Net Income Attributable to TRIT
|
1,761,688 | 8.7 | % | 1,421,587 | 17.5 | % | 340,101 | 23.9 | % | |||||||||||||||
The following are the operating results for the six months ended June 30, 2011 and 2010:
|
Six Months
Ended June
30, 2011 ($)
|
% of
Sales
|
Six Months
Ended June
30, 2010 ($)
|
% of
Sales
|
Change ($)
|
%
Change
|
|||||||||||||||||||
|
Revenue
|
37,755,098 | 100.0 | % | 12,340,892 | 100.0 | % | 25,414,206 | 205.9 | % | |||||||||||||||
|
Cost of Revenues
|
27,440,700 | 72.7 | % | 7,569,797 | 61.3 | % | 19,870,903 | 262.5 | % | |||||||||||||||
|
Selling and Marketing Expenses
|
786,323 | 2.1 | % | 438,232 | 3.6 | % | 348,091 | 79.4 | % | |||||||||||||||
|
General and Administrative Expenses
|
3,949,226 | 10.5 | % | 1,619,754 | 13.1 | % | 2,329,472 | 143.8 | % | |||||||||||||||
|
Research and Development
|
66,744 | 0.2 | % | 113,001 | 0.9 | % | (46,257 | ) | (40.9 | )% | ||||||||||||||
|
Total Operating Expenses
|
4,802,293 | 12.7 | % | 2,170,987 | 17.6 | % | 2,631,306 | 121.2 | % | |||||||||||||||
|
Operating Income
|
5,512,105 | 14.6 | % | 2,600,108 | 21.1 | % | 2,911,997 | 112.0 | % | |||||||||||||||
|
Other Income (expenses)
|
(97,134 | ) | (0.3 | )% | 77,694 | 0.6 | % | (174,828 | ) | (225.0 | )% | |||||||||||||
|
Income Before Provision for Income Taxes
|
5,414,971 | 14.3 | % | 2,677,802 | 21.7 | % | 2,737,169 | 102.2 | % | |||||||||||||||
|
Provision for Income Taxes
|
845,059 | 2.2 | % | 419,420 | 3.4 | % | 425,639 | 101.5 | % | |||||||||||||||
|
Net Income
|
4,569,912 | 12.1 | % | 2,258,382 | 18.3 | % | 2,311,530 | 102.4 | % | |||||||||||||||
|
Less: Net Income Attributable to Noncontrolling Interests
|
1,109,243 | 2.9 | % | 19,180 | 0.2 | % | 1,090,063 | 5,683.3 | % | |||||||||||||||
|
Net Income Attributable to TRIT
|
3,460,669 | 9.2 | % | 2,239,202 | 18.1 | % | 1,221,467 | 54.5 | % | |||||||||||||||
10
Our revenues are subject to value added tax (“VAT”), sales tax, urban maintenance and construction tax and additional education fees. Among the above taxes, VAT has already been deducted from the calculation of revenue.
Revenue
During the second quarter of 2011, we have announced numerous awards of large contracts including the expansion phase of the Ordos drinking water plant for $20 million. These projects have been launched and large percentage of the subsequent revenue will be recognized in the second half of the year. The software product related businesses are all conducted as part of the system integration. Therefore, they are accounted in the system integration category.
Our total revenue for the second quarter of 2011 was $20,201,887, an increase of $12,099,109, or 149.3%, compared with $8,102,778 in the second quarter of 2010. This increase is primarily attributable to an increase in the system integration category, from $5,587,132 in the second quarter of 2010 to $19,883,553 in the same period for 2011, or an increase of 255.9% as a result of the Ordos project progress. Revenue from Segment 1, water and wastewater treatment and municipal infrastructure, continued to be very strong, constituting 83% of the total revenue. Revenue from Segment 2, water resource management and engineering, totaled $2,314,470, or 11.5% of the total revenue, mostly in the system integration category. Revenue from Segment 3, industrial pollution control and safety, totaled $1,117,784, constituted 5.5% of the total revenue for the second quarter, also mostly in the system integration category.
For the six months ended June 30, 2011, total revenue has reached $37,755,098, among which 78.6%, or $29,674,019 was from Segment 1, 10.5%, or $3,955,529 was from Segment 2, and 10.9%, or $4,125,550, was from Segment 3. The system integration category constituted 94.7% of the total revenue, or $35,754,047. Hardware product sales revenue totaled $2,001,051, constituting the remaining 5.3%.
Cost of Revenue
Total cost of revenue was $14,897,669 for the second quarter of 2011, an increase of $9,799,110, or 192.2%, from $5,098,559 in the second quarter of 2010. The system integration category, which was the largest contributor to the revenue increase, was also the largest contributor to the increase in the cost of revenue, totaling $14,622,576. The cost of revenue increase in the system integration category was $11,184,531, or 325.3%, from $3,438,045 in the second quarter of 2010 to $14,622,576 in the second quarter of 2011. The increase is mainly a result of the Ordos build-and-transfer project, which was at 70% completion by the end of the second quarter. 25% of the Ordos project was completed in the second quarter of 2011 alone. The project design of phase two of the Ordos project has been completed in the second quarter, which constitutes 20% of the contract value for the expansion phase.
Total cost of revenue for the six months ended June 30, 2011 was $27,440,700, an increase of $19,870,903, or 262.5%, compared to $7,569,797 for the same period in 2010. The system integration category, totaling $26,273,325, had an increase of $20,684,065, or 370.1%, from $5,589,260. The cost of revenue for both hardware and software products had a slight decrease.
Cost of revenue is based on total actual costs incurred plus estimated costs to completion applied to percentage of completion as measured at different stages. It includes material costs, equipment costs, transportation costs, processing costs, packaging costs, quality inspection and control, outsourced construction service fees and other costs that directly relate to the execution of the services and delivery of projects. Cost of revenue also includes freight charges, purchasing and receiving costs and inspection costs when they are incurred. In the second quarter of 2011, depending on different projects, about 60-90% of the cost was due to equipment purchases. About 5% to 15% was due to outsourced construction services. The remainder was due to other costs directly associated with each specific project.
11
Our gross margin decreased from 37.1% in the second quarter of 2010 to 26.3% in the second quarter of 2011. The major reason is that most of the revenue for this quarter was for the Ordos project, which, given the scale of the project, has a relatively low gross margin. At the same time, we have been more conservative on the estimates of Ordos project costs. Higher accrued project costs also caused the lower gross margin. Normally, the larger the size of the project, the lower the gross margin will be. Our strategy is to carefully choose more higher-margin build-and-transfer projects, which means the gross margin will remain at the current level. However, in the next two to three years, we will continue to look for ways to minimize the negative impact on our gross margin through optimizing product and system design, leveraging purchasing bargaining power, and exploring supply chain financing and local equipment sourcing.
The gross margin for the six months ended June 30, 2011 and 2010 was 27.3% and 38.7%, respectively.
Selling and Marketing Expenses
Selling and marketing expenses consist primarily of compensation costs, marketing costs, travel expenses and business entertainment expenses. In the second quarter of 2011, total selling and marketing expenses increased by $172,058, or 57.3%, from $300,092 in the second quarter of 2010 to $472,150. This increase was caused by increases in compensation-related expenses of $73,579, or 69.8%, from $105,486 in the second quarter of 2010 to $179,065 for the same period this year, travel expenses of $27,466, or 65.3%, from $42,035 in the second quarter of 2010 to $69,501 for the same period this year, and other selling expenses of $46,750, or 58.7%, from $79,680 in the second quarter of 2010 to $126,430 for the same period this year. The entertainment expenses increased by $24,263, or 33.3%, from $72,891 in the second quarter of 2010 to $97,154 for the same period this year.
The selling and marketing expenses for the six months ended June 30, 2011 totaled $786,323, an increase of $348,091, or 79.4%, from $ 438,232 for the same period last year. This increase was mainly due to the increase of headcount for the sales team and rapid geographic expansion. Compensation-related costs increased from $146,135 for the six-month period ended June 30, 2010 to $294,890 for the same period this year, an increase of $148,755, or 101.8%. Travel expenses increased from $55,149 for the six-month period ended June 30, 2010 to $135,772 for the same period this year, an increase of $80,623, or 146.2%. Other selling expenses increase from $110,275 for the six-month period ended June 30, 2010 to $207,909 for the same period this year, an increase of $97,634, or 88.5%.
Selling and marketing expenses for the quarter and six months ended June 30, 2011 took up approximately 2% of the total revenue. We anticipate it to continue to increase in the second half of 2011.
General and Administrative Expenses
General and administrative expenses consist primarily of compensation costs, rental expenses, professional fees, and other overhead expenses. General and administrative expenses increased by $1,004,254, or 114.4%, from $878,178 in the second quarter of 2010 to $1,882,432 in the second quarter of 2011. Of this increase, $152,381 was for officers’ salaries, which increased from $28,034 in the second quarter of 2010 to $180,415 in the second quarter of 2011. Salaries for mid-level management, technical support team, and other office staff increased by $231,733, or 93.6%, from $247,667 in the second quarter of 2010 to $479,400 in the second quarter of 2011. Other headcount related expenses, such as endowment and social insurance, increased by 64.0% and 26.2%, respectively, to $54,701 and $48,098, in the second quarter of 2011, respectively. Rent increased by $104,887, or 146.8%, from $71,439 in the second quarter of 2010 to $176,326 in the second quarter of 2011 due to office relocation. Professional fees increased by $91,438, or 120.8%, from $75,713 to $167,151, which was mainly for audit services and investor conferences. Amortization of intangible assets and software increased by $104,798 from $20,013 to $124,811. This increase was due to the purchase of some major software and intangible assets in our acquired subsidiaries and the amortization of land use rights for about $9,247 per month. Other general and administrative expenses increased by $242,626, or 69.4%, from $349,700 to $592,326 in the second quarter of 2011. Those are mainly for office expenses, utilities, travel, communication and other services.
In the first half of the year, our administrative support, including human resources and finance functions, grew stronger. Many highly qualified professionals joined us to support the revenue growth. Total general and administrative expenses for the six months ended June 30, 2011 was $3,949,226, an increase of $2,329,472, or 143.8%, from $1,619,754 for the same period last year. Of this increase, $990,038 was for compensation-related costs. Other general and administrative overhead increased by $580,572 for the first half of 2011, or 85.5% compared to the same period last year.
12
General and administrative expenses for the three and six months ended June 30, 2011 took up approximately 10% of the total revenue. We anticipate it to continue to increase but at a lower rate in the second half of 2011.
Provision for Income Tax
We provide for deferred income taxes using the asset and liability method. Under this method, we recognize deferred income taxes for tax credits, net operating losses available for carry-forwards and significant temporary differences. We classify deferred tax assets and liabilities as current or non-current based upon the classification of the related asset or liability in the financial statements or the expected timing of their reversal if they do not relate to a specific asset or liability. We provide a valuation allowance to reduce the amount of deferred tax assets if it is considered more likely than not that some portion or all of the deferred tax assets will not be realized.
Our operations are subject to income and transaction taxes of the PRC since most of our business activities take place in China. Significant estimates and judgments are required in determining our provision for income taxes. Some of these estimates are based on interpretations of existing tax law or regulations, as well as predictions related to future changes in these law and regulations. The ultimate amount of tax liability may be uncertain as a result. We do not anticipate any events which could change these uncertainties.
We, including our subsidiaries and controlled companies, are subject to income taxes on an entity basis on income arising in or derived from the tax jurisdictions in which each entity is domiciled. According to the New Enterprise Income Tax Law in China, the unified enterprise income tax (“EIT”) rate is 25%. However, two of our subsidiaries are eligible for certain favorable tax policies for being high-tech companies.
|
EIT
|
||||||||
|
Three Months Ended June 30,
|
||||||||
|
2011
|
2010
|
|||||||
|
%
|
%
|
|||||||
|
TTB (effective until the end of 2011)
|
7.5 | 7.5 | ||||||
|
BSST
|
15 | 15 | ||||||
|
Yanyu
|
25 | 25 | ||||||
|
Tranhold
|
25 | 25 | ||||||
|
TTA
|
25 | — | ||||||
|
Baoding
|
25 | 25 | ||||||
|
Consolidated Effective EIT
|
16 | 20 | ||||||
The favorable income tax treatment for TTB at 7.5% is going to expire at the end of 2011. Afterwards, the EIT rate could be either 15% if TTB qualifies as a high-tech company or 25% if it does not so qualify. We believe that TTB will continue to qualify as a high-tech company. The provision for income tax for the second quarter of 2011 was $439,423.
The Company has not recorded tax provision for U.S. tax purposes as they have no assessable profits arising in or derived from the United States and intends to permanently reinvest accumulated earnings in the PRC operations.
Net Income before Income Taxes
In the quarter ended June 30, 2011, our net income before provision for income taxes was $2,829,810, an increase of $1,039,921, or 58.1%, compared to $1,789,889 in the same period in 2010. Our provision for income taxes increased by $87,776, from $351,647 in the second quarter of 2010 to $439,423 in the same period in 2011. The increase in income taxes was primarily driven by an increase in income from ordinary business operations. In the second quarter of 2011, net income attributable to the shareholders of TRIT was $1,761,688, an increase of $340,101, or 23.9%, from $1,421,587 for the same period in 2010.
13
For the six months ended June 30, 2011, our net income before provision for income taxes increased by 102.2%, or $2,737,169, from $2,677,802 for the same period last year to $5,414,971. The provision for income taxes increased at approximately the same rate, from $419,420 to $845,059. The net income attributable to the shareholders of TRIT was $3,460,669, an increase of $1,221,467, or 54.5%, from $2,239,202 for the same period in 2010.
Liquidity and Capital Resources
As highlighted in the consolidated statements of cash flows, our liquidity and available capital resources are impacted by four key components: (i) cash and cash equivalents, (ii) operating activities, (iii) financing activities, and (iv) investing activities.
Consolidated cash flows for the six months ended June 30, 2011 and 2010 were as follow:
|
Six Months Ended June 30,
|
Change
|
|||||||||||
|
2011 ($)
|
2010 ($)
|
($)
|
||||||||||
|
Net Cash Used in Operating Activities
|
(10,926,709 | ) | (6,602,555 | ) | (4,324,154 | ) | ||||||
|
Net Cash Used in Investing Activities
|
(2,373,937 | ) | (428,607 | ) | (1,945,330 | ) | ||||||
|
Net Cash Provided by Financing Activities
|
2,524,703 | 31,507,188 | (28,982,485 | ) | ||||||||
|
Effects of Exchange Rate Changes on Cash and Cash Equivalents
|
499,908 | (36,963 | ) | 536,871 | ||||||||
|
Net Increase (Decrease) in Cash and Cash Equivalents
|
(10,276,035 | ) | 24,439,063 | (34,715,098 | ) | |||||||
|
Cash and Cash Equivalents, Beginning of Period
|
23,394,995 | 7,171,464 | 16,223,531 | |||||||||
|
Cash and Cash Equivalents, End of Period
|
13,118,960 | 31,610,527 | (18,491,567 | ) | ||||||||
Cash and Cash Equivalents
On June 30, 2011, our cash and cash equivalents amounted to $13,118,960. The restricted cash as of June 30, 2011 and December 31, 2010 amounted to $2,289,600 and $1,505,617, respectively, which is not included in the total of cash and cash equivalents. The restricted cash consisted of deposits as collaterals for the issuance of letters of credit. Our subsidiaries that own these deposits do not have material cash obligations to any third parties. Therefore, the restriction does not impact our liquidity.
Operating Activities
Net cash used for operating activities was $10,926,709 for the six months ended June 30, 2011, compared with $6,602,555 in the same period 2010. An increase of $4,324,154 in operating cash outflow was mainly attributable to the lag between revenue recognition and cash collection for the build-and-transfer project in the first half of 2011. This increase is expected, since it is common that most of the cash collection happens in the second half of the year. $4.6 million has been received for the Ordos project initial phase, and it is the client’s intention to pay ahead of the contracted schedule to avoid additional financing charges. This will enhance the Company’s operating cash to a certain extent. As the Company focuses more on its newly adapted build-and-transfer business model, the Company is very likely to face a more critical cash position in the next two quarters. However, the Company is confident that as soon as it passes this rapid takeoff stage, and cash collection for the major projects begins to catch up, this particular tightness of cash will ease substantially.
Investing Activities
Net cash used for investing activities was $2,373,937 in the first half of 2011, compared to $428,607 in the same period of 2010, an increase of $1,945,330. The increase was due to the acquisition of J&Y and the construction in progress for the Baoding research and development center. For the second half of 2011, our investment strategy will remain to focus on capital expenditures for research and development facilities and for new technology and product development.
14
Financing Activities
The cash provided by financing activities was $2,524,703 in the six months ended June 3, 2011, compared to $31,507,188 in the same period of 2010. The large cash inflow last year was due to the second round of capital fund-raising.
Effect of Exchange Rate Changes on Cash and Cash Equivalents
Net cash gain due to currency exchange was $499,908 in the six months ended June 30, 2011, an amelioration of $536,871 compared to a loss of $36,963 in the same period of 2010.
Restricted Net Assets
Our ability to pay dividends is primarily dependent on receiving distributions of funds from our subsidiaries, which is restricted by certain regulatory requirements. Relevant Chinese statutory laws and regulations permit payments of dividends by our Chinese subsidiaries only out of their retained earnings, if any, as determined in accordance with PRC accounting standards and regulations. In addition, our PRC subsidiaries are required to set aside at least 10% of their after-tax profit after deducting any accumulated deficit based on PRC accounting standards each year to our general reserves until the accumulated amount of such reserves reach 50% of our registered capital. These reserves are not distributable as cash dividends. Our off-shore subsidiaries, TIS and TTII, do not have material cash obligations to third parties. Therefore, the dividend restriction does not impact the liquidity of the companies. There is no significant difference between accumulated profit calculated pursuant to PRC accounting standards and that pursuant to U.S. GAAP. As of June 30, 2011 and December 31, 2010, restricted retained earnings were $897,382, and restricted net assets were $3,856,293 and $3,579,295, respectively. Unrestricted retained earnings as of June 30, 2011 and December 31, 2010 were $16,024,293 and $12,563,624, respectively, which were the amounts available for distribution in the form of dividends or for reinvestment.
Working Capital and Cash Flow Management
As of June 30, 2011, our working capital was $15,214,616. Due to the increase in purchase orders, we have experienced tremendous pressure from a shortage in working capital. We received net proceeds from our follow-on offering of $30,251,442 in 2010, of which we have used $23,749,000, or 77.6%, on working capital, product research and development, acquisition and sales and marketing. The percentage allocation is shown below:
| Percentage of | ||||||||||||
|
Proposed
|
Actual Expenditures
|
Proposed Spent
|
||||||||||
|
Expenditure
|
through June 30,
|
through June 30,
|
||||||||||
|
Description of Use
|
Amount
|
2011
|
2011
|
|||||||||
|
Working Capital
|
$ | 18,973,000 | $ | 18,973,000 | 100.0 | % | ||||||
|
Mergers & Acquisitions
|
6,120,000 | 2,081,000 | 34.0 | % | ||||||||
|
New Product Development
|
3,366,000 | 654,000 | 19.4 | % | ||||||||
|
Sales & Marketing
|
2,142,000 | 2,041,000 | 95.3 | % | ||||||||
|
Total
|
$ | 30,601,000 | $ | 23,749,000 | 77.6 | % | ||||||
However, we may require additional cash to undertake larger projects or to complete strategic acquisitions in the future. In the event our current capital is insufficient to fund these and other business plans, we may take the following actions to meet such working capital needs:
|
|
·
|
We may look into the possibility of optimizing our funding structure by obtaining short- and/or long-term debt through commercial loans. We are actively exploring opportunities with other major Chinese banks, such as ICBC and CITIC Bank, and we expect to acquire additional lines of credit to enable us to gain more project opportunities in the future. Other financing instruments into which we are currently looking include supply chain financing, project financing, trust fund financing and capital leasing. As of the time of filing, we have been granted a line of credit loan in the amount of RMB 60 million ($9.32 million) from CITIC Bank. The agreement will be signed by both parties shortly.
|
15
|
|
·
|
We may improve our collection of accounts receivable. Most of our clients are central, provincial and local governments. We believe that our clients are in good financial positions. Therefore, good collectability from relatively high accounts receivables are expected. The accounts receivable collection should catch up with our rapid growth in the near future. Given the interest rates in the long-term contracts, it is possible that some clients might choose to pay the contract fees before the due date. As of the time of filing, $4.6 million has been received ahead of the contracted payment schedule.
|
Contractual Obligations and Commercial Commitments
Operating Leases
As of June 30, 2011, we had commitments under certain operating leases, which require annual minimum rental payments as follows:
|
For the Year Ending December 31,
|
Amount
|
|||
|
2011
|
$ | 342,846 | ||
|
2012
|
643,821 | |||
|
2013
|
452,268 | |||
|
2014
|
111,589 | |||
|
2015
|
– | |||
|
Thereafter
|
– | |||
|
Total
|
$ | 1,550,524 | ||
Our leased properties are principally located in Beijing and are used for administration and research and development purposes. The terms of these operating leases vary from one to five years. Pursuant to the lease terms, when the contracts expire, we have the right to extend them with new negotiated prices. The leases are renewable subject to negotiation. Rental expenses were $176,326 and $71,439 for the quarter ended June 30, 2011 and 2010, respectively.
Product Warranties
Our warranty policy generally is to replace parts at no additional charge if they become defective within one year after deployment. Historically, failure of product parts due to materials used or workmanship has not been significant. We have not incurred any material unexpected costs associated with servicing warranties. We continuously evaluate and estimate our potential warranty obligations, and record the related warranty obligation when the estimated amount becomes material at the time revenue is recorded.
Capital Expenditures
In the past, the capital expenditures were mainly for purchases of computers and other office equipment to support our daily business activities. Our capital expenditures will increase in the near term as our business continues to grow and as the construction of our research and development facilities in Tianjin progresses. The construction of the research and development center consists of three phases. Phase one is to be completed around May 2012. Phase two and three of the construction are planned to be completed by the end 2013. The total capital investment is expected to be $18.2 million.
Seasonality
Our operating revenues normally tend to fluctuate due to different project stages and U.S. GAAP requirements on revenue recognition. As the scope of our business extends to the civil construction activities, certain destructive weather conditions that tend to occur during the winter often impact the progress of our projects. Certain weather conditions, including severe winter storms, may result in temporary suspension of outdoor operations, which can significantly affect the operating results in the affected regions.
Usually, the operating results for the first quarter reflect the business slowdown for the holiday season in China, which usually lasts up to 15 days.
16
As the bidding season starts around March, more contracts start during the second quarter of the year. Revenue recognition criteria are mostly met in the second half of the year, when we typically show our best performances both in revenue and in cash flow.
Off-Balance Sheet Arrangements
We did not have any off-balance sheet arrangements for the quarter ended June 30, 2011 or 2010.
Taxation
According to an approval from the Beijing State Tax Bureau of Xicheng District, TTB received a preferential income tax rate of 7.5% from January 1, 2009 to December 31, 2011.
Pursuant to the new EIT Law and supplementary regulations, only high-tech companies that have been re-certified as such under the new criteria are granted the preferential enterprise income tax rate of 15%. BSST was certified as a high-tech enterprise under the new criteria in September 2010, and it is subject to a 15% income tax rate from January 1, 2010 to December 31, 2012. At that time, BSST will need to re-apply for certification or pay the 25% rate.
Business tax varies from 3% to 5% depending on the nature of the revenue, and VAT is at a rate of 17%. For revenues generated from those parts of our software solutions which are recognized by and registered with government authorities and meet government authorities’ requirements to be treated as software products, we are entitled to receive a refund of 14% on the total VAT paid at a rate of 17%. Revenues from software products other than the above are subject to full VAT at 17%. In addition, we are currently exempted from sales tax for revenues generated from development and transfer of tailor-made software solutions for clients. Further, revenues from consulting services are subject to a 5% sales tax. Qualified to issue VAT invoices, we need to maintain a certain amount of revenue that is taxable by VAT. As such, we may have to refuse some of the tax exemption benefits in our tailor-made software development and transfer business and pay VAT for those parts of the revenue in order to maintain minimum VAT revenue thresholds. This practice may cease to apply if more of the software products become recognized and registered as software products in the PRC.
Segment Information
We have three reportable operating segments. The segments are grouped with reference to the types of services provided and the types of clients that use those services. Total sales and costs are divided among these three segments. We assess each segment’s performance based on net revenue and gross profit on contribution margin.
Segment 1: Water, Wastewater Treatment and Municipal Infrastructure
The following are the operating results for the three months ended June 30, 2011 and 2010 for Segment 1:
|
Three Months Ended June 30,
|
||||||||||||||||
|
2011 ($)
|
2010 ($)
|
Change ($)
|
Change (%)
|
|||||||||||||
|
Revenues
|
16,769,633 | 4,252,524 | 12,517,109 | 294.3 | % | |||||||||||
|
Cost of Revenues
|
12,589,753 | 2,495,414 | 10,094,339 | 404.5 | % | |||||||||||
|
Operating Expenses:
|
||||||||||||||||
|
Selling and Marketing Expenses
|
143,878 | 121,573 | 22,305 | 18.3 | % | |||||||||||
|
General and Administrative Expenses
|
1,196,760 | 446,986 | 749,774 | 167.7 | % | |||||||||||
|
Research and Development
|
7,936 | 53,573 | (45,637 | ) | (85.2 | )% | ||||||||||
|
Total Operating Expenses
|
1,348,574 | 622,132 | 726,442 | 116.8 | % | |||||||||||
|
Other (Expenses) Income, Net
|
(34,363 | ) | 13,531 | (47,894 | ) | (354.0 | )% | |||||||||
|
Income before Provision for Income Taxes
|
2,796,943 | 1,148,509 | 1,648,434 | 143.5 | % | |||||||||||
17
Net revenue for Segment 1 was $16,769,633 for the three months ended June 30, 2011, an increase of $12,517,109, or 294.3%, from $4,252,524 in the same period of 2010. This increase was mainly attributable to the progression of the Ordos drinking water plant project. In the second quarter of 2011, we recognized Ordos revenue of $16,054,587, which is about 25% of the initial phase contract value and 20% of the expansion phase contract. In total, the initial phase project has reached approximately 70% completion. The customer’s acceptance of the entire project is expected to be on or before September 30, 2011 and the remaining 30% of revenue will be recognized upon customer acceptance.
Cost of revenue for Segment 1 was $12,589,753 in the second quarter of 2011, an increase of $10,094,339, or 404.5%, from that of $2,495,414 in the second quarter of 2010. The percentage increase was higher than that in revenue because the revenue generated from system integration increased while the revenue generated from software sales decreased. The Ordos project, which has a relatively low gross margin, contributed $11,887,818 to the cost of revenue in this segment. The gross margin for Segment 1 is 24.9%, decreased from the same period last year by 41.3%.
Total operating expenses in Segment 1 were $1,348,574, an increase of $726,442, or 116.8%, compared with $622,132 in the second quarter of 2010. The selling and marketing expenses increased from $121,573 in the second quarter of 2010 to $143,878 in same period 2011, an increase of $22,305, or 18.3%. The increase was mainly due to the headcount increase and travel expenses. The general and administrative expenses for the second quarter of 2011 were $1,196,760, an increase of $749,774, or 167.7%, compared with $446,986 for the same period in 2010. The increase was caused by the increase in salaries, rent and professional service expenses.
Other expenses were $34,363 in the second quarter ended June 30, 2011, a $47,894 decrease compared to other income of $13,531 in the same period of 2010. The decrease was mainly due to the foreign exchange loss in the second quarter of 2011.
Income before provision for income taxes was $2,796,943 in the quarter ended June 30, 2011, an increase of $1,648,434, or 143.5%, from that of $1,148,509 in the same period in 2010. Net margin for this segment was 16.7%.
The following are the operating results for the six months ended June 30, 2011 and 2010 for Segment 1:
|
Six Months Ended June 30,
|
||||||||||||||||
|
2011 ($)
|
2010 ($)
|
Change ($)
|
Change (%)
|
|||||||||||||
|
Revenues
|
29,674,019 | 6,813,575 | 22,860,444 | 335.5 | % | |||||||||||
|
Cost of Revenues
|
22,211,750 | 4,026,798 | 18,184,952 | 451.6 | % | |||||||||||
|
Operating Expenses:
|
||||||||||||||||
|
Selling and Marketing Expenses
|
252,935 | 190,397 | 62,538 | 32.8 | % | |||||||||||
|
General and Administrative Expenses
|
1,937,901 | 766,930 | 1,170,971 | 152.7 | % | |||||||||||
|
Research and Development
|
7,936 | 110,413 | (102,477 | ) | (92.8 | )% | ||||||||||
|
Total Operating Expenses
|
2,198,772 | 1,067,740 | 1,131,032 | 105.9 | % | |||||||||||
|
Other Income (Expenses), Net
|
(40,016 | ) | 15,726 | (55,742 | ) | (354.5 | )% | |||||||||
|
Income before Provision for Income Taxes
|
5,223,481 | 1,734,763 | 3,488,718 | 201.1 | % | |||||||||||
In Segment 1, revenue was $29,674,019 for the six months ended June 30, 2011, an increase of $22,860,444, or 335.5%, from $6,813,575 in the same period of 2010. Cost of revenue for Segment 1 was $22,211,750 for the six months ended June 30, 2011, an increase of $18,184,952, or 451.6%, from that of $4,026,798 in the same period of 2010. The six-month gross margin for Segment 1 was 25.1%, compared to 40.9% for the same period last year. The decrease of gross margin was caused by the growing scale of the projects and more conservative recognition of the related revenue and costs.
Total operating expenses in Segment 1 were $2,198,772, an increase of $1,131,032, or 105.9%, compared with $1,067,740 in the same period of 2010. The selling and marketing expenses increased from $190,397 for the six months ended June 30, 2010 to $252,935 in the same period of 2011, an increase of $62,538, or 32.8%. The general and administrative expenses for the six months ended June of 30, 2011 were $1,937,901, an increase of $1,170,971, or 152.7%, compared with $766,930 for the same period in 2010.
18
Other expenses were $40,016 for the six months ended June 30, 2011, a $55,742 decrease compared to other income of $15,726 in the same period of 2010.
Income before provision for income taxes was $5,223,481 for the six months ended June 30, 2011, an increase of $3,488,718, or 201.1%, from that of $1,734,763 in the same period in 2010. The six-month net margin for this segment was 17.6% compared to 25.5% for the same period last year.
Segment 2: Water Resource Management System and Engineering Services
The following are the operating results for the three months ended June 30, 2011 and 2010 for Segment 2:
|
Three Months Ended June 30,
|
||||||||||||||||
|
2011 ($)
|
2010 ($)
|
Change ($)
|
Change (%)
|
|||||||||||||
|
Revenues
|
2,314,470 | 2,053,070 | 261,400 | 12.7 | % | |||||||||||
|
Cost of Revenues
|
1,576,744 | 1,207,680 | 369,064 | 30.6 | % | |||||||||||
|
Operating Expenses:
|
||||||||||||||||
|
Selling and Marketing Expenses
|
215,005 | 172,014 | 42,991 | 25.0 | % | |||||||||||
|
General and Administrative Expenses
|
247,098 | 266,403 | (19,305 | ) | (7.2 | )% | ||||||||||
|
Research and Development
|
8,263 | - | 8,263 | |||||||||||||
|
Total Operating Expenses
|
470,366 | 438,417 | 31,949 | 7.3 | % | |||||||||||
|
Other (Expenses), Net
|
(30,230 | ) | (2,868 | ) | (27,362 | ) | 954.0 | % | ||||||||
|
Income before Provision for Income Taxes
|
237,130 | 404,105 | (166,975 | ) | (41.3 | )% | ||||||||||
In Segment 2, net revenue was $2,314,470 for the three months ended June 30, 2011, an increase of $261,400, or 12.7%, from $2,053,070 in the same period of 2010. Revenue in this segment remained steady with only moderate growth due to the slowdown of the government policy implementation. The contract bidding season started in June this year for the water resource segment. Several contract awards have been announced during June and July 2011 such as the Yanyu contract for the flash flood early warning projects in two counties of Xingtai City and two counties in Baoding City in Hebei Province, and the districts of Changping, Yanqing and Pinggu in Beijing City, as well as the projects in three counties of Yuxi City, Yunnan Province. The projects are valued at RMB 26.7 million ($4.1 million). These projects are expected to be completed at different points in time from late September to late December 2011.
Cost of revenue in Segment 2 was $1,576,744 in the quarter ended June 30, 2011, an increase of $369,064, or 30.6%, from $1,207,680 in the same period of 2010. The gross margin for this segment was 31.9% compared to 41.2% for the same period last year.
Total operating expenses in Segment 2 were $470,366, an increase of $31,949, or 7.3%, compared with $438,417 in the second quarter of 2010. The selling and marketing expenses increased from $172,014 in the second quarter of 2010 to $215,005 in the second quarter of 2011, an increase of $42,991, or 25.0%. The increase was mainly due to headcount increase and travel expenses. The general and administrative expenses for the second quarter of 2011 were $247,098, a decrease of $19,305, or 7.2%, compared with $266,403 for the same period in 2010.
Other expenses were $30,230 in the quarter ended June 30, 2011, an increase of $27,362, compared with other expenses of $2,868 in the same period of 2010. The increase was primarily due to the material scrap during the quarter.
Income before provision for income taxes was $237,130 in the quarter ended June 30, 2011, a decrease of $166,975, or 41.3%, compared with $404,105 in the same period of 2010. The decrease was driven by the rapidly increasing selling and marketing expenses, and other expenses. The net margin in this segment was 10.2% compared to 19.7% for the same period last year.
19
The following are the operating results for the six months ended June 30, 2011 and 2010 for Segment 2:
|
Six Months Ended June 30,
|
||||||||||||||||
|
2011 ($)
|
2010 ($)
|
Change ($)
|
Change (%)
|
|||||||||||||
|
Revenues
|
3,955,529 | 3,669,490 | 286,039 | 7.8 | % | |||||||||||
|
Cost of Revenues
|
2,445,352 | 2,133,071 | 312,281 | 14.6 | % | |||||||||||
|
Operating Expenses:
|
||||||||||||||||
|
Selling and Marketing Expenses
|
365,733 | 236,624 | 129,109 | 54.6 | % | |||||||||||
|
General and Administrative Expenses
|
742,334 | 672,923 | 69,411 | 10.3 | % | |||||||||||
|
Research and Development
|
48,248 | 75 | 48,173 | 64,130 | % | |||||||||||
|
Total Operating Expenses
|
1,156,315 | 909,622 | 246,693 | 27.1 | % | |||||||||||
|
Other (Expenses) Income, Net
|
(30,295 | ) | 55,118 | (85,413 | ) | (155.0 | )% | |||||||||
|
Income before Provision for Income Taxes
|
323,567 | 681,915 | (358,348 | ) | (52.6 | )% | ||||||||||
Segment 2 revenue was $3,955,529 for the six months ended June 30, 2011, an increase of $286,039, or 7.8%, from $3,669,490 in the same period of 2010. Cost of revenue in Segment 2 was $2,445,352 for the six months ended June 30, 2011, an increase of $312,281, or 14.6%, from $2,133,071 in the same period of 2010. The six-month gross margin for this segment was 38.2% compared to 41.9% for the same period last year.
Total operation expenses in Segment 2 were $1,156,315, an increase of $246,693, or 27.1%, compared with $909,622 in the six months ended June 30, 2010. The selling and marketing expenses increased from $236,624 for the six months ended June 30, 2010 to $365,733 in the same period of 2011, an increase of $129,109, or 54.6%. The increase was mainly due to headcount increase and travel expenses. The general and administrative expenses for the six months ended June 30, 2011 were $742,334, an increase of $69,411, or 10.3%, compared with $672,923 for the same period in 2010.
Other expenses were $30,295 for the six months ended June 30, 2011, a decrease of $85,413, compared with other income of $55,118 in the same period of 2010. The decrease was primarily due to the scrap of inventory material.
Income before provision for income taxes was $323,567 for the six months ended June 30, 2011, a decrease of $358,348, or 52.6%, compared with $681,915 in the same period of 2010. The decrease was driven by the raising general and administrative and other expenses. The six-month net margin in this segment was 8.2% and 18.6% for the same period last year.
Segment 3: Industrial Pollution Control and Safety
The following are the operating results for the three months ended June 30, 2011 and 2010 for Segment 3:
|
Three Months Ended June 30,
|
||||||||||||||||
|
2011 ($)
|
2010 ($)
|
Change ($)
|
Change (%)
|
|||||||||||||
|
Revenues
|
1,117,784 | 1,797,184 | (679,400 | ) | (37.8 | )% | ||||||||||
|
Cost of Revenues
|
731,172 | 1,395,465 | (664,293 | ) | (47.6 | )% | ||||||||||
|
Operating Expenses:
|
||||||||||||||||
|
Selling and Marketing Expenses
|
113,267 | 6,505 | 106,762 | 1,641.2 | % | |||||||||||
|
General and Administrative Expenses
|
438,574 | 164,789 | 273,785 | 166.1 | % | |||||||||||
|
Research and Development
|
10,560 | - | 10,560 | |||||||||||||
|
Total Operating Expenses
|
562,401 | 171,294 | 391,107 | 228.3 | % | |||||||||||
|
Other (Expenses) Income, Net
|
(28,474 | ) | 6,850 | (35,324 | ) | (515.7 | )% | |||||||||
|
Income (Loss) before Provision for Income Taxes
|
(204,263 | ) | 237,275 | (441,538 | ) | (186.1 | )% | |||||||||
The revenue in Segment 3 was $1,117,784 for the three months ended June 30, 2011, a decrease of $679,400, or 37.8%, compared to $1,797,184 in the same quarter of 2010. This was due to the delay of project progresses. For several large projects, customer acceptances were completed in July and revenue recognition criteria were not met. Therefore, a decrease appeared in this quarter for segment 3 total revenues. The cost of revenue for the second quarter was $731,172, a decrease of $664,293, or 47.6%, compared with $1,395,465 in the second quarter of 2010. During this period, Segment 3 went through the process of refining its technical profile, seeking new strategies and growth opportunities. As a result, we acquired J&Y to expand our business scope and global reach. The immediate financial results showed an adverse impact. However, it is anticipated that the benefit of these strategic changes will show in the remaining periods of the year.
20
Total operating expenses were $562,401, an increase of $391,107 compared with $171,294 in the second quarter of 2010. Selling and marketing expenses increased by $106,762 compared to the second quarter of 2010. General and administrative expenses increased from $164,789 in the second quarter of 2010 to $438,574, an increase of $273,785. Other income in Segment 3 decreased from $6,850 in the second quarter of 2010 to an expense of $28,474 in the second quarter of 2011, a decrease of $35,324, or 515.7%. The expense was due to the inventory material scrap during the period. The gross margin for this segment was 34.6% compared to 22.4% for the same period last year.
The following are the operating results for the six months ended June 30, 2011 and 2010 for Segment 3:
|
Six Months Ended June 30,
|
||||||||||||||||
|
2011 ($)
|
2010 ($)
|
Change ($)
|
Change (%)
|
|||||||||||||
|
Revenues
|
4,125,550 | 1,857,827 | 2,267,723 | 122.1 | % | |||||||||||
|
Cost of Revenues
|
2,783,598 | 1,409,928 | 1,373,670 | 97.4 | % | |||||||||||
|
Operating Expenses:
|
||||||||||||||||
|
Selling and Marketing Expenses
|
167,655 | 11,211 | 156,444 | 1,395.5 | % | |||||||||||
|
General and Administrative Expenses
|
1,268,991 | 179,901 | 1,089,090 | 605.4 | % | |||||||||||
|
Research and Development
|
10,560 | 2,513 | 8,047 | 320.2 | % | |||||||||||
|
Total Operating Expenses
|
1,447,206 | 193,625 | 1,253,581 | 647.4 | % | |||||||||||
|
Other (Expenses) Income, Net
|
(26,823 | ) | 6,850 | (33,673 | ) | (491.6 | )% | |||||||||
|
Income (Loss) before Provision for Income Taxes
|
(132,077 | ) | 261,124 | (393,201 | ) | (150.6 | )% | |||||||||
The revenue in Segment 3 for the six months ended June 30, 2011 was $4,125,550, an increase of $2,267,723, or 122.1%, compared to $1,857,827 in the same quarter of 2010. The cost of revenue for the six months ended June 30, 2011 was $2,783,598, an increase of $1,373,670, or 97.4%, compared with $1,409,928 for the same period last year.
Total operating expenses were $1,447,206, an increase of $1,253,581 compared to $193,625 for the six months ended June 30, 2010. Selling and marketing expenses increased by $156,444, compared to the six months ended June 30, 2010. General and administrative expenses were $1,268,991, compared to $179,901 for the six months ended June 30, 2010, an increase of $1,089,090. Other income in Segment 3 decreased from $6,850 for the six months ended June 30, 2010 to other expenses $26,823 for the six months ended June 30, 2011, a decrease of $33,673, or 491.6%. The six-month gross margin for this segment was 32.5% compared to 24.1% for the same period last year.
Assets attributable to each segment as of June 30, 2011 and December 31, 2010 are shown below:
|
Segment Assets
|
Segment 1
|
Segment 2
|
Segment 3
|
Total
|
||||||||||||
|
As of June 30, 2011
|
$ | 68,006,133 | $ | 16,111,116 | $ | 22,621,160 | $ | 106,738,409 | ||||||||
|
As of December 31, 2010
|
$ | 44,168,017 | $ | 14,488,083 | $ | 24,106,603 | $ | 82,762,703 | ||||||||
Significant Accounting Policies
Estimates and Assumptions
The preparation of financial statements requires management to make numerous estimates and assumptions that affect the amounts reported in the consolidated financial statements and accompanying notes. Changes in these estimates and assumptions may have financial impacts on recognition and disclosure of assets, liabilities, equity, revenues and expenses. However, we believe that these estimates used in preparing our financial statements are based on our best professional judgment, and are reasonable and prudent.
21
The most complex and subjective estimates and assumptions that present the greatest amount of uncertainty relate to the recognition of revenue under the percentage of completion method, business combination, the allowance for doubtful accounts, long term contract collectability, impairment of fixed assets and intangible assets, and income tax. We evaluate all of these estimates and judgments on an on-going basis. Below are the most critical estimates and assumptions we make in preparing the consolidated financial statements.
Revenue Recognition
Our revenues consist primarily of three categories: (i) hardware product sales, (ii) software product sales, and (iii) system integration sales. We recognize revenue when the consideration to be received is fixed or determinable, products delivered or services rendered, and collectability ensured.
For system integration, sales contracts are structured with fixed price. The contract periods range from two months to approximately three years in length. We recognize revenue of these contracts following the percentage-of-completion method, measured by different stages in accordance with ASC 605-35, “Construction-Type and Production-Type Contracts.” Only if the actual implementation status meets the established stages of completion will we recognize the relevant portion of the revenue. There are four major stages for the system integration revenue recognition: (a) the completion of project design, (b) the delivery of products, (c) the completion of debugging, and (d) inspection and acceptance. For build-and-transfer projects, such as the Ordos drinking water plant project, we recognize the project revenue in terms of working hours, which is the primary element of the total project costs, as the measurement for percentage of completion.
For hardware product sales, we recognize revenue only when all products are delivered and the acceptance confirmations are signed by the customers, according to ASC 605-10, “Revenue Recognition.” We are not obligated for any repurchase or return of the goods.
We also sell software products. These software product sales do not include any additional services such as maintenance or technical support. We recognize revenue under ASC 985-605, “Software Revenue Recognition” according to the acceptance of delivery revenue recognition method. At the end of each reporting period, we recognize the contract amount as revenue only if all software products have been delivered and the customer acceptance confirmation has been signed.
If unapproved change orders or claims occur in the future, in accounting for contracts, we follow paragraphs 30 and 31 of ASC 605-35-25, “Construction-Type and Production-Type Contracts.” We recognize revenue from unapproved change orders or claims only to the extent that contract costs relating to the unapproved change orders or claims have been incurred, and only if it is probable that such unapproved change orders or claims will result in additional contract revenue and the amount of such additional revenue can be reliably estimated. To date, we have not experienced any unapproved change orders in our ordinary business operation.
We present all sales revenue net of VAT. Our products sold in China are generally subject to Chinese VAT of 17% of the sales price, except for certain proprietary software sales which will only be subject to an effective tax rate of 3%. The VAT payable may be offset by VAT paid by us on purchased raw materials and other materials included in the cost of projects or producing the finished product.
We record revenue in excess of billings as “unbilled revenue,” and billings in excess of revenues as “billings in excess of revenue.” For revenues accounted for under these two accounts, we expect the amounts to be collected within one year. For those with collection periods in excess of one year, we classify them under “long-term unbilled revenue” on the consolidated balance sheets.
We obtained several contracts with a billing cycle of over three years. Unless the discounted revenue from those contracts is specified, such as the Ordos project, which is 10%, the discount rate used is the 3-year nominal interest rate, set by the People’s Bank of China, China’s central bank.
22
Our accounts receivable period is 75 days for the second quarter of 2011, significantly shortened from 87 days for the first quarter of 2011. Given the characteristics of the clientele, we are confident that our accounts receivable are of good quality even though our accounts receivable days are relatively long compared with companies in other industries. Our finance team is constantly monitoring the accounts receivable quality and the process and assumptions used in bad debt provision. In case of any event that indicates accounts receivable quality deterioration, management will reassess the bad debt provision within the period such event occurs.
We recognize accounts receivable initially at fair value less an allowance for doubtful accounts. We make an allowance for doubtful accounts based on the aging of accounts receivable and on any specifically identified accounts receivable that may become uncollectible. We maintain allowances for doubtful accounts for estimated losses resulting from the failure of customers to make required payments in the relevant time periods. We review the accounts receivable on a periodic basis and makes general and specific allowances when there is doubt as to the collectability of individual balances. In evaluating the collectability of individual receivable balances, we consider many factors, including the age of the balance, the customer’s historical payment history and current credit-worthiness and current economic trends. The amount of the provision, if any, is recognized in the consolidated statement of operations within “general and administrative expenses.”
While the collection period for some of the long-term contracts, such as the build-and-transfer projects, can be as long as two years, given that our clients are primarily government agencies supported by provincial budgets and large state-owned enterprises with sufficient liquidity, we believe the collectability of accounts receivable is secure, long-term or short-term.
Impairment of Assets and Intangible Assets
We monitor the carrying value of our long-lived assets for potential impairment whenever events or changes in circumstances indicate that their carrying amounts may not be recoverable. To the extent the estimated undiscounted future cash inflows attributable to the asset, less estimated undiscounted future cash outflows, are less than the carrying amount, we recognize an impairment loss in an amount equal to the difference between the carrying value of such assets and fair value. No impairment indicator is noted in the prior or current periods.
We evaluate the periods of depreciation and amortization to determine whether subsequent events and circumstances warrant revised estimates of useful lives. Estimating future cash flows require significant judgment, and projections may vary from the cash flows eventually realized which could impact our ability to accurately assess whether an asset has been impaired.
For goodwill, we assess for impairment at period end or whenever events or changes indicate that, more likely than not, the carrying value of goodwill has been impaired. We use the income approach to estimate the fair value of the goodwill. The income approach is based on the long-term projected future cash flows of the operating segments. We discount the estimated cash flows to present value using a weighted-average cost of capital that considers factors such as the timing of the cash flows and the risks inherent in those cash flows. We believe that this approach is the most reasonable because it provides a fair value estimate based upon the operating segments’ expected long-term performance considering the economic and market conditions that generally affect our business.
PRC Value-Added Tax
Our products sold in China are generally subject to a Chinese VAT at a rate of 17%. Proprietary software sales are subject to business tax of 5%. The VAT may be offset by VAT we pay on raw materials and other materials included in the cost of producing our finished product. Accrued VAT payables from Yanyu, Tranhold and BSST are subject to urban maintenance and construction tax and additional education fees, which are accounted for as 0.5% of the total sales value.
23
Revenues from services provided by TTB, Yanyu, Tranhold and BSST are mostly subject to a Chinese business tax of 5% and surtax of 0.5%. One of the projects in Tianjin is subject to a 3% business tax. We pay business tax on gross revenues generated from our shipping agency services minus the costs of services, which are paid on behalf of our customers.
|
Item 3.
|
Quantitative and Qualitative Disclosures about Market Risk
|
Not applicable.
|
Item 4.
|
Controls and Procedures
|
Disclosure Controls and Procedures
As of December 31, 2010, the Company carried out an evaluation based on the criteria for effective internal control over financial reporting established in “Internal Control - Integrated Framework” issued by the Committee of Sponsoring Organizations of the Treadway Commission (“COSO”) and SEC guidance. Based on such assessment, management concluded that its internal control over financial reporting was not effective at that time because of the material weaknesses described below:
|
|
•
|
Inadequate U.S. GAAP expertise. The accounting team at that time was professional and experienced in accounting requirements and procedures generally accepted in the PRC, but was less experienced in applying the U.S. GAAP standards and reporting requirements. The staff needed additional training to become experienced in U.S. GAAP.
|
|
|
•
|
Lack of segregation of duties between functions. Due to the Company’s size, segregation of all conflicting duties may not always have been possible and may not have been economically feasible.
|
|
|
•
|
Communication mechanisms. Even after the centralization of its operating functions to work from its new headquarters in September 2010, the Company still needed to build an effective communication system with clear procedures that would enable it to collect, process and deliver information related to internal controls in a timely and precise fashion.
|
In order to correct the foregoing deficiencies, the Company has taken the following remediation measures:
|
|
•
|
The Company retained AuditPrep Limited, an outside consulting firm, in March 2011 to perform a review on the disclosure and presentation of the Company’s unaudited financial statements for fiscal year 2011 in accordance with U.S. GAAP and SEC regulations.
|
|
|
•
|
To improve its financial and internal control system, management of the Company started an enterprise resource planning (“ERP”) integration and upgrade project in December 2010 with UFIDA, China’s largest ERP system provider. The first phase of the project was completed in the first quarter of 2011. During the project, the Company maintains the existing ERP system parallel to the new one to ensure accuracy and completeness of the accounting data.
|
|
|
•
|
The Company set up its internal audit department in June 2010. The person who is currently responsible for such function obtained her Australian CPA certification in 2005. After that, she worked in a consulting firm providing finance services, specialized accounting services and internal audit services. Since joining the Company, she has contributed to the design and implementation of various financial and account management policies and procedures and has provided a series of trainings to different levels of the staff. The management has now completed the internal control system and has started to offer training programs throughout the entire company.
|
24
|
|
•
|
The Company retained Friedman LLP, an outside consulting firm, in June 2010 to assist it in devising an effective risk assessment system. The Chief Financial Officer of the Company is directly responsible for overseeing such measures.
|
|
|
•
|
To the extent practicable in the segregation of duties, the Company designed procedures to enhance the independent performance by separate individuals of different tasks, such as in the custody of assets and the recording of transactions.
|
|
|
•
|
Management strengthened its communication system through such efforts as developing an Internal Office Automation System and establishing tailor-made procedures and protocols for particular staff members.
|
Following completion of the foregoing remediation measures, as of June 30, 2011, the Company carried out an evaluation, under the supervision of and with the participation of management, including the Company’s Chief Executive Officer and Chief Financial Officer, of the effectiveness of the design and operation of the Company’s disclosure controls and procedures. Based on the foregoing, the Chief Executive Officer and Chief Financial Officer concluded that the Company’s disclosure controls and procedures (as defined in Rules 13a-15(e) and 15d-15(e) under the Securities Exchange Act of 1934) were effective.
Changes in Internal Control over Financial Reporting
Other than the changes described above, there were no changes in the Company’s internal control over financial reporting (as defined in Rule 13a-15(f) of the Securities Exchange Act of 1934) during the three month ended June 30, 2011 that have materially affected, or are reasonably likely to materially affect, the Company’s internal control over financial reporting.
25
PART II. OTHER INFORMATION
None.
Not applicable.
|
|
(a)
|
None
|
|
|
(b)
|
The section entitled “Use of Proceeds” from the registration statement filed on January 8, 2010, as amended (the “Registration Statement”) is incorporated herein by reference. The effective date of the Registration Statement is April 14, 2010, and the Commission file number assigned to the Registration Statement is 333-164273. The Registration Statement registers the offering of up to 2,366,833 ordinary shares (subject to amendment in accordance with the Securities Act of 1933 and the rules and regulations promulgated thereunder) (the “Offering”). As of June 30, 2011, the Company has spent proceeds from the Offering in accordance with the following chart:
|
| Percentage of | ||||||||||||
|
Proposed
|
Actual Expenditures
|
Proposed Spent
|
||||||||||
|
Expenditure
|
Through June 30,
|
through June 30,
|
||||||||||
|
Description of Use
|
Amount
|
2011
|
2011
|
|||||||||
|
Working Capital
|
$ | 18,973,000 | $ | 18,973,000 | 100.0 | % | ||||||
|
Mergers & Acquisitions
|
6,120,000 | 2,081,000 | 34.0 | % | ||||||||
|
New Product Development
|
3,366,000 | 654,000 | 19.4 | % | ||||||||
|
Sales & Marketing
|
2,142,000 | 2,041,000 | 95.3 | % | ||||||||
|
Total
|
$ | 30,601,000 | $ | 23,749,000 | 77.6 | % | ||||||
|
|
(c)
|
None
|
|
Item 3.
|
Defaults Upon Senior Securities
|
None.
None.
|
Item 6.
|
Exhibits
|
The following exhibits are filed herewith:
|
Exhibit
Number
|
Document
|
|
|
3(i).1
|
Articles of Association of the Registrant (1)
|
|
|
3(i).2
|
Amended and Restated Articles of Association of the Registrant (1)
|
|
|
3(ii).1
|
Memorandum of Association of the Registrant (1)
|
26
|
3(ii).2
|
Amended and Restated Memorandum of Association of the Registrant (1)
|
|
|
4.1
|
Specimen Share Certificate (1)
|
|
|
10.1
|
Translation of Form of Employment Agreement between Registrant and Executive Officer of the Registrant (1)
|
|
|
10.2
|
Translation of Exclusive Technical and Consulting Service Agreement for Tranhold (1)
|
|
|
10.3
|
Translation of Management Fee Payment Agreement for Tranhold (1)
|
|
|
10.4
|
Translation of Proxy Agreement for Tranhold (1)
|
|
|
10.5
|
Translation of Equity Interest Pledge Agreement for Tranhold (1)
|
|
|
10.6
|
Translation of Exclusive Equity Interest Purchase Agreement for Tranhold (1)
|
|
|
10.7
|
Translation of Exclusive Technical and Consulting Service Agreement for Yanyu (1)
|
|
|
10.8
|
Translation of Management Fee Payment Agreement for Yanyu (1)
|
|
|
10.9
|
Translation of Proxy Agreement for Yanyu (1)
|
|
|
10.10
|
Translation of Equity Interest Pledge Agreement for Yanyu (1)
|
|
|
10.11
|
Translation of Exclusive Equity Interest Purchase Agreement for Yanyu (1)
|
|
|
10.14
|
Translation of Operating Agreement for Yanyu (1)
|
|
|
10.15
|
Translation of Operating Agreement for Tranhold (1)
|
|
|
10.16
|
Stock Option Plan (1)
|
|
|
10.17
|
Translation of Exclusive Technical and Consulting Service Agreement for BSST (2)
|
|
|
10.18
|
Translation of Management Fee Payment Agreement for BSST (2)
|
|
|
10.19
|
Translation of Operating Agreement for BSST (2)
|
|
|
10.20
|
Translation of Equity Interest Pledge Agreement for BSST (2)
|
|
|
10.21
|
Translation of Exclusive Equity Interest Purchase Agreement for BSST (2)
|
|
|
10.22
|
Translation of Proxy Agreement for BSST (2)
|
|
|
21.1
|
Subsidiaries of the Registrant (1)
|
|
|
31.1
|
Certifications pursuant to Rule 13a-14(a) or 15(d)-14(a) under the Securities Exchange Act of 1934, as amended, as adopted pursuant to Section 302 of the Sarbanes-Oxley Act of 2002 (3)
|
|
|
31.2
|
Certifications pursuant to Rule 13a-14(a) or 15(d)-14(a) under the Securities Exchange Act of 1934, as amended, as adopted pursuant to Section 302 of the Sarbanes-Oxley Act of 2002 (3)
|
|
|
32.1
|
Certifications pursuant to 18 U.S.C. Section 1350, as adopted pursuant to Section 906 of the Sarbanes-Oxley Act of 2002 (3)
|
27
|
32.2
|
Certifications pursuant to 18 U.S.C. Section 1350, as adopted pursuant to Section 906 of the Sarbanes-Oxley Act of 2002 (3)
|
|
|
99.1
|
Code of Business Conduct and Ethics (1)
|
|
|
99.2
|
|
Audit Committee Charter (4)
|
|
(1)
|
Incorporated by reference to the registrant’s registration statement on Form S-1, File no. 333-158393, filed on April 3, 2009, as amended.
|
|
(2)
|
Incorporated by reference to the registrant’s Form 10-K, File no. 001-34427, filed on March 29, 2011.
|
|
(3)
|
Filed herewith.
|
|
(4)
|
Incorporated by reference to the registrant’s Form 10-K, File no. 001-34427, filed on March 24, 2010.
|
28
SIGNATURES
In accordance with the requirements of the Exchange Act, the registrant caused this report to be signed on its behalf by the undersigned, thereunto duly authorized.
|
Tri-Tech Holding Inc.
|
||
|
August 15, 2011
|
By:
|
/s/ Peter Dong
|
|
Peter Dong
|
||
|
Chief Financial Officer
|
||
|
(Principal Financial and Accounting Officer)
|
||
29
TRI-TECH HOLDING INC. AND SUBSIDIARIES
Consolidated Financial Statements
For the quarters ended June 30, 2011 and 2010
TRI-TECH HOLDING INC. AND SUBSIDIARIES
TABLE OF CONTENTS
|
Page
|
|
|
CONSOLIDATED BALANCE SHEETS
|
F-1
|
|
CONSOLIDATED STATEMENTS OF INCOME AND COMPREHENSIVE INCOME
|
F-2
|
|
CONSOLIDATED STATEMENTS OF CASH FLOWS
|
F-4
|
|
NOTES TO CONSOLIDATED FINANCIAL STATEMENTS
|
F-5 – F23
|
TRI-TECH HOLDING INC. AND SUBSIDIARIES
| CONSOLIDATED BALANCE SHEETS | ||||||||
|
June 30, 2011
(Unaudited)
|
December 31,
2010
|
|||||||
|
ASSETS
|
||||||||
|
Current Assets
|
||||||||
|
Cash
|
$ | 13,118,960 | $ | 23,394,995 | ||||
|
Restricted cash
|
2,289,600 | 1,505,617 | ||||||
|
Accounts Receivable, net of allowance for doubtful accounts of $621,254 and $427,020 as of June 30, 2011 and December 31, 2010, respectively
|
14,557,320 | 18,041,079 | ||||||
|
Unbilled revenue
|
3,202,214 | 3,208,473 | ||||||
|
Other receivables
|
3,194,930 | 1,427,050 | ||||||
|
Inventories
|
7,567,105 | 5,886,619 | ||||||
|
Deposits on projects
|
935,557 | 591,505 | ||||||
|
Prepayments to suppliers and subcontractors
|
3,629,608 | 1,311,844 | ||||||
|
Total current assets
|
48,495,294 | 55,367,182 | ||||||
|
Long-term unbilled revenue
|
44,762,519 | 15,936,739 | ||||||
|
Plant and equipment, net
|
1,274,739 | 1,045,150 | ||||||
|
Intangible assets, net
|
11,002,758 | 4,331,261 | ||||||
|
Long-term restricted cash
|
— | 203,418 | ||||||
|
Long-term prepayment on land use right purchasing
|
— | 5,284,854 | ||||||
|
Goodwill
|
1,203,099 | 594,099 | ||||||
|
Total Assets
|
$ | 106,738,409 | $ | 82,762,703 | ||||
|
LIABILITIES AND EQUITY
|
||||||||
|
Current liabilities
|
||||||||
|
Accounts payable
|
$ | 3,338,896 | $ | 2,721,643 | ||||
|
Costs accrual on projects
|
17,077,853 | 9,198,420 | ||||||
|
Customer deposits
|
2,652,231 | 1,650,174 | ||||||
|
Other payables
|
6,216,449 | 2,717,502 | ||||||
| Accrued liabilities | 227,536 | 294,809 | ||||||
|
Payable on acquisition consideration
|
735,000 | — | ||||||
|
Income taxes payable
|
2,491,888 | 1,656,800 | ||||||
|
Short-term bank borrowing
|
540,825 | — | ||||||
|
Current portion of long-term liabilities
|
— | 14,994 | ||||||
|
Total current liabilities
|
33,280,678 | 18,254,342 | ||||||
|
Noncurrent deferred income taxes
|
550,561 | 187,295 | ||||||
|
Total Liabilities
|
33,831,239 | 18,441,637 | ||||||
|
Equity
|
||||||||
|
Tri-Tech Holding Inc. shareholders' equity
|
||||||||
|
Ordinary shares ($0.001 par value, 30,000,000 shares authorized; 8,181,507 and 8,051,833 shares issued as of June 30, 2011 and December 31, 2010, respectively)
|
8,182 | 8,052 | ||||||
|
Additional paid-in-capital
|
48,401,689 | 47,278,042 | ||||||
|
Statutory reserves
|
897,382 | 897,382 | ||||||
|
Retained earnings
|
16,024,293 | 12,563,624 | ||||||
|
Treasury stock (21,100 shares in treasury as of June 30, 2011 and December 31, 2010, respectively)
|
(193,750 | ) | (193,750 | ) | ||||
|
Accumulated other comprehensive income
|
3,020,839 | 1,739,799 | ||||||
|
Total Tri-Tech Holding Inc. shareholders' equity
|
68,158,635 | 62,293,149 | ||||||
|
Noncontrolling Interests
|
4,748,535 | 2,027,917 | ||||||
|
Total shareholders' equity
|
72,907,170 | 64,321,066 | ||||||
|
Total liabilities and equity
|
$ | 106,738,409 | $ | 82,762,703 | ||||
See notes to consolidated financial statements
F-1
TRI-TECH HOLDING INC. AND SUBSIDIARIES
CONSOLIDATED STATEMENTS OF INCOME AND COMPREHENSIVE INCOME
|
For The Three Months Ended June 30,
|
||||||||
|
2011
|
2010
|
|||||||
|
(Unaudited)
|
(Unaudited)
|
|||||||
|
Revenues:
|
||||||||
|
System integration
|
$ | 19,883,553 | $ | 5,587,132 | ||||
|
Hardware products
|
318,334 | 1,927,760 | ||||||
|
Software products
|
— | 587,886 | ||||||
|
Total revenues
|
20,201,887 | 8,102,778 | ||||||
|
Cost of revenues
|
||||||||
|
System integration
|
14,622,576 | 3,438,045 | ||||||
|
Hardware products
|
275,093 | 1,646,342 | ||||||
|
Cost of software
|
— | 14,172 | ||||||
|
Total cost of revenues
|
14,897,669 | 5,098,559 | ||||||
|
Operating expenses:
|
||||||||
|
Selling and marketing expenses
|
472,150 | 300,092 | ||||||
|
General and administrative expenses
|
1,882,432 | 878,178 | ||||||
|
Research and development expenses
|
26,759 | 53,573 | ||||||
|
Total operating expenses
|
2,381,341 | 1,231,843 | ||||||
|
Income from operations
|
2,922,877 | 1,772,376 | ||||||
|
Other income (expenses):
|
||||||||
|
Other expense
|
(132,558 | ) | (15,906 | ) | ||||
|
Interest income
|
46,446 | 10,002 | ||||||
|
Interest expense
|
(6,955 | ) | (1,134 | ) | ||||
|
Tax rebates
|
— | 24,551 | ||||||
|
Total other (expenses) income, net
|
(93,067 | ) | 17,513 | |||||
|
Income before provision for income taxes
|
2,829,810 | 1,789,889 | ||||||
|
Provision for income taxes
|
439,423 | 351,647 | ||||||
|
Net income
|
2,390,387 | 1,438,242 | ||||||
|
Less: Net income attributable to Non-controlling Interests
|
628,699 | 16,655 | ||||||
|
Net income attributable to Tri-Tech Holding Inc shareholders
|
$ | 1,761,688 | $ | 1,421,587 | ||||
|
Comprehensive income
|
||||||||
|
Net income
|
2,390,387 | 1,438,242 | ||||||
|
Foreign currency translation adjustment
|
833,706 | 70,709 | ||||||
|
Comprehensive income
|
3,224,093 | 1,508,951 | ||||||
|
Less: Comprehensive income attributable to non-controlling interests
|
721,172 | 21,703 | ||||||
|
Comprehensive income attributable to Tri-Tech Holding Inc.
|
$ | 2,502,921 | $ | 1,487,248 | ||||
|
Net income attributable to Tri-Tech Holding Inc. shareholders per share:
|
||||||||
|
Basic
|
$ | 0.22 | $ | 0.20 | ||||
|
Diluted
|
$ | 0.21 | $ | 0.19 | ||||
|
Weighted Average number of Ordinary Shares outstanding:
|
||||||||
|
Basic
|
8,133,130 | 7,254,714 | ||||||
|
Diluted
|
8,202,784 | 7,413,836 | ||||||
F-2
TRI-TECH HOLDING INC. AND SUBSIDIARIES
CONSOLIDATED STATEMENTS OF INCOME AND COMPREHENSIVE INCOME
|
For The Six Months Ended June 30,
|
||||||||
|
2011
|
2010
|
|||||||
|
(Unaudited)
|
(Unaudited)
|
|||||||
|
Revenues:
|
||||||||
|
System integration
|
$ | 35,754,047 | $ | 9,095,217 | ||||
|
Hardware products
|
2,001,051 | 2,274,841 | ||||||
|
Software products
|
- | 970,834 | ||||||
|
Total revenues
|
37,755,098 | 12,340,892 | ||||||
|
Cost of revenues
|
||||||||
|
System integration
|
26,273,325 | 5,589,260 | ||||||
|
Hardware products
|
1,167,375 | 1,956,082 | ||||||
|
Cost of software
|
- | 24,455 | ||||||
|
Total cost of revenues
|
27,440,700 | 7,569,797 | ||||||
|
Operating expenses:
|
||||||||
|
Selling and marketing expenses
|
786,323 | 438,232 | ||||||
|
General and administrative expenses
|
3,949,226 | 1,619,754 | ||||||
|
Research and development expenses
|
66,744 | 113,001 | ||||||
|
Total operating expenses
|
4,802,293 | 2,170,987 | ||||||
|
Income from operations
|
5,512,105 | 2,600,108 | ||||||
|
Other income (expenses):
|
||||||||
|
Other expense
|
(150,787 | ) | (20,755 | ) | ||||
|
Interest income
|
60,608 | 19,696 | ||||||
|
Interest expense
|
(6,955 | ) | (2,763 | ) | ||||
|
Tax rebates
|
- | 81,516 | ||||||
|
Total other (expenses) income, net
|
(97,134 | ) | 77,694 | |||||
|
Income before provision for income taxes
|
5,414,971 | 2,677,802 | ||||||
|
Provision for income taxes
|
845,059 | 419,420 | ||||||
|
Net income
|
4,569,912 | 2,258,382 | ||||||
|
Less: Net income attributable to Non-controlling Interests
|
1,109,243 | 19,180 | ||||||
|
Net income attributable to Tri-Tech Holding Inc shareholders
|
$ | 3,460,669 | $ | 2,239,202 | ||||
|
Comprehensive income
|
||||||||
|
Net income
|
4,569,912 | 2,258,382 | ||||||
|
Foreign currency translation adjustment
|
1,347,203 | 67,985 | ||||||
|
Comprehensive income
|
5,917,115 | 2,326,367 | ||||||
|
Less: Comprehensive income attributable to non-controlling interests
|
1,175,406 | 24,034 | ||||||
|
Comprehensive income attributable to Tri-Tech Holding Inc.
|
$ | 4,741,709 | $ | 2,302,333 | ||||
|
Net income attributable to Tri-Tech Holding Inc. shareholders per share:
|
||||||||
|
Basic
|
$ | 0.43 | $ | 0.36 | ||||
|
Diluted
|
$ | 0.42 | $ | 0.34 | ||||
|
Weighted Average number of Ordinary Shares outstanding:
|
||||||||
|
Basic
|
8,094,639 | 6,267,348 | ||||||
|
Diluted
|
8,164,293 | 6,505,580 | ||||||
See notes to consolidated financial statements
F-3
TRI-TECH HOLDING INC. AND SUBSIDIARIES
CONSOLIDATED STATEMENTS OF CASH FLOWS
|
For The Six Months Ended June 30,
|
||||||||
|
2011
|
2010
|
|||||||
|
(Unaudited)
|
(Unaudited)
|
|||||||
|
Cash flows from operating activities:
|
||||||||
|
Net income
|
$ | 4,569,912 | $ | 2,258,382 | ||||
|
Adjustments to reconcile net income to net cash used in operating activities:
|
||||||||
|
Amortization of option stock-based compensation
|
183,977 | 183,977 | ||||||
|
Amortization of warrants stock-based compensation
|
30,327 | 8,766 | ||||||
|
Depreciation and amortization
|
385,846 | 74,608 | ||||||
|
Provision for doubtful accounts
|
183,428 | (1,963 | ) | |||||
|
Deferred income taxes
|
363,266 | (149,875 | ) | |||||
|
Changes in operating assets and liabilities:
|
||||||||
|
Restricted cash
|
(541,012 | ) | (36,684 | ) | ||||
|
Accounts receivable
|
3,720,721 | (8,755,106 | ) | |||||
|
Unbilled revenue
|
(28,535,572 | ) | 1,192,722 | |||||
|
Other receivables and deposits on projects
|
(663,056 | ) | (2,083,909 | ) | ||||
|
Inventories
|
(1,543,043 | ) | (489,111 | ) | ||||
|
Prepayments to suppliers and subcontractors
|
(2,590,183 | ) | (206,504 | ) | ||||
|
Billings in excess of revenue
|
— | (8,654 | ) | |||||
|
Accounts payable
|
553,880 | (77,097 | ) | |||||
|
Cost accrual on projects
|
7,827,724 | 127,427 | ||||||
|
Customer deposits
|
963,528 | 261,458 | ||||||
|
Other payables
|
3,421,314 | 602,216 | ||||||
|
Accrued liabilities
|
(54,171 | ) | (42,430 | ) | ||||
|
Income taxes payable
|
796,405 | 539,222 | ||||||
|
Net cash used in operating activities
|
(10,926,709 | ) | (6,602,555 | ) | ||||
|
Cash flows from investing activities:
|
||||||||
|
Payment to purchase plant and equipment
|
(67,962 | ) | (135,574 | ) | ||||
|
Payment to purchase intangible assets
|
(164,952 | ) | (293,033 | ) | ||||
|
Addition of construction in progress
|
(241,612 | ) | — | |||||
|
Loan to third-party companies
|
(1,411,411 | ) | — | |||||
|
Payment in business acquisition
|
(488,000 | ) | — | |||||
|
Net cash used in investing activities
|
(2,373,937 | ) | (428,607 | ) | ||||
|
Cash flows from financing activities:
|
||||||||
|
Proceeds from exercising options into ordinary shares
|
454,009 | — | ||||||
|
Proceeds from short-term bank borrowing
|
540,825 | — | ||||||
|
Capital Injection by Minority Shareholder
|
1,545,213 | — | ||||||
|
Proceeds from the issuance of common stock
|
— | 30,666,876 | ||||||
|
Payment in repurchase treasury stock
|
— | (122,080 | ) | |||||
|
Payment of financing expenses to agencies
|
— | (392,784 | ) | |||||
|
Proceeds from exercising warrants into ordinary shares
|
— | 1,377,000 | ||||||
|
Payment of installment of purchasing vehicle
|
(15,344 | ) | (21,824 | ) | ||||
|
Net cash provided by financing activities
|
2,524,703 | 31,507,188 | ||||||
|
Effect of exchange rate fluctuation on cash and cash equivalents
|
499,908 | (36,963 | ) | |||||
|
Net (decrease) increase in cash and cash equivalents
|
(10,276,035 | ) | 24,439,063 | |||||
|
Cash and cash equivalents, beginning of period
|
$ | 23,394,995 | $ | 7,171,464 | ||||
|
Cash and cash equivalents, end of period
|
$ | 13,118,960 | $ | 31,610,527 | ||||
|
Supplemental disclosure of cash flow information:
|
||||||||
|
Income taxes paid
|
$ | 93,040 | $ | 183,954 | ||||
|
Interest paid on debt
|
$ | 6,955 | $ | 2,763 | ||||
|
Supplemental disclosure of noncash investing activity:
|
||||||||
|
Addition in land use right by transferring from long-term prepayment
|
$ | 5,547,907 | $ | — | ||||
|
Payable to purchase intangible assets during the business combination
|
$ | 735,000 | $ | — | ||||
|
Issued 35,974 ordinary shares as one of the consideration in business combination
|
$ | 277,000 | $ | — | ||||
See notes to consolidated financial statements
F-4
Tri-Tech Holding Inc. and Subsidiaries
Notes To Consolidated Financial Statements
June 30, 2011 and 2010
|
1.
|
Company Background
|
Tri-Tech Holding Inc. (“TRIT”), incorporated in the Cayman Islands, through its subsidiaries (collectively the “Company”), provides self-manufactured, proprietary or third-party products, system integration and other services in the following three segments: Water, Wastewater Treatment and Municipal Infrastructure, Water Resource Management System and Engineering Service, and Industrial Pollution Control and Safety.
TRIT currently has eight subsidiaries: (1) Tri-Tech International Investment, Inc. (“TTII”), (2) Tri-Tech (Beijing) Co., Ltd. (“TTB”), (3) Beijing Satellite Science & Technology Co. (“BSST”), (4) Tianjin Baoding Environmental Technology Co., Ltd. (“BAODING”), (5) Tranhold Environmental (Beijing) Tech Co., Ltd. (“Tranhold”), (6) Beijing Yanyu Water Tech Co., Ltd. (“Yanyu”) and (7) Tri-Tech Infrastructure LLC, a Delaware limited liability company located in the United States (“TIS”), and (8) Ordos Tri-Tech Anguo Investment Co., Ltd. (“TTA”). The corporate structure is as follow:
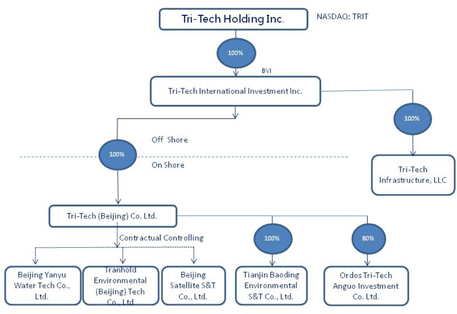
Through a series of contractual agreements in 2008 and 2010, the Company is deemed indirectly to be the sole interest holder of Tranhold and BSST, and the indirect interest holder of 92.86% equity ownership of Yanyu. According to the provisions of ASC 810, “Consolidation”, Tranhold, Yanyu and BSST are consolidated in the Company’s financial statements. For BSST, the Company also applied the consolidation procedures required by ASC 805 “Business Combinations”.
F-5
Tri-Tech Holding Inc. and Subsidiaries
Notes To Consolidated Financial Statements
June 30, 2011 and 2010
To expand its technical and geological market profile, on June 9, 2011, The Company acquired the total operating assets of J&Y International Inc. (“J&Y”), inclusive of its technology know-how, design prints, etc. J&Y was subsequently dissolved according to the terms. J&Y’s business, including design and production of industrial chemical water recovery, desalination plants, domestic and industrial wastewater treatment systems and reverse osmosis filtration systems and combined into the Company’s US subsidiary - TIS.
|
2.
|
Principles of consolidation and basis of presentation
|
Principles of consolidation and basis of presentation
The consolidated interim financial information as of June 30, 2011 and for the three-month and six-month periods ended June 30, 2011 and 2010 have been prepared without audit, pursuant to the rules and regulations of the Securities and Exchange Commission (the “SEC”). Certain information and footnote disclosures, which are normally included in consolidated financial statements prepared in accordance with accounting principles generally accepted in the United States of America (“U.S. GAAP”) have not been included. The interim consolidated financial information should be read in conjunction with the Financial Statements and the notes thereto, included in the Company’s Annual Report on Form 10-K for the fiscal year ended December 31, 2010, previously filed with the SEC.
In the opinion of management, all adjustments (which include normal recurring adjustments) necessary to present a fair statement of the Company’s consolidated financial position as of June 30, 2011, its consolidated results of operations and cash flows for the three-month and six-month periods ended June 30, 2011 and 2010, as applicable, have been made. The interim results of operations are not necessarily indicative of the operating results for the full fiscal year or any future periods.
The Company compiles its daily financial records in accordance with Generally Accepted Accounting Principles of the PRC (“PRC GAAP”) and converts its financial statements according to the US GAAP when reporting.
Reclassifications
Certain amounts have been reclassified to conform to the current presentation.
Use of Estimates
The preparation of financial statements in conformity with US GAAP requires management to make estimates and assumptions that affect the amounts reported in the consolidated financial statements and accompanying notes. Management believes that the estimates used in preparing its financial statements are reasonable and prudent. Actual results could differ from these estimates.
Certain of the Company’s accounting policies require higher degrees of professional judgment than others in their application. These include the recognition of revenue under the percentage of completion method, the allowance for doubtful accounts, long term contract collectability, impairment of fixed assets and intangible assets, and income tax. Management evaluates all of its estimates and judgments on an on-going basis.
F-6
Tri-Tech Holding Inc. and Subsidiaries
Notes To Consolidated Financial Statements
June 30, 2011 and 2010
Accounts Receivable
Accounts receivable are recorded at net realizable value consisting of the carrying amount less an allowance for uncollectible accounts as needed. The allowance for doubtful accounts is the Company’s best estimate of the amount of probable credit losses in the Company’s existing accounts receivable. The Company makes an allowance for doubtful accounts based on the aging of accounts receivable and on any specifically identified accounts receivable that may become uncollectible.
Long-term Unbilled Revenue
The Company obtained several Build-Transfer (“BT”) contracts with billing cycles of over three years in recent years. Due to the nature of the BT projects, we discounted the related revenue and recorded as long-term unbilled revenue and the discount rate is the 3-year nominal interest rate of 5.4%, set by the People’s Bank of China, the PRC’s central bank. For the contract that a specific discount rate is agreed in the contract, that specific rate is applied. These projects are funded by local governments with central government project appropriation, so the Company does not ascribe any collection risk on such projects.
Business combination
For a business combination with an acquisition date on or after the beginning of the first annual reporting period beginning on or after December 15, 2008, the assets acquired, the liabilities assumed, and any noncontrolling interest in the acquiree are recognized at the acquisition date, measured at their fair values as of that date. In a business combination achieved in stages, the identifiable assets and liabilities, as well as the non-controlling interest in the acquiree, are recognized at the full amounts of their fair values. In a bargain purchase in which the total acquisition-date fair value of the identifiable net assets acquired exceeds the fair value of the consideration transferred plus any non-controlling interest in the acquiree, that excess in earnings was recognized as a gain attributable to the Company.
Deferred tax liability and asset were recognized for the deferred tax consequences of differences between the tax bases and the recognized values of assets acquired and liabilities assumed in a business combination in accordance with ASC Topic 740, “Income Taxes”.
Goodwill represents the excess of the fair value of consideration transferred (plus the fair value of the non-controlling interest, if any) over fair value of the net assets acquired (including recognized intangibles). Goodwill is not amortized; rather, impairment tests are performed at least annually or more frequently if circumstances indicate impairment may have occurred. If impairment exists, goodwill is immediately written off to its fair value and the loss is recognized in the consolidated income statements. The Company assesses for impairment at period end or whenever events or changes indicate that, more likely than not, the carrying value of goodwill has been impaired. The Company uses the income approach to estimate the fair value of the goodwill. The income approach is based on the long-term projected future cash flows of the operating segments. The Company discounts the estimated cash flows to present value using a weighted-average cost of capital that considers factors such as the timing of the cash flows and the risks inherent in those cash flows.
Intangible Assets
The Company amortizes other acquired intangible assets with definite lives on a straight-line basis over their expected useful economic lives. The Company does not amortize intangible assets with an indefinite useful life but subjects them to an impairment test annually or more frequently if events or changes in circumstances indicate that the assets might be impaired.
F-7
Tri-Tech Holding Inc. and Subsidiaries
Notes To Consolidated Financial Statements
June 30, 2011 and 2010
|
Useful Life
|
|
|
Proprietary technology relating to sewage, municipal solid waste treatment and tail gas purification
|
20 years
|
|
Proprietary technology relating to low energy consumption data transmission system
|
20 years
|
|
Large region environmental management system
|
10 years
|
|
Mobile web management system
|
10 years
|
|
Database Management System
|
10 years
|
|
Pollution reduction checking assistant
|
10 years
|
|
Water pollution control infrastructure
|
10 years
|
|
Software-Gas Flow
|
20 years
|
|
Software-Oil Mixing
|
20 years
|
|
Software-Crude Blending
|
10 years
|
|
Customer Relationship
|
5 years
|
|
Land use right
|
50 years
|
|
Know-how
|
10 years
|
Revenue Recognition
Our revenues consist primarily of three categories: (i) Hardware Product Sales, (ii) Software Product Sales, and (iii) System Integration Sales. The Company recognizes revenue when the consideration to be received is fixed or determinable, products delivered, or services rendered, and collectability ensured.
For System Integration, sales contracts are structured with fixed price. The contract periods range from two months to approximately three years in length. The Company recognizes revenue of these contracts following the percentage-of-completion method, measured by different stages of completion in accordance with ASC 605-35, “Construction-Type and Production-Type Contracts”. Only if the actual implementation status meets the established milestone will the Company recognize the relevant portion of the revenue. There are four major stages for the System Integration revenue recognition: (a) the completion of project design, (b) the delivery of products, (c) the completion of debugging, and (d) inspection and acceptance. For BT projects, such as the Ordos drinking water plant project, the Company recognizes the project revenue using the man-power hours, which is the primary element of the total project costs, as the measurement for percentage of completion.
For Hardware Product Sales, the Company recognizes the revenue only when all products are delivered and the acceptance confirmations are signed by the customers, according to ASC 605-10, “Revenue Recognition”. We are not obligated for any repurchase or return of the goods.
F-8
Tri-Tech Holding Inc. and Subsidiaries
Notes To Consolidated Financial Statements
June 30, 2011 and 2010
The Company also sells software products. These software product sales do not include any additional services such as maintenance or technical support. The Company recognizes revenue under ASC 985-605, “Software Revenue Recognition” according to acceptance of delivery revenue recognition method. At the end of each reporting period, the Company recognizes the contract amount as revenue only if all software products have been delivered and the customer acceptance confirmation has been signed.
Provided unapproved change orders or claims occur in the future, in accounting for contracts, we follow Paragraphs 30 and 31 of ASC 605-35-25, “Construction-Type and Production-Type Contracts”. The Company recognizes revenue from unapproved change orders or claims only to the extent that contract costs relating to the unapproved change orders or claims have been incurred, and only if it is probable that such unapproved change orders or claims will result in additional contract revenue and the amount of such additional revenue can be reliably estimated. Until today, we have not experienced any unapproved change orders in our ordinary business operation.
The Company presents all sales revenue net of a value-added tax (“VAT”). The Company’s products sold in China are generally subject to a Chinese VAT of 17% of the sales price, except for certain proprietary software sales which will only be subject to an effective tax rate of 3%. The VAT payable may be offset by VAT paid by the Company on purchased raw materials and other materials included in the cost of projects or producing the finished product.
The Company record revenue in excess of billings as “unbilled revenue”, and billings in excess of revenues as “billings in excess of revenue.” For revenues accounted for under these two accounts, we expect the amounts to be collected within one year. For those with collective period longer than one year, we classify them under “Long-term unbilled revenue” on the consolidated balance sheets.
Cost of Revenues
Cost of revenues is based on total actual costs incurred plus estimated costs to completion applied to percentage of completion as measured at different stages. It includes material costs, equipment costs, transportation costs, processing costs, packaging costs, quality inspection and control, outsourced construction services fees and other costs that directly relate to the execution of the services and delivery of projects. Cost of revenues also includes inbound freight charges, purchasing and receiving costs and inspection costs when they incur.
Income Taxes
The Company provides for deferred income taxes using the asset and liability method. Under this method, the Company recognizes deferred income taxes for tax credits and net operating losses available for carry-forwards and significant temporary differences. The Company classifies deferred tax assets and liabilities as current or non-current based upon the classification of the related asset or liability in the financial statements or the expected timing of their reversal if they do not relate to a specific asset or liability. The Company provides a valuation allowance to reduce the amount of deferred tax assets if it is considered more likely than not that some portion or all of the deferred tax assets will not be realized.
F-9
Tri-Tech Holding Inc. and Subsidiaries
Notes To Consolidated Financial Statements
June 30, 2011 and 2010
The Company adopted Financial Accounting Standards Board (“FASB”) accounting standard codification 740(ASC 740), as of January 1, 2007. The Company recognizes a tax position as a benefit only if it is “more likely than not” that the tax position would be sustained in a tax examination, with a tax examination being presumed to occur. The amount recognized is the largest amount of tax benefit that the Company believes is more than 50% likely to be realized on examination. For tax positions not meeting the “more likely than not” test, the Company does not record it as a tax benefit. The Company also adopts ASC 740 guidance on de-recognition, classification, interest and penalties, accounting in interim periods, disclosures, and transition. It had no effect on the Company’s financial statements as of June 30, 2011 and December 31, 2010. The Company did not have any significant unrecognized uncertain tax positions as of June 30, 2011 and December 31, 2010.
The Company’s operations are subject to income and transaction taxes in China since most of the business activities take place in China. Significant estimates and judgments are required in determining the Company’s provision for income taxes. Some of these estimates are based on interpretations of existing tax laws or regulations. The ultimate amount of tax liability may be uncertain as a result. The Company does not anticipate any events which could change these uncertainties.
Recently Issued Accounting Pronouncements
In May 2011, the FASB issued ASU No. 2011-04, “’ Amendments to Achieve Common Fair Value Measurement and Disclosure Requirements in U.S. GAAP and IFRSs”, which is not expected to have a material impact on the consolidated financial statements upon adoption.
In June 2011, the FASB issued ASU No. 2011-05, “Presentation of Comprehensive Income”. Under the amendments in this ASU, an entity has two options for presenting its total comprehensive income: to present total comprehensive income and its components along with the components of net income in a single continuous statement, or in two separate but consecutive statements. The amendments in this ASU are required to be applied retrospectively and are effective for fiscal years, and interim periods within those years, beginning after December 15, 2011, with early adoption permitted. The Company intends to conform to the new presentation required in this ASU beginning with its Form 10-Q for the three months ended March 31, 2012. This pronouncement is not expected to have a material impact on the consolidated financial statements upon adoption.
|
3.
|
Business Combination
|
To expand its technical and geological market profile, on June 9, 2011, the Company acquired the total operating assets of J&Y International Inc. (“J&Y”), a water treatment company based in Wisconsin, USA, inclusive of its technology know-how, design prints, etc. The total purchase price is estimated to be $1,500,000 in form of cash and ordinary shares, of which $488,000 payment in cash and 35,974 ordinary shares at the price on the trading day prior to the Closing of $7.61 per share with a total amount of $277,000 should be paid and issued at Closing. The remaining payment of $735,000 subject to adjustment shall be deferred and paid by the issuance of ordinary shares, including:
|
|
1)
|
$200,000 payable upon a specific contract granted on or before February 28, 2012;
|
|
|
2)
|
$200,000 payable upon a specific contract completion and receipt of payment excluding retainer;
|
|
|
3)
|
In the event of this specific contract is not granted, the shares in 1) and 2) shall not be issued;
|
F-10
Tri-Tech Holding Inc. and Subsidiaries
Notes To Consolidated Financial Statements
June 30, 2011 and 2010
|
4)
|
$335,000 payable on or before February 28, 2012 based on the specific threshold of performance EBITDA generated in connection with a specific contract.
|
|
5)
|
If the seller sells the issued shares at a price less than $7.61 within one calendar year after the expiration of the restriction period, the Company shall pay the seller shortfall in cash as the Make Good Amount.
|
The above contingent consideration was classified as a liability as of June 9, 2011, the closing date. The fair value of the contingent consideration as of June 9, 2011 and June 30, 2011 was estimated at $735,000 which was provisional pending receipt of the final valuation. The estimation was done based on the best estimates of the management and will be retrospectively adjusted according to the official appraisal reports.
As a result of this acquisition, all of J&Y’s original business unit will be transferred to the Company, and then J&Y will deregister accordingly. The original shareholder of J&Y will become an employee of the Company. The Company will manage J&Y’s original business in US market. Thus, the Company will benefit from J&Y’s customer relationship, relevant technology and the potential profit earning ability from this transaction, which is also the purpose of this transaction. This acquisition was accounted for as a business combination in accordance with ASC Topic 805. .
The goodwill of $609,000 arising from the acquisition represents the consideration paid in excess of the operating assets acquired. Management expects to realize synergies from combining the operations of the Company and J&Y. None of the goodwill recognized is expected to be deductible for income tax purposes. All of the goodwill was assigned to the segment 3, Industrial pollution control and safety water resource.
The estimated fair values of the assets acquired recognized at the acquisition date as of June 9, 2011:
|
Fair Value
|
||||
|
Customer relationship
|
$ | 570,000 | ||
|
Know-how
|
700,000 | |||
|
Deferred tax liabilities
|
(379,000 | ) | ||
|
Total identifiable net assets
|
$ | 891,000 | ||
The following table represents the consideration allocation based on estimated fair value on June 9, 2011:
|
Total identifiable net assets
|
$ | 891,000 | ||
|
Goodwill
|
609,000 | |||
|
Total consideration
|
$ | 1,500,000 |
The goodwill mainly represents the intangibles not qualifying for separate recognition.
A reconciliation of the carrying amount of goodwill is as shown below:
F-11
Tri-Tech Holding Inc. and Subsidiaries
Notes To Consolidated Financial Statements
June 30, 2011 and 2010
|
Carrying amount of Goodwill
|
||||
|
January 1, 2011
|
$ | 594,099 | ||
|
Addition within six months ended June 30, 2011
|
609,000 | |||
|
June 30, 2011
|
$ | 1,203,099 | ||
The amounts of J&Y’s revenue and earnings for the six months ended June 30, 2011, and the revenue and earnings of the combined entity had the acquisition date been January 1, 2011, or January 1, 2010, are as follow. The unaudited pro forma financial information presents the result of operation of the Company as if the acquisition of J&Y has occurred as of December 31, 2010. The result includes the impact of preliminary fair value adjustment on intangible assets and the related adjustments on deferred taxes. The unaudited pro forma financial information is not necessarily indicative of what the Company’s consolidated results of operations would actually have been had it completed the acquisition on December 31, 2010. In addition, the unaudited pro forma financial information does not attempt to project the future results of operations of the combined entity.
|
Revenue
|
Earnings
|
|||||||
|
Actual from June 9 to June 30, 2011 generated from assets purchased from J&Y
|
$ | - | $ | - | ||||
|
Supplemental pro forma from January 1 – June 30, 2011
|
$ | 37,789,298 | $ | 4,521,272 | ||||
|
Supplemental pro forma for January 1 – June 30, 2010
|
$ | 13,170,173 | $ | 2,258,683 | ||||
Supplemental pro forma in revenue:
|
Revenue
|
J&Y
|
TRIT Group
|
Elimination
|
Combined
|
||||||||||||
|
January 1, 2011–June 30, 2011
|
$ | 34,200 | $ | 37,755,098 | $ | — | $ | 37,789,298 | ||||||||
|
January 1, 2010–June 30, 2010
|
$ | 829,281 | $ | 12,340,892 | $ | — | $ | 13,170,173 | ||||||||
Supplemental pro forma in earnings:
|
Earnings
|
J&Y
|
TRIT Group
|
Elimination
|
Combined
|
||||||||||||
|
January 1, 2011 – June 30, 2011
|
$ | (48,640 | ) | $ | 4,569,912 | $ | — | $ | 4,521,272 | |||||||
|
January 1, 2010 – June 30, 2010
|
$ | 301 | $ | 2,258,382 | $ | — | $ | 2,258,683 | ||||||||
F-12
Tri-Tech Holding Inc. and Subsidiaries
Notes To Consolidated Financial Statements
June 30, 2011 and 2010
|
4.
|
Restricted Cash
|
As of June 30, 2011, the Company has made several time deposits totaling $2,289,600, as collateral in exchange of the issuance of Letters of Credit. These deposits are all with expiration dates within the next 12 months. Specifically, $679,138 will expire in the third quarter of 2011; $838,498 will expire in the fourth quarter of 2011; and remaining balance of $771,964 is to expire in the next 12 months.
|
5.
|
Accounts Receivable, Net
|
Based on the Company’s assessment, management believes the net balance on each balance sheet date herein was collectable. The gross balance and bad debt provision as at June 30, 2011 and December 31, 2010 are as the following:
|
June 30, 2011
|
December 31, 2010
|
|||||||
|
(Unaudited)
|
||||||||
|
Accounts receivable, gross
|
$ | 15,178,574 | $ | 18,468,099 | ||||
|
Less bad debt provision
|
(621,254 | ) | (427,020 | ) | ||||
|
Accounts receivable, net
|
$ | 14,557,320 | $ | 18,041,079 | ||||
|
6.
|
Other Receivables
|
Other receivables consisted of the following:
|
June 30, 2011
|
December 31, 2010
|
|||||||
|
(Unaudited)
|
||||||||
|
Advances to staff
|
$ | 892,183 | $ | 198,604 | ||||
|
Loan to third-party companies
|
1,427,128 | - | ||||||
|
Rental Deposit
|
170,261 | 172,096 | ||||||
|
Receivables regarding Ordos Project
|
451,611 | 388,059 | ||||||
|
Other
|
253,747 | 668,291 | ||||||
|
Total
|
$ | 3,194,930 | $ | 1,427,050 | ||||
Loan to third-party companies was made to cooperative companies for working capital purpose. $500,000 is for a short term of six month with 6% annual interest rate. $463,564 is for a short term of three month with monthly interest rate of 1%. And the remaining $463,564 is for 58 days without interest bearing.
|
7.
|
Inventories
|
Inventories consisted of the following:
F-13
Tri-Tech Holding Inc. and Subsidiaries
Notes To Consolidated Financial Statements
June 30, 2011 and 2010
|
June 30, 2011
|
December 31
|
|||||||
|
(Unaudited)
|
2010
|
|||||||
|
Raw materials
|
$ | 878,072 | $ | 1,136,981 | ||||
|
Finished goods
|
783,858 | 557,694 | ||||||
|
Project work-in-progress
|
5,905,175 | 4,191,944 | ||||||
|
Total
|
$ | 7,567,105 | $ | 5,886,619 | ||||
The Company reviews its inventory periodically for possible obsolete goods and to determine if any reserves are necessary for potential obsolescence. As of June 30, 2011 and December 31, 2010, the Company determined that no reserves were necessary.
|
8.
|
Deposits on Projects
|
Deposits on Projects consisted of the following:
|
June 30 2011
|
December 31
|
|||||||
|
(Unaudited)
|
2010
|
|||||||
|
Current:
|
||||||||
|
Contract deposit
|
$ | 884,531 | $ | 386,000 | ||||
|
Bidding deposit
|
51,026 | 205,505 | ||||||
|
Totals
|
$ | 935,557 | $ | 591,505 | ||||
Contract deposits are paid to customers for promising the service or products will be properly and timely provided. Bidding deposits are paid as a deposit for involving in the bidding process. All of the deposits will be utilized within one year.
|
9.
|
Intangible Assets, Net
|
The Intangible Assets mainly consist of patents, software, customer lists, land use right and know-how. The patents were invested as capital contribution by the shareholders of Tranhold and Yanyu, and were recorded at the appraisal value as stipulated by the local regulatory authority. Software was purchased from third parties at the acquisition cost.
All the intangible assets have definite lives, and are amortized on a straight-line basis over their expected useful economic lives. The original costs and accumulated amortization as of June 30, 2011 and December 31, 2010 are as follows:
In November 2010, $5,284,854 was paid for a land use right. On January 18, 2011, the land use right was transferred and accepted by the Company. The amortization of the land use right for 50 years started in January 2011.
F-14
Tri-Tech Holding Inc. and Subsidiaries
Notes To Consolidated Financial Statements
June 30, 2011 and 2010
|
June 30,2011
|
December 31,
|
|||||||
|
(Unaudited)
|
2010
|
|||||||
|
Patents
|
$ | 1,815,082 | $ | 1,773,670 | ||||
|
Software
|
2,803,016 | 2,739,064 | ||||||
|
Customer list
|
1,242,168 | 656,832 | ||||||
|
Land use right
|
5,573,197 | - | ||||||
|
Know-how
|
700,000 | - | ||||||
|
Total intangible assets
|
12,133,463 | 5,169,566 | ||||||
|
Less accumulated amortization
|
(1,130,705 | ) | (838,305 | ) | ||||
|
Intangible assets, net
|
$ | 11,002,758 | $ | 4,331,261 | ||||
According to the spirit of ASC 845-10-S99, transfers of nonmonetary assets to a company by its promoters or shareholders in exchange for stock prior to or at the time of the company’s initial public offering normally should be recorded at the transferors’ historical cost basis determined under GAAP. The net book value of the patents invested by the majority shareholders of Yanyu was $508,007 as of June 30, 2011,which only accounted for 0.5% of its total assets as of June 30, 2011. Therefore, the effect from the inclusion of the contributed patents at its fair value instead of historical cost was immaterial.
The amortization expense for the quarters ended June 30, 2011 and 2010 amounted to $124,811 and $20,013 respectively. The amortization expenses for the six months ended June 30, 2011 and 2010 accounted to $269,827 and $37,575, respectively.
The amortization expense from June 30, 2011 for the next five years is expected to be as follows:
|
For the Year Ending December 31,
|
Amount
|
|||
|
2011
|
$ | 360,345 | ||
|
2012
|
720,691 | |||
|
2013
|
720,691 | |||
|
2014
|
720,691 | |||
|
2015
|
664,677 | |||
|
Thereafter
|
7,815,663 | |||
|
Total
|
$ | 11,002,758 | ||
|
10.
|
Accounts Payable and Costs Accrual on Projects
|
This account contains the accounts payable to suppliers and accruals of costs incurred in the projects in accordance with the percentage of completion method.
Accounts payable and project accruals based on progress are consisted of the following:
|
June 30,2011
|
December 31,
|
|||||||
|
(Unaudited)
|
2010
|
|||||||
|
Accounts Payable
|
$ | 3,338,896 | $ | 2,721,643 | ||||
|
Accruals
|
17,077,853 | 9,198,420 | ||||||
|
Total
|
$ | 20,416,749 | $ | 11,920,063 | ||||
F-15
Tri-Tech Holding Inc. and Subsidiaries
Notes To Consolidated Financial Statements
June 30, 2011 and 2010
|
11.
|
Income Taxes
|
We are subject to income taxes on entity basis on income arising in or derived from the tax jurisdictions in which each entity is domiciled. According to the New Enterprise Income Tax Law (“NEITL”) in China, unified Enterprise Income Tax rate is 25%. However, two of six subsidiaries in China are subject to certain favorable tax policies as being a high-tech company. The effective EIT used in the second quarter of 2011 is 16%, as projected by our management.
The Company has not recorded tax provision for U.S. tax purposes as they have no assessable profits arising in or derived from the United States and intends to permanently reinvest accumulated earnings in the PRC operations.
|
Three Months Ended June 30,
|
||||||||
|
(Unaudited)
|
||||||||
|
2011
|
2010
|
|||||||
|
%
|
%
|
|||||||
|
TTB (effective until the end of 2011)
|
7.5 | 7.5 | ||||||
|
BSST
|
15 | 15 | ||||||
|
Yanyu
|
25 | 25 | ||||||
|
Tranhold
|
25 | 25 | ||||||
|
TTA
|
25 | - | ||||||
|
Baoding
|
25 | 25 | ||||||
|
Consolidated Effective EIT
|
16 | 20 | ||||||
|
Six Months Ended June 30,
|
||||||||
|
(Unaudited)
|
||||||||
|
2011
|
2010
|
|||||||
|
%
|
%
|
|||||||
|
TTB (effective until the end of 2011)
|
7.5 | 7.5 | ||||||
|
BSST
|
15 | 15 | ||||||
|
Yanyu
|
25 | 25 | ||||||
|
Tranhold
|
25 | 25 | ||||||
|
TTA
|
25 | — | ||||||
|
Baoding
|
25 | 25 | ||||||
|
Consolidated Effective EIT
|
16 | 16 | ||||||
The provision for income tax expense (benefit) from continuing operations consists of the following:
|
Three Months Ended June 30,
|
||||||||
|
2011
|
2010
|
|||||||
|
(Unaudited)
|
(Unaudited)
|
|||||||
|
Current:
|
||||||||
|
PRC
|
$ | 449,590 | $ | 351,647 | ||||
|
Deferred:
|
||||||||
|
PRC
|
(10,167 | ) | - | |||||
|
Total income tax expense
|
$ | 439,423 | $ | 351,647 | ||||
F-16
Tri-Tech Holding Inc. and Subsidiaries
Notes To Consolidated Financial Statements
June 30, 2011 and 2010
|
Six Months Ended June 30,
|
||||||||
|
2011
|
2010
|
|||||||
|
(Unaudited)
|
(Unaudited)
|
|||||||
|
Current:
|
||||||||
|
PRC
|
$ | 860,793 | $ | 419,420 | ||||
|
Deferred:
|
||||||||
|
PRC
|
(15,734 | ) | — | |||||
|
Total income tax expense
|
$ | 845,059 | $ | 419,420 | ||||
Significant components of the Company’s net deferred tax assets/(liabilities) are as follows:
|
June 30, 2011
|
December 31,
|
|||||||
|
(Unaudited)
|
2010
|
|||||||
|
Long-term:
|
||||||||
|
Deferred tax liabilities:
|
||||||||
|
Intangible assets valuation in business combination
|
$ | 550,561 | $ | 187,295 | ||||
|
Total net deferred tax liabilities
|
$ | 550,561 | $ | 187,295 | ||||
Income tax reconciliation for the three months ended June 30, 2011 and 2010 are as follows:
|
Three Months Ended June 30,
|
||||||||
|
2011
|
2010
|
|||||||
|
(Unaudited)
|
(Unaudited)
|
|||||||
|
PRC statutory tax rate
|
25 | % | 25 | % | ||||
|
Taxable income
|
$ | 2,829,810 | $ | 1,789,889 | ||||
|
Computed expected income tax expense
|
$ | 707,453 | $ | 447,471 | ||||
|
Effect of preferential tax rates
|
(268,030 | ) | (95,824 | ) | ||||
|
Income tax expense
|
$ | 439,423 | $ | 351,647 | ||||
Income tax reconciliation for the six months ended June 30, 2011 and 2010 are as follows:
F-17
Tri-Tech Holding Inc. and Subsidiaries
Notes To Consolidated Financial Statements
June 30, 2011 and 2010
|
Six Months Ended June 30,
|
||||||||
|
2011
|
2010
|
|||||||
|
(Unaudited)
|
(Unaudited)
|
|||||||
|
PRC statutory tax rate
|
25 | % | 25 | % | ||||
|
Taxable income
|
$ | 5,414,971 | $ | 2,677,802 | ||||
|
Computed expected income tax expense
|
$ | 1,353,743 | $ | 669,451 | ||||
|
Effect of preferential tax rates
|
(508,684 | ) | (250,031 | ) | ||||
|
Income tax expense
|
$ | 845,059 | $ | 419,420 | ||||
|
12.
|
Ordinary Shares
|
At the beginning of 2011, the outstanding ordinary shares of the Company were 8,030,733 and the issued ordinary shares of the Company were 8,051,833.
During 2010, the Company repurchased 21,100 ordinary shares in six installments with $193,750 paid, and recorded as treasury shares at cost method.
On March 8, 2011, 93,700 options were exercised at a price equal to $6.75 per share. During the three months ended June 30, 2011, 35,974 shares were issued at $7.61 per share with a total amount of $277,000 as part of the consideration in business combination.
By June 30, 2011, the total outstanding ordinary shares of the Company were 8,160,407 and the total issued ordinary shares of the Company were 8,181,507.
|
13.
|
Warrants
|
As of June 30, 2011 and December 31, 2010, the Company has 229,274 and 221,774 warrants outstanding for ordinary shares. None of these warrants were exercised by June 30, 2011. During the three months ended June 30, 2011 and 2010, the Company recorded warrants expense as general and administrative expenses with $30,327 and $0. During the six months ended June 30, 2011 and 2010, the Company recorded warrants expense as general and administrative expenses with $30,327 and $8,766.
On February 21, 2011, the Company issued 7,500 warrants to Hawk Associates Inc. in exchange for its investors relation services provided during the period of year 2011. These warrants can be exercised at a price of $8.10 per share on the base date and will be expired on the five year anniversary of the base date. The fair value of each warrant awarded is $8.09 which is estimated on the grant date of using Black-Scholes model that uses the items noted in the following table.
|
Fair value per share (USD/share)
|
13.23 | |||
|
Exercise price (USD/share)
|
8.10 | |||
|
Risk free rate
|
2.04 | % | ||
|
Dividend yield
|
0.00 | % | ||
|
Expected term/Contractual Life (No. of Yrs)
|
5.0 | |||
|
Expected volatility
|
54 | % |
F-18
Tri-Tech Holding Inc. and Subsidiaries
Notes To Consolidated Financial Statements
June 30, 2011 and 2010
|
14.
|
Options Issued to Employees
|
TRIT’s 2009 Stock Incentive plan that was approved by shareholders permits the Company to offer up to 525,500 shares, options and other securities to its employees and director. On September 9, 2009, TRIT granted 525,500 stock options with an exercise price equal to $6.75 to its senior management and employees. The options will vest based on 5 years of continuous service and will have 10-year contractual terms from September 9, 2009. The options will vest over five years at a rate of 20% per year, with the first 20% vesting on September 9, 2010. Certain options provide for accelerated vesting upon a change in control (as defined in the employee share option plan).
The fair value of options on the grant-date of September 9, 2009 was $3.53 per share, which was estimated by using a Black-Scholes Model. The total fair value of options was $1,855,015. 105,100 options are vested under the employee share option plan as of June 30, 2011 and December 31, 2010, respectively. 93,700 and 0 options are exercised as of June 30, 2011 and December 31 2010, respectively.
The Company recognized compensation cost for awards with graded vesting on a straight-line basis over the requisite service period for the entire award. The total option compensation expense recognized for the three months ended June 30, 2011 and 2010 was $96,846 and $92,497, respectively. The total option compensation expense recognized for the six months ended June 30, 2011 and 2010 was both $183,977. Another $1,185,177 will be recognized as general and administrative expense over the next 1,166 days.
|
15.
|
Net Income per Ordinary Share
|
The following table presents a reconciliation of basic and diluted net income per share:
|
Three Months Ended June 30,
|
||||||||
|
2011
|
2010
|
|||||||
|
(Unaudited)
|
(Unaudited)
|
|||||||
|
Net income attributable to Tri-Tech Holding Inc
|
$ | 1,761,688 | $ | 1,421,587 | ||||
|
Weighted-average shares of ordinary share used to compute basic net income per share
|
8,133,130 | 7,254,714 | ||||||
|
Effect of dilutive ordinary share equivalents:
|
||||||||
|
Dilutive effect of warrants
|
3,975 | 8,015 | ||||||
|
Dilutive effect of employee stock options
|
65,679 | 151,107 | ||||||
|
Shares used in computing diluted net income per ordinary share
|
8,202,784 | 7,413,836 | ||||||
|
Basic net income per ordinary share
|
$ | 0.22 | $ | 0.20 | ||||
|
Diluted net income per ordinary share
|
$ | 0.21 | $ | 0.19 | ||||
F-19
Tri-Tech Holding Inc. and Subsidiaries
Notes To Consolidated Financial Statements
June 30, 2011 and 2010
|
Six Months Ended June 30,
|
||||||||
|
2011
|
2010
|
|||||||
|
(Unaudited)
|
(Unaudited)
|
|||||||
|
Net income attributable to Tri-Tech Holding Inc
|
$ | 3,460,669 | $ | 2,239,202 | ||||
|
Weighted-average shares of ordinary share used to compute basic net income per share
|
8,094,639 | 6,267,348 | ||||||
|
Effect of dilutive ordinary share equivalents:
|
||||||||
|
Dilutive effect of warrants
|
3,975 | 87,125 | ||||||
|
Dilutive effect of employee stock options
|
65,679 | 151,107 | ||||||
|
Shares used in computing diluted net income per ordinary share
|
8,164,293 | 6,505,580 | ||||||
|
Basic net income per ordinary share
|
$ | 0.43 | $ | 0.36 | ||||
|
Diluted net income per ordinary share
|
$ | 0.42 | $ | 0.34 | ||||
The dilutive effect comes from 525,500 options to employee and 150,000 warrants to investor relations consultant. There are 214,274 warrants to underwriter having anti-dilutive effect due to the fact that the weighted average exercise price per share of these warrants is higher than the weighted average market price per share of ordinary share during the three months and six months ended June 30, 2011
|
16.
|
Certain Significant Risks and Uncertain
|
Cash includes cash on hand and demand deposits in accounts maintained with banks. Total cash in these banks as of June 30, 2011 and December 31, 2010 amounted to $13,118,960 and $23,394,995, respectively, of which no deposits are covered by insurance. The Company has not experienced any losses in such accounts and believes it is not exposed to any risks on its cash in bank accounts.
The Company’s substantial operations are carried out in the PRC. Accordingly, the Company’s business, financial condition and results of operations may be influenced by the political, economic and legal environments in the PRC and by the general state of the PRC’s economy. The Company’s operations in the PRC are subject to specific considerations and significant risks not typically associated with companies in North America and Western Europe. These include risks associated with, among others, the political, economic and legal environments and foreign currency exchange. The Company’s results may be adversely affected by changes in governmental policies with respect to laws and regulations, anti-inflationary measures, currency conversion and remittance abroad, and rates and methods of taxation, among other things.
The Company has one major customer who represented approximately 79.59% of the Company’s revenue for the three month ended June 30, 2011. The project is a Build-Transfer project we entered into in 2010 with a local government agency. The long-term unbilled revenue balance with this customer is $38,622,732 and $9,769,657 as of June 30, 2011 and December 31, 2010, respectively. No other customers represented more than 10% of the Company’s sales for the three months ended June 30, 2011 and 2010. Due to the nature of the BT projects, and the creditability of the government agency, the management believes the risk of the client being insolvent is minor. The five major customers represented approximately 86.7% and 82.2% of the Company’s sales for the three and six months ended June 30, 2011.
Our suppliers vary from project to project. Many times, they are specifically appointed by the clients. Most of the material or equipment we purchase is non-unique and easily available in the market. The prices for those purchases, although increasing, are relatively consistent and predictable. A specific supplier might occupy a significant percentage of our total purchase at a certain time for a large contract. The dependence on a specific supplier usually ends when the project is completed. We do not rely on any single supplier for long term.
F-20
Tri-Tech Holding Inc. and Subsidiaries
Notes To Consolidated Financial Statements
June 30, 2011 and 2010
|
17.
|
Commitments and Contingencies
|
Operating Leases
As of June 30, 2011, the Company had commitments under certain operating leases, requiring annual minimum rentals as follows:
|
For the Year Ending
December 31,
|
Amount
|
|||
|
2011
|
$ | 342,846 | ||
|
2012
|
643,821 | |||
|
2013
|
452,268 | |||
|
2014
|
111,589 | |||
|
2015
|
- | |||
|
Total
|
$ | 1,550,524 | ||
The leased properties are principally located in the PRC and are used for administration and research and development purposes. The terms of these operating leases vary from one to five years. Pursuant to the contracts, when they expire, we have the rights to extend them with new negotiated prices. Rental expenses were $176,326 and $71,439 for the three months ended June 30, 2011 and 2010, respectively. Rental expenses were $359,613 and $140,666 for the six months ended June 30, 2011 and 2010, respectively.
Product Warranties
The Company’s warranty policy generally is to replace parts if they become defective within one year after deployment at no additional charge. Historically, failure of product parts due to materials or workmanship has not been significant. The Company has not incurred any material unexpected costs associated with servicing its warranties. The Company continuously evaluates and estimates its potential warranty obligations, and records the related warranty obligation when the estimated amount becomes material at the time revenue is recorded.
|
18.
|
Segment and Geographic Information
|
The Company has three reportable operating segments. The segments are grouped with references to the types of services provided and the types of clients that use those services. As TTB and its subsidiaries conduct services of the three segments, the total sales and costs are accordingly divided into the three segmental portions. The Company assesses each segment’s performance based on net revenues and gross profit on contribution margin. The three reportable operating segments are:
Segment 1: Water, Wastewater Treatment and Municipal Infrastructure
Municipal water supply and distribution, wastewater treatment and gray water reuse engineering, procurement, and construction (EPC), build and transfer (BT); proprietary process control systems, process equipment integrated, and proprietary odor control systems, and other municipal facilities engineering, operation management, and related infrastructure construction projects.
Segment 2: Water Resource Management System and Engineering Service
F-21
Tri-Tech Holding Inc. and Subsidiaries
Notes To Consolidated Financial Statements
June 30, 2011 and 2010
Water resources protection and allocation, flood control and forecasting, irrigation systems, related system integration, proprietary hardware and software products, etc.
Segment 3: Industrial Pollution Control and Safety Water Resource
Provide systems for VOC abatement, odor control, water and wastewater treatment, water recycling facilities design, engineering, procurement and construction for oil, gas, petrochemical and power industries, safety and clean production technologies for oil, gas exploration and pipeline.
|
For the three months ended June 30, 2011 and 2010 (Unaudited)
|
||||||||||||||||||||||||||||||||
|
Segment 1
|
Segment 2
|
Segment 3
|
Total
|
|||||||||||||||||||||||||||||
|
2011
|
2010
|
2011
|
2010
|
2011
|
2010
|
2011
|
2010
|
|||||||||||||||||||||||||
|
Revenues
|
$ | 16,769,633 | $ | 4,252,524 | $ | 2,314,470 | $ | 2,053,070 | $ | 1,117,784 | $ | 1,797,184 | $ | 20,201,887 | $ | 8,102,778 | ||||||||||||||||
|
Cost of revenues
|
12,589,753 | 2,495,414 | 1,576,744 | 1,207,680 | 731,172 | 1,395,465 | 14,897,669 | 5,098,559 | ||||||||||||||||||||||||
|
Operating expenses:
|
||||||||||||||||||||||||||||||||
|
Selling and Marketing Expenses
|
143,878 | 121,573 | 215,005 | 172,014 | 113,267 | 6,505 | 472,150 | 300,092 | ||||||||||||||||||||||||
|
General and Administrative Expenses
|
1,196,760 | 446,986 | 247,098 | 266,403 | 438,574 | 164,789 | 1,882,432 | 878,178 | ||||||||||||||||||||||||
|
Research and Development
|
7,936 | 53,573 | 8,263 | - | 10,560 | - | 26,759 | 53,573 | ||||||||||||||||||||||||
|
Total operating expenses
|
1,348,574 | 622,132 | 470,366 | 438,417 | 562,401 | 171,294 | 2,381,341 | 1,231,843 | ||||||||||||||||||||||||
|
Other income (expenses), net
|
(34,363 | ) | 13,531 | (30,230 | ) | (2,868 | ) | (28,474 | ) | 6,850 | (93,067 | ) | 17,513 | |||||||||||||||||||
|
Income (loss) before income taxes
|
$ | 2,796,943 | $ | 1,148,509 | $ | 237,130 | $ | 404,105 | $ | (204,263 | ) | $ | 237,275 | $ | 2,829,810 | $ | 1,789,889 | |||||||||||||||
|
For the six months ended June 30, 2011 and 2010 (Unaudited)
|
||||||||||||||||||||||||||||||||
|
Segment 1
|
Segment 2
|
Segment 3
|
Total
|
|||||||||||||||||||||||||||||
|
2011
|
2010
|
2011
|
2010
|
2011
|
2010
|
2011
|
2010
|
|||||||||||||||||||||||||
|
Revenues
|
$ | 29,674,019 | $ | 6,813,575 | $ | 3,955,529 | $ | 3,669,490 | $ | 4,125,550 | $ | 1,857,827 | $ | 37,755,098 | $ | 12,340,892 | ||||||||||||||||
|
Cost of revenues
|
22,211,750 | 4,026,798 | 2,445,352 | 2,133,071 | 2,783,598 | 1,409,928 | 27,440,700 | 7,569,797 | ||||||||||||||||||||||||
|
Operating expenses:
|
||||||||||||||||||||||||||||||||
|
Selling and Marketing Expenses
|
252,935 | 190,397 | 365,733 | 236,624 | 167,655 | 11,211 | 786,323 | 438,232 | ||||||||||||||||||||||||
|
General and Administrative Expenses
|
1,937,901 | 766,930 | 742,334 | 672,923 | 1,268,991 | 179,901 | 3,949,226 | 1,619,754 | ||||||||||||||||||||||||
|
Research and Development
|
7,936 | 110,413 | 48,248 | 75 | 10,560 | 2,513 | 66,744 | 113,001 | ||||||||||||||||||||||||
|
Total operating expenses
|
2,198,772 | 1,067,740 | 1,156,315 | 909,622 | 1,447,206 | 193,625 | 4,802,293 | 2,170,987 | ||||||||||||||||||||||||
|
Other income (expenses), net
|
(40,016 | ) | 15,726 | (30,295 | ) | 55,118 | (26,823 | ) | 6,850 | (97,134 | ) | 77,694 | ||||||||||||||||||||
|
Income (loss) before income taxes
|
$ | 5,223,481 | $ | 1,734,763 | $ | 323,567 | $ | 681,915 | $ | (132,077 | ) | $ | 261,124 | $ | 5,414,971 | $ | 2,677,802 | |||||||||||||||
Assets by segment
The Company evaluates its assets by segment to generate information needed for internal control, resource allocation and performance assessment. This information also helps management to establish a basis for asset realization, determine insurance coverage, assess risk exposure, and meet requirements for external financial reporting.
F-22
Tri-Tech Holding Inc. and Subsidiaries
Notes To Consolidated Financial Statements
June 30, 2011 and 2010
Segment assets of the Company are as follows:
|
Segment Assets
|
Segment 1
|
Segment 2
|
Segment 3
|
Total
|
||||||||||||
|
As of June 30, 2011
|
$ | 68,006,133 | $ | 16,111,116 | $ | 22,621,160 | $ | 106,738,409 | ||||||||
|
As of December 31, 2010
|
$ | 44,168,017 | $ | 14,488,083 | $ | 24,106,603 | $ | 82,762,703 | ||||||||
|
19.
|
Subsequent Events
|
Management has considered all events occurring through the date the financial statements have been issued, and has determined that there are no such events except as disclosed below that are material to the financial statements, or all such material events have been fully disclosed.
In June 2011, the Company entered into an agreement with Beijing Huaxia Yuanjie Water Technology Co., Ltd (“Yuanjie”) to acquire 51% of the total stake in Yuanjie. According to the terms of the agreement, Yuanjie became a subsidiary of TRIT for majority control of the ownership, effective on July 22, 2011. Yuanjie is a high-tech enterprise engaged in water system integration for large high-rise buildings, R&D, manufacturing, installation and sales and operation of water treatment equipment systems directly affecting consumer use. Under the terms of the agreement, Tri-Tech Beijing will invest approximately RMB11,000,000 (approximately $1,700,000) into Yuanjie Water. This includes RMB10,000,000 (approximately $1,500,000) in cash as well as intellectual property worth RMB 1,000,000 (approximately $150,000).
F-23