Attached files
| file | filename |
|---|---|
| 8-K - FORM 8-K - LegacyTexas Financial Group, Inc. | d387724d8k.htm |
Exhibit 99.1

| 1 NASDAQ: VPFG KBW Community Bank Investor Conference July 31, 2012 Kevin Hanigan - President and Chief Executive Officer Patti McKee - Executive Vice President and Chief Financial Officer |
| 2 Safe Harbor Statement When used in filings by the Company with the Securities and Exchange Commission (the "SEC") in the Company's press releases or other public or shareholder communications, and in oral statements made with the approval of an authorized executive officer, the words or phrases "will likely result," "are expected to," "will continue," "is anticipated," "estimate," "project," "intends" or similar expressions are intended to identify "forward-looking statements" within the meaning of the Private Securities Litigation Reform Act of 1995. Such statements are subject to certain risks and uncertainties, including, among other things, changes in economic conditions, legislative changes, changes in policies by regulatory agencies, fluctuations in interest rates, the risks of lending and investing activities, including changes in the level and direction of loan delinquencies and write-offs and changes in estimates of the adequacy of the allowance for loan losses, the Company's ability to access cost-effective funding, fluctuations in real estate values and both residential and commercial real estate market conditions, demand for loans and deposits in the Company's market area, the industry-wide decline in mortgage production, competition, changes in management's business strategies and other factors set forth under Risk Factors in the Company's Form 10-K, that could cause actual results to differ materially from historical earnings and those presently anticipated or projected. The Company wishes to advise readers that the factors listed above could materially affect the Company's financial performance and could cause the Company's actual results for future periods to differ materially from any opinions or statements expressed with respect to future periods in any current statements. The Company does not undertake - and specifically declines any obligation - to publicly release the result of any revisions which may be made to any forward-looking statements to reflect events or circumstances after the date of such statements or to reflect the occurrence of anticipated or unanticipated events. |
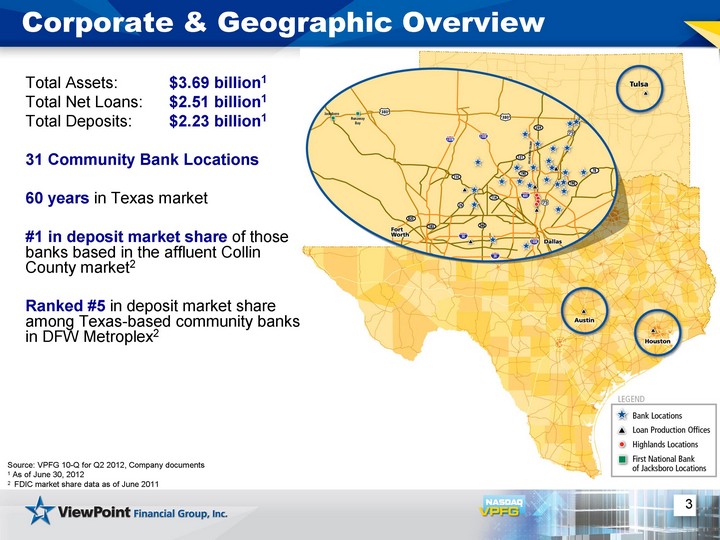
| 3 Corporate & Geographic Overview Total Assets: $3.69 billion1 Total Net Loans: $2.51 billion1 Total Deposits: $2.23 billion1 31 Community Bank Locations 60 years in Texas market #1 in deposit market share of those banks based in the affluent Collin County market2 Ranked #5 in deposit market share among Texas-based community banks in DFW Metroplex2 Source: VPFG 10-Q for Q2 2012, Company documents 1 As of June 30, 2012 2 FDIC market share data as of June 2011 |

| 4 Q2 2012 Highlights Net Income totaled $6.5 million, up 34% vs. Q2 2011 Core EPS totaled $0.24, up 71% vs. Q2 2011 Q/Q EPS down $0.05, core EPS up $0.01 Q/Q Strong Earnings Continued Loan Growth Total loans increased 27% from Q1 to Q2, and 11% on a pro forma basis ( includes Highlands loans in Q1) Loans HFI up 27% vs. Q1 2012, pro forma basis 4% Loans HFS increased $191 million or 26% from Q1 to Q2 Significant Increase in Net Interest Margin NIM of 3.62%, up 79 bps vs. Q2 2011 and up 32 bps vs. Q1 2012 Driven by reduced deposit cost and improvement in earning asset mix Strong Capitalization & Stable Credit Quality Tangible Common Equity ratio of 12.96% Tier 1 Capital ratio of 22.6% Asset quality - NPLs stable at $22.6 million, or 1.41% of loans HFI See Appendix (slides 26 & 27) for reconciliation of core (non-GAAP) to GAAP net income and Appendix (slide 28) for calculation of pro forma loan totals. Source: VPFG 10-Q for Q2 2012; Company Documents |
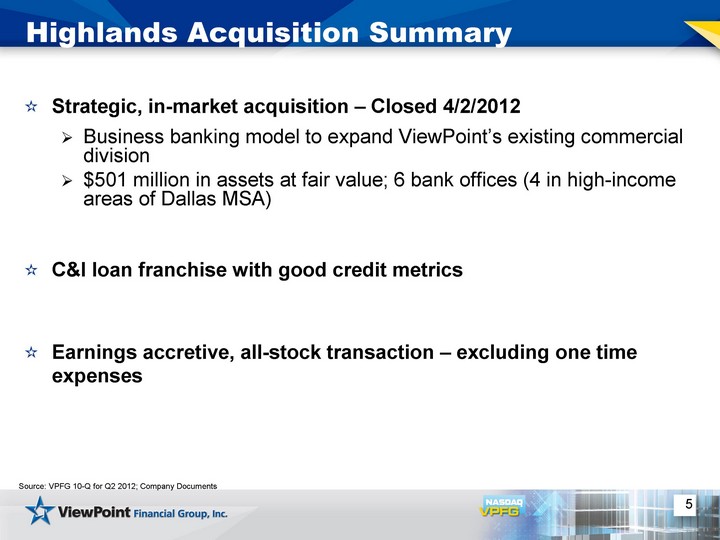
| Highlands Acquisition Summary Strategic, in-market acquisition - Closed 4/2/2012 Business banking model to expand ViewPoint's existing commercial division $501 million in assets at fair value; 6 bank offices (4 in high-income areas of Dallas MSA) C&I loan franchise with good credit metrics Earnings accretive, all-stock transaction - excluding one time expenses Source: VPFG 10-Q for Q2 2012; Company Documents 5 |

| 6 Attractive Demographics: Strengthening Dallas Franchise Source: SNL Financial |
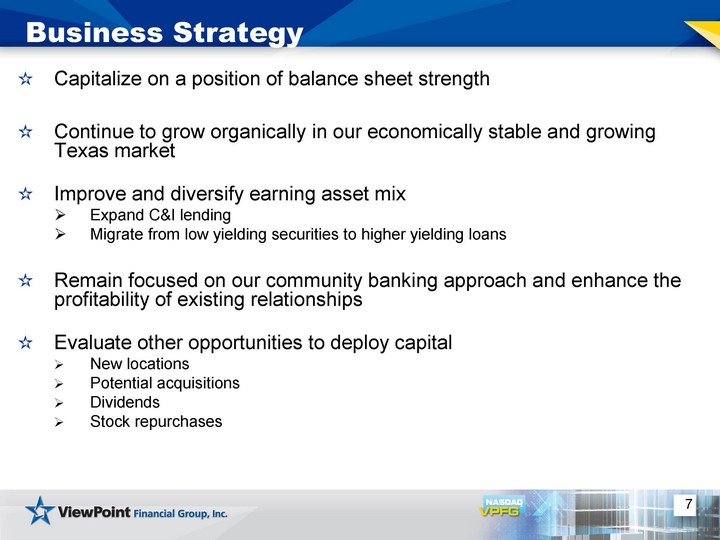
| 7 Capitalize on a position of balance sheet strength Continue to grow organically in our economically stable and growing Texas market Improve and diversify earning asset mix Expand C&I lending Migrate from low yielding securities to higher yielding loans Remain focused on our community banking approach and enhance the profitability of existing relationships Evaluate other opportunities to deploy capital New locations Potential acquisitions Dividends Stock repurchases Business Strategy |

| 8 ViewPoint is Positioned Well in Current Industry Headwinds Source: SNL Financial - Morgan Stanley - Peers are KRX index of 50 regional banks |

| 9 ViewPoint's Earning Asset Mix Source: Company Documents Average Earning Assets and Related Yields June 30, 2011 June 30, 2012 Quarterly yield on earning assets: 4.18% Quarterly yield on earning assets: 4.36% Improve the mix of earning assets by continuing to build on the success of our three primary loan programs, further develop our C&I program, and reduce the mix of securities. |

| 10 The Highlands acquisition accelerated ViewPoint's transition to a commercial banking model Commercial banking CEO Team of commercial lenders Shift loan portfolio away from real estate centric lending Emphasis on C&I lending with a goal to transition to balanced loan book Continued emphasis on low-cost, core deposits Commercial Bank Transformation |
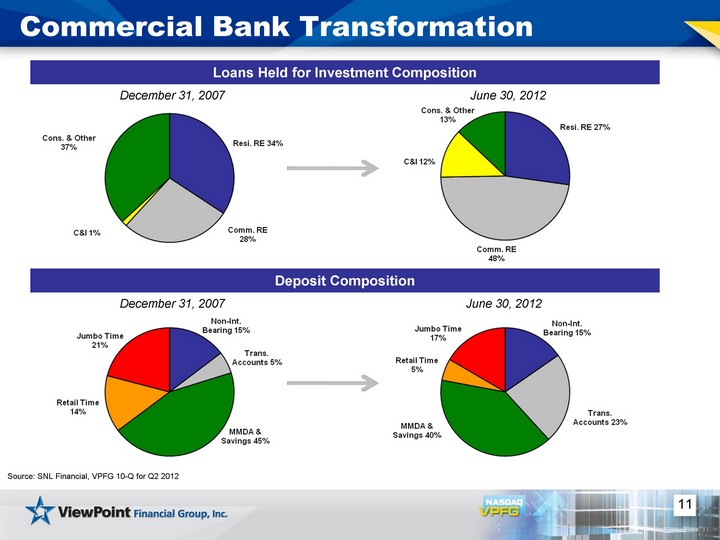
| 11 Commercial Bank Transformation Loans Held for Investment Composition Source: SNL Financial, VPFG 10-Q for Q2 2012 December 31, 2007 Deposit Composition June 30, 2012 June 30, 2012 December 31, 2007 |

| 12 Continued Strong Organic Loan Growth Increase in loans held for investment Q2 vs. Q1 $61 million increase in Q2 2012, or 4% Strong CRE growth of $43 million, or 6%, in Q2 2012 Strong organic C&I growth of $27 million, or 16%, in Q2 2012 Gross Loans Held For Investment on Pro Forma Basis ($ in millions) Source: VPFG 10-Q for Q2 2012; Company Documents (a) Highlands outstanding loans at March 31, 2012. See appendix (slide 28) for pro forma loan information. |

| 13 Strong Loan Growth C&I Lending Growth ($ in millions) Source: VPFG 10-Q for Q2 2012; Company Documents (a) Highlands outstanding loans at March 31, 2012. See appendix for pro forma loan information. CRE Lending Growth ($ in millions) |
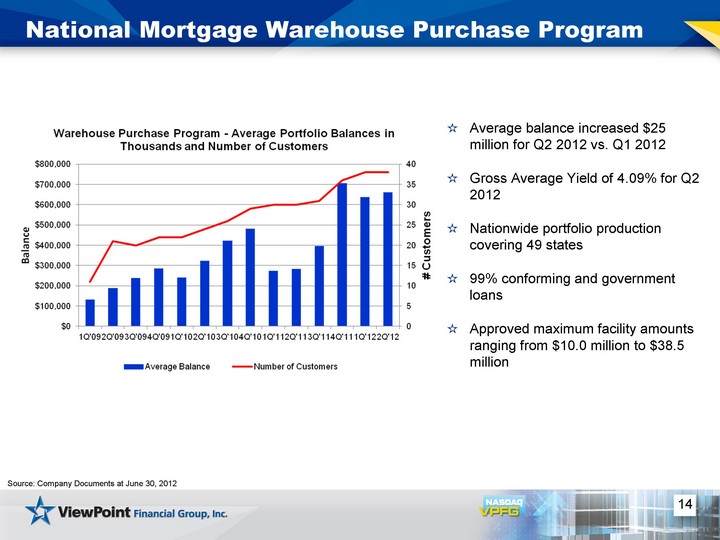
| 14 National Mortgage Warehouse Purchase Program Source: Company Documents at June 30, 2012 Average balance increased $25 million for Q2 2012 vs. Q1 2012 Gross Average Yield of 4.09% for Q2 2012 Nationwide portfolio production covering 49 states 99% conforming and government loans Approved maximum facility amounts ranging from $10.0 million to $38.5 million |

| 15 Core Earnings Per Share Growth CAGR: 38% See Appendix (slides 26 & 27) for reconciliation of core (non-GAAP) to GAAP net income Source: VPFG 10-Q for Q2 2012; Company Documents Share and per share information for periods prior to July 6, 2010, have been revised to reflect the 1.4:1 conversion ratio on publicly traded shares Annual Quarterly Core Net Income ($ in millions): $5.3 $5.7 $9.7 $17.9 $22.2 $4.4 $7.2 $4.6 $8.9 |

| 16 Profitability Net Interest Margin Source: VPFG 10-Q for Q2 2012, Company Documents 1 Core income excludes gains/losses on sale of securities and nonrecurring items See Appendix (slides 26 & 27) for reconciliation of core (non-GAAP) to GAAP net income Core ROAA1 Core ROAE1 |
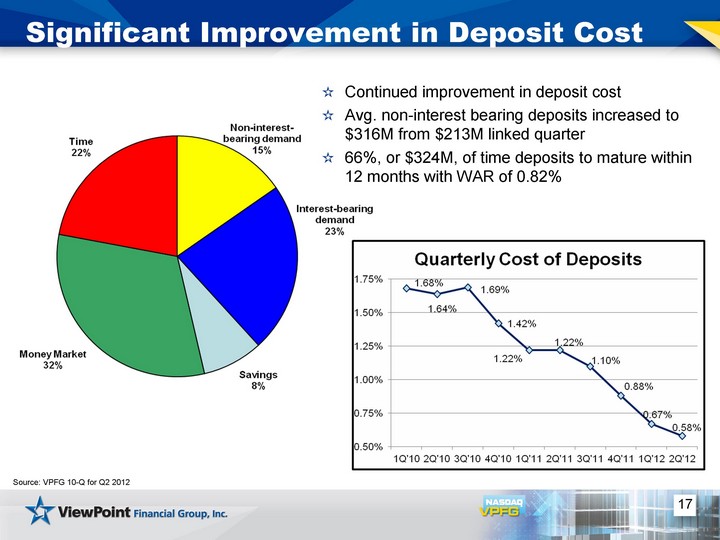
| 17 Significant Improvement in Deposit Cost Source: VPFG 10-Q for Q2 2012 Continued improvement in deposit cost Avg. non-interest bearing deposits increased to $316M from $213M linked quarter 66%, or $324M, of time deposits to mature within 12 months with WAR of 0.82% |
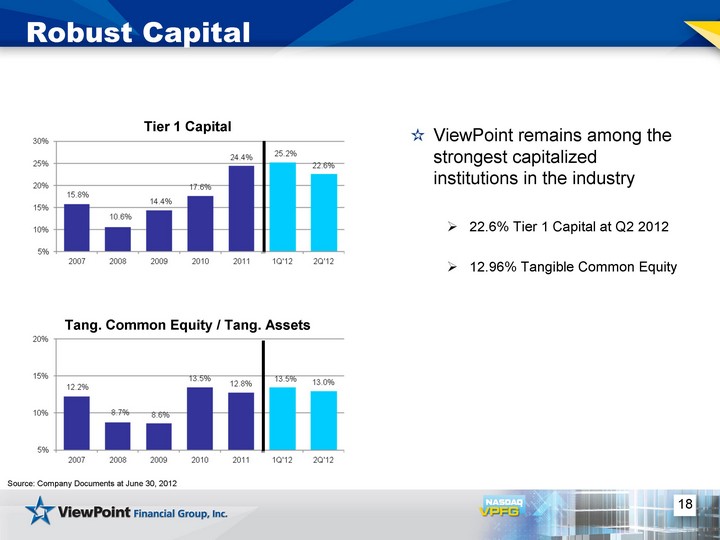
| 18 Robust Capital Tier 1 Capital Tang. Common Equity / Tang. Assets ViewPoint remains among the strongest capitalized institutions in the industry 22.6% Tier 1 Capital at Q2 2012 12.96% Tangible Common Equity Source: Company Documents at June 30, 2012 |

| 19 Strong Credit Quality Total Non-Performing Loans ($ in millions) Total NPLs as a % of Total Loans (1) Allowance / Total Loans (1) Net Charge-offs / Avg. Loans Source: Company Documents Total loans does not include loans held for sale Total loans for 2Q'12 includes loans acquired from Highlands (2) (2) (2) |
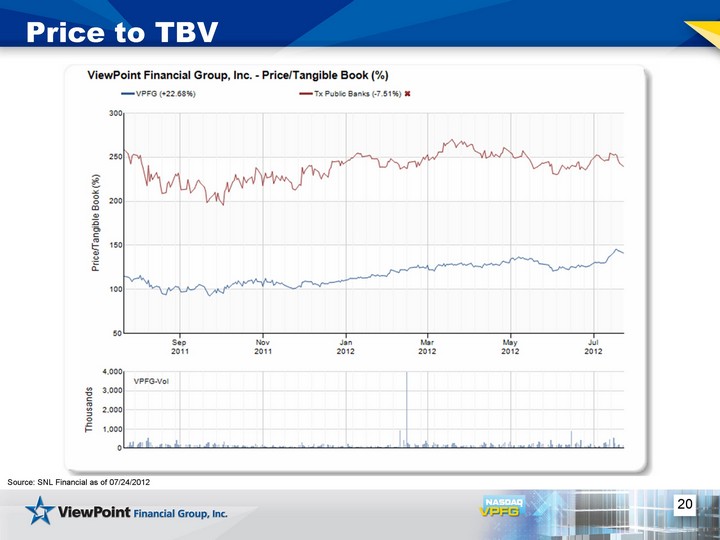
| 20 Price to TBV Source: SNL Financial as of 07/24/2012 |
| 21 Investment Highlights Positive earnings growth trends One of the largest independent community banking franchises in the highly attractive Texas market Strong credit metrics and positive asset quality compared to peers reflecting disciplined underwriting standards Well-capitalized and able to deploy capital Price to TBV favorable compared to Texas peers |

| 22 Questions? |

| 23 Appendix |

| 24 Appendix The subsequent tables present non-GAAP reconciliations of the following calculations: TCE (Tangible Common Equity) to TCA (Tangible Common Assets) ratio TCE per share Price to TBV Core (non-GAAP) net income and earnings per share Pro forma loan totals as of March 31, 2012 |
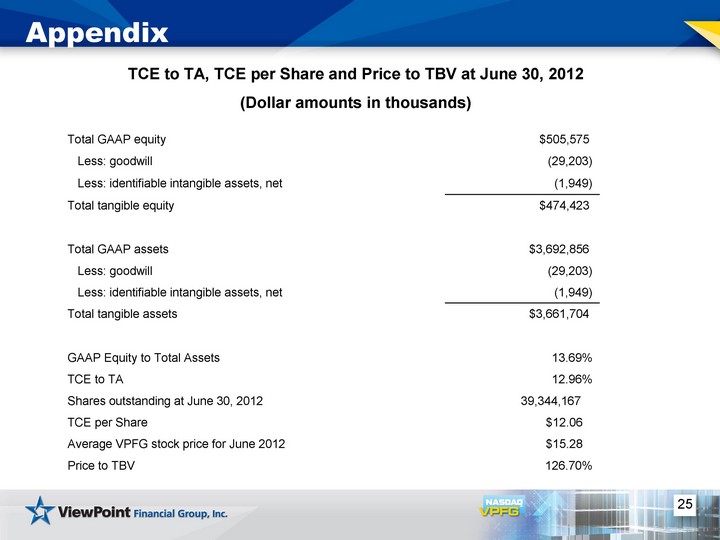
| 25 Appendix TCE to TA, TCE per Share and Price to TBV at June 30, 2012 (Dollar amounts in thousands) Total GAAP equity $505,575 Less: goodwill (29,203) Less: identifiable intangible assets, net (1,949) Total tangible equity $474,423 Total GAAP assets $3,692,856 Less: goodwill (29,203) Less: identifiable intangible assets, net (1,949) Total tangible assets $3,661,704 GAAP Equity to Total Assets 13.69% TCE to TA 12.96% Shares outstanding at June 30, 2012 39,344,167 TCE per Share $12.06 Average VPFG stock price for June 2012 $15.28 Price to TBV 126.70% |

| 26 Appendix Reconciliation of Core (non-GAAP) to GAAP Net Income and EPS (Dollar amounts in thousands except share and per share data) |
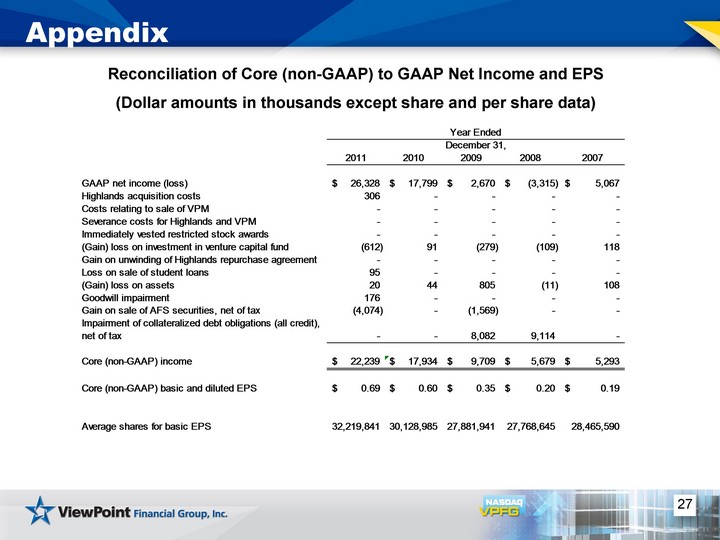
| 27 Appendix Reconciliation of Core (non-GAAP) to GAAP Net Income and EPS (Dollar amounts in thousands except share and per share data) |
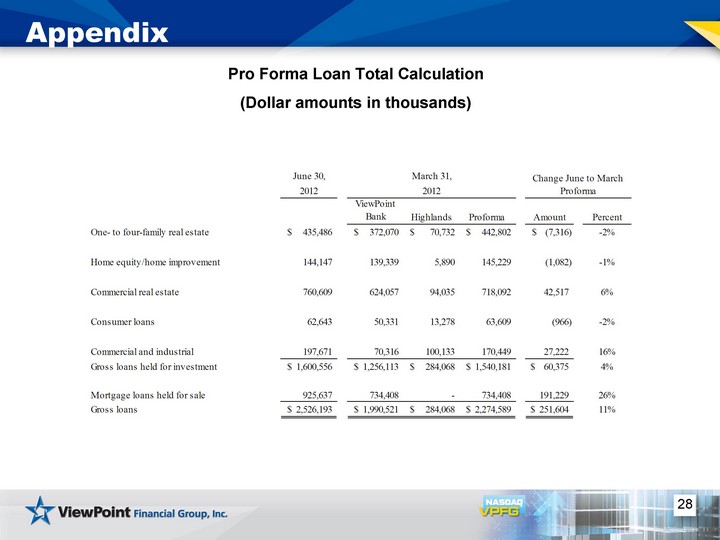
| 28 Appendix Pro Forma Loan Total Calculation (Dollar amounts in thousands) |

| 29 Seattle -24.7% San Francisco -40.3% Los Angeles -40.6% San Diego -39.2% Phoenix -52.1% Las Vegas -61.1% Denver -9.8% Minneapolis -35.7% Chicago -37.8% Detroit -47.0% Cleveland -21.2% Boston -17.3% New York -26.9% Washington, DC -27.8% Charlotte -12.1% Atlanta -36.9% Tampa -46.4% Miami -49.2% Portland -25.9% Dallas -6.5% Appendix: Dallas Metroplex: Stable Home Prices Home Price Index Percent Change From Peak in June 2006 to April 2012 Source: S&P / Case-Shiller |

| 30 Appendix: Lower Unemployment Rates Unemployment Rates Source: Bureau of Labor Statistics as of May2012 8.0% 6.8% 6.2% |