Attached files
| file | filename |
|---|---|
| 8-K - ARROW ELECTRONICS, INC. 8-K - ARROW ELECTRONICS INC | a50357068.htm |
| EX-99.1 - EXHIBIT 99.1 - ARROW ELECTRONICS INC | a50357068ex99_1.htm |
Exhibit 99.2
Second-Quarter 2012 CFO Commentary
As reflected in our earnings release, there are a number of items that impact the comparability of our results with those in the trailing quarter and the second quarter of last year. Any discussion of our results will exclude these items to give you a better sense of our operating results. As always, the operating information we provide to you should be used as a complement to GAAP numbers. For a complete reconciliation between our GAAP and Non-GAAP results, please refer to our earnings release or the earnings reconciliation found at the end of this document.
The following second quarter and pro forma information included in this CFO commentary is unaudited and should be read in conjunction with the Form 10-Q for the quarterly periods ended June 30, 2012 and March 31, 2012, as well as the company's consolidated financial statements and related notes appearing in the company's 2011 Annual Report on Form 10-K as filed with the Securities and Exchange Commission.
Second-Quarter Summary
We executed well in the second quarter, with revenue and earnings per share in line with our expectations, even as the global macroeconomic climate weakened throughout the quarter. We continue to build our business strategically and make progress toward our corporate targets. We are investing cautiously as the macro environment continues to be challenging. In the second quarter we generated $61 million in cash from operations. Over the last twelve months we have generated more than $575 million in cash flow from operations and converted 108% of our GAAP net income to cash, well in excess of our target. Even in a challenging macro environment returns continue to be accretive to shareholders with return on invested capital well ahead of our weighted average cost of capital.
In our global enterprise computing solutions segment, sales increased 2% year over year and 10% from the first quarter and were in line with our expectations driven by another quarter of strong performance in ECS Europe as our matrix expansion strategy continues to pay dividends. In the Americas we performed very well even as market growth has slowed. On a global basis, we saw solid double-digit year-over-year growth in services, storage, and software, offset by declines in servers. Consistent with our strategy to increase our scale in Europe, we completed the acquisition of The Altimate Group, a value-added distributor of enterprise and midrange computing products, services, and solutions.
In global components, sales decreased 11% year over year and increased 3% sequentially, in line with our expectations. Sales in Asia Pacific came in well ahead of normal seasonality in our core business, driven by strength in China and Taiwan, while sales in the Americas and Europe were in line with normal seasonality. Book to bill is at parity on a global basis, with the Americas and our core Asia business above one. We remain focused on our strategic priorities of increasing our technical resources, creating new value through expansion of services, local execution with global capabilities, and leveraging our differentiated go-to-market model.
1
Consolidated Overview – Second Quarter
|
P&L Highlights*
|
Q2 2012
|
Y/Y
Change
|
Y/Y Change
Pro Forma
|
Q/Q
Change
|
|
Sales
|
$5,151
|
-7%
|
-8%
|
+5%
|
|
Gross Profit Margin
|
13.3%
|
-60bps
|
-80bps
|
-60bps
|
|
Operating Expense/Sales
|
9.4%
|
+10bps
|
-10bps
|
-50bps
|
|
Operating Income
|
$202.0
|
-20%
|
-22%
|
+3%
|
|
Operating Margin
|
3.9%
|
-70bps
|
-60bps
|
-10bps
|
|
Net Income
|
$124.1
|
-22%
|
-24%
|
+4%
|
|
Diluted EPS
|
$1.11
|
-18%
|
-20%
|
+6%
|
* $ in millions, except per share data, may reflect rounding
|
●
|
Second quarter sales of $5.2 billion were in line with our expectations
|
|
o
|
Decreased 7% year over year and increased 5% on a sequential basis
|
|
§
|
Pro forma for acquisitions and excluding FX, sales were down 5% year over year and increased 6% sequentially
|
|
●
|
Consolidated gross profit margin was 13.3%
|
|
o
|
Decreased 60 basis year over year and sequentially primarily due to pricing pressure as well as a change in mix of products and customers
|
|
o
|
Pro forma for acquisitions and excluding FX, gross profit margin was down 80 basis points year over year
|
|
●
|
Operating expenses as a percentage of sales were 9.4%
|
|
o
|
Increased 10 basis points year over year and declined 50 basis points sequentially
|
|
§
|
On an absolute dollar basis, operating expenses declined 6% year over year
|
|
§
|
Pro forma for acquisitions, operating expenses declined 9% year over year and were down 10 basis points as a percentage of sales.
|
|
●
|
Operating income was $202.0 million
|
|
o
|
Decreased 20% year over year and increased 3% sequentially
|
|
o
|
Pro forma for acquisitions, operating income was down 22% year over year
|
|
●
|
Operating income as a percentage of sales was 3.9%
|
|
o
|
Decreased 70 basis points year over year and 10 basis points sequentially
|
|
o
|
Pro forma for acquisitions, operating income as a percentage of sales decreased 60 basis points year over year
|
|
●
|
Effective tax rate for the quarter was 29.0%
|
|
●
|
Net income was $124.1 million
|
|
o
|
Decreased 22% compared with last year and was up 4% sequentially
|
|
o
|
Pro forma for acquisitions, net income was down 24% year over year
|
|
●
|
Earnings per share were $1.12 and $1.11 on a basic and diluted, respectively
|
|
o
|
Diluted EPS decreased 18% year over year and increased 6% sequentially
|
|
o
|
Pro forma for acquisitions, EPS decreased 20% year over year
|
2
Global Components
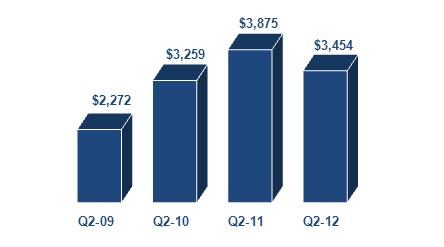
$2,272 $3,259 $3,875 $3,454 Q2-09 Q2-10 Q2-11 Q2-12
Sales ($ in millions)
|
●
|
Sales decreased 11% year over year and increased 3% sequentially
|
|
o
|
Pro forma and excluding the impact of foreign exchange, sales declined 9% year over year and increased 4% sequentially
|
|
●
|
Gross margin declined 50 basis points year over year primarily due to weakness in Europe resulting from macro-related market softness
|
|
o
|
Sequentially, gross margin decreased 50 basis points
|
|
●
|
Book to bill at parity
|
|
o
|
In line with normal seasonal trends
|
|
●
|
We continue to see solid design activity in all regions
|
|
o
|
Approved registrations increased 11% year over year
|
|
●
|
Leading indicators, including lead times and cancellation rates, are in line with historical levels
|
|
●
|
Operating profit declined 24% year over year
|
|
o
|
Operating margin decreased 80 basis points year over year to 4.9%
|
|
●
|
Return on working capital declined 430 basis points year over year
|
3
Americas Components Region
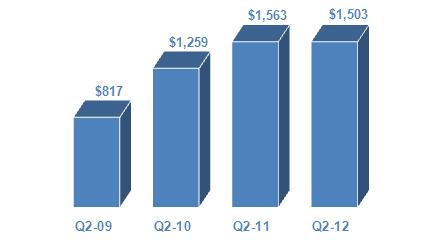
$817 $1,259 $1,563 $1,503 Q2-09 Q2-10 Q2-11 Q2-12
Sales ($ in millions)
|
●
|
Sales decreased 4% year over year and increased 3% sequentially
|
|
o
|
Pro forma for acquisitions, sales decreased 5% year over year and increased 2% on a sequential basis
|
|
o
|
Sales in line with normal seasonality on a sequential basis
|
|
●
|
The lighting vertical continues to grow faster than the market, increasing 25% year over year and 9% sequentially
|
|
o
|
Alternative energy and aerospace and defense increased 10% and 5%, respectively, sequentially
|
|
●
|
PEMCO sales increased 1% year over year, driven by growth in connectors
|
|
●
|
Operating income decreased 13% year over year
|
|
o
|
Operating margin declined 70 basis points year over year
|
|
o
|
We continue to generate operating margins above the targeted level in what was a more difficult environment compared to a year ago.
|
|
●
|
Looking ahead to the third quarter, we expect sales in our legacy Americas components business to be in line with normal seasonality
|
4
Europe Components Region
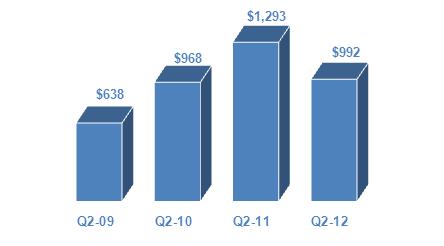
$638 $968 $1,293 $992 Q2-09 Q2-10 Q2-11 Q2-12
Sales ($ in millions)
|
●
|
Sales declined 23% year over year and 6% sequentially
|
|
o
|
Pro forma for acquisitions and excluding FX, sales decreased 15% year over year and 4% sequentially
|
|
o
|
Sales in our core business were in line with normal seasonality despite ongoing market softness in all regions
|
|
●
|
Vertical market growth continues to outperform the broader market
|
|
o
|
Automotive and medical increased 6% and 2% year over year, respectively
|
|
●
|
Operating income declined 48% year over year
|
|
o
|
Operating margin declined 190 basis points year over year
|
|
●
|
Looking ahead to the third quarter, we expect sales in our legacy European components business to be in line with normal seasonality
|
5
Asia Pacific Components Region
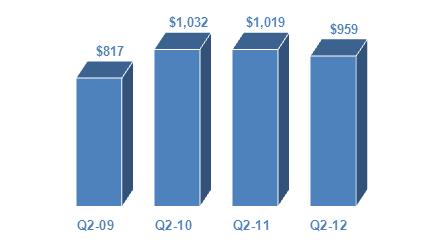
$817 $1,032 $1,019 $959 Q2-09 Q2-10 Q2-11 Q2-12
Sales ($ in millions)
|
●
|
Sales declined 6% year over year and increased 16% sequentially
|
|
o
|
Pro forma for acquisitions, sales decreased 9% year over year
|
|
o
|
Sales in our core Asia business were significantly ahead of normal seasonality driven by a rebound in sales in China and Taiwan
|
|
o
|
Core Asia sales declined 2% year over year
|
|
●
|
Lighting growth continue to be strong, increasing 18% sequentially
|
|
●
|
Operating profit declined 21% year over year
|
|
o
|
Operating margin declined 50 basis points year over year
|
|
●
|
Looking ahead to the third quarter, we expect sales in our legacy Asia Pacific components business to be in line with normal seasonality
|
6
Global Enterprise Computing Solutions
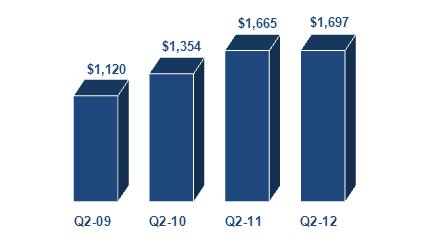
$1,120 $1,354 $1,665 $1,697 Q2-09 Q2-10 Q2-11 Q2-12
Sales ($ in millions)
|
●
|
Sales increased 2% year over year and 10% sequentially
|
|
o
|
Record second quarter revenue
|
|
o
|
Pro forma for acquisitions and excluding FX, sales increased 4% year over year and 9% sequentially
|
|
●
|
Strong double-digit year-over-year growth in services (+18%), storage (+16%), and software (+13%)
|
|
o
|
Within software networking, infrastructure, and virtualization continue to post very strong year over year growth
|
|
●
|
Gross margin decreased 40 basis points year over year driven primarily by product mix
|
|
o
|
Pro forma for acquisitions, gross profit decreased 60 basis points year over year
|
|
o
|
Gross margin was down 50 basis points on a sequential basis
|
|
●
|
Operating income increased 4% year over year
|
|
o
|
Operating income grew 2x faster than sales year over year
|
|
o
|
Operating margin increased 10 basis points year over year to 3.9%
|
|
●
|
Return on working capital continues to excel
|
7
ECS America
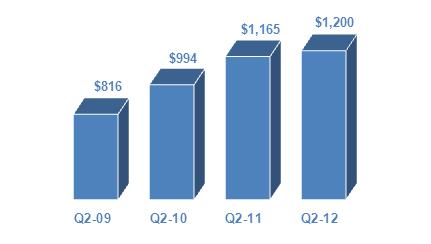
$816 $994 $1,165 $1,200 Q2-09 Q2-10 Q2-11 Q2-12
Sales ($ in millions)
|
●
|
Sales increased 3% year over year and 13% sequentially
|
|
o
|
Pro forma for acquisitions, sales increased 1% year over year and 10% sequentially
|
|
o
|
Performed well in a weakening market
|
|
●
|
Robust double-digit year-over-year growth in services (+22%), storage (+19%), and software (+15%)
|
|
o
|
Within software, networking grew 85% and infrastructure grew 20% year over year
|
|
●
|
Gross profit decreased 40 basis points year over year and 80 basis points sequentially driven primarily by changes in product mix
|
|
●
|
Operating income grew 2% year over year
|
|
o
|
Operating margin was flat year over year and remains within our long-term target range
|
|
●
|
Looking ahead to the third quarter, we expect sales in our legacy Americas value-added computing solutions business to be in line with normal seasonality
|
8
ECS Europe
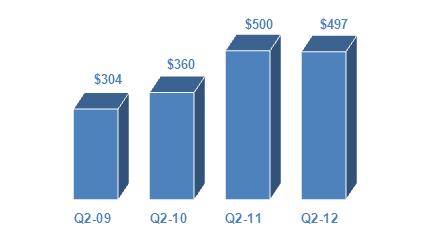
$304 $360 $500 $497 Q2-09 Q2-10 Q2-11 Q2-12
Sales ($ in millions)
|
●
|
Sales declined 1% year over year and increased 5% sequentially
|
|
o
|
Pro forma for acquisitions and excluding FX, sales increased 11% year over year and 8% sequentially
|
|
●
|
Sales growth was slightly above normal seasonality on a sequential basis, driven primarily by strength in proprietary servers and software
|
|
o
|
Double-digit year-over-year growth in all regions except Southern Europe
|
|
o
|
Strong year-over-year growth in software with virtualization and infrastructure up 18% and 17%, respectively
|
|
●
|
Gross profit declined 40 basis points year over year due primarily to product and country mix
|
|
o
|
Pro forma for acquisitions, gross profit declined 40 basis points year over year
|
|
o
|
Increased 10 basis points sequentially
|
|
●
|
Operating profit increased 6% year over year
|
|
o
|
Operating income grew substantially faster than sales year over year
|
|
o
|
Operating margin increased 10 basis points year over year
|
|
●
|
Looking ahead to the third quarter, we expect sales in our legacy European value-added computing solutions business to be in line with normal seasonality
|
9
Cash Flow and Balance Sheet Highlights
|
●
|
Cash Flow from Operations
|
We generated $61 million in cash from operations in the second quarter, with contributions from both business segments. Over the last twelve months we have generated more than $575 million in cash flow from operations and converted 108% of our GAAP net income to cash, well in excess of our target.
|
●
|
Working Capital
|
We continue to effectively manage all levers of our working capital with working capital to sales of $.15. Return on working capital is 26.6%.
|
●
|
Return on Invested Capital
|
Our return on invested capital of 10.5% is well ahead of our weighted average cost of capital.
|
●
|
Share Buyback
|
Through the end of the second quarter, we completed the previous $150 million share repurchase authorization, bringing the total amount returned to shareholders to nearly $700 million over the past five years. In June the board of directors authorized an additional $200 million share repurchase program.
|
●
|
Debt and Liquidity
|
Our balance sheet and capital structure remain strong with conservative debt levels, and a net debt to EBITDA ratio of approximately 1.8x. Our total liquidity is $2.3 billion when including our cash of $325 million. Thus, we have the flexibility to continue to take advantage of opportunities in the marketplace.
|
Third-Quarter 2012 Guidance
|
|
|
Consolidated Sales
|
$4.8 billion to $5.2 billion
|
|
Global Components
|
$3.3 billion to $3.5 billion
|
|
Global ECS
|
$1.5 billion to $1.7 billion
|
|
Diluted Earnings per Share
|
$1.00 to $1.12
|
10
Arrow Electronics Revenue Seasonality*
|
Global
Components
|
NAC
|
EMEA ex FX
|
AAP
|
|
Q1
|
-2% to +4%
|
+13% to +19%
|
-1% to +5%
|
|
Q2
|
-3% to +3%
|
-5% to -11%
|
+4% to +10%
|
|
Q3
|
-2% to +4%
|
-5% to +1%
|
+3% to +9%
|
|
Q4
|
-4% to +2%
|
-3% to -9%
|
-1% to +7%
|
|
Global ECS
|
NA
|
EMEA ex FX
|
|
Q1
|
-28% to -34%
|
-21% to -27%
|
|
Q2
|
+20% to +26%
|
+1% to +7%
|
|
Q3
|
-2% to -8%
|
-12% to -18%
|
|
Q4
|
+28% to +34%
|
+59% to +65%
|
* Revenue seasonality based on historical sequential sales growth for 2007-2011 for our traditional components and ECS businesses excluding acquisitions
11
Risk Factors
The discussion of the company’s business and operations should be read together with the risk factors contained in Item 1A of its 2011 Annual Report on Form 10-K, filed with the Securities and Exchange Commission, which describe various risks and uncertainties to which the company is or may become subject. If any of the described events occur, the company’s business, results of operations, financial condition, liquidity, or access to the capital markets could be materially adversely affected.
Certain Non-GAAP Financial Information
In addition to disclosing results that are determined in accordance with Generally Accepted Accounting Principles ("GAAP"), the company provides certain non-GAAP financial information relating to operating income, net income attributable to shareholders and net income per basic and diluted share, each as adjusted for certain charges, credits and losses that the company believes impact the comparability of its results of operations. These charges, credits and losses arise out of the company's efficiency enhancement initiatives and acquisitions. A reconciliation of the company's non-GAAP financial information to GAAP is set forth in the table below.
The company believes that such non-GAAP financial information is useful to investors to assist in assessing and understanding the company's operating performance and underlying trends in the company's business because management considers the charges, credits and losses referred to above to be outside the company's core operating results. This non-GAAP financial information is among the primary indicators management uses as a basis for evaluating the company's financial and operating performance. In addition, the company's Board of Directors may use this non-GAAP financial information in evaluating management performance and setting management compensation.
The presentation of this additional non-GAAP financial information is not meant to be considered in isolation or as a substitute for, or alternative to, operating income, net income attributable to shareholders and net income per basic and diluted share determined in accordance with GAAP. Analysis of results and outlook on a non-GAAP basis should be used as a complement to, and in conjunction with, data presented in accordance with GAAP.
12
Earnings Reconciliation
($ in thousands, except per share data)
| Q2 2012 | Q1 2012 | Q2 2011 | ||||||||||
|
Operating income, as Reported
|
$ | 188,689 | $ | 187,449 | $ | 248,330 | ||||||
|
Restructuring, integration, and other charges
|
13,347 | 8,243 | 5,221 | |||||||||
|
Operating income, as Adjusted
|
$ | 202,036 | $ | 195,692 | $ | 253,551 | ||||||
|
Net income attributable to shareholders, as Reported
|
$ | 114,383 | $ | 113,628 | $ | 156,197 | ||||||
|
Restructuring, integration, and other charges
|
9,702 | 6,141 | 3,584 | |||||||||
|
Net income attributable to shareholders, as Adjusted
|
$ | 124,085 | $ | 119,769 | $ | 159,781 | ||||||
|
Diluted EPS, as Reported
|
$ | 1.02 | $ | 1.00 | $ | 1.33 | ||||||
|
Restructuring, integration, and other charges
|
0.09 | 0.05 | 0.03 | |||||||||
|
Diluted EPS, as Adjusted
|
$ | 1.11 | $ | 1.05 | $ | 1.36 | ||||||
|
The sum of the components for diluted EPS, as Adjusted, may not agree to totals, as presented, due to rounding.
|
||||||||||||
Earnings Reconciliation
References to restructuring and other charges refer to the following incremental charges taken in the periods indicated:
Q2-12 Restructuring, Integration, and Other Charges: During the second quarter of 2012, the company recorded restructuring, integration, and other charges of $13.3 million ($9.7 million net of related taxes or $.09 per share on both a basic and diluted basis).
Q1-12 Restructuring, Integration, and Other Charges: During the first quarter of 2012, the company recorded restructuring, integration, and other charges of $8.2 million ($6.1 million net of related taxes or $.05 per share on both a basic and diluted basis).
Q2-11 Restructuring, Integration, and Other Charges: During the second quarter of 2011, the company recorded restructuring, integration, and other charges of $5.2 million ($3.6 million net of related taxes or $.03 per share on both a basic and diluted basis).
13