Attached files
| file | filename |
|---|---|
| 8-K - FORM 8-K - LegacyTexas Financial Group, Inc. | d385607d8k.htm |
| EX-99.1 - EXHIBIT 99.1 - LegacyTexas Financial Group, Inc. | d385607dex991.htm |
Exhibit 99.2

| 1 NASDAQ: VPFG Second Quarter 2012 Earnings Kevin Hanigan - President and Chief Executive Officer Patti McKee - Executive Vice President and Chief Financial Officer Mark Hord - Executive Vice President and General Counsel |

| 2 Safe Harbor Statement Certain matters discussed on this call may contain forward^looking statements, which are subject to risks and uncertainties. A number of factors, many of which are beyond ViewPoint Financial Group, Inc.'s control, could cause actual results to differ materially from future results expressed or implied by such forward^looking statements. These risks and uncertainties include the risk of adverse impacts from general economic conditions, competition, interest rate sensitivity and exposure to regulatory and legislative changes. These and other factors that could cause results to differ materially from those described in the forward^looking statements can be found in our annual report on Form 10^K for the year ended December 31, 2011, and in other filings made by ViewPoint Financial Group, Inc. with the Securities and Exchange Commission. |

| 3 Q2 2012 Highlights Net Income totaled $6.5 million, up 34% vs. Q2 2011 Core EPS totaled $0.24, up 71% vs. Q2 2011 Q/Q EPS down $0.05, core EPS up $0.01 Q/Q Strong Earnings Continued Loan Growth Total loans increased 27% from Q1 to Q2, and 11% on a pro forma basis ( includes Highlands loans in Q1) Loans HFI up 27% vs. Q1 2012, pro forma basis 4% Loans HFS increased $191 million or 26% from Q1 to Q2 Significant Increase in Net Interest Margin NIM of 3.62%, up 79 bps vs. Q2 2011 and up 32 bps vs. Q1 2012 Driven by reduced deposit cost and improvement in earning asset mix Strong Capitalization & Stable Credit Quality Tangible Common Equity ratio of 12.96% Tier 1 Capital ratio of 22.6% Asset quality - NPLs stable at $22.6 million, or 1.41% of loans HFI See Appendix (slides 17 & 18) for reconciliation of core (non-GAAP) to GAAP net income and Appendix (slide 19) for calculation of pro forma loan totals. Source: VPFG 10-Q for Q2 2012; Company Documents |

| 4 Core Earnings Per Share Growth CAGR: 38% See Appendix (slides 17 & 18) for reconciliation of core (non-GAAP) to GAAP net income Source: VPFG 10-Q for Q2 2012; Company Documents Share and per share information for periods prior to July 6, 2010, have been revised to reflect the 1.4:1 conversion ratio on publicly traded shares Annual Quarterly Core Net Income ($ in millions): $5.3 $5.7 $9.7 $17.9 $22.2 $4.4 $7.2 $4.6 $8.9 |

| 5 Continued Strong Organic Loan Growth Increase in loans held for investment Q2 vs. Q1 $61 million increase in Q2 2012, or 4% Strong CRE growth of $43 million, or 6%, in Q2 2012 Strong organic C&I growth of $27 million, or 16%, in Q2 2012 Gross Loans Held For Investment on Pro Forma Basis ($ in millions) Source: VPFG 10-Q for Q2 2012; Company Documents (a) Highlands outstanding loans at March 31, 2012. See appendix (slide 19) for pro forma loan information. |

| 6 Strong Loan Growth C&I Lending Growth ($ in millions) Source: VPFG 10-Q for Q2 2012; Company Documents (a) Highlands outstanding loans at March 31, 2012. See appendix for pro forma loan information. CRE Lending Growth ($ in millions) |

| 7 National Mortgage Warehouse Purchase Program Source: Company Documents at June 30, 2012 Average balance increased $25 million for Q2 2012 vs. Q1 2012 Gross Average Yield of 4.09% for Q2 2012 Nationwide portfolio production covering 49 states 99% conforming and government loans Approved maximum facility amounts ranging from $10.0 million to $38.5 million |
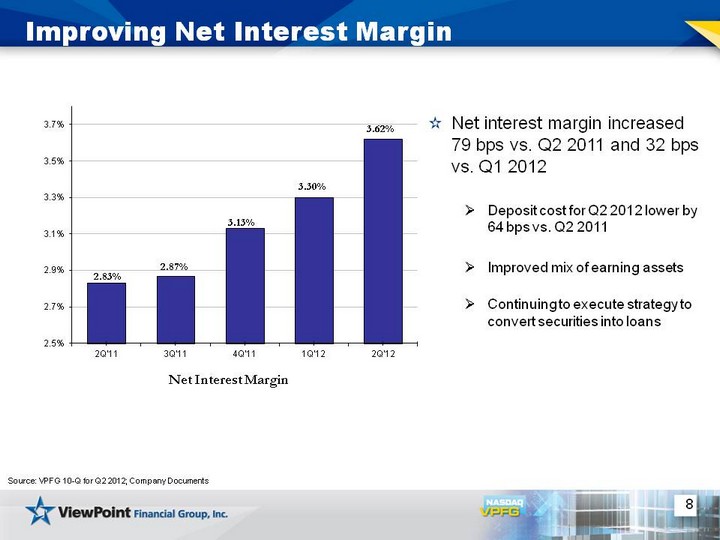
| 8 Improving Net Interest Margin Net interest margin increased 79 bps vs. Q2 2011 and 32 bps vs. Q1 2012 Deposit cost for Q2 2012 lower by 64 bps vs. Q2 2011 Improved mix of earning assets Continuing to execute strategy to convert securities into loans Source: VPFG 10-Q for Q2 2012; Company Documents |

| 9 Improved Earning Asset Mix Source: Company Documents Average Earning Assets and Related Yields June 30, 2011 June 30, 2012 Quarterly yield on earning assets: 4.18% Quarterly yield on earning assets: 4.36% |

| 10 Significant Improvement in Deposit Cost Source: VPFG 10-Q for Q2 2012 Continued improvement in deposit cost Avg. non-interest bearing deposits increased to $316M from $213M linked quarter 66%, or $324M, of time deposits to mature within 12 months with WAR of 0.82% |

| 11 Robust Capital Tier 1 Capital Tang. Common Equity / Tang. Assets ViewPoint remains among the strongest capitalized institutions in the industry 22.6% Tier 1 Capital at Q2 2012 12.96% Tangible Common Equity Source: Company Documents at June 30, 2012 |

| 12 Strong Credit Quality Total Non-Performing Loans ($ in millions) Total NPLs as a % of Total Loans (1) Allowance / Total Loans (1) Net Charge-offs / Avg. Loans Source: Company Documents Total loans does not include loans held for sale Total loans for 2Q'12 includes loans acquired from Highlands (2) (2) (2) |

| 13 Current Initiatives Completed Highlands acquisition Systems integration completed July 23 Cost savings in line with expectations Continued improvement in funding mix Grow C&I lending business Continuing evaluation of capital deployment |

| 14 Questions? |

| 15 Appendix The subsequent tables present non-GAAP reconciliations of the following calculations: TCE (Tangible Common Equity) to TCA (Tangible Common Assets) ratio TCE per share Price to TBV Core (non-GAAP) net income and earnings per share Pro forma loan totals as of March 31, 2012 |

| 16 Appendix TCE to TA, TCE per Share and Price to TBV at June 30, 2012 (Dollar amounts in thousands) Total GAAP equity $505,575 Less: goodwill (29,203) Less: identifiable intangible assets, net (1,949) Total tangible equity $474,423 Total GAAP assets $3,692,856 Less: goodwill (29,203) Less: identifiable intangible assets, net (1,949) Total tangible assets $3,661,704 GAAP Equity to Total Assets 13.69% TCE to TA 12.96% Shares outstanding at June 30, 2012 39,344,167 TCE per Share $12.06 Average VPFG stock price for June 2012 $15.28 Price to TBV 126.70% |

| 17 Appendix Reconciliation of Core (non-GAAP) to GAAP Net Income and EPS (Dollar amounts in thousands except share and per share data) |

| 18 Appendix Reconciliation of Core (non-GAAP) to GAAP Net Income and EPS (Dollar amounts in thousands except share and per share data) |

| 19 Appendix Pro Forma Loan Total Calculation (Dollar amounts in thousands) |