Attached files
| file | filename |
|---|---|
| 8-K - 8-K - ASSOCIATED BANC-CORP | d382367d8k.htm |
| EX-99.1 - EX-99.1 - ASSOCIATED BANC-CORP | d382367dex991.htm |
 Associated Banc-Corp
2Q 2012 Earnings Presentation
July 19, 2012
Exhibit 99.2 |
 Forward-Looking Statements
Important note regarding forward-looking statements: 1
Statements made in this presentation which are not purely historical are
forward-looking statements, as defined in the Private Securities
Litigation Reform Act of 1995. This
includes any statements regarding management’s plans, objectives, or goals
for future operations,
products
or
services,
and
forecasts
of
its
revenues,
earnings,
or
other
measures of performance.
Such forward-looking statements may be identified by the
use of words such as “believe”,
“expect”, “anticipate”, “plan”, “estimate”, “should”, “will”, “intend”,
“outlook”, or similar expressions.
Forward-looking statements are based on current
management expectations and, by their nature, are subject to risks and
uncertainties. Actual
results
may
differ
materially
from
those
contained
in
the
forward-looking
statements.
Factors which may cause actual results to differ materially from
those contained in such forward-looking
statements include those identified in the company’s most
recent
Form
10-K
and
subsequent
SEC
filings.
Such
factors
are
incorporated
herein
by reference. |
 Second Quarter 2012 Highlights
•
Net income available to common shareholders of $42 million or $0.24 per
share –
Quarterly net income to common shareholders is at the highest level since early
2008 •
Return on Tier 1 common equity of 9.26%, compared to 6.07% a year ago
2
Improving Results & Trends
Net Income
&
ROT1CE
Loan Growth
Net Interest Income
&
Net Interest Margin
•
Total loans of $14.7 billion were up $445 million, or 3% from the end of the first
quarter –
Commercial real estate lending loans increased by $193 million
–
General commercial loans increased by $139 million
•
Net interest income of $154 million
–
Net interest margin of 3.30%; down 1 bps compared to first quarter NIM of
3.31% Capital
•
Repurchased $30 million of common stock during the quarter
•
Redeemed $25 million of outstanding 7.625% Trust preferred securities in the
quarter •
Capital ratios remain very strong with a Tier 1 common equity ratio of
12.04% |
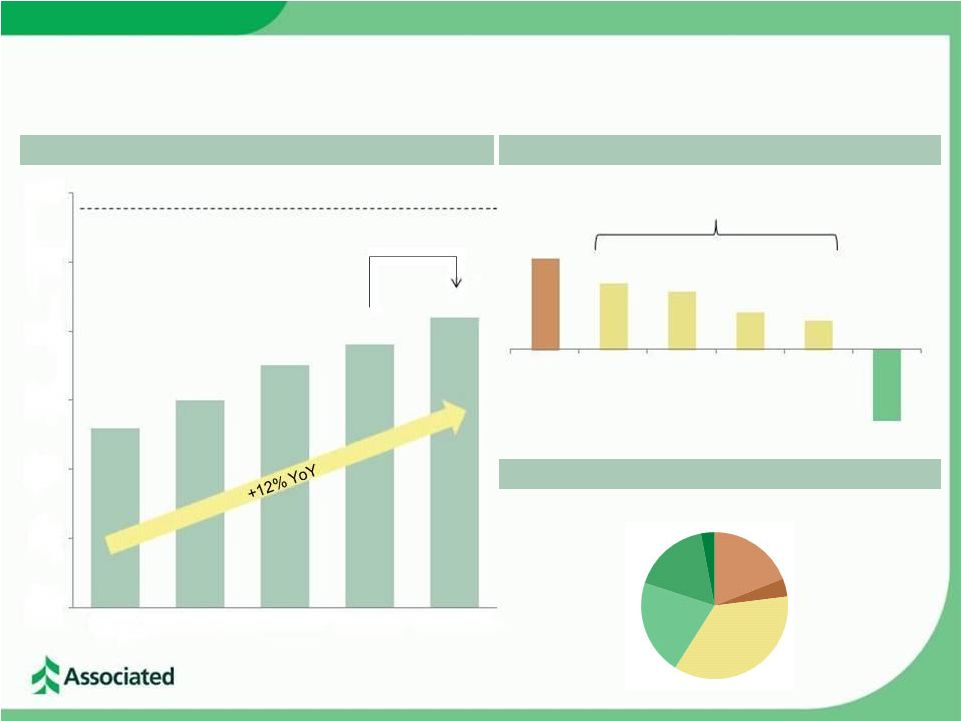 Loan
Portfolio Growth and Composition 3
Total Loans of $14.7 billion at June 30, 2012
2Q 2012 Net Loan Growth of $445 million
Total Loans ($ in billions)
($ balances in millions)
CBL: Commercial and business lending
CRE: Commercial real estate lending
CL: General commercial loans
MW: Mortgage Warehouse
OG: Oil & Gas
PU: Power & Utilities
RRM: Retail and residential mortgage
$193
$139
$122
$79
$61
RRM
($149)
CRE
CL
MW
OG
PU
$16.5
$15.5
$14.5
$13.5
$12.5
$11.5
$10.5
2Q 2011
3Q 2011
4Q 2011
1Q 2012
2Q 2012
$13.1
$13.5
$14.0
$14.3
$14.7
3% QoQ
Peak Loans (4Q 2008) $16.3 billion
CBL: +$401
Loan Mix
2Q 2012
+
–
+
CRE Investor
19%
Consumer
3%
Home Equity
17%
Res Mtg
21%
Construction
4%
Commercial
& Business
Lending
36% |
 4
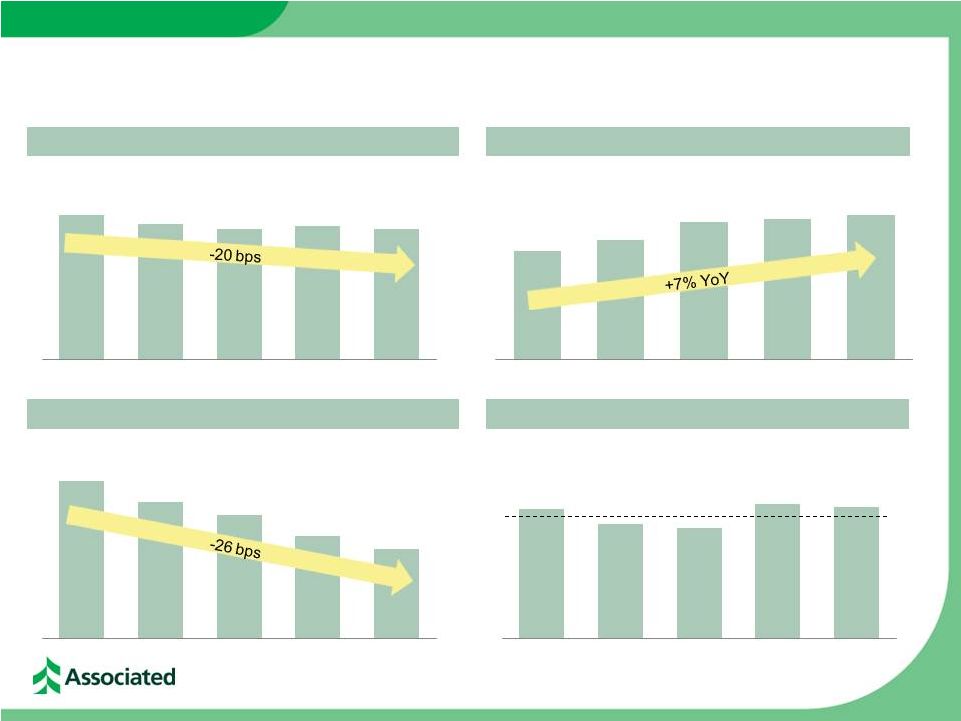
FY2011:
3.26%
Yield on Interest-earning Assets
Cost of Interest-bearing Liabilities
Average Deposits
Net Interest Margin
($ balances in billions)
4.00%
3.88%
3.81%
3.85%
3.80%
2Q 2011
3Q
2011 4Q
2011 1Q
2012
2Q
2012
2Q 2011
3Q
2011 4Q
2011 1Q
2012
2Q
2012
2Q 2011 3Q
2011
4Q
2011
1Q
2012
2Q
2012
2Q 2011 3Q
2011
4Q
2011
1Q
2012
2Q
2012
0.91%
0.83%
0.78%
0.70%
0.65%
$14.1
$14.4
$14.9
$15.0
$15.1
3.29%
3.23%
3.21%
3.31%
3.30%
Managing the Cost of Funds & Margin |
 Continued Improvement in Credit Quality Indicators
5
($ in millions)
Provision for loan losses
$ 16
$ 4
$ 1
$ 0
$ 0
Net charge offs
$ 45
$ 30
$ 23
$ 22
$ 24
Potential problem loans
$ 699
$ 660
$ 566
$ 480
$ 410
Nonaccruals
$ 468
$ 403
$ 357
$ 327
$ 318
ALLL/Total loans
3.25%
2.96%
2.70%
2.50%
2.26%
ALLL/Nonaccruals
91.09%
99.09%
105.99%
108.93%
104.65%
NPA/Assets
2.33%
2.03%
1.82%
1.65%
1.62%
Nonaccruals/Loans
3.57%
2.99%
2.54%
2.29%
2.16%
NCOs / Avg Loans
1.37%
0.90%
0.64%
0.61%
0.65%
2Q 2011
3Q 2011
2Q 2012
1Q 2012
4Q 2011 |
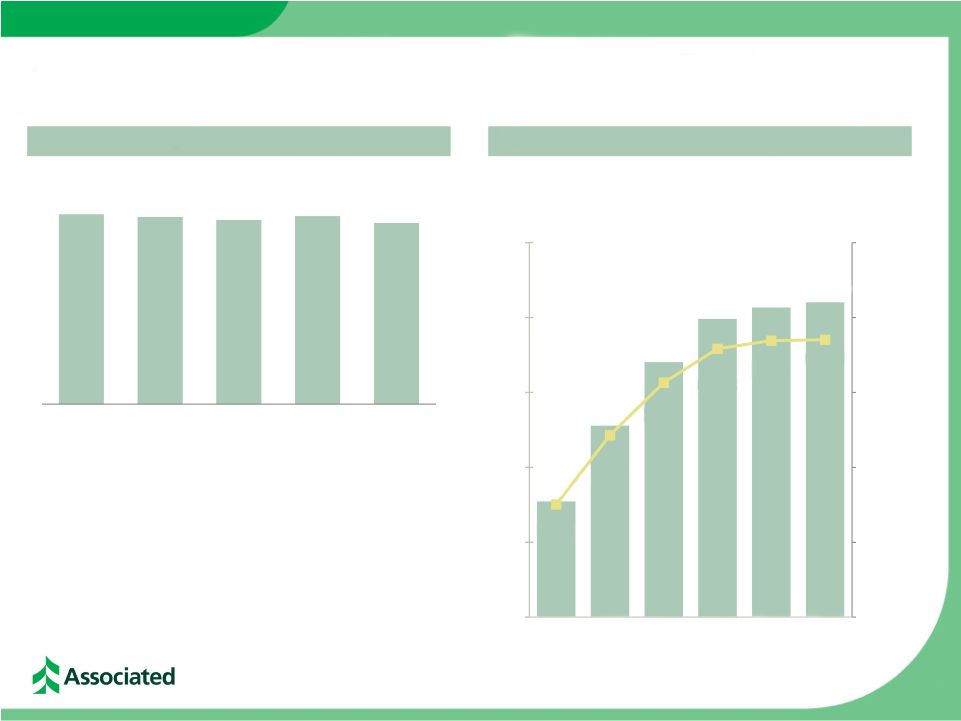 Strong Capital Profile
& Improving Earnings Tier 1 Common Equity Ratio
Net Income Available to Common & ROT1CE
12.61%
12.44%
12.24%
12.49%
12.04%
2Q 2011
3Q 2011
4Q 2011
1Q 2012
2Q 2012
3.76%
6.07%
7.83%
8.96%
9.23%
9.26%
12.50%
10.00%
7.50%
5.00%
2.50%
0.00%
$50
$40
$30
$20
$10
Net Income
($ in millions)
Return on Tier 1
Common Equity
$0
$15
$26
$34
$40
$41
$42
•
Current capital levels are well in excess of
“well-capitalized”
regulatory benchmarks
–
Existing capital levels are already above
proposed Basel III capital levels
1Q 2011
2Q 2011
3Q 2011
4Q 2011
1Q 2012
2Q 2012
6 |
 Outlook
7
Loan Growth
•
Approximately 3% quarterly
growth
Deposit Growth
Fee Income
Expenses
NIM
Positioned for Growth; Creating Long-Term Shareholder Value
Footprint
Credit
Capital
•
Continued disciplined pricing
•
Slowing run-off of high cost CDs
•
Sustained focus on treasury
management solutions to drive
growth in commercial deposits
•
Relatively stable on a full-year
basis compared to full-year 2011
•
Modest improvement quarterly
in core fee-based revenues
with mortgage banking income
likely reduced going forward
•
Low single-digit quarterly growth;
including the cost of continuing
BSA enhancements & footprint
updates
•
Continue to invest in our branches
while optimizing our network
•
Consolidating in downtown
Green Bay
•
Continuing improvement in
credit trends
•
Very modest provision outlook
•
Disciplined, value-added
approach to capital
deployment over time |