Attached files
| file | filename |
|---|---|
| 8-K - CONDOR HOSPITALITY TRUST, INC. | sppr8k_may15.htm |
For Immediate Release
Contact:
Ms. Krista Arkfeld
Director of Corporate Communications
karkfeld@supertelinc.com
Supertel Hospitality Reports 2012 First Quarter Results
NORFOLK, NE., May 15, 2012 – Supertel Hospitality, Inc. (NASDAQ: SPPR), a real estate investment trust (REIT) which owns 97 hotels in 23 states, today announced its results for the first quarter ended March 31, 2012.
First Quarter 2012 Highlights
|
·
|
Sourced $30 million in new equity capital through an investment by an IRSA Inversiones y Representaciones Sociedad Anónima (NYSE: IRS) affiliate.
|
|
·
|
Improved RevPAR 10.2 percent for the upper midscale continuing operations portfolio, aided by an 8.8 percent increase in occupancy and a 1.2 percent increase in ADR.
|
|
·
|
Bettered continuing operations portfolio RevPAR by 1.8 percent.
|
|
·
|
Entered into an agreement to acquire the 100-room Hilton Garden Inn in Solomons Island, Maryland for $11.5 million.
|
|
·
|
Increased revenues from continuing operations 2.5 percent to $16.7 million.
|
|
·
|
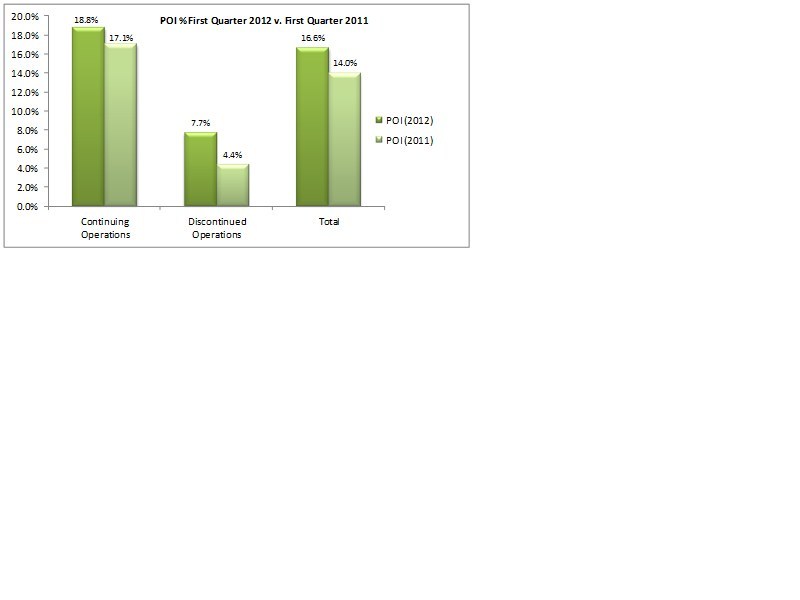
Increased Property Operating Income (POI) on the total portfolio $0.45 million, or 14.9 percent.
|
|
·
|
Reduced consolidated mortgage debt by $19.4 million.
|
|
·
|
Sold two economy hotels, generating gross proceeds of $2.86 million.
|
First Quarter Operating and Financial Results
Revenues from continuing operations for the 2012 first quarter rose $0.4 million, or 2.5 percent, to $16.7 million, compared to the same year-ago period. The improved performance primarily was due to the improved results of the company’s 21 upper midscale properties.
The company reported a net loss of $(4.0) million for the 2012 first quarter, compared to a net loss of $(3.7) million for the same 2011 period. The 2012 first quarter loss includes a $1.2 million increase in the fair value of derivative liabilities as well as an impairment charge of $1.8 million on properties which are held for sale. The 2011 first quarter loss includes a onetime termination cost of $0.6 million and a net impairment charge of $0.3 million on properties held for sale. All income and expenses related to sold and held for sale hotels are classified as discontinued operations.
Funds from operations (FFO) in the 2012 first quarter was $(1.5) million, or $(0.07) per diluted share, compared to $(1.0) million, or $(0.04) per diluted share, in the same 2011 period. The company’s Adjusted FFO for three months ended March 31, 2012 was $(0.3) million, which is an increase of $0.7 million over the $(1.0) million reported at March 31, 2011.
Earnings before interest, taxes, depreciation and amortization, non controlling interest and preferred stock dividends (Adjusted EBITDA) decreased to $0.2 million, compared to $0.9 million for the first quarter of 2011.
“The 2012 first quarter began to bear the fruits of our new strategic direction, both financially and operationally,” said Kelly A. Walters, Supertel president and CEO. “From an operations standpoint, a 14.9% increase in our most critical metric, total POI, validated last year’s decision to revamp our hotel management structure by replacing a long-standing centralized management company with more focused, regional operators. From a financial standpoint, the shareholder approval of the sale of the Series C preferred stock, gave us a strategic infusion of $30 million in new equity with $20 million specifically designated to be used for acquiring hotels conforming to the business plan. Further, we saw a 10.2% increase in the RevPAR figures of our upper midscale properties, which supports our strategy of expanding our holdings in that segment.”
The full portfolio of 74 hotels in continuing operations in the 2012 first quarter reported a RevPAR increase of 1.8 percent led by a 3.7 percent improvement in ADR partially offset by a 1.9 percent decline in occupancy, compared to the 2011 first quarter.
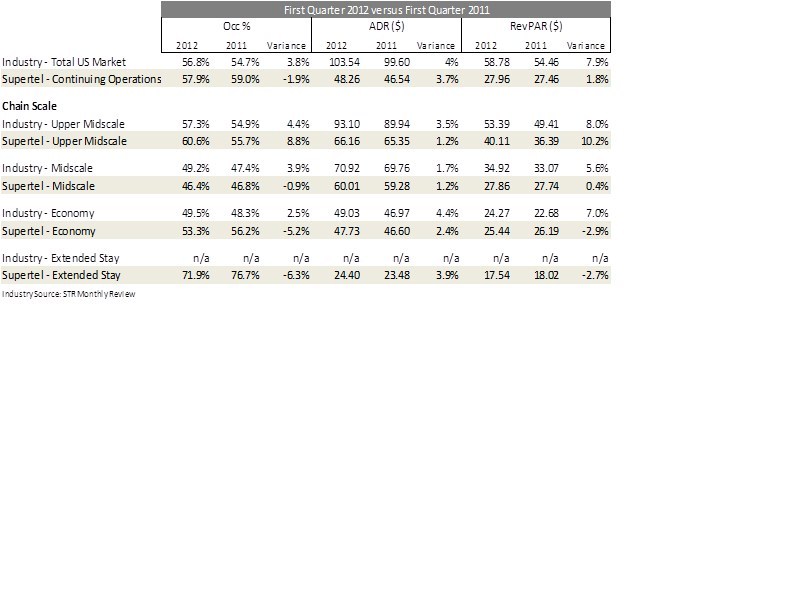
Prior to the 2012 first quarter, the company had classified its upper midscale and midscale hotels collectively as midscale hotels. Supertel updated its chain-scale brand categories for midscale hotels to correspond with the 2012 Smith Travel Research (STR) classifications of midscale and upper midscale hotels. “Reclassifying our 21 upper midscale hotels allows us to better clarify RevPAR growth in the segment that over time will dominate our portfolio,” Walters said.
Upper Midscale Hotels
First quarter RevPAR for the company’s 21 continuing operations upper midscale hotels rose 10.2 percent to $40.11, aided by an 8.8 percent increase in occupancy and a 1.2 percent increase in ADR to $66.16. Upper midscale hotel brands currently in the company’s portfolio include Comfort Inns, Comfort Suites, Hampton Inn and Holiday Inn Express.
Midscale Hotels
RevPAR for the company’s six continuing operations midscale hotels rose 0.4 percent to $27.86. Occupancy declined 0.9 percent with an offsetting ADR increase of 1.2 percent to $60.01. Supertel’s midscale brands include Quality Inn, Sleep Inn, Baymont Inn and Ramada Limited.
Economy Hotels
The company’s 40 continuing operations economy hotels reported a 2.9 percent decrease in RevPAR to $25.44 in the 2012 first quarter, caused by a 5.2 percent decrease in occupancy, partially offset by a 2.4 percent rise in ADR to $47.73. Supertel’s branded properties in this segment include Days Inn, Super 8, Key West Inns and Guesthouse Inn.
Extended Stay Hotels
The company’s seven continuing operations extended-stay hotels reported a 2.7 percent decrease in RevPAR to $17.54, reflecting a 6.3 percent decline in occupancy and a 3.9 percent increase in ADR to $24.40. Hotels in this segment include the Savannah Suites brand.
“Three factors influenced our 2012 first quarter results:
|
·
|
Our new operators have been directed to place significantly more weight on profit margin improvement.
|
|
·
|
The economic recovery is not distributed equally across all of our markets.
|
|
·
|
We are focusing on improving room rate as our overall occupancy remains above the national average.
|
While we always want to expand our top-line growth, STR data indicates that we are exceeding our fair share of occupancy, but we currently are not attaining our fair share of ADR,” Walters said. “As a result, we continue to fine tune our bottom line strategy on a property-by-property basis which we expect will continue to impact our relative performance over the short term. Our goal is to win the bottom-line game, without forfeiting top-line growth.
“Our management companies have kept operation expenses from continuing operations’ hotels under control in the 2012 first quarter and were essentially flat, over the like 2011 period,” Walters noted.
Interest expense from continuing operations decreased to $2.1 million for the quarter, primarily due to the paydown of the Great Western Bank revolver with funds provided by the sale of the preferred stock, but also due to a prepayment penalty incurred during the first quarter of 2011. Depreciation and amortization expense from continuing operations declined $0.1 million from the 2011 first quarter to $2.1 million.
For the 2012 first quarter, property operating income (POI) from continuing operations rose $0.4 million, or 12.9 percent, compared to the year-ago period. The increase resulted from a combination of higher revenue and improved cost management, especially in the areas of utilities and repairs and maintenance. POI is calculated as revenue from room rentals and other hotel services less hotel and property operations expenses. See attached chart (Property Operating Income Percent First Quarter 2012 versus First Quarter 2011).
General and administration expense from continuing operations for the 2012 first quarter was unchanged.
“We believe our new operators now are fully familiar with our properties, and we expect to see steady improvements in the quarters ahead, as the economy continues to recover,” Walters said.
Acquisition Activity
On March 27, the company entered into an agreement to acquire the 100-room Hilton Garden Inn in Solomons Island, Maryland for $11.5 million, excluding closing costs and fees. Completion of the proposed acquisition is subject to customary closing conditions and is expected to occur in the 2012 second quarter. The hotel will be managed by Cherry Cove Hospitality Management, LLC, the current operator.
“The purchase of the Hilton Garden Inn is significant on many levels because not only does it mark our re-entry into the acquisition market, but it represents the type of asset we target as part of our updated strategy which we believe will usher in a new era of growth for Supertel,” said Walters. “This hotel is located in the greater Washington, D.C. market and has multiple demand generators, including the Naval Air Station Patuxent River and Calvert Cliffs Nuclear Power Plant.”
Disposition Program
During the first quarter, the company sold an 83-room Super 8 hotel located in Fayetteville, Arkansas, for $1.56 million and a 63-room Super 8 in Muscatine, Iowa for $1.3 million. Proceeds were used to reduce related mortgage debt. “We are divesting of hotels that no longer meet our new strategic vision,” Walters said. “Over time we intend to significantly reduce the age of our portfolio and refine the mix, moving from a heavy concentration in the economy segment to a portfolio with a much greater focus on premium-branded, select-service hotels.”
Property Renovations
During the 2012 first quarter, the company invested $1.6 million to upgrade its properties and maintain brand standards. Imbedded in the quarter’s capital expenditure figures is approximately $0.5 million of renovations to three upper midscale Choice Hotels located in Indiana, including South Bend, Fort Wayne, and Warsaw. The renovations caused some displacement in revenues but the hotels are now better positioned for the high demand period.
Balance Sheet
“We continue to strengthen and add flexibility to our balance sheet through reconfiguring our portfolio and raising new equity,” said Connie Scarpello, chief financial officer. “We have reduced our total debt in the past 12 months by 16.5 percent to $146.5 million.”
Outstanding debt on hotels in continuing operations totaled $120.6 million, and has an average term to maturity of 3.4 years and a weighted average annual interest rate of 6.4 percent.
In two separate transactions in February, 2012, the company completed the sale of the previously announced 3,000,000 shares of Series C convertible preferred stock and warrants to purchase 30,000,000 shares of common stock at an exercise price of $1.20 per common share. On February 3, 2012, the company paid off its $5.0 million balance on a revolving credit facility with Elkhorn Valley Bank with a portion of the net proceeds from the sale of the Series C convertible preferred stock.
On February 16, 2012, the company paid off a $2.1 million note payable to Fredericksburg North Investors, LLC, with a portion of the net proceeds from the sale of the Series C convertible preferred stock. In addition, the company used a portion of proceeds to pay down the $12.5 million Great Western Bank revolver. On February 21, 2012, the company entered into an amendment with Great Western Bank to extend the maturity date of all loans to June 30, 2013. On March 1, 2012 the company amended its credit facility with First National Bank of Omaha to extend the maturity date to May 1, 2012. The debt was paid in full April 20, 2012.
“The terms of the preferred capital raise require the company to invest $20 million of equity in hotels meeting the firm’s investment criteria, which will involve both the use of our set aside cash and the $12.5 million revolving facility with Great Western Bank. By year end, the company has plans to invest as much as $40 million in equity and debt as we begin to rebuild our portfolio,” Walters said. “We continue to focus on balance sheet improvements through additional de-levering measures.”
Subsequent Events
Following the close of the first quarter, the company closed on the sale of its 49-room Super 8 hotel in El Dorado, Kansas for $1.625 million. The associated mortgage debt was fully retired with excess proceeds applied to general corporate purposes.
Dividends
The company did not declare a common stock dividend for the 2012 first quarter. Preferred dividends continued uninterrupted. The company will monitor requirements to maintain its REIT status and will routinely evaluate the dividend policy. The company intends to continue to meet its dividend requirements to retain its REIT status.
Outlook
“We believe that the 2012 first quarter marks a critical, positive shift in the company’s future direction and sets it on a restorative and transformational path by putting into motion the financial and human capital required to restructure and adapt the hotel portfolio to contemporary market expectations,” Walters said. “This will be a multi-year process, but we are confident in our direction.”
About Supertel Hospitality, Inc.
Supertel Hospitality, Inc. (NASDAQ: SPPR) is a self-administered real estate investment trust that specializes in the ownership of select-service hotels. The company currently owns 97 hotels comprising 8,573 rooms in 23 states. Supertel’s hotels are franchised by a number of the industry’s most well-regarded brand families, including Hilton, IHG, Choice and Wyndham. For more information or to make a hotel reservation, visit www.supertelinc.com.
Forward Looking Statement
Certain matters within this press release are discussed using forward-looking language as specified in the Private Securities Litigation Reform Act of 1995, and, as such, may involve known and unknown risks, uncertainties and other factors that may cause the actual results or performance to differ from those projected in the forward-looking statement. These risks are discussed in the Company’s filings with the Securities and Exchange Commission.
SELECTED FINANCIAL DATA:
The following table sets forth the Company’s balance sheet as of March 31, 2012 and December 31, 2011. The Company owned 98 hotels (including 24 hotels in discontinued operations) at March 31, 2012, and 105 hotels as of December 31, 2011 respectively.
(in thousands, except share and per share data)
|
As of
|
||||||
|
March 31,
|
December 31,
|
|||||
|
2012
|
2011
|
|||||
|
(unaudited)
|
||||||
|
ASSETS
|
||||||
|
Investments in hotel properties
|
$ 256,343
|
$ 255,677
|
||||
|
Less accumulated depreciation
|
77,767
|
76,777
|
||||
|
178,576
|
178,900
|
|||||
|
Cash and cash equivalents
|
9,991
|
279
|
||||
|
Accounts receivable, net of allowance for doubtful accounts of $173 and $194
|
2,251
|
1,891
|
||||
|
Prepaid expenses and other assets
|
10,065
|
8,917
|
||||
|
Deferred financing costs, net
|
718
|
850
|
||||
|
Investment in hotel properties, held for sale, net
|
26,394
|
30,335
|
||||
|
$ 227,995
|
$ 221,172
|
|||||
|
LIABILITIES AND EQUITY
|
||||||
|
LIABILITIES
|
||||||
|
Accounts payable, accrued expenses and other liabilities
|
$ 11,440
|
$ 10,704
|
||||
|
Derivative liabilities, at fair value
|
16,902
|
-
|
||||
|
Debt related to hotel properties held for sale
|
25,920
|
35,173
|
||||
|
Long-term debt
|
120,564
|
130,672
|
||||
|
174,826
|
176,549
|
|||||
|
Redeemable noncontrolling interest in consolidated partnership,
|
||||||
|
at redemption value
|
114
|
114
|
||||
|
Redeemable preferred stock
|
||||||
|
10% Series B, 800,000 shares authorized; $.01 par value,
|
||||||
|
332,500 shares outstanding, liquidation preference of $8,312
|
7,662
|
7,662
|
||||
|
EQUITY
|
||||||
|
Shareholders' equity
|
||||||
|
Preferred stock, 40,000,000 shares authorized;
|
||||||
|
8% Series A, 2,500,000 shares authorized, $.01 par value, 803,270
|
||||||
|
shares outstanding, liquidation preference of $8,033
|
8
|
8
|
||||
|
6.25% Series C, 3,000,000 shares authorized, $.01 par value, 3,000,000
|
||||||
|
shares outstanding, liquidation preference of $30,000
|
30
|
-
|
||||
|
Common stock, $.01 par value, 100,000,000 shares authorized;
|
||||||
|
23,074,752 and 23,070,387 shares outstanding
|
231
|
231
|
||||
|
Common stock warrants
|
252
|
252
|
||||
|
Additional paid-in capital
|
134,766
|
121,619
|
||||
|
Distributions in excess of retained earnings
|
(90,020)
|
(85,398)
|
||||
|
Total shareholders' equity
|
45,267
|
36,712
|
||||
|
Noncontrolling interest
|
||||||
|
Noncontrolling interest in consolidated partnership,
|
||||||
|
redemption value $102 and $64
|
126
|
135
|
||||
|
Total equity
|
45,393
|
36,847
|
||||
|
COMMITMENTS AND CONTINGENCIES
|
||||||
|
$ 227,995
|
$ 221,172
|
|||||
The following table sets forth the Company’s results of operations for the three months ended March 31, 2012 and 2011, respectively. (in thousands, except per share data)
|
Three Months Ended
March 31,
|
|||||||
|
2012
|
2011
|
||||||
|
REVENUES
|
|||||||
|
Room rentals and other hotel services
|
$ 16,681
|
$ 16,270
|
|||||
|
EXPENSES
|
|||||||
|
Hotel and property operations
|
13,541
|
13,488
|
|||||
|
Depreciation and amortization
|
2,124
|
2,247
|
|||||
|
General and administrative
|
1,093
|
1,103
|
|||||
|
Termination cost
|
-
|
540
|
|||||
|
16,758
|
17,378
|
||||||
|
EARNINGS BEFORE NET LOSS
|
|||||||
|
ON DISPOSITIONS OF
|
|||||||
|
ASSETS, OTHER INCOME, INTEREST EXPENSE
|
|||||||
|
AND INCOME TAXES
|
(77)
|
(1,108)
|
|||||
|
Net loss on dispositions of assets
|
(4)
|
(5)
|
|||||
|
Other income (expense)
|
(1,212)
|
85
|
|||||
|
Interest expense
|
(2,116)
|
(2,336)
|
|||||
|
Impairment
|
381
|
(193)
|
|||||
|
LOSS FROM CONTINUING OPERATIONS
|
|||||||
|
BEFORE INCOME TAXES
|
(3,028)
|
(3,557)
|
|||||
|
Income tax benefit
|
464
|
609
|
|||||
|
LOSS FROM CONTINUING OPERATIONS
|
(2,564)
|
(2,948)
|
|||||
|
Loss from discontinued operations, net of tax
|
(1,407)
|
(763)
|
|||||
|
NET LOSS
|
(3,971)
|
(3,711)
|
|||||
|
Noncontrolling interest
|
6
|
11
|
|||||
|
NET LOSS ATTRIBUTABLE TO CONTROLLING INTERESTS
|
(3,965)
|
(3,700)
|
|||||
|
Preferred stock dividends
|
(657)
|
(368)
|
|||||
|
NET LOSS ATTRIBUTABLE
|
|||||||
|
TO COMMON SHAREHOLDERS
|
$ (4,622)
|
$ (4,068)
|
|||||
|
NET LOSS PER COMMON SHARE - BASIC AND DILUTED
|
|||||||
|
EPS from continuing operations
|
$ (0.14)
|
$ (0.15)
|
|||||
|
EPS from discontinued operations
|
$ (0.06)
|
$ (0.03)
|
|||||
|
EPS basic and diluted
|
$ (0.20)
|
$ (0.18)
|
|||||
RECONCILIATION OF NON-GAAP FINANCIAL MEASURES
Unaudited-In thousands, except per share data:
|
Three months
ended March 31,
|
|||
|
2012
|
2011
|
||
|
Weighted average shares outstanding for:
|
|||
|
calculation of FFO per share - basic and diluted
|
23,070
|
22,918
|
|
|
Reconciliation of net income to FFO
|
|||
|
Net loss attributable to common shareholders
|
$ (4,622)
|
$ (4,068)
|
|
|
Depreciation and amortization, including discontinued operations
|
2,170
|
2,621
|
|
|
Net gain on disposition of assets, including discontinued operations
|
(490)
|
19
|
|
|
Impairment, including discontinued operations
|
1,434
|
449
|
|
|
FFO
|
$ (1,508)
|
$ (979)
|
|
|
Unrealized loss on derivatives
|
1,213
|
--
|
|
|
Adjusted FFO
|
$ (295)
|
$ (979)
|
|
|
FFO per share - basic and diluted
|
$ (0.07)
|
$ (0.04)
|
|
|
Adjusted FFO per share - basic and diluted
|
$ (0.01)
|
$ (0.04)
|
|
FFO and Adjusted FFO (“AFFO”) are non-GAAP financial measures. We consider FFO and AFFO to be market accepted measures of an equity REIT's operating performance, which are necessary, along with net earnings (loss), for an understanding of our operating results. FFO, as defined under the National Association of Real Estate Investment Trusts (NAREIT) standards, consists of net income computed in accordance with GAAP, excluding gains (or losses) from sales of real estate assets, plus depreciation and amortization of real estate assets. We believe our method of calculating FFO complies with the NAREIT definition. Adjusted FFO excludes the unrealized loss on derivative liabilities, which is a non-cash charge against income and which does not represent results from our core operations. FFO and AFFO do not represent amounts available for management’s discretionary use because of needed capital replacement or expansion, debt service obligations, or other commitments and uncertainties. FFO and AFFO should not be considered as alternatives to net income (loss) (computed in accordance with GAAP) as an indicator of our liquidity, nor are they indicative of funds available to fund our cash needs, including our ability to pay dividends or make distributions. All REITs do not calculate FFO and AFFO in the same manner; therefore, our calculation may not be the same as the calculation of FFO and AFFO for similar REITs.
We use FFO and AFFO as performance measures to facilitate a periodic evaluation of our operating results relative to those of our peers. We consider FFO and AFFO useful additional measures of performance for an equity REIT because they facilitate an understanding of the operating performance of our properties without giving effect to real estate depreciation and amortization, which assume that the value of real estate assets diminishes predictably over time. Since real estate values have historically risen or fallen with market conditions, we believe that FFO and AFFO provide a meaningful indication of our performance.
|
Unaudited-In thousands, except statistical data:
|
Three months
ended March 31,
|
||
|
2012
|
2011
|
||
|
RECONCILIATION OF NET LOSS TO ADJUSTED EBITDA
|
|||
|
Net loss attributable to common shareholders
|
$ (4,622)
|
$ (4,068)
|
|
|
Interest expense, including discontinued operations
|
2,678
|
3,103
|
|
|
Income tax benefit, including discontinued operations
|
(662)
|
(1,073)
|
|
|
Depreciation and amortization, including discontinued operations
|
2,170
|
2,621
|
|
|
EBITDA
|
(436)
|
583
|
|
|
Noncontrolling interest
|
(6)
|
(11)
|
|
|
Preferred stock dividend
|
657
|
368
|
|
|
ADJUSTED EBITDA
|
$ 215
|
$ 940
|
|
Adjusted EBITDA is a financial measure that is not calculated in accordance with accounting principles generally accepted in the United States of America (“GAAP”). We calculate Adjusted EBITDA by adding back to net earnings (loss) available to common shareholders certain non-operating expenses and non-cash charges which are based on historical cost accounting and we believe may be of limited significance in evaluating current performance. We believe these adjustments can help eliminate the accounting effects of depreciation and amortization and financing decisions and facilitate comparisons of core operating profitability between periods, even though Adjusted EBITDA also does not represent an amount that accrues directly to common shareholders. In calculating Adjusted EBITDA, we also add back preferred stock dividends and noncontrolling interests, which are cash charges.
Adjusted EBITDA doesn’t represent cash generated from operating activities determined by GAAP and should not be considered as an alternative to net income, cash flow from operations or any other operating performance measure prescribed by GAAP. Adjusted EBITDA is not a measure of our liquidity, nor is Adjusted EBITDA indicative of funds available to fund our cash needs, including our ability to make cash distributions. Neither does the measurement reflect cash expenditures for long-term assets and other items that have been and will be incurred. Adjusted EBITDA may include funds that may not be available for management’s discretionary use due to functional requirements to conserve funds for capital expenditures, property acquisitions, and other commitments and uncertainties. To compensate for this, management considers the impact of these excluded items to the extent they are material to operating decisions or the evaluation of our operating performance. Adjusted EBITDA, as presented, may not be comparable to similarly titled measures of other companies.
The following table sets forth the operations of the Company’s hotel properties in continuing operations for the three months ended March 31, 2012 and 2011, respectively.
|
Unaudited-In thousands, except statistical data:
|
Three months
ended March 31,
|
||
|
2012
|
2011
|
||
|
Same Store:
|
|||
|
Revenue per available room (RevPAR):
|
|||
|
Upper Midscale
|
$ 40.11
|
$ 36.39
|
|
|
Midscale
|
$ 27.86
|
$ 27.74
|
|
|
Economy
|
$ 25.44
|
$ 26.19
|
|
|
Extended Stay
|
$ 17.54
|
$ 18.02
|
|
|
Total
|
$ 27.96
|
$ 27.46
|
|
|
Average daily room rate (ADR):
|
|||
|
Upper Midscale
|
$ 66.16
|
$ 65.35
|
|
|
Midscale
|
$ 60.01
|
$ 59.28
|
|
|
Economy
|
$ 47.73
|
$ 46.60
|
|
|
Extended Stay
|
$ 24.40
|
$ 23.48
|
|
|
Total
|
$ 48.26
|
$ 46.54
|
|
|
Occupancy percentage:
|
|||
|
Upper Midscale
|
60.6%
|
55.7%
|
|
|
Midscale
|
46.4%
|
46.8%
|
|
|
Economy
|
53.3%
|
56.2%
|
|
|
Extended Stay
|
71.9%
|
76.7%
|
|
|
Total
|
57.9%
|
59.0%
|
|
This presentation includes non-GAAP financial measures. The Company believes that the presentation of hotel property operating income (POI) is helpful to investors, and represents a useful description of its operations, as it communicates the comparability of its hotels’ operating results.
|
Unaudited-In thousands, except statistical data:
|
Three months
ended March 31,
|
||
|
2012
|
2011
|
||
|
Total Same Store Hotels:
|
|||
|
Revenue per available room (RevPAR):
|
$ 27.96
|
$ 27.46
|
|
|
Average daily room rate (ADR):
|
$ 48.26
|
$ 46.54
|
|
|
Occupancy percentage:
|
57.9%
|
59.0%
|
|
|
Revenue from room rentals and other hotel services consists of:
|
|||
|
Room rental revenue
|
$ 16,157
|
$ 15,706
|
|
|
Telephone revenue
|
77
|
71
|
|
|
Other hotel service revenues
|
447
|
493
|
|
|
Total revenue from room rentals and other hotel services
|
$ 16,681
|
$ 16,270
|
|
|
Hotel and property operations expense
|
|||
|
Total hotel and property operations expense
|
$ 13,541
|
|
$ 13,488
|
|
Property Operating Income ("POI") from continuing operations
|
|||
|
POI - continuing operations
|
$ 3,140
|
$ 2,782
|
|
|
POI - continuing operations as a percentage of revenue from room rentals
|
|||
|
and other hotel services
|
|||
|
POI - continuing operations as a percentage of revenue
|
18.8%
|
17.1%
|
|
|
Same Store reflects 74 hotels.
|
|||
|
Discontinued Operations
|
|||
|
Room rentals and other hotel services
|
|||
|
Total room rental and other hotel services
|
$ 4,189
|
$ 5,305
|
|
|
Hotel and property operations expense
|
|||
|
Total hotel and property operations expense
|
$ 3,865
|
$ 5,071
|
|
|
Property Operating Income ("POI") from discontinued operations
|
|||
|
POI - discontinued operations
|
$ 324
|
$ 234
|
|
|
POI - discontinued operations as a percentage of revenue from room rentals
|
|||
|
and other hotel services
|
|||
|
POI - discontinued operations as a percentage of revenue
|
7.7%
|
4.4%
|
|
|
RECONCILIATION OF NET LOSS FROM
|
|||
|
CONTINUING OPERATIONS TO POI
|
|||
|
Net loss
|
$ (2,564)
|
|
$ (2,948)
|
|
Depreciation and amortization
|
2,124
|
2,247
|
|
|
Net loss on disposition of assets
|
4
|
5
|
|
|
Other (income) expense
|
1,212
|
(85)
|
|
|
Interest expense
|
2,116
|
2,336
|
|
|
General and administrative expense
|
1,093
|
1,103
|
|
|
Termination cost
|
-
|
540
|
|
|
Income tax benefit
|
(464)
|
(609)
|
|
|
Impairment (recovery) expense
|
(381)
|
193
|
|
|
POI - continuing operations
|
$ 3,140
|
$ 2,782
|
|
|
Net income (loss) as a percentage of continuing operations revenue
|
|||
|
from room rentals and other hotel services
|
-15.4%
|
-18.1%
|
|
|
Reconciliation of loss from discontinued operations to POI - discontinued operations:
|
Three months
ended March 31,
|
|||
|
2012
|
2011
|
|||
|
Loss from discontinued operations
|
$ (1,407)
|
$ (763)
|
||
|
Depreciation and amortization from discontinued operations
|
46
|
374
|
||
|
Net gain on disposition of assets from discontinued operations
|
(494)
|
14
|
||
|
Interest expense from discontinued operations
|
562
|
767
|
||
|
General and administrative expense from discontinued operations
|
-
|
50
|
||
|
Impairment losses from discontinued operations
|
1,815
|
256
|
||
|
Income tax benefit from discontinued operations
|
(198)
|
(464)
|
||
|
POI--discontinued operations
|
$ 324
|
$ 234
|
||
|
Reconciliation of Total POI:
|
Three months
ended March 31,
|
||
|
2012
|
2011
|
||
|
POI - Continuing Operations
|
3,140
|
2,782
|
|
|
POI- Discontinued Operations
|
324
|
234
|
|
|
Total POI
|
$ 3,464
|
$ 3,016
|
|
|
Total POI as a percentage of room revenues
|
16.6%
|
14.0%
|
|
Same Store reflects 74 hotels in continuing operations for the three months and year to date ended March 31, 2012 and 2011.
The following unaudited table presents our RevPAR, ADR and Occupancy, by region, for the three months ended March 31, 2012 and 2011, respectively. The comparisons of same store operations are for 74 hotels in continuing operations as of January 1, 2011.
|
Three months ended March 31, 2012
|
Three months ended March 31, 2011
|
|||||||||
|
Room
Count
|
Room
Count
|
|||||||||
|
Region
|
RevPAR
|
Occupancy
|
ADR
|
RevPAR
|
Occupancy
|
ADR
|
||||
|
Mountain
|
214
|
$ 25.49
|
53.8%
|
$ 47.35
|
214
|
$ 23.35
|
52.3%
|
$ 44.66
|
||
|
West North Central
|
1,559
|
25.15
|
51.9%
|
48.41
|
1,559
|
25.47
|
55.0%
|
46.30
|
||
|
East North Central
|
978
|
29.01
|
50.2%
|
57.74
|
978
|
28.48
|
49.5%
|
57.56
|
||
|
Middle Atlantic
|
142
|
34.61
|
61.8%
|
56.01
|
142
|
31.54
|
59.8%
|
52.76
|
||
|
South Atlantic
|
2,525
|
28.49
|
66.4%
|
42.93
|
2,525
|
27.28
|
66.8%
|
40.82
|
||
|
East South Central
|
563
|
33.31
|
52.1%
|
63.98
|
563
|
31.93
|
49.5%
|
64.45
|
||
|
West South Central
|
373
|
24.07
|
55.7%
|
43.22
|
373
|
28.45
|
65.6%
|
43.36
|
||
|
Total Same Store
|
6,354
|
$ 27.96
|
57.9%
|
$ 48.26
|
6,354
|
$ 27.46
|
59.0%
|
$ 46.54
|
||
|
States included in the Regions
|
|
|
Mountain
|
Idaho and Montana
|
|
West North Central
|
Iowa, Kansas, Missouri, Nebraska and South Dakota
|
|
East North Central
|
Indiana and Wisconsin
|
|
Middle Atlantic
|
Pennsylvania
|
|
South Atlantic
|
Delaware, Florida, Georgia, Maryland, North Carolina, South Carolina, Virginia and West Virginia
|
|
East South Central
|
Kentucky and Tennessee
|
|
West South Central
|
Arkansas and Louisiana
|