Attached files
| file | filename |
|---|---|
| 8-K - FORM 8-K - CYS Investments, Inc. | d348301d8k.htm |
 Exhibit
99.1 UBS Global Financial Services Conference
May 8, 2012
Investment Outlook
May 2012 |
 Forward
Looking Statements This presentation contains forward-looking statements,
within the meaning of Section 27A of the Securities Act of 1933, as amended,
and Section 21E of the Securities Exchange Act of 1934, as amended, that are
based on management’s beliefs and assumptions, current expectations,
estimates and projections. Such statements, including information relating to the Company’s
expectations
for
future
distributions
and
market
conditions,
are
not
considered
historical
facts
and
are
considered
forward-looking
information
under
the
federal
securities
laws.
This
information
may
contain
words
such
as
“believes,”
“plans,”
“expects,”
“intends,”
“estimates”
or similar expressions.
This information is not a guarantee of the Company’s future performance and is
subject to risks, uncertainties and other important factors that could cause
the Company’s actual performance or achievements to differ materially from those expressed
or implied by this forward-looking information and include, without limitation,
changes in the Company’s distribution policy, changes in the
Company’s ability to pay distributions, changes in the market value and yield of our assets, changes in interest
rates and the yield curve, net interest margin, return on equity, availability and
terms of financing and hedging and various other risks
and
uncertainties
related
to
our
business
and
the
economy,
some
of
which
are
described
in
our
filings
with
the
SEC.
Given
these uncertainties, you should not rely on forward-looking information.
The Company undertakes no obligations to update any forward-looking
information, whether as a result of new information, future events or otherwise.
1 |
 CYS:
Overview Agency Residential Mortgage Backed Securities
Currently
financing
lines
with
33
lenders
Swap agreements with 18 counterparties
Self managed: highly scalable
Kevin Grant, CEO, President, Chairman
Frances Spark, CFO
Pay dividends and achieve capital appreciation throughout changing interest
rate and credit cycles
Be the most efficient Agency REIT in the market
Company intends to distribute all or substantially all of its REIT taxable
income 2
A Real Estate Investment Trust formed in January 2006
Target Assets
Objective
Senior Management
Focus on Cost
Efficiency
Ample Financing
Sources
Dividend Policy |
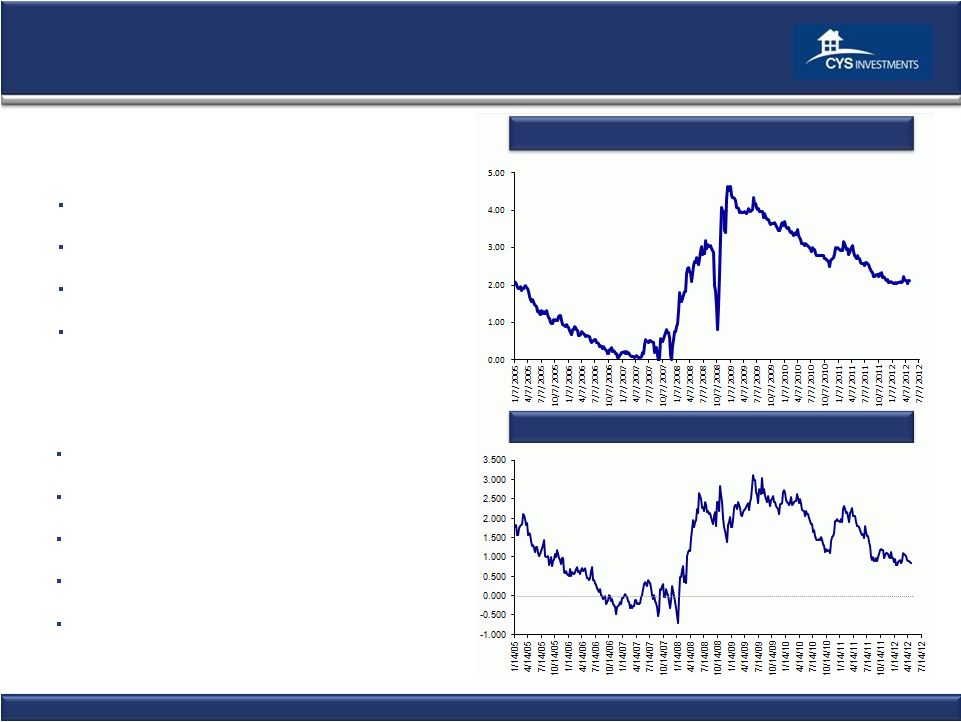 Attractive Environment Likely to Persist
Steep Curve
Creates significant positive carry
Very low cost of financing
Significant ROE
Hedge flexibility very important
Fed still fighting deflation
5 Year
Swap
vs.
1
Month
LIBOR:
1/2005
–
5/1
Hybrid
Net
Interest
Margin:
1/2005
–
Source: Bloomberg
(1) May 4, 2012
Mortgage Yields Currently Attractive
Par-Priced
7/1
hybrid
rates
now
1.62%
(1)
30
Year
fixed
rates
now
2.97%
(1)
15
Year
fixed
rates
now
2.28%
(1)
Hedging rates historically low
May 4, 2012
May 4, 2012
3
5/2012
5/2012 |
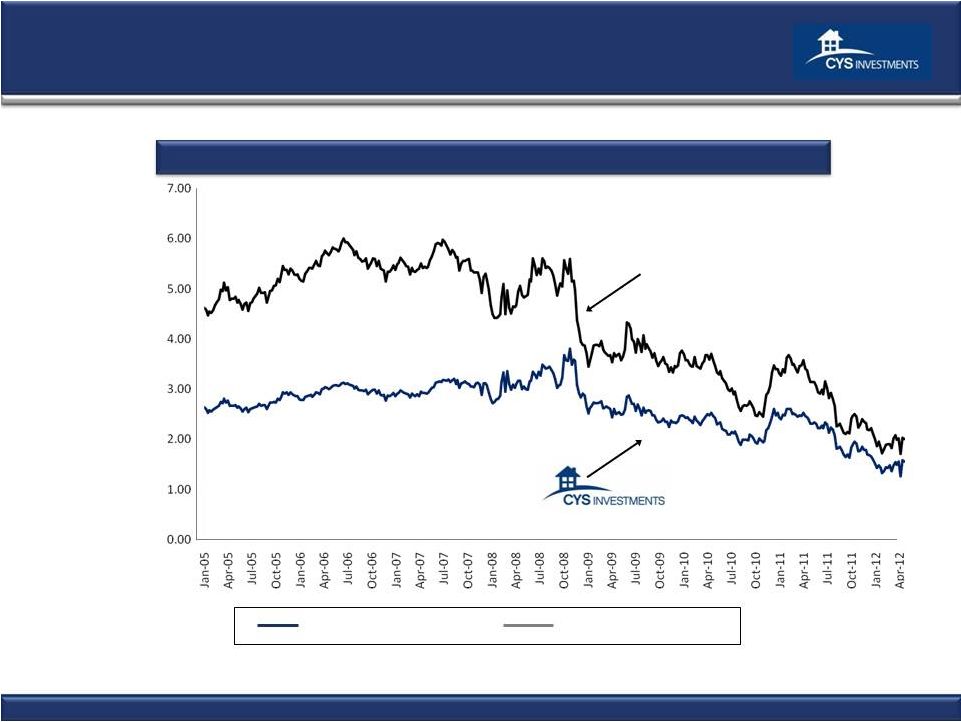 Attractive Investment Environment Remains
15 Year Hedged
(i)
15 Year Unhedged
(ii)
Borrow Short
Invest Long
May 4, 2012
15
Year
Fixed
Hedged
with
Swaps:
1/1/2005
–
5/4/2012
4
Source: Bloomberg.
Note: Spreads calculated as: (i) 15 year CC
Index = 50% 4 year swap, and (ii) 15 year Current Coupon Index |
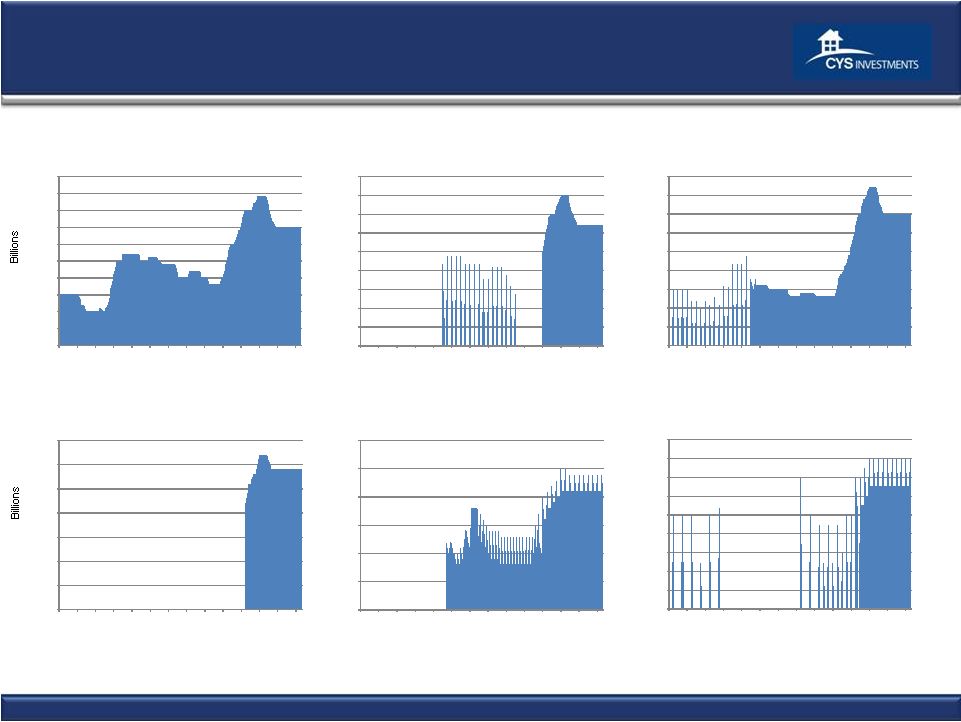 10 Year
Treasury Note Auctions 11/98 –
3/12
Treasury Auction Volume
2 Year Treasury Note Auctions
2/98 –
3/12
3 Year Treasury Note Auctions
10/98 –
3/12
Source: Bloomberg, US Treasury
5 Year Treasury Note Auctions
2/98 –
3/12
7 Year Treasury Note Auctions
2/00 –
3/12
30 Year Treasury Note Auctions
2/00–
3/12
0
5
10
15
20
25
30
35
40
45
50
Nov
'98
Nov
'99
Nov
'00
Nov
'01
Nov
'02
Nov
'03
Nov
'04
Nov
'05
Nov
'06
Nov
'07
Nov
'08
Nov
'09
Nov
'10
Nov
'11
0
5
10
15
20
25
30
35
40
45
Nov
'98
Nov
'99
Nov
'00
Nov
'01
Nov
'02
Nov
'03
Nov
'04
Nov
'05
Nov
'06
Nov
'07
Nov
'08
Nov
'09
Nov
'10
Nov
'11
0
5
10
15
20
25
30
35
40
45
Nov
'98
Nov
'99
Nov
'00
Nov
'01
Nov
'02
Nov
'03
Nov
'04
Nov
'05
Nov
'06
Nov
'07
Nov
'08
Nov
'09
Nov
'10
Nov
'11
0
5
10
15
20
25
30
35
Nov
'98
Nov
'99
Nov
'00
Nov
'01
Nov
'02
Nov
'03
Nov
'04
Nov
'05
Nov
'06
Nov
'07
Nov
'08
Nov
'09
Nov
'10
Nov
'11
0
5
10
15
20
25
30
Nov
'98
Nov
'99
Nov
'00
Nov
'01
Nov
'02
Nov
'03
Nov
'04
Nov
'05
Nov
'06
Nov
'07
Nov
'08
Nov
'09
Nov
'10
Nov
'11
0
2
4
6
8
10
12
14
16
18
Nov
'98
Nov
'99
Nov
'00
Nov
'01
Nov
'02
Nov
'03
Nov
'04
Nov
'05
Nov
'06
Nov
'07
Nov
'08
Nov
'09
Nov
'10
Nov
'11
5 |
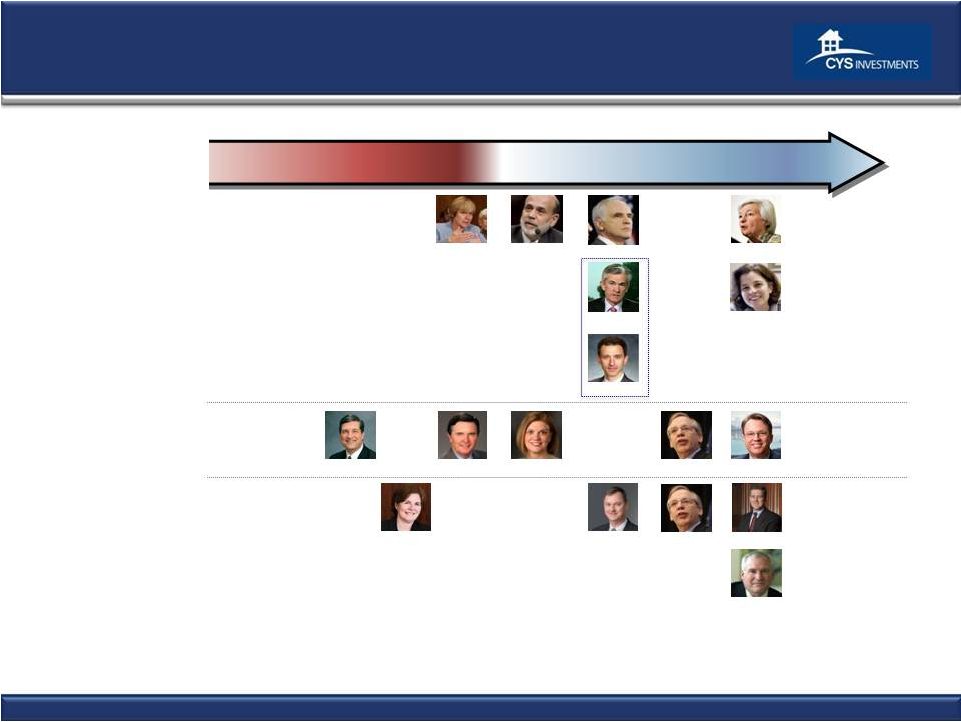 Hawkish
Dovish
Neutral
Lacker
Duke
Tarullo
Lockhart
Pianalto
Yellen
Raskin
Bernanke
Governors
2012 Voters
Fed Voters Moving To Be Even More Dovish in 2012
Williams
2013 Voters
Dudley
Evans
Rosengren
Bullard
Powell
Stein
Obama
Nominees
Sources: federalreserve.gov, Macroeconomic Advisers, LLC, Bank of America
Merrill Lynch, Bloomberg, Wall Street Journal, Indiana University, Marketwatch, Thomson Reuters, Federal Reserve Bank of Atlanta, Federal Reserve Bank of Chicago, Federal
Reserve Bank of Cleveland, Maryland Consumer Rights Coalition, Boston Globe,
Businessweek, Newsweek, Washington Post, CNBC. Dudley
George
6 |
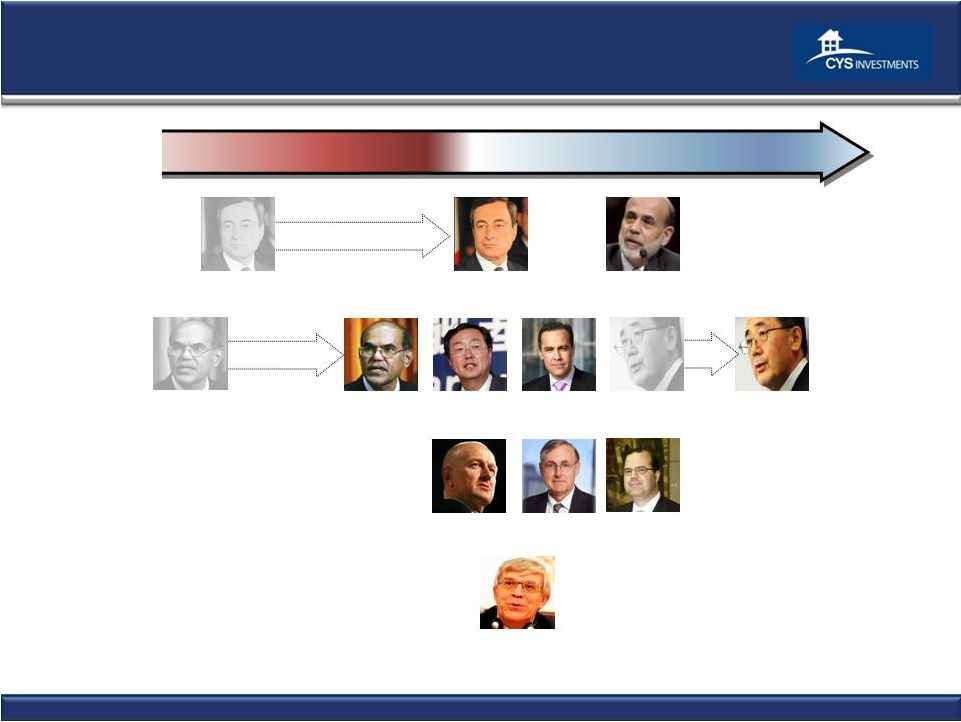 The Brief
Hawkish Interlude Appears Over Xiaochuan
China
Bernanke
Shirakawa
Japan
Canada
Carney
Australia
Stevens
New Zealand
Bollard
Draghi
EU
Tombini
Brazil
Subbarao
India
Global Accommodation Has Reluctantly Restarted
Hawkish
Dovish
Neutral
Draghi
EU
Ignatiev
Russia
Shirakawa
Japan
Subbarao
India
USA
7 |
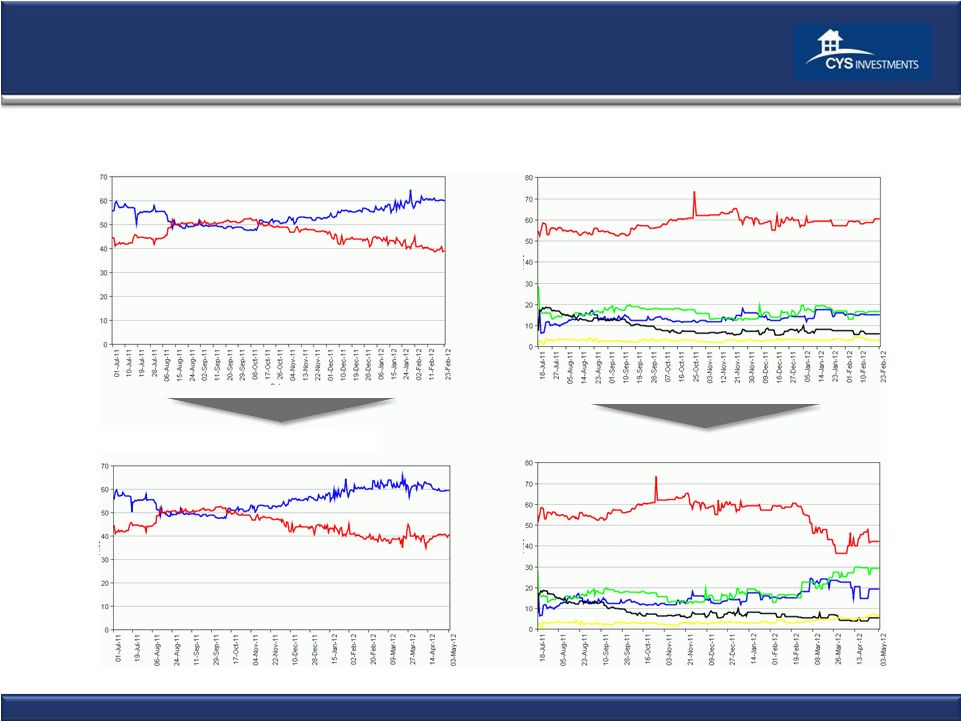 The Iowa
Electronic Futures Market: Obama Re-elected and a Republican Congress
Democrat
Republican
Republican House/
Republican Senate
Republican House/
Democrat Senate
Democrat House/
Democrat Senate
Democrat House/
Republican Senate
Source: The Iowa Electronic Markets
2012
US
Presidential
Election
Winner-Takes-All
Market
2012 Congressional Control Winner-Takes-All Market
As of February 29
As of February 29
As of May 3
As of May 3
Republican House/
Democrat Senate
Democrat House/
Democrat Senate
Democrat House/
Republican Senate
Republican House/
Republican Senate
Democrat
Republican
8 |
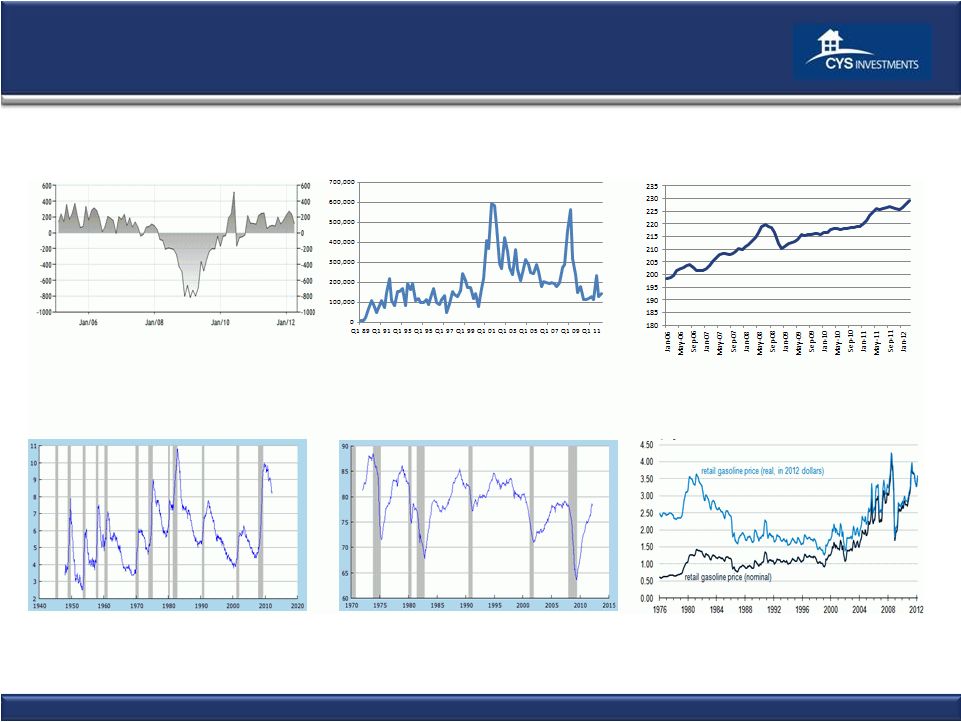 Source: S&P, Fiserv, and Macromarkets LLC / Haver Analytics, BLS, Challenger,
Gray & Christmas, US Dept. of Energy, NYMEX U.S. Retail Gasoline Price, Regular
Grade 1976 –
Present
Capacity Utilization: Manufacturing
1972 –
Present
%
Civilian Unemployment Rate
1947 -
present
%
Economic Recovery Below Normal Pace
CPI-U All Items, Core
2006 –
Present
% Change -
Year to Year
Total Nonfarm Private Payroll Employment
2005-present
000’s
Challenger, Gray & Christmas, Inc.
Job Cut Announcement Report
1/2007 –
3/2012, by Quarter
9 |
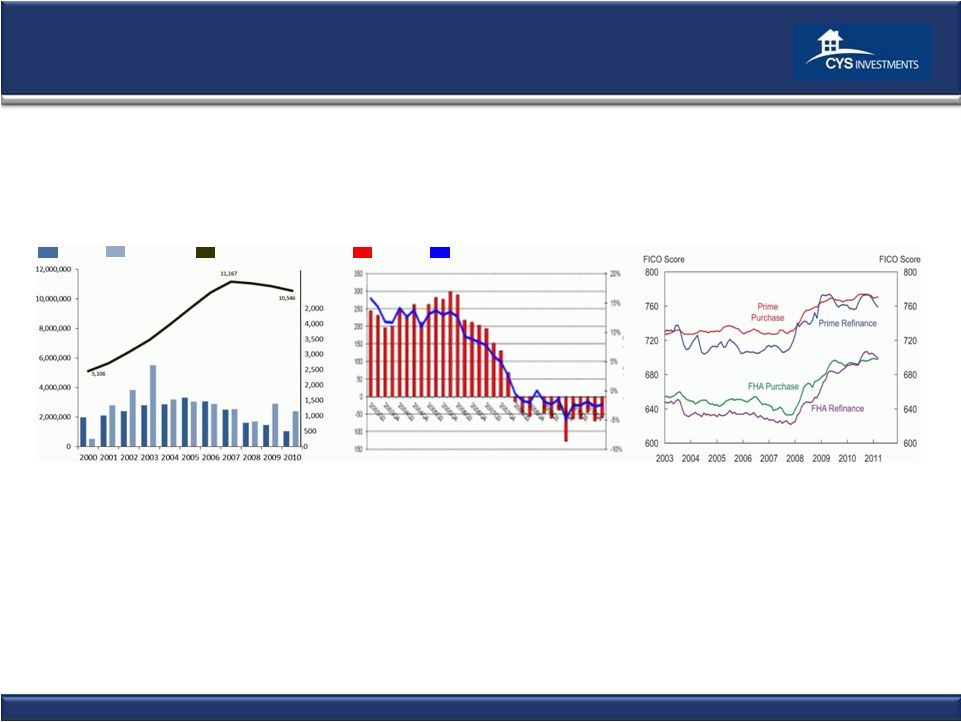 Mortgage
Market Shrinkage Likely to Continue Residential Mortgage Debt Decline Driven By:
1.
Declining home prices
2.
Delevering Consumers/Homeowners
3.
Psychology of lower leverage
4.
Low volume of new and existing home sales
5.
All-cash home purchase transactions, and higher downpayments
6.
Scheduled principal payments
7.
High percentage of cash-in refis versus cash-out refis.
Quarterly Growth in
Residential Mortgage Debt
Q2 2003 –
Q4 2010
Growth
Net Issuance
Home Mortgage Originations
2000 -
2010
In billions
Refinance
Purchase
Home Mortgage Debt
Outstanding
2000 -
2010
In millions
Total Home Mortgage Debt
Median Credit Score at
Mortgage Origination
2003-2012
Source: BLS, LPS Applied Analytics, Financial Stability Oversight Council 2011 Annual
Report 10 |
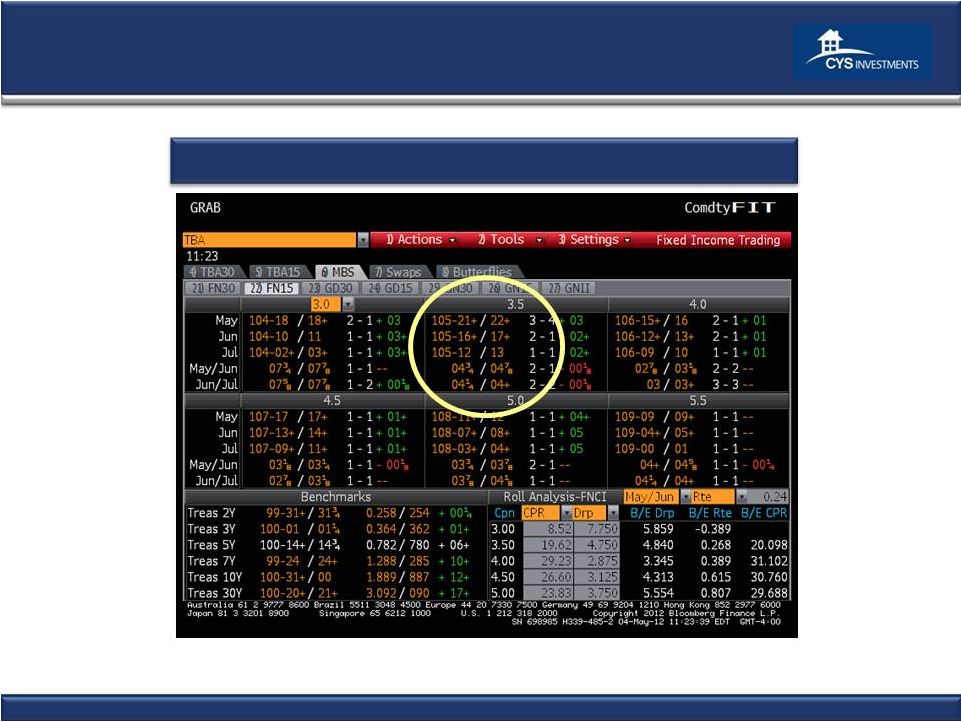 11
11
Economics of Forward Purchase
Example:
15
yr.
3½%
drop
=
~4
3/4
/32
pt.
per
month
1
Source: Bloomberg 05/04/12
1
4
3/4
/32 represents a discount to the purchase price of the security of approximately $0.30 per month from
trade date to settlement date. |
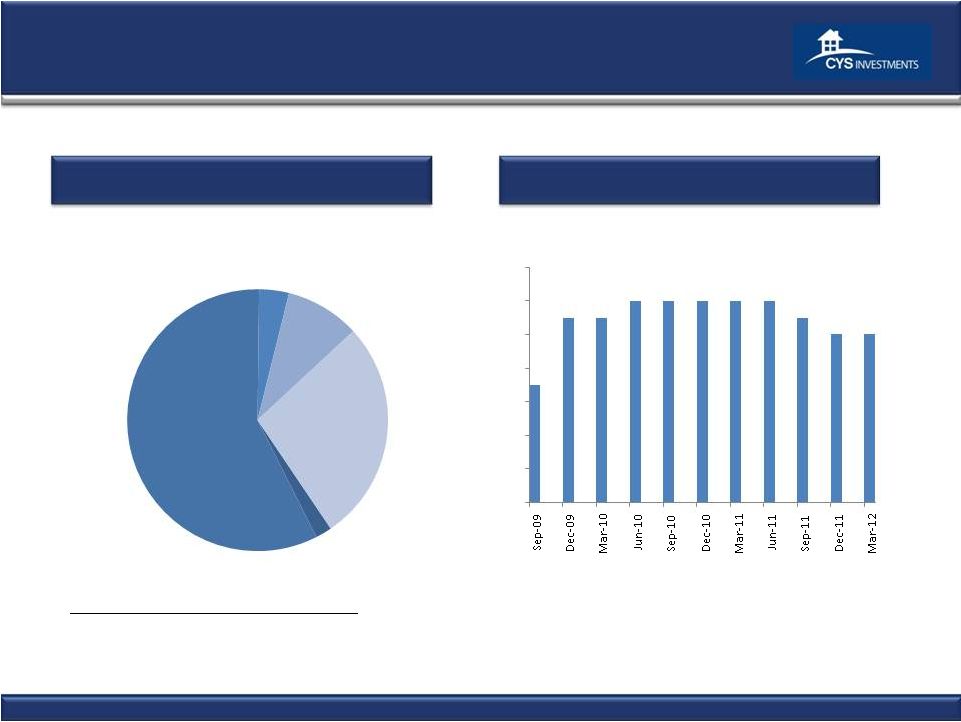 Portfolio Composition and Results
CYS Agency RMBS Portfolio
1
As of 3/31/12
15 Year Fixed
Total Agency RMBS: $13,307.4 million
30 Year
Fixed Rate,
9%
Hybrid ARMs,
27%
Rate, 58%
10 Year Fixed
Rate, 2%
20 Year Fixed
Rate, 4%
0.00
0.10
0.20
0.30
0.40
0.50
0.60
0.70
0.35
0.55
0.55
0.60
0.60
0.60
0.60
0.60
0.55
0.50
0.50
12
1
CYS Dividends: 9/09 –
4/12 |
 Portfolio Characteristics
* As of 3/31/11
13
CYS Agency RMBS Portfolio Characteristics*
(1)
MTR, or “Months to Reset,” is the number of months remaining before the fixed rate on a
hybrid ARM becomes a variable rate. At the end of the fixed period, the variable rate
will be determined by the margin and the pre-specified caps of the ARM. After the fixed period, the interest rates on
100% of our hybrid ARMs reset annually. (2) CPR, or
“Constant Prepayment Rate,” is a method of expressing the prepayment rate for a mortgage pool that assumes that a constant fraction of
the remaining principal is prepaid each month or year. Specifically, the CPR is an annualized version
of the prior three month prepayment rate. Securities with no prepayment history are
excluded from this calculation.
(3) Weighted average months to reset of our hybrid ARM
portfolio.
Par Value
Fair Value
Asset Type
Cost/Par
Fair
Value/Par
MTR
(1)
Coupon
CPR
(2)
10 Year Fixed Rate
$256,373
$269,227
$103.88
$105.01
N/A
3.50%
13.8%
15 Year Fixed Rate
7,306,193
7,666,261
103.05
104.93
N/A
3.54%
14.8%
20 Year Fixed Rate
460,938
489,662
102.36
106.23
N/A
4.16%
21.8%
30 Year Fixed Rate
1,132,244
1,225,193
106.90
108.21
N/A
5.09%
26.5%
Hybrid ARMs
3,493,632
3,657,100
102.54
104.68
65.9
3.19%
20.1%
Total/Weighted Average
$ 12,649,380
$13,307,443
$103.24
$ 105.20
65.9
(3)
3.61%
17.3%
Weighted Average
(in thousands) |
 History
of Transparent and Consistent Financial Reporting
CYS uses Financial Reporting for Investment Companies
CYS
financial
reporting
-
Best
in
Class
Schedule of investments
NAVs have reflected mark-to-market accounting since inception
No OCI account on balance sheet
Realized and unrealized losses taken through income statement
Losses expensed in period incurred
14 |
 15
Historical Financials
3/31/2012
12/31/2011
Income Statement Data (in 000's)
Investment Income – Interest Income
$65,369
$61,631
Total expenses
11,972
10,510
Net Investment Income
53,397
51,121
Net gain (loss) from investments
33,150
(8,587)
Net gain (loss) from swap and cap contracts
(17,429)
1,559
Net Income
$69,118
$44,093
Net Income Per Common Share (diluted)
$0.66
$0.53
Distributions per Common Share
$0.50
$0.50
Non-GAAP Measure (in 000's)
Core Earnings
(1)
$41,891
$37,836
Non-GAAP Reconciliation (in 000's)
NET INCOME
$69,118
$44,093
Net (gain) loss from investments
(33,150)
8,587
Net (gain) loss on termination of swap contracts
--
1,411
Net unrealized (appreciation) depreciation on swap
and cap contracts
5,923
(16,255)
Core Earnings
$41,891
$37,836
Key Portfolio Statistics*
Average yield on Agency RMBS
(2)
2.78%
2.81%
Average cost of funds and hedge
(3)
0.90%
1.01%
Interest rate spread net of hedge
(4)
1.88%
1.80%
Operating expense ratio
(5)
1.46%
1.53%
Leverage ratio (at period end)
(6)
7.7:1
7.7:1
Balance Sheet Data (in 000's)
3/31/2012
12/31/2011
Cash and Cash Equivalents
$10,643
$11,508
Total Assets
$13,555,905
$9,518,057
Repurchase Agreements
$8,234,669
$7,880,814
Net assets
$1,525,792
$1,077,458
Net assets per common share
$13.14
$13.02
Three Months Ended
As of
(1) Core Earnings is defined as net income (loss) excluding net gain (loss) on investments, net
realized gain (loss) on termination of swap contracts and unrealized appreciation (depreciation) on swap and cap contracts.
(2) Our average yield on Agency RMBS for the period was calculated by dividing our interest income
from Agency RMBS by our average Agency RMBS.
(3) Our average cost of funds and hedge for the period was calculated by dividing our total interest
expense, including our net swap and cap interest income (expense), by our average repurchase agreements.
(4) Our interest rate spread net of hedge for the period was calculated by subtracting our average
cost of funds and hedge from our average yield on Agency RMBS.
(5) Our operating expense ratio is calculated by dividing operating expenses by average net
assets.
(6) Our leverage ratio was calculated by dividing (i) the Company’s repurchase agreements balance
plus payable for securities purchased minus receivable for securities sold by (ii) net assets.
* All percentages are annualized.
|
 Financial Highlights
Steep yield curve and attractive spreads in target assets
Tailwinds likely to continue
Fed Transparency very helpful
Investment Company accounting provides transparency
16 |
 UBS
Global Financial Services Conference May 8, 2012
Investment Outlook
May 2012 |