Attached files
| file | filename |
|---|---|
| 8-K - FORM 8-K - LegacyTexas Financial Group, Inc. | d348389d8k.htm |
Exhibit 99.1

| 1 Kevin Hanigan - President and Chief Executive Officer Patti McKee - Executive Vice President and Chief Financial Officer Mark Hord - Executive Vice President and General Counsel NASDAQ: VPFG |
| 2 Safe Harbor Statement When used in filings by the Company with the Securities and Exchange Commission (the "SEC") in the Company's press releases or other public or shareholder communications, and in oral statements made with the approval of an authorized executive officer, the words or phrases "will likely result," "are expected to," "will continue," "is anticipated," "estimate," "project," "intends" or similar expressions are intended to identify "forward- looking statements" within the meaning of the Private Securities Litigation Reform Act of 1995. Such statements are subject to certain risks and uncertainties, including, among other things: changes in economic conditions; legislative changes; changes in policies by regulatory agencies; fluctuations in interest rates; the risks of lending and investing activities, including changes in the level and direction of loan delinquencies and write-offs and changes in estimates of the adequacy of the allowance for loan losses; the Company's ability to access cost- effective funding; fluctuations in real estate values and both residential and commercial real estate market conditions; demand for loans and deposits in the Company's market area; the industry-wide decline in mortgage production; competition; changes in management's business strategies; our ability to successfully integrate any assets, liabilities, customers, systems and management personnel we have acquired or may acquire into our operations and our ability to realize related revenue synergies and cost savings within expected time frames and any goodwill charges related thereto; and other factors set forth under Risk Factors in the Company's Form 10-K that could cause actual results to differ materially from historical earnings and those presently anticipated or projected. The factors listed above could materially affect the Company's financial performance and could cause the Company's actual results for future periods to differ materially from any opinions or statements expressed with respect to future periods in any current statements. The Company does not undertake- and specifically declines any obligation-to publicly release the result of any revisions that may be made to any forward-looking statements to reflect events or circumstances occurring after the date of such statements. |
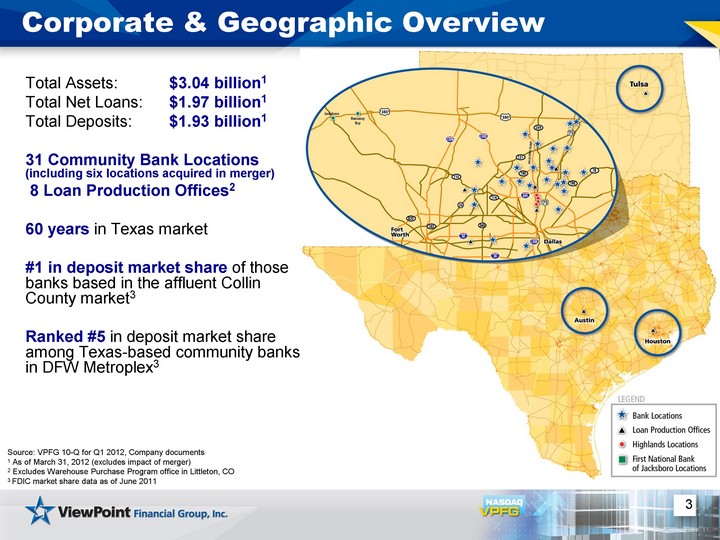
| 3 Corporate & Geographic Overview Total Assets: $3.04 billion1 Total Net Loans: $1.97 billion1 Total Deposits: $1.93 billion1 31 Community Bank Locations (including six locations acquired in merger) 8 Loan Production Offices2 60 years in Texas market #1 in deposit market share of those banks based in the affluent Collin County market3 Ranked #5 in deposit market share among Texas-based community banks in DFW Metroplex3 Source: VPFG 10-Q for Q1 2012, Company documents 1 As of March 31, 2012 (excludes impact of merger) 2 Excludes Warehouse Purchase Program office in Littleton, CO 3 FDIC market share data as of June 2011 |
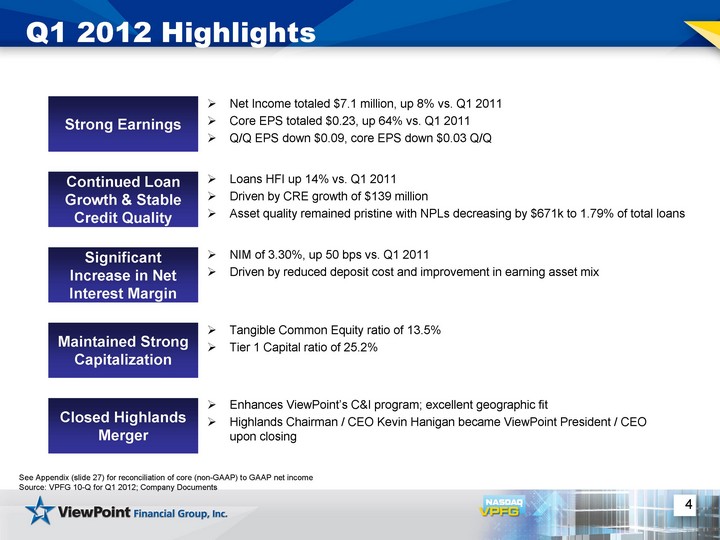
| 4 Q1 2012 Highlights Net Income totaled $7.1 million, up 8% vs. Q1 2011 Core EPS totaled $0.23, up 64% vs. Q1 2011 Q/Q EPS down $0.09, core EPS down $0.03 Q/Q Strong Earnings Continued Loan Growth & Stable Credit Quality Loans HFI up 14% vs. Q1 2011 Driven by CRE growth of $139 million Asset quality remained pristine with NPLs decreasing by $671k to 1.79% of total loans Significant Increase in Net Interest Margin NIM of 3.30%, up 50 bps vs. Q1 2011 Driven by reduced deposit cost and improvement in earning asset mix Closed Highlands Merger Enhances ViewPoint's C&I program; excellent geographic fit Highlands Chairman / CEO Kevin Hanigan became ViewPoint President / CEO upon closing Maintained Strong Capitalization Tangible Common Equity ratio of 13.5% Tier 1 Capital ratio of 25.2% See Appendix (slide 27) for reconciliation of core (non-GAAP) to GAAP net income Source: VPFG 10-Q for Q1 2012; Company Documents |
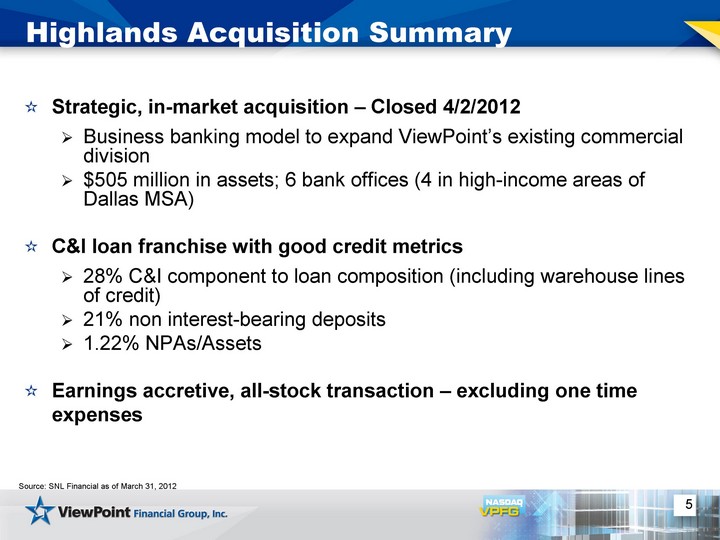
| Highlands Acquisition Summary Strategic, in-market acquisition - Closed 4/2/2012 Business banking model to expand ViewPoint's existing commercial division $505 million in assets; 6 bank offices (4 in high-income areas of Dallas MSA) C&I loan franchise with good credit metrics 28% C&I component to loan composition (including warehouse lines of credit) 21% non interest-bearing deposits 1.22% NPAs/Assets Earnings accretive, all-stock transaction - excluding one time expenses Source: SNL Financial as of March 31, 2012 5 |
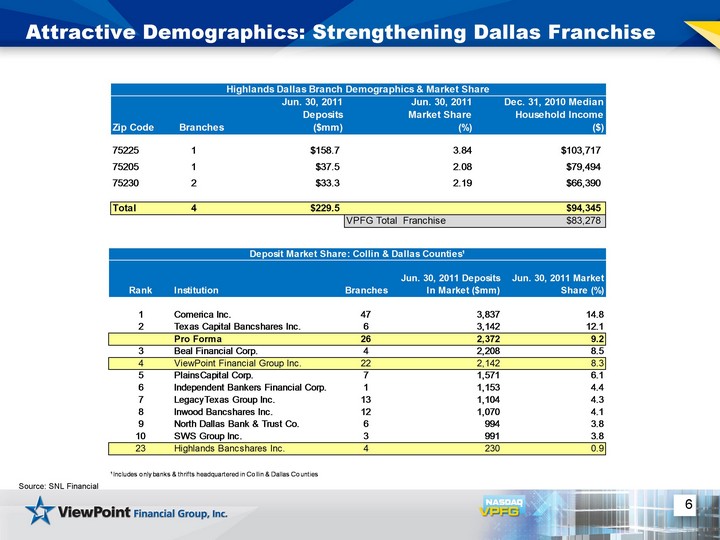
| 6 Attractive Demographics: Strengthening Dallas Franchise Source: SNL Financial |
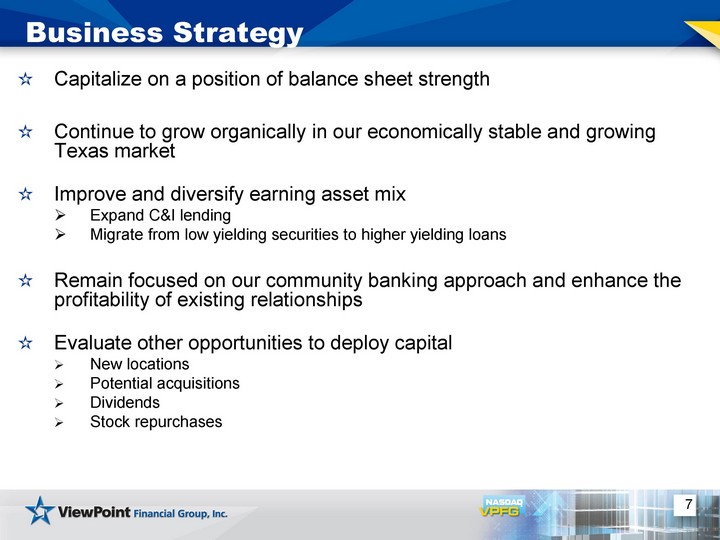
| 7 Capitalize on a position of balance sheet strength Continue to grow organically in our economically stable and growing Texas market Improve and diversify earning asset mix Expand C&I lending Migrate from low yielding securities to higher yielding loans Remain focused on our community banking approach and enhance the profitability of existing relationships Evaluate other opportunities to deploy capital New locations Potential acquisitions Dividends Stock repurchases Business Strategy |
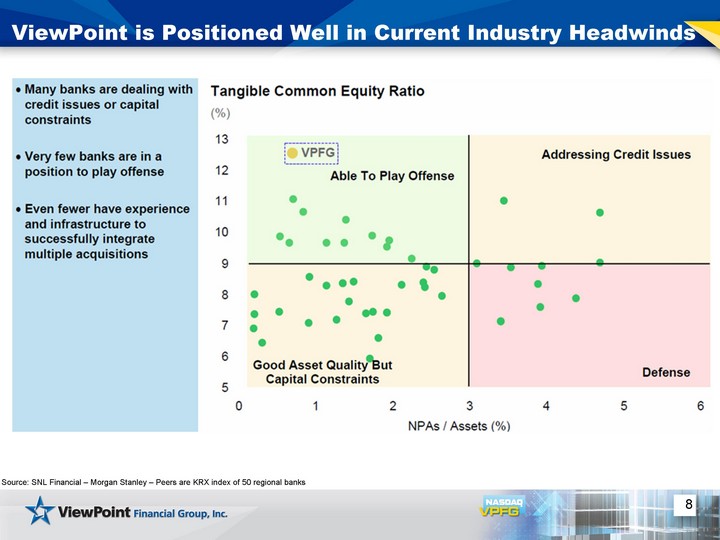
| 8 ViewPoint is Positioned Well in Current Industry Headwinds Source: SNL Financial - Morgan Stanley - Peers are KRX index of 50 regional banks |
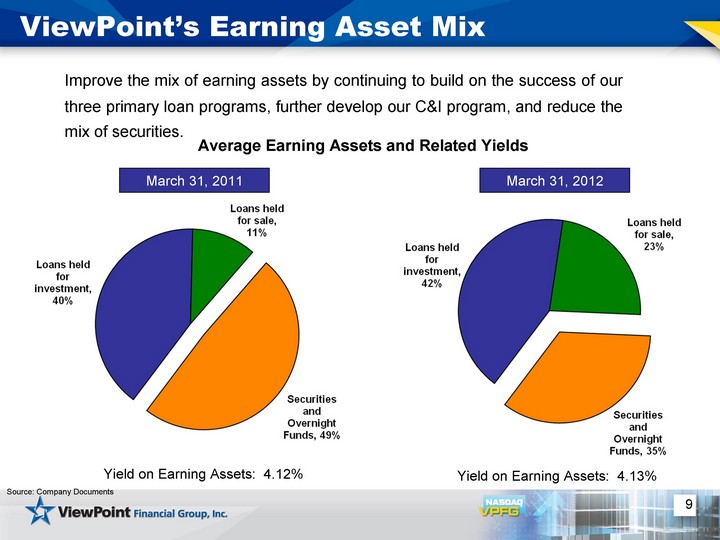
| Improve the mix of earning assets by continuing to build on the success of our three primary loan programs, further develop our C&I program, and reduce the mix of securities. 9 ViewPoint's Earning Asset Mix Source: Company Documents Average Earning Assets and Related Yields March 31, 2011 March 31, 2012 Yield on Earning Assets: 4.12% Yield on Earning Assets: 4.13% |
| 10 The Highlands acquisition accelerated ViewPoint's transition to a commercial banking model Commercial banking CEO Team of commercial lenders Shift loan portfolio away from real estate centric lending Emphasis on C&I lending with a goal to transition to balanced loan book Continued emphasis on low-cost, core deposits Commercial Bank Transformation |
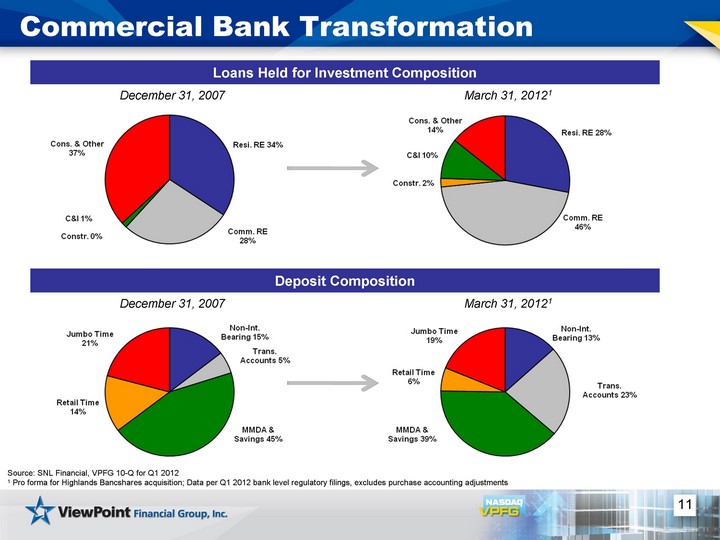
| 11 Commercial Bank Transformation Loans Held for Investment Composition Source: SNL Financial, VPFG 10-Q for Q1 2012 1 Pro forma for Highlands Bancshares acquisition; Data per Q1 2012 bank level regulatory filings, excludes purchase accounting adjustments December 31, 2007 Deposit Composition March 31, 20121 March 31, 20121 December 31, 2007 |
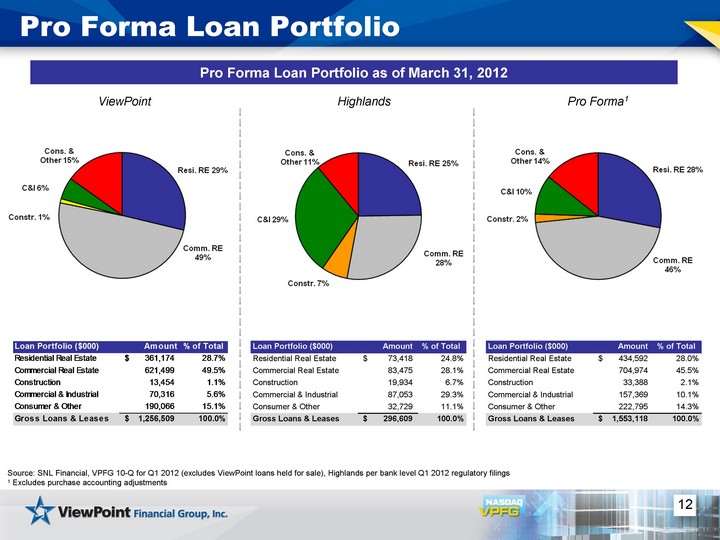
| 12 Pro Forma Loan Portfolio Pro Forma Loan Portfolio as of March 31, 2012 Source: SNL Financial, VPFG 10-Q for Q1 2012 (excludes ViewPoint loans held for sale), Highlands per bank level Q1 2012 regulatory filings 1 Excludes purchase accounting adjustments ViewPoint Pro Forma1 Highlands Loan Portfolio ($000) Amount % of Total Residential Real Estate 73,418 $ 24.8% Commercial Real Estate 83,475 28.1% Construction 19,934 6.7% Commercial & Industrial 87,053 29.3% Consumer & Other 32,729 11.1% Gross Loans & Leases 296,609 $ 100.0% Loan Portfolio ($000) Amount % of Total Residential Real Estate 434,592 $ 28.0% Commercial Real Estate 704,974 45.5% Construction 33,388 2.1% Commercial & Industrial 157,369 10.1% Consumer & Other 222,795 14.3% Gross Loans & Leases 1,553,118 $ 100.0% |
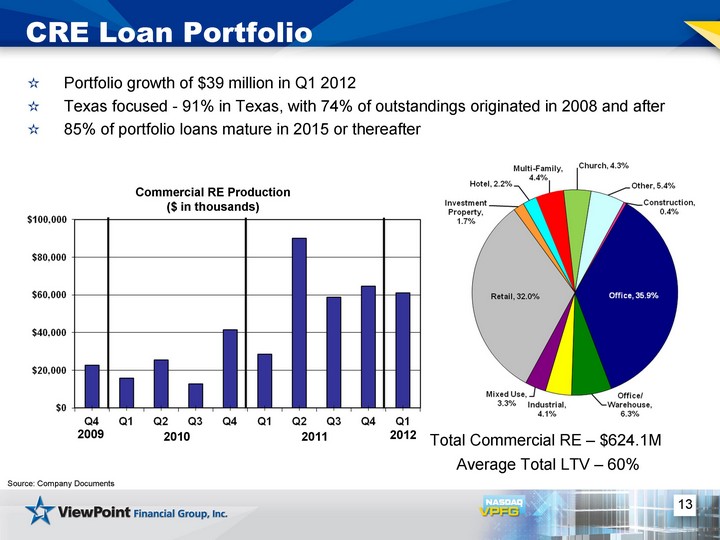
| 13 CRE Loan Portfolio Total Commercial RE - $624.1M Average Total LTV - 60% Source: Company Documents Commercial RE Production ($ in thousands) Portfolio growth of $39 million in Q1 2012 Texas focused - 91% in Texas, with 74% of outstandings originated in 2008 and after 85% of portfolio loans mature in 2015 or thereafter 2009 2010 2011 2012 |
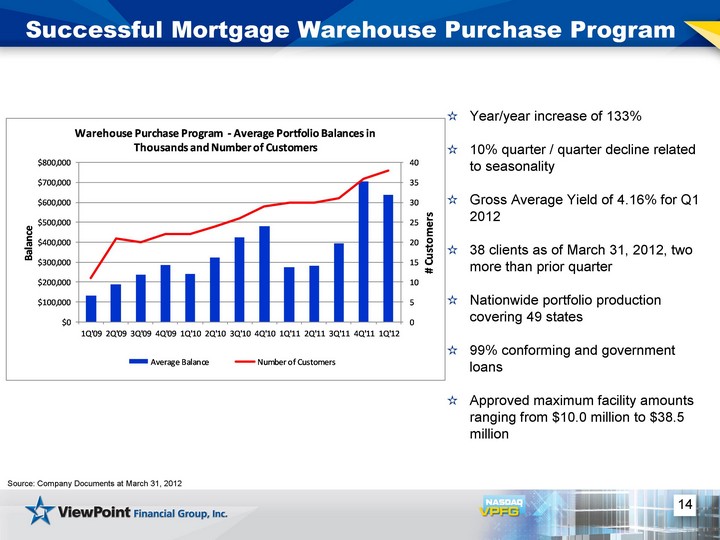
| 14 Successful Mortgage Warehouse Purchase Program Source: Company Documents at March 31, 2012 Year/year increase of 133% 10% quarter / quarter decline related to seasonality Gross Average Yield of 4.16% for Q1 2012 38 clients as of March 31, 2012, two more than prior quarter Nationwide portfolio production covering 49 states 99% conforming and government loans Approved maximum facility amounts ranging from $10.0 million to $38.5 million |
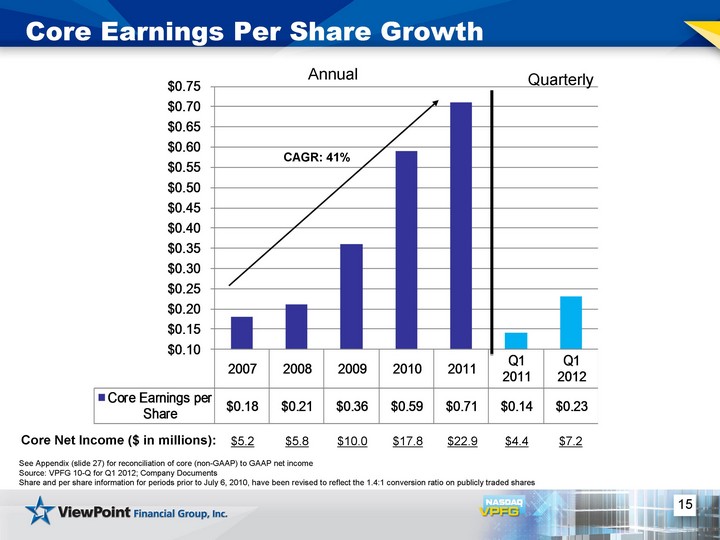
| 15 Core Earnings Per Share Growth CAGR: 41% See Appendix (slide 27) for reconciliation of core (non-GAAP) to GAAP net income Source: VPFG 10-Q for Q1 2012; Company Documents Share and per share information for periods prior to July 6, 2010, have been revised to reflect the 1.4:1 conversion ratio on publicly traded shares Annual Quarterly $5.2 Core Net Income ($ in millions): $5.8 $10.0 $17.8 $22.9 $4.4 $7.2 |
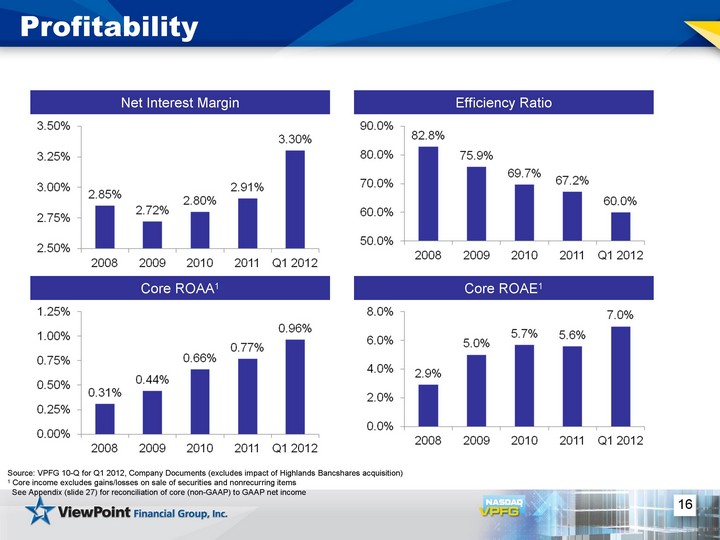
| 16 Profitability Net Interest Margin Source: VPFG 10-Q for Q1 2012, Company Documents (excludes impact of Highlands Bancshares acquisition) 1 Core income excludes gains/losses on sale of securities and nonrecurring items See Appendix (slide 27) for reconciliation of core (non-GAAP) to GAAP net income Efficiency Ratio Core ROAA1 Core ROAE1 |
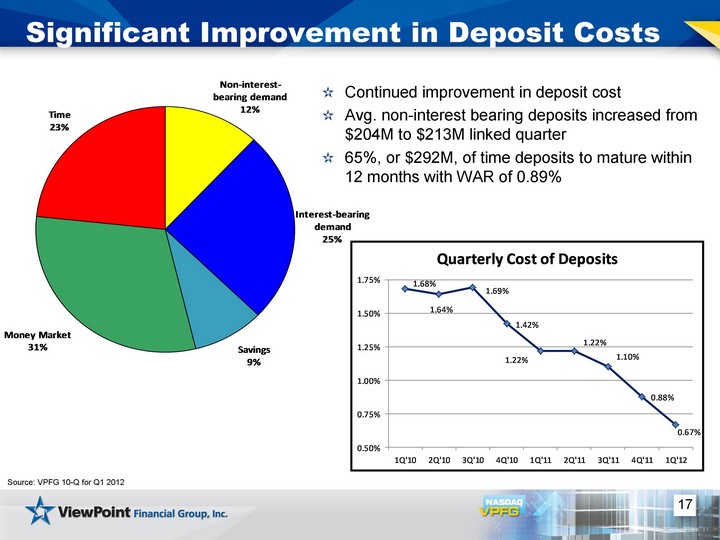
| 17 Significant Improvement in Deposit Costs Source: VPFG 10-Q for Q1 2012 Continued improvement in deposit cost Avg. non-interest bearing deposits increased from $204M to $213M linked quarter 65%, or $292M, of time deposits to mature within 12 months with WAR of 0.89% |
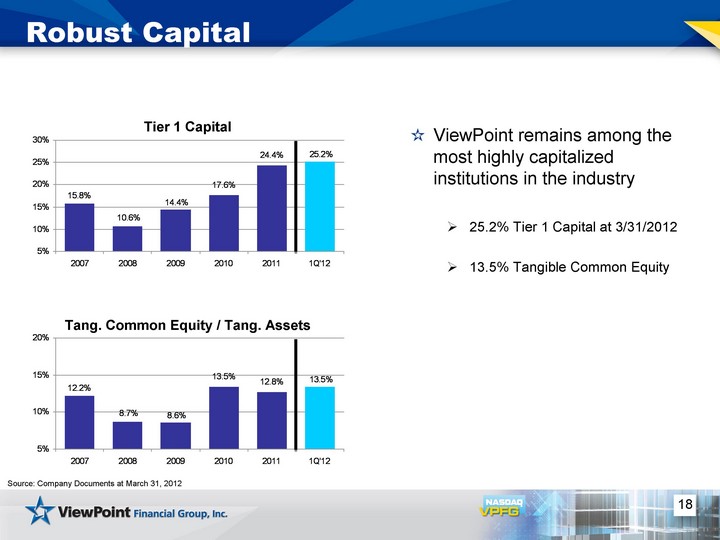
| Series 1 2007 0.1223 2008 0.0873 2009 0.086 2010 0.1345 2011 0.1275 1Q'12 0.1345 Series 1 2007 0.1579 2008 0.1058 2009 0.1439 2010 0.1761 2011 0.244 1Q'12 0.2522 18 Robust Capital Tier 1 Capital Tang. Common Equity / Tang. Assets ViewPoint remains among the most highly capitalized institutions in the industry 25.2% Tier 1 Capital at 3/31/2012 13.5% Tangible Common Equity Source: Company Documents at March 31, 2012 |
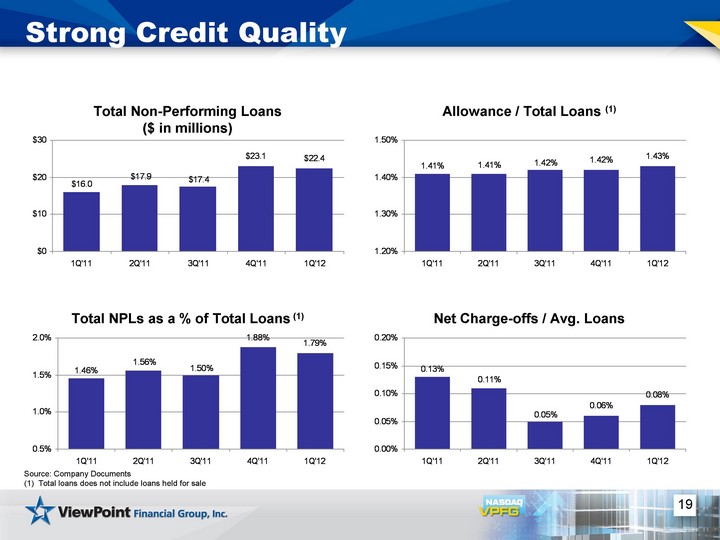
| 19 Strong Credit Quality Series 1 1Q'11 16.03 2Q'11 17.866 3Q'11 17.439 4Q'11 23.098 1Q'12 22.427 Total Non-Performing Loans ($ in millions) Series 1 1Q'11 0.0146 2Q'11 0.0156 3Q'11 0.015 4Q'11 0.0188 1Q'12 0.0179 Total NPLs as a % of Total Loans (1) Series 1 1Q'11 0.0141 2Q'11 0.0141 3Q'11 0.0142 4Q'11 0.0142 1Q'12 0.0143 Allowance / Total Loans (1) Series 1 1Q'11 0.0013 2Q'11 0.0011 3Q'11 0.0005 4Q'11 0.0006 1Q'12 0.0008 Net Charge-offs / Avg. Loans Source: Company Documents (1) Total loans does not include loans held for sale |
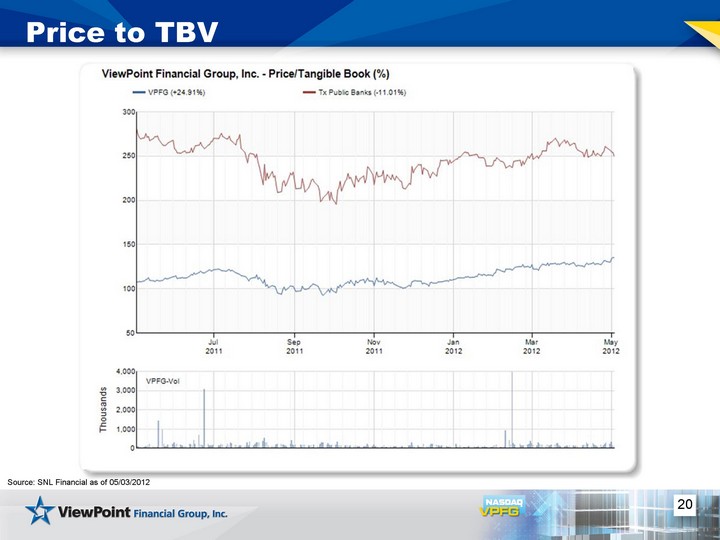
| 20 Price to TBV Source: SNL Financial as of 05/03/2012 |
| 21 Investment Highlights Positive earnings growth trends One of the largest independent community banking franchises in the highly attractive Texas market Strong credit metrics and positive asset quality compared to peers reflecting disciplined underwriting standards Well-capitalized and able to deploy capital Price to TBV favorable compared to Texas peers |
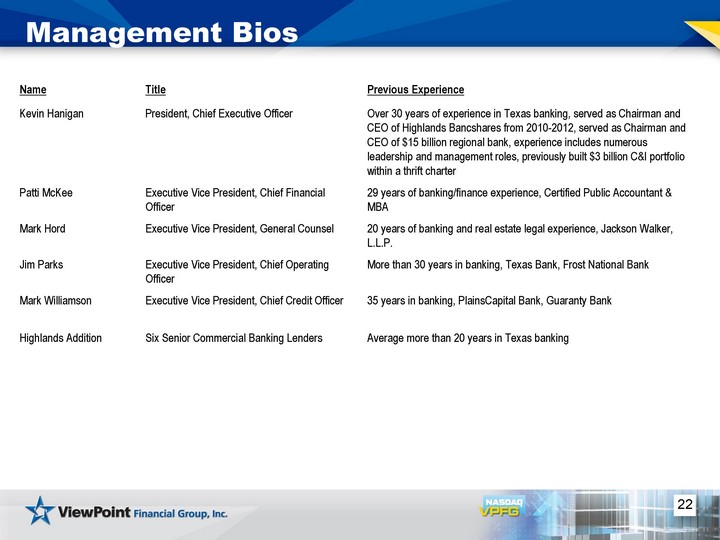
| 22 Management Bios Name Title Previous Experience Kevin Hanigan President, Chief Executive Officer Over 30 years of experience in Texas banking, served as Chairman and CEO of Highlands Bancshares from 2010-2012, served as Chairman and CEO of $15 billion regional bank, experience includes numerous leadership and management roles, previously built $3 billion C&I portfolio within a thrift charter Patti McKee Executive Vice President, Chief Financial Officer 29 years of banking/finance experience, Certified Public Accountant & MBA Mark Hord Executive Vice President, General Counsel 20 years of banking and real estate legal experience, Jackson Walker, L.L.P. Jim Parks Executive Vice President, Chief Operating Officer More than 30 years in banking, Texas Bank, Frost National Bank Mark Williamson Executive Vice President, Chief Credit Officer 35 years in banking, PlainsCapital Bank, Guaranty Bank Highlands Addition Six Senior Commercial Banking Lenders Average more than 20 years in Texas banking |

| 23 Questions? |
| 24 Appendix |
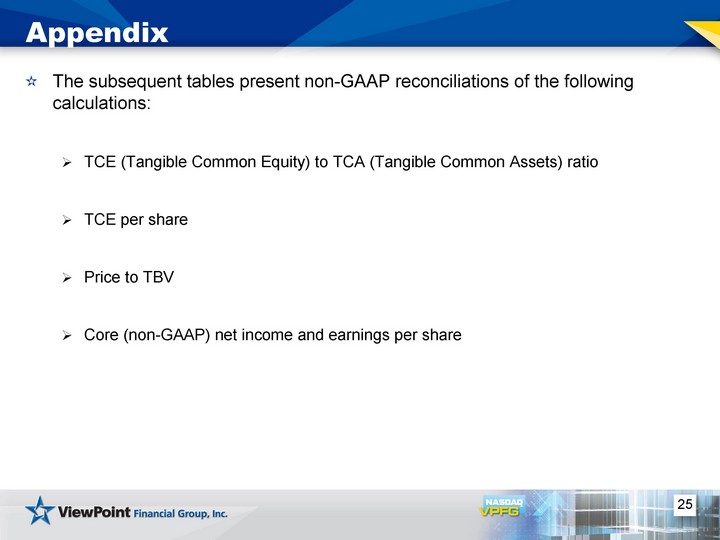
| 25 Appendix The subsequent tables present non-GAAP reconciliations of the following calculations: TCE (Tangible Common Equity) to TCA (Tangible Common Assets) ratio TCE per share Price to TBV Core (non-GAAP) net income and earnings per share |
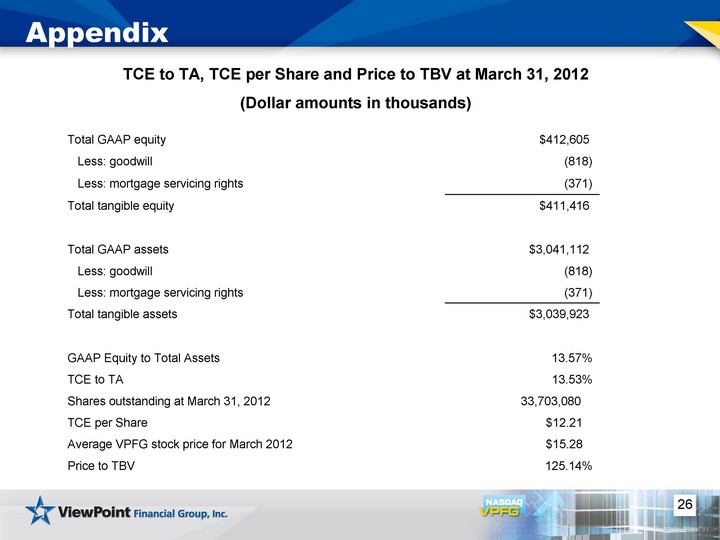
| 26 Appendix TCE to TA, TCE per Share and Price to TBV at March 31, 2012 (Dollar amounts in thousands) Total GAAP equity $412,605 Less: goodwill (818) Less: mortgage servicing rights (371) Total tangible equity $411,416 Total GAAP assets $3,041,112 Less: goodwill (818) Less: mortgage servicing rights (371) Total tangible assets $3,039,923 GAAP Equity to Total Assets 13.57% TCE to TA 13.53% Shares outstanding at March 31, 2012 33,703,080 TCE per Share $12.21 Average VPFG stock price for March 2012 $15.28 Price to TBV 125.14% |
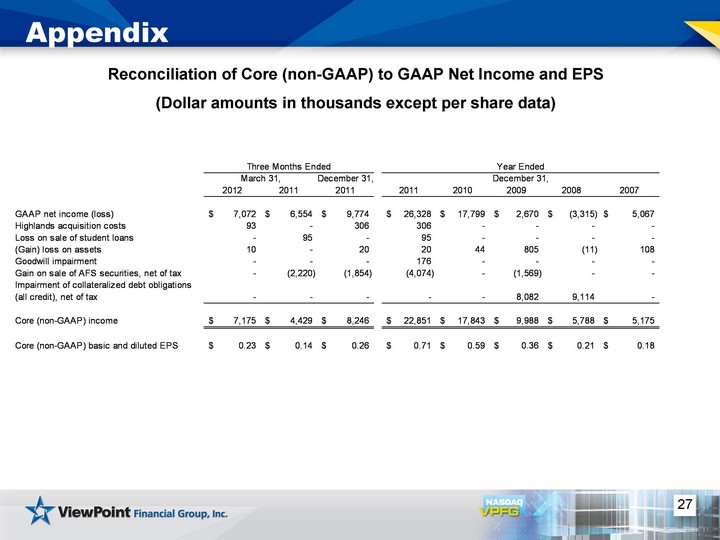
| 27 Appendix Reconciliation of Core (non-GAAP) to GAAP Net Income and EPS (Dollar amounts in thousands except per share data) |
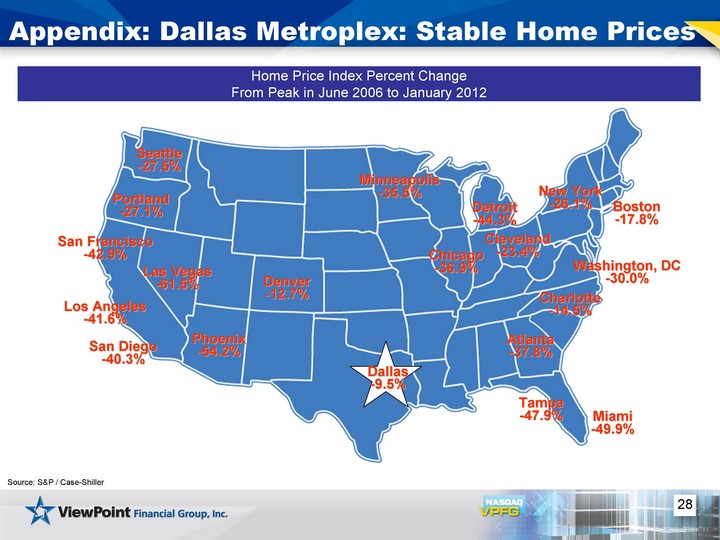
| 28 Seattle -27.5% San Francisco -42.9% Los Angeles -41.6% San Diego -40.3% Phoenix -54.2% Las Vegas -61.5% Denver -12.7% Minneapolis -35.5% Chicago -36.9% Detroit -44.3% Cleveland -23.4% Boston -17.8% New York -26.1% Washington, DC -30.0% Charlotte -14.5% Atlanta -37.8% Tampa -47.9% Miami -49.9% Portland -27.1% Dallas -9.5% Appendix: Dallas Metroplex: Stable Home Prices Home Price Index Percent Change From Peak in June 2006 to January 2012 Source: S&P / Case-Shiller |
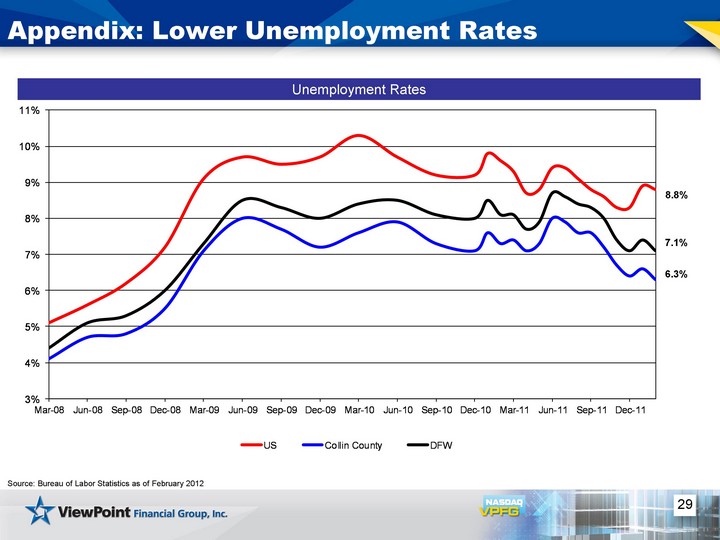
| 29 Appendix: Lower Unemployment Rates Unemployment Rates Source: Bureau of Labor Statistics as of February 2012 8.8% 7.1% 6.3% |