Attached files
| file | filename |
|---|---|
| 8-K - FORM 8-K - LegacyTexas Financial Group, Inc. | d341659d8k.htm |
| EX-99.1 - EX-99.1 - LegacyTexas Financial Group, Inc. | d341659dex991.htm |
Exhibit 99.2

| 1 NASDAQ: VPFG First Quarter 2012 Earnings Kevin Hanigan - President and Chief Executive Officer Patti McKee - Executive Vice President and Chief Financial Officer Mark Hord - Executive Vice President and General Counsel |
| 2 Safe Harbor Statement Certain matters discussed on this call may contain forward^looking statements, which are subject to risks and uncertainties. A number of factors, many of which are beyond ViewPoint Financial Group, Inc.'s control, could cause actual results to differ materially from future results expressed or implied by such forward^looking statements. These risks and uncertainties include the risk of adverse impacts from general economic conditions, competition, interest rate sensitivity and exposure to regulatory and legislative changes. These and other factors that could cause results to differ materially from those described in the forward^looking statements can be found in our annual report on Form 10^K for the year ended December 31, 2011, and in other filings made by ViewPoint Financial Group, Inc. with the Securities and Exchange Commission. |
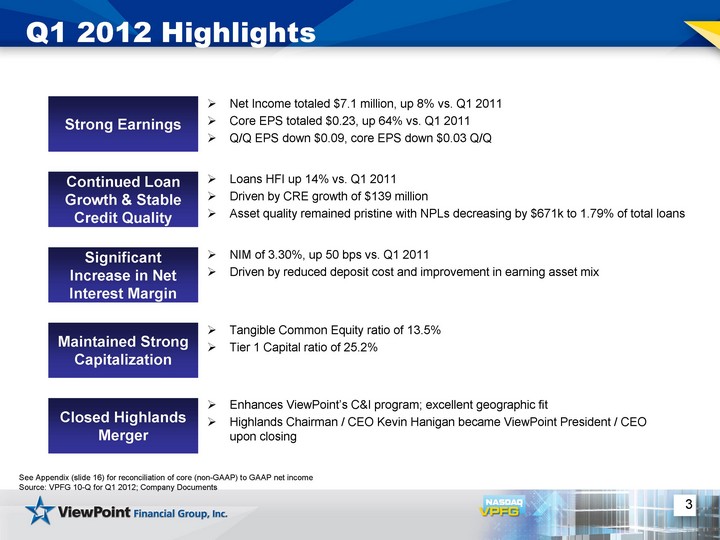
| 3 Q1 2012 Highlights Net Income totaled $7.1 million, up 8% vs. Q1 2011 Core EPS totaled $0.23, up 64% vs. Q1 2011 Q/Q EPS down $0.09, core EPS down $0.03 Q/Q Strong Earnings Continued Loan Growth & Stable Credit Quality Loans HFI up 14% vs. Q1 2011 Driven by CRE growth of $139 million Asset quality remained pristine with NPLs decreasing by $671k to 1.79% of total loans Significant Increase in Net Interest Margin NIM of 3.30%, up 50 bps vs. Q1 2011 Driven by reduced deposit cost and improvement in earning asset mix Closed Highlands Merger Enhances ViewPoint's C&I program; excellent geographic fit Highlands Chairman / CEO Kevin Hanigan became ViewPoint President / CEO upon closing Maintained Strong Capitalization Tangible Common Equity ratio of 13.5% Tier 1 Capital ratio of 25.2% See Appendix (slide 16) for reconciliation of core (non-GAAP) to GAAP net income Source: VPFG 10-Q for Q1 2012; Company Documents |
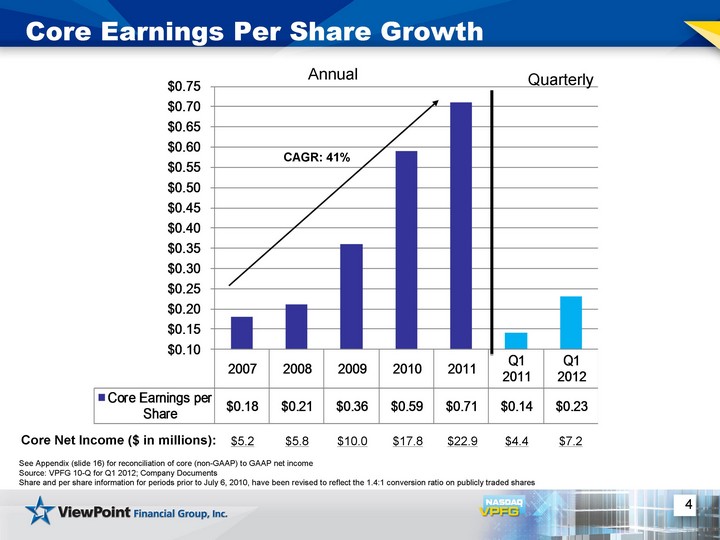
| 4 Core Earnings Per Share Growth CAGR: 41% See Appendix (slide 16) for reconciliation of core (non-GAAP) to GAAP net income Source: VPFG 10-Q for Q1 2012; Company Documents Share and per share information for periods prior to July 6, 2010, have been revised to reflect the 1.4:1 conversion ratio on publicly traded shares Annual Quarterly $5.2 Core Net Income ($ in millions): $5.8 $10.0 $17.8 $22.9 $4.4 $7.2 |
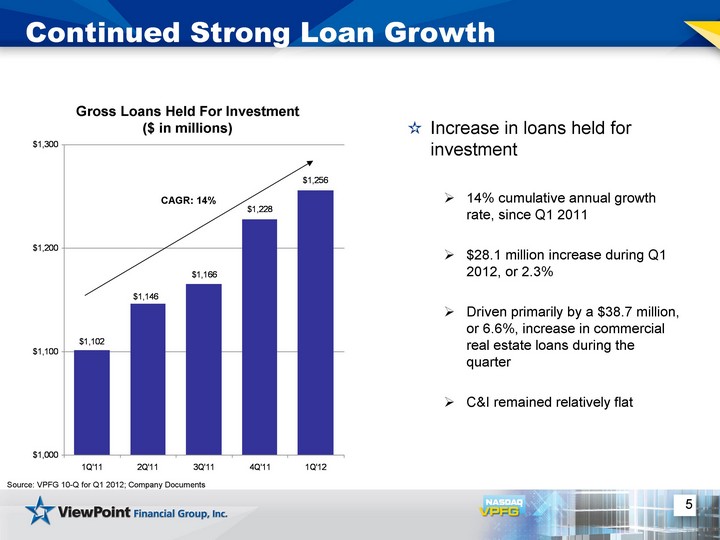
| 5 Continued Strong Loan Growth Increase in loans held for investment 14% cumulative annual growth rate, since Q1 2011 $28.1 million increase during Q1 2012, or 2.3% Driven primarily by a $38.7 million, or 6.6%, increase in commercial real estate loans during the quarter C&I remained relatively flat Series 1 1Q'11 1101.514 2Q'11 1146.19 3Q'11 1165.611 4Q'11 1228.028 1Q'12 1256.113 Gross Loans Held For Investment ($ in millions) CAGR: 14% Source: VPFG 10-Q for Q1 2012; Company Documents |
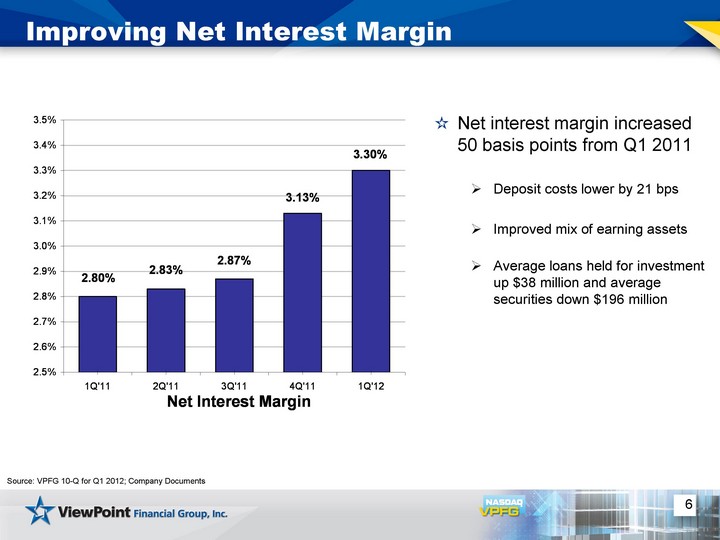
| 6 Improving Net Interest Margin Net interest margin increased 50 basis points from Q1 2011 Deposit costs lower by 21 bps Improved mix of earning assets Average loans held for investment up $38 million and average securities down $196 million Source: VPFG 10-Q for Q1 2012; Company Documents |
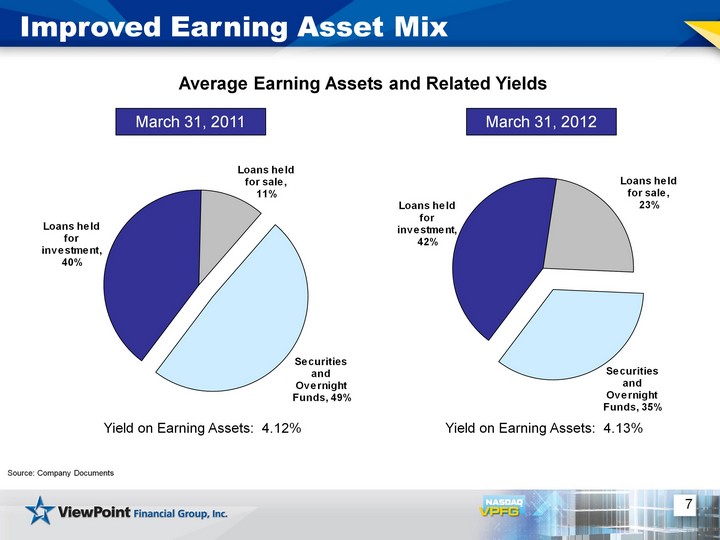
| 7 Improved Earning Asset Mix Source: Company Documents Average Earning Assets and Related Yields March 31, 2011 March 31, 2012 Yield on Earning Assets: 4.12% Yield on Earning Assets: 4.13% |
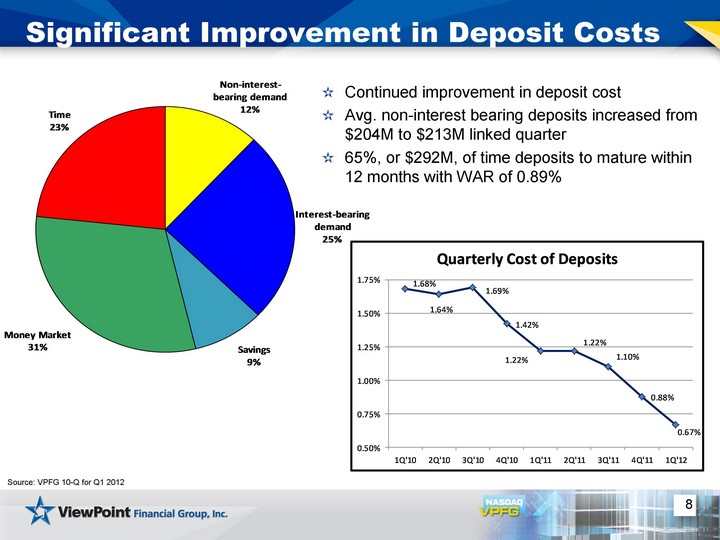
| 8 Significant Improvement in Deposit Costs Source: VPFG 10-Q for Q1 2012 Continued improvement in deposit cost Avg. non-interest bearing deposits increased from $204M to $213M linked quarter 65%, or $292M, of time deposits to mature within 12 months with WAR of 0.89% |
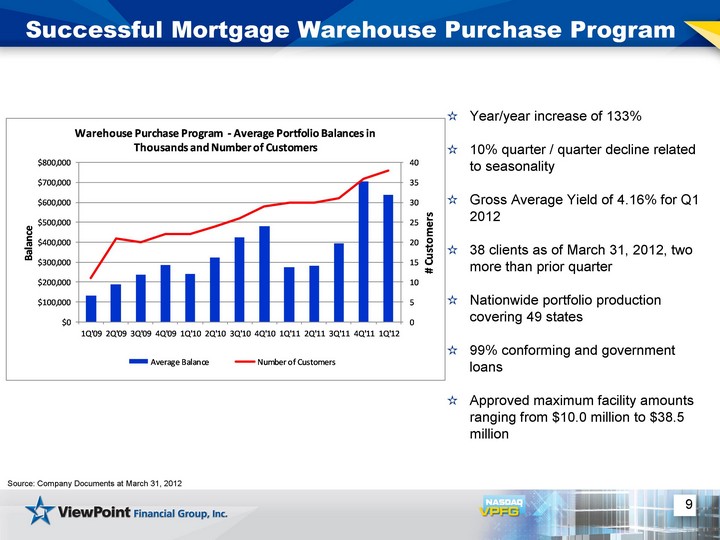
| 9 Successful Mortgage Warehouse Purchase Program Source: Company Documents at March 31, 2012 Year/year increase of 133% 10% quarter / quarter decline related to seasonality Gross Average Yield of 4.16% for Q1 2012 38 clients as of March 31, 2012, two more than prior quarter Nationwide portfolio production covering 49 states 99% conforming and government loans Approved maximum facility amounts ranging from $10.0 million to $38.5 million |
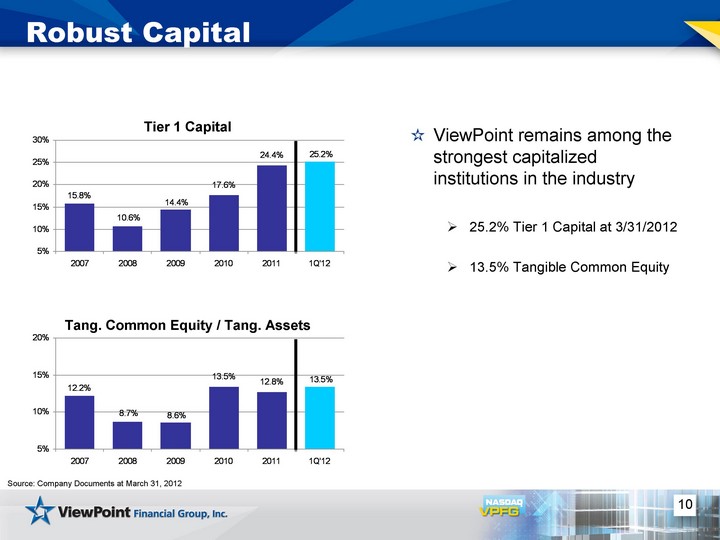
| Series 1 2007 0.1223 2008 0.0873 2009 0.086 2010 0.1345 2011 0.1275 1Q'12 0.1345 Series 1 2007 0.1579 2008 0.1058 2009 0.1439 2010 0.1761 2011 0.244 1Q'12 0.2522 10 Robust Capital Tier 1 Capital Tang. Common Equity / Tang. Assets ViewPoint remains among the strongest capitalized institutions in the industry 25.2% Tier 1 Capital at 3/31/2012 13.5% Tangible Common Equity Source: Company Documents at March 31, 2012 |
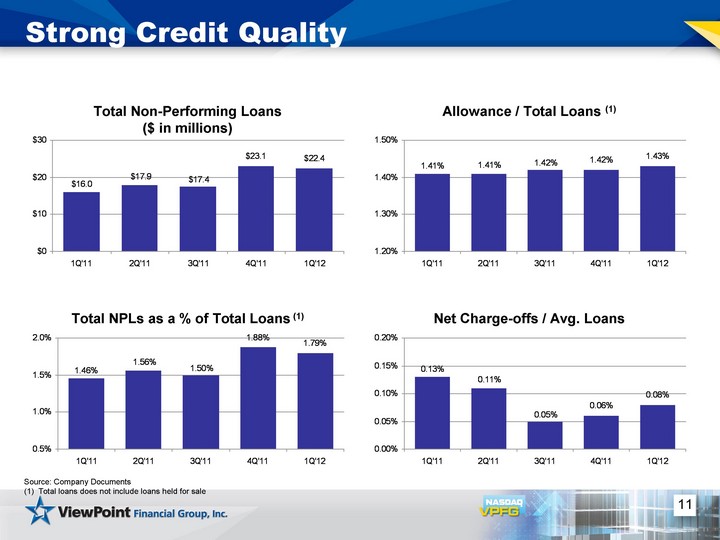
| 11 Strong Credit Quality Series 1 1Q'11 16.03 2Q'11 17.866 3Q'11 17.439 4Q'11 23.098 1Q'12 22.427 Total Non-Performing Loans ($ in millions) Series 1 1Q'11 0.0146 2Q'11 0.0156 3Q'11 0.015 4Q'11 0.0188 1Q'12 0.0179 Total NPLs as a % of Total Loans (1) Series 1 1Q'11 0.0141 2Q'11 0.0141 3Q'11 0.0142 4Q'11 0.0142 1Q'12 0.0143 Allowance / Total Loans (1) Series 1 1Q'11 0.0013 2Q'11 0.0011 3Q'11 0.0005 4Q'11 0.0006 1Q'12 0.0008 Net Charge-offs / Avg. Loans Source: Company Documents (1) Total loans does not include loans held for sale |
| 12 Current Initiatives Integration of Highlands Systems integration targeted for late July Costs savings in line with expectations Continued improvements in funding mix Build out of C&I lending business |

| 13 Questions? |
| 14 Appendix The subsequent tables present non-GAAP reconciliations of the following calculations: TCE (Tangible Common Equity) to TCA (Tangible Common Assets) ratio TCE per share Price to TBV Core (non-GAAP) net income and earnings per share |
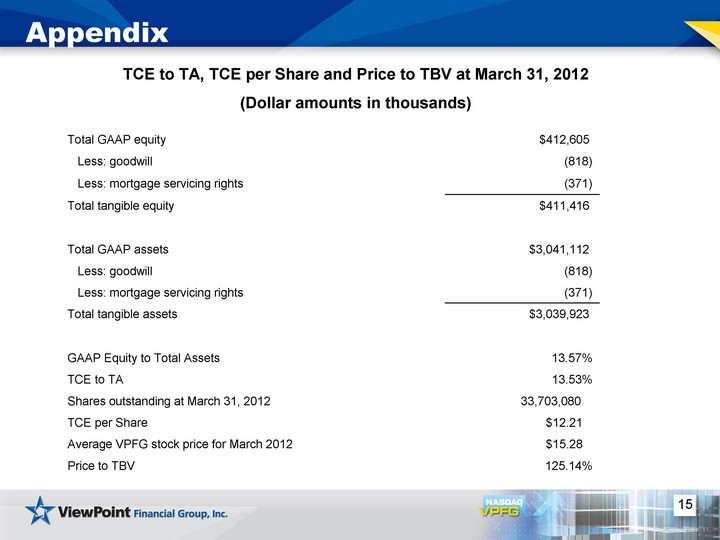
| 15 Appendix TCE to TA, TCE per Share and Price to TBV at March 31, 2012 (Dollar amounts in thousands) Total GAAP equity $412,605 Less: goodwill (818) Less: mortgage servicing rights (371) Total tangible equity $411,416 Total GAAP assets $3,041,112 Less: goodwill (818) Less: mortgage servicing rights (371) Total tangible assets $3,039,923 GAAP Equity to Total Assets 13.57% TCE to TA 13.53% Shares outstanding at March 31, 2012 33,703,080 TCE per Share $12.21 Average VPFG stock price for March 2012 $15.28 Price to TBV 125.14% |
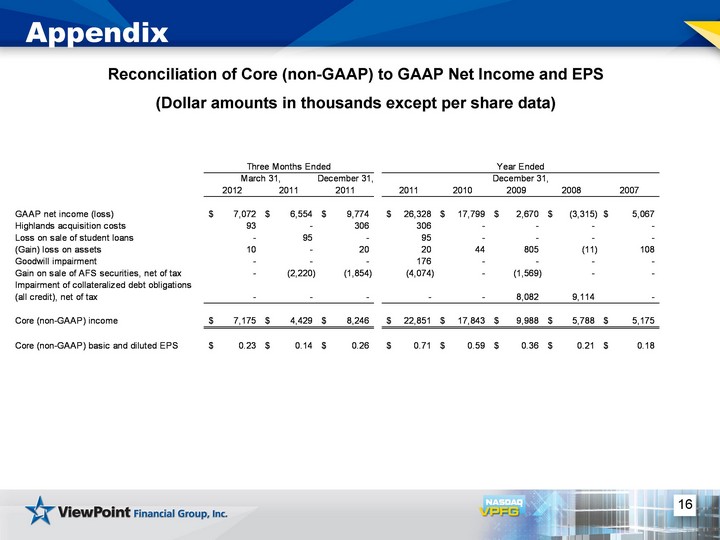
| 16 Appendix Reconciliation of Core (non-GAAP) to GAAP Net Income and EPS (Dollar amounts in thousands except per share data) |