Attached files
| file | filename |
|---|---|
| 8-K - 8-K - TCF FINANCIAL CORP | a12-10376_18k.htm |
Exhibit 99.1
|
|
TCF Financial Corporation 2012 First Quarter Investor Presentation |
|
|
Table of Contents Corporate Profile 3 Strategic Overview 4 Revenue 10 Credit Quality 15 Capital 21 Balance Sheet Growth 23 Conclusion 32 |
|
|
$17.8 billion national bank holding company headquartered in Minnesota 36th largest publicly-traded U.S. based bank holding company by asset size 434 bank branches in eight states, 26th largest U.S. branch network Five campus alliances; 5th largest in campus card banking relationships Over 660 ATMs available free to TCF customers; 208 off-site Total equity to total assets of 8.69% Tangible realized common equity of 7.36%1 Corporate Profile At March 31, 2012 1 36 7 110 26 53 196 5 Well-Diversified Loan Portfolio ($ millions) 11% 45% 23% 20% At 12/31/01 63% 25% 12% 1 See “Reconciliation of GAAP to Non-GAAP Measures – Tangible Realized Common Equity” slide 2 Quarterly Average 3 Annualized At 3/31/12 Branch Summary Leasing & Equipment Finance $957 Leasing & Equipment Finance $3,119 Inventory Finance $1,638 Consumer Real Estate and Other $6,845 Commercial Lending $3,467 Auto Finance $139 1% 48% 9% 37% 6% Savings $5,905 Checking $4,565 CDs $1,136 Money Market $662 Low-Cost Deposit Base2 At 3/31/12 ($ millions) Average interest rate on deposits: .30%3 |
|
|
Strategic Overview |

|
|
Executive Summary 2012 Outlook – A Building & Investing Year Focus on asset growth, especially in specialty finance Earning asset levels in Auto Finance are expected to continue ramping up throughout the year Stabilizing credit quality Mature loan portfolios to remain stable Continue to focus on optimizing retail checking products to grow profitable accounts Continue evolution of TCF, focus on diversified regional and national lending businesses funded by regional deposit platform TCF’s balance sheet repositioning significantly decreases long-term borrowing costs, reduces mark-to-market risk and provides a more flexible balance sheet |
|
|
What Makes TCF Different Convenience TCF attracts a large and diverse customer base by offering a host of convenient banking services: Traditional, supermarket and campus branches open seven days a week Free debit cards, free coin counting and free withdrawals at over 660 ATMs TCF Free Online Banking TCF Free Mobile Banking Customer-friendly checking options National Lending Platforms Focus on asset growth through disciplined expansion of national secured lending platforms Conservative Corporate Philosophy Secured and diversified lender Conservative underwriting Conservative accounting Minimized interest-rate risk Prudent capital and liquidity management At March 31, 2012 |
|
|
The Evolution of TCF As a result of current economic and regulatory challenges, TCF is actively positioning itself for the future while remaining true to its conservative corporate philosophy Growth and Asset Diversification Focus on disciplined asset growth (including the expansion of national secured lending platforms) and creating a more equal diversification between consumer real estate products, commercial and specialty finance Deposits and Revenue Increase deposits and accounts through convenience, customer-friendly products and incentives Evaluate and implement additional revenue-producing and expense reduction strategies throughout the company Balance Sheet Repositioning Enables TCF to realize its true franchise value from its ongoing strategy of originating high-yielding, low-risk, secured loans and leases funded by a low-cost, core deposit base Provides funding flexibility needed to optimize current asset growth and diversification strategy Better positions TCF for today’s interest rate environment |

|
|
Balance Sheet Repositioning Details Deleveraged balance sheet by selling $1.9 billion of 3.8% weighted average MBS resulting in a $77 million gain ($48 million after-tax) which reduces exposure to prepayment and mark-to-market risk Restructured $3.6 billion of 4.3% weighted average debt with a termination loss of $551 million ($344 million after-tax) with a weighted average maturity of approximately 4.75 years Replaced $2.1 billion of 4.4% weighted average fixed-rate, FHLB advances with a mix of floating and fixed rate borrowings with a current weighted average rate of .5% Terminated $1.5 billion of 4.2% weighted average repurchase agreement borrowings Capital infusion of $120 million from the Holding Company into TCF National Bank One-time net after-tax charge of $296 million, or a loss of $1.87 per common share, recorded in 1Q12 |
|
|
Balance Sheet Repositioning Improves TCF’s Outlook Net Interest Margin Expansion Estimated annualized increase in net interest margin of $74 million pre-tax, or 96 bps (full quarter impact of balance sheet repositioning is 4.93%) Decreased Interest Rate Risk Sales of 3.8% weighted average MBS decreases TCF’s interest rate risk and mark-to-market risk profile Reduced reliance on wholesale funding from 26% to 19% of total deposits & borrowings Improved Funding Optionality Aligned with loan and lease growth and type Creates opportunity to grow deposits Recently announced $805 million deposit assumption, subject to regulatory approval (expected to close during 2Q12) Ability to reduce loan-to-deposit ratio Less reliance on wholesale funding |

|
|
Revenue |
|
|
1 Quarter-to-date, core revenues and income exclude gains on securities of $77 million in the first quarter Diversified Core Revenue Base1 Core Revenues1 Mix of Core Non-Interest Income1 ($ millions) 47% 8% 30% 15% At March 31, 2012 ($ millions) 67% 33% Non-Interest Income $89 $269 Million $89 Million Diversified sources of revenue developed over time Opportunity to increase specialty finance fee revenue with Gateway One acquisition Balance sheet repositioning significantly increases TCF’s ability to maximize net interest income moving forward Banking Fees and Service Charges $42 Card Revenue $13 Specialty Finance $27 ATM Revenue and Other $7 |
|
|
Banking Fees ($ millions) At March 31, 2012 $71.3 $61.3 Banking fees in the first quarter of 2012 were impacted by: Lower seasonal transaction volume Customer behavior changes Checking account attrition including some account consolidation Fee structure modifications Late in the first quarter, TCF launched its Choice Checking account product Expected to positively impact attrition and banking fee revenue |

|
|
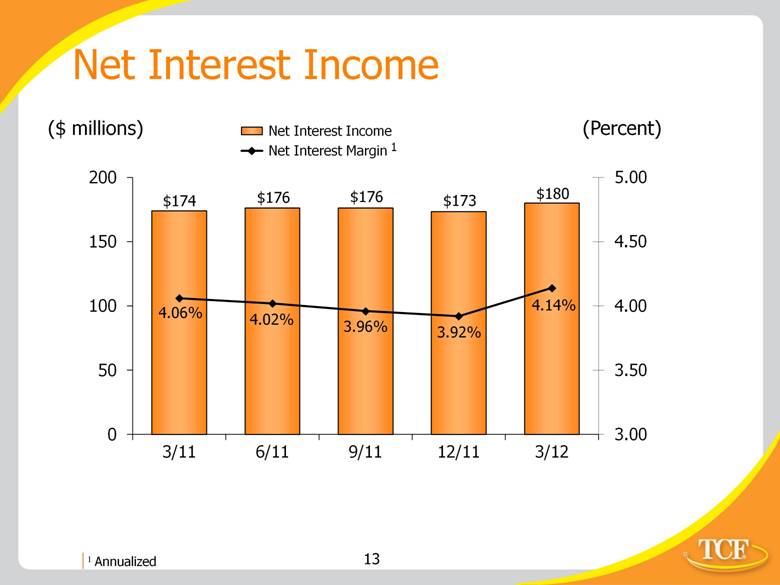
Net Interest Income ($ millions) (Percent) 1 Annualized 2 Full quarter impact of balance sheet repositioning is 4.93% 1 |
|
|
Tailwinds Growth in net interest income through balance sheet repositioning and expansion, including new specialty finance programs such as BRP Acquisition of Gateway One Lending & Finance Net margin benefit through future growth in net interest income Gains on sales of loans create additional fee opportunity Opportunities for cross-selling of various TCF products and services via specialty finance dealer base Assumption of Prudential Bank & Trust deposits, subject to regulatory approval, will reduce TCF’s loan-to-deposit ratio and reduce the need for additional borrowings Headwinds Banking fees and service charges Legacy long-term borrowing costs Credit quality Future Considerations Substantially reduced through balance sheet repositioning transaction |

|
|
Credit Quality |
|
|
2012 Outlook Look for continued strong credit performance in the specialty finance businesses Look for continued decline in non-performing assets through REO sales, paydowns and loans returning to accrual status based on performance Consumer delinquencies and net charge-offs may remain at elevated levels due to the sluggish economy, but home values appear to be stabilizing Improving work-out environment for commercial real estate non-performing assets Credit Quality Summary |

|
|
Credit Quality Trends ($ millions) 60+ Delinquency % Accruing TDR Non-Accrual Loans & Leases Leading Indicators Loss Mitigation Working Out Classified Assets |
|
|
Credit Quality Trends (continued) ($ millions) Real Estate Owned Allowance Net-Charge-offs1 Maximize Value Adequate Coverage Minimize Loss NCO Coverage Ratio: 1.1X 1.5X 1.2X 1.1X 1.7X 1 Annualized |
|
|
Consumer Real Estate TDRs At March 31, 2012, TCF held $445 million of accruing modified consumer real estate loans that are considered TDRs (weighted average rate of 3.7%), a net increase of $12 million, or 2.8% from December 31, 2011 The reserves are based on present value of expected cash flows – $59.9 million, or 13.5% at March 31, 2012 First quarter annualized net charge-offs of 7% The over 60-day delinquency rate was 7.1% at March 31, 2012, up slightly from 7% at December 31, 2011 Approximately 56% were permanent modifications and 4.1% of the accruing permanent modifications were over 60-days delinquent |
|
|
Consumer Real Estate TDR Process Loans modified to assist qualifying customers with their financial hardship by lowering their monthly loan payments Individually underwrite each TDR following face-to-face, in-property interview Generally determine interest rate and payment based on debt-to-income ratio of 38% Program terms up to five-years with interest/payment reduction, generally no principal forgiven These customers can make payments and want to stay in their houses! |
|
|
Capital |

|
|
1 See “Reconciliation of GAAP to Non-GAAP Measures – Tangible Realized Common Equity” slide 2 See “Reconciliation of GAAP to Non-GAAP Measures – Total Tier 1 Common Capital Ratio” slide Capital Ratios – Holding Company ($ millions) Other Capital Ratios 4Q11 1Q12 Total equity to total assets 9.90% 8.69% Total tier 1 common capital 11.74%2 9.04%2 Total risk-based capital 14.80% 11.88% Tier 1 leverage capital 9.15% 7.68% 1 1 |

|
|
Balance Sheet Growth |

|
|
Loan Balances ($ millions) Diverse Products and Geographies 5-Year CAGR 1.5% 3.9% 25.4% |
|
|
Leasing and Equipment Finance Minnesota $ 2,738,067 $ 915,386 $ 90,215 $ 15,281 $ 3,698 $ 3,762,647 Illinois 2,084,946 780,381 102,119 50,508 7,506 3,025,460 Michigan 889,668 675,551 124,808 63,907 2,926 1,756,860 Wisconsin 445,815 633,574 57,946 54,757 160 1,192,252 Colorado 577,878 88,886 40,575 17,165 2,701 727,205 California 3,096 16,772 387,461 50,759 31,841 489,929 Canada -- -- 2,936 391,282 -- 394,218 Texas 180 9,494 247,648 95,516 7,379 360,217 Florida 2,075 48,649 169,452 68,696 8,275 297,147 New York 2,136 -- 175,397 63,520 3,079 244,132 Ohio 2,085 37,037 129,090 58,898 1,880 228,990 Indiana 23,106 101,368 58,655 33,654 1,539 218,322 Pennsylvania 126 -- 136,260 59,763 2,874 199,023 Arizona 50,787 32,208 69,926 13,536 4,859 171,316 Other 25,122 127,783 1,326,267 600,716 60,330 2,140,218 Total $ 6,845,087 $ 3,467,089 $ 3,118,755 $ 1,637,958 $ 139,047 $ 15,207,936 Loan & Lease Geographic Diversification Consumer Real Estate and Other At 3/31/12: ($000s) Commercial Real Estate and Commercial Business Inventory Finance Total 25 Auto Finance |

|
|
Strong Deposit Franchise Quarterly Average Balances ($ millions) Average rate1: 1.51% .74% .46% .32% .30% CDs as a % of total deposits: 24.9% 12.0% 9.1% 9.2% 9.3% 1 Quarter-to-date (annualized) High Quality Core Deposit Base |

|
|
Leasing & Equipment Finance1 1 Includes operating leases ($67 million at March 31, 2012) 2 Excludes non-accrual loans and leases and acquired portfolios 3 Annualized ($ millions) At March 31, 2012 13th largest bank-affiliated leasing company and 28th largest equipment finance/leasing company in the U.S. Diverse equipment types 22% specialty vehicles, 15% manufacturing, 14% medical, 11% construction 2012 quarter-to-date fee revenue of $22.9 million, 26% of total fees and other revenue 5.63% average yield 2012 quarter-to-date originations are up 23.2% from same 2011 period Over 60-day delinquency rate .17%2 Net charge-offs: 2010 2011 2012 1.00% .41% .02%3 Uninstalled backlog of $513.5 million Unguaranteed residuals of only $126.3 million, or 6.4% of leases Core portfolio increased 8% year-over-year |

|
|
TCF Inventory Finance ($ millions) $4 $469 $625 At March 31, 2012 Inventory floorplan finance business with a focus on lawn and garden products, powersports, consumer electronics and appliances, recreation vehicles and marine products Experienced and seasoned management Operates in the U.S. and Canada 275 employees 100% variable-rate receivables 6.58% average yield Net charge-offs: 2011 2012 .10% .22%1 Credit support from equipment manufacturers Credit risk spread across more than 8,300 active dealers $1 billion of growth during 1Q12, primarily due to addition of BRP program $792 $1,638 1 Annualized |

|
|
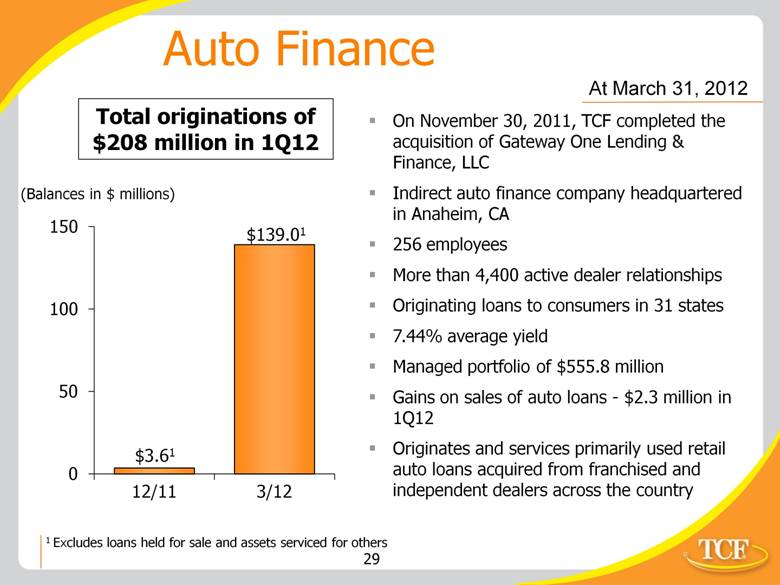
Auto Finance On November 30, 2011, TCF completed the acquisition of Gateway One Lending & Finance, LLC Indirect auto finance company headquartered in Anaheim, CA 256 employees More than 4,400 active dealer relationships Originating loans to consumers in 31 states 7.44% average yield Managed portfolio of $555.8 million Gains on sales of auto loans - $2.3 million in 1Q12 Originates and services primarily used retail auto loans acquired from franchised and independent dealers across the country At March 31, 2012 ($ millions) $3.61 $139.01 Total originations of $208 million in 1Q12 1 Excludes loans held for sale and assets serviced for others |
|
|
Commercial Lending ($ millions) At March 31, 2012 Commercial real estate – $3.2 billion 30% apartment loans 24% retail services 16% office buildings 12% industrial buildings Commercial highlights 5.32% average yield 84% fixed-rate, 16% variable-rate Over 60-day delinquency rate .10%1 Net charge-offs: 2010 2011 2012 1.31% 1.15% .18%2 CRE location mix: 93% TCF banking markets, 7% other Continue to look for strategic expansion opportunities that fit TCF’s profile On March 19th, TCF announced the creation of a new commercial banking division called TCF Capital Funding specializing in asset-based and cash flow lending to smaller middle market companies across the U.S. 1 Excludes non-accrual loans 2 Annualized Secured Lending Philosophy |

|
|
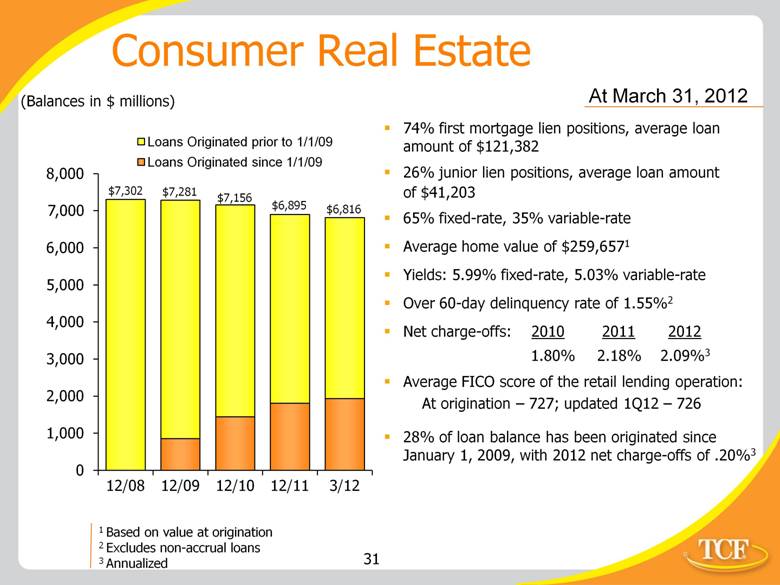
74% first mortgage lien positions, average loan amount of $121,382 26% junior lien positions, average loan amount of $41,203 65% fixed-rate, 35% variable-rate Average home value of $259,6571 Yields: 5.99% fixed-rate, 5.03% variable-rate Over 60-day delinquency rate of 1.55%2 Net charge-offs: 2010 2011 2012 1.80% 2.18% 2.09%3 Average FICO score of the retail lending operation: At origination – 727; updated 1Q12 – 726 28% of loan balance has been originated since January 1, 2009, with 2012 net charge-offs of .20%3 Consumer Real Estate ($ millions) 1 Based on value at origination 2 Excludes non-accrual loans 3 Annualized $6,895 $6,816 $7,281 $7,156 $7,302 At March 31, 2012 |
|
|
Conclusion |

|
|
Summary On the Lending side: Focus on disciplined asset growth, especially through national secured specialty finance lending platforms Maintain strong asset quality and earnings from Leasing and Equipment Finance Maintain superior asset quality levels in Inventory Finance Integrate Gateway One and execute on growth plans – expect the acquisition to be slightly accretive in 2012, primarily in the last six months Continue the commercial real estate strategy by being opportunistic on new business in all footprint geographies, while dedicated work-out teams optimize the problem credits In Retail Lending, continue to work with our borrowers to provide mutually beneficial solutions, while being selective in asset generation focusing on profitability and diversification |
|
|
Summary (continued) On the Capital and Funding side: Integrate funding strategies keeping in mind the best equity mix and keeping an eye on continuing to reduce the loan-to-deposit ratio over time Redesign of retail checking products to compete effectively in the marketplace and to meet various customer needs Capitalize on the deposit gathering strength of TCF’s branch network to continue to fund balance sheet growth in the most stable and economic methods Continue to use capital for strategic purposes Organizationally: Functionally organized management structure (Enterprise Risk Management, Lending, Funding and Corporate Development) will bolster TCF’s evolution to accommodate today’s changing banking and economic environment |

|
|
Cautionary Statements for Purposes of the Safe Harbor Provisions of the Securities Litigation Reform Act Any statements contained in this presentation regarding the outlook for the Company’s businesses and their respective markets, such as projections of future performance, guidance, statements of the Company’s plans and objectives, forecasts of market trends and other matters, are forward-looking statements based on the Company’s assumptions and beliefs. Such statements may be identified by such words or phrases as “will likely result,” “are expected to,” “will continue,” “outlook,” “will benefit,” “is anticipated,” “estimate,” “project,” “management believes” or similar expressions. These forward-looking statements are subject to certain risks and uncertainties that could cause actual results to differ materially from those discussed in such statements and no assurance can be given that the results in any forward-looking statement will be achieved. For these statements, TCF claims the protection of the safe harbor for forward-looking statements contained in the Private Securities Litigation Reform Act of 1995. Any forward-looking statement speaks only as of the date on which it is made, and we disclaim any obligation to subsequently revise any forward-looking statement to reflect events or circumstances after such date or to reflect the occurrence of anticipated or unanticipated event Certain factors could cause the Company’s future results to differ materially from those expressed or implied in any forward-looking statements contained in this release. These factors include the factors discussed in Part I, Item 1A of the Company’s Annual Report on Form 10-K for the year ended December 31, 2011 under the heading “Risk Factors,” the factors discussed below and any other cautionary statements, written or oral, which may be made or referred to in connection with any such forward-looking statements. Since it is not possible to foresee all such factors, these factors should not be considered as complete or exhaustive. Adverse Economic or Business Conditions, Credit and Other Risks Deterioration in general economic and banking industry conditions, including defaults, anticipated defaults or rating agency downgrades of sovereign debt (including debt of the U.S.), or continued high rates of or increases in unemployment in TCF’s primary banking markets; adverse economic, business and competitive developments such as shrinking interest margins, deposit outflows, deposit account attrition or an inability to increase the number of deposit accounts; adverse changes in credit quality and other risks posed by TCF’s loan, lease, investment and securities available for sale portfolios, including declines in commercial or residential real estate values or changes in the allowance for loan and lease losses dictated by new market conditions or regulatory requirements; interest rate risks resulting from fluctuations in prevailing interest rates or other factors that result in a mismatch between yields earned on TCF’s interest-earning assets and the rates paid on its deposits and borrowings; foreign currency exchange risks; counterparty risk, including the risk of defaults by our counterparties or diminished availability of counterparties who satisfy our credit quality requirements; decreases in demand for the types of equipment that TCF leases or finances; limitations on TCF’s ability to attract and retain manufacturers and dealers to expand the inventory finance business. Legislative and Regulatory Requirements New consumer protection and supervisory requirements and regulations, including those resulting from action by the Consumer Financial Protection Bureau and changes in the scope of Federal preemption of state laws that could be applied to national banks; the imposition of requirements with an adverse impact relating to TCF’s lending, loan collection and other business activities as a result of the Dodd-Frank Act, or other legislative or regulatory developments such as mortgage foreclosure moratorium laws or imposition of underwriting or other limitations that impact the ability to use certain variable-rate products; reduction of interchange revenue from debit card transactions resulting from the Durbin Amendment to the Dodd-Frank Act; impact of legislative, regulatory or other changes affecting customer account charges and fee income; changes to bankruptcy laws which would result in the loss of all or part of TCF’s security interest due to (continued) |
|
|
collateral value declines; deficiencies in TCF’s compliance under the Bank Secrecy Act in past or future periods, which may result in regulatory enforcement action including monetary penalties; increased health care costs resulting from Federal health care reform legislation; adverse regulatory examinations and resulting enforcement actions or other adverse consequences such as increased capital requirements or higher deposit insurance assessments; heightened regulatory practices, requirements or expectations, including, but not limited to, requirements related to the Bank Secrecy Act and anti-money laundering compliance activity. Earnings/Capital Risks and Constraints, Liquidity Risks Limitations on TCF’s ability to pay dividends or to increase dividends because of financial performance deterioration, regulatory restrictions or limitations; increased deposit insurance premiums, special assessments or other costs related to adverse conditions in the banking industry, the economic impact on banks of the Dodd-Frank Act and other regulatory reform legislation; the impact of financial regulatory reform, including the phase out of trust preferred securities in tier 1 capital called for by the Dodd-Frank Act, or additional capital, leverage, liquidity and risk management requirements or changes in the composition of qualifying regulatory capital (including those resulting from U.S. implementation of Basel III requirements); adverse changes in securities markets directly or indirectly affecting TCF’s ability to sell assets or to fund its operations; diminished unsecured borrowing capacity resulting from TCF credit rating downgrades and unfavorable conditions in the credit markets that restrict or limit various funding sources; costs associated with new regulatory requirements or interpretive guidance relating to liquidity; uncertainties relating to customer opt-in preferences with respect to overdraft fees on point of sale and ATM transactions which may have an adverse impact on TCF’s fee revenue; uncertainties relating to future retail deposit account changes, including limitations on TCF’s ability to predict customer behavior and the impact on TCF’s fee revenues; product additions and of distribution channels (or entry into new markets) for existing products. Competitive Conditions; Supermarket Branching Risk; Growth Risks Reduced demand for financial services and loan and lease products; adverse developments affecting TCF’s supermarket banking relationships or any of the supermarket chains in which TCF maintains supermarket branches; customers completing financial transactions without using a bank; the effect of any negative publicity; slower than anticipated growth in existing or acquired businesses; inability to successfully execute on TCF’s growth strategy through acquisitions or cross-selling opportunities; failure to expand or diversify our balance sheet through programs or new opportunities; failure to successfully attract and retain new customers; product additions and addition of distribution channels (or entry into new markets) for existing products. Technological and Operational Matters Technological or operational difficulties, loss or theft of information, counterparty failures and the possibility that deposit account losses (fraudulent checks, etc.) may increase; failure to keep pace with technological change. Litigation Risks Results of litigation, including class action litigation concerning TCF’s lending or deposit activities including account servicing processes or fees or charges, or employment practices, and possible increases in indemnification obligations for certain litigation against Visa U.S.A. and potential reductions in card revenues resulting from such litigation or other litigation against Visa. Accounting, Audit, Tax and Insurance Matters Changes in accounting standards or interpretations of existing standards; federal or state monetary, fiscal or tax policies, including adoption of state legislation that would increase state taxes; ineffective internal controls; adverse state or Federal tax assessments or findings in tax audits; lack of or inadequate insurance coverage for claims against TCF; potential for claims and legal action related to TCF’s fiduciary responsibilities. Cautionary Statements for Purposes of the Safe Harbor Provisions of the Securities Litigation Reform Act (continued) |

|
|
1 In contrast to GAAP-basis measures, tangible realized common equity excludes the effect of goodwill, other intangibles and accumulated other comprehensive income (loss). Management reviews tangible realized common equity as an ongoing measure and has included this information because of current interest in the industry. The methodology for calculating tangible realized common equity may vary between companies. Reconciliation of GAAP to Non-GAAP Measures – Tangible Realized Common Equity1 Computation of total equity to total assets: Total equity $ 1,493,776 $ 1,179,755 $ 1,480,163 $ 1,878,627 $ 1,549,325 Total assets $ 16,740,357 $ 17,885,175 $ 18,465,025 $ 18,979,388 $ 17,833,457 Total equity to total assets 8.92 % 6.60 % 8.02 % 9.90 % 8.69 % Computation of tangible realized common equity to tangible assets Total equity $ 1,493,776 $ 1,179,755 $ 1,480,163 $ 1,878,627 $ 1,549,325 Less: Non-controlling interest in subsidiaries - 4,393 8,500 10,494 18,306 Total TCF stockholders’ equity 1,493,776 1,175,362 1,471,663 1,868,133 1,531,019 Less: Goodwill 152,599 152,599 152,599 225,640 225,640 Customer based intangibles - 1,405 1,232 7,134 6,803 Deposit based intangibles - - - - - Preferred Stock 348,437 - - - - Accumulated other comprehensive income 23,685 1,661 - 56,826 3,273 Add: Accumulated other comprehensive loss - - 15,692 - - Tangible realized common equity $ 969,055 $ 1,019,697 $ 1,333,524 $ 1,578,533 $ 1,295,303 Total assets $ 16,740,357 $ 17,885,175 $ 18,465,025 $ 18,979,388 $ 17,833,457 Less: Goodwill 152,599 152,599 152,599 225,640 225,640 Customer based intangibles - 1,405 1,232 7,134 6,803 Deposit based intangibles - - - - - Tangible assets $ 16,587,758 $ 17,731,171 $ 18,311,194 $ 18,746,614 $ 17,601,014 Total realized common equity to tangible 5.84 % 5.75 % 7.28 % 8.42 % 7.36 % assets Mar. 31, 2012 ($000s) Dec. 31, 2011 Dec. 31, 2010 Dec. 31, 2009 Dec. 31, 2008 |

|
|
Total Tier 1 risk-based capital ratio: Total tier 1 capital $ 1,706,926 Total risk-weighted assets $ 13,475,330 Total tier 1 risk-based capital ratio 12.67 % Computation of tier 1 common capital ratio: Total tier 1 capital $ 1,706,926 Less: Qualifying trust preferred securities 115,000 Qualifying non-controlling interest in subsidiaries 10,494 Preferred stock - Total tier 1 common capital 1,581,432 Total risk-weighted assets $ 13,475,330 Total tier 1 common capital ratio 11.74 % ($000s) Mar. 31, 2012 Reconciliation of GAAP to Non-GAAP Measures – Total Tier 1 Common Capital Ratio1 1 In contrast to GAAP-basis measures, the total tier 1 common capital ratio excludes the effect of qualifying trust preferred securities and qualifying non-controlling interest in subsidiaries. Management reviews the total tier 1 common capital ratio as an on-going measure and has included this information because of current interest in the industry. The methodology for calculating total tier 1 common capital may vary between companies. $ 1,431,565 $ 14,357,389 9.97 % $ 1,431,565 115,000 18,306 - 1,298,259 $ 14,357,389 9.04 % Dec. 31, 2011 |

|
|
Source References & Footnotes Slide: Corporate Profile 36th largest publicly-traded U.S. based bank holding company – SNL Financial, LC; 12/31/2011 26th largest branch network – SNL Financial, LC; 1Q12 5th largest in campus card relationships - CR80News; June 2011 Slide: Leasing & Equipment Finance 13th largest bank-affiliated leasing company – The Monitor; 2011 Monitor Bank 40 28th largest equipment finance/leasing company – The Monitor; 2011 Monitor 100 |