Attached files
| file | filename |
|---|---|
| 8-K - FORM 8-K - BATTALION OIL CORP | d340197d8k.htm |
| EX-2.1 - AGREEMENT AND PLAN OF MERGER - BATTALION OIL CORP | d340197dex21.htm |
| EX-10.1 - VOTING AGREEMENT - BATTALION OIL CORP | d340197dex101.htm |
| EX-99.1 - JOINT PRESS RELEASE - BATTALION OIL CORP | d340197dex991.htm |
| EX-10.3 - CONFIDENTIAL INFORMATION - BATTALION OIL CORP | d340197dex103.htm |
| EX-10.2 - VOTING AGREEMENT - BATTALION OIL CORP | d340197dex102.htm |
 April 25,
2012 HK to Acquire GEOI
Exhibit 99.2 |
 NYSE:
HK Forward-Looking Statements
2
This presentation contains forward-looking information regarding Halcón Resources and
GeoResources that is intended to be covered by the safe harbor for
"forward-looking statements" provided by the Private Securities Litigation Reform Act of 1995. Forward-
looking statements are based on Halcón Resources’ and GeoResources’ current
expectations beliefs, plans, objectives, assumptions and strategies.
Forward-looking statements often, but not always, can be identified by using words such as "expects", "anticipates",
"plans", "estimates", "potential", "possible",
"probable", or "intends", or where Halcón Resources or GeoResources states that
certain actions, events or results "may", "will", "should", or
"could" be taken, occur or be achieved. Forward-looking statements are
subject to risks and uncertainties, which could cause actual results to differ materially from
those reflected in the statements. These risks include, but are not limited to:
anticipated timing for closing the proposed merger, the possibility that the companies may be
unable to obtain stockholder or other approvals required for the acquisition or will not be
able to satisfy the other conditions to closing; that problems will arise in the
integration of the businesses of the two companies; that the acquisition may involve
unexpected costs; operational risks in exploring for, developing and producing crude oil and
natural gas; uncertainties involving geology of oil and natural gas deposits; the
timing of and potential proceeds from planned divestitures; uncertainty of reserve
estimates; uncertainty of estimates and projections relating to future production, costs and
expenses; potential delays or changes in plans with respect to exploration or
development projects or capital expenditures; health, safety and environmental risks and risks
related to weather such as hurricanes and other natural disasters; uncertainties as to the
availability and cost of financing; fluctuations in oil and natural gas prices; risks
associated with derivative positions; inability to timely integrate and realize expected
value from acquisitions, inability of our management team to execute plans to meet our goals;
shortages of drilling equipment, oil field personnel and services; unavailability of
gathering systems, pipelines and processing facilities; and the possibility that laws,
regulations or government policies may change or governmental approvals may be delayed or
withheld. Additional information on these and other factors which could affect
operations or financial results are included in Halcón Resources’ and GeoResources’
reports on file with the SEC. Investors are cautioned that any forward-looking
statements are not guarantees of future performance and actual results or developments
may differ materially from the projections in the forward-looking statements. Forward-looking
statements are based on assumptions, estimates and opinions of management at the time the
statements are made. We do not assume any obligation to update forward-looking
statements should circumstances or such estimates or opinions change. |
 NYSE:
HK Additional Information
3
PROPOSED
TRANSACTION.
Investors
and
security
holders
may
obtain
these
documents
free
of
charge
at
the
SEC’s
website
at
www.sec.gov.
In
addition,
the
documents
filed
with
the
SEC
by
Halcón
Resources
can
be
obtained
free
of
charge
from
Halcón
Resources’
website
at
www.halconresources.com.
The
documents
filed
by
GeoResources
can
be
obtained
free
of
charge
from
GeoResources’
website
at
www.georesourcesinc.com.
Halcón Resources and GeoResources intend to file materials relating to the
transaction with the SEC, including a registration statement of Halcón Resources,
which will include a prospectus of Halcón Resources and a joint proxy statement of
Halcón Resources and GeoResources. The definitive joint proxy
statement/prospectus will be mailed to stockholders of Halcón Resources and
GeoResources. INVESTORS AND SECURITY HOLDERS ARE URGED TO CAREFULLY READ THE
REGISTRATION STATEMENT AND THE JOINT PROXY STATEMENT/PROSPECTUS AND OTHER DOCUMENTS FILED WITH THE SEC IN THEIR ENTIRETY
WHEN THEY BECOME AVAILABLE BECAUSE THEY WILL CONTAIN IMPORTANT INFORMATION ABOUT HALCÓN
RESOURCES, GEORESOURCES AND THE Halcón Resources, GeoResources and their respective executive officers and directors may
be deemed to be participants in the solicitation of proxies from the stockholders of
Halcón Resources and GeoResources in respect of the proposed transaction. Information regarding Halcón Resources' directors and executive
officers is available in its annual report on Form 10-K for the year ended December 31,
2011, which was filed with the SEC on March 5, 2012, and its proxy statement for its
2012 annual meeting of stockholders, which was filed with the SEC on April 12, 2012, and information regarding GeoResources' directors and
executive officers is available in its proxy statement for its 2011 annual meeting of
stockholders, which was filed with the SEC on April 29, 2011. Other information
regarding the participants in the proxy solicitation and a description of their direct and indirect interests, by security holdings or otherwise, will be
contained in the joint proxy statement/prospectus and other relevant materials to be filed
with the SEC when they become available. We use the terms “resource potential” and “EURs” per well in this
presentation to describe estimates of potentially recoverable hydrocarbons that the SEC
rules prohibit from being included in filings with the SEC. These are based on the
Company’s internal estimates of hydrocarbon quantities that may be potentially
discovered through exploratory drilling or recovered with additional drilling or recovery techniques. These quantities do not constitute “reserves”
within the meaning of the Society of Petroleum Engineer’s Petroleum Resource Management
System or SEC rules. “EUR,” or Estimated Ultimate Recovery, refers to
our management’s internal estimates based on per well hydrocarbon quantities that may be potentially recovered from a hypothetical future well
completed as a producer in the area. Management estimated these EURs based on publicly
available information relating to the operations of producers who are conducting
operating in these areas. Factors affecting ultimate recovery include our ability to acquire the acreage we are
targeting and the scope of our ongoing drilling program, which will be directly
affected by the availability of capital, drilling and production costs, availability of drilling services and equipment, drilling results, lease expirations,
transportation constraints, regulatory approvals and other factors; and actual drilling
results, including geological and mechanical factors affecting recovery rates.
Estimates of resource potential, per well EUR may change significantly as the Company pursues acquisitions. In addition, our production forecasts and
expectations for future periods are dependent upon many assumptions, including estimates of
production decline rates from existing wells and the undertaking and outcome of future
drilling activity, which may be affected by significant commodity price declines or drilling cost increases.
|
 NYSE:
HK Announcing the Acquisition of GEOI by HK
Consideration ($37.97 per GEOI share ):
$20.00 in cash
1.932 HK shares
Total
transaction
value
~$1.0
Billion
GEOI stockholders to own ~18% of HK at closing
Expected to close in 3Q12, subject to customary approvals
4
(1) Based
on
the
closing
price
of
Halcón
Resources’
common
stock
on
April
24,
2012.
(1)
(1) |
 NYSE:
HK 5
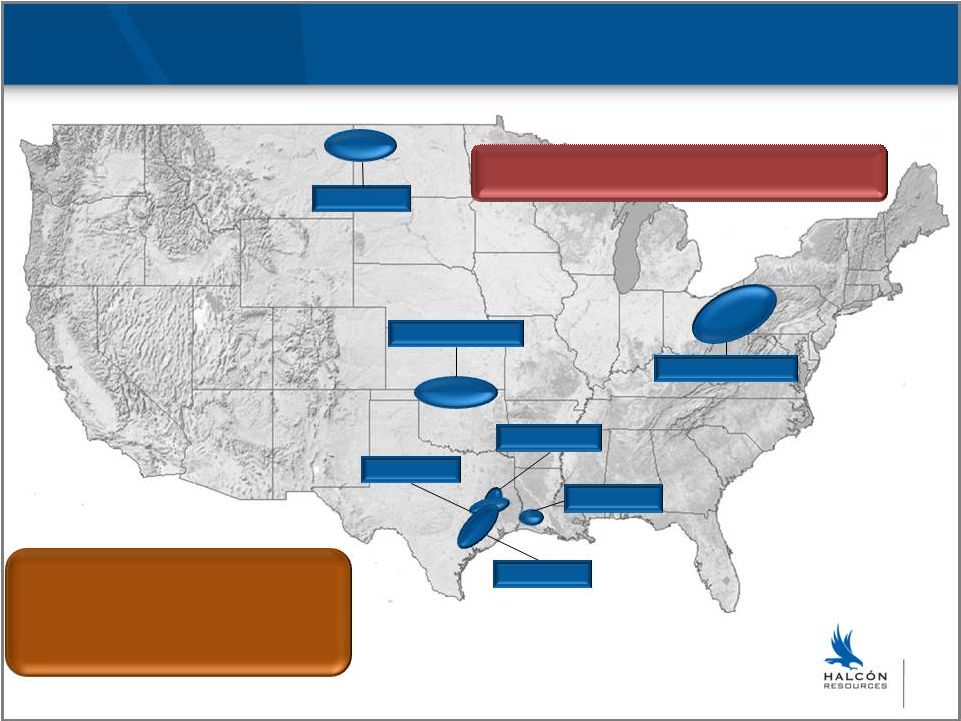
Liquids-Rich Asset Base and Significant Drilling Inventory
Utica/Point Pleasant
Wilcox
Woodbine
Mississippian Lime
Bakken
Austin Chalk
Eagle Ford
3 Exploratory Liquids-Rich Plays Not Shown
Note: Estimated proved reserves and PV10 at 12.31.11 using SEC pricing including
GeoResources’ management estimates of 12.31.11 proved reserves associated with
Brookeland field acquisition using SEC pricing.
PF Total Proved Reserves: 52.8 MMBoe
PF % Developed: 68%
PF % Oil/NGLs: 69%
PF 4Q11 Avg. Net Daily Production: 11,070 Boe
PF Total Proved PV10: $1,044.9 MM |
 NYSE:
HK 6
Numerous “oily”
resource style high growth assets
Multi-decade drilling inventory
Improves commercial opportunity set
Immediately
accretive
to
discretionary
cash
flow,
production
and
reserves
on
a
per
share
basis
More than doubles HK proved reserves and production
Pro forma 52.8 MMBoe of estimated proved reserves
Pro forma 11.1 MBoe/d of 4Q11 production
More than doubles HK estimated 2012 cash flow
Strong balance sheet
Increases public float
Increases debt capacity
Scale
Capital
Access
Resource
Intensity
Accretive
To
Shareholders
Creating a Resource Powerhouse |
 NYSE:
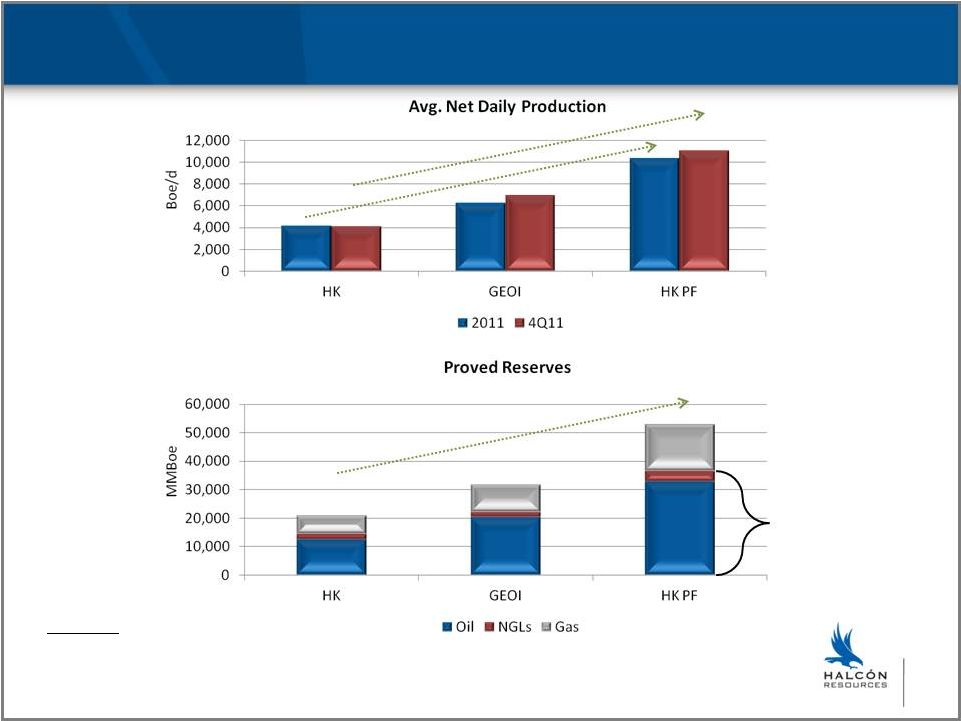
HK Substantial Increase in Production and Reserves
+151%
+171%
+151%
(1)
(1)
(2)
69%
Liquids
(1) Includes GeoResources’ Brookeland field acquisition. (2) Proved
reserves at 12.31.11 using SEC pricing including GeoResources’ management estimates of 12.31.11 proved reserves associated
with Brookeland field acquisition using SEC pricing; proved reserve figures exclude
approximately 1.2 MMBoe (96% gas) of proved reserves and $11 MM of PV10 associated with
GP interest in partnerships with GE. 7 |
 NYSE:
HK 48% gas (6:1)
Allows for added focus on growth areas
Expect some sales in 2012
Source of additional liquidity
8
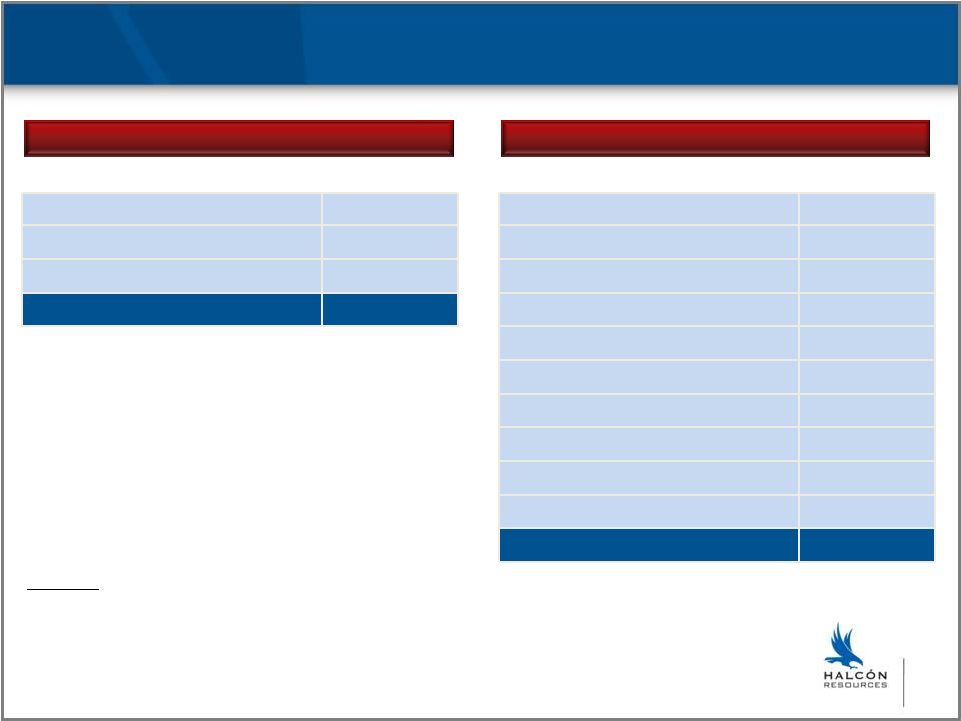
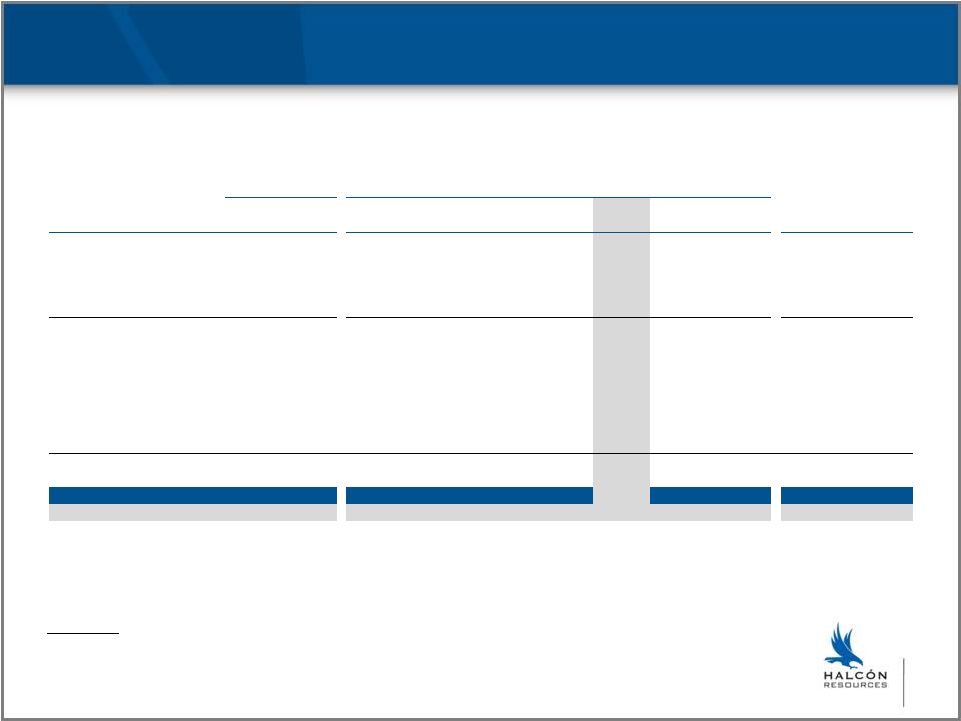
Pro Forma Non-Core Divestiture Candidates
(1) Estimated proved reserves and PV10 at 12.31.11 using SEC pricing.
2011 Average Net
Daily Production
Proved Reserves
(1)
Boe/d
Full Year
4Q11
Oil
MBbls
Gas
MMcf
NGL
MBbls
Equiv.
Mboe
%
Oil/NGLs
% PD
% Total PF
Reserves
PV10
(1)
($MM)
% Total PF
PV10
Permian
322
322
1,205
2,087
44
1,597
78%
72%
3%
$46.3
4%
South Texas
865
732
317
21,246
1,280
5,139
31%
42%
10%
$48.3
5%
South Louisiana
1,146
1,235
3,725
14,499
0
6,141
61%
70%
12%
$142.0
14%
Other
1,364
1,371
3,581
19,765
365
7,240
55%
92%
14%
$131.4
13%
Total
3,697
3,660
8,828
57,597
1,690
20,117
52%
71%
38%
$367.9
35% |
 NYSE:
HK 9
Increased Capitalization
(1)
As of 12.31.11 the borrowing base under the revolving credit facility was $150 MM; adjusted
to $225 MM after the 2.8.12 recap and adjusted to estimated $475 MM post GeoResources
acquisition; assumes all outstanding GeoResources borrowings paid off.
(2)
GeoResources
balance
sheet
pro
forma
for
Brookeland
field
($40.4
MM)
and
Bakken
($12.7
MM)
acquisitions
funded
on
revolver.
(3)
Reflects $275 MM five-year convertible Note issued 2.8.12 to HALRES LLC (formerly
Halcón Resources LLC); Note is reflected at fair value.
(4)
Includes 73.3 MM common shares, 4,444 preferred shares automatically converted into 44.4 MM
common shares, issuance costs and change in control payments.
(5)
Reflects equity consideration (51.4 million shares) for GeoResources acquisition at
Halcón’s closing price of $9.30/share on 4.24.12.
HK
Recap
GEOI
Merger
HK + GEOI
($000s)
12.31.11
Adjustments
12.31.11
Adjustments
PF 12.31.11
Debt
Revolving Credit Facility
(1)(2)
127,000
(127,000)
53,100
(53,100)
-
Term Loan
75,000
(75,000)
-
-
-
8.00%
Sr.
Conv.
Note
due
2017
(3)
-
248,961
-
-
248,961
Total Debt
$202,000
$53,100
$248,961
Shareholders’
Equity
(4)
5,948
669,736
368,311
-
1,043,995
New Equity
(5)
-
-
-
478,219
478,219
Total Capitalization
$207,948
$421,411
$1,771,175 |
 NYSE:
HK 10
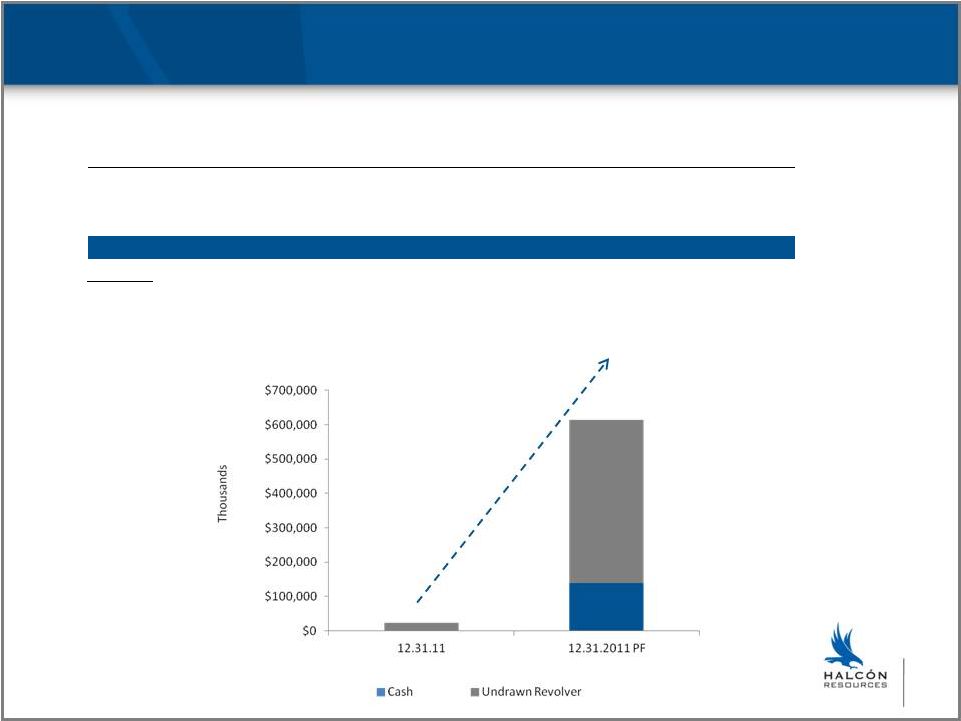
Solid Liquidity to Fund Growth
(1)
Includes cash consideration for acquisition, payoff of outstanding balance on GeoResources
credit facility, change in control payments and estimated transaction
fees/expenses. (2)
Reflects new revolving credit facility with estimated $475 MM borrowing base post
GeoResources acquisition. HK
Recap
GEOI
Merger
HK + GEOI
($000s)
12.31.11
Adjustments
12.31.11
Adjustments
PF 12.31.11
Cash and Cash Equivalents
49
710,342
39,144
(611,391)
(1)
138,144
Revolving Credit Facility
150,000
75,000
180,000
70,000
475,000
(2)
Borrowings
(127,000)
127,000
(53,100)
53,100
-
Total Liquidity
$23,049
$166,044
$613,144 |
 NYSE:
HK 11
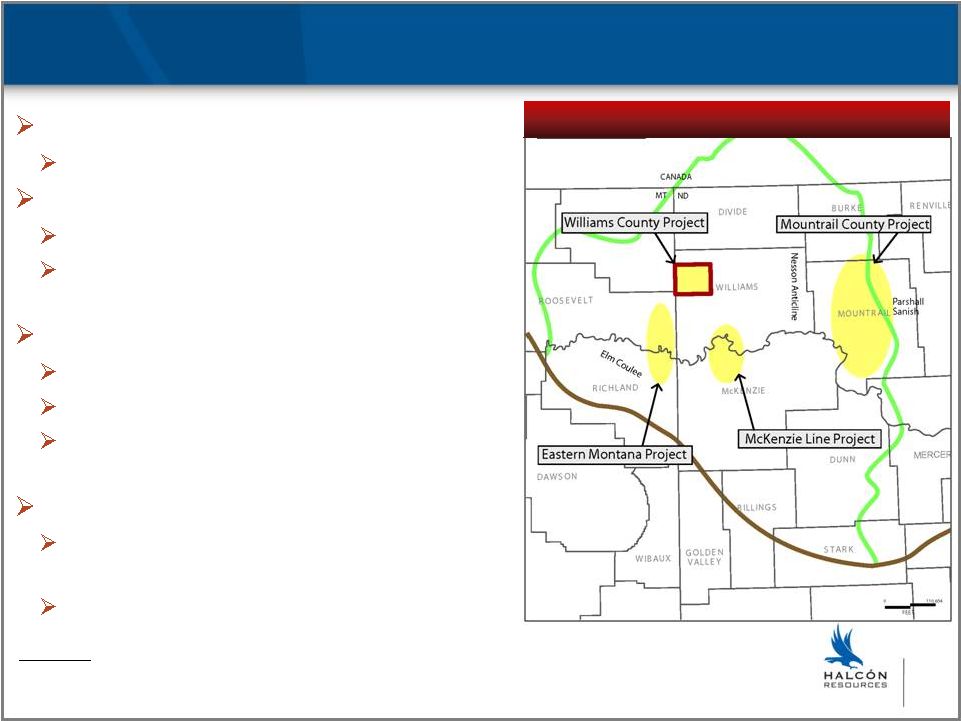
Bakken Project Area Overview
55,000 net acres (37,000 operated)
50+ MMBoe of unbooked resource potential
NW Williams County (operated)
2 rigs running
20-24 gross wells planned for 2012
(~30% -
~35% W.I.)
Eastern Montana (operated)
Rig to begin drilling in May
3-5 gross wells planned for 2012 (~45% W.I.)
2-3 conventional prospects to be drilled in
2012
Non-operated programs
3-4 rigs running in Mountrail County area
with very strong economics (~8% W.I.)
1 rig running in McKenzie Line area
(~11% W.I.)
Diversified Footprint Across Bakken Trend
(1)
(1) Estimate is based on 320 acre spacing and excludes developed acreage on which proved
reserves are already booked. Excludes Three Forks potential. See Additional
Information on page 3. |
 NYSE:
HK 12
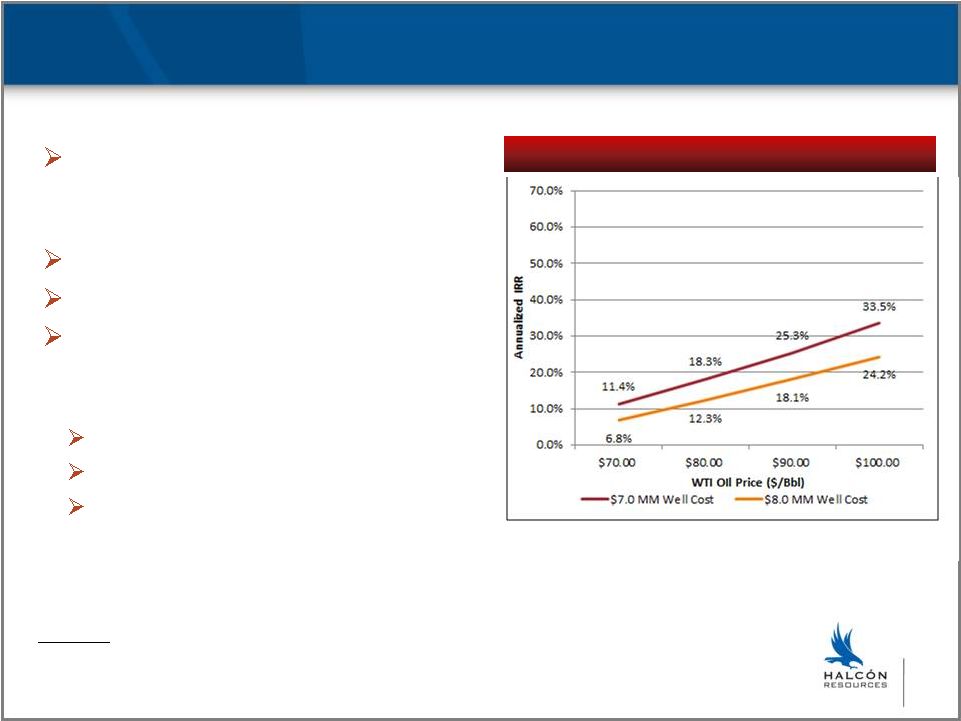
Bakken Operated Project Area Economics and Upside
Potential for increased drilling
density (i.e. 4-6 wells per 1280 acre
unit)
Three Forks formation potential
Improved frac efficiency expected
Multiple initiatives underway to
lower D&C, operating costs and
improve recoveries
Pad development, walking rigs
Company owned SWD wells
Infrastructure being developed
Base Case Returns (300 Mboe)
(1)(2)
(1)
Dry gas price held constant at $4.50/Mcf.
(2)
EUR refers to GeoResources’ management internal estimates of reserves potentially
recoverable from successful drilling of wells and may change as more data becomes available as well as our actual results of drilling
and production. See Additional Information on page 3. |
 NYSE:
HK 13
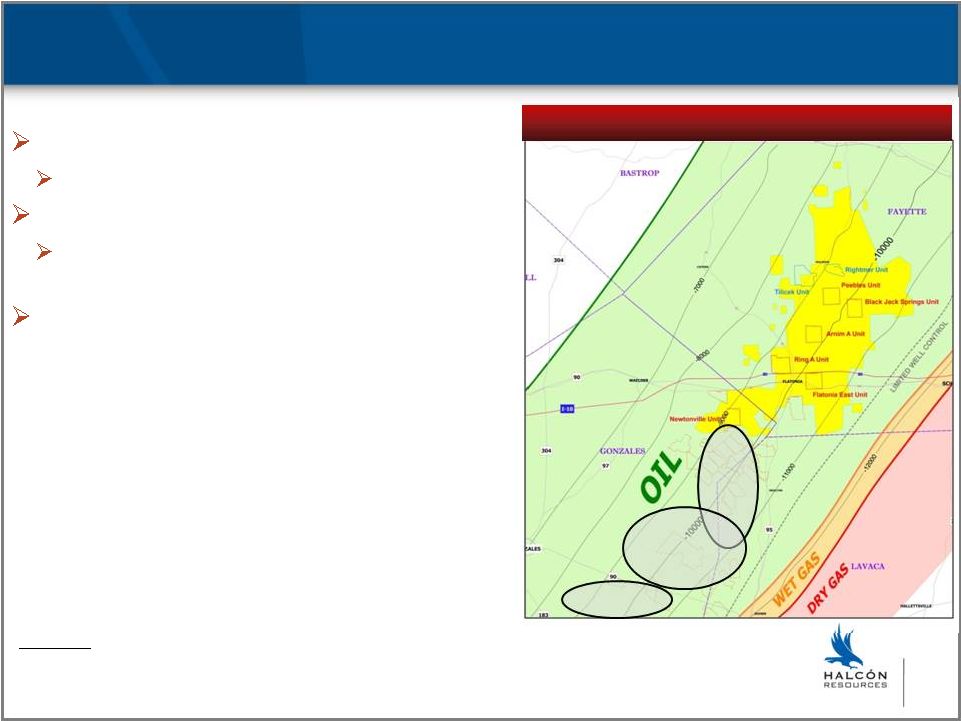
Eagle Ford Project Overview
24,000 net acres (operated)
50+ MMBoe of unbooked resource potential
2 rigs running (3 to be added in 2H12)
20-24 gross operated wells planned for 2012
(~45% W.I.)
Geology similar to area being developed by
offset operators to the south
Eagle Ford Acreage Position
EOG
PVA
MHR
(1) Estimate is based on 150 acre spacing and excludes developed acreage on which proved
reserves are already booked. See Additional Information on page 3.
(1)
rd |
 NYSE:
HK 14
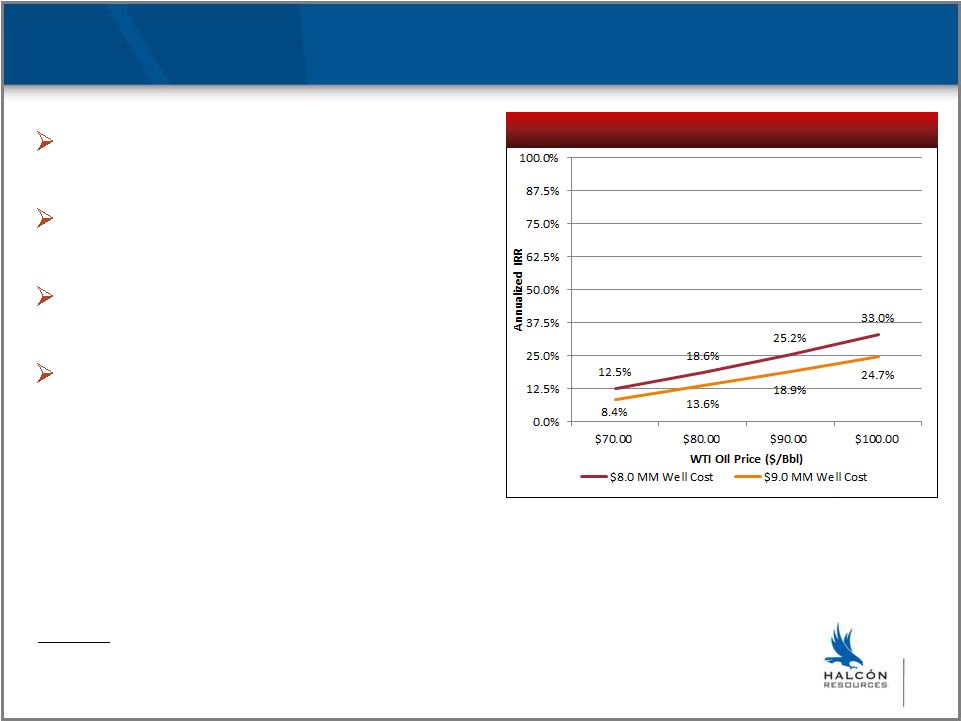
Eagle Ford Project Economics and Upside
Continued refinement of optimal
completion methodology
Potential for increased drilling density
(i.e. 80 or 120 acre spacing)
Austin Chalk potential
(unconventional/conventional)
Potential to lower costs and improve
recoveries
Base Case Returns (325 Mboe)
(1)(2)
(1)
Dry gas price held constant at $4.50/Mcf.
(2)
EUR refers to GeoResources’ management internal estimates of reserves potentially
recoverable from successful drilling of wells and may change as more data becomes
available as well as our actual results of drilling and production. See Additional Information
on page 3. |
 NYSE:
HK 15
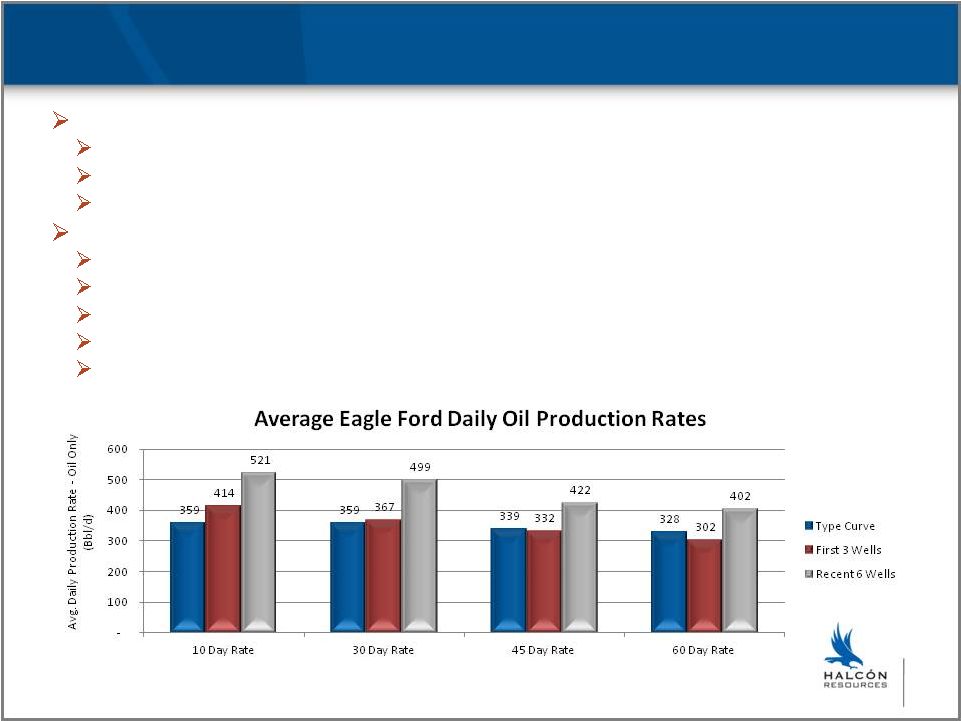
Eagle Ford Project Improvements
First three well completions largely ineffective
Laterals 3200’-5900’
with 10-16 frac stages
40/70 white sand (embedment issues)
Slick water, linear gels and cross link frac fluids
Recent six wells
Targeting 5000’
laterals with 20 frac stages
20/40 and 30/50 resin coated and white sand
Cross link gel
All six still flowing up 5.5”
frac string
Performing significantly above 325 Mboe type curve |
 NYSE:
HK 16
2012 Pro Forma D&C, Seismic and Infrastructure Estimate
Note:
Capital
budget
subject
to
revision;
property
and
leasehold
acquisitions
not
budgeted.
By Category
By Area
Drilling and Completions
78%
Seismic
9%
Infrastructure
13%
Total
~$620 MM
Utica/Point Pleasant
9%
Woodbine
8%
Wilcox
8%
Mississippi Lime
9%
Bakken
17%
Eagle Ford
16%
Austin Chalk
1%
Exploratory Liquids Plays
11%
Infrastructure
13%
Other
8%
Total
~$620 MM |
 NYSE:
HK 17
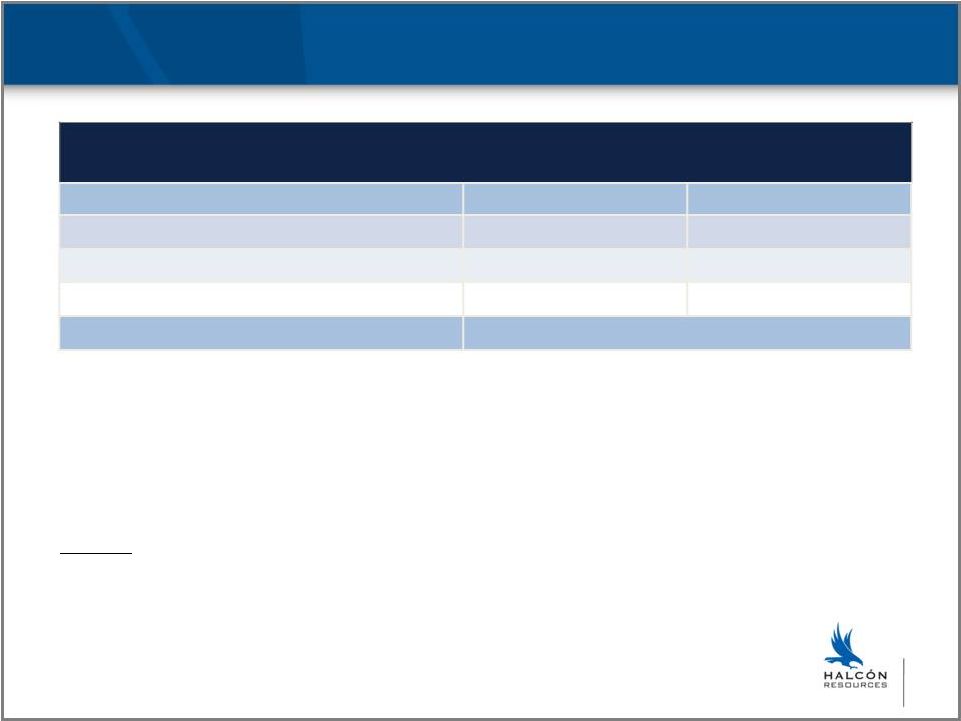
2012 Operating and Financial Guidance Summary
Note: Pro forma combined guidance under review; guidance is forward-looking information
that is subject to a number of risks and uncertainties, many of which are beyond the
Company’s control. HK
GEOI
Production
Total (Boe/d)
6,161-
6,270
7,300 –
8,300
Percent Oil & NGLs
70%
65-70%
Operating costs and expenses ($ per Boe)
UNDER REVIEW |
 NYSE:
HK 18
Building An Oil Company
(1)
Percentage leased, optioned or under contract compared to midpoint of target acreage
range. Targeted Net Acres
Progress
First Spud
Targeted Areas
Utica / Point Pleasant
150,000 -
250,000
~50%
May
Woodbine
150,000 -
250,000
~35%
May
Wilcox
50,000 -
100,000
~30%
June
Mississippian Lime
50,000 -
100,000
~60%
April
Total Targeted Areas
400,000 -
700,000
~42%
3 Exploratory Liquids
Rich Plays
225,000 -
375,000 Not Disclosed
Play 1
25,000 -
75,000
May
Play 2
100,000 -
150,000
June
Play 3
100,000 -
150,000
June
(1)
- |
 NYSE:
HK 19
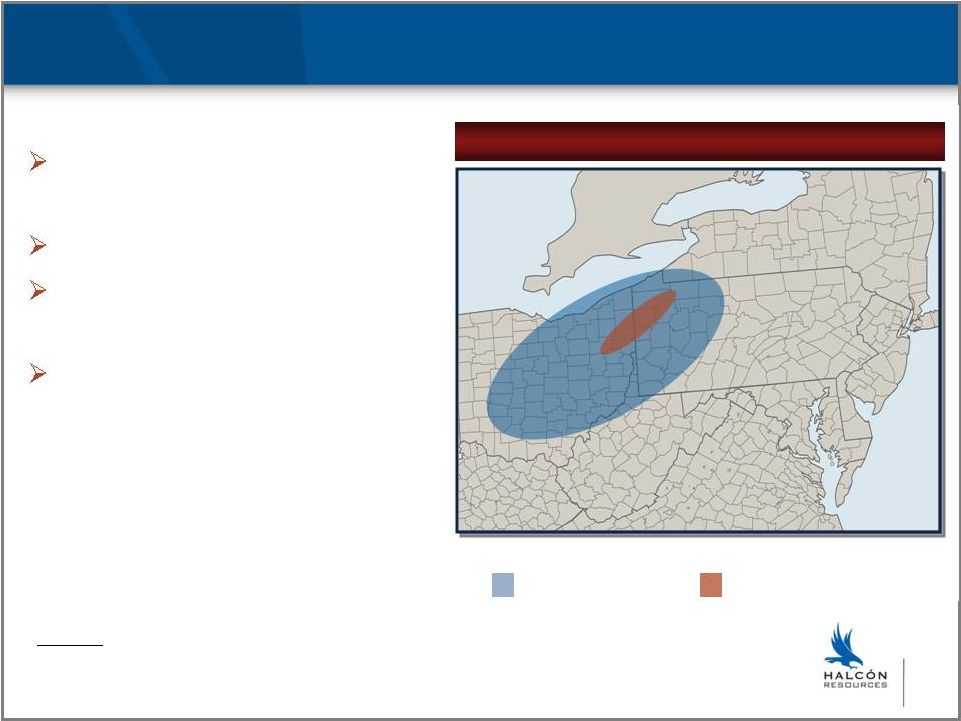
Utica/Point Pleasant Overview
PA
OH
KY
NY
Utica/Point Pleasant
WV
MD
VA
Utica/Point Pleasant
HK Target Acreage Area
Target Acreage: 150,000 –
250,000
Focus –
volatile oil and liquids-rich
window
Access to cores, geochem and logs
3D seismic to optimize completions
and reduce costs
Wells could be as prolific as Eagle
Ford wells
Source: Industry research. |
 NYSE:
HK 20
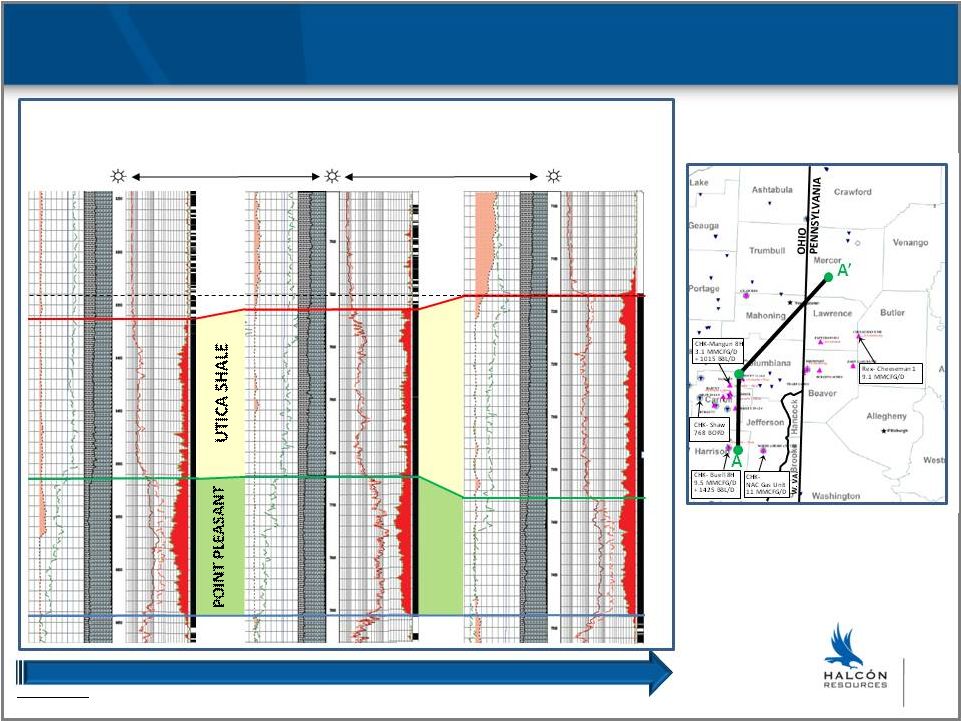
Utica/Point Pleasant Thickness and Reservoir Quality Comparison
Source: Citi and
W.D. Von Gonten & Co.
Point Pleasant Thins as Utica Thickens and Reservoir Parameters Improve
-
100’
-
300’
-
200’
-
0’
N. Coast Energy
C. Shaney #1
Harrison Co.
(near Buell 8H Well)
Newstar Energy
Toalston #1
Carroll Co.
(near Mangun 8H Well)
D&M
Lark #1
Mercer Co.
24 miles
48 miles
A
A’
Cross Section |
 NYSE:
HK 21
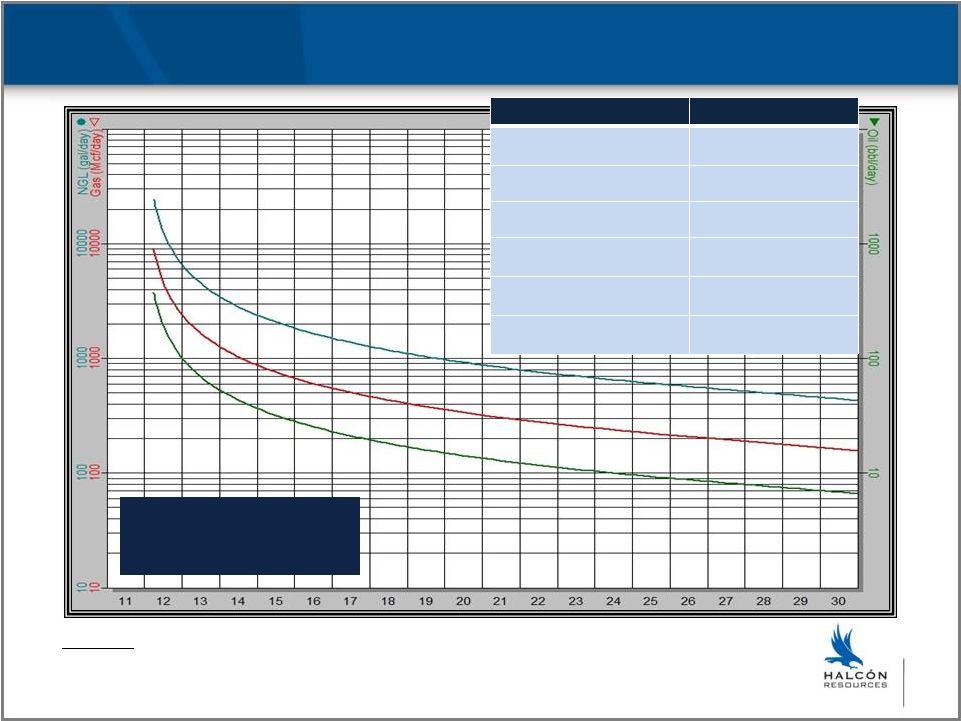
Utica/Point Pleasant Volatile Condensate Single Well Type Curve
Oil: EUR 150-250MBO
NGL: EUR 275-325MBNGL
Gas: EUR 4-5BCF
Play:
Utica/Point Pleasant
Estimated Avg. Well Cost:
$6.5-$7.5 MM
Estimated EUR:
1,250 MBoe
Target Acreage:
150,000-250,000 acres
Est. Spud-to-Production:
90 days
Rig Count Estimate:
2Q12: 1 2H12: 2
Wells Planned:
2012: 8-10
Note: Internal estimates based on third party data. Company has not drilled in this
play. Individual well results will differ. EUR estimate based upon
available data and may change as more data becomes available as well as our actual results of drilling and production.
See Additional Information on page 3. |
 NYSE:
HK 22
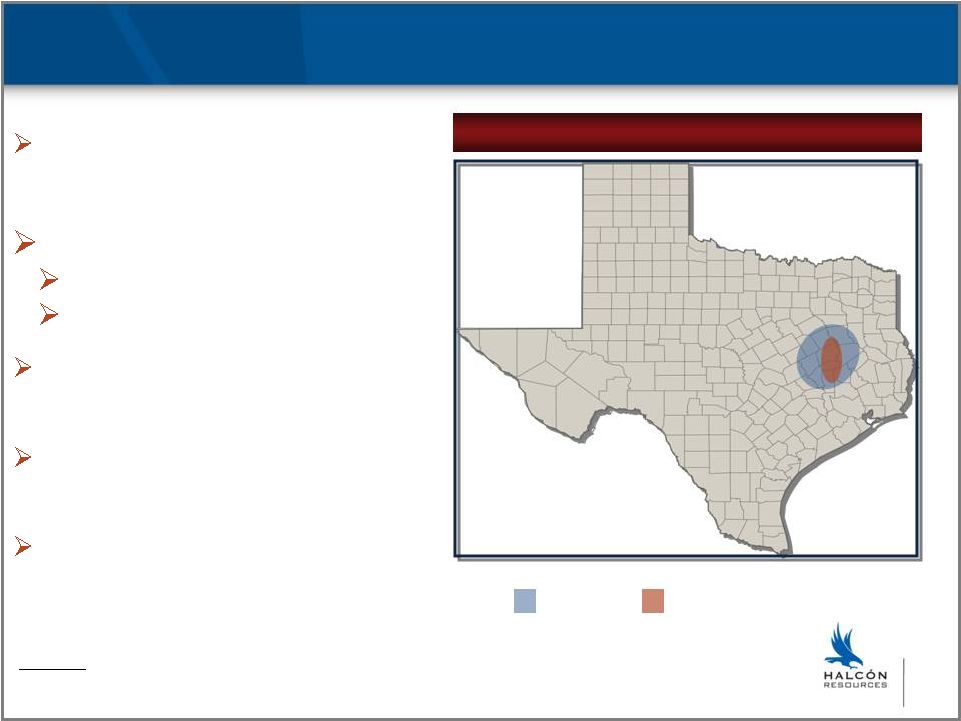
Woodbine Overview
TX
Woodbine
HK Target Acreage Area
Woodbine
Target Acreage: 150,000 –
250,000
Upper Cretaceous section ~40% silica
and clastics = deliverability
Regional studies indicate:
10%+ porosity
Current IP’s 3-4x higher vs. recent past
Geologically analogous to the Eagle
Ford in South Texas
Horizontal drilling and completion
techniques are a game changer
Premium pricing for oil, NGLs and gas
Source: Industry research. |
 NYSE:
HK 23
Woodbine Hydrocarbon System
23
Deltaic depositional system
Woodbine sands charged with
Eagle Ford sourced oil
Multiple Woodbine sand lenses
6,500’-
11,500’
depth
Play 1: High porosity, high
storage capacity sands
Play 2: Downdip, permeability
trapped sands
Eagle Ford
Buda
Woodbine
Woodbine Isopach
Source: Internal research. |
 24
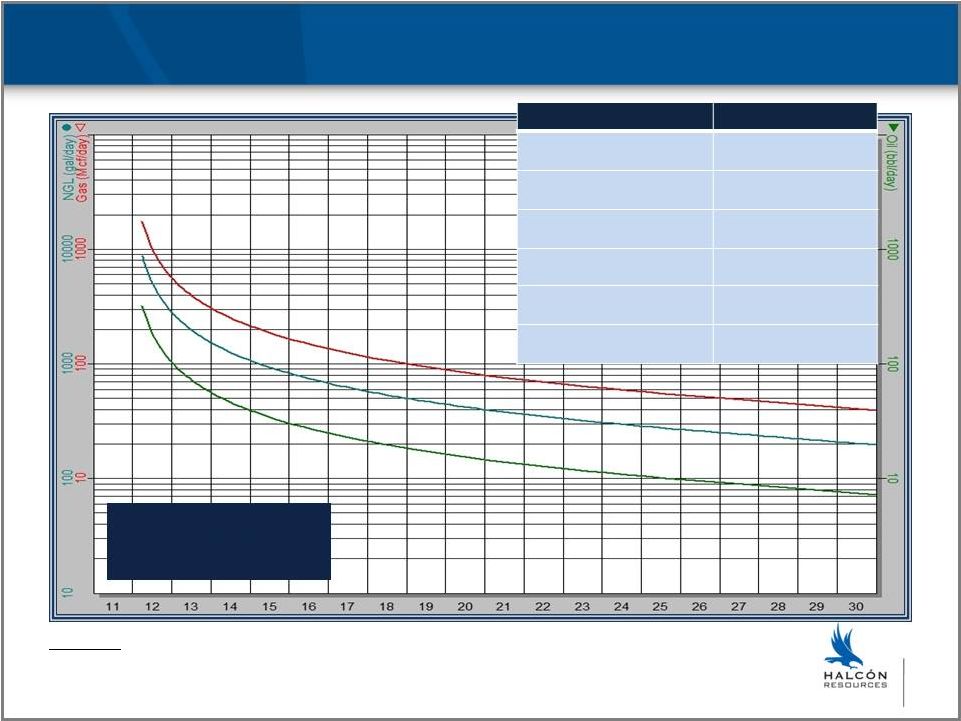
Woodbine Single Well Type Curve
Oil: EUR 350-450MBO
NGL: EUR 25-35MBNGL
Gas: EUR 200-300MMCF
NYSE: HK
Play:
Woodbine
Estimated Avg. Well Cost:
$5.5-$6.5 MM
Estimated EUR:
467 MBoe
Target Acreage:
150,000-250,000 acres
Est. Spud-to-Production:
60-90 days
Rig Count Estimate:
2Q12: 1 2H12: 2
Wells Planned:
2012: 10-15
Note: Internal estimates based on third party data. Company has not drilled in this
play. Individual well results will differ. EUR estimate based upon available data
and may change as more data becomes available as well as our actual results of drilling
and production. See Additional Information on page 3. |
 NYSE:
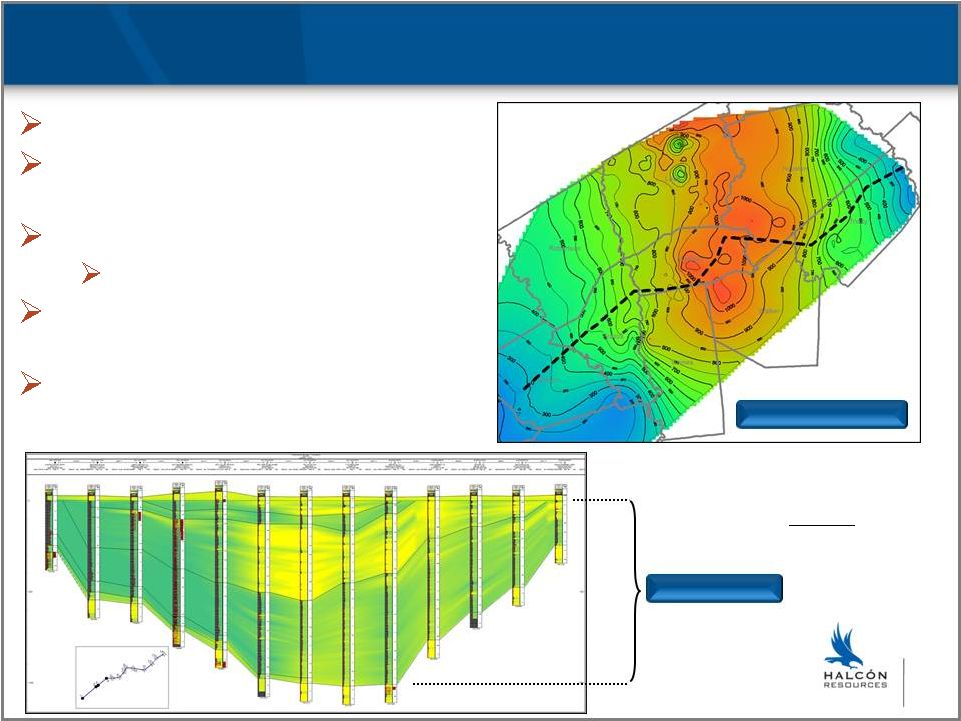
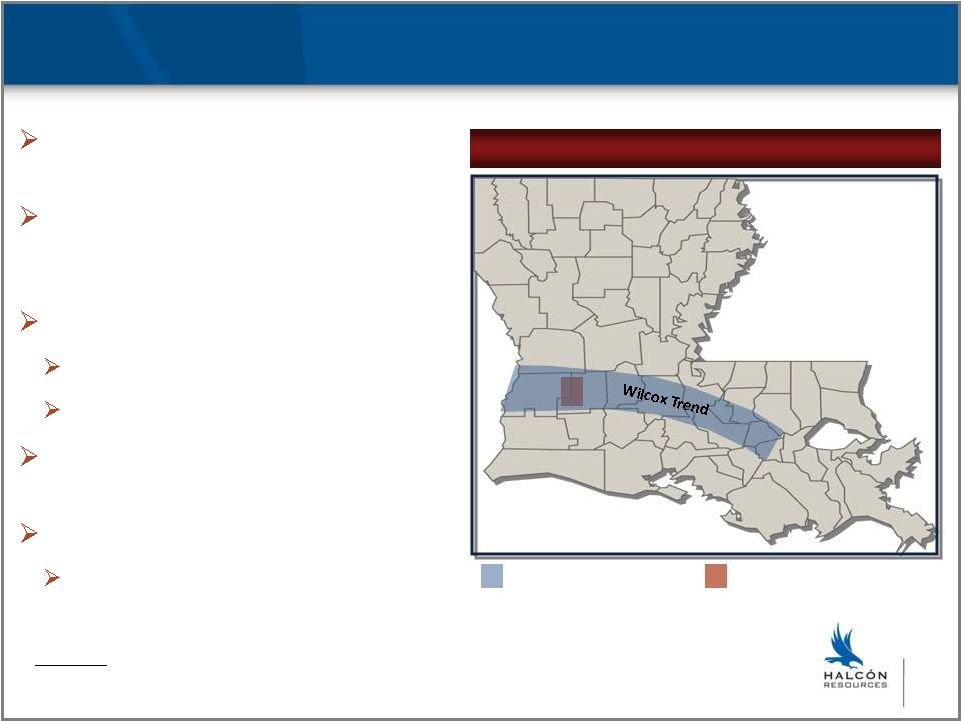
HK 25
Wilcox Overview
LA
Southwest LA Wilcox
HK 3D Shoot in Progress
Source: Industry research.
Oil-prone reservoir with significant
associated gas and NGLs
Production rate limits and
commingling restrictions removed
from Louisiana regulations
3D seismic essential to success
100 sq. mile 3D shoot in progress
36 sq. miles of existing 3D to be merged
Responsive to multi-stage hydraulic
fracturing
Premium pricing
LSS & high BTU gas
Target Acreage: 50,000 –
100,000 |
 NYSE:
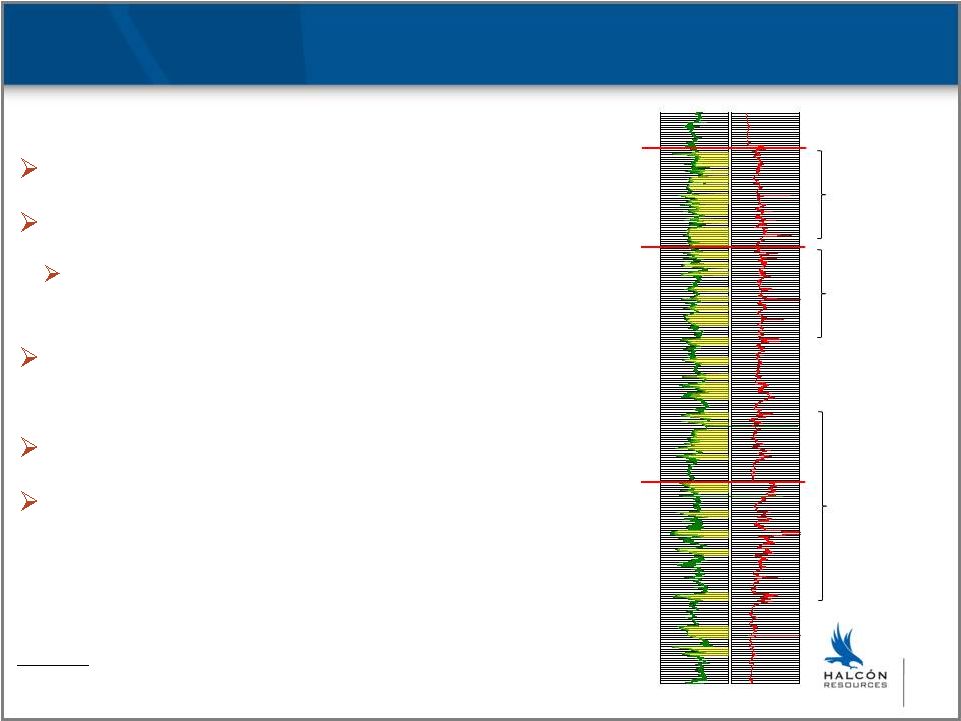
HK 26
Wilcox Log Section
Source: Industry research.
Eocene age tight sandstones
Target depths range from 8,500’-15,000’
Focus -
Middle and Lower Wilcox
(11,000’-15,000’)
Structurally controlled hydrocarbon
accumulation
Vertical wells
Multi-stage fracs
Upper Wilcox
Middle Wilcox
Lower Wilcox
Bivens
N. Bivens
N. Bancroft
18.2 MMBO
6.4 BCFG
Bearhead Creek
S. Bearhead Creek
Fields
W. Gordon
7.7 MMBO
32 BCFG
Neal
Quicksand Creek
Bon Weir
29 MMBO
37 BCFG |
 NYSE:
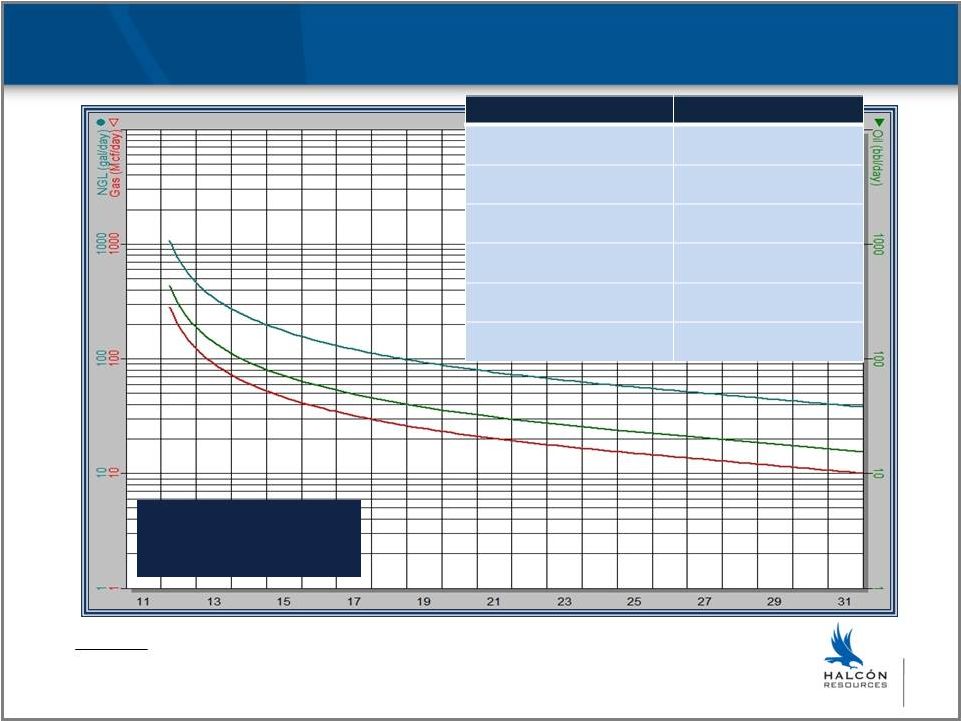
HK 27
Wilcox Single Well Type Curve
Oil: EUR 150-250MBO
NGL: EUR 100-200MBNGL
Gas: EUR 1-2BCF
Play:
Wilcox
Estimated Avg. Well Cost:
$7.5-$8.5 MM
Estimated EUR:
510
MBoe
Target Acreage:
50,000-100,000 acres
Est. Spud-to-Production:
60-90 days
Rig Count Estimate:
2Q12: 1 2H12: 1
Wells Planned:
2012: 4-6
Note: Internal estimates based on third party data. Company has not drilled in this
play. Individual well results will differ. EUR estimate based upon available data
and may change as more data becomes available as well as our actual results of drilling and
production. See Additional Information on page 3.
|
 NYSE:
HK 28
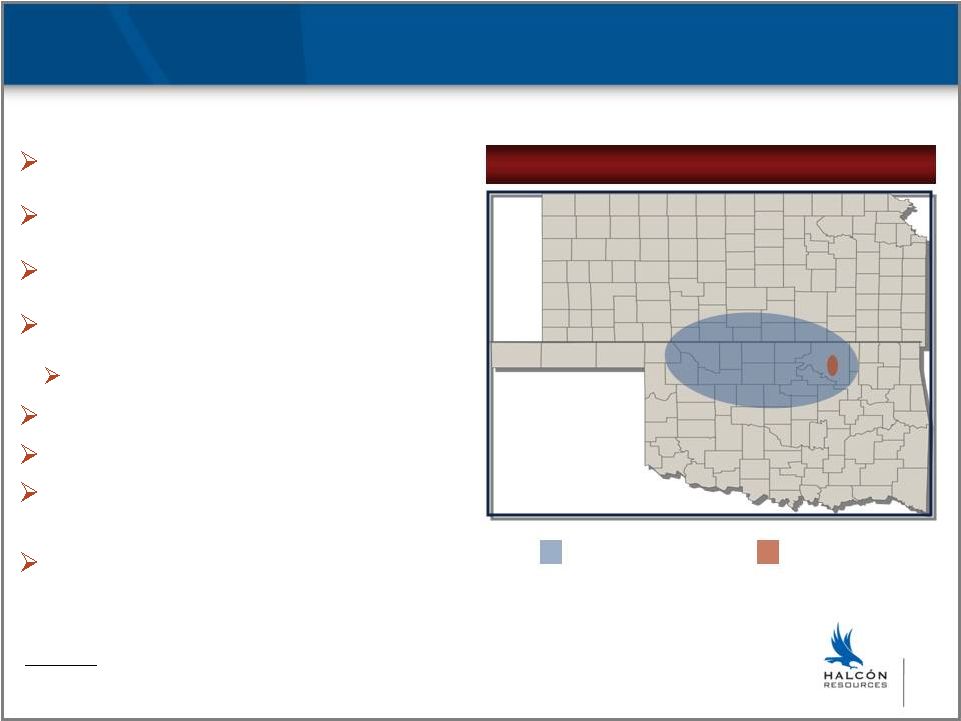
Mississippian Lime Overview
KS
OK
Mississippian Lime
HK Acreage
Mississippian Lime
Target Acreage: 50,000 -
100,000
(1)
Initially developed using vertical wells
Carbonate reservoir (high permeability)
Predominately oil production
Shallow drilling depths (4,000’-
6,000’)
200’-
500’
gross thickness
Technology reinvigorating the play
Scalability and repeatability
Commercial results from offset
operators
Recent internal technical evaluation
reinforces enthusiasm for the play
Source: Industry research.
(1) HK currently holds a concession for 45,280 gross/net acres. |
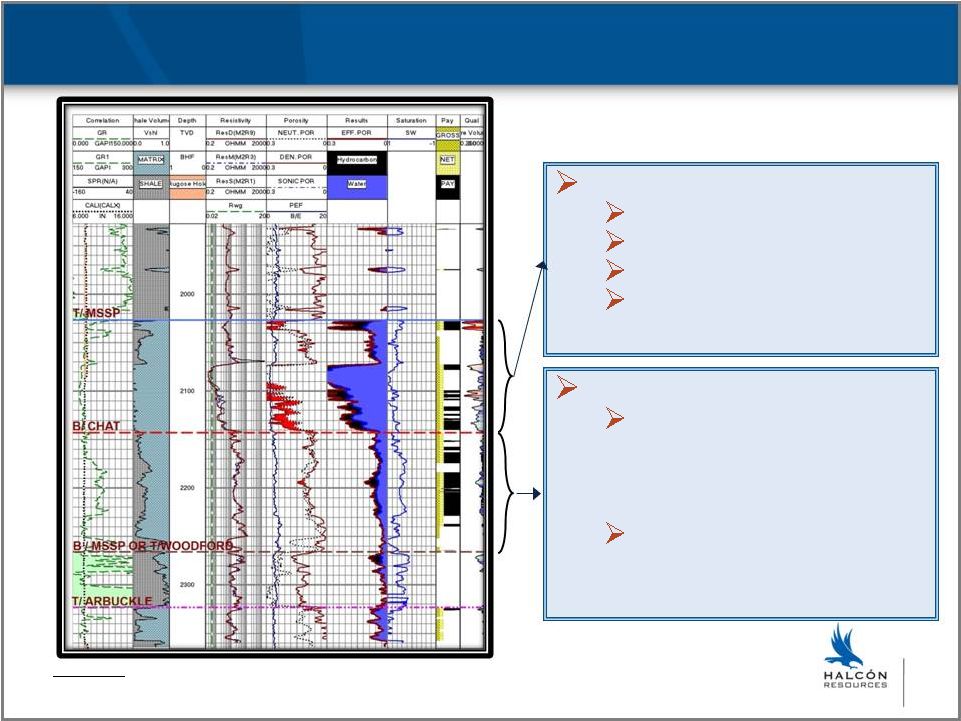 29
Mississippian Lime Log Section
Chat
High porosity (20-30%)
High permeability
Associated with karsting
High fluid volumes
Dense limestone
High porosity tripolitic chert
lenses embedded within the
low porosity/permeability
dense
Horizontal wells with multi-
stage fracs connect high
porosity lenses
Source: W.D. Von Gonten & Co.
NYSE: HK |
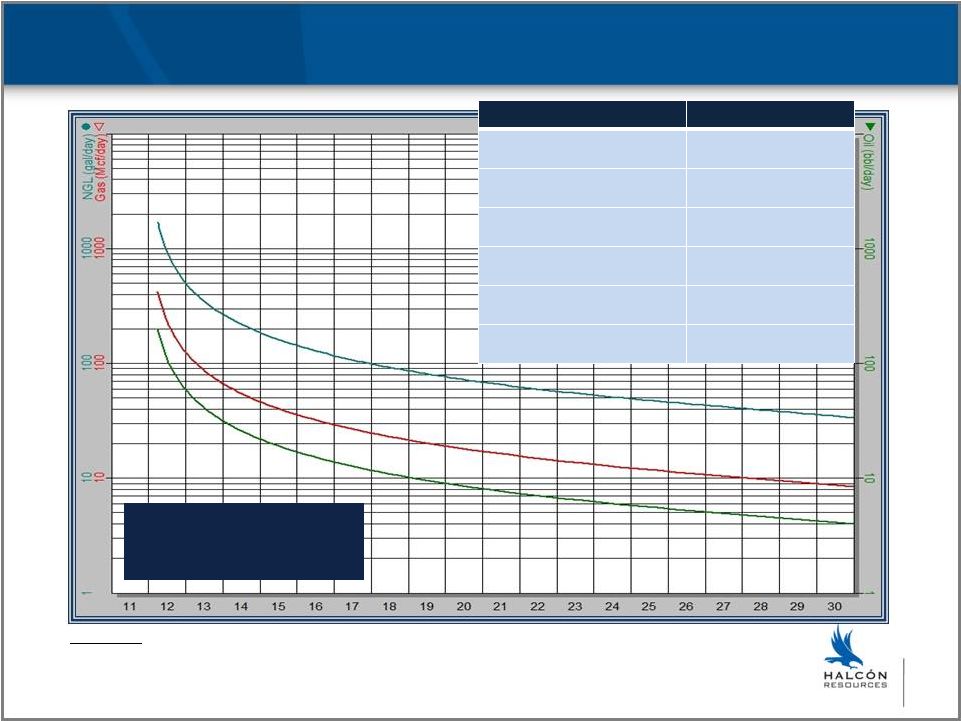 NYSE:
HK 30
Mississippian Lime Single Well Type Curve
Oil: EUR 100-150MBO
NGL: EUR 20-30MBNGL
Gas: EUR 300-350MMCF
Play:
Mississippian Lime
Estimated Avg. Well Cost:
$2.5-$3.5 MM
Estimated EUR
175 MBoe
Target Acreage:
50,000-100,000 acres
Est. Spud-to-Production:
60-90 days
Rig Count Estimate:
2Q12: 1 2H12: 2
Wells Planned:
2012: 8-10
Note: Internal estimates based on third party data. Company has not drilled in this
play. Individual well results will differ. EUR estimate based upon
available data and may change as more data becomes available as well as our actual results of drilling
and production. See Additional Information on page 3. |
 NYSE:
HK Exploratory Liquids Rich Plays -
undisclosed
Targeting 225,000 –
375,000 acres in aggregate
Two unconventional plays (100,000 –
150,000 acres each)
One conventional play (25,000 –
75,000 acres)
Will drill in all three plays in 2012
8-12 wells
Oil and liquids-rich targets
Prospect identification driven by technical analysis and experience
Due to competitive concerns, not disclosing details at this time
31 |
 NYSE:
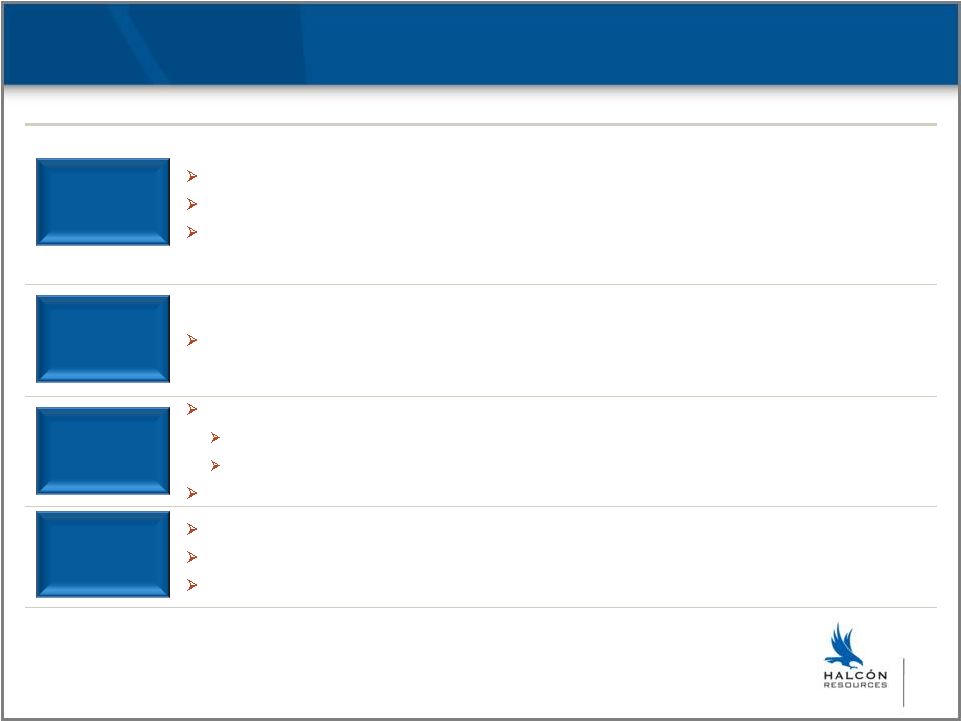
HK Investment Highlights
Proven Management Team With Significant Ownership Stake
Proven Management Team With Significant Ownership Stake
Technical Bias With Extensive Resource Play Experience
Technical Bias With Extensive Resource Play Experience
Attractive Liquids-Rich Asset Portfolio With Compelling Economics
Attractive Liquids-Rich Asset Portfolio With Compelling Economics
Positioned For Significant Near-Term Reserve And Production Growth
Positioned For Significant Near-Term Reserve And Production Growth
Excellent Track Record For Managing Cash Margin –
Excellent Track Record For Managing Cash Margin –
The “Best Hedge”
The “Best Hedge”
Solid Balance Sheet And Liquidity To Fund Growth
Solid Balance Sheet And Liquidity To Fund Growth
32 |
 NYSE:
HK “Oily”
(69% Liquids)
Strong growth profile (+25% in 2012)
Adds two established liquids rich resource plays
Austin Chalk potential
Solid production base
Immediately accretive
New HK shareholders
33
HK to Acquire GEOI |
 Appendix |
 NYSE:
HK 35
Pro Forma Production and Reserves (69% Liquids)
2011 Average Net
Daily Production
Proved Reserves
(1)
Boe/d
Full Year
4Q
Oil
MBbls
Gas
MMcf
NGL
MBbls
Equiv.
Mboe
%
Oil/NGLs
% PD
% Total
Reserves
PV10
(1)
($MM)
% Total
PV10
Resource Style
Bakken
1,560
1,998
6,264
3,040
273
7,044
93%
59%
13%
$183.9
18%
Eagle Ford
106
176
890
349
69
1,017
94%
17%
2%
$16.4
2%
Austin Chalk
2,412
2,581
1,279
34,987
1,293
8,403
31%
68%
16%
$99.0
9%
4,078
4,755
8,433
38,376
1,635
16,464
61%
61%
31%
$299.3
29%
Conventional
Electra/Burkburnett
1,329
1,325
5,889
-
328
6,217
100%
65%
12%
$151.5
15%
Fitts-Allen
826
822
4,916
1,437
79
5,235
95%
74%
10%
$129.4
12%
South Texas
865
732
317
21,246
1,280
5,139
31%
42%
10%
$48.3
5%
South Lousiana
1,146
1,235
3,725
14,499
-
6,141
61%
70%
12%
$142.0
14%
Permian
322
322
1,205
2,087
44
1,597
78%
72%
3%
$46.3
4%
Other
1,793
1,879
8,166
20,852
365
12,007
71%
85%
23%
$228.0
22%
6,282
6,315
24,219
60,121
2,096
36,335
72%
71%
69%
$745.5
71%
Total
10,360
11,070
32,652
98,497
3,731
52,799
69%
68%
100%
$1,044.9
100%
% Increase vs. HK Stand-Alone
151%
171%
164%
146%
86%
151%
1%
6%
167%
(1) Estimated proved reserves and PV10 at 12.31.11 using SEC pricing including
GeoResources’ management estimates of 12.31.11 proved reserves and PV10
associated with Brookeland field acquisition using SEC pricing. Note: Production figures are pro forma to include GeoResources’ Brookeland field
acquisition; proved reserve and PV10 figures exclude approximately 1.2 MMBoe (96%
gas) of proved reserves and $11 MM of PV10 associated with GP interest in partnerships with GE. |
 NYSE:
HK 36
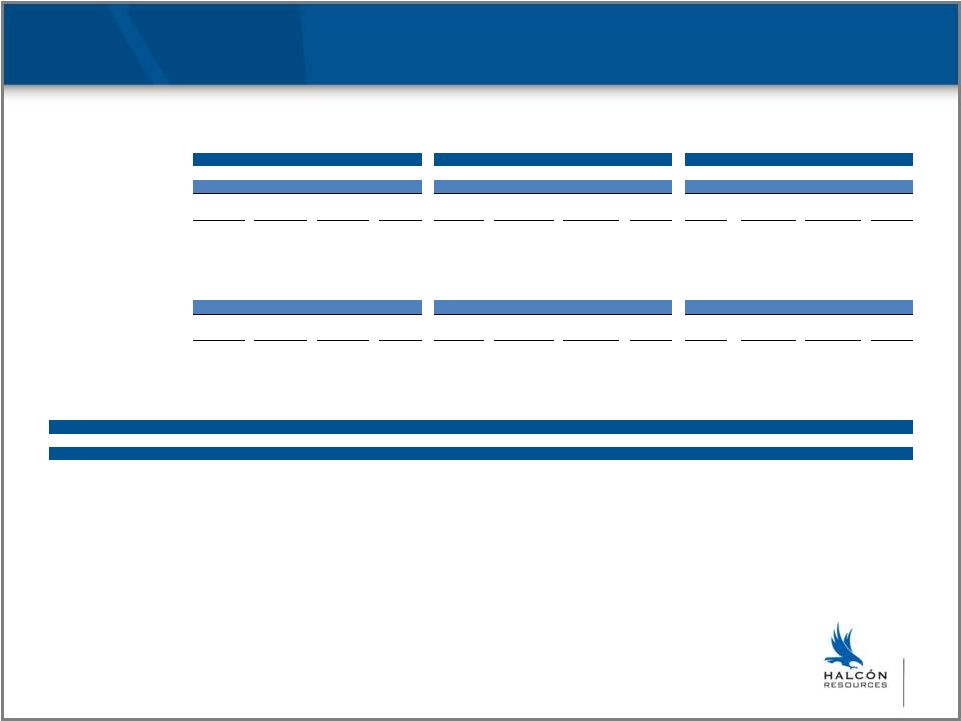
Pro Forma Derivative Summary
*Weighted averaged price
FY 2012
FY 2013
FY 2014
OIL
OIL
OIL
Volume
(Bbls)
Ceiling /
Swap Price*
Floor
Purchased*
Floor
Sold*
Volume
(Bbls)
Ceiling / Swap
Price*
Floor
Purchased*
Floor
Sold*
Volume
(Bbls)
Ceiling /
Swap Price*
Floor
Purchased*
Floor
Sold*
Three-Way Collars
400,500
$104.89
$87.11
$70.00
251,075
$100.60
$95.18
$70.00
280,500
$99.59
$95.00
$70.00
Collars
419,300
$105.85
$84.42
350,875
$100.04
$95.00
-
-
-
-
Swaps
660,000
$98.62
-
-
360,000
$102.18
-
-
-
-
-
-
Puts
-
-
-
-
-
-
-
-
-
-
-
-
GAS
GAS
GAS
Volume
(MMBtu)
Ceiling /
Swap Price*
Floor
Purchased*
Floor
Sold*
Volume
(MMBtu)
Ceiling / Swap
Price*
Floor
Purchased*
Floor
Sold*
Volume
(MMBtu)
Ceiling /
Swap Price*
Floor
Purchased*
Floor
Sold*
Three-Way Collars
-
-
-
-
-
-
-
-
-
-
-
-
Collars
915,000
$6.00
$4.00
-
-
-
-
-
-
-
-
-
Swaps
1,720,000
$5.15
-
-
465,000
$4.18
-
-
-
-
-
-
Puts
609,700
-
$4.35
-
-
-
-
-
-
-
-
-
Total (Boe)
1,918,967
1,039,450
280,500
Total (Boe/d)
5,243
2,848
768 |
    NYSE: HK
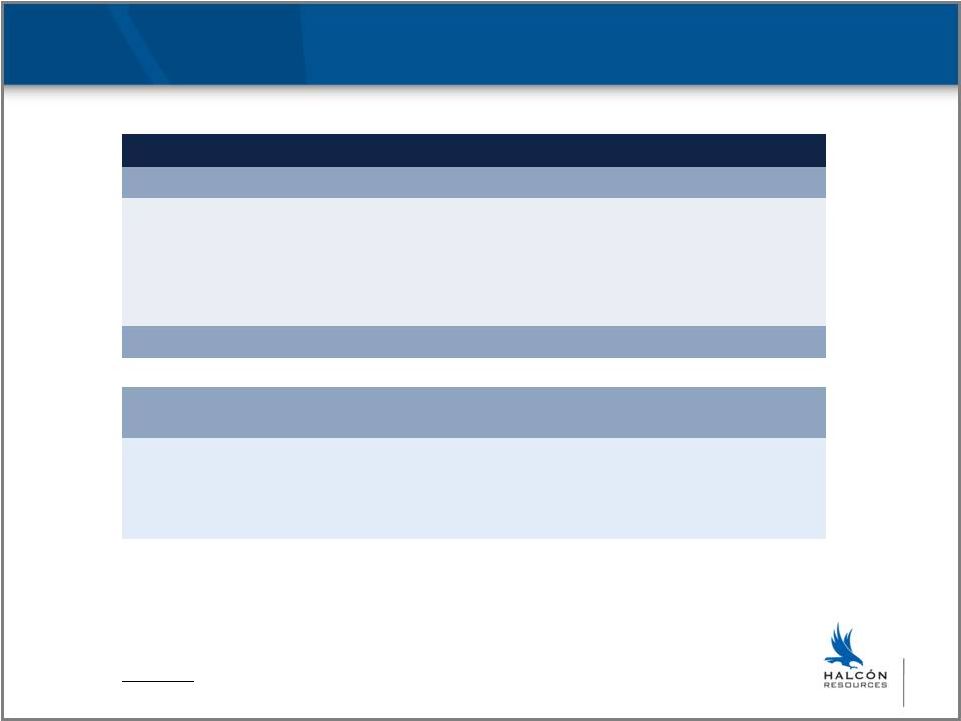
$550 Million Recap
(1)
Halcón/RAM Transaction Summary
37
Ticker change to HK
(effective 2.9.12)
Reverse stock split (1:3)
(effective 2.10.12)
New credit facility with
undrawn borrowing base of
$225 million
$275 million common equity
$275 million convertible note
36.7 million warrants
Why RAM Energy Resources?
Solid platform
Concentrated ownership
Oil levered
Simple balance sheet
Attractive valuation
New Senior
Management
and Board
Stock Listing
Modifications
(1) Common equity issued at $3.75 per share; convertible note yields 8% with a 5 year term and
is convertible at $4.50 per share after February 8, 2014; warrants exercisable at
$4.50 per share; Investor group partnering with Halcón management includes EnCap Investments L.P.,
Liberty Energy Holdings LLC, and Mansefeldt Investment Corp.
|
 Contact:
Scott
Zuehlke,
Director
of
Investor
Relations
1000 Louisiana St., Suite 6700, Houston, TX 77002
832-538-0314
szuehlke@halconresources.com
www.halconresources.com |