Attached files
| file | filename |
|---|---|
| EX-10.13 - EX-10.13 - BATTALION OIL CORP | a2227173zex-10_13.htm |
| EX-10.25 - EX-10.25 - BATTALION OIL CORP | a2227173zex-10_25.htm |
| EX-21.1 - EX-21.1 - BATTALION OIL CORP | a2227173zex-21_1.htm |
| EX-23.2 - EX-23.2 - BATTALION OIL CORP | a2227173zex-23_2.htm |
| EX-99.1 - EX-99.1 - BATTALION OIL CORP | a2227173zex-99_1.htm |
| EX-23.1 - EX-23.1 - BATTALION OIL CORP | a2227173zex-23_1.htm |
| EX-3.1.1 - EX-3.1.1 - BATTALION OIL CORP | a2227173zex-3_11.htm |
| EX-12.1 - EX-12.1 - BATTALION OIL CORP | a2227173zex-12_1.htm |
| EX-31.2 - EX-31.2 - BATTALION OIL CORP | a2227173zex-31_2.htm |
| EX-32 - EX-32 - BATTALION OIL CORP | a2227173zex-32.htm |
| EX-31.1 - EX-31.1 - BATTALION OIL CORP | a2227173zex-31_1.htm |
| EX-10.24 - EX-10.24 - BATTALION OIL CORP | a2227173zex-10_24.htm |
Use these links to rapidly review the document
TABLE OF CONTENTS
ITEM 8. CONSOLIDATED FINANCIAL STATEMENTS AND SUPPLEMENTARY DATA
UNITED STATES
SECURITIES AND EXCHANGE COMMISSION
WASHINGTON, D.C. 20549
FORM 10-K
ANNUAL REPORT PURSUANT TO SECTION 13 OR 15(d) OF
THE SECURITIES EXCHANGE ACT OF 1934
For the fiscal year ended December 31, 2015
Commission File Number: 001-35467
Halcón Resources Corporation
(Exact name of registrant as specified in its charter)
| Delaware (State or other jurisdiction of incorporation or organization) |
20-0700684 (I.R.S. Employer Identification Number) |
|
1000 Louisiana Street, Suite 6700, Houston, TX 77002 (Address of principal executive offices) |
||
(832) 538-0300
(Registrant's telephone number)
Securities registered pursuant to Section 12(b) of the Act:
| Title of each class | Name of each exchange on which registered | |
|---|---|---|
| Common Stock, par value $.0001 per share | New York Stock Exchange |
Securities registered pursuant to Section 12(g) of the Act: None
Indicate by check mark if the registrant is a well-known seasoned issuer, as defined in Rule 405 of the Securities Act. Yes o No ý
Indicate by check mark if the registrant is not required to file reports pursuant to Section 13 or Section 15(d) of the Act. Yes o No ý
Indicate by check mark whether the registrant (1) has filed all reports required to be filed by Section 13 or 15(d) of the Securities Exchange Act of 1934 during the preceding 12 months (or for such shorter period that the registrant was required to file such reports) and (2) has been subject to such filing requirements for the past 90 days. Yes ý No o
Indicate by check mark whether the registrant has submitted electronically and posted on its corporate Web site, if any, every Interactive Data File required to be submitted and posted pursuant to Rule 405 of Regulation S-T (§232.405 of this chapter) during the preceding 12 months (or for such shorter period that the registrant was required to submit and post such files). Yes ý No o
Indicate by check mark if disclosure of delinquent filers pursuant to Item 405 of Regulation S-K (§229.405 of this chapter) is not contained herein, and will not be contained, to the best of registrant's knowledge, in definitive proxy or information statements incorporated by reference in Part III of this Form 10-K or any amendment to this Form 10-K. o
Indicate by check mark whether the registrant is a large accelerated filer, an accelerated filer, a non-accelerated filer, or a smaller reporting company. See the definition of "large accelerated filer," "accelerated filer" and "smaller reporting company" in Rule 12b-2 of the Exchange Act.
| Large accelerated filer o | Accelerated filer ý | Non-accelerated filer o (Do not check if a smaller reporting company) |
Smaller reporting company o |
Indicate by check mark whether the registrant is a shell company (as defined in Rule 12b-2 of the Act). Yes o No ý
As of February 23, 2016, there were 122,370,159 shares outstanding of registrant's $.0001 par value common stock. Based upon the closing price for the registrant's common stock on the New York Stock Exchange as of June 30, 2015, the aggregate market value of shares of common stock held by non-affiliates of the registrant was approximately $468.5 million.
DOCUMENTS INCORPORATED BY REFERENCE
Information required by Part III, Items 10, 11, 12, 13, and 14, is incorporated by reference to portions of the registrant's definitive proxy statement for its 2016 annual meeting of stockholders which will be filed no later than 120 days after December 31, 2015.
1
Special note regarding forward-looking statements
This Annual Report on Form 10-K contains forward-looking statements within the meaning of the federal securities laws. All statements, other than statements of historical facts, concerning, among other things, planned capital expenditures, potential increases in oil and natural gas production, the number and location of wells to be drilled in the future, future cash flows and borrowings, pursuit of potential acquisition or divestiture opportunities, our financial position, business strategy and other plans and objectives for future operations, are forward-looking statements. These forward-looking statements are identified by their use of terms and phrases such as "may," "expect," "estimate," "project," "plan," "objective," "believe," "predict," "intend," "achievable," "anticipate," "will," "continue," "potential," "should," "could" and similar terms and phrases. Although we believe that the expectations reflected in these forward-looking statements are reasonable, they do involve certain assumptions, risks and uncertainties. Actual results could differ materially from those anticipated in these forward-looking statements. Readers should consider carefully the risks described under the "Risk Factors" section of this report and other sections of this report which describe factors that could cause our actual results to differ from those anticipated in forward-looking statements, including, but not limited to, the following factors:
- •
- volatility in commodity prices for oil and natural gas, including the current sustained decline in the price for oil;
- •
- our ability to generate sufficient cash flow from operations, borrowings or other sources to enable us to fund our operations, satisfy
our obligations and fully develop our undeveloped acreage positions;
- •
- we have substantial indebtedness and may incur more debt;
- •
- higher levels of indebtedness make us more vulnerable to economic downturns and adverse developments in our business;
- •
- our ability to replace our oil and natural gas reserves;
- •
- our ability to successfully develop our large inventory of undeveloped acreage in our resource plays;
- •
- our ability to retain key members of senior management, the board, and key technical employees;
- •
- access to and availability of water and other treatment materials to carry out planned fracture stimulations in our resource plays;
- •
- access to adequate gathering systems, processing facilities, transportation take-away capacity to move our production to market and
marketing outlets to sell our production at market prices;
- •
- the presence or recoverability of estimated oil and natural gas reserves and the actual future production rates and associated costs;
- •
- contractual limitations that affect our management's discretion in managing our business, including covenants that, among other
things, limit our ability to incur debt, make investments and pay cash dividends;
- •
- the potential for production decline rates for our wells to be greater than we expect;
- •
- competition, including competition for acreage in resource play holdings;
- •
- environmental risks;
- •
- drilling and operating risks;
2
- •
- exploration and development risks;
- •
- the possibility that the industry may be subject to future regulatory or legislative actions (including additional taxes and changes
in environmental regulations);
- •
- general economic conditions, whether internationally, nationally or in the regional and local market areas in which we do business,
may be less favorable than expected, including the possibility that economic conditions in the United States will worsen and that capital markets are disrupted, which could adversely affect demand for
oil and natural gas and make it difficult to access capital;
- •
- social unrest, political instability or armed conflict in major oil and natural gas producing regions outside the United States, such
as the Middle East, and armed conflict or acts of terrorism or sabotage;
- •
- other economic, competitive, governmental, regulatory, legislative, including federal, state and tribal regulations and laws,
geopolitical and technological factors that may negatively impact our business, operations or oil and natural gas prices;
- •
- our ability to successfully integrate acquired oil and natural gas businesses and operations;
- •
- the possibility that acquisitions and divestitures may involve unexpected costs or delays, and that acquisitions may not achieve
intended benefits and may divert management's time and energy;
- •
- the insurance coverage maintained by us may not adequately cover all losses that we may sustain;
- •
- title to the properties in which we have an interest may be impaired by title defects;
- •
- senior management's ability to execute our plans to meet our goals;
- •
- the cost and availability of goods and services, such as drilling rigs, fracture stimulation services and tubulars; and
- •
- our dependency on the skill, ability and decisions of third party operators of the oil and natural gas properties in which we have a non-operated working interest.
All forward-looking statements are expressly qualified in their entirety by the cautionary statements in this paragraph and elsewhere in this document. Other than as required under the securities laws, we do not assume a duty to update these forward-looking statements, whether as a result of new information, subsequent events or circumstances, changes in expectations or otherwise.
Glossary of Oil and Natural Gas Terms
The definitions set forth below apply to the indicated terms as used in this report. All volumes of natural gas referred to herein are stated at the legal pressure base of the state or area where the reserves exist at 60 degrees Fahrenheit and in most instances are rounded to the nearest major multiple.
Bbl. One stock tank barrel, or 42 U.S. gallons liquid volume, used herein in reference to crude oil or other liquid hydrocarbons.
Bcf. One billion cubic feet of natural gas.
Boe. Barrels of oil equivalent in which six Mcf of natural gas equals one Bbl of oil. This ratio does not assume price equivalency and, given price differentials, the price for a barrel of oil equivalent for natural gas may differ significantly from the price for a barrel of oil.
Boe/d. Barrels of oil equivalent per day.
3
Btu. British thermal unit, which is the heat required to raise the temperature of a one-pound mass of water from 58.5 to 59.5 degrees Fahrenheit.
Completion. The installation of permanent equipment for the production of oil or natural gas or, in the case of a dry hole, the reporting of abandonment to the appropriate agency.
Developed property. Property where wells have been drilled and production equipment has been installed.
Development well. A well drilled within the proved areas of an oil or natural gas reservoir to the depth of a stratigraphic horizon known to be productive.
Dry hole or well. A well found to be incapable of producing hydrocarbons in sufficient quantities such that proceeds from the sale of such production exceed production expenses and taxes.
Extension well. A well drilled to extend the limits of a known reservoir.
Exploratory well. A well drilled to find a new field or to find a new reservoir in a field previously found to be productive of oil or natural gas in another reservoir.
Field. An area consisting of a single reservoir or multiple reservoirs all grouped on or related to the same individual geological structural feature and/or stratigraphic condition.
Gross acres or gross wells. The total acres or wells, as the case may be, in which a working interest is owned.
Hydraulic fracturing. The injection of water, sand and chemicals under pressure into rock formations to stimulate oil and natural gas production.
MBbls. One thousand barrels of crude oil or other liquid hydrocarbons.
MBoe. One thousand Boe.
MMBoe. One million Boe.
Mcf. One thousand cubic feet of natural gas.
MMBbls. One million barrels of crude oil or other liquid hydrocarbons.
MMBtu. One million Btu.
MMcf. One million cubic feet of natural gas.
Net acres or net wells. The sum of the fractional working interests owned in gross acres or gross wells, as the case may be.
Operator. The individual or company responsible for the exploration, exploitation and production of an oil or natural gas well or lease.
Productive well. A well that is found to be capable of producing hydrocarbons in sufficient quantities such that proceeds from the sale of such production exceed production expenses and taxes.
Proved developed producing reserves. Proved developed reserves that are expected to be recovered from completion intervals currently open in existing wells and capable of production.
Proved developed reserves. Proved reserves that are expected to be recovered from existing wellbores, whether or not currently producing, without drilling additional wells. Production of such reserves may require a recompletion.
4
Proved reserves. Those quantities of oil and natural gas, which, by analysis of geoscience and engineering data, can be estimated with reasonable certainty to be economically producible—from a given date forward, from known reservoirs, and under existing economic conditions, operating methods, and government regulations—prior to the time at which contracts providing the right to operate expire, unless evidence indicates that renewal is reasonably certain, regardless of whether deterministic or probabilistic methods are used for estimation.
Proved undeveloped location. A site on which a development well can be drilled consistent with spacing rules for purposes of recovering proved undeveloped reserves.
Proved undeveloped reserves. Proved reserves that are expected to be recovered from new wells on undrilled acreage or from existing wells where a relatively major expenditure is required for recompletion.
Recompletion. The completion for production of an existing wellbore in another formation from that in which the well has been previously completed.
Reserve-to-production ratio or Reserve life. A ratio determined by dividing our estimated existing reserves determined as of the stated measurement date by production from such reserves for the prior twelve month period.
Reservoir. A porous and permeable underground formation containing a natural accumulation of producible oil and/or natural gas that is confined by impermeable rock or water barriers and is individual and separate from other reservoirs.
Spud. Commencement of actual drilling operations.
3-D seismic. The method by which a three dimensional image of the earth's subsurface is created through the interpretation of reflection seismic data collected over a surface grid. 3-D seismic surveys allow for a more detailed understanding of the subsurface than do conventional surveys and contribute significantly to field appraisal, exploitation and production.
Undeveloped acreage. Lease acreage on which wells have not been drilled or completed to a point that would permit the production of commercial quantities of oil and natural gas regardless of whether such acreage contains proved reserves.
Working interest. The operating interest that gives the owner the right to drill, produce and conduct operating activities on the property and a share of production.
Workover. Operations on a producing well to restore or increase production.
5
Overview
Unless the context otherwise requires, all references in this report to "Halcón," "our," "us," and "we" refer to Halcón Resources Corporation (formerly known as RAM Energy Resources, Inc.) and its subsidiaries, as a common entity. On December 28, 2015, we completed a one-for-five reverse stock split of our common stock. All share and per share information in this report has been adjusted to reflect the reverse stock split.
We are an independent energy company focused on the acquisition, production, exploration and development of onshore liquids-rich oil and natural gas assets in the United States. We were incorporated in Delaware on February 5, 2004 and were recapitalized on February 8, 2012. During 2012, we focused our efforts on the acquisition of unevaluated leasehold and producing properties in selected prospect areas, providing us with an extensive drilling inventory in multiple basins that we believe allow for multiple years of production and broad flexibility to direct our capital resources to projects with the greatest potential returns. In the years since, we focused on the development of acquired properties and also divested non-core assets in order to fund activities in our core resource plays. Our oil and natural gas assets consist of proved reserves and undeveloped acreage positions in unconventional liquids-rich basins/fields. We have acquired acreage and may acquire additional acreage in the Bakken / Three Forks formations in North Dakota and the Eagle Ford formation in East Texas, as well as other areas.
At December 31, 2015, our estimated total proved oil and natural gas reserves, as prepared by our independent reserve engineering firm, Netherland, Sewell & Associates, Inc. (Netherland, Sewell) using SEC prices of $50.28 per Bbl of oil and $2.587 per MMBtu of natural gas, were approximately 146.8 MMBoe, consisting of 120.7 MMBbls of oil, 13.0 MMBbls of natural gas liquids, and 78.4 Bcf of natural gas. Approximately 56% of our proved reserves were classified as proved developed as of December 31, 2015. We maintain operational control of approximately 95% of our proved reserves.
Our total operating revenues for 2015 were approximately $550.3 million. This represents a 52% decrease in operating revenues year over year, which was driven by the sustained decline in the prices of crude oil and natural gas. Full year 2015 production averaged 41,542 Boe/d compared to 42,107 Boe/d in 2014, resulting in a slight decrease in our average daily production year over year. We have curtailed our drilling in response to the decline in commodity prices. However, production volumes associated with our core properties in the Bakken / Three Forks formations and the Eagle Ford formation in East Texas (which we refer to as "El Halcón") remained flat or slightly increased year over year as we have focused our drilling efforts on our most economic areas due to the current price environment. These areas collectively accounted for approximately 38,500 Boe/d, or 93% of our production in 2015. Our remaining production was associated with various non-core properties. In 2015, we participated in the drilling of 184 gross (49.0 net) wells, all of which were completed and capable of production.
Recent Developments
The prices of crude oil and natural gas have declined dramatically since mid-year 2014, having recently reached multiyear lows, as a result of robust non Organization of the Petroleum Exporting Countries' (OPEC) supply growth led by unconventional production in the United States, weakening demand in emerging markets, and OPEC's decision to continue to produce at current levels. These market dynamics have led many to conclude that commodity prices are likely to remain lower for a prolonged period. In response to these developments, among other things, we have reduced our spending and completed a series of transactions (described in more detail below) that resulted in the
6
reduction of our long-term debt by approximately $1.0 billion and reduced our annual interest burden by approximately $53.5 million. We also extended the maturity date and amended other provisions of certain of our debt agreements. We are continuing to actively explore and evaluate various strategic alternatives to reduce the level of our long-term debt and lower our future cash interest obligations, including through debt repurchases, exchanges of existing debt securities for new debt securities and exchanges or conversions of existing debt securities for new equity securities, among other options. The timing and outcome of these efforts is highly uncertain. One or more of these alternatives could potentially be consummated without the consent of any one or more of our current security holders and, if consummated, could be dilutive to the holders of our outstanding equity securities and adversely affect the trading prices and values of our current debt and equity securities. Although we believe that we will have adequate liquidity over the next twelve months to operate our business and to meet our cash requirements, based on current market conditions, we believe that a reduction in our long-term debt and cash interest obligations is needed to improve our financial position and flexibility and to position us to take advantage of opportunities that may arise out of the current industry downturn.
Senior Unsecured Notes Exchanged for Senior Secured Second Lien Notes due 2022
On December 21, 2015, we completed the issuance of approximately $112.8 million aggregate principal amount of new 12.0% second lien senior secured notes due 2022 (the 2022 Second Lien Notes) in exchange for approximately $289.6 million principal amount of our senior unsecured notes, consisting of $116.6 million principal amount of our 9.75% senior notes due 2020, $137.7 million principal amount of our 8.875% senior notes due 2021 and $35.3 million principal amount of our 9.25% senior notes due 2022 in a public tender. At closing, we paid all accrued and unpaid interest since the respective interest payment dates of the notes surrendered in the exchange. As a result of the issuance of the 2022 Second Lien Notes, our borrowing base under our Senior Credit Agreement was reduced from $850.0 million to approximately $827.4 million. See Item 8. Consolidated Financial Statements and Supplementary Data—Note 5, "Long-term Debt" for additional information on the 2022 Second Lien Notes and the accounting for the exchange.
Amendments to the Senior Credit Agreement
On October 29, 2015, we entered into the Twelfth Amendment to our Senior Credit Agreement (the Twelfth Amendment) which, among other things, provided us additional flexibility with respect to exchanges and repurchases of senior unsecured notes; reaffirmed the borrowing base; and scheduled our next borrowing base redetermination for March 2016. We expect the borrowing base to be confirmed between $650.0 million to $700.0 million in this redetermination.
On September 10, 2015, in conjunction with the issuance of the Third Lien Notes (defined below), we entered into the Eleventh Amendment to our Senior Credit Agreement (the Eleventh Amendment) which, among other things, permitted us to incur the debt under the Third Lien Notes and to grant the liens in connection therewith; excluded the Third Lien Notes for the calculation of the total secured debt to EBITDA ratio; and reduced the borrowing base under our Senior Credit Agreement to $850.0 million.
On May 1, 2015, in conjunction with the issuance of the 2020 Second Lien Notes (defined below), we entered into the Tenth Amendment to our Senior Credit Agreement (the Tenth Amendment) which among other things, permitted us to incur the debt under the 2020 Second Lien Notes and to grant the liens in connection therewith; replaced the interest coverage ratio covenant that had been modified in the Ninth Amendment with a covenant that requires the ratio of our total secured debt (excluding the Third Lien Notes pursuant the Eleventh Amendment) to EBITDA (as defined in the Senior Credit Agreement) be no greater than 2.75 to 1.00; reduced the borrowing base; and extended the maturity date of the Senior Credit Agreement to August 1, 2019. Prior to the Tenth Amendment, under the Ninth Amendment executed on February 25, 2015, the Senior Credit Agreement had a required
7
minimum coverage of interest expenses of not less than 2.0 to 1.0 through March 31, 2016 and not less than 2.5 to 1.0 for subsequent periods.
Repurchase of Senior Unsecured Notes
During the fourth quarter of 2015, we repurchased approximately $44.5 million principal amount of our senior unsecured notes, consisting of $6.2 million principal amount of our 9.75% senior notes due 2020, $28.0 million principal amount of our 8.875% senior notes due 2021, and $10.3 million principal amount of our 9.25% senior notes due 2022. The net cash used to make these repurchases was approximately $14.8 million. Upon the settlement of each repurchase, we paid all accrued and unpaid interest since the respective interest payment dates of the notes repurchased.
Senior Unsecured Notes Exchanged for Senior Secured Third Lien Notes
On September 10, 2015, we issued approximately $1.02 billion aggregate principal amount of new 13.0% third lien senior secured notes due 2022 (the Third Lien Notes) in exchange for approximately $1.57 billion principal amount of our senior unsecured notes, consisting of $497.2 million principal amount of our 9.75% senior notes due 2020, $774.7 million principal amount of our 8.875% senior notes due 2021, and $294.4 million principal amount of our 9.25% senior notes due 2022 in privately negotiated transactions with certain holders of our outstanding senior unsecured notes. At closing, we paid all accrued and unpaid interest since the respective interest payment dates of the notes surrendered in the exchange. The Third Lien Notes are fully and unconditionally guaranteed on a senior basis by our subsidiary guarantors' assets and by certain future subsidiaries of ours. See Item 8. Consolidated Financial Statements and Supplementary Data—Note 5, "Long-term Debt" for additional information on the Third Lien Notes and the accounting for the exchange.
HK TMS, LLC Agreement Amendment
On June 1, 2015, our subsidiary, HK TMS, LLC (HK TMS), and funds and accounts managed by affiliates of Apollo Global Management, LLC (Apollo) entered into an amendment to their original agreement (the HK TMS Amendment) which, among other things, i) commits HK TMS to drill a minimum of 6.5 net wells in each of the five consecutive twelve month periods beginning December 31, 2015 and ii) allows for the redemption of preferred shares at the greater of a 12% annual rate of return plus principal and 1.25 times Apollo's investment plus applicable fees (the Redemption Price), between March 1, 2016 and June 30, 2016 at the election of Apollo to the extent there is available cash above the minimum cash balance. For any commitment period in which HK TMS does not meet its drilling obligation, HK TMS must use available cash, above its minimum required cash balance, to redeem preferred shares at the Redemption Price. See Item 8. Consolidated Financial Statements and Supplementary Data—Note 10, "Mezzanine Equity" for additional information on the HK TMS Amendment as well as the original agreement.
Issuance of Senior Secured Second Lien Notes due 2020
On May 1, 2015, we completed the issuance of $700 million aggregate principal amount of 8.625% second lien senior secured notes due 2020 (the 2020 Second Lien Notes) in a private offering. The 2020 Second Lien Notes were issued at par. The net proceeds from the sale of the 2020 Second Lien Notes were approximately $686.2 million (after deducting offering fees and expenses). We used the net proceeds from the offering to repay a majority of the then outstanding borrowings under our Senior Credit Agreement. Interest on the 2020 Second Lien Notes is payable on February 1 and August 1 of each year, beginning on August 1, 2015. The 2020 Second Lien Notes will mature on February 1, 2020. The 2020 Second Lien Notes are secured by second-priority liens on substantially all of our and our subsidiary guarantors' assets that secure our Senior Credit Agreement.
8
Amendments to Convertible Note and February 2012 Warrants
On March 9, 2015, we entered into an amendment (the HALRES Note Amendment) to our convertible note in the principal amount of $289.7 million due 2017 (the Convertible Note). The HALRES Note Amendment extended the maturity date of the Convertible Note by three years, from February 8, 2017 to February 8, 2020. The Convertible Note originally provided for prepayment without premium or penalty at any time after February 8, 2014, at which time it also became convertible into shares of our common stock at a conversion price of $22.50 per share. These dates have been extended and the conversion price has been adjusted, such that at any time after March 9, 2017, we may prepay the Convertible Note without premium or penalty, and HALRES may elect to convert all or any portion of unpaid principal and interest outstanding under the Convertible Note to shares of our common stock at a conversion price of $12.20 per share, subject to adjustments for stock splits and other customary anti-dilution provisions as set forth in the Convertible Note. At the same time, we also entered into an amendment (the Warrant Amendment, and collectively with the HALRES Note Amendment, the Amendments) to our five year warrants (the February 2012 Warrants) which extended the term of the February 2012 Warrants from February 8, 2017 to February 8, 2020 and adjusted the exercise price of the February 2012 Warrants from $22.50 to $12.20 per share. The Amendments were approved by our stockholders on May 6, 2015, in accordance with the rules of the New York Stock Exchange (NYSE).
Long-Term Debt Exchanged for Common Stock
During the second quarter of 2015, we entered into several exchange agreements with holders of our senior unsecured notes in which they agreed to exchange an aggregate $258.0 million principal amount of their senior unsecured notes for approximately 29.0 million shares of our common stock. See Item 8. Consolidated Financial Statements and Supplementary Data—Note 5, "Long-term Debt" for additional information on the exchange agreements.
Equity Distribution Agreement
On March 18, 2015, we entered into an Equity Distribution Agreement (the Equity Distribution Agreement) with BMO Capital Markets Corp., Jefferies LLC and MLV & Co. LLC (collectively, the Managers). Pursuant to the terms of the Equity Distribution Agreement, we sold, from time to time during 2015 through the Managers, by means of ordinary brokers' transactions through the facilities of the NYSE at market prices, a total of approximately 1.9 million shares of our common stock for net proceeds of approximately $15.0 million, after deducting offering expenses.
2016 Capital Budget
We expect to spend approximately $140 million to $160 million on drilling and completion capital expenditures during 2016. In addition, we expect to spend approximately $10 million to $15 million on leasehold, infrastructure, seismic and other in 2016. The decrease in planned capital spending for 2016 is in response to the significant decrease in crude oil prices and our expectations that prices may not recover in the near term. Approximately 80-85% of our 2016 drilling and completion budget is expected to be spent in the Bakken / Three Forks formations in North Dakota and approximately 15-20% is budgeted for the El Halcón area in East Texas. Our 2016 drilling and completion budget currently contemplates running one to two operated rigs during the year, is based on our current view of market conditions and current business plans, and is subject to change.
We expect to fund our budgeted 2016 capital expenditures with cash flows from operations and, to a lesser extent, with borrowings under our Senior Credit Agreement. We strive to maintain financial flexibility and may access capital markets as necessary to maintain substantial borrowing capacity under our Senior Credit Agreement, facilitate drilling on our large undeveloped acreage position and permit
9
us to selectively expand our acreage position. In the event our cash flows are materially less than anticipated and other sources of capital we historically have utilized are not available on acceptable terms, we may further curtail our capital spending.
Our financial results depend upon many factors, but are largely driven by the volume of our oil and natural gas production and the price that we receive for that production. Our production volumes will decline as reserves are depleted unless we expend capital in successful development and exploration activities or acquire properties with existing production. The amount we realize for our production depends predominately upon commodity prices and our related commodity price hedging activities, which are affected by changes in market demand and supply, as impacted by overall economic activity, weather, pipeline capacity constraints, inventory storage levels, basis differentials and other factors. Accordingly, finding and developing oil and natural gas reserves in an economical manner is critical to our long-term success.
Business Strategy
Our primary long-term objective is to increase stockholder value by growing reserves, production and cash flow. To accomplish this objective, we intend to execute the following business strategies:
- •
- Develop and Grow Our Liquids Rich Resource-Style Acreage Positions Using Our Proven Development
Expertise. We plan to leverage our management team's expertise and the latest available technologies to economically develop our property portfolio with a focus on our core
liquids-rich resource style plays. We are the operator for the majority of our acreage, which gives us control over the timing of capital expenditures, execution and costs. It also allows us to adjust
our capital spending based on drilling results and the economic environment. Our leasing strategy is to pursue long-term contracts that allow us to maintain flexible development plans and avoid
short-term obligations to drill wells, as have been common in other resource plays. As operator, we are also able to evaluate industry drilling results and implement improved operating practices which
may enhance our initial production rates, ultimate recovery factors and rate of return on invested capital.
- •
- Manage Our Property Portfolio Actively. We continually evaluate our property base to identify and divest non-core assets and higher cost or lower volume producing properties with limited development potential, which allows us to focus on a portfolio of core properties with the greatest economic potential to increase our proved reserves and production.
Our Competitive Strengths
We have a number of competitive strengths that we believe will allow us to successfully execute our business strategies:
- •
- Proven Management Team with Significant Ownership
Stake. Our management team and technical professionals, including geologists and engineers, have decades of combined experience in the
industry. Our management team has successfully founded, grown, operated and sold companies in the oil and gas sector. Floyd C. Wilson was Chairman and Chief Executive Officer of Petrohawk Energy
Corporation, which was acquired by BHP Billiton in August 2011, Chairman and Chief Executive Officer of 3TEC Energy Corporation, which was acquired by Plains Exploration & Production Company in
2003, and Chairman and Chief Executive Officer of Hugoton Energy Corporation, which was acquired by Chesapeake Energy Corporation in 1998.
- •
- Geographically and Geologically Diverse Asset Base. Our proved reserves, production and acreage are located in concentrated positions within multiple onshore U.S. basins. These various basins provide exposure to a variety of reservoir formations, each of which has its own characteristics that impact the costs to drill, complete and operate as well as the composition (and therefore
10
- •
- Extensive Experience in Resource
Plays. Our team has significant experience in all aspects of the development of resource plays. Under Mr. Wilson's leadership,
Petrohawk, 3TEC and Hugoton improved drilling times and reserve recoveries through innovation, the use of new technologies and a focus on controlling costs. While at Petrohawk, in developing the early
shale plays, the technical team also acquired expertise relevant in our evaluation of new resource play opportunities. In addition to their core strength in exploration and production, our personnel
have experience in building midstream infrastructure and have managed oilfield service activities. For example, Petrohawk developed extensive midstream systems serving the Eagle Ford Shale and the
Haynesville Shale in order to accommodate their rapid growth in production volumes.
- •
- Strong Technical Team. We believe that there are certain competitive advantages to be gained by employing a highly skilled technical staff. This team has significant experience and expertise in applying the most sophisticated technologies used in conventional and unconventional resource style plays, including 3-D seismic interpretation, horizontal drilling, deep onshore drilling, comprehensive multi-stage hydraulic fracture stimulation programs, and other exploration, production, and processing technologies. We believe this technical expertise is partly responsible for our management team's strong track record of successful exploration and development, including new discoveries and defining core producing areas in emerging plays.
value) of the hydrocarbon stream. We believe that this geographic diversity provides us with broad flexibility to direct our capital resources to projects with the greatest potential returns and access to multiple key end markets, which mitigates our exposure to temporary price dislocations in any one market.
Oil and Natural Gas Reserves
The proved reserves estimates shown herein for the years ended December 31, 2015, 2014 and 2013 have been independently evaluated by Netherland, Sewell, a worldwide leader of petroleum property analysis for industry and financial organizations and government agencies. Netherland, Sewell was founded in 1961 and performs consulting petroleum engineering services under Texas Board of Professional Engineers Registration No. F-2699. Within Netherland, Sewell, the technical persons primarily responsible for preparing the estimates set forth in the Netherland, Sewell reserves report incorporated herein are Mr. J. Carter Henson, Jr. and Mr. David E. Nice. Mr. Henson, a Licensed Professional Engineer in the State of Texas (No. 73964), has been practicing consulting petroleum engineering at Netherland, Sewell since 1989 and has over 8 years of prior industry experience. He graduated from Rice University in 1981 with a Bachelor of Science Degree in Mechanical Engineering. Mr. Nice, a Licensed Professional Geoscientist in the State of Texas (No. 346), has been practicing consulting petroleum geoscience at Netherland, Sewell since 1998 and has over 13 years of prior industry experience. He graduated from University of Wyoming in 1982 with a Bachelor of Science Degree in Geology and in 1985 with a Master of Science Degree in Geology. Netherland, Sewell has reported to us that both technical principals meet or exceed the education, training, and experience requirements set forth in the Standards Pertaining to the Estimating and Auditing of Oil and Gas Reserves Information promulgated by the Society of Petroleum Engineers; both are proficient in judiciously applying industry standard practices to engineering and geoscience evaluations as well as applying Securities and Exchange Commission (SEC) and other industry reserves definitions and guidelines.
Our board of directors has established a reserves committee composed of three independent directors, all of whom have experience in energy company reserve evaluations. Our independent engineering firm reports jointly to the reserves committee and to our Senior Vice President of Corporate Reserves. The reserves committee is charged with ensuring the integrity of the process of selection and engagement of the independent engineering firm and in making a recommendation to our board of directors as to whether to accept the report prepared by our independent consulting
11
petroleum engineers. Ms. Tina Obut, our Senior Vice President of Corporate Reserves is the technical person primarily responsible for overseeing the preparation of the annual reserve report by Netherland, Sewell. She graduated from Marietta College with a Bachelor of Science degree in Petroleum Engineering, received a Master of Science degree in Petroleum and Natural Gas Engineering from Penn State University and a Master of Business Administration degree from the University of Houston.
The reserves information in this Annual Report on Form 10-K represents only estimates. There are a number of uncertainties inherent in estimating quantities of proved reserves, including many factors beyond our control. Reserve evaluation is a subjective process of estimating underground accumulations of oil and natural gas that cannot be measured in an exact manner. The accuracy of any reserve estimate is a function of the quality of available data and of engineering and geological interpretation and judgment. As a result, estimates of different engineers may vary significantly. In addition, results of drilling, testing and production subsequent to the date of an estimate may lead to revising the original estimate. Accordingly, initial reserve estimates are often different from the quantities of oil and natural gas that are ultimately recovered. The meaningfulness of such estimates depends primarily on the accuracy of the assumptions upon which they were based. Except to the extent we acquire additional properties containing proved reserves or conduct successful exploration and development activities or both, our proved reserves will decline as reserves are produced. For additional information regarding estimates of proved reserves, the preparation of such estimates by Netherland, Sewell and other information about our oil and natural gas reserves, see Item 8. Consolidated Financial Statements and Supplementary Data—"Supplemental Oil and Gas Information (Unaudited)."
Proved reserve estimates are based on the unweighted arithmetic average prices on the first day of each month for the 12-month period ended December 31, 2015. Average prices for the 12-month period were as follows: West Texas Intermediate (WTI) crude oil spot price of $50.28 per Bbl, adjusted by lease or field for quality, transportation fees, and market differentials and a Henry Hub natural gas spot price of $2.587 per MMBtu, as adjusted by lease or field for energy content, transportation fees, and market differentials. All prices and costs associated with operating wells were held constant in accordance with SEC guidelines. The following table presents certain proved reserve information as of December 31, 2015.
Proved Reserves (MBoe)(1) |
||||
Developed |
81,885 | |||
Undeveloped |
64,919 | |||
| | | | | |
Total |
146,804 | |||
| | | | | |
| | | | | |
| | | | | |
- (1)
- Natural gas reserves are converted to oil reserves using a ratio of six Mcf to one Bbl of oil. This ratio does not assume price equivalency and, given price differentials, the price for a barrel of oil equivalent for natural gas may differ significantly from the price for a barrel of oil.
12
The following table sets forth the number of productive oil and natural gas wells in which we owned an interest as of December 31, 2015 and 2014. Shut-in wells currently not capable of production are excluded from the well information below.
| |
Years Ended December 31, | ||||||||||||
|---|---|---|---|---|---|---|---|---|---|---|---|---|---|
| |
2015 | 2014 | |||||||||||
| |
Gross | Net | Gross | Net | |||||||||
Oil |
1,384 | 326.5 | 1,313 | 300.2 | |||||||||
Natural Gas |
74 | 42.6 | 143 | 85.9 | |||||||||
| | | | | | | | | | | | | | |
Total |
1,458 | 369.1 | 1,456 | 386.1 | |||||||||
| | | | | | | | | | | | | | |
| | | | | | | | | | | | | | |
| | | | | | | | | | | | | | |
Oil and Natural Gas Production
Core Resource Plays
At December 31, 2015, we have estimated proved reserves in our core resource plays of approximately 143.6 MMBoe, of which 92% are oil and natural gas liquids and 55% are proved developed. In general, our core resource plays are characterized by high oil and liquids-rich natural gas content in thick, continuous sections of source rock that can provide repeatable drilling opportunities and significant initial production rates. Our core resource plays are as follows:
Bakken / Three Forks Formations
We have working interests in approximately 123,000 net acres as of December 31, 2015 prospective in the Bakken / Three Forks formations in North Dakota. Multiple initiatives are underway to lower costs and improve recoveries in our operated project areas. We expect to spud 15 to 20 gross horizontal wells on our operated acreage in 2016 with an average working interest of 60%. In 2016, we expect to operate one to two rigs in the Williston Basin. As of December 31, 2015, we had approximately 264 operated wells producing in this area in addition to minor working interests in hundreds of non-operated wells. Our average daily net production from this area for the year ended December 31, 2015 was approximately 28,900 Boe/d. As of December 31, 2015, estimated proved reserves for the Bakken / Three Forks formations were approximately 122.0 MMBoe, of which approximately 54% were classified as proved developed and approximately 46% as proved undeveloped.
East Texas Eagle Ford Formation (El Halcón)
We have working interests in approximately 92,000 net acres as of December 31, 2015 prospective for the Eagle Ford formation in Brazos, Burleson, and Robertson Counties, Texas, with targeted depths ranging from 7,000 feet to 10,000 feet. We finished 2015 with a one rig drilling program and approximately 106 producing wells. In 2016, we plan to operate one rig during the first quarter and spud two gross horizontal wells with an average working interest of 98%. Our average daily net production from this area for the year ended December 31, 2015 was approximately 9,500 Boe/d. As of December 31, 2015, estimated proved reserves for the El Halcón area were approximately 21.6 MMBoe, of which approximately 63% were classified as proved developed and approximately 37% as proved undeveloped.
Non-core Areas
Tuscaloosa Marine Shale
Through our subsidiary, HK TMS, we own working interests in approximately 183,000 net acres as of December 31, 2015 in the Tuscaloosa Marine Shale (TMS), which is located primarily in Southwest Mississippi and the Louisiana Florida Parishes. Due to low commodity prices, we currently do not plan
13
to drill any new wells in this area in 2016. Our average daily net production from this area for the year ended December 31, 2015 was approximately 920 Boe/d. As of December 31, 2015, estimated proved reserves for the TMS were approximately 1.1 MMBoe, 77% of which was classified as proved developed. We can provide no assurance that this exploratory area, or any wells we subsequently drill in the formations we have targeted for exploration and development, will be successful.
Utica / Point Pleasant Formations
Our acreage is located in the northern part of the Utica / Point Pleasant play, and as of December 31, 2015, we owned approximately 120,000 net acres in Trumbull and Mahoning Counties, Ohio, and Mercer and Venango Counties, Pennsylvania. Substantially all of our acreage in these areas is either held by shallow production or provides for five years, from the initial date of the lease, in which to drill a well with many of the leases containing a renewal option for an additional three to five years. Currently, seven operated wells are producing and five wells are shut in due to commodity prices. Average daily net production from this area for the year ended December 31, 2015 was approximately 330 Boe/d. Due to low commodity prices, we currently do not plan to drill any new wells in this area in 2016. We continue to monitor competitor activity in this area and new technologies that might allow for lower cost development and increased recoveries from this hydrocarbon rich basin. As of December 31, 2015, estimated proved reserves for the Utica / Point Pleasant formations were less than 0.1 MMBoe and all were classified as proved developed. We can provide no assurance that this exploratory area, or any wells we subsequently drill in the formations we have targeted for exploration and development, will be successful.
Other Non-core Areas
We have other oil and natural gas properties with varying working interests located in the Austin Chalk Trend in East Texas. Production from these non-core areas totaled approximately 670 MBoe, or 1,800 Boe/d, for the year ended December 31, 2015. As of December 31, 2015, estimated proved reserves for these other properties were approximately 2.1 MMBoe in aggregate, of which all were classified as proved developed. We may consider divesting certain of these assets over time.
Liquids-Rich Exploratory Plays
In addition to the disclosed areas, we may acquire acreage in other unconventional exploratory plays as opportunities arise. Our strategy for our exploratory projects is to use our in-house geologic and engineering expertise to identify underdeveloped areas that we believe are prospective for oil or liquids-rich production. We can provide no assurance that any of these exploratory areas, or any wells we subsequently drill in the formations we have targeted for exploration and development, will be successful. Due to competitive concerns, we intend to keep the details of such plays confidential until such time as it is appropriate to disclose specific information.
Risk Management
We have designed a risk management policy for the use of derivative instruments to provide partial protection against certain risks relating to our ongoing business operations, such as commodity price declines. Derivative contracts are utilized to hedge our exposure to price fluctuations and reduce the variability in our cash flows associated with anticipated sales on future oil and natural gas production. Our objective generally is to hedge 70-80% of our anticipated oil and natural gas production for the next 18 to 24 months However, our decision on the quantity and price at which we choose to hedge our production is based in part on our view of current and future market conditions. Our hedge policies and objectives change as our operational profile changes and/or commodity prices change and currently we have hedged only a limited amount of our anticipated production beyond 2016 due to low commodity prices. As a consequence, our future performance is subject to increased commodity price
14
risks and our future cash flows from operations may be subject to greater volatility than historically. We do not enter into derivative contracts for speculative trading purposes.
While there are many different types of derivatives available, we typically use costless collar agreements, swap agreements and deferred put options to attempt to manage price risk more effectively. The costless collar agreements are put and call options used to establish floor and ceiling commodity prices for a fixed volume of production during a certain time period. All costless collar agreements provide for payments to counterparties if the index price exceeds the ceiling and payments from the counterparties if the index price is below the floor. The swap agreements call for payments to, or receipts from, counterparties depending on whether the index price of oil or natural gas for the period is greater or less than the fixed price established for the period contracted under the swap agreement. Under deferred put option agreements, we pay a fixed premium to lock in a specified floor price for a specified future period. If the index price of oil or natural gas falls below the contracted floor price, the counterparty pays us the difference between the index price and the floor price (netted against the fixed premium payable to the counterparty). If the index price rises above floor price, we pay the fixed premium.
It is our policy to enter into derivative contracts only with counterparties that are creditworthy financial institutions deemed by management as competent and competitive market makers. We did not post collateral under any of our derivative contracts as they are secured under our Senior Credit Agreement or are uncollateralized trades. We will continue to evaluate the benefit of employing derivatives in the future. See Item 7A. Quantitative and Qualitative Disclosures about Market Risk and Item 8. Consolidated Financial Statements and Supplementary Data—Note 7, "Derivative and Hedging Activities" for additional information.
Oil and Natural Gas Operations
Our principal properties consist of leasehold interests in developed and undeveloped oil and natural gas properties and the reserves associated with these properties. Generally, oil and natural gas leases remain in force as long as production in paying quantities is maintained. Leases on undeveloped oil and natural gas properties are typically for a primary term of three to five years within which we are generally required to develop the property or the lease will expire. In some cases, the primary term of leases on our undeveloped properties can be extended by option payments; the amount of any payments and time extended vary by lease.
15
The table below sets forth the results of our drilling activities for the periods indicated:
| |
Years Ended December 31, | ||||||||||||||||||
|---|---|---|---|---|---|---|---|---|---|---|---|---|---|---|---|---|---|---|---|
| |
2015 | 2014 | 2013 | ||||||||||||||||
| |
Gross | Net | Gross | Net | Gross | Net | |||||||||||||
Exploratory Wells: |
|||||||||||||||||||
Productive(1) |
— | — | — | — | 10 | 6.8 | |||||||||||||
Dry |
— | — | — | — | 2 | 2.0 | |||||||||||||
| | | | | | | | | | | | | | | | | | | | |
Total Exploratory |
— | — | — | — | 12 | 8.8 | |||||||||||||
| | | | | | | | | | | | | | | | | | | | |
| | | | | | | | | | | | | | | | | | | | |
| | | | | | | | | | | | | | | | | | | | |
Extension Wells: |
|||||||||||||||||||
Productive(1) |
72 | 18.1 | 207 | 51.1 | 203 | 56.0 | |||||||||||||
Dry |
— | — | — | — | 1 | 1.0 | |||||||||||||
| | | | | | | | | | | | | | | | | | | | |
Total Extension |
72 | 18.1 | 207 | 51.1 | 204 | 57.0 | |||||||||||||
| | | | | | | | | | | | | | | | | | | | |
| | | | | | | | | | | | | | | | | | | | |
| | | | | | | | | | | | | | | | | | | | |
Development Wells: |
|||||||||||||||||||
Productive(1) |
112 | 30.9 | 113 | 47.2 | 68 | 41.6 | |||||||||||||
Dry |
— | — | — | — | — | — | |||||||||||||
| | | | | | | | | | | | | | | | | | | | |
Total Development |
112 | 30.9 | 113 | 47.2 | 68 | 41.6 | |||||||||||||
| | | | | | | | | | | | | | | | | | | | |
| | | | | | | | | | | | | | | | | | | | |
| | | | | | | | | | | | | | | | | | | | |
Total Wells: |
|||||||||||||||||||
Productive(1) |
184 | 49.0 | 320 | 98.3 | 281 | 104.4 | |||||||||||||
Dry |
— | — | — | — | 3 | 3.0 | |||||||||||||
| | | | | | | | | | | | | | | | | | | | |
Total |
184 | 49.0 | 320 | 98.3 | 284 | 107.4 | |||||||||||||
| | | | | | | | | | | | | | | | | | | | |
| | | | | | | | | | | | | | | | | | | | |
| | | | | | | | | | | | | | | | | | | | |
- (1)
- Although a well may be classified as productive upon completion, future changes in oil and natural gas prices, operating costs and production may result in the well becoming uneconomical, particularly extension or exploratory wells where there is no production history.
We own interests in developed and undeveloped oil and natural gas acreage in the locations set forth in the table below. These ownership interests generally take the form of working interests in oil and natural gas leases that have varying provisions. The following table presents a summary of our acreage interests as of December 31, 2015:
| |
Developed Acreage | Undeveloped Acreage | Total Acreage | ||||||||||||||||
|---|---|---|---|---|---|---|---|---|---|---|---|---|---|---|---|---|---|---|---|
State
|
Gross | Net | Gross | Net | Gross | Net | |||||||||||||
Louisiana |
960 | 912 | 117,388 | 107,494 | 118,348 | 108,406 | |||||||||||||
Montana |
6,111 | 1,614 | 4,038 | 1,645 | 10,149 | 3,259 | |||||||||||||
Mississippi |
8,377 | 8,084 | 129,883 | 66,119 | 138,260 | 74,203 | |||||||||||||
North Dakota |
679,284 | 109,012 | 54,839 | 14,193 | 734,123 | 123,205 | |||||||||||||
Ohio |
3,142 | 3,121 | 39,717 | 38,445 | 42,859 | 41,566 | |||||||||||||
Oklahoma |
— | — | 33,183 | 14,889 | 33,183 | 14,889 | |||||||||||||
Pennsylvania |
983 | 912 | 79,689 | 77,615 | 80,672 | 78,527 | |||||||||||||
Texas |
282,990 | 170,184 | 80,489 | 54,863 | 363,479 | 225,047 | |||||||||||||
| | | | | | | | | | | | | | | | | | | | |
Total Acreage |
981,847 | 293,839 | 539,226 | 375,263 | 1,521,073 | 669,102 | |||||||||||||
| | | | | | | | | | | | | | | | | | | | |
| | | | | | | | | | | | | | | | | | | | |
| | | | | | | | | | | | | | | | | | | | |
Due to a variety of factors, including but not limited to, current market conditions and commodity prices, drilling results of us and other operators in our plays, tract location in relation to current developmental plans, and infrastructure requirements to bring product to market; approximately 165,000 of the 375,263 net owned undeveloped acres as of December 31, 2015, pertaining to certain tracts previously recorded in "Unevaluated oil and natural gas properties" on the consolidated balance
16
sheets have been transferred over time into the full cost pool. Of the approximated 210,000 net owned undeveloped acres remaining as of December 31, 2015, approximately 29,000, 46,000 and 33,000 acres will expire in 2016, 2017 and 2018, respectively, if we do not establish production in paying quantities on the units in which such acreage is included or do not pay (to the extent we have the contractual right to pay) delay rentals or obtain other extensions to maintain the lease. The potential lease expirations for 2016, 2017 and 2018 are primarily attributable to our TMS area, for which our capital budget includes the renewal/extension for a limited number of acres, subject to discretion as each lease comes due for renewal. For the majority of the 29,000 net acres expiring in 2016, management has not yet made a decision whether the leases will be renewed (to the extent renewal rights exist).
We review undeveloped acreage on a quarterly basis for new or changed factors that could impact the renewal decisions, as well as making an assessment for possible impairment in which case the cost of any expired, or soon to be expired acreage, would be transferred the full cost pool to be depleted. For our proved undeveloped locations that are not scheduled to be drilled until after lease expiration, we continually review our near-term lease expirations, actively pursue lease extensions and renewals and modify our drilling schedules in order to preserve the leases.
At December 31, 2015, we had estimated proved reserves of approximately 146.8 MMBoe comprised of 120.7 MMBbls of crude oil, 13.0 MMBbls of natural gas liquids, and 78.4 Bcf of natural gas. The following table sets forth, at December 31, 2015, these reserves:
| |
Proved Developed |
Proved Undeveloped |
Total Proved |
|||||||
|---|---|---|---|---|---|---|---|---|---|---|
Oil (MBbls) |
66,123 | 54,570 | 120,693 | |||||||
Natural Gas Liquids (MBbls) |
7,561 | 5,476 | 13,037 | |||||||
Natural Gas (MMcf) |
49,201 | 29,241 | 78,442 | |||||||
Equivalent (MBoe)(1) |
81,885 | 64,919 | 146,804 | |||||||
- (1)
- Natural gas reserves are converted to oil reserves using a ratio of six Mcf to one Bbl of oil. This ratio does not assume price equivalency and, given price differentials, the price for a barrel of oil equivalent for natural gas may differ significantly from the price for a barrel of oil.
At December 31, 2015, our estimated proved undeveloped (PUD) reserves were approximately 64.9 MMBoe, a 46.8 MMBoe net decrease over the previous year's estimate of 111.7 MMBoe. The following table details the changes in PUD reserves for 2015 (in MBoe):
Beginning proved undeveloped reserves at December 31, 2014 |
111,710 | |||
Undeveloped reserves transferred to developed |
(14,594 | ) | ||
Revisions |
(38,110 | ) | ||
Extension and discoveries |
5,913 | |||
| | | | | |
Ending proved undeveloped reserves at December 31, 2015 |
64,919 | |||
| | | | | |
| | | | | |
| | | | | |
The decrease in PUD reserves was due to a negative revision associated with the decline in the unweighted 12-month average prices of oil and natural gas during 2015. Negative revisions of approximately 38 MMBoe were largely associated with PUD locations in the Bakken / Three Forks and El Halcón areas that became uneconomic at the lower unweighted 12-month average prices of oil and natural gas as of December 31, 2015, or were removed because they no longer met the SEC five year development requirement as we have reduced our capital spending since the prior year as a result of the sustained decline in oil and natural gas prices. Further reductions of approximately 15 MMBoe in PUD reserves were the direct result of our development of PUD through our drilling program and the
17
associated transfer of those reserves to proved developed reserves, primarily in the Bakken / Three Forks and El Halcón areas.
As of December 31, 2015, all of our PUD reserves are planned to be developed within five years from the date they were initially recorded. During 2015, approximately $285.2 million in capital expenditures went toward the development of proved undeveloped reserves, which includes drilling, completion and other facility costs associated with developing proved undeveloped wells.
Reliable technologies were used to determine areas where PUD locations are more than one offset location away from a producing well. These technologies include seismic data, wire line open hole log data, core data, log cross-sections, performance data, and statistical analysis. In such areas, these data demonstrated consistent, continuous reservoir characteristics in addition to significant quantities of economic estimated ultimate recoveries from individual producing wells. Our management team has been a leader in data gathering and evaluation in these areas and was instrumental in developing consortiums that allow various operators to exchange data. We relied only on production flow tests and historical production data, along with the reliable geologic data mentioned above to estimate proved reserves. No other alternative methods or technologies were used to estimate proved reserves.
The estimates of quantities of proved reserves contained in this report were made in accordance with the definitions contained in SEC Release No. 33-8995, Modernization of Oil and Gas Reporting. For additional information on our oil and natural gas reserves, see Item 8. Consolidated Financial Statements and Supplementary Data—"Supplemental Oil and Gas Information (Unaudited)."
We account for our oil and natural gas producing activities using the full cost method of accounting in accordance with SEC regulations. Accordingly, all costs incurred in the acquisition, exploration, and development of proved and unproved oil and natural gas properties, including the costs of abandoned properties, dry holes, geophysical costs, direct internal costs and annual lease rentals are capitalized. All general and administrative corporate costs unrelated to drilling activities are expensed as incurred. Sales or other dispositions of oil and natural gas properties are accounted for as adjustments to capitalized costs, with no gain or loss recorded unless the ratio of cost to proved reserves would significantly change. Depletion of evaluated oil and natural gas properties is computed on the units of production method based on proved reserves. The net capitalized costs of evaluated oil and natural gas properties are subject to a quarterly full cost ceiling test. Our net book value of oil and natural gas properties at March 31, June 30, September 30, and December 31, 2015 exceeded the respective ceiling amounts for each quarter end. As a result, we recorded full cost ceiling test impairments before income taxes of $2.6 billion for the year ended December 31, 2015. See further discussion in Item 8. Consolidated Financial Statements and Supplementary Data—Note 4, "Oil and Natural Gas Properties."
Capitalized costs of our evaluated and unevaluated properties at December 31, 2015, 2014 and 2013 are summarized as follows:
| |
December 31, | |||||||||
|---|---|---|---|---|---|---|---|---|---|---|
| |
2015 | 2014 | 2013 | |||||||
| |
|
(In thousands) |
|
|||||||
Oil and natural gas properties (full cost method): |
||||||||||
Evaluated |
$ | 7,060,721 | $ | 6,390,820 | $ | 4,960,467 | ||||
Unevaluated |
1,641,356 | 1,829,786 | 2,028,044 | |||||||
| | | | | | | | | | | |
Gross oil and natural gas properties |
8,702,077 | 8,220,606 | 6,988,511 | |||||||
Less—accumulated depletion |
(5,933,688 | ) | (2,953,038 | ) | (2,189,515 | ) | ||||
| | | | | | | | | | | |
Net oil and natural gas properties |
$ | 2,768,389 | $ | 5,267,568 | $ | 4,798,996 | ||||
| | | | | | | | | | | |
| | | | | | | | | | | |
| | | | | | | | | | | |
18
The following table summarizes our oil, natural gas and natural gas liquids production volumes, average sales price per unit and average costs per unit. In addition, this table summarizes our production for each field that contains 15% or more of our total proved reserves:
| |
Years Ended December 31, | |||||||||
|---|---|---|---|---|---|---|---|---|---|---|
| |
2015 | 2014 | 2013 | |||||||
Production: |
||||||||||
Crude oil—MBbl |
||||||||||
Bakken / Three Forks |
8,702 | 9,316 | 6,232 | |||||||
El Halcón |
2,840 | 2,708 | 1,194 | |||||||
Woodbine(1) |
— | 390 | 1,171 | |||||||
Other(2) |
477 | 373 | 1,551 | |||||||
| | | | | | | | | | | |
Total |
12,019 | 12,787 | 10,148 | |||||||
| | | | | | | | | | | |
| | | | | | | | | | | |
| | | | | | | | | | | |
Natural gas—MMcf |
||||||||||
Bakken / Three Forks |
5,673 | 3,861 | 1,615 | |||||||
El Halcón |
1,489 | 976 | 282 | |||||||
Woodbine(1) |
— | 260 | 506 | |||||||
Other(2) |
2,961 | 3,715 | 5,600 | |||||||
| | | | | | | | | | | |
Total |
10,123 | 8,812 | 8,003 | |||||||
| | | | | | | | | | | |
| | | | | | | | | | | |
| | | | | | | | | | | |
Natural gas liquids—MBbl |
||||||||||
Bakken / Three Forks |
918 | 591 | 227 | |||||||
El Halcón |
382 | 278 | 92 | |||||||
Woodbine(1) |
— | 49 | 87 | |||||||
Other(2) |
157 | 195 | 277 | |||||||
| | | | | | | | | | | |
Total |
1,457 | 1,113 | 683 | |||||||
| | | | | | | | | | | |
| | | | | | | | | | | |
| | | | | | | | | | | |
Production: |
||||||||||
Total MBoe(3) |
15,163 | 15,369 | 12,165 | |||||||
Average daily production—Boe(3) |
41,542 | 42,107 | 33,329 | |||||||
Average price per unit:(4) |
||||||||||
Crude oil price—Bbl |
$ | 42.63 | $ | 83.78 | $ | 93.08 | ||||
Natural gas price—Mcf |
2.22 | 4.21 | 3.41 | |||||||
Natural gas liquids price—Bbl |
9.35 | 33.66 | 35.96 | |||||||
Barrel of oil equivalent price—Boe(3) |
36.17 | 74.56 | 81.91 | |||||||
Average cost per Boe: |
||||||||||
Production: |
||||||||||
Lease operating |
$ | 6.83 | $ | 8.47 | $ | 11.44 | ||||
Workover and other |
1.38 | 1.05 | 0.52 | |||||||
Taxes other than income |
3.22 | 6.92 | 7.28 | |||||||
Gathering and other |
2.66 | 1.74 | 0.97 | |||||||
- (1)
- On May 9, 2014, we completed the divestiture of certain non-core assets in East Texas. The effective date of the transaction was April 1,
2014.
- (2)
- During the fourth quarter of 2013, we completed three separate divestitures of non-core properties located in the United States. The effective date of the transactions was July 1, 2013. Additionally, on July 19, 2013, we completed the divestiture of our Eagle Ford assets located in Fayette and Gonzales Counties, Texas. The transaction had an effective date of January 1, 2013.
19
- (3)
- Natural gas reserves are converted to oil reserves using a ratio of six Mcf to one Bbl of oil. This ratio does not assume price equivalency and, given price
differentials, the price for a barrel of oil equivalent for natural gas may differ significantly from the price for a barrel of oil.
- (4)
- Amounts exclude the impact of cash paid or received on settled commodities derivative contracts as we did not elect to apply hedge accounting.
The average crude oil and natural gas sales prices above do not reflect the impact of cash paid on, or cash received from, settled derivative contracts as these amounts are reflected as "Net gain (loss) on derivative contracts" in the consolidated statements of operations, consistent with our decision not to elect hedge accounting. Including this impact 2015, 2014 and 2013 average crude oil sales prices were $78.50, $84.72 and $90.66 per Bbl and average natural gas sales prices were $3.06, $4.06 and $3.66 per Mcf, respectively.
Competitive Conditions in the Business
The oil and natural gas industry is highly competitive and we compete with a substantial number of other companies that have greater financial and other resources. Many of these companies explore for, produce and market oil and natural gas, as well as carry on refining operations and market the resultant products on a worldwide basis. The primary areas in which we encounter substantial competition are in locating and acquiring desirable leasehold acreage for our drilling and development operations, locating and acquiring attractive producing oil and natural gas properties, obtaining sufficient availability of drilling and completion equipment and services, obtaining purchasers and transporters of the oil and natural gas we produce and hiring and retaining key employees. There is also competition between oil and natural gas producers and other industries producing energy and fuel. Furthermore, competitive conditions may be substantially affected by various forms of energy legislation and/or regulation considered from time to time by the government of the United States, the states in which our properties are located and tribal regulations in North Dakota. It is not possible to predict the nature of any such legislation or regulation which may ultimately be adopted or its effects upon our future operations. Such laws and regulations may substantially increase the costs of exploring for, developing or producing oil and natural gas and may prevent or delay the commencement or continuation of a given operation.
Other Business Matters
Markets and Major Customers
The purchasers of our oil and natural gas production consist primarily of independent marketers, major oil and natural gas companies and gas pipeline companies. Historically, we have not experienced any significant losses from uncollectible accounts. In 2015 and 2014, three individual purchasers, Crestwood Midstream Partners, formerly Arrow Field Services LLC, Sunoco Inc. and Suncor Energy Marketing Inc., each accounted for more than 10% of our total sales, collectively representing 57% and 66% of our total sales for the year, respectively.
Seasonality of Business
Weather conditions affect the demand for, and prices of, natural gas and can also delay drilling activities, disrupting our overall business plans. Demand for natural gas is typically higher during the winter, resulting in higher natural gas prices for our natural gas production during our first and fourth fiscal quarters. Due to these seasonal fluctuations, our results of operations for individual quarterly periods may not be indicative of the results that we may realize on an annual basis.
20
Operational Risks
Oil and natural gas exploration and development involves a high degree of risk, which even a combination of experience, knowledge and careful evaluation may not be able to overcome. There is no assurance that we will discover or acquire additional oil and natural gas in commercial quantities. Oil and natural gas operations also involve the risk that well fires, blowouts, equipment failure, human error and other events may cause accidental releases of toxic or hazardous materials, such as petroleum liquids or drilling fluids into the environment, or cause significant injury to persons or property. In such event, substantial liabilities to third parties or governmental entities may be incurred, the satisfaction of which could substantially reduce available cash and possibly result in loss of oil and natural gas properties. Such hazards may also cause damage to or destruction of wells, producing formations, production facilities and pipeline or other processing facilities.
As is common in the oil and natural gas industry, we will not insure fully against all risks associated with our business either because such insurance is not available or because we believe the premium costs are prohibitive. A loss not fully covered by insurance could have a material effect on our operating results, financial position or cash flows. For further discussion on risks see Item 1A. Risk Factors.
Regulations
All of the jurisdictions in which we own or operate producing oil and natural gas properties have statutory provisions regulating the exploration for and production of oil and natural gas, including provisions related to permits for the drilling of wells, bonding requirements to drill or operate wells, the location of wells, the method of drilling and casing wells, the surface use and restoration of properties upon which wells are drilled, sourcing and disposal of water used in the drilling and completion process, and the plugging and abandonment of wells. Our operations are also subject to various conservation laws and regulations. These laws and regulations govern the size of drilling and spacing units, the density of wells that may be drilled in oil and natural gas properties and the unitization or pooling of oil and natural gas properties. In this regard, some states allow the forced pooling or integration of land and leases to facilitate exploration while other states rely primarily or exclusively on voluntary pooling of land and leases. In areas where pooling is primarily or exclusively voluntary, it may be difficult to form spacing units and therefore difficult to develop a project if the operator owns less than 100% of the leasehold. In addition, state conservation laws establish maximum rates of production from oil and natural gas wells, generally prohibit the venting or flaring of natural gas, and impose specified requirements regarding the ratability of production. On some occasions, tribal and local authorities have imposed moratoria or other restrictions on exploration and production activities pending investigations and studies addressing potential local impacts of these activities before allowing oil and natural gas exploration and production to proceed.
The effect of these regulations is to limit the amount of oil and natural gas that we can produce from our wells and to limit the number of wells or the locations at which we can drill, although we can apply for exceptions to such regulations or to have reductions in well spacing. Failure to comply with applicable laws and regulations can result in substantial penalties. The regulatory burden on the industry increases the cost of doing business and affects profitability. Moreover, each state generally imposes a production or severance tax with respect to the production and sale of oil, natural gas and natural gas liquids within its jurisdiction.
Environmental Regulations
Our operations are subject to stringent federal, state, tribal and local laws regulating the discharge of materials into the environment or otherwise relating to health and safety or the protection of the environment. Numerous governmental agencies, such as the United States Environmental Protection
21
Agency, commonly referred to as the EPA, issue regulations to implement and enforce these laws, which often require difficult and costly compliance measures. Among other things, environmental regulatory programs typically govern the permitting, construction and operation of a facility. Many factors, including public perception, can materially impact the ability to secure an environmental construction or operation permit. Failure to comply with environmental laws and regulations may result in the assessment of substantial administrative, civil and criminal penalties, as well as the issuance of injunctions limiting or prohibiting our activities. In addition, some laws and regulations relating to protection of the environment may, in certain circumstances, impose strict liability for environmental contamination, which could result in liability for environmental damages and cleanup costs without regard to negligence or fault on our part.
Beyond existing requirements, new programs and changes in existing programs, may address various aspects of our business including natural occurring radioactive materials, oil and natural gas exploration and production, air emissions, waste management, and underground injection of waste material. Environmental laws and regulations have been subject to frequent changes over the years, and the imposition of more stringent requirements could have a material adverse effect on our financial condition and results of operations. The following is a summary of the more significant existing environmental, health and safety laws and regulations to which our business operations are subject and for which compliance in the future may have a material adverse impact on our capital expenditures, earnings and competitive position.
Hazardous Substances and Wastes
The federal Comprehensive Environmental Response, Compensation and Liability Act, referred to as CERCLA or the Superfund law, and comparable state laws impose liability, without regard to fault, on certain classes of persons that are considered to be responsible for the release of a hazardous substance into the environment. These persons may include the current or former owner or operator of the disposal site or sites where the release occurred and companies that disposed or arranged for the disposal of hazardous substances that have been released at the site. Under CERCLA, these persons may be subject to joint and several liability for the costs of investigating and cleaning up hazardous substances that have been released into the environment, for damages to natural resources and for the costs of some health studies. In addition, it is not uncommon for neighboring landowners and other third parties to file claims for personal injury and property damage allegedly caused by hazardous substances or other pollutants released into the environment.
Under the federal Solid Waste Disposal Act, as amended by the Resource Conservation and Recovery Act of 1976, referred to as RCRA, most wastes generated by the exploration and production of oil and natural gas are not regulated as hazardous waste. Periodically, however, there are proposals to lift the existing exemption for oil and gas wastes and reclassify them as hazardous wastes. If such proposals were to be enacted, they could have a significant impact on our operating costs and on those of all the industry in general. In the ordinary course of our operations moreover, some wastes generated in connection with our exploration and production activities may be regulated as solid waste under RCRA, as hazardous waste under existing RCRA regulations or as hazardous substances under CERCLA. From time to time, releases of materials or wastes have occurred at locations we own or at which we have operations. These properties and the materials or wastes released thereon may be subject to CERCLA, RCRA and analogous state laws. Under these laws, we have been and may be required to remove or remediate such materials or wastes.
Water Discharges
Our operations are also subject to the federal Clean Water Act and analogous state laws. Under the Clean Water Act, the EPA has adopted regulations concerning discharges of storm water runoff. This program requires covered facilities to obtain individual permits, or seek coverage under a general
22
permit. Some of our properties may require permits for discharges of storm water runoff and, as part of our overall evaluation of our current operations, we are upgrading storm water management practices at some facilities. We believe that we will be able to obtain, or be included under, these permits, where necessary, and will need to make only minor modifications to existing facilities and operations that would not have a material effect on us. The Clean Water Act and similar state acts regulate other discharges of wastewater, oil, and other pollutants to surface water bodies, such as lakes, rivers, wetlands, and streams. Failure to obtain permits for such discharges could result in civil and criminal penalties, orders to cease such discharges, and costs to remediate and pay natural resources damages. These laws also require the preparation and implementation of Spill Prevention, Control, and Countermeasure Plans in connection with on-site storage of significant quantities of oil.
Our oil and natural gas production also generates salt water, which we dispose of by underground injection. The federal Safe Drinking Water Act (SDWA), the Underground Injection Control (UIC) regulations promulgated under the SDWA and related state programs regulate the drilling and operation of salt water disposal wells. The EPA directly administers the UIC program in some states, and in others it is delegated to the state for administering. Permits must be obtained before drilling salt water disposal wells, and casing integrity monitoring must be conducted periodically to ensure the casing is not leaking salt water to groundwater. Contamination of groundwater by oil and natural gas drilling, production, and related operations may result in fines, penalties, and remediation costs, among other sanctions and liabilities under the SDWA and state laws. In addition, third party claims may be filed by landowners and other parties claiming damages for alternative water supplies, property damages, and bodily injury.
Hydraulic Fracturing
Our completion operations are subject to regulation, which may increase in the short- or long-term. In particular, the well completion technique known as hydraulic fracturing, which is used to stimulate production of oil and natural gas, has come under increased scrutiny by the environmental community, and many local, state and federal regulators. Hydraulic fracturing involves the injection of water, sand and additives under pressure, usually down casing that is cemented in the wellbore, into prospective rock formations at depth to stimulate oil and natural gas production. We engage third parties to provide hydraulic fracturing or other well stimulation services to us in connection with substantially all of the wells for which we are the operator.
Under the direction of Congress, the EPA has undertaken a study of the effect of hydraulic fracturing on drinking water and groundwater. The EPA has also announced its plan to propose pre-treatment standards under the Clean Water Act for wastewater discharges from shale hydraulic fracturing operations. Congress may consider legislation to amend the federal SDWA to require the disclosure of chemicals used by the oil and natural gas industry in the hydraulic fracturing process. Certain states, including Colorado, Utah and Wyoming, have issued similar disclosure rules. Several environmental groups have also petitioned the EPA to extend toxic release reporting requirements under the Emergency Planning and Community Right-to-Know Act to the oil and natural gas extraction industry.
In addition, the Department of the Interior has promulgated new regulations concerning the use of hydraulic fracturing on lands under its jurisdiction, which includes lands on which we conduct or plan to conduct operations. A number of other jurisdictions likewise have sought to impose restrictions or bans on hydraulic fracturing. On December 19, 2013, the Supreme Court of Pennsylvania overturned several portions of Pennsylvania's law regulating hydraulic fracturing, allowing local governments in Pennsylvania to regulate hydraulic fracturing through local land use regulations. Other local jurisdictions, including Denton, Texas and several cities in Colorado have adopted, or tried to adopt, regulations restricting hydraulic fracturing. Additional hydraulic fracturing requirements at the federal, state, tribal or local level may limit our ability to operate or increase our operating costs.
23
Air Emissions
The federal Clean Air Act and comparable state laws regulate emissions of various air pollutants through permitting programs and the imposition of other requirements. In addition, the EPA has developed and continues to develop stringent regulations governing emissions of toxic air pollutants at specified sources, including oil and natural gas production. Federal and state regulatory agencies can impose administrative, civil and criminal penalties for non-compliance with air permits or other requirements of the federal Clean Air Act and associated state laws and regulations. Our operations, or the operations of service companies engaged by us, may in certain circumstances and locations be subject to permits and restrictions under these statutes for emissions of air pollutants.
In 2012, the EPA issued four new regulations for the oil and natural gas industry, including: a new source performance standard for volatile organic compounds; a new source performance standard for sulfur dioxide; an air toxics standard for oil and natural gas production; and an air toxics standard for natural gas transmission and storage. The final rule includes the first federal air standards for natural gas wells that are hydraulically fractured, or refractured, as well as requirements for several sources, such as storage tanks and other equipment, and has the effect of limiting methane emissions from these sources. Compliance with these regulations has imposed additional requirements and costs on our operations.
In October 2015, the EPA announced that it was lowering the primary national ambient air quality standard for ozone from 75 parts per billion to 70 parts per billion. Implementation will take place over several years; however, the new standard could result in a significant expansion of ozone nonattainment areas across the United States, including areas in which we operate. Oil and natural gas operations in ozone nonattainment areas would likely be subject to increased regulatory burdens in the form of more stringent emission controls, emission offset requirements, and increased permitting delays and costs.
Climate Change
Studies over recent years have indicated that emissions of certain gases may be contributing to warming of the Earth's atmosphere. In response to these studies, governments have been adopting domestic and international climate change regulations that require reporting and reductions of the emission of such greenhouse gases. Methane, a primary component of natural gas, and carbon dioxide, a byproduct of burning oil, natural gas and refined petroleum products, are considered greenhouse gases. Internationally, the United Nations Framework Convention on Climate Change, the Kyoto Protocol and the Paris Agreement address greenhouse gas emissions, and several countries, including those comprising the European Union, have established greenhouse gas regulatory systems. In the United States, at the state level, many states, either individually or through multi-state regional initiatives, have been implementing legal measures to reduce emissions of greenhouse gases, primarily through emission inventories, emissions targets, greenhouse gas cap and trade programs or incentives for renewable energy generation, while others have considered adopting such greenhouse gas programs.
At the federal level, the EPA has issued regulations requiring us and other companies to annually report certain greenhouse gas emissions from our oil and natural gas facilities. Beyond its measuring and reporting rules, the EPA has issued an "Endangerment Finding" under section 202(a) of the Clean Air Act, concluding greenhouse gas pollution threatens the public health and welfare of current and future generations. The finding served as the first step in issuing regulations that require permits for and reductions in greenhouse gas emissions for certain facilities.
In addition, President Obama released a Strategy to Reduce Methane Emissions in March 2014. Consistent with that strategy, the EPA issued a proposed rule in 2015 that would set additional standards for methane and volatile organic compound emissions from oil and gas production sources, including hydraulically fractured oil wells and natural gas processing and transmission sources. The EPA intends to issue a final rule in 2016. In addition, the federal Bureau of Land Management (BLM) has
24
proposed standards for reducing venting and flaring on public lands. The EPA and BLM actions are part of a series of steps by the Administration that are intended to result by 2025 in a 40-45% decrease in methane emissions from the oil and gas industry as compared to 2012 levels. In the courts, several decisions have been issued that may increase the risk of claims being filed by governments and private parties against companies that have significant greenhouse gas emissions. Such cases may seek to challenge air emissions permits that greenhouse gas emitters apply for and seek to force emitters to reduce their emissions or seek damages for alleged climate change impacts to the environment, people, and property.
Any laws or regulations that may be adopted to restrict or reduce emissions of greenhouse gases could require us to incur additional operating costs, such as costs to purchase and operate emissions control systems or other compliance costs, and reduce demand for our products.
The National Environmental Policy Act
Oil and natural gas exploration and production activities may be subject to the National Environmental Policy Act, or NEPA. NEPA requires federal agencies, including the Department of the Interior, to evaluate major agency actions that have the potential to significantly impact the environment. In the course of such evaluations, an agency will prepare an Environmental Assessment that assesses the potential direct, indirect and cumulative impacts of a proposed project and, if necessary, will prepare a more detailed Environmental Impact Statement that may be made available for public review and comment. All of our current exploration and production activities, as well as proposed exploration and development plans, on federal lands require governmental permits that are subject to the requirements of NEPA. This process has the potential to delay the development of oil and natural gas projects.
Threatened and endangered species, migratory birds, and natural resources
Various state and federal statutes prohibit certain actions that adversely affect endangered or threatened species and their habitat, migratory birds, wetlands, and natural resources. These statutes include the Endangered Species Act, the Migratory Bird Treaty Act and the Clean Water Act. The United States Fish and Wildlife Service may designate critical habitat areas that it believes are necessary for survival of threatened or endangered species. A critical habitat designation could result in further material restrictions on federal land use or on private land use and could delay or prohibit land access or development. Where takings of or harm to species or damages to wetlands, habitat, or natural resources occur or may occur, government entities or at times private parties may act to prevent or restrict oil and gas exploration activities or seek damages for any injury, whether resulting from drilling or construction or releases of oil, wastes, hazardous substances or other regulated materials, and in some cases, criminal penalties, may result.
Occupational Safety and Health Act
We are subject to the requirements of the federal Occupational Safety and Health Act and comparable state statutes that regulate the protection of the health and safety of workers. In addition, the Occupational Safety and Health Administration's hazard communication standard requires that information be maintained about hazardous materials used or produced in operations and that this information be provided to employees.
Employees and Principal Office
As of December 31, 2015, we had 323 full-time employees. We hire independent contractors on an as needed basis. We have no collective bargaining agreements with our employees. We believe that our employee relationships are satisfactory.
25
As of December 31, 2015, we leased corporate office space in Houston, Texas at 1000 Louisiana Street, where our principal offices are located. We also lease corporate office space in Denver, Colorado as well as a number of other field office locations.
Access to Company Reports
We file periodic reports, proxy statements and other information with the SEC in accordance with the requirements of the Securities Exchange Act of 1934, as amended. We make our Annual Reports on Form 10-K, Quarterly Reports on Form 10-Q, Current Reports on Form 8-K and Forms 3, 4 and 5 filed on behalf of directors and officers, and any amendments to such reports, available free of charge through our corporate website at www.halconresources.com as soon as reasonably practicable after such reports are filed with, or furnished to, the SEC. In addition, our insider trading policy, regulation FD policy, equity-based incentive grant policy, corporate governance guidelines, code of conduct, code of ethics, audit committee charter, compensation committee charter, nominating and corporate governance committee charter and reserves committee charter are available on our website under the heading "Investor Relations—Corporate Governance". Within the time period required by the SEC and the NYSE, as applicable, we will post on our website any modifications to the code of conduct and the code of ethics for our Chief Executive Officer and senior financial officers and any waivers applicable to senior officers as defined in the applicable code, as required by the Sarbanes-Oxley Act of 2002. You may also read and copy any document we file with the SEC at the SEC's Public Reference Room at 100 F Street, N.E., Washington, D.C. 20549. You may obtain information on the operation of the Public Reference Room by calling the SEC at 1-800-SEC-0330. In addition, our reports, proxy and information statements, and our other filings are also available to the public over the internet at the SEC's website at www.sec.gov. Unless specifically incorporated by reference in this Annual Report on Form 10-K, information that you may find on our website is not part of this report.
Oil and natural gas prices are volatile, and low prices could have a material adverse impact on our business.
Our revenues, profitability and future growth and the carrying value of our properties depend substantially on prevailing oil and natural gas prices. Prices also affect the amount of cash flow available for capital expenditures and our ability to borrow and raise additional capital. For example, due to the significant decrease in crude oil prices over the past year, we have significantly reduced our planned drilling and completion capital expenditures for 2016 and we currently expect to spend approximately $140 million to $160 million. The amount we will be able to borrow under our Senior Credit Agreement will be subject to periodic redetermination based in part on current oil and natural gas prices and on changing expectations of future prices. Lower prices may also reduce the amount of oil and natural gas that we can economically produce and have an adverse effect on the value of our properties. Sustained low prices may extend beyond the period of our current hedging transactions, which could prevent us from entering into new hedges at terms (or prices) acceptable to us, and could adversely affect our cash flows after our current hedges expire.
Historically, the markets for oil and natural gas have been volatile, and they are likely to continue to be volatile in the future. Among the factors that can cause volatility are:
- •
- the domestic and foreign supply of oil and natural gas;
- •
- the ability of members of the Organization of Petroleum Exporting Countries and other producing countries to agree upon and maintain
oil prices and production levels;
- •
- social unrest and political instability, particularly in major oil and natural gas producing regions outside the United States, such as the Middle East, and armed conflict or terrorist attacks, whether or not in oil or natural gas producing regions;
26
- •
- the level of consumer product demand;
- •
- the growth of consumer product demand in emerging markets, such as China;
- •
- labor unrest in oil and natural gas producing regions;
- •
- weather conditions, including hurricanes and other natural occurrences that affect the supply and/or demand of oil and natural gas;
- •
- the price and availability of alternative fuels;
- •
- the price of foreign imports;
- •
- worldwide economic conditions; and
- •
- the availability of liquid natural gas imports.
These external factors and the volatile nature of the energy markets make it difficult to estimate future prices of oil and natural gas.
We are currently out of compliance with the New York Stock Exchange's minimum share price requirement and are at risk of the NYSE delisting our common stock, which could materially impair the liquidity and value of our common stock.
Our common stock is currently listed on the NYSE. On August 25, 2015, we were notified by the NYSE that the average closing price of our common stock had fallen below $1.00 per share over a period of 30 consecutive trading days, which is the minimum average share price required by the NYSE. The NYSE will permit us to regain compliance by: (i) obtaining the requisite stockholder approval for a plan to regain compliance (such as a reverse stock split) by no later than our annual stockholder meeting in 2016, (ii) implementing the action promptly thereafter and (iii) the price of our common stock promptly exceeding $1.00 per share, and the price remaining above that level for at least the following 30 trading days. If we are unable to regain compliance, the NYSE will commence suspension and delisting procedures. In addition, if our common stock price remains below the $1.00 per share threshold and falls to the point where the NYSE considers the stock price to be "abnormally low," the NYSE has the discretion to begin delisting procedures immediately. While there is no formal definition of "abnormally low" in the NYSE rules, the NYSE has recently delisted the common stock of issuers trading below $0.16 per share.
A delisting of our common stock, either as result of a failure to regain compliance with the NYSE's minimum share price requirement or our failure to satisfy other qualitative or quantitative standards for continued listing on the NYSE, could negatively impact us by, among other things, reducing the liquidity and market price of our common stock, reducing the number of investors willing to hold or acquire our common stock, and limiting our ability to issue additional securities or obtain additional financing in the future. Moreover, a delisting of our common stock could constitute a "fundamental change" under the terms of our convertible preferred stock, which might require us to reserve a significantly greater number of shares of our common stock for issuance upon conversion of the convertible preferred stock and deplete the number of authorized shares of common stock available for issuance for other purposes.
We may have difficulty financing our planned capital expenditures which could adversely affect our growth.
We have experienced, and may continue to experience, substantial capital expenditure and working capital needs, primarily as a result of our drilling program. We may continue to selectively increase our acreage position, which would require capital in addition to the capital necessary to drill on our existing acreage. In addition, it is possible that we will acquire acreage in other areas that we believe are prospective for oil and natural gas production and expend capital to develop such acreage. We expect
27
to use borrowings under our Senior Credit Agreement and proceeds from potential future capital markets transactions, if necessary, to fund capital expenditures that are in excess of our cash flow and cash on hand.
Our Senior Credit Agreement limits our borrowings to the lesser of the borrowing base and the total commitments. As of December 31, 2015, our Senior Credit Agreement was a $1.5 billion facility with a borrowing base of approximately $827.4 million. As of December 31, 2015, we had $62.0 million of indebtedness outstanding, $1.6 million of letters of credit outstanding and $763.8 million of borrowing capacity available under our Senior Credit Agreement. Our borrowing base is determined semi-annually, and may also be redetermined periodically at the discretion of our lenders. Lower oil and natural gas prices may result in a reduction in our borrowing base at the next redetermination, which is currently scheduled for March 2016 and we expect the borrowing base to be confirmed between $650.0 million to $700.0 million. A reduction in our borrowing base could require us to repay any indebtedness in excess of the borrowing base. Our Senior Credit Agreement includes a covenant that requires the ratio of our total secured debt (excluding the Third Lien Notes) to EBITDA (as defined in the Senior Credit Agreement) be no greater than 2.75 to 1.00. In the event we have difficulty meeting the total secured debt to EBITDA test or the current ratio test in the future, we would be required to seek additional relief, and there is no assurance that it would be granted. Additionally, the indentures governing our senior debt contain covenants limiting our ability to incur additional indebtedness, including borrowings under our Senior Credit Agreement, unless we meet one of two alternative tests. The first test applies to all indebtedness and requires that, after giving effect to the incurrence of additional debt, our fixed charge coverage ratio (which is the ratio of our adjusted consolidated EBITDA (as defined in our indentures) to our adjusted consolidated interest expense over the trailing four fiscal quarters) will be at least 2.0 to 1.0. The second test allows us to incur additional indebtedness, beyond the limitations of the fixed charge coverage ratio test, as long as this additional debt is incurred under Credit Facilities (as defined in our indentures) and, in the case of certain secured indebtedness, the amount thereof is not more than, subject to certain exceptions, the greater of (i) $950 million, (ii) the borrowing base in effect under our Senior Credit Agreement, and (iii) 30% of our adjusted consolidated net tangible assets, or ACNTA, and, in the case of unsecured indebtedness, the amount thereof is not more than the greater of the fixed sum of $750 million or 30% of our ACNTA. ACNTA is defined in all of our indentures and is determined primarily by the value of discounted future net revenues from proved oil and natural gas reserves plus the capitalized cost attributable to our unevaluated properties. Currently, we are permitted to incur additional indebtedness under these incurrence tests, but may be limited in the future. Lower oil and natural gas prices in the future could reduce our adjusted consolidated EBITDA, as well as our adjusted consolidated net tangible assets, and thus could reduce our ability to incur additional indebtedness.
Additionally, our ability to complete future equity offerings is limited by general market conditions. If we are not able to borrow sufficient amounts under our Senior Credit Agreement and/or are unable to raise sufficient capital to fund our capital expenditures, we may be required to curtail our drilling, development, land acquisition and other activities, which could result in a decrease in our production of oil and natural gas, forfeiture of leasehold interests if we are unable or unwilling to renew them, and could force us to sell some of our assets on an untimely or unfavorable basis, each of which could have a material adverse effect on our results and future operations.
We may be required to take non-cash asset write downs.
We may be required under full cost accounting rules to write down the carrying value of oil and natural gas properties if oil and natural gas prices do not improve or if there are substantial downward adjustments to our estimated proved reserves, increases in our estimates of development costs or deterioration in our exploration results. We utilize the full cost method of accounting for oil and natural gas exploration and development activities. Under full cost accounting, we are required by SEC
28
regulations to perform a ceiling test each quarter. The ceiling test is an impairment test and generally establishes a maximum, or "ceiling," of the book value of oil and natural gas properties that is equal to the expected after tax present value (discounted at 10%) of the future net cash flows from proved reserves, including the effect of cash flow hedges when hedge accounting is applied, calculated using the unweighted arithmetic average of the first day of each month for the 12-month period ending at the balance sheet date. If the net book value of oil and natural gas properties (reduced by any related net deferred income tax liability and asset retirement obligation) exceeds the ceiling limitation, SEC regulations require us to impair or "write down" the book value of our oil and natural gas properties.
Due to the decline in the unweighted 12-month average price of oil and natural gas during 2015, the net book value of our oil and natural gas properties at March 31, June 30, September 30, and December 31, 2015 exceeded the respective ceiling amounts for each quarter end. As a result we recorded full cost ceiling test impairments before income taxes of $2.6 billion for the year ended December 31, 2015. As ceiling test computations depend upon the calculated unweighted arithmetic average prices and oil and natural gas prices are inherently volatile, sustained lower commodity prices will continue to have a material impact upon our full cost ceiling test calculation. Continued write downs of oil and natural gas properties may occur until such time as commodity prices have recovered, and remained at recovered levels, so as to increase the 12-month average price used in the ceiling calculation. Depending on the magnitude, a ceiling test write down could materially affect our results of operations.
Costs associated with unevaluated properties, which were approximately $1.6 billion at December 31, 2015, are not initially subject to the ceiling test limitation. Rather, we assess all items classified as unevaluated property on a quarterly basis for possible impairment or reduction in value based upon our intentions with respect to drilling on such properties, the remaining lease term, geological and geophysical evaluations, drilling results, the assignment of proved reserves, and the economic viability of development if proved reserves are assigned. These factors are significantly influenced by our expectations regarding future commodity prices, development costs, and access to capital at acceptable cost. During any period in which these factors indicate impairment, the cumulative drilling costs incurred to date for such property and all or a portion of the associated leasehold costs are transferred to the full cost pool and are then subject to depletion and the ceiling test limitation. Accordingly, a significant change in these factors, many of which are beyond our control, may shift a significant amount of cost from unevaluated properties into the full cost pool that is subject to depletion and the ceiling test limitation.
We are subject to various contractual limitations that affect the discretion of our management in operating our business.
The indentures governing our senior unsecured debt and our Senior Credit Agreement and the certificate of designations governing our Series A Preferred Stock contain various provisions that may limit our management's discretion in certain respects. In particular, these agreements limit our and our subsidiaries' ability to, among other things:
- •
- pay dividends on, redeem or repurchase shares of our common stock and, under certain circumstances, our convertible preferred stock,
and redeem or repurchase our subordinated debt;
- •
- make loans to others;
- •
- make investments;
- •
- incur additional indebtedness or issue preferred stock that is senior to our convertible preferred stock as to dividends or rights
upon liquidation, winding-up or dissolution;
- •
- create certain liens;
29
- •
- sell assets;
- •
- enter into agreements that restrict dividends or other payments from our restricted subsidiaries to us;
- •
- consolidate, merge or transfer all or substantially all of our assets and those of our restricted subsidiaries taken as a whole;
- •
- engage in transactions with affiliates;
- •
- enter into hedging contracts;
- •
- create unrestricted subsidiaries; and
- •
- enter into sale and leaseback transactions.
In January 2016, we announced that future quarterly dividends on the Series A Preferred Stock will be suspended due to the weakened market conditions as a result of low commodity prices. Additionally, if dividends on our Series A Preferred Stock are in arrears and unpaid for six or more quarterly periods, the holders (voting as a single class) of our outstanding Series A Preferred Stock will be entitled to elect two additional directors to our board of directors until paid in full.
As part of HK TMS's transaction with Apollo, there are certain restrictions on the transfer of assets, including cash, to us from HK TMS. HK TMS is required to maintain a minimum cash balance equal to two quarterly dividend payments, of approximately $3.0 million each, plus $10.0 million. Additionally, the quarterly 8% dividends paid to holders of the HK TMS preferred shares have priority over other cash distributions. No dividends shall be paid to us from HK TMS prior to December 31, 2016. HK TMS is restricted from transferring more than 20% of its maximum net acres and from transferring any assets exceeding 20% of HK TMS's proved reserves at any one time. Finally, proceeds from any such transfers of acres or other assets must be used for HK TMS's capital or operating expenditures, or to redeem the preferred shares.
Compliance with these and other limitations may limit our ability to operate and finance our business and engage in certain transactions in the manner we might otherwise. In addition, if we fail to comply with the limitations under our indentures or Senior Credit Agreement, our creditors, if the agreements so provide, may accelerate the related indebtedness as well as any other indebtedness to which a cross-acceleration or cross-default provision applies. In addition, lenders may be able to terminate any commitments they had made to make further funds available to us.
We have substantial indebtedness and may incur substantially more debt. Higher levels of indebtedness make us more vulnerable to economic downturns and adverse developments in our business.
We have incurred substantial debt amounting to approximately $2.9 billion as of December 31, 2015. As a result of our indebtedness, we will need to use a substantial portion of our cash flow to pay interest, which will reduce the amount we will have available to finance our operations and other business activities and could limit our flexibility in planning for or reacting to changes in our business and the industry in which we operate. Our indebtedness under our Senior Credit Agreement is at a variable interest rate, and so a rise in interest rates will generate greater interest expense to the extent we do not have hedging arrangements that are effective in mitigating interest rate fluctuations. The amount of our debt may also cause us to be more vulnerable to economic downturns and adverse developments in our business.
We may incur substantially more debt in the future. The indentures governing our outstanding senior notes contain restrictions on our incurrence of additional indebtedness. These restrictions, however, are subject to a number of qualifications and exceptions, and under certain circumstances, we could incur substantial additional indebtedness in compliance with these restrictions. Moreover, these
30
restrictions do not prevent us from incurring obligations that do not constitute "indebtedness" as defined under the indentures. At December 31, 2015, our Senior Credit Agreement was a $1.5 billion facility with a borrowing base of approximately $827.4 million. At December 31, 2015, we had $62.0 million of indebtedness outstanding, $1.6 million of letters of credit outstanding and $763.8 million of borrowing capacity available under our Senior Credit Agreement.
Our ability to meet our debt obligations and other expenses will depend on our future performance, which will be affected by financial, business, economic, regulatory and other factors, many of which we are unable to control. If our cash flow is not sufficient to service our debt, we may be required to refinance debt, sell assets or sell additional shares of common or preferred stock on terms that we may not find attractive if it may be done at all. Further, our failure to comply with the financial and other restrictive covenants relating to our indebtedness could result in a default under that indebtedness, which could adversely affect our business, financial condition and results of operations.
Offers or sales of a substantial number of shares of our common stock by our shareholders may cause the market price of our common stock to decline.
We have agreed to file registration statements under the Securities Act of 1933, as amended, covering the resale of approximately 25% of our outstanding common stock. In addition, we have also agreed to file registration statements covering the approximately 31.1 million shares of common stock underlying the Convertible Note and the February 2012 Warrants. Should the stockholders to whom we owe these obligations exercise their rights to require us to file such registration statements, such filing, together with any actual sales of our common stock they may choose to make, could cause the market price of our common stock to fall and could make it more difficult for us to raise additional financing through future sales of equity or equity-related securities at a time and price that we deem reasonable or appropriate.
If we were to experience an ownership change, we could be limited in our ability to use net operating losses arising prior to the ownership change to offset future taxable income.
If we were to experience an "ownership change," as determined under section 382 of the Internal Revenue Code, our ability to offset taxable income arising after the ownership change with net operating losses (NOLs) arising prior to the ownership change would be limited, possibly substantially. An ownership change would establish an annual limitation on the amount of our pre-change NOLs we could utilize to offset our taxable income in any future taxable year to an amount generally equal to the value of our stock immediately prior to the ownership change multiplied by the long-term tax-exempt rate.
We depend on computer and telecommunications systems and failures in our systems or cyber security attacks could significantly disrupt our business operations.
We have entered into agreements with third parties for hardware, software, telecommunications and other information technology services in connection with our business. In addition, we have developed proprietary software systems, management techniques and other information technologies incorporating software licensed from third parties. It is possible we could incur interruptions from cyber security attacks, computer viruses or malware. We believe that we have positive relations with our related vendors and maintain adequate anti-virus and malware software and controls; however, any interruptions to our arrangements with third parties to our computing and communications infrastructure or our information systems could significantly disrupt our business operations.
31
Assets we acquire may prove to be worth less than we paid because of uncertainties in evaluating recoverable reserves and potential liabilities.
Our growth in 2013 and 2014 was due significantly to acquisitions of exploration and production companies, producing properties and undeveloped and unevaluated leaseholds. Acquisitions may also contribute to our future growth. Successful acquisitions require an assessment of a number of factors, including estimates of recoverable reserves, exploration potential, future oil and natural gas prices, operating and capital costs and potential environmental and other liabilities. Such assessments are inexact and their accuracy is inherently uncertain. In connection with our assessments, we perform a review of the acquired properties which we believe is generally consistent with industry practices. However, such a review will not reveal all existing or potential problems. In addition, our review may not permit us to become sufficiently familiar with the properties to fully assess their deficiencies and capabilities. We do not inspect every well. Even when we inspect a well, we do not always discover structural, subsurface and environmental problems that may exist or arise. We are generally not entitled to contractual indemnification for preclosing liabilities, including environmental liabilities. Normally, we acquire interests in properties on an "as is" basis with limited remedies for breaches of representations and warranties. As a result of these factors, we may not be able to acquire oil and natural gas properties that contain economically recoverable reserves or be able to complete such acquisitions on acceptable terms.
A downgrade in our credit rating could negatively impact our cost of and ability to access capital.
As of the date of this filing, our corporate credit rating was "SD" by Standard and Poor's (S&P) and "Caa2" with a stable outlook by Moody's Investors Service (Moody's). Although we are not aware of any current plans of these or other rating agencies to lower their respective ratings on us or our senior debt, we cannot be assured that our credit ratings will not be downgraded. A downgrade in our credit ratings could negatively impact our cost of capital and our ability to effectively execute aspects of our strategy. If our credit rating were downgraded, it could be difficult for us to raise debt in the public debt markets and the cost of that new debt could be higher than debt we could raise with our current ratings. In addition, a downgrade could impact requirements for us to provide financial assurance of performance under contractual arrangements or derivative agreements.
We may not be able to drill wells on a substantial portion of our acreage.
We may not be able to drill on a substantial portion of our acreage for various reasons. We may not generate or be able to raise sufficient capital to do so. Commodities pricing may also make drilling some acreage uneconomic. Our actual drilling activities and future drilling budget will depend on drilling results, oil and natural gas prices, the availability and cost of capital, drilling and production costs, availability of drilling services and equipment, lease expirations, gathering system and pipeline transportation constraints, regulatory approvals and other factors. In addition, any drilling activities we are able to conduct may not be successful or add additional proved reserves to our overall proved reserves, which could have a material adverse effect on our future business, financial condition and results of operations.
Part of our strategy involves drilling in shale formations, some of which are new and emerging, using horizontal drilling and completion techniques. The results of our drilling program using these techniques may be subject to more uncertainties than conventional drilling programs, especially in areas that are new and emerging. These uncertainties could result in an inability to meet our expectations for reserves and production.
The results of our drilling in new or emerging formations, such as the Tuscaloosa Marine Shale formation and the Utica / Point Pleasant formations are more uncertain initially than drilling results in areas that are more developed and have a longer history of established production. Newer or emerging formations and areas have limited or no production history and consequently we are less able to
32
predict drilling results in these areas. In addition, the use of horizontal drilling and completion techniques used in all of our shale formations involve certain risks and complexities that do not exist in conventional wells. The ultimate success of our drilling and completion strategies and techniques will be better evaluated over time as more wells are drilled and production profiles are better established.
If our drilling results are less than anticipated our investment in these areas may not be as attractive as we anticipate and we could incur material write downs of unevaluated properties and the value of our undeveloped acreage could decline in the future.
Certain of our undeveloped leasehold acreage is subject to leases that will expire over the next several years unless production is established on units containing the acreage.
As of December 31, 2015, we owned leasehold interests in approximately 183,000 net acres in the Tuscaloosa Marine Shale formation and 120,000 net acres in the Utica / Point Pleasant formations. A large portion of our acreage is not currently held by production. Unless production in paying quantities is established on units containing these leases during their terms or unless we pay (to the extent we have the contractual right to pay) delay rentals or obtain other extensions to maintain the lease, these leases will expire. If our leases expire, we will lose our right to develop the related properties.
Our drilling plans for these areas are subject to change based upon various factors, many of which are beyond our control, including drilling results, oil and natural gas prices, the availability and cost of capital, drilling and production costs, availability of drilling services and equipment, gathering system and pipeline transportation constraints, and regulatory approvals. Further, some of our acreage is located in sections where we do not hold the majority of the acreage and therefore it is likely that we will not be named operator of these sections. As a non-operating leaseholder we have less control over the timing of drilling and are therefore subject to additional risk of expirations.
Our ability to sell our production and/or receive market prices for our production may be adversely affected by transportation capacity constraints and interruptions.
If the amount of natural gas, condensate or oil being produced by us and others exceeds the capacity of the various transportation pipelines and gathering systems available in our operating areas, it will be necessary for new transportation pipelines and gathering systems to be built. Or, in the case of oil and condensate, it will be necessary for us to rely more heavily on trucks to transport our production, which is more expensive and less efficient than transportation via pipeline. The construction of new pipelines and gathering systems is capital intensive and construction may be postponed, interrupted or cancelled in response to changing economic conditions and the availability and cost of capital. In addition, capital constraints could limit our ability to build gathering systems to transport our production to transportation pipelines. In such event, costs to transport our production may increase materially or we might have to shut in our wells awaiting a pipeline connection or capacity and/or sell our production at much lower prices than market or than we currently project, which would adversely affect our results of operations.
A portion of our production may also be interrupted, or shut in, from time to time for numerous other reasons, including as a result of weather conditions (which may worsen due to climate changes), accidents, loss of pipeline or gathering system access, field labor issues or strikes, or we might voluntarily curtail production in response to market conditions. If a substantial amount of our production is interrupted at the same time, it could adversely affect our cash flow.
Unless we replace our reserves, our reserves and production will decline, which would adversely affect our financial condition, results of operations and cash flows.
Producing oil and natural gas reservoirs generally are characterized by declining production rates that vary depending upon reservoir characteristics and other factors. Decline rates are typically greatest
33
early in the productive life of a well. Estimates of the decline rate of an oil or natural gas well are inherently imprecise, and are less precise with respect to new or emerging oil and natural gas formations with limited production histories than for more developed formations with established production histories. Our production levels and the reserves that we currently expect to recover from our wells will change if production from our existing wells declines in a different manner than we have estimated and can change under other circumstances. Thus, our future oil and natural gas reserves and production and, therefore, our cash flow and results of operations are highly dependent upon our success in efficiently developing and exploiting our current properties and economically finding or acquiring additional recoverable reserves. We may not be able to develop, find or acquire additional reserves to replace our current and future production at acceptable costs. If we are unable to replace our current and future production, our cash flows and the value of our reserves may decrease, adversely affecting our business, financial condition, results of operations, cash flows and potentially the borrowing capacity under our Senior Credit Agreement.
Estimates of proved oil and natural gas reserves involve assumptions and any material inaccuracies in these assumptions will materially affect the quantities and the value of our reserves.
This Annual Report on Form 10-K contains estimates of our proved oil and natural gas reserves. These estimates are based upon various assumptions, including assumptions required by the SEC relating to oil and natural gas prices, drilling and operating expenses, capital expenditures, taxes and availability of funds. The process of estimating oil and natural gas reserves is complex. This process requires significant decisions and assumptions in the evaluation of available geological, geophysical, engineering and economic data for each reservoir. Therefore, these estimates are inherently imprecise.
Actual future production, oil and natural gas prices, revenues, taxes, development expenditures, operating expenses and quantities of recoverable oil and natural gas reserves will vary from those estimated. Any significant variance could materially affect the estimated quantities and the value of our reserves. For instance, the SEC mandated prices used in estimating our proved reserves are $50.28 per Bbl of oil and $2.587 per MMBtu of natural gas, which are significantly higher than current spot market prices. Our properties may also be susceptible to hydrocarbon drainage from production by other operators on adjacent properties. In addition, we may adjust estimates of proved reserves to reflect production history, results of exploration and development, prevailing oil and natural gas prices and other factors, many of which are beyond our control.
At December 31, 2015, approximately 44% of our estimated proved reserves were classified as proved undeveloped. Recovery of proved undeveloped reserves requires significant capital expenditures and successful drilling operations. The reserve data assumes that we will make significant capital expenditures to develop our reserves. The estimates of these oil and natural gas reserves and the costs associated with development of these reserves have been prepared in accordance with SEC regulations, however, actual capital expenditures will likely vary from estimated capital expenditures, development may not occur as scheduled and actual results may not be as estimated.
We depend substantially on the continued presence of key personnel for critical management decisions and industry contacts.
Our success depends upon the continued contributions of our executive officers and key employees, particularly with respect to providing the critical management decisions and contacts necessary to manage and maintain growth within a highly competitive industry. Competition for qualified personnel can be intense, particularly in the oil and natural gas industry, and there are a limited number of people with the requisite knowledge and experience. Under these conditions, we could be unable to attract and retain these personnel. The loss of the services of any of our executive officers or other key employees for any reason could have a material adverse effect on our business, operating results, financial condition and cash flows.
34
We will be subject to risks in connection with acquisitions, and the integration of significant acquisitions may be difficult.
We have completed in the past and may complete in the future significant acquisitions of reserves, properties, prospects and leaseholds and other strategic transactions that appear to fit within our overall business strategy, which may include the acquisition of asset packages of producing properties or existing companies or businesses operating in our industry. The successful acquisition of producing properties requires an assessment of several factors, including:
- •
- recoverable reserves;
- •
- future oil, natural gas and natural gas liquids prices and their appropriate differentials;
- •
- development and operating costs; and
- •
- potential environmental and other liabilities.
The accuracy of these assessments is inherently uncertain. In connection with these assessments, we perform a review of the subject properties that we believe to be generally consistent with industry practices. Our review will not reveal all existing or potential problems nor will it permit us to become sufficiently familiar with the properties to fully assess their deficiencies and potential recoverable reserves. Inspections may not always be performed on every well, and environmental problems are not necessarily observable even when an inspection is undertaken. Even when problems are identified, the seller may be unwilling or unable to provide effective contractual protection against all or part of the problems. We are generally not able to obtain contractual indemnification for environmental liabilities and normally acquire properties on an "as is" basis.
Significant acquisitions of existing companies or businesses and other strategic transactions may involve additional risks, including:
- •
- diversion of our management's attention to evaluating, negotiating and integrating significant acquisitions and strategic
transactions;
- •
- the challenge and cost of integrating acquired operations, information management and other technology systems and business cultures
with our own while carrying on our ongoing business;
- •
- difficulty associated with coordinating geographically separate organizations;
- •
- the challenge of integrating environmental compliance systems to meet requirements of rapidly changing regulations;
- •
- the challenge of attracting and retaining personnel associated with acquired operations; and
- •
- failure to realize the full benefit that we expect in estimated proved reserves, production volume, cost savings from operating synergies or other benefits anticipated from an acquisition, or to realize these benefits within our expected time frame.
The process of integrating operations could cause an interruption of, or loss of momentum in, the activities of our business. Members of our senior management may be required to devote considerable amounts of time to this integration process, which will decrease the time they will have to manage our business. If our senior management is not able to manage the integration process effectively, or if any significant business activities are interrupted as a result of the integration process, our business could be materially and adversely affected.
35
Our business is highly competitive.
The oil and natural gas industry is highly competitive in many respects, including identification of attractive oil and natural gas properties for acquisition, drilling and development, securing financing for such activities and obtaining the necessary equipment and personnel to conduct such operations and activities. In seeking suitable opportunities, we compete with a number of other companies, including large oil and natural gas companies and other independent operators with greater financial resources, larger numbers of personnel and facilities, and, in some cases, with more expertise. There can be no assurance that we will be able to compete effectively with these entities.
Our oil and natural gas activities are subject to various risks which are beyond our control.
Our operations are subject to many risks and hazards incident to exploring and drilling for, producing, transporting, marketing and selling oil and natural gas. Although we may take precautionary measures, many of these risks and hazards are beyond our control and unavoidable under the circumstances. Many of these risks or hazards could materially and adversely affect our revenues and expenses, the ability of certain of our wells to produce oil and natural gas in commercial quantities, the rate of production and the economics of the development of, and our investment in the prospects in which we have or will acquire an interest. Any of these risks and hazards could materially and adversely affect our financial condition, results of operations and cash flows. Such risks and hazards include:
- •
- human error, accidents, labor force and other factors beyond our control that may cause personal injuries or death to persons and
destruction or damage to equipment and facilities;
- •
- blowouts, fires, hurricanes, pollution and equipment failures that may result in damage to or destruction of wells, producing
formations, production facilities and equipment;
- •
- unavailability of materials and equipment;
- •
- engineering and construction delays;
- •
- unanticipated transportation costs and delays;
- •
- unfavorable weather conditions;
- •
- hazards resulting from unusual or unexpected geological or environmental conditions;
- •
- environmental regulations and requirements;
- •
- accidental leakage of toxic or hazardous materials, such as petroleum liquids, drilling fluids or salt water, into the environment;
- •
- hazards resulting from the presence of hydrogen sulfide (H2S) or other contaminants in gas we produce;
- •
- changes in laws and regulations, including laws and regulations applicable to oil and natural gas activities or markets for the oil
and natural gas produced;
- •
- fluctuations in supply and demand for oil and natural gas causing variations of the prices we receive for our oil and natural gas
production; and
- •
- the availability of alternative fuels and the price at which they become available.
As a result of these risks, expenditures, quantities and rates of production, revenues and operating costs may be materially affected and may differ materially from those anticipated by us.
36
Our exploration and development drilling efforts and the operation of our wells may not be profitable or achieve our targeted returns.
We require significant amounts of undeveloped leasehold acreage to further our development efforts. Exploration, development, drilling and production activities are subject to many risks, including the risk that commercially productive reservoirs will not be discovered. We invest in property, including undeveloped leasehold acreage, which we believe will result in projects that will add value over time. However, we cannot guarantee that our leasehold acreage will be profitably developed, that new wells drilled by us will be productive or that we will recover all or any portion of our investment in such leasehold acreage or wells. Drilling for oil and natural gas may involve unprofitable efforts, not only from dry wells but also from wells that are productive but do not produce sufficient net reserves to return a profit after deducting operating and other costs. In addition, wells that are profitable may not achieve our targeted rate of return. Our ability to achieve our target results are dependent upon the current and future market prices for oil and natural gas, costs associated with producing oil and natural gas and our ability to add reserves at an acceptable cost.
In addition, we may not be successful in controlling our drilling and production costs to improve our overall return. The cost of drilling, completing and operating a well is often uncertain and cost factors can adversely affect the economics of a project. We cannot predict the cost of drilling and completing a well, and we may be forced to limit, delay or cancel drilling operations as a result of a variety of factors, including:
- •
- unexpected drilling conditions;
- •
- pressure or irregularities in formations;
- •
- equipment failures or accidents and shortages or delays in the availability of drilling and completion equipment and services;
- •
- adverse weather conditions, including hurricanes; and
- •
- compliance with governmental requirements.
We are subject to complex federal, state, local and other laws and regulations that frequently are amended to impose more stringent requirements that could adversely affect the cost, manner or feasibility of doing business.
Companies that explore for and develop, produce, sell and transport oil and natural gas in the United States are subject to extensive federal, state and local laws and regulations, including complex tax and environmental, health and safety laws and the corresponding regulations, and are required to obtain various permits and approvals from federal, state and local agencies. If these permits are not issued or unfavorable restrictions or conditions are imposed on our drilling activities, we may not be able to conduct our operations as planned. We may be required to make large expenditures to comply with governmental regulations. Matters subject to regulation include:
- •
- water discharge and disposal permits for drilling operations;
- •
- drilling bonds;
- •
- drilling permits;
- •
- reports concerning operations;
- •
- air quality, air emissions, noise levels and related permits;
- •
- spacing of wells;
- •
- rights-of-way and easements;
37
- •
- unitization and pooling of properties;
- •
- pipeline construction;
- •
- gathering, transportation and marketing of oil and natural gas;
- •
- taxation; and
- •
- waste transport and disposal permits and requirements.
Failure to comply with applicable laws may result in the suspension or termination of operations and subject us to liabilities, including administrative, civil and criminal penalties. Compliance costs can be significant. Moreover, the laws governing our operations or the enforcement thereof could change in ways that substantially increase the costs of doing business. Any such liabilities, penalties, suspensions, terminations or regulatory changes could materially and adversely affect our business, financial condition and results of operations. Under environmental, health and safety laws and regulations, we also could be held liable for personal injuries, property damage (including site clean-up and restoration costs) and other damages including the assessment of natural resource damages. Such laws may impose strict as well as joint and several liability for environmental contamination, which could subject us to liability for the conduct of others or for our own actions that were in compliance with all applicable laws at the time such actions were taken. Environmental and other governmental laws and regulations also increase the costs to plan, design, drill, install, operate and abandon oil and natural gas wells. Moreover, public interest in environmental protection has increased in recent years, and environmental organizations have opposed, with some success, certain drilling projects. Part of the regulatory environment in which we operate includes, in some cases, federal requirements for performing or preparing environmental assessments, environmental impact studies and/or plans of development before commencing exploration and production activities. In addition, our activities are subject to regulation by oil and natural gas producing states relating to conservation practices and protection of correlative rights. These regulations affect our operations and limit the quantity of oil and natural gas we may produce and sell. Delays in obtaining regulatory approvals or necessary permits, the failure to obtain a permit or the receipt of a permit with excessive conditions or costs could have a material adverse effect on our ability to explore on, develop or produce our properties. Additionally, the oil and natural gas regulatory environment could change in ways that might substantially increase the financial and managerial costs to comply with the requirements of these laws and regulations and, consequently, adversely affect our profitability.
Federal, state and local legislation and regulatory initiatives relating to hydraulic fracturing could result in increased costs and additional operating restrictions or delays.
We engage third parties to provide hydraulic fracturing or other well stimulation services to us in connection with many of the wells for which we are the operator. Federal, state, tribal and local governments have been adopting or considering restrictions on or prohibitions of fracturing in areas where we currently conduct operations, or in the future plan to conduct operations. Consequently, we could be subject to additional levels of regulation, operational delays or increased operating costs and could have additional regulatory burdens imposed upon us that could make it more difficult to perform hydraulic fracturing and increase our costs of compliance and doing business.
From time to time, for example, legislation has been proposed in Congress to amend the federal SDWA to require federal permitting of hydraulic fracturing and the disclosure of chemicals used in the hydraulic fracturing process. Further, the EPA is conducting a wide-ranging study on the effects of hydraulic fracturing on drinking water resources. In December 2015, the EPA issued a draft final report for public comment and peer review. Other governmental reviews have also been recently conducted or are under way that focus on environmental aspects of hydraulic fracturing. For example, a federal BLM rulemaking for hydraulic fracturing practices on federal and Indian lands resulted in a 2015 final rule
38
that requires public disclosure of chemicals used in hydraulic fracturing, confirmation that the wells used in fracturing operations meet proper construction standards and development of plans for managing related flowback water. These activities could result in additional regulatory scrutiny that could make it difficult to perform hydraulic fracturing and increase our costs of compliance and doing business.
Certain states, including North Dakota, Ohio, Pennsylvania, and Texas where we conduct operations, likewise are considering or have adopted more stringent requirements for various aspects of hydraulic fracturing operations, such as permitting, disclosure, air emissions, well construction, seismic monitoring, waste disposal and water use. In addition to state laws, local land use restrictions, such as city ordinances, may restrict or prohibit drilling in general or hydraulic fracturing in particular. Such efforts have extended to bans on hydraulic fracturing. On December 19, 2013, the Pennsylvania Supreme Court overturned several portions of Pennsylvania's law regulating hydraulic fracturing, allowing local governments in Pennsylvania to regulate hydraulic fracturing through local land use regulations. Other local jurisdictions, including Dallas, Texas and several cities in Colorado, have adopted or tried to adopt restrictions on hydraulic fracturing, and anti-hydraulic fracturing activists are seeking more such controls.
The proliferation of regulations may limit our ability to operate. If the use of hydraulic fracturing is limited, prohibited or subjected to further regulation, these requirements could delay or effectively prevent the extraction of oil and natural gas from formations which would not be economically viable without the use of hydraulic fracturing. This could have a material adverse effect on our business, financial condition, results of operations and cash flows.
Regulation related to global warming and climate change could have an adverse effect on our operations and demand for oil and natural gas.
Studies over recent years have indicated that emissions of certain gases may be contributing to warming of the Earth's atmosphere. In response to these studies, governments have been adopting domestic and international climate change regulations that require reporting and reductions of the emission of such greenhouse gases. Methane, a primary component of natural gas, and carbon dioxide, a byproduct of burning oil, natural gas and refined petroleum products, are considered greenhouse gases. Internationally, the United Nations Framework Convention on Climate Change, the Kyoto Protocol and the Paris Agreement address greenhouse gas emissions, and international negotiations over climate change and greenhouse gases are continuing. Meanwhile, several countries, including those comprising the European Union, have established greenhouse gas regulatory systems.
In the United States, many states, either individually or through multi-state regional initiatives, have begun implementing legal measures to reduce emissions of greenhouse gases, primarily through emission inventories, emission targets, greenhouse gas cap and trade programs or incentives for renewable energy generation, while others have considered adopting such greenhouse gas programs.
At the federal level, the Obama Administration is attempting to address climate change through a variety of administrative actions. The EPA has issued greenhouse gas monitoring and reporting regulations that cover oil and natural gas facilities, among other industries. Beyond measuring and reporting, the EPA issued an "Endangerment Finding" under section 202(a) of the Clean Air Act, concluding certain greenhouse gas pollution threatens the public health and welfare of current and future generations. The finding served as the first step to issuing regulations that require permits for and reductions in greenhouse gas emissions for certain facilities. In March 2014, moreover, the President released a Strategy to Reduce Methane Emissions that included consideration of both voluntary programs and targeted regulations for the oil and gas sector. Towards that end, the EPA released five draft white papers on methane and volatile organic compound emissions and mitigation measures for natural gas compressors, hydraulically fractured oil wells, pneumatic devices, well liquids
39
unloading facilities and natural gas production and transmission facilities. Building on its white papers and the public input on those documents, the EPA issued a proposed rule in 2015 that would set additional standards for methane and volatile organic compound emissions from oil and gas production sources, including hydraulically fractured oil wells and natural gas processing and transmission sources. The EPA intends to issue a final rule in 2016. In addition, the BLM has proposed standards for reducing venting and flaring on public lands. The EPA and BLM actions are part of a series of steps by the Administration that are intended to result by 2025 in a 40-45% decrease in methane emissions from the oil and gas industry as compared to 2012 levels.
In the courts, several decisions have been issued that may increase the risk of claims being filed by governments and private parties against companies that have significant greenhouse gas emissions. Such cases may seek to challenge air emissions permits that greenhouse gas emitters apply for and seek to force emitters to reduce their emissions or seek damages for alleged climate change impacts to the environment, people, and property.
Any laws or regulations that may be adopted to restrict or reduce emissions of greenhouse gases could require us to incur additional operating costs, such as costs to purchase and operate emissions controls, to obtain emission allowances or to pay emission taxes, and reduce demand for our products.
Requirements to reduce gas flaring in North Dakota could have an adverse effect on our operations.
Wells in the Bakken / Three Forks formations in North Dakota, where we have significant operations, yield natural gas as a byproduct of oil production. Bottlenecks in the gas gathering network in certain areas resulted in some of that natural gas being flared instead of processed. In 2014, the North Dakota Industrial Commission (NDIC), the State's chief energy regulator, issued an order to reduce the volume of natural gas flared from oil wells in the Bakken / Three Forks formations. The State's objectives are to cause operators to capture 85% of the natural gas by November 1, 2016, and 90%, with the potential for 95%, by the fourth quarter 2020. In addition, the NDIC is requiring operators to develop gas capture plans that describe how much natural gas is expected to be produced, how it will be delivered to a processor and where it will be processed. Production caps or penalties will be imposed on certain wells that cannot meet the capture goals. These capture requirements and any similar future obligations in North Dakota or our other locations, may increase our operational costs or restrict our production, which could materially and adversely affect our financial condition, results of operations and cash flows.
Crude oil from the Bakken / Three Forks formations may pose unique hazards that may have an adverse effect on our operations.
The United States Department of Transportation (USDOT) has concluded that crude oil from the Bakken / Three Forks formations has a higher volatility than most other crude oil from the United States and thus is more ignitable and flammable. Based on that information, and several fires involving rail transportation of crude oil, USDOT has issued a final rule with new requirements for shipping crude oil by rail. In addition, the rail industry has adopted increased precautions for crude shipments. Any restrictions that significantly affect transportation of crude oil production could materially and adversely affect our financial condition, results of operations and cash flows.
Operations on the Fort Berthold Indian Reservation of the Three Affiliated Tribes in North Dakota are subject to various federal and tribal regulations and laws, any of which may increase our costs and delay our operations.
Various federal agencies within the U.S. Department of the Interior, particularly the Office of Natural Resources Revenue (formerly the Minerals Management Service) and the Bureau of Indian Affairs, along with the Three Affiliated Tribes, promulgate and enforce regulations pertaining to
40
operations on the Fort Berthold Indian Reservation on which we hold approximately 28,000 net acres. In addition, the Three Affiliated Tribes is a sovereign nation having the right to enforce laws and regulations independent from federal, state and local statutes and regulations. These tribal laws and regulations include various taxes, fees and other conditions that apply to lessees, operators and contractors conducting operations on Native American tribal lands. Lessees and operators conducting operations on tribal lands can be subject to the Native American tribal court system. One or more of these factors may increase our costs of doing business on the Fort Berthold Indian Reservation and may have an adverse impact on our ability to effectively transport products within the Fort Berthold Indian Reservation or to conduct our operations on such lands.
Our operations substantially depend on the availability of water. Restrictions on our ability to obtain, dispose of or recycle water may impact our ability to execute our drilling and development plans in a timely or cost-effective manner.
Water is an essential component of our drilling and hydraulic fracturing processes. If we are unable to obtain water to use in our operations from local sources, we may be unable to economically produce oil, natural gas liquids and natural gas, which could have an adverse effect on our business, financial condition and results of operations. Wastewaters from our operations typically are disposed of via underground injection. Some studies have linked earthquakes in certain areas to underground injection, which is leading to greater public scrutiny of disposal wells. Any new environmental initiatives or regulations that restrict injection of fluids, including, but not limited to, produced water, drilling fluids and other wastes associated with the exploration, development or production of oil and gas, or that limit the withdrawal, storage or use of surface water or ground water necessary for hydraulic fracturing of our wells, could increase our operating costs and cause delays, interruptions or cessation of our operations, the extent of which cannot be predicted, and all of which would have an adverse effect on our business, financial condition, results of operations and cash flows.
The ongoing implementation of federal legislation enacted in 2010 could have an adverse impact on our ability to use derivative instruments to reduce the effects of commodity prices, interest rates and other risks associated with our business.
Historically, we have entered into a number of commodity derivative contracts in order to hedge a portion of our oil and natural gas production. On July 21, 2010, President Obama signed into law the Dodd-Frank Wall Street Reform and Consumer Protection Act, or the Dodd-Frank Act, which requires the SEC and the Commodity Futures Trading Commission (or CFTC), along with other federal agencies, to promulgate regulations implementing the new legislation. The CFTC, in coordination with the SEC and various United States federal banking regulators, has issued regulations to implement the so-called "Volcker Rule" under which banking entities are generally prohibited from proprietary trading of derivatives. Although conditional exemptions from this general prohibition are available, the Volcker Rule may limit the trading activities of banking entities that have been counterparties to our derivatives trades in the past.
The CFTC also has finalized other regulations implementing the Dodd-Frank Act's provisions regarding trade reporting, margin and position limits; however, some regulations remain to be finalized and it is not possible at this time to predict when the CFTC will adopt final rules. For example, the CFTC has re-proposed regulations setting position limits for certain futures and option contracts in the major energy markets and for swaps that are their economic equivalents. Certain bona fide hedging transactions are expected to be made exempt from these limits. Also, it is possible that under recently adopted margin rules, some CFTC registered swap dealers may require us to post initial and variation margins in connection with certain swaps not subject to central clearing.
The Dodd-Frank Act and any additional implementing regulations could significantly increase the cost of some commodity derivative contracts (including through requirements to post collateral, which
41
could adversely affect our available liquidity), materially alter the terms of some commodity derivative contracts, limit our ability to trade some derivatives to hedge risks, reduce the availability of some derivatives to protect against risks we encounter, and reduce our ability to monetize or restructure our existing commodity derivative contracts. If we reduce our use of derivatives as a consequence, our results of operations may become more volatile and our cash flows may be less predictable, which could adversely affect our ability to plan for and fund capital expenditures. Increased volatility may make us less attractive to certain types of investors. Finally, the Dodd-Frank Act was intended, in part, to reduce the volatility of oil and natural gas prices, which some legislators attributed to speculative trading in derivatives and commodity instruments related to oil and natural gas. If the implementing regulations result in lower commodity prices, our revenues could be adversely affected. Any of these consequences could adversely affect our business, financial condition and results of operations.
We cannot be certain that the insurance coverage maintained by us will be adequate to cover all losses that may be sustained in connection with all oil and natural gas activities.
We maintain general and excess liability policies, which we consider to be reasonable and consistent with industry standards. These policies generally cover:
- •
- personal injury;
- •
- bodily injury;
- •
- third party property damage;
- •
- medical expenses;
- •
- legal defense costs;
- •
- pollution in some cases;
- •
- well blowouts in some cases; and
- •
- workers compensation.
As is common in the oil and natural gas industry, we will not insure fully against all risks associated with our business either because such insurance is not available or because we believe the premium costs are prohibitive. A loss not fully covered by insurance could have a material effect on our financial position, results of operations and cash flows. There can be no assurance that the insurance coverage that we maintain will be sufficient to cover claims made against us in the future.
Title to the properties in which we have an interest may be impaired by title defects.
We generally obtain title opinions on significant properties that we drill or acquire. However, there is no assurance that we will not suffer a monetary loss from title defects or title failure. Additionally, undeveloped acreage has greater risk of title defects than developed acreage. Generally, under the terms of the operating agreements affecting our properties, any monetary loss is to be borne by all parties to any such agreement in proportion to their interests in such property. If there are any title defects or defects in assignment of leasehold rights in properties in which we hold an interest, we will suffer a financial loss.
The unavailability or high cost of drilling rigs, pressure pumping equipment and crews, other equipment, supplies, water, personnel and oil field services could adversely affect our ability to execute our exploration and development plans on a timely basis and within our budget.
Our industry is cyclical and, from time to time, there is a shortage of drilling rigs, equipment, supplies, water or qualified personnel. During these periods, the costs and delivery times of rigs, equipment and supplies are substantially greater. In addition, the demand for, and wage rates of,
42
qualified drilling rig crews rise as the number of active rigs in service increases. Increasing levels of exploration and production may increase the demand for oilfield services and equipment, and the costs of these services and equipment may increase, while the quality of these services and equipment may suffer. The unavailability or high cost of drilling rigs, pressure pumping equipment, supplies or qualified personnel can materially and adversely affect our operations and profitability. In order to secure drilling rigs and pressure pumping equipment, we have entered into certain contracts that extend over several months and or years. If demand for drilling rigs and pressure pumping equipment subside during the period covered by these contracts, the price we are required to pay may be significantly more than the market rate for similar services.
We depend on the skill, ability and decisions of third-party operators of the oil and natural gas properties in which we have a non-operated working interest.
The success of the drilling, development and production of the oil and natural gas properties in which we have or expect to have a non-operating working interest is substantially dependent upon the decisions of such third-party operators and their diligence to comply with various laws, rules and regulations affecting such properties. The failure of any third-party operator to make decisions, perform their services, discharge their obligations, deal with regulatory agencies, and comply with laws, rules and regulations, including environmental laws and regulations, in a proper manner with respect to properties in which we have an interest could result in material adverse consequences to our interest in such properties, including substantial penalties and compliance costs. Such adverse consequences could result in substantial liabilities to us or reduce the value of our properties, which could materially affect our results of operations.
Hedging transactions may limit our potential gains and increase our potential losses.
In order to manage our exposure to price risks in the marketing of our oil, natural gas, and natural gas liquids production, we have entered into oil, natural gas, and natural gas liquids price hedging arrangements with respect to a portion of our anticipated production and we may enter into additional hedging transactions in the future. While intended to reduce the effects of volatile commodity prices, such transactions may limit our potential gains and increase our potential losses if commodity prices were to rise substantially over the price established by the hedge. In addition, such transactions may expose us to the risk of loss in certain circumstances, including instances in which:
- •
- our production is less than expected;
- •
- there is a widening of price differentials between delivery points for our production; or
- •
- the counterparties to our hedging agreements fail to perform under the contracts.
ITEM 1B. UNRESOLVED STAFF COMMENTS
None.
A description of our properties is included in Item 1. Business and is incorporated herein by reference.
We believe that we have satisfactory title to the properties owned and used in our business, subject to liens for taxes not yet payable, liens incident to minor encumbrances, liens for credit arrangements and easements and restrictions that do not materially detract from the value of these properties, our interests in these properties, or the use of these properties in our business. We believe that our properties are adequate and suitable for us to conduct business in the future.
43
A description of our legal proceedings is included in Item 8. Consolidated Financial Statements and Supplementary Data—Note 9, "Commitments and Contingencies," and is incorporated herein by reference.
From time to time, we are a party to litigation or other legal proceedings that we consider to be a part of the ordinary course of our business. We are not currently involved in any legal proceedings, nor are we a party to any pending or threatened claims, that could reasonably be expected to have a material adverse effect on our financial condition or results of operations.
ITEM 4. MINE SAFETY DISCLOSURES
Not applicable.
44
ITEM 5. MARKET FOR REGISTRANT'S COMMON EQUITY, RELATED STOCKHOLDER MATTERS AND ISSUER PURCHASES OF EQUITY SECURITIES
Our common stock trades on the New York Stock Exchange (NYSE) under the symbol HK. The following table sets forth the quarterly high and low sales prices per share of our common stock as reported on the NYSE from January 1, 2014 through December 31, 2015. On August 25, 2015, we were notified by the NYSE that the average closing price of our common stock had fallen below $1.00 per share over a period of 30 consecutive trading days, which is the minimum average share price required by the NYSE. For additional information, please read Item 1A. Risk Factors—"We are currently out of compliance with the New York Stock Exchange's minimum share price requirement and are at risk of the NYSE delisting our common stock, which could materially impair the liquidity and value of our common stock" of this report. All share prices reflect the one-for-five reverse stock split, which was effective December 28, 2015.
| |
High | Low | |||||
|---|---|---|---|---|---|---|---|
2015 |
|||||||
First Quarter |
$ | 11.60 | $ | 5.30 | |||
Second Quarter |
10.30 | 5.05 | |||||
Third Quarter |
6.30 | 2.60 | |||||
Fourth Quarter |
5.15 | 0.90 | |||||
2014 |
|||||||
First Quarter |
$ | 21.70 | $ | 15.80 | |||
Second Quarter |
36.45 | 20.75 | |||||
Third Quarter |
37.50 | 19.80 | |||||
Fourth Quarter |
20.70 | 7.75 | |||||
We intend to retain earnings for use in the operation and expansion of our business and therefore do not anticipate declaring cash dividends on our common stock in the foreseeable future. Any future determination to pay dividends on common stock will be at the discretion of the board of directors and will be dependent upon then existing conditions, including our prospects, and such other factors, as the board of directors deems relevant. We are also restricted from paying cash dividends on common stock under our Senior Credit Agreement and under the terms of the indentures governing our other long-term debt.
Approximately 732 registered stockholders of record as of February 23, 2016 held our common stock. In many instances, a stockholder can hold shares through a broker or other entity holding shares in street name for one or more customers who beneficially own the shares.
45
Changes in Securities, Use of Proceeds and Issuer Purchases of Equity Securities
The following table sets forth certain information with respect to the surrender of our common stock by employees in exchange for the payment of certain tax withholding obligations during the three months ended December 31, 2015.
| |
Total Number of Shares Purchased(1) |
Average Price Paid Per Share |
Total Number of Shares Purchased as Part of Publicly Announced Plans or Programs |
Maximum Number (or Approximate Dollar Value) of Shares that May Yet Be Purchased Under the Plans or Programs |
|||||||||
|---|---|---|---|---|---|---|---|---|---|---|---|---|---|
October 2015 |
107 | $ | 4.47 | — | — | ||||||||
November 2015 |
455 | 2.92 | — | — | |||||||||
December 2015 |
71,294 | 2.12 | — | — | |||||||||
- (1)
- All of the shares were surrendered by employees in exchange for the payment of tax withholding upon the vesting of restricted stock awards. The acquisition of the surrendered shares was not part of a publicly announced program to repurchase shares of our common stock, nor were they considered as or accounted for as treasury stock.
Five-Year Stock Performance Graph
The following graph and table compare the cumulative 5-year total return provided to our stockholders on our common stock beginning December 31, 2010 through December 31, 2015, relative to the cumulative total returns of the NYSE Composite Index and the S&P Oil & Gas Exploration & Production Index. The comparison assumes an investment of $100 (with reinvestment of all dividends at the average of the closing stock prices at the beginning and end of the quarter) was made in our common stock on December 31, 2010, and in each of the indexes, and relative performance is tracked
46
through December 31, 2015. The identity of the companies included in the S&P Oil & Gas Exploration & Production Index will be provided upon request.
COMPARISON OF 5 YEAR CUMULATIVE TOTAL RETURN*
Among Halcón Resources Corporation, the NYSE Composite Index,
and S&P Oil & Gas Exploration & Production index
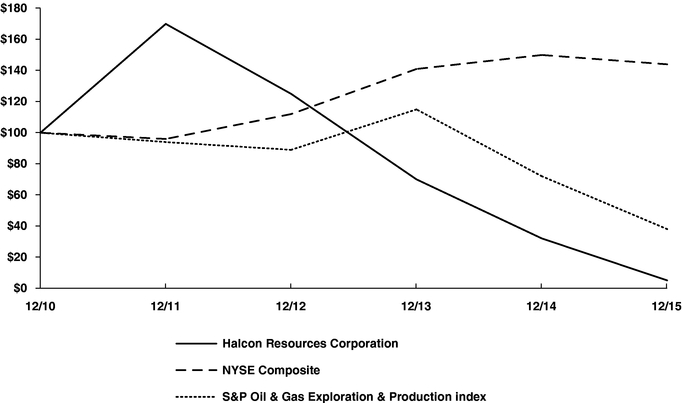
- *
- $100 invested on 12/31/10 in stock or index, including reinvestment of dividends.
Fiscal year ending December 31.
Value of Initial $100 Investment (End of Year)
| |
Years Ended December 31, | ||||||||||||||||||
|---|---|---|---|---|---|---|---|---|---|---|---|---|---|---|---|---|---|---|---|
| |
2010 | 2011 | 2012 | 2013 | 2014 | 2015 | |||||||||||||
Halcón Resources Corporation |
$ | 100 | $ | 170 | $ | 125 | $ | 70 | $ | 32 | $ | 5 | |||||||
NYSE Composite |
100 | 96 | 112 | 141 | 150 | 144 | |||||||||||||
S&P Oil & Gas Exploration & Production Index |
100 | 94 | 89 | 115 | 72 | 38 | |||||||||||||
47
ITEM 6. SELECTED FINANCIAL DATA
The following table presents selected historical financial data derived from our consolidated financial statements. The following data is only a summary and should be read with our historical consolidated financial statements and related notes contained in this document. Refer to Item 8. Consolidated Financial Statements and Supplementary Data—Note 3, "Acquisitions and Divestitures," for details regarding recent acquisitions, business combinations and dispositions that could impact the comparability of the following data.
| |
Years Ended December 31, | |||||||||||||||
|---|---|---|---|---|---|---|---|---|---|---|---|---|---|---|---|---|
| |
2015(8) | 2014(9) | 2013(10) | 2012 | 2011 | |||||||||||
| |
(In thousands, except per share data) |
|||||||||||||||
Income Statement Data: |
||||||||||||||||
Total operating revenues |
$ | 550,278 | $ | 1,148,261 | $ | 999,506 | $ | 248,322 | $ | 104,574 | ||||||
Income (loss) from operations |
(2,744,506 | ) | (58,387 | ) | (1,290,947 | ) | (29,717 | ) | 19,799 | |||||||
Net income (loss) |
(1,922,621 | ) | 315,956 | (1,222,662 | ) | (53,885 | ) | (1,403 | ) | |||||||
Net income (loss) available to common stockholders |
(2,006,958 | ) | 282,942 | (1,233,407 | ) | (142,330 | ) | (1,403 | ) | |||||||
Net income (loss) per share of common stock(1): |
||||||||||||||||
Basic |
$ | (18.66 | ) | $ | 3.40 | $ | (16.25 | ) | $ | (4.55 | ) | $ | (0.25 | ) | ||
Diluted |
$ | (18.66 | ) | $ | 2.93 | $ | (16.25 | ) | $ | (4.55 | ) | $ | (0.25 | ) | ||
| |
As of December 31, | |||||||||||||||
|---|---|---|---|---|---|---|---|---|---|---|---|---|---|---|---|---|
| |
2015 | 2014 | 2013 | 2012 | 2011 | |||||||||||
| |
(In thousands) |
|||||||||||||||
Balance sheet data: |
||||||||||||||||
Working capital (deficit) |
$ | 261,345 | $ | (41,977 | ) | $ | (325,756 | ) | $ | (390,111 | ) | $ | (7,620 | ) | ||
Total assets(2) |
3,458,692 | 6,383,227 | 5,298,986 | 5,002,320 | 267,174 | |||||||||||
Total long-term debt, net(2)(3)(4) |
2,873,637 | 3,695,488 | 3,126,318 | 1,995,793 | 202,000 | |||||||||||
Redeemable noncontrolling interest(5) |
183,986 | 117,166 | — | — | — | |||||||||||
Preferred stock(6) |
— | — | — | 695,238 | — | |||||||||||
Stockholders' equity(6)(7) |
52,414 | 1,772,169 | 1,447,610 | 1,397,982 | 1,680 | |||||||||||
- (1)
- No cash dividends on our common stock were declared or paid for any periods
presented.
- (2)
- In accordance with the Financial Accounting Standards Board (FASB) Accounting Standards Update (ASU) No. 2015-03, Simplifying
the Presentation of Debt Issuance Costs, (ASU 2015-03), unamortized debt issuance costs, except those on the senior revolving credit facility, were reclassified from "Debt issuance costs, net"
within total assets to "Long-term debt, net" within total long-term liabilities.
- (3)
- Excludes current portion of long-term debt for all periods presented.
- (4)
- On December 21, 2011, we entered into a Securities Purchase Agreement (the Agreement) and on May 6, 2015 we amended the Agreement (the Amendment), with HALRES LLC, formerly Halcón Resources, LLC (HALRES), in which HALRES purchased and we sold 14.7 million shares of our common stock for a purchase price of $275 million and HALRES purchased and we issued a senior convertible promissory note in the principal amount of $275 million, together with five year warrants to purchase 7.3 million shares of our common stock at an exercise price of $12.20 per share, subject to adjustment under certain circumstances. Refer to Item 8. Consolidated Financial Statements and Supplementary Data—Note 5, "Long-term Debt," for additional information regarding the Agreement and the Amendment.
48
- (5)
- On June 16, 2014, our subsidiary, HK TMS, LLC (HK TMS) entered into a transaction with funds and
accounts managed by Apollo Global Management, LLC, by initially selling 150,000 preferred shares in HK TMS, which holds all of our acreage in the Tuscaloosa Marine Shale, located in Mississippi and
Louisiana. For additional information regarding this transaction, see Item 8. Consolidated Financial Statements and Supplementary Data—Note 10, "Mezzanine
Equity."
- (6)
- Preferred stock outstanding at December 31, 2012 converted into 21.8 million shares of our common stock on
January 18, 2013, following stockholder approval.
- (7)
- On March 5, 2012, we sold in a private placement 4,444.4511 shares of 8% automatically convertible preferred stock
(Preferred Stock), par value $0.0001 per share, each share of which automatically converted into 2,000 shares of our common stock on April 17, 2012. We received gross proceeds of
approximately $400.0 million, or $45.00 per share of common stock, before offering expenses. No cash dividends were paid on the Preferred Stock as it converted into common stock before
May 31, 2012. Refer to Item 8. Consolidated Financial Statements and Supplementary Data—Note 11, "Stockholders' Equity," for additional information regarding the
offering and subsequent conversion.
- (8)
- For the year ended December 31, 2015, we incurred a $2.6 billion full cost ceiling impairment on the carrying value of
our oil and natural gas properties. Refer to Item 8. Consolidated Financial Statements and Supplementary Data—Note 4,"Oil and Natural Gas Properties," for additional
information regarding this impairment.
- (9)
- For the year ended December 31, 2014, we incurred the following charges, a $239.7 million full cost ceiling impairment
on the carrying value of oil and natural gas properties and a $35.6 million impairment on other operating property and equipment. Refer to the footnotes included in Item 8. Consolidated
Financial Statements and Supplementary Data, for additional information regarding these impairments.
- (10)
- For the year ended December 31, 2013, we incurred the following charges which contributed to our net loss for the year, a $1.1 billion full cost ceiling impairment on the carrying value of our oil and natural gas properties, a $228.9 million goodwill impairment, and a $67.5 million impairment of other operating property and equipment. Refer to the footnotes included in Item 8. Consolidated Financial Statements and Supplementary Data, for additional information regarding these impairments.
49
ITEM 7. MANAGEMENT'S DISCUSSION AND ANALYSIS OF FINANCIAL CONDITION AND RESULTS OF OPERATIONS
The following discussion is intended to assist in understanding our results of operations and our current financial condition. Our consolidated financial statements and the accompanying notes included elsewhere in this Annual Report on Form 10-K contain additional information that should be referred to when reviewing this material.
Statements in this discussion may be forward-looking. These forward-looking statements involve risks and uncertainties, including those discussed below, which could cause actual results to differ from those expressed.
Overview
We are an independent energy company focused on the acquisition, production, exploration and development of onshore liquids-rich oil and natural gas assets in the United States. We were incorporated in Delaware on February 5, 2004 and were recapitalized on February 8, 2012. During 2012, we focused our efforts on the acquisition of unevaluated leasehold and producing properties in selected prospect areas, providing us with an extensive drilling inventory in multiple basins that we believe allow for multiple years of production and broad flexibility to direct our capital resources to projects with the greatest potential returns. In the years since, we focused on the development of acquired properties and also divested non-core assets in order to fund activities in our core resource plays. Our oil and natural gas assets consist of proved reserves and undeveloped acreage positions in unconventional liquids-rich basins/fields. We have acquired acreage and may acquire additional acreage in the Bakken / Three Forks formations in North Dakota and the Eagle Ford formation in East Texas, as well as several other areas.
At December 31, 2015, our estimated total proved oil and natural gas reserves, as prepared by our independent reserve engineering firm, Netherland, Sewell & Associates, Inc. (Netherland, Sewell), were approximately 146.8 MMBoe, consisting of 120.7 MMBbls of oil, 13.0 MMBbls of natural gas liquids, and 78.4 Bcf of natural gas. Approximately 56% of our proved reserves were classified as proved developed as of December 31, 2015. We maintain operational control of approximately 95% of our proved reserves. Full year 2015 production averaged 41,542 Boe/d compared to 42,107 Boe/d in 2014. Our total operating revenues for 2015 were approximately $550.3 million compared to $1.1 billion in 2014. This represents a 52% decrease in operating revenues year over year, which was driven by the sustained decline in commodity prices.
Our average daily production slightly decreased year over year as we have curtailed our drilling and completion activities in response to the decline in commodity prices. However, production volumes associated with our core properties in the Bakken / Three Forks and the Eagle Ford formation in East Texas (which we refer to as "El Halcón") remained flat or slightly increased year over year as we have focused our drilling efforts on our most economic areas due to the current price environment. These areas collectively accounted for approximately 38,500 Boe/d, or 93% of our production in 2015. Our remaining production was associated with various non-core properties. In 2015, we participated in the drilling of 184 gross (49.0 net) wells all of which were completed and capable of production.
Our financial results depend upon many factors, but are largely driven by the volume of our oil and natural gas production and the price that we receive for that production. Our production volumes will decline as reserves are depleted unless we expend capital in successful development and exploration activities or acquire properties with existing production. The amount we realize for our production depends predominantly upon commodity prices and our related commodity price hedging activities, which are affected by changes in market demand and supply, as impacted by overall economic activity, weather, pipeline capacity constraints, inventory storage levels, basis differentials and
50
other factors. Accordingly, finding and developing oil and natural gas reserves at economical costs is critical to our long-term success.
For the twelve months ended December 31, 2015 we incurred capital expenditures for drilling and completions of approximately $508.4 million. We expect to spend approximately $140 million to $160 million on drilling and completion capital expenditures during 2016. In addition, we expect to spend approximately $10 million to $15 million on leasehold, infrastructure, seismic and other in 2016. The decrease in planned capital spending for 2016 is in response to the significant decrease in crude oil prices and our expectations that prices may not recover in the near term. Approximately 80-85% of our 2016 drilling and completion budget is expected to be spent in the Bakken / Three Forks formations in North Dakota and approximately 15-20% is budgeted for the El Halcón area in East Texas. Our 2016 drilling and completion budget currently contemplates running one to two operated rigs during the year, is based on our current view of market conditions and current business plans, and is subject to change.
We expect to fund our budgeted 2016 capital expenditures with cash flows from operations and, to a lesser extent, with borrowings under our Senior Credit Agreement. We strive to maintain financial flexibility and may access capital markets as necessary to maintain substantial borrowing capacity under our Senior Credit Agreement, facilitate drilling on our large undeveloped acreage position and permit us to selectively expand our acreage position and infrastructure projects. In the event our cash flows are materially less than anticipated and other sources of capital we historically have utilized are not available on acceptable terms, we may further curtail our capital spending.
Oil and natural gas prices are inherently volatile and have declined dramatically since mid-year 2014. In response to this we have significantly curtailed our capital spending, reduced operating costs, and have incurred substantial asset impairments, primarily as a result of the full cost ceiling test calculation. Sustained lower commodity prices will continue to have a material impact upon our full cost ceiling test calculation. In addition to commodity prices, our production rates, levels of proved reserves, future development costs, transfers of unevaluated properties, capital spending, and other factors will determine our actual ceiling test calculation and impairment analyses in future periods.
The ceiling test calculation dictates that we use the unweighted arithmetic average price of crude oil and natural gas as of the first day of each month for the 12-month period ending at the balance sheet date. If the average of the oil and natural gas prices for the first day of each month for the trailing 12-month period ended December 31, 2015 had been $46.03 per Bbl for oil and $2.45 per MMBtu for natural gas, holding all other factors constant, our ceiling test limitation related to the net book value of our proved oil and natural gas properties would have been reduced by an additional $242.5 million. The foregoing prices were calculated using a simple average of the oil and natural gas prices on the first day of the month for each of the 11 months ended February 2016, with the crude oil price for February 2016 of $31.62 per Bbl held constant for the remaining month to create a trailing 12-month period. As a consequence of the reduction in the ceiling test limitation, our ceiling test impairment would have increased by an additional $242.5 million, partly as a result of a decrease in our proved undeveloped reserves of approximately 33%, reflecting certain locations that would not be economical when using these prices. The foregoing calculation of the impact of lower commodity prices was prepared assuming that all inputs and factors other than oil and natural gas prices remain constant, thereby isolating the impact of commodity prices on our ceiling test limitation and proved reserves. Price is only one variable in the estimation of our proved reserves, and other factors could have a significant impact on future reserves and the present value of future cash flows, including, but not limited to, extensions and discoveries, changes in costs, drilling results, well performance and changes in our development plans. There are numerous uncertainties inherent in the estimation of proved reserves and accounting for oil and natural gas properties in subsequent periods and this estimate should not be construed as indicative of our development plans or future results.
51
Recent Developments
The prices of crude oil and natural gas have declined dramatically since mid-year 2014, having recently reached multiyear lows, as a result of robust non Organization of the Petroleum Exporting Countries' (OPEC) supply growth led by unconventional production in the United States, weakening demand in emerging markets, and OPEC's decision to continue to produce at current levels. These market dynamics have led many to conclude that commodity prices are likely to remain lower for a prolonged period. In response to these developments, among other things, we have reduced our spending and completed a series of transactions (described in more detail below) that resulted in the reduction of our long-term debt by approximately $1.0 billion and reduced our annual interest burden by approximately $53.5 million. We also extended the maturity date and amended other provisions of certain of our debt agreements. We are continuing to actively explore and evaluate various strategic alternatives to reduce the level of our long-term debt and lower our future cash interest obligations, including through debt repurchases, exchanges of existing debt securities for new debt securities and exchanges or conversions of existing debt securities for new equity securities, among other options. The timing and outcome of these efforts is highly uncertain. One or more of these alternatives could potentially be consummated without the consent of any one or more of our current security holders and, if consummated, could be dilutive to the holders of our outstanding equity securities and adversely affect the trading prices and values of our current debt and equity securities. Although we believe that we will have adequate liquidity over the next twelve months to operate our business and to meet our cash requirements, based on current market conditions, we believe that a reduction in our long-term debt and cash interest obligations is needed to improve our financial position and flexibility and to position us to take advantage of opportunities that may arise out of the current industry downturn.
Senior Unsecured Notes Exchanged for Senior Secured Second Lien Notes due 2022
On December 21, 2015, we completed the issuance of approximately $112.8 million aggregate principal amount of new 12.0% second lien senior secured notes due 2022 (the 2022 Second Lien Notes) in exchange for approximately $289.6 million principal amount of our senior unsecured notes, consisting of $116.6 million principal amount of our 9.75% senior notes due 2020, $137.7 million principal amount of our 8.875% senior notes due 2021 and $35.3 million principal amount of our 9.25% senior notes due 2022 in a public tender. At closing, we paid all accrued and unpaid interest since the respective interest payment dates of the notes surrendered in the exchange. The 2022 Second Lien Notes are fully and unconditionally guaranteed on a senior basis by our subsidiary guarantors' assets and by certain future subsidiaries of ours. As a result of the issuance of the 2022 Second Lien Notes, our borrowing base under our Senior Credit Agreement was reduced from $850.0 million to approximately $827.4 million. See Item 8. Consolidated Financial Statements and Supplementary Data—Note 5, "Long-term Debt" for additional information on the 2022 Second Lien Notes and the accounting for the exchange.
Amendments to the Senior Credit Agreement
On October 29, 2015, we entered into the Twelfth Amendment to our Senior Credit Agreement (the Twelfth Amendment) which, among other things, provided us additional flexibility with respect to exchanges and repurchases of senior unsecured notes; reaffirmed the borrowing base; and scheduled our next borrowing base redetermination for March 2016. We expect the borrowing base to be confirmed between $650.0 million to $700.0 million in this redetermination.
On September 10, 2015, in conjunction with the issuance of the Third Lien Notes (defined below), we entered into the Eleventh Amendment to our Senior Credit Agreement (the Eleventh Amendment) which, among other things, permitted us to incur the debt under the Third Lien Notes and to grant the liens in connection therewith; excluded the Third Lien Notes for the calculation of the total secured
52
debt to EBITDA ratio; and reduced the borrowing base under our Senior Credit Agreement to $850.0 million.
On May 1, 2015, in conjunction with the issuance of the 2020 Second Lien Notes (defined below), we entered into the Tenth Amendment to our Senior Credit Agreement (the Tenth Amendment) which among other things, permitted us to incur the debt under the 2020 Second Lien Notes and to grant the liens in connection therewith; replaced the interest coverage ratio covenant that had been modified in the Ninth Amendment with a covenant that requires the ratio of our total secured debt (excluding the Third Lien Notes pursuant the Eleventh Amendment) to EBITDA (as defined in the Senior Credit Agreement) be no greater than 2.75 to 1.00; reduced the borrowing base; and extended the maturity date of the Senior Credit Agreement to August 1, 2019. Prior to the Tenth Amendment, under the Ninth Amendment executed on February 25, 2015, the Senior Credit Agreement had a required minimum coverage of interest expenses of not less than 2.0 to 1.0 through March 31, 2016 and not less than 2.5 to 1.0 for subsequent periods.
Repurchase of Senior Unsecured Notes
During the fourth quarter of 2015, we repurchased approximately $44.5 million principal amount of our senior unsecured notes, consisting of $6.2 million principal amount of our 9.75% senior notes due 2020, $28.0 million principal amount of our 8.875% senior notes due 2021, and $10.3 million principal amount of our 9.25% senior notes due 2022. The net cash used to make these repurchases was approximately $14.8 million. Upon settlement of the repurchases, we paid all accrued and unpaid interest since the respective interest payment dates of the notes repurchased.
Subsequent to December 31, 2015, we repurchased $91.3 million principal amount of our senior unsecured notes, consisting of $15.0 million principal amount of our 9.25% senior notes due 2022, $51.8 million principal amount of our 8.875% senior notes due 2021, and $24.5 million principal amount of our 9.75% senior notes due 2020 for cash at prevailing market prices at the time of the transactions. Upon settlement of the repurchases, we paid all accrued and unpaid interest since the respective interest payment dates of the notes repurchased.
Senior Unsecured Notes Exchanged for Senior Secured Third Lien Notes
On September 10, 2015, we issued approximately $1.02 billion aggregate principal amount of new 13.0% third lien senior secured notes due 2022 (the Third Lien Notes) in exchange for approximately $1.57 billion principal amount of our senior unsecured notes, consisting of $497.2 million principal amount of our 9.75% senior notes due 2020, $774.7 million principal amount of our 8.875% senior notes due 2021, and $294.4 million principal amount of our 9.25% senior notes due 2022 in privately negotiated transactions with certain holders of our outstanding senior unsecured notes. At closing, we paid all accrued and unpaid interest since the respective interest payment dates of the notes surrendered in the exchange. The Third Lien Notes are fully and unconditionally guaranteed on a senior basis by our subsidiary guarantors' assets and by certain future subsidiaries of ours. See Item 8. Consolidated Financial Statements and Supplementary Data—Note 5, "Long-term Debt" for additional information on the Third Lien Notes and the accounting for the exchange.
HK TMS, LLC Agreement Amendment
On June 1, 2015, our subsidiary, HK TMS, LLC (HK TMS), and funds and accounts managed by affiliates of Apollo Global Management, LLC (Apollo) entered into an amendment to their original agreement (the HK TMS Amendment) which, among other things, i) commits HK TMS to drill a minimum of 6.5 net wells in each of the five consecutive twelve month periods beginning December 31, 2015 and ii) allows for the redemption of preferred shares at the greater of a 12% annual rate of return plus principal and 1.25 times Apollo's investment plus applicable fees (the Redemption Price),
53
between March 1, 2016 and June 30, 2016 at the election of Apollo to the extent there is available cash above the minimum cash balance. For any commitment period in which HK TMS does not meet its drilling obligation, HK TMS must use available cash, above its minimum required cash balance, to redeem preferred shares at the Redemption Price. See Item 8. Consolidated Financial Statements and Supplementary Data—Note 10, "Mezzanine Equity" for additional information on the HK TMS Amendment as well as the original agreement.
Issuance of Senior Secured Second Lien Notes due 2020
On May 1, 2015, we completed the issuance of $700 million aggregate principal amount of 8.625% second lien senior secured notes due 2020 (the 2020 Second Lien Notes) in a private offering. The 2020 Second Lien Notes were issued at par. The net proceeds from the sale of the 2020 Second Lien Notes were approximately $686.2 million (after deducting offering fees and expenses). We used the net proceeds from the offering to repay a majority of the then outstanding borrowings under our Senior Credit Agreement. Interest on the 2020 Second Lien Notes is payable on February 1 and August 1 of each year, beginning on August 1, 2015. The 2020 Second Lien Notes will mature on February 1, 2020. The 2020 Second Lien Notes are secured by second-priority liens on substantially all of our and our subsidiary guarantors' assets that secure our Senior Credit Agreement.
Amendments to Convertible Note and February 2012 Warrants
On March 9, 2015, we entered into an amendment (the HALRES Note Amendment) to our convertible note in the principal amount of $289.7 million due 2017 (the Convertible Note). The HALRES Note Amendment extended the maturity date of the Convertible Note by three years, from February 8, 2017 to February 8, 2020. The Convertible Note originally provided for prepayment without premium or penalty at any time after February 8, 2014, at which time it also became convertible into shares of our common stock at a conversion price of $22.50 per share. These dates have been extended and the conversion price has been adjusted, such that at any time after March 9, 2017, we may prepay the Convertible Note without premium or penalty, and HALRES may elect to convert all or any portion of unpaid principal and interest outstanding under the Convertible Note to shares of our common stock at a conversion price of $12.20 per share, subject to adjustments for stock splits and other customary anti-dilution provisions as set forth in the Convertible Note. At the same time, we also entered into an amendment (the Warrant Amendment, and collectively with the HALRES Note Amendment, the Amendments) to our five year warrants (the February 2012 Warrants) which extended the term of the February 2012 Warrants from February 8, 2017 to February 8, 2020 and adjusted the exercise price of the February 2012 Warrants from $22.50 to $12.20 per share. The Amendments were approved by our stockholders on May 6, 2015, in accordance with the rules of the New York Stock Exchange (NYSE).
Long-Term Debt Exchanged for Common Stock
During the second quarter of 2015, we entered into several exchange agreements with holders of our senior unsecured notes in which they agreed to exchange an aggregate $258.0 million principal amount of their senior unsecured notes for approximately 29.0 million shares of our common stock. See Item 8. Consolidated Financial Statements and Supplementary Data—Note 5, "Long-term Debt" for additional information on the exchange agreements.
Equity Distribution Agreement
On March 18, 2015, we entered into an Equity Distribution Agreement (the Equity Distribution Agreement) with BMO Capital Markets Corp., Jefferies LLC and MLV & Co. LLC (collectively, the Managers). Pursuant to the terms of the Equity Distribution Agreement, we sold, from time to time during 2015 through the Managers, by means of ordinary brokers' transactions through the facilities of
54
the NYSE at market prices, a total of approximately 1.9 million shares of our common stock for net proceeds of approximately $15.0 million, after deducting offering expenses.
Capital Resources and Liquidity
Our near-term capital spending requirements are expected to be funded with cash flows from operations, proceeds from potential capital market transactions and borrowings under our Senior Credit Agreement, which has a current borrowing base of approximately $827.4 million. Amounts borrowed under the Senior Credit Agreement will mature on August 1, 2019. Our borrowing base is redetermined on a semi-annual basis (with us and the lenders each having the right to one interim unscheduled redetermination between any two consecutive semi-annual redeterminations) and adjusted based on the estimated value of our oil and natural gas reserves, the amount and cost of our other indebtedness and other relevant factors. Our next redetermination is scheduled for March 2016 and we expect the borrowing base to be confirmed between $650.0 million and $700.0 million.
Our ability to utilize the full amount of our borrowing capacity is influenced by a variety of factors, including redeterminations of our borrowing base, and covenants under our Senior Credit Agreement and our senior debt indentures. Our Senior Credit Agreement contains customary financial and other covenants, including minimum working capital levels (the ratio of current assets plus the unused commitment under the Senior Credit Agreement to current liabilities) of not less than 1.0 to 1.0 and a covenant that requires the ratio of our total secured debt to EBITDA (as defined in the Senior Credit Agreement) be no greater than 2.75 to 1.0. Pursuant to the Eleventh Amendment, the Third Lien Notes are excluded from the calculation of total secured debt to EBITDA ratio. We are also subject to additional covenants limiting dividends and other restricted payments, transactions with affiliates, incurrence of debt, changes of control, asset sales, and liens on properties. Additionally, the indentures governing our senior debt contain covenants limiting our ability to incur additional indebtedness, including borrowings under our Senior Credit Agreement, unless we meet one of two alternative tests. The first test, the fixed charge coverage ratio test, applies to all indebtedness and requires that after giving effect to the incurrence of additional debt the ratio of our adjusted consolidated EBITDA (as defined in our indentures) to our adjusted consolidated interest expense over the trailing four fiscal quarters will be at least 2.0 to 1.0. The second test allows us to incur additional indebtedness, beyond the limitations of the fixed charge coverage ratio test, as long as this additional debt is incurred under Credit Facilities (as defined in our indentures) and, in the case of certain secured indebtedness, the amount thereof is not more than, subject to certain exceptions, the greater of (i) $950 million, (ii) the borrowing base in effect under our Senior Credit Agreement, and (iii) 30% of our adjusted consolidated net tangible assets, or ACNTA, and, in the case of unsecured indebtedness, the amount thereof is not more than the greater of the fixed sum of $750 million or 30% of our ACNTA. ACNTA is defined in all of our indentures and is determined primarily by the value of discounted future net revenues from proved oil and natural gas reserves plus the capitalized cost attributable to our unevaluated properties. At December 31, 2015, we had $62.0 million of indebtedness outstanding, $1.6 million of letters of credit outstanding and $763.8 million of borrowing capacity available under our Senior Credit Agreement.
Our ability to meet our debt covenants and our capacity to incur additional indebtedness will depend on our future performance, which will be affected by financial, business, economic, regulatory and other factors. For example, lower oil and natural gas prices could result in a redetermination of the borrowing base under our Senior Credit Agreement at a lower level and reduce our adjusted consolidated EBITDA, as well as our adjusted consolidated net tangible assets as determined under our indentures (ACNTA), and thus could reduce our ability to incur indebtedness. Our strategic divestitures of non-core producing properties in favor of investing in undeveloped acreage, coupled with our current drilling plans have also impacted our ability to comply with our debt covenants by reducing our production and reserves on a current and, for purposes of covenant calculations, a pro forma historical
55
basis, as drilling takes time to replace these losses. Of course, over the longer term, we expect that our strategy and our investments will result in increased production and reserves, lower lease operating costs and more abundant drilling opportunities. As a consequence, we constantly monitor our liquidity and capital resources, endeavor to anticipate potential covenant compliance issues and work with the lenders under our Senior Credit Agreement to address any such issues ahead of time.
We have in the past obtained amendments to the covenants under our Senior Credit Agreement under circumstances where we anticipated that it might be challenging for us to comply with our financial covenants for a particular period of time. During 2013, we obtained amendments to the calculation of the interest coverage ratio covenant under our Senior Credit Agreement allowing us to annualize our quarterly EBITDA because, among other things, we anticipated that our strategic decision to divest various non-core producing properties and invest in the acquisition and drilling of undeveloped acreage would have caused us to fall below the interest coverage ratio. We requested a reduction in the minimum required interest coverage ratio of 2.0 to 1.0 for 2014 and 2015 and those requests were granted on March 21, 2014 and again on February 25, 2015, respectively. With the Tenth Amendment and the issuance of the 2020 Second Lien Notes, the interest coverage ratio was replaced with a total secured debt to EBITDA ratio and with the Eleventh Amendment; in the calculation of total secured debt to EBITDA ratio the Third Lien Notes are excluded. The basis for the recent amendments and waiver requests is those requested waivers described above, i.e., the potential for us to fall out of compliance primarily as a result of our strategic decision to divest producing properties, invest extensively in undeveloped acreage and the long lead times associated with replacing lost production through our drilling program and, in the case of the Eleventh and Twelfth Amendments, due to our desire to reduce overall debt through the exchanges and repurchases of unsecured notes. Declining commodity prices have also adversely impacted our ability to comply with these covenants. As part of our plan to manage liquidity risks, we have scaled back our capital expenditures budget, focused our drilling program on our highest return projects, and we continue to explore opportunities to divest non-core properties.
If, in the future, the lenders under our Senior Credit Agreement are unwilling to provide us with the covenant flexibility we seek, and we are unable to comply with those covenants, we may be forced to repay or refinance amounts then outstanding under the Senior Credit Agreement and seek alternative sources of capital to fund our business and anticipated capital expenditures. In the event that we are unable to access sufficient capital to fund our business and planned capital expenditures, we may be required to curtail our drilling, development, land acquisition and other activities, which could result in a decrease in our production of oil and natural gas, may be subject to forfeitures of leasehold interests to the extent we are unable or unwilling to renew them, and may be forced to sell some of our assets on an untimely or unfavorable basis, each of which could adversely affect our results of operations and financial condition. Further, the failure to comply with the restrictive covenants relating to our indebtedness could result in the declaration of a default and cross default under the instruments governing our indebtedness, potentially resulting in acceleration of our obligations and adversely impacting our financial condition.
Our future capital resources and liquidity depend, in part, on our success in developing our leasehold interests, growing reserves and production and finding additional reserves. Cash is required to fund capital expenditures necessary to offset inherent declines in our production and proven reserves, which is typical in the capital-intensive oil and natural gas industry. We therefore continuously monitor our liquidity and the capital markets and evaluate our development plans in light of a variety of factors, including, but not limited to, our cash flows, capital resources, acquisition opportunities and drilling successes.
We strive to maintain financial flexibility while pursuing our drilling plans and evaluating potential acquisitions, and will therefore likely continue to access capital markets (if on acceptable terms) as necessary to, among other things, maintain substantial borrowing capacity under our Senior Credit
56
Agreement, facilitate drilling on our large undeveloped acreage position and permit us to selectively expand our acreage position and infrastructure projects while sustaining sufficient operating cash levels. Our ability to complete future debt and equity offerings and maintain or increase our borrowing base is subject to a number of variables, including our level of oil and natural gas production, reserves and commodity prices, as well as various economic and market conditions that have historically affected the oil and natural gas industry. Even if we are otherwise successful in growing our reserves and production, if oil and natural gas prices decline for a sustained period of time, our ability to fund our capital expenditures, complete acquisitions, reduce debt, meet our financial obligations and become profitable may be materially impacted.
We are exposed to various risks including energy commodity price risk. When oil, natural gas, and natural gas liquids prices decline significantly, as they have since mid-year 2014, our ability to finance our capital budget and operations may be adversely impacted. While we use derivative instruments to provide partial protection against declines in oil and natural gas prices, the total volumes we hedge varies from period to period based on our view of current and future market conditions. Currently, we have approximately 81% of anticipated 2016 oil production hedged at a weighted average price of $80.59 per Bbl. However, beyond 2016, we have currently hedged only a limited amount of our anticipated production. Sustained low commodity prices, after our current hedges expire, may adversely impact our liquidity and cash flows from operations. Our hedge policies and objectives may change significantly as our operational profile changes and/or commodities prices change. We do not enter into derivative contracts for speculative trading purposes.
Cash Flow
Our primary sources of cash in 2015 and 2014 were from operating and financing activities. In 2013, our primary source of cash was from financing activities. Operating cash flow fluctuations were substantially driven by changes in commodity prices and changes in our production volumes. Working capital was substantially influenced by these variables. Fluctuation in commodity prices and our overall cash flow may result in an increase or decrease in our future capital expenditures. Prices for oil and natural gas have historically been subject to seasonal fluctuations characterized by peak demand and higher prices in the winter heating season; however, the impact of other risks and uncertainties have influenced prices throughout recent years. See Results of Operations below for a review of the impact of prices and volumes on sales.
| |
Years Ended December 31, | |||||||||
|---|---|---|---|---|---|---|---|---|---|---|
| |
2015 | 2014 | 2013 | |||||||
| |
(In thousands) |
|||||||||
Cash flows provided by (used in) operating activities |
$ | 466,999 | $ | 667,934 | $ | 493,924 | ||||
Cash flows provided by (used in) investing activities |
(667,132 | ) | (1,271,093 | ) | (2,100,699 | ) | ||||
Cash flows provided by (used in) financing activities |
164,446 | 644,038 | 1,607,103 | |||||||
| | | | | | | | | | | |
Net increase (decrease) in cash |
$ | (35,687 | ) | $ | 40,879 | $ | 328 | |||
| | | | | | | | | | | |
| | | | | | | | | | | |
| | | | | | | | | | | |
Operating Activities. Net cash flows provided by operating activities were $467.0 million, $667.9 million and $493.9 million for the years ended December 31, 2015, 2014 and 2013, respectively. Key drivers of net operating cash flows are commodity prices, production volumes, operating costs, and in 2015 realized settlements on our derivative contracts.
For the year ended December 31, 2015, the $467.0 million of net cash provided by operating activities primarily reflects the impact of realized settlements on our derivative contracts of $418.4 million, which largely mitigated the decrease in revenues due to lower commodity prices, as compared to the prior year period. Cash operating expenses also decreased over the prior year period.
57
For the year ended December 31, 2014, net cash provided by operating activities increased $174.0 million over the prior year. The improvement in operating cash flows primarily reflects the impact of the 26% increase in our average daily production compared to the 2013 period, which drove the increase in operating revenues. Production for 2014 averaged 42,107 Boe/d compared to 33,329 Boe/d in 2013.
Net loss for the year ended December 31, 2013 was $1.2 billion. Non-cash items, including a $1.1 billion full cost ceiling impairment, $228.9 million goodwill impairment, $67.5 million other operating property and equipment impairment and $463.7 million depreciation, depletion and accretion served to more than offset this net loss. The improvement in operating cash flows primarily reflects the impact of the 254% increase in our average daily production compared to the 2012 period, which drove the significant increase in operating revenues.
Investing Activities. The primary driver of cash used in investing activities is capital spending on our oil and natural gas properties. Net cash used in investing activities was $667.1 million, $1.3 billion and $2.1 billion for the years ended December 31, 2015, 2014 and 2013, respectively.
In 2015, we used $659.4 million of cash on oil and natural gas capital expenditures, of which $508.4 million related to drilling and completion costs and the remainder was primarily associated with capitalized interest, leasing and seismic data. We participated in the drilling of 184 gross (49.0 net) wells, all of which were completed and capable of production. We significantly decreased our capital spending for 2015, as compared to capital expenditure levels in prior years, in response to the significant decrease in crude oil prices over the latter of 2014 and throughout 2015, and our expectation that prices may not recover in the near term. Cash paid for drilling and completion costs during the year were attributable to both costs incurred before we slowed our drilling and completion program and costs related to wells spud or drilled during the period.
In 2014, we used $1.5 billion of cash on oil and natural gas capital expenditures, of which $1.2 billion related to drilling and completion costs and the remainder was primarily associated with leasing, acquisitions and seismic data. We participated in the drilling of 320 gross (98.3 net) wells, all of which were completed and capable of production. These expenditures were offset by $484.2 million in proceeds received from the divestitures of various non-core assets, including the East Texas Assets. As part of HK TMS's transaction with Apollo, discussed in further detail below, as well as in Item 8. Consolidated Financial Statements and Supplementary Data—Note 10, "Mezzanine Equity," we received proceeds of approximately $33.8 million from the conveyance of an overriding royalty interest to Apollo.
On December 20, 2013, we entered into a carry and earning agreement, as amended, (the Agreement) with an independent third party (the Seller) associated with the acquisition of certain properties in the Tuscaloosa Marine Shale (TMS), located primarily in Wilkinson County, Mississippi and in West Feliciana and East Feliciana Parishes, Louisiana. The Agreement required us to fund up to $189.4 million (the Carry Amount) in exchange for approximately 117,870 net acres. We paid $62.5 million of the Carry Amount at closing on February 28, 2014 and the remaining $126.9 million during the three months ended June 30, 2014, reflected as "Advance on carried interest" in the accompanying consolidated statements of cash flows. As of December 31, 2015, the Carry Amount was fully expended. The Carry Amount was used by the Seller to drill wells in the TMS (the Carry Wells) on the Seller's retained acreage. As part of the transaction, we also received a 5% working interest in the Carry Wells.
In 2013, we used $2.4 billion of cash on oil and natural gas capital expenditures, of which $1.5 billion related to drilling and completion costs and the remainder was primarily associated with leasing, acquisitions and seismic data. These expenditures were offset by $448.3 million in proceeds received from the sale of our Eagle Ford properties and other non-core asset divestitures. We participated in the drilling of 284 gross (107.4 net) wells of which 281 gross (104.4 net) wells were
58
completed and capable of production and 3 gross (3.0 net) wells were dry holes. We spent an additional $139.3 million on other operating property and equipment capital expenditures primarily related to gathering and transportation systems.
Financing Activities. Net cash flows provided by financing activities were $164.4 million, $644.0 million and $1.6 billion for the years ended December 31, 2015, 2014 and 2013, respectively.
During the fourth quarter of 2015, we repurchased approximately $6.2 million principal amount of our 9.75% senior notes due 2020, $28.0 million principal amount of our 8.875% senior notes due 2021, and $10.3 million principal amount of our 9.25% senior notes due 2022. The net cash used to make these repurchases was approximately $14.8 million and we recognized a $29.4 million net gain on the extinguishment of debt, as a $29.7 million gain on the repurchase was partially offset by the writedown of $0.3 million associated with related issuance costs and discounts and premiums for the respective unsecured notes. Upon settlement of the repurchases, we paid all accrued and unpaid interest since the respective interest payment dates of the notes repurchased.
On May 1, 2015, we completed the issuance of $700.0 million aggregate principal amount of our 2020 Second Lien Notes. The net proceeds from the offering were approximately $686.2 million after deducting commissions and offering expenses and were used to repay a majority of the then outstanding borrowings under our Senior Credit Agreement.
Cash flows provided by financing activities include net borrowings under our Senior Credit Agreement of $62.0 million for the year ended December 31, 2015, primarily used to fund drilling and completion activities and other general corporate purposes.
During the year ended December 31, 2015, cash flows from financing activities were modestly impacted by sales of our common stock under the Equity Distribution Agreement. For the year ended December 31, 2015, we sold approximately 1.9 million shares for net proceeds of approximately $15.0 million, after deducting offering expenses.
On June 16, 2014, our subsidiary, HK TMS, entered into a transaction with Apollo by initially selling 150,000 preferred shares in HK TMS, which holds all of our acreage in the TMS, located in Mississippi and Louisiana. Apollo contributed $150 million to HK TMS, and we contributed all our assets related to the TMS as well as $50 million in cash. The proceeds from Apollo were allocated as follows: $110.1 million of proceeds associated with the issuance of HK TMS preferred stock and approximately $4.5 million associated with Apollo's rights to additional preferred shares within cash flows from financing activities and the aforementioned $33.8 million investing cash flows related to the overriding royalty conveyance. The proceeds are being used to develop the TMS.
On December 19, 2013, we issued an additional $400.0 million aggregate principal amount of our 9.75% senior notes due 2020 at a price to the initial purchasers of 102.750% of par. The net proceeds from the sale of the additional 2020 Notes of approximately $406.3 million, after deducting offering fees and expenses, were used to repay a portion of the then outstanding borrowings under our Senior Credit Agreement.
On August 13, 2013, we completed the issuance of $400.0 million aggregate principal amount of our 2022 Notes. The net proceeds to us from the offering were approximately $392.1 million after deducting commissions and offering expenses and were used to repay a portion of the then outstanding borrowings under our Senior Credit Agreement.
On August 13, 2013, we also issued of 8.7 million shares of common stock in an underwritten public offering. The net proceeds from the offering of our common stock were approximately $215.2 million, after deducting the underwriting discount and estimated offering expenses. We used the net proceeds from the offering to repay a portion of the then outstanding borrowings on our Senior Credit Agreement.
59
On June 18, 2013, we issued 345,000 shares of our Series A Preferred Stock in a public offering at a price of $1,000 per share. The net proceeds to us from the offering of the Series A Preferred Stock were approximately $335.2 million, after deducting the underwriting discount and offering expenses. We used the net proceeds from the offering to repay a portion of the then outstanding borrowings under our Senior Credit Agreement.
On January 14, 2013, we issued an additional $600.0 million aggregate principal amount of our 2021 Notes at a price to the initial purchasers of 105% of par. The net proceeds from the sale of the additional 2021 Notes were approximately $619.5 million, after deducting offering fees and expenses. We used the net proceeds from the offering to repay all of the then outstanding borrowings under our Senior Credit Agreement and for general corporate purposes, including funding a portion of our 2013 capital expenditures program.
Contractual Obligations
We have a significant degree of flexibility to adjust the level of our future capital expenditures as circumstances warrant. Our level of capital expenditures will vary in future periods depending on the success we experience in our acquisition, developmental and exploration activities, oil and natural gas price conditions, our access to capital and liquidity and other related economic factors. We currently have no material off-balance sheet arrangements or transactions with unconsolidated, limited-purpose entities. The following table summarizes our contractual obligations and commitments by payment periods as of December 31, 2015.
| |
Payments Due by Period | |||||||||||||||
|---|---|---|---|---|---|---|---|---|---|---|---|---|---|---|---|---|
Contractual Obligations
|
Total | 2016 | 2017 - 2018 | 2019 - 2020 | 2021 and Beyond |
|||||||||||
| |
(In thousands) |
|||||||||||||||
Senior revolving credit facility |
$ | 62,000 | $ | — | $ | — | $ | 62,000 | $ | — | ||||||
8.625% senior secured second lien notes due 2020(1) |
700,000 | — | — | 700,000 | — | |||||||||||
12.0% senior secured second lien notes due 2022(2) |
112,826 | — | — | — | 112,826 | |||||||||||
13.0% senior secured third lien notes due 2022(3) |
1,017,970 | — | — | — | 1,017,970 | |||||||||||
9.25% senior notes due 2022(4) |
52,694 | — | — | — | 52,694 | |||||||||||
8.875% senior notes due 2021(5) |
348,944 | — | — | — | 348,944 | |||||||||||
9.75% senior notes due 2020(6) |
340,035 | — | — | 340,035 | — | |||||||||||
8.0% convertible note due 2020(7) |
289,669 | — | — | 289,669 | — | |||||||||||
Interest expense on long-term debt(8) |
1,600,101 | 303,609 | 607,218 | 508,573 | 180,701 | |||||||||||
Operating leases |
51,034 | 8,875 | 18,344 | 15,858 | 7,957 | |||||||||||
Drilling rig commitments |
31,322 | 17,742 | 13,580 | — | — | |||||||||||
Rig stacking commitments |
21,982 | 11,341 | 10,641 | — | — | |||||||||||
| | | | | | | | | | | | | | | | | |
Total contractual obligations |
$ | 4,628,577 | $ | 341,567 | $ | 649,783 | $ | 1,916,135 | $ | 1,721,092 | ||||||
| | | | | | | | | | | | | | | | | |
| | | | | | | | | | | | | | | | | |
| | | | | | | | | | | | | | | | | |
- (1)
- Excludes $12.2 million unamortized debt issuance costs.
- (2)
- Excludes $1.2 million unamortized debt issuance costs.
- (3)
- Excludes $8.4 million unamortized debt issuance costs.
- (4)
- Excludes $0.8 million unamortized debt issuance costs.
60
- (5)
- Excludes $5.8 million unamortized debt issuance costs, $1.0 million unamortized discount recorded in conjunction with the issuance of the
original 2021 Notes and a $5.5 million unamortized premium recorded in conjunction with the issuance of the additional 2021 Notes.
- (6)
- Excludes $4.3 million unamortized debt issuance costs, $1.9 million unamortized discount recorded in conjunction with the issuance of the
original 2020 notes and a $2.6 million unamortized premium recorded in conjunction with the issuance of the additional 2020 Notes.
- (7)
- Excludes $23.0 million unamortized discount recorded in conjunction with the HALRES Note Amendment.
- (8)
- Future interest expense was calculated based on interest rates and amounts outstanding at December 31, 2015 less required annual repayments.
Subsequent to December 31, 2015, we entered into an amendment to one of our drilling rig contracts with an original term ending date of August 31, 2016, whereby we will early terminate the rig contract, incur a termination fee of approximately $1.3 million and reduce our 2016 drilling commitments by extending part of the contract term on another of our drilling rig contracts out further in 2018. This amendment is not reflected in the table above and the termination fee will be expenses when incurred.
In January 2015, we made the decision to early terminate a drilling rig contract in response to the decline in crude oil prices, and as such, incurred an early termination fee of $6.0 million, paid over the first half of 2015. If certain requirements are not met by two separate trigger dates, the first being January 1, 2017 and the second being January 12, 2020, we may incur up to an additional $3.0 million in connection with this drilling rig contract. Early termination of our active drilling rig commitments would result in termination penalties of approximately $21.9 million, which would be in lieu of the remaining $31.3 million of drilling rig commitments as of December 31, 2015. These obligations are not included in the table above and will be reflected as expense when incurred.
We also have various long-term gathering, transportation and sales contracts in the Bakken / Three Forks formations in North Dakota that are not included in the table above. As of December 31, 2015, we had in place ten long-term crude oil contracts and six long-term natural gas contracts in this area, with sales prices based on posted market rates. Under the terms of these contracts we have committed a substantial portion of our Bakken / Three Forks production for periods ranging from one to ten years from the date of first production. We believe that there are sufficient available reserves and production in the Bakken / Three Forks formations to meet our commitments, as the proved reserves from this area represent approximately 83% of our total proved reserves. Historically, we have been able to meet our delivery commitments.
On December 20, 2013, we entered into a carry and earning agreement, as amended, with an independent third party associated with the acquisition of certain properties in the TMS, located primarily in Wilkinson County, Mississippi and in West Feliciana and East Feliciana Parishes, Louisiana. The Agreement required us to fund up to $189.4 million in exchange for approximately 117,870 net acres. We paid $62.5 million of the Carry Amount at closing on February 28, 2014 and the remaining $126.9 million during the three months ended June 30, 2014. As of December 31, 2015, the Carry Amount was fully expended. The Carry Amount was used by the Seller to drill wells in the TMS on the Seller's retained acreage. As part of the transaction, we also received a 5% working interest in the Carry Wells.
On June 16, 2014, HK TMS entered into a transaction to develop our TMS assets with funds and accounts managed by affiliates of Apollo Global Management, LLC. and on June 1, 2015 amended this agreement. See Item 8. Consolidated Financial Statements and Supplementary Data—Note 10, "Mezzanine Equity," for a discussion of the drilling obligation associated with the amended transaction.
61
The contractual obligations table does not include obligations to taxing authorities due to the uncertainty surrounding the ultimate settlement of amounts and timing of these obligations. In addition, amounts related to our asset retirement obligations are not included in the table above given the uncertainty regarding the actual timing of such expenditures. The total estimated amount of our asset retirement obligations at December 31, 2015 was $47.0 million.
Senior Revolving Credit Facility
On February 8, 2012, we entered into a senior secured revolving credit agreement (the Senior Credit Agreement) with JPMorgan Chase Bank, N.A., as administrative agent, and the other lenders party thereto on. The Senior Credit Agreement provides for a $1.5 billion facility with a current borrowing base of approximately $827.4 million. Amounts borrowed under the Senior Credit Agreement will mature on August 1, 2019. The borrowing base will be redetermined semi-annually, with the lenders and us each having the right to one interim unscheduled redetermination between any two consecutive semi-annual redeterminations. The borrowing base takes into account the estimated value of our oil and natural gas proved reserves, total indebtedness, and other relevant factors consistent with customary oil and natural gas lending criteria. The borrowing base is subject to a reduction equal to the product of 0.25 multiplied by the stated principal amount (without regard to any initial issue discount) of any future notes or other long-term debt securities that we may issue. Funds advanced under the Senior Credit Agreement may be paid down and re-borrowed during the term of the facility. Amounts outstanding under the Senior Credit Agreement bear interest at specified margins over the base rate of 0.75% to 1.75% for ABR-based loans or at specified margins over LIBOR of 1.75% to 2.75% for Eurodollar-based loans. These margins fluctuate based on our utilization of the facility. At December 31, 2015, the weighted average interest rate on our variable rate debt was 3.8% per year. Advances under the Senior Credit Agreement are secured by liens on substantially all of our restricted subsidiaries' properties and assets. The Senior Credit Agreement contains customary representations, warranties and covenants including, among others, restrictions on the payment of dividends on our capital stock and financial covenants, including minimum working capital levels (the ratio of current assets plus the unused commitment under the Senior Credit Agreement to current liabilities) of not less than 1.0 to 1.0 and a ratio of total secured debt (excluding the Third Lien Notes pursuant to the Eleventh Amendment, as defined and discussed below) to EBITDA (as defined in the Senior Credit Agreement) of no greater than 2.75 to 1.0.
At December 31, 2015, we had $62.0 million of indebtedness outstanding, $1.6 million of letters of credit outstanding and $763.8 million of borrowing capacity available under our Senior Credit Agreement.
Amendments to the Senior Credit Agreement
On October 29, 2015, we entered into the Twelfth Amendment which, among other things, provided us additional flexibility with respect to exchanges and repurchases of senior unsecured notes; reaffirmed the borrowing base; and scheduled our next borrowing base redetermination for March 2016. We expect the borrowing base to be confirmed between $650.0 million to $700.0 million in this redetermination.
On September 10, 2015, in conjunction with the issuance of the Third Lien Notes, we entered into the Eleventh Amendment which, among other things, permitted us to incur the debt under the Third Lien Notes and to grant the liens in connection therewith; excluded the Third Lien Notes from the calculation of the total secured debt to EBITDA ratio; and reduced the borrowing base to $850.0 million.
On May 1, 2015, we entered into the Tenth Amendment which, among other things, replaced the interest coverage test with a covenant that requires the ratio of total secured debt to EBITDA of no
62
greater than 2.75 to 1.0, reduced the borrowing base and extended the maturity date of the Senior Credit Agreement to August 1, 2019. Prior to the Tenth Amendment, under the Ninth Amendment executed on February 25, 2015, the Senior Credit Agreement had a required minimum coverage of interest expenses of not less than 2.0 to 1.0 through March 31, 2016 and not less than 2.5 to 1.0 for subsequent periods.
8.625% Senior Secured Second Lien Notes
On May 1, 2015, we issued $700 million aggregate principal amount of our 8.625% second lien senior secured notes due 2020 in a private offering. The 2020 Second Lien Notes were issued at par. The net proceeds from the sale of the 2020 Second Lien Notes were approximately $686.2 million (after deducting offering fees and expenses). We used the net proceeds from the offering to repay the majority of the then outstanding borrowings under our Senior Credit Agreement.
The 2020 Second Lien Notes bear interest at a rate of 8.625% per annum, payable semi-annually on February 1 and August 1 of each year, beginning on August 1, 2015. The 2020 Second Lien Notes will mature on February 1, 2020. The 2020 Second Lien Notes are secured by second-priority liens on substantially all of our and our subsidiary guarantors' assets to the extent such assets secure the Senior Credit Agreement (the Collateral). Pursuant to the terms of the Intercreditor Agreement, dated May 1, 2015 (the Intercreditor Agreement), the security interest in those assets that secure the 2020 Second Lien Notes and the guarantees are contractually subordinated to liens that secure our Senior Credit Agreement and certain other permitted indebtedness. Consequently, the 2020 Second Lien Notes and the guarantees are effectively subordinated to the Senior Credit Agreement and such other indebtedness to the extent of the value of such assets. The Collateral does not include any of the assets of HK TMS, LLC, a wholly owned subsidiary of ours, or any of our future unrestricted subsidiaries.
12.0% Senior Secured Second Lien Notes
On December 21, 2015, we completed the issuance of approximately $112.8 million aggregate principal amount of new 12.0% second lien senior secured notes due 2022 in exchange for approximately $289.6 million principal amount of our senior unsecured notes, consisting of $116.6 million principal amount of our 9.75% senior notes due 2020, $137.7 million principal amount of our 8.875% senior notes due 2021 and $35.3 million principal amount of our 9.25% senior notes due 2022 in a public tender. At closing, we paid all accrued and unpaid interest since the respective interest payment dates of the notes surrendered in the exchange. We recorded the issuance of the 2022 Second Lien Notes at par value and also recognized a $174.5 million net gain on the extinguishment of debt, as a $176.7 million gain on the exchanges was partially offset by the writedown of $2.2 million associated with related issuance costs and discounts and premiums for the respective notes. The net gain is recorded in "Gain (loss) on extinguishment of debt" in the consolidated statements of operations.
Interest on the 2022 Second Lien Notes accrues at a rate of 12.0% per annum, payable semi-annually on February 15 and August 15, commencing on February 15, 2016. The 2022 Second Lien Notes mature on February 15, 2022. Pursuant to the terms of the Intercreditor Agreement, dated December 21, 2015, the security interest in the Collateral securing the 2022 Second Lien Notes and the guarantees are (i) contractually subordinated to liens that secure the Senior Credit Agreement and certain other permitted indebtedness, (ii) contractually equal with the liens that secure the 2020 Second Lien Notes and other future parity obligations and (iii) contractually senior to the liens securing junior lien obligations (including the Third Lien Notes). Consequently, the 2022 Second Lien Notes and the guarantees are effectively subordinated to the Senior Credit Agreement and such other indebtedness, effectively equal to the 2020 Second Lien Notes and effectively senior to the Third Lien Notes, any outstanding senior unsecured notes or other unsecured debt of ours, in each case to the extent of the value of the Collateral. The 2022 Second Lien Notes are fully and unconditionally guaranteed on a senior basis by our subsidiary guarantors' assets and by certain future subsidiaries of ours. As a result
63
of the issuance of the 2022 Second Lien Notes, our borrowing base under our Senior Credit Agreement was reduced from $850.0 million to approximately $827.4 million.
13.0% Senior Secured Third Lien Notes
On September 10, 2015, we issued approximately $1.02 billion aggregate principal amount of our new 13.0% third lien senior secured notes due 2022 in exchange for approximately $1.57 billion principal amount of our senior unsecured notes, consisting of $497.2 million principal amount of our 9.75% senior notes due 2020, $774.7 million principal amount of our 8.875% senior notes due 2021 and $294.4 million principal amount of our 9.25% senior notes due 2022 in privately negotiated transactions with certain holders of our outstanding senior unsecured notes. At closing, we paid all accrued and unpaid interest since the respective interest payment dates of the notes surrendered in the exchange. We recorded the issuance of the Third Lien Notes at par value and also recognized a $535.1 million net gain on the extinguishment of debt, as a $548.2 million gain on the exchanges was partially offset by the writedown of $13.1 million associated with related issuance costs and discounts and premiums for the respective notes. The net gain is recorded in "Gain (loss) on extinguishment of debt" in the consolidated statements of operations.
The Third Lien Notes bear interest at a rate of 13.0% per annum, payable semi-annually on February 15 and August 15, commencing on February 15, 2016. The Third Lien Notes mature on February 15, 2022. The Third Lien Notes are secured by third-priority liens on the same Collateral securing our Senior Credit Agreement and the 2020 Second Lien Notes. Pursuant to the terms of the Intercreditor Agreement, the security interest in those assets that secure the Third Lien Notes and the guarantees are contractually subordinated to liens that secure the Senior Credit Agreement, the 2020 Second Lien Notes and certain other permitted indebtedness. Consequently, the Third Lien Notes and the guarantees are effectively subordinated to the Senior Credit Agreement, the 2020 Second Lien Notes, the 2022 Second Lien Notes and such other indebtedness to the extent of the value of such assets. The Third Lien Notes are fully and unconditionally guaranteed on a senior basis by our subsidiary guarantors' assets and by certain future subsidiaries of ours.
9.25% Senior Notes
On August 13, 2013, we issued at par $400.0 million aggregate principal amount of 9.25% senior notes due 2022 (the 2022 Notes). The net proceeds from the offering of approximately $392.1 million (after deducting commissions and offering expenses) were used to repay a portion of the then outstanding borrowings under our Senior Credit Agreement.
The 2022 Notes bear interest at a rate of 9.25% per annum, payable semi-annually on February 15 and August 15 of each year, beginning on February 15, 2014. The 2022 Notes will mature on February 15, 2022. The 2022 Notes are senior unsecured obligations of ours and are effectively subordinate to our secured debt, and rank equally with all of our current and future senior indebtedness. The 2022 Notes are jointly and severally, fully and unconditionally guaranteed on a senior unsecured basis by our existing 100% owned subsidiaries, except for the subsidiary, HK TMS, LLC. We, the issuer of the 2022 Notes, have no material independent assets or operations apart from the assets and operations of our subsidiaries. See Item 8. Consolidated Financial Statements and Supplementary Data—Note 5, "Long-term Debt," for additional information regarding the 2022 Notes.
During the second quarter of 2015, we entered into several exchange agreements with holders of the 2022 Notes in which they agreed to exchange an aggregate $7.4 million principal amount of their senior notes for approximately 0.9 million shares of our common stock. The exchanges closed on various dates from April 30, 2015 through May 15, 2015, at which time we also paid all accrued and unpaid interest since the prior interest payment date in February 2015.
64
On September 10, 2015, we closed several separate, privately negotiated exchange agreements with holders of the 2022 Notes in which they agreed to exchange an aggregate $294.4 million principal amount of their senior unsecured notes for the Third Lien Notes. At closing, we paid all accrued and unpaid interest since the prior interest payment date in August 2015.
On December 21, 2015, approximately $35.3 million principal amount of 2022 Notes was exchanged for the 2022 Second Lien Notes. At closing, we paid all accrued and unpaid interest since the prior interest payment date in August 2015.
During the fourth quarter of 2015, we repurchased $10.3 million principal amount of the 2022 Notes for cash. At closing, we paid all accrued and unpaid interest since the prior interest payment date in August 2015. As of December 31, 2015, approximately $52.7 million principal amount of the 2022 Notes remained outstanding.
Subsequent to December 31, 2015, we repurchased an additional $15.0 million principal amount of the 2022 Notes for cash at prevailing market prices at the time of the transactions. Upon settlement of the repurchases, we paid all accrued and unpaid interest since the prior interest payment date of the 2022 Notes.
8.875% Senior Notes
On November 6, 2012, we issued $750.0 million aggregate principal amount of 8.875% senior notes due 2021, issued at 99.247% of par (the 2021 Notes). The net proceeds from the offering were approximately $725.6 million after deducting the initial purchasers' discounts, commissions and offering expenses and were used to fund a portion of the cash consideration paid in the Williston Basin Assets acquisition. See Item 8. Consolidated Financial Statements and Supplementary Data—Note 3, "Acquisitions and Divestitures," for additional information regarding the Williston Basin Assets acquisition.
On January 14, 2013, we issued an additional $600.0 million aggregate principal amount of 2021 Notes, issued at 105% of par. The net proceeds from the sale of the additional 2021 Notes were approximately $619.5 million (after the initial purchasers' premiums, commissions and offering expenses). The net proceeds from this offering were used to repay all of the then outstanding borrowings under our Senior Credit Agreement and for general corporate purposes, including funding a portion of our 2013 capital expenditures program.
The 2021 Notes bear interest at a rate of 8.875% per annum, payable semi-annually on May 15 and November 15 of each year, beginning on May 15, 2013. The Notes will mature on May 15, 2021. The 2021 Notes are senior unsecured obligations of ours and are effectively subordinate to our secured debt and rank equally with all of our current and future senior indebtedness. The 2021 Notes are jointly and severally, fully and unconditionally guaranteed on a senior unsecured basis by our existing 100% owned subsidiaries, except for the subsidiary, HK TMS, LLC. We, the issuer of the 2021 Notes, have no material independent assets or operations apart from the assets and operations of our subsidiaries.
In connection with the issuance of the original 2021 Notes, we recorded a discount of approximately $5.7 million to be amortized over the remaining life of the 2021 Notes using the effective interest method. The remaining unamortized discount was $1.0 million at December 31, 2015. In connection with the issuance of the additional 2021 Notes, we recorded a premium of approximately $30.0 million to be amortized over the remaining life of the 2021 Notes using the effective interest method. The remaining unamortized premium was $5.5 million at December 31, 2015. See Item 8. Consolidated Financial Statements and Supplementary Data—Note 5, "Long-term Debt," for additional information regarding the 2021 Notes.
65
During the second quarter of 2015, we entered into several exchange agreements with holders of the 2021 Notes in which they agreed to exchange an aggregate $60.6 million principal amount of their senior notes for approximately 6.9 million shares of our common stock. The exchanges closed on various dates from April 29, 2015 through May 15, 2015, at which time we also paid all accrued and unpaid interest since the prior interest payment date for the 2021 Notes.
On September 10, 2015, we closed several separate, privately negotiated exchange agreements with holders of the 2021 Notes in which they agreed to exchange an aggregate $774.7 million principal amount of their senior unsecured notes for the Third Lien Notes. At closing, we paid all accrued and unpaid interest since the prior interest payment date in May 2015.
On December 21, 2015, approximately $137.7 million principal amount of 2021 Notes was exchanged for the 2022 Second Lien Notes. At closing, we paid all accrued and unpaid interest since the prior interest payment date in November 2015.
During the fourth quarter of 2015, we repurchased $28.0 million principal amount of the 2021 Notes for cash. Upon settlement of the repurchases, we paid all accrued and unpaid interest since the prior interest payment date for the 2021 Notes. As of December 31, 2015, approximately $348.9 million principal amount of the 2021 Notes remained outstanding.
Subsequent to December 31, 2015, we repurchased an additional $51.8 million principal amount of the 2021 Notes for cash at prevailing market prices at the time of the transactions. Upon settlement of the repurchases, we paid all accrued and unpaid interest since the prior interest payment date of the 2021 Notes.
9.75% Senior Notes
On July 16, 2012, we issued $750.0 million aggregate principal amount of 9.75% senior notes due 2020 issued at 98.646% of par (the 2020 Notes). The net proceeds from the offering were approximately $723.1 million after deducting the initial purchasers' discounts, commissions and offering expenses and were used to fund a portion of the cash consideration paid in the merger with GeoResources, Inc. (the Merger) and the East Texas Assets acquisition. See Item 8. Consolidated Financial Statements and Supplementary Data—Note 3, "Acquisitions and Divestitures," for additional information regarding the Merger and the East Texas Assets acquisition.
On December 19, 2013, we issued an additional $400.0 million aggregate principal amount of the 2020 Notes at a price to the initial purchasers of 102.750% of par. The net proceeds from the sale of the additional 2020 Notes of approximately $406.3 million (after the initial purchasers' premiums, commissions and offering expenses) were used to repay a portion of the then outstanding borrowings under the Senior Credit Agreement and for general corporate purposes. These notes were issued as "additional notes" under the indenture governing the 2020 Notes and under the indenture are treated as a single series with substantially identical terms as the 2020 Notes previously issued.
The 2020 Notes bear interest at a rate of 9.75% per annum, payable semi-annually on January 15 and July 15 of each year, beginning on January 15, 2013. The 2020 Notes will mature on July 15, 2020. The 2020 Notes are senior unsecured obligations of ours and are effectively subordinate to our secured debt and rank equally with all of our current and future senior indebtedness. The 2020 Notes are jointly and severally, fully and unconditionally guaranteed on a senior unsecured basis by our existing 100% owned subsidiaries, except for the subsidiary, HK TMS, LLC. We, the issuer of the 2020 Notes, have no material independent assets or operations apart from the assets and operations of our subsidiaries.
In connection with the issuance of the 2020 Notes, we recorded a discount of approximately $10.2 million to be amortized over the remaining life of the 2020 Notes using the effective interest method. The remaining unamortized discount was $1.9 million at December 31, 2015. In connection
66
with the issuance of the additional 2020 Notes, we recorded a premium of approximately $11.0 million to be amortized over the remaining life of the 2020 Notes using the effective interest method. The remaining unamortized premium was $2.6 million at December 31, 2015. See Item 8. Consolidated Financial Statements and Supplementary Data—Note 5, "Long-term Debt," for additional information regarding the 2020 Notes.
During the second quarter of 2015, we entered into several exchange agreements with holders of the 2020 Notes in which they agreed to exchange an aggregate $190.0 million principal amount of their senior notes for approximately 21.2 million shares of our common stock, thereby reducing the aggregate principal amount of the 2020 Notes. The exchanges closed on various dates from April 13, 2015 through May 4, 2015, at which time we also paid all accrued and unpaid interest since the prior interest payment date for the 2020 Notes.
On September 10, 2015, we closed several separate, privately negotiated exchange agreements with holders of the 2020 Notes in which they agreed to exchange an aggregate $497.2 million principal amount of their senior unsecured notes for the Third Lien Notes. At closing, we paid all accrued and unpaid interest since the prior interest payment date in July 2015.
On December 21, 2015, approximately $116.6 million principal amount of 2020 Notes was exchanged for the 2022 Second Lien Notes. At closing, we paid all accrued and unpaid interest since the prior interest payment date in July 2015.
During the fourth quarter of 2015, we repurchased $6.2 million principal amount of the 2020 Notes for cash. Upon settlement of the repurchases, we paid all accrued and unpaid interest since the prior interest payment date in July 2015. As of December 31, 2015, approximately $340.0 million principal amount of the 2020 Notes remained outstanding.
Subsequent to December 31, 2015, we repurchased an additional $24.5 million principal amount of the 2020 Notes for cash at prevailing market prices at the time of the transactions. Upon settlement of the repurchases, we paid all accrued and unpaid interest since the prior interest payment date of the 2020 Notes.
8.0% Convertible Note
On February 8, 2012, we issued to HALRES, LLC (HALRES), a note in the principal amount of $275.0 million due 2017 together with five year warrants for an aggregate purchase price of $275.0 million. The Convertible Note bears interest at a rate of 8% per annum, payable quarterly on March 31, June 30, September 30 and December 31 of each year. Through the March 31, 2014 interest payment date, we were permitted to elect to pay the interest in kind, by adding to the principal of the Convertible Note, all or any portion of the interest due on the Convertible Note. We elected to pay the interest in kind on March 31, June 30 and September 30, 2012, and added $3.2 million, $5.7 million and $5.8 million of interest incurred, respectively, to the Convertible Note, increasing the principal amount to $289.7 million. We did not elect to pay-in-kind interest for the subsequent quarterly payments. The Convertible Note is a senior unsecured obligation of ours.
On March 9, 2015, we entered into the HALRES Note Amendment to the Convertible Note. The HALRES Note Amendment extended the maturity date of the Convertible Note by three years, from February 8, 2017 to February 8, 2020. The Convertible Note originally provided for prepayment without premium or penalty at any time after February 8, 2014, at which time it also became convertible into shares of our common stock at a conversion price of $22.50 per share. These dates have been extended pursuant to the HALRES Note Amendment and the conversion price has been adjusted, such that at any time after March 9, 2017, we may prepay the Convertible Note without premium or penalty, and HALRES may elect to convert all or any portion of unpaid principal and interest outstanding under the Convertible Note to shares of our common stock at a conversion price of $12.20 per share, subject
67
to adjustments for stock splits and other customary anti-dilution provisions as set forth in the Convertible Note. At the same time, we also entered into the Warrant Amendment which extended the term of the February 2012 Warrants from February 8, 2017 to February 8, 2020 and adjusted the exercise price of the February 2012 Warrants from $22.50 to $12.20 per share. The Amendments were approved by our stockholders on May 6, 2015, in accordance with the rules of the NYSE.
We accounted for the HALRES Note Amendment as a debt extinguishment because the change in the fair value of the embedded conversion option immediately before and after the modification was at least 10% of the carrying amount of the original Convertible Note immediately prior to the modification. The $7.3 million difference between the unamortized original issuance discount of $18.6 million and the post-amendment discount of $25.9 million, net of $1.4 million of unamortized initial issuance costs, resulted in a net gain recorded in "Gain (loss) on extinguishment of Convertible Note and modification of February 2012 Warrants" in the consolidated statements of operations. See Item 8. Consolidated Financial Statements and Supplementary Data—Note 11, "Stockholders' Equity" for further discussion of the Warrant Amendment. The remaining unamortized discount was $23.0 million at December 31, 2015.
Off-Balance Sheet Arrangements
At December 31, 2015, we did not have any material off-balance sheet arrangements.
Critical Accounting Policies and Estimates
The discussion and analysis of our financial condition and results of operations are based upon our consolidated financial statements, which have been prepared in accordance with accounting principles generally accepted in the United States. The preparation of our consolidated financial statements requires us to make estimates and assumptions that affect our reported results of operations and the amount of reported assets, liabilities and proved oil and natural gas reserves. Some accounting policies involve judgments and uncertainties to such an extent that there is reasonable likelihood that materially different amounts could have been reported under different conditions, or if different assumptions had been used. Actual results may differ from the estimates and assumptions used in the preparation of our consolidated financial statements. Described below are the most significant policies we apply in preparing our consolidated financial statements, some of which are subject to alternative treatments under accounting principles generally accepted in the United States. We also describe the most significant estimates and assumptions we make in applying these policies. We discussed the development, selection and disclosure of each of these with our audit committee. See Item 8. Consolidated Financial Statements and Supplementary Data—Note 1, "Summary of Significant Events and Accounting Policies," for a discussion of additional accounting policies and estimates made by management.
Oil and Natural Gas Activities
Accounting for oil and natural gas activities is subject to unique rules. Two generally accepted methods of accounting for oil and natural gas activities are available—successful efforts and full cost. The most significant differences between these two methods are the treatment of unsuccessful exploration costs and the manner in which the carrying value of oil and natural gas properties are amortized and evaluated for impairment. The successful efforts method requires unsuccessful exploration costs to be expensed as they are incurred upon a determination that the well is uneconomical while the full cost method provides for the capitalization of these costs. Both methods generally provide for the periodic amortization of capitalized costs based on proved reserve quantities. Impairment of oil and natural gas properties under the successful efforts method is based on an evaluation of the carrying value of individual oil and natural gas properties against their estimated fair value, while impairment under the full cost method requires an evaluation of the carrying value of oil
68
and natural gas properties included in a cost center against the net present value of future cash flows from the related proved reserves, using the unweighted arithmetic average of the first day of the month for each of the 12-month prices for oil and natural gas within the period, holding prices and costs constant and applying a 10% discount rate.
Full Cost Method
We use the full cost method of accounting for our oil and natural gas activities. Under this method, all costs incurred in the acquisition, exploration and development of oil and natural gas properties are capitalized into a cost center (the amortization base or full cost pool). Such amounts include the cost of drilling and equipping productive wells, dry hole costs, lease acquisition costs and delay rentals. All general and administrative costs unrelated to drilling activities are expensed as incurred. The capitalized costs of our evaluated oil and natural gas properties, plus an estimate of our future development and abandonment costs are amortized on a unit-of-production method based on our estimate of total proved reserves. Our financial position and results of operations could have been significantly different had we used the successful efforts method of accounting for our oil and natural gas activities.
Proved Oil and Natural Gas Reserves
Estimates of our proved reserves included in this report are prepared in accordance with accounting principles generally accepted in the United States and Securities Exchange Commission (SEC) guidelines. Our engineering estimates of proved oil and natural gas reserves directly impact financial accounting estimates, including depletion, depreciation and accretion expense and the full cost ceiling test limitation. Proved oil and natural gas reserves are the estimated quantities of oil and natural gas reserves that geological and engineering data demonstrate with reasonable certainty to be recoverable in future years from known reservoirs under defined economic and operating conditions. The process of estimating quantities of proved reserves is very complex, requiring significant subjective decisions in the evaluation of all geological, engineering and economic data for each reservoir. The accuracy of a reserve estimate is a function of: (i) the quality and quantity of available data; (ii) the interpretation of that data; (iii) the accuracy of various mandated economic assumptions; and (iv) the judgment of the persons preparing the estimate. The data for a given reservoir may change substantially over time as a result of numerous factors, including additional development activity, evolving production history and continual reassessment of the viability of production under varying economic conditions. Changes in oil and natural gas prices, operating costs and expected performance from a given reservoir also will result in revisions to the amount of our estimated proved reserves.
Our estimated proved reserves for the years ended December 31, 2015, 2014 and 2013 were prepared by Netherland, Sewell, an independent oil and natural gas reservoir engineering consulting firm. For more information regarding reserve estimation, including historical reserve revisions, refer to Item 8. Consolidated Financial Statements and Supplementary Data—"Supplemental Oil and Gas Information (Unaudited)."
Depreciation, Depletion and Accretion
Our rate of recording depletion, depreciation and accretion expense (DD&A) is primarily dependent upon our estimate of proved reserves, which is utilized in our unit-of-production method calculation. If the estimates of proved reserves were to be reduced, the rate at which we record DD&A expense would increase, reducing net income. Such a reduction in reserves may result from calculated lower market prices, which may make it non-economic to drill for and produce higher cost reserves. At December 31, 2015, a five percent positive revision to proved reserves would decrease the DD&A rate by approximately $0.79 per Boe and a five percent negative revision to proved reserves would increase the DD&A rate by approximately $0.87 per Boe.
69
Full Cost Ceiling Test Limitation
Under the full cost method, we are subject to quarterly calculations of a ceiling or limitation on the amount of our oil and natural gas properties that can be capitalized on our balance sheet. If the net capitalized costs of our oil and natural gas properties exceed the cost center ceiling, we are subject to a ceiling test write down to the extent of such excess. If required, it would reduce earnings and impact stockholders' equity in the period of occurrence and result in lower amortization expense in future periods. The discounted present value of our proved reserves is a major component of the ceiling calculation and represents the component that requires the most subjective judgments. However, the associated prices of oil and natural gas reserves that are included in the discounted present value of the reserves do not require judgment. The ceiling calculation dictates that we use the unweighted arithmetic average price of oil and natural gas as of the first day of each month for the 12-month period ending at the balance sheet date. If average oil and natural gas prices decline, or if we have downward revisions to our estimated proved reserves, it is possible that write downs of our oil and natural gas properties could occur in the future.
If the unweighted arithmetic average price of oil and natural gas as of the first day of each month for the 12-month period ended December 31, 2015 had been 10% lower while all other factors remained constant, our ceiling amount related to our net book value of oil and natural gas properties would have been reduced by approximately $287.3 million. This reduction would have increased our full cost ceiling impairment by approximately $287.3 million before income taxes.
Future Development Costs
Future development costs include costs incurred to obtain access to proved reserves such as drilling costs and the installation of production equipment. Future abandonment costs include costs to dismantle and relocate or dispose of our production facilities, gathering systems and related structures and restoration costs. We develop estimates of these costs for each of our properties based upon their geographic location, type of production structure, well depth, currently available procedures and ongoing consultations with construction and engineering consultants. Because these costs typically extend many years into the future, estimating these future costs is difficult and requires management to make judgments that are subject to future revisions based upon numerous factors, including changing technology and the political and regulatory environment. We review our assumptions and estimates of future development and future abandonment costs on an annual basis. A five percent decrease or increase in future development and abandonment costs would decrease or increase the DD&A rate by approximately $0.26 per Boe at December 31, 2015.
Accounting for Derivative Instruments and Hedging Activities
We account for our derivative activities under the provisions of Accounting Standards Codification (ASC) No. 815, Derivatives and Hedging (ASC 815). ASC 815 establishes accounting and reporting that every derivative instrument be recorded on the balance sheet as either an asset or liability measured at fair value. From time to time, when derivative contracts are available at terms (or prices) acceptable to us, we may hedge a portion of our forecasted oil, natural gas, and natural gas liquids production. Derivative contracts entered into by us have consisted of transactions in which we hedge the variability of cash flow related to a forecasted transaction. We elected to not designate any of our positions for hedge accounting. Accordingly, we record the net change in the mark-to-market valuation of these positions, as well as payments and receipts on settled contracts, in "Net gain (loss) on derivative contracts" on the consolidated statements of operations.
70
Goodwill
We account for goodwill in accordance with ASC 350, Intangibles—Goodwill and Other (ASC 350). Goodwill represents the excess of the purchase price over the estimated fair value of the assets acquired net of the fair value of liabilities assumed in an acquisition. ASC 350 requires that intangible assets with indefinite lives, including goodwill, be evaluated on an annual basis for impairment or more frequently if an event occurs or circumstances change that could potentially result in impairment. The goodwill impairment test requires the allocation of goodwill and all other assets and liabilities to reporting units. Our goodwill related to the merger with GeoResources in 2012.
Accounting Standards Update (ASU) No. 2011-08, Testing for Goodwill Impairment (ASU 2011-08), simplifies testing for goodwill impairments by allowing entities to first assess qualitative factors to determine whether the facts or circumstances lead to the conclusion that it is more likely than not that the fair value of a reporting unit is less than the carrying value. If the entity concludes that it is not more likely than not that the fair value of a reporting unit is less than its carrying value, then the entity does not have to perform the two-step impairment test. However, if the same conclusion is not reached, the entity is required to perform the first step of the two-step impairment test. In this step, the fair value of the reporting unit is calculated and compared to the carrying value of the reporting unit. If the carrying value exceeds the fair value, then the entity must perform the second step of the impairment test to measure the amount of impairment loss, if any. ASU 2011-08 also allows a company to bypass the qualitative assessment and proceed directly with performing the two-step goodwill impairment test.
Income Taxes
Our provision for taxes includes both state and federal taxes. We account for income taxes using the asset and liability method wherein deferred tax assets and liabilities are recognized for the future tax consequences attributable to differences between financial statement carrying amounts of existing assets and liabilities and their respective tax bases. Deferred tax assets and liabilities are measured using enacted tax rates expected to apply to taxable income in the years in which temporary differences are expected to be recovered or settled. Deferred tax assets are reduced by a valuation allowance if it is more likely than not that some portion or all of the deferred tax assets will not be realized.
In assessing the need for a valuation allowance on our deferred tax assets, we consider possible sources of taxable income that may be available to realize the benefit of deferred tax assets, including projected future taxable income, the reversal of existing temporary differences, taxable income in carryback years and available tax planning strategies. We consider all available evidence (both positive and negative) in determining whether a valuation allowance is required. A significant item of objective negative evidence considered was the cumulative book loss over the three-year period ended December 31, 2015 driven primarily by the full cost ceiling impairments over that period. Based upon the evaluation of the available evidence we recorded an increase of $598.4 million to our valuation allowance resulting in a valuation allowance of $761.5 million being applied against our deferred tax assets as of December 31, 2015.
We follow ASC 740, Income Taxes (ASC 740). ASC 740 creates a single model to address accounting for the uncertainty in income tax positions and prescribes a minimum recognition threshold a tax position must meet before recognition in the financial statements. We apply significant judgment in evaluating our tax positions and estimating our provision for income taxes. During the ordinary course of business, there are many transactions and calculations for which the ultimate tax determination is uncertain. The actual outcome of these future tax consequences could differ significantly from these estimates, which could impact our financial position, results of operations and cash flows. The evaluation of a tax position in accordance with ASC 740 is a two-step process. The first step is a recognition process to determine whether it is more likely than not that a tax position will be
71
sustained upon examination, including resolution of any related appeals or litigation processes, based on the technical merits of the position. In evaluating whether a tax position has met the more likely than not recognition threshold, it is presumed that the position will be examined by the appropriate taxing authority with full knowledge of all relevant information. The second step is a measurement process whereby a tax position that meets the more likely than not recognition threshold is calculated to determine the amount of benefit/expense to recognize in the financial statements. The tax position is measured at the largest amount of benefit/expense that is more likely than not of being realized upon ultimate settlement.
In November 2015, the Financial Accounting Standards Board (FASB) issued Accounting Standards Update (ASU) No. 2015-17, Balance Sheet Classification of Deferred Taxes (ASU 2015-17) to simplify the presentation of deferred income taxes. Under ASU 2015-17, all deferred tax assets and liabilities, along with any related valuation allowance, are required to be classified as noncurrent on the balance sheet. Effective December 31, 2015, we early adopted ASU 2015-17, on a prospective basis, which resulted in the reclassification of our current deferred tax assets and liabilities as a non-current deferred tax assets and liabilities, net of the valuation allowance, on our consolidated balance sheets. No prior periods were retrospectively adjusted.
72
Comparison of Results of Operations
Year Ended December 31, 2015 Compared to Year Ended December 31, 2014
We reported a net loss of $1.9 billion for the year ended December 31, 2015 compared to net income of $316.0 million for the comparable period in 2014. The following table summarizes key items of comparison and their related change for the periods indicated.
| |
Years Ended December 31, |
|
||||||||
|---|---|---|---|---|---|---|---|---|---|---|
In thousands (except per unit and per Boe amounts)
|
2015 | 2014 | Change | |||||||
Net income (loss) |
$ | (1,922,621 | ) | $ | 315,956 | $ | (2,238,577 | ) | ||
Operating revenues: |
||||||||||
Oil |
512,346 | 1,071,319 | (558,973 | ) | ||||||
Natural gas |
22,509 | 37,101 | (14,592 | ) | ||||||
Natural gas liquids |
13,624 | 37,460 | (23,836 | ) | ||||||
Other |
1,799 | 2,381 | (582 | ) | ||||||
Operating expenses: |
||||||||||
Production: |
||||||||||
Lease operating |
103,590 | 130,239 | (26,649 | ) | ||||||
Workover and other |
20,862 | 16,193 | 4,669 | |||||||
Taxes other than income |
48,890 | 106,331 | (57,441 | ) | ||||||
Gathering and other |
40,281 | 26,719 | 13,562 | |||||||
Restructuring |
2,886 | 987 | 1,899 | |||||||
General and administrative: |
||||||||||
General and administrative |
73,237 | 97,799 | (24,562 | ) | ||||||
Share-based compensation |
14,529 | 18,733 | (4,204 | ) | ||||||
Depletion, depreciation and accretion: |
||||||||||
Depletion—Full cost |
354,344 | 523,855 | (169,511 | ) | ||||||
Depreciation—Other |
8,063 | 8,744 | (681 | ) | ||||||
Accretion expense |
1,797 | 1,822 | (25 | ) | ||||||
Full cost ceiling impairment |
2,626,305 | 239,668 | 2,386,637 | |||||||
Other operating property and equipment impairment |
— | 35,558 | (35,558 | ) | ||||||
Other income (expenses): |
||||||||||
Net gain (loss) on derivative contracts |
310,264 | 518,956 | (208,692 | ) | ||||||
Interest expense and other, net |
(232,878 | ) | (145,689 | ) | (87,189 | ) | ||||
Gain (loss) on extinguishment of debt |
761,804 | — | 761,804 | |||||||
Gain (loss) on extinguishment of Convertible Note and modification of February 2012 Warrants |
(8,219 | ) | — | (8,219 | ) | |||||
Income tax benefit (provision) |
(9,086 | ) | 1,076 | (10,162 | ) | |||||
Production: |
||||||||||
Crude oil—MBbls |
12,019 | 12,787 | (768 | ) | ||||||
Natural gas—MMcf |
10,123 | 8,812 | 1,311 | |||||||
Natural gas liquids—MBbls |
1,457 | 1,113 | 344 | |||||||
Total MBoe(1) |
15,163 | 15,369 | (206 | ) | ||||||
Average daily production—Boe(1) |
41,542 | 42,107 | (565 | ) | ||||||
Average price per unit(2): |
||||||||||
Crude oil price—Bbl |
$ | 42.63 | $ | 83.78 | $ | (41.15 | ) | |||
Natural gas price—Mcf |
2.22 | 4.21 | (1.99 | ) | ||||||
Natural gas liquids price—Bbl |
9.35 | 33.66 | (24.31 | ) | ||||||
Total per Boe(1) |
36.17 | 74.56 | (38.39 | ) | ||||||
Average cost per Boe: |
||||||||||
Production: |
||||||||||
Lease operating |
$ | 6.83 | $ | 8.47 | $ | (1.64 | ) | |||
Workover and other |
1.38 | 1.05 | 0.33 | |||||||
Taxes other than income |
3.22 | 6.92 | (3.70 | ) | ||||||
Gathering and other |
2.66 | 1.74 | 0.92 | |||||||
Restructuring |
0.19 | 0.06 | 0.13 | |||||||
General and administrative: |
||||||||||
General and administrative |
4.83 | 6.36 | (1.53 | ) | ||||||
Share-based compensation |
0.96 | 1.22 | (0.26 | ) | ||||||
Depletion |
23.37 | 34.09 | (10.72 | ) | ||||||
- (1)
- Natural gas reserves are converted to oil reserves using a ratio of six Mcf to one Bbl of oil. This ratio does not assume price
equivalency and, given price differentials, the price for a barrel of oil equivalent for natural gas may differ significantly from the price for a barrel of
oil.
- (2)
- Amounts exclude the impact of cash paid/received on settled contracts as we did not elect to apply hedge accounting.
73
For the year ended December 31, 2015, oil, natural gas and natural gas liquids revenues decreased $597.4 million from the same period in 2014 due to lower average realized prices and a slight decrease in our production volumes. Average realized prices (excluding effects of hedging arrangements) decreased from $74.56 per Boe to $36.17 per Boe, representing a 51% decrease from the prior year period. Oil and natural gas prices are inherently volatile and decreased significantly since mid-year 2014. Production slightly decreased year over year, as we have curtailed our drilling in response to the decline in commodity prices. However, production volumes associated with our core properties in the Bakken/Three Forks and El Halcón areas have remained flat or increased slightly year over year, as we have focused our drilling efforts on our most economic areas due to the current price environment. Sustained lower commodity prices will continue to impact our oil, natural gas and natural gas liquids revenues.
Lease operating expenses decreased $26.6 million for the year ended December 31, 2015. On a per unit basis, lease operating expenses were $6.83 per Boe in 2015 compared to $8.47 per Boe in 2014. The decrease per Boe is primarily due to lower relative operating expenses on our core properties due, in part, to operational improvements and efficiencies as well as cost decreases from our vendors in light of the current commodity price environment.
Workover and other expenses increased $4.7 million for the year ended December 31, 2015 as compared to the same period in 2014 primarily due to $8.6 million of expenses associated with increased activity in our core areas as we continue to develop these areas.
Taxes other than income decreased $57.4 million for the year ended December 31, 2015 as compared to the same period in 2014 primarily due to lower oil, natural gas and natural gas liquids revenues attributable to significantly lower commodity prices. Most production taxes are based on realized prices at the wellhead. As revenues or volumes from oil and natural gas sales increase or decrease, production taxes on these sales also increase or decrease. On a per unit basis, taxes other than income were $3.22 per Boe and $6.92 per Boe, for the years ended 2015 and 2014, respectively. The decrease on a per Boe basis in 2015 is driven by a decrease in our realized average prices.
Gathering and other expenses for the year ended December 31, 2015 and 2014 were $40.3 million and $26.7 million, respectively. Approximately, $29.2 million of expenses incurred in 2015 relate to gathering and other fees paid on our oil and natural gas production. Also included is a $6.0 million termination fee paid to early terminate one of our drilling rig contacts and $3.8 million of rig stacking fees. The decision to early terminate one drilling rig contract and stack another drilling rig was in response to the decline in crude oil prices.
For the year ended December 31, 2015, we had reductions in our workforce due to the decrease in our drilling and developmental activities planned for the year. We incurred approximately $2.9 million in severance costs and accelerated stock-based compensation expense related to the termination of certain employees during the year. For the year ended December 31, 2014, in conjunction with our divestitures of certain non-core properties, we incurred approximately $1.0 million in severance costs and accelerated stock-based compensation expense related to the termination of certain employees in these non-core areas.
General and administrative expense for the year ended December 31, 2015 decreased $24.6 million to $73.2 million as compared to the same period in 2014. The decrease was primarily due to decreases in professional fees, payroll and employee related benefit costs, and transaction expenses amounting to $9.9 million, $9.3 million and $1.8 million, respectively. On a per unit basis, general and administrative expenses were $4.83 per Boe and $6.36 per Boe, for the years ended December 31, 2015 and 2014, respectively.
74
Share-based compensation expense for the year ended December 31, 2015 was $14.5 million, a decrease of $4.2 million compared to the same period in 2014. The decrease in share-based compensation expense results from forfeitures and lower fair market value for new awards granted to employees and directors during 2015.
Depletion for oil and natural gas properties is calculated using the unit of production method, which depletes the capitalized costs of evaluated properties plus future development costs based on the ratio of production volume for the current period to total remaining reserve volumes for evaluated properties as of the beginning of the period. Depletion expense decreased $169.5 million to $354.3 million for the year ended December 31, 2015 compared to the same period in 2014, primarily attributable to decreases in the amortizable base due to the full cost ceiling impairments since the prior year period. On a per unit basis, depletion expense was $23.37 per Boe for the year ended December 31, 2015 compared to $34.09 per Boe for the year ended December 31, 2014.
We utilize the full cost method of accounting to account for our oil and natural gas exploration and development activities. Under this method of accounting, we are required on a quarterly basis to determine whether the book value of our oil and natural gas properties (excluding unevaluated properties) is less than or equal to the "ceiling," established by the expected after tax present value (discounted at 10%) of the future net cash flows from our proved reserves. Any excess of the net book value of our oil and natural gas properties over the ceiling must be recognized as a non-cash impairment expense. We recorded a full cost ceiling test impairment before income taxes of $2.6 billion for the year ended December 31, 2015, compared to a full cost ceiling test impairment before income taxes of $239.7 million for the year ended December 31, 2014. The ceiling test impairments in 2015 were driven by decreases in the first-day-of-the-month average prices for crude oil used in the ceiling test calculations from $94.99 per Bbl at December 31, 2014 to $50.28 per Bbl at December 31, 2015. Changes in commodity prices, production rates, reserve volumes, future development costs, transfers of unevaluated properties, capital spending, and other factors will determine our actual ceiling test calculation and impairment analyses in future periods. See "Overview" for a discussion and quantification of potential future ceiling impairments in an environment of sustained lower commodity prices.
We review our gas gathering systems and equipment and other operating assets for impairment in accordance with ASC 360. For the year ended December 31, 2014, we recorded a non-cash impairment charge for gas gathering systems and other related operating assets of $35.6 million, net of $1.9 million of accumulated depreciation. The majority of the impairment represents approximately half of our gas gathering infrastructure, right-of-way and permitting investments in the Utica/Point Pleasant area. These infrastructure related investments were related to acreage in certain non-core areas of the Utica play which, at the time of evaluation for impairment in December 2014, we did not plan to develop in light of the recent downtrend in oil prices, which rendered certain areas to be deemed uneconomical and/or non-strategic.
We enter into derivative commodity instruments to economically hedge our exposure to price fluctuations on our anticipated oil and natural gas production. Consistent with prior years, we have elected not to designate any positions as cash flow hedges for accounting purposes, and accordingly, we recorded the net change in the mark-to-market value of these derivative contracts in the consolidated statements of operations. At December 31, 2015, we had a $365.5 million derivative asset, $348.9 million of which was classified as current, and we had a $0.3 million derivative liability, none of which was classified as current. We recorded a net derivative gain of $310.3 million ($129.2 million net unrealized loss offset by a $439.5 million net realized gain on settled contracts) for the year ended December 31, 2015 compared to a net derivative gain of $518.9 million ($506.5 million net unrealized gain and $12.4 million net realized gain on settled contracts) in the prior year.
75
Interest expense and other increased $87.2 million for the year ended December 31, 2015 from the same period in 2014. Capitalized interest for the years ended December 31, 2015 and 2014 was $113.0 million and $168.9 million, respectively. The decrease in capitalized interest was driven by decreases in our unevaluated properties since 2014, which is the basis of our capitalized interest calculation. Interest expense subject to capitalization increased $19.9 million, over the prior year period, from $317.7 million in 2014 to $337.6 million in 2015. The increase in interest subject to capitalization is primarily due to the issuance of our 2020 Second Lien Notes since the prior year period.
During the year ended December 31, 2105, we entered into several transactions intended to reduce our long-term debt. The table below denotes the transaction description, the reduction of the principal amount of long-term debt, the writedown of associated issuance costs and discounts and premiums, and the net gain on extinguishment of debt that was recorded for each transaction:
Transaction Description
|
Principal Reduction |
Common Stock Issuance |
Issuance Cost and Discount/ Premium Writedown |
Net (Gain) | |||||||||
|---|---|---|---|---|---|---|---|---|---|---|---|---|---|
| |
(In millions) |
||||||||||||
Unsecured Notes Exchanged for Common Stock |
$ | (258.0 | ) | $ | 231.4 | $ | (3.8 | ) | $ | (22.8 | ) | ||
Unsecured Notes Exchanged for Secured Third Lien Notes |
(548.2 | ) | — | (13.1 | ) | (535.1 | ) | ||||||
Repurchases of Unsecured Notes |
(29.7 | ) | — | (0.3 | ) | (29.4 | ) | ||||||
Unsecured Notes Exchanged for Secured Second Lien Notes |
(176.7 | ) | — | (2.2 | ) | (174.5 | ) | ||||||
| | | | | | | | | | | | | | |
|
$ | (1,012.6 | ) | $ | 231.4 | $ | (19.4 | ) | $ | (761.8 | ) | ||
| | | | | | | | | | | | | | |
| | | | | | | | | | | | | | |
| | | | | | | | | | | | | | |
During the year ended December 31, 2015, we entered into an amendment to our Convertible Note and to the February 2012 Warrants, in which we recorded a net gain on the extinguishment of the Convertible Note of $5.9 million and a net loss on the modification of the February 2012 Warrants of $14.1 million.
We recorded an income tax provision of $9.1 million on a loss before income taxes of $1.9 billion for the year ended December 31, 2015. The provision represents projected alternative minimum tax. For the year ended December 31, 2014, we recorded an income tax benefit of $1.1 million on income before income taxes of $314.9 million. The benefit reflects the impact of the change in the valuation allowance for the year of $102.0 million.
76
Year Ended December 31, 2014 Compared to Year Ended December 31, 2013
We reported net income of $316.0 million for the year ended December 31, 2014 compared to a net loss of $1.2 billion for the comparable period in 2013. The following table summarizes key items of comparison and their related change for the periods indicated.
| |
Years Ended December 31, | |
||||||||
|---|---|---|---|---|---|---|---|---|---|---|
In thousands (except per unit and per Boe amounts)
|
2014 | 2013 | Change | |||||||
Net income (loss) |
$ | 315,956 | $ | (1,222,662 | ) | $ | 1,538,618 | |||
Operating revenues: |
||||||||||
Oil |
1,071,319 | 944,535 | 126,784 | |||||||
Natural gas |
37,101 | 27,319 | 9,782 | |||||||
Natural gas liquids |
37,460 | 24,564 | 12,896 | |||||||
Other |
2,381 | 3,088 | (707 | ) | ||||||
Operating expenses: |
||||||||||
Production: |
||||||||||
Lease operating |
130,239 | 139,182 | (8,943 | ) | ||||||
Workover and other |
16,193 | 6,268 | 9,925 | |||||||
Taxes other than income |
106,331 | 88,622 | 17,709 | |||||||
Gathering and other |
26,719 | 11,745 | 14,974 | |||||||
Restructuring |
987 | 4,471 | (3,484 | ) | ||||||
General and administrative: |
||||||||||
General and administrative |
97,799 | 115,298 | (17,499 | ) | ||||||
Share-based compensation |
18,733 | 17,112 | 1,621 | |||||||
Depletion, depreciation and accretion: |
||||||||||
Depletion—Full cost |
523,855 | 453,537 | 70,318 | |||||||
Depreciation—Other |
8,744 | 6,522 | 2,222 | |||||||
Accretion expense |
1,822 | 3,596 | (1,774 | ) | ||||||
Full cost ceiling impairment |
239,668 | 1,147,771 | (908,103 | ) | ||||||
Other operating property and equipment impairment |
35,558 | 67,454 | (31,896 | ) | ||||||
Goodwill impairment |
— | 228,875 | (228,875 | ) | ||||||
Other income (expenses): |
||||||||||
Net gain (loss) on derivative contracts |
518,956 | (31,233 | ) | 550,189 | ||||||
Interest expense and other, net |
(145,689 | ) | (58,198 | ) | (87,491 | ) | ||||
Income tax benefit (provision) |
1,076 | 157,716 | (156,640 | ) | ||||||
Production: |
||||||||||
Crude oil—MBbls |
12,787 | 10,148 | 2,639 | |||||||
Natural gas—MMcf |
8,812 | 8,003 | 809 | |||||||
Natural gas liquids—MBbls |
1,113 | 683 | 430 | |||||||
Total MBoe(1) |
15,369 | 12,165 | 3,204 | |||||||
Average daily production—Boe(1) |
42,107 | 33,329 | 8,778 | |||||||
Average price per unit(2): |
||||||||||
Crude oil price—Bbl |
$ | 83.78 | $ | 93.08 | $ | (9.30 | ) | |||
Natural gas price—Mcf |
4.21 | 3.41 | 0.80 | |||||||
Natural gas liquids price—Bbl |
33.66 | 35.96 | (2.30 | ) | ||||||
Total per Boe(1) |
74.56 | 81.91 | (7.35 | ) | ||||||
Average cost per Boe: |
||||||||||
Production: |
||||||||||
Lease operating |
$ | 8.47 | $ | 11.44 | $ | (2.97 | ) | |||
Workover and other |
1.05 | 0.52 | 0.53 | |||||||
Taxes other than income |
6.92 | 7.28 | (0.36 | ) | ||||||
Gathering and other |
1.74 | 0.97 | 0.77 | |||||||
Restructuring |
0.06 | 0.37 | (0.31 | ) | ||||||
General and administrative: |
||||||||||
General and administrative |
6.36 | 9.48 | (3.12 | ) | ||||||
Share-based compensation |
1.22 | 1.41 | (0.19 | ) | ||||||
Depletion |
34.09 | 37.28 | (3.19 | ) | ||||||
- (1)
- Natural gas reserves are converted to oil reserves using a ratio of six Mcf to one Bbl of oil. This ratio does not assume price
equivalency and, given price differentials, the price for a barrel of oil equivalent for natural gas may differ significantly from the price for a barrel of
oil.
- (2)
- Amounts exclude the impact of cash paid/received on settled contracts as we did not elect to apply hedge accounting.
77
For the year ended December 31, 2014, oil, natural gas and natural gas liquids revenues increased $149.5 million from the same period in 2013. The increase was due to increased production volumes associated with the development of the properties we acquired in 2013 in the Bakken/Three Forks and El Halcón areas. These areas collectively accounted for approximately 5,600 MBoe and $360.0 million of incremental revenues year over year. The increase in revenues from production volumes was offset by a decrease in our realized average prices per Boe, which decreased $7.35 per Boe to $74.56 per Boe.
Lease operating expenses decreased $8.9 million for the year ended December 31, 2014. On a per unit basis, lease operating expenses were $8.47 per Boe in 2014 compared to $11.44 per Boe in 2013. The decrease per Boe is primarily due to lower relative operating expenses per Boe on the more recently developed core properties due, in part, to operational improvements and efficiencies.
Workover and other expenses increased $9.9 million for the year ended December 31, 2014 as compared to the same period in 2013 primarily due to $8.0 million of expenses associated with increased activity in our core areas as we continue to develop these areas. The remaining $1.9 million of the increase is attributable to workover activity in non-core areas.
Taxes other than income increased $17.7 million for the year ended December 31, 2014 as compared to the same period in 2013 primarily due to increased production from the development of our core properties. Most production taxes are based on realized prices at the wellhead. As revenues or volumes from oil and natural gas sales increase or decrease, production taxes on these sales also increase or decrease proportionately. On a per unit basis, taxes other than income were $6.92 per Boe and $7.28 per Boe, for the years ended 2014 and 2013, respectively. The decrease on a per Boe basis in 2014 is driven by a decrease in our realized average prices.
Gathering and other expenses increased $15.0 million for the year ended December 31, 2014 as compared to the same period in 2013 primarily due to increased gathering and other fees paid on our oil and natural gas production in the Bakken/Three Forks area.
In conjunction with our divestitures of certain non-core properties, we incurred approximately $1.0 million in severance costs and accelerated share-based compensation expenses related to the termination of certain employees for the year ended December 31, 2014. In March 2012, we announced our intention to close our Plano, Texas office and began the process of relocating key administrative functions to our corporate headquarters in Houston, Texas (the restructuring). As part of the restructuring, we offered certain severance and retention benefits to affected employees, through May 2013. Approximately $0.5 million of our restructuring expense in 2013 relates to costs from the restructuring. Additionally, in the fourth quarter of 2013, in conjunction with our divestitures of certain non-core assets, we incurred approximately $4.0 million in severance costs and accelerated stock-based compensation expense related to the termination of certain employees in these non-core areas.
General and administrative expense for the year ended December 31, 2014 decreased $17.5 million to $97.8 million as compared to the same period in 2013. The decrease was primarily due to decreases in professional fees, specifically contract services and legal expenses, of $14.0 million and office related expenses of $3.2 million. On a per unit basis, general and administrative expenses were $6.36 per Boe and $9.48 per Boe, for the years ended 2014 and 2013, respectively.
Share-based compensation expense for the year ended December 31, 2014 was $18.7 million, an increase of $1.6 million compared to the same period in 2013. The increase in share-based compensation expense results from additional awards granted to employees subsequent to the prior year period.
Depletion for oil and natural gas properties is calculated using the unit of production method, which depletes the capitalized costs of evaluated properties plus future development costs based on the ratio of production volume for the current period to total remaining reserve volume for the evaluated properties. Depletion expense increased $70.3 million to $523.8 million for the year ended
78
December 31, 2014 compared to the same period in 2013 of $453.5 million, due to an increase in production volumes. On a per unit basis, depletion expense was $34.09 per Boe for the year ended December 31, 2014 compared to $37.28 per Boe for the year ended December 31, 2013.
We utilize the full cost method of accounting to account for our oil and natural gas exploration and development activities. Under this method of accounting, we are required on a quarterly basis to determine whether the book value of our oil and natural gas properties (excluding unevaluated properties) is less than or equal to the "ceiling," based upon the expected after tax present value (discounted at 10%) of the future net cash flows from our proved reserves. Any excess of the net book value of our oil and natural gas properties over the ceiling must be recognized as a non-cash impairment expense. We recorded a full cost ceiling test impairment before income taxes of $239.7 million for the year ended December 31, 2014. The impairment for the year ended December 31, 2014 primarily relates to non-routine transfers of unevaluated properties to the full cost pool, due to our shift in drilling, away from the non-strategic areas of the Utica/Point Pleasant and TMS until economics and return on investment improve due to a combination of lower drilling and completion costs and higher commodity prices. We recorded a full cost ceiling test impairment before income taxes of $1.1 billion for the year ended December 31, 2013. During the year ended December 31, 2013, we transferred $655.7 million of unevaluated property costs to the full cost pool primarily related to Woodbine assets in East Texas where capital was reallocated to El Halcón, and certain Utica/Point Pleasant assets in Northwest Pennsylvania related to non-economical drilling results obtained in the third quarter of 2013. The combined impact of less favorable oil price differentials adversely affecting proved reserve values and the aforementioned non-routine transfers of unevaluated properties to the full cost pool primarily contributed to the ceiling impairment in 2013. Oil and natural gas prices, changes in production rates, levels of reserves, future development costs, transfers of unevaluated properties, capital spending, and other factors will determine our actual ceiling test calculation and impairment analyses in future periods.
We review our gas gathering systems and equipment and other operating assets for impairment in accordance with ASC 360. For the year ended December 31, 2014, we recorded a non-cash impairment charge for gas gathering systems and other related operating assets of $35.6 million, net of $1.9 million of accumulated depreciation. The majority of the impairment represents approximately half of our gas gathering infrastructure, right-of-way and permitting investments in the Utica/Point Pleasant area. These infrastructure related investments were related to acreage in certain non-core areas of the Utica play which, at the time of evaluation for impairment in December 2014, we did not plan to develop in light of the recent downtrend in oil prices, which rendered certain areas to be deemed uneconomical and/or non-strategic. For the year ended December 31, 2013, we recorded a non-cash impairment charge of $67.5 million. The impairment relates to our gross investments of $72.1 million in gas gathering infrastructure that will not be economically recoverable due to our shift in exploration, drilling and developmental plans from the Woodbine area to El Halcón during the third quarter of 2013.
During the third quarter of 2013, we performed our annual goodwill impairment test, using a measurement date of July 1, and based on this review; we recorded a non-cash impairment charge of $228.9 million to reduce the carrying value of goodwill to zero. In the first step of the goodwill impairment test, we determined that the fair value of our reporting unit was less than the carrying amount, including goodwill, primarily due to pricing deterioration in the NYMEX forward pricing curve for oil, coupled with less favorable oil price differentials in our core areas, both factors which adversely impacted the fair value of our proved reserves. Therefore, we performed the second step of the goodwill impairment test, which led us to conclude that there would be no remaining implied fair value attributable to goodwill.
Accretion expense is a function of changes in the discounted asset retirement obligation liability from period to period. We recorded $1.8 million for the year ended December 31, 2014, compared to
79
$3.6 million for the year ended December 31, 2013. The year over year reduction in our accretion expense stems from a reduction in the number of wells we currently have a working interest in after our divestitures of non-core properties.
We enter into derivative commodity instruments to economically hedge our exposure to price fluctuations on our anticipated oil and natural gas production. Consistent with prior years, we have elected not to designate any positions as cash flow hedges for accounting purposes, and accordingly, we recorded the net change in the mark-to-market value of these derivative contracts in the consolidated statements of operations. At December 31, 2014, we had a $503.9 million derivative asset, $352.5 million of which was classified as current, and we had a $9.4 million derivative liability none of which was classified as current. We recorded a net derivative gain of $518.9 million ($506.5 million net unrealized gain and $12.4 million net realized gain on settled contracts and premium costs) for the year ended December 31, 2014 compared to a net derivative loss of $31.2 million ($10.1 million net unrealized loss and $21.1 million net realized loss on settled contracts and premium costs) in the prior year.
Interest expense increased $87.5 million for the year ended December 31, 2014. Capitalized interest for the years ended December 31, 2014 and 2013 was $168.9 million and $204.0 million, respectively. The decrease in capitalized interest was driven by decreases in our unevaluated properties since 2013. Unevaluated properties are the basis of our capitalized interest calculation. Interest expense subject to capitalization increased to $317.7 million from $259.2 million in the prior year. The increase in interest subject to capitalization is primarily due to our 9.25% Senior Notes and the additional 9.75% Senior Notes outstanding for a full year in 2014.
We recorded an income tax benefit of $1.1 million on income before income taxes of $314.9 million for the year ended December 31, 2014. The benefit reflects the impact of the change in the valuation allowance for the year of $102.0 million. For the year ended December 31, 2013, we recorded an income tax benefit of $157.7 million on a loss before income taxes of $1.4 billion. The benefit reflects the impact of the change in the valuation allowance for the year of $262.8 million and the non-deductible goodwill impairment of $84.5 million.
Recently Issued Accounting Pronouncements
We discuss recently adopted and issued accounting standards in Item 8. Consolidated Financial Statements and Supplementary Data—Note 1, "Summary of Significant Events and Accounting Policies."
ITEM 7A. QUANTITATIVE AND QUALITATIVE DISCLOSURES ABOUT MARKET RISK
Derivative Instruments and Hedging Activity
We are exposed to various risks including energy commodity price risk. When oil, natural gas, and natural gas liquids prices decline significantly our ability to finance our capital budget and operations may be adversely impacted. We expect energy prices to remain volatile and unpredictable, therefore we have designed a risk management policy which provides for the use of derivative instruments to provide partial protection against declines in oil and natural gas prices by reducing the risk of price volatility and the affect it could have on our operations. The types of derivative instruments that we typically utilize include costless collars, swaps, and deferred put options. The total volumes which we hedge through the use of our derivative instruments varies from period to period, however, generally our objective is to hedge approximately 70% to 80% of our current and anticipated production for the next 18 to 24 months, when derivative contracts are available at terms (or prices) acceptable to us. Our hedge policies and objectives may change significantly as our operational profile changes and/or commodities prices change and currently we have hedged only a limited amount of our anticipated production beyond 2016 due to low commodity prices. As a consequence our future performance is subject to increased commodity price risks and our future cash flows from operations may be subject to
80
greater volatility than historically. We do not enter into derivative contracts for speculative trading purposes.
We are exposed to market risk on our open derivative contracts related to potential non-performance by our counterparties. It is our policy to enter into derivative contracts only with counterparties that are creditworthy institutions deemed by management as competent and competitive market makers. We did not post collateral under any of these contracts as they are secured under our Senior Credit Agreement or are uncollateralized trades. Please refer to Item 8. Consolidated Financial Statements and Supplementary Data—Note 7, "Derivative and Hedging Activities" for additional information.
We account for our derivative activities under the provisions of ASC 815, Derivatives and Hedging, (ASC 815). ASC 815 establishes accounting and reporting that every derivative instrument be recorded on the balance sheet as either an asset or liability measured at fair value. See Item 8. Consolidated Financial Statements and Supplementary Data—Note 7, "Derivative and Hedging Activities" for more details.
Fair Market Value of Financial Instruments
The estimated fair values for financial instruments under ASC 825, Financial Instruments, (ASC 825) are determined at discrete points in time based on relevant market information. These estimates involve uncertainties and cannot be determined with precision. The estimated fair value of cash, cash equivalents, accounts receivable and accounts payable approximates their carrying value due to their short-term nature. See Item 8. Consolidated Financial Statements and Supplementary Data—Note 6, "Fair Value Measurements" for additional information.
Interest Rate Sensitivity
We are also exposed to market risk related to adverse changes in interest rates. Our interest rate risk exposure results primarily from fluctuations in short-term rates, which are LIBOR and ABR based and may result in reductions of earnings or cash flows due to increases in the interest rates we pay on these obligations.
At December 31, 2015, the principal amount of our total long-term debt was $2.9 billion, of which approximately 98% bears interest at a weighted average fixed interest rate of 10.4% per year. The remaining 2% of our total long-term debt at December 31, 2015 bears interest at floating or market interest rates that at our option are tied to prime rate or LIBOR. Fluctuations in market interest rates will cause our annual interest costs to fluctuate. At December 31, 2015, the weighted average interest rate on our variable rate debt was 3.8% per year. If the balance of our variable rate debt at December 31, 2015 were to remain constant, a 10% change in market interest rates would impact our cash flow by approximately $0.2 million per year.
81
ITEM 8. CONSOLIDATED FINANCIAL STATEMENTS AND SUPPLEMENTARY DATA
INDEX TO CONSOLIDATED FINANCIAL STATEMENTS
82
MANAGEMENT'S REPORT ON INTERNAL CONTROL OVER FINANCIAL REPORTING
Management of Halcón Resources Corporation (the Company), including the Company's Chief Executive Officer and Chief Financial Officer, is responsible for establishing and maintaining adequate internal control over financial reporting for the Company. The Company's internal control system was designed to provide reasonable assurance to the Company's Management and Board of Directors regarding the preparation and fair presentation of published financial statements. Because of its inherent limitations, internal control over financial reporting may not prevent or detect misstatements. Also, projections of any evaluation of effectiveness to future periods are subject to the risk that controls may become inadequate because of changes in conditions, or that the degree of compliance with the policies or procedures may deteriorate.
Management conducted an evaluation of the effectiveness of internal control over financial reporting based on the Internal Control—Integrated Framework issued by the Committee of Sponsoring Organizations of the Treadway Commission in 2013. Based on this evaluation, management concluded that Halcón Resources Corporation's internal control over financial reporting was effective as of December 31, 2015.
Deloitte & Touche LLP, the Company's independent registered public accounting firm, has issued an attestation report on the effectiveness of the Company's internal control over financial reporting as of December 31, 2015 which is included herein.
| /s/ FLOYD C. WILSON Floyd C. Wilson Chairman of the Board and Chief Executive Officer |
/s/ MARK J. MIZE Mark J. Mize Executive Vice President, Chief Financial Officer and Treasurer |
Houston,
Texas
February 26, 2016
83
REPORT OF INDEPENDENT REGISTERED PUBLIC ACCOUNTING FIRM
To
the Board of Directors and Stockholders of
Halcón Resources Corporation
Houston, Texas
We have audited the internal control over financial reporting of Halcón Resources Corporation and subsidiaries (the "Company") as of December 31, 2015, based on criteria established in Internal Control—Integrated Framework (2013) issued by the Committee of Sponsoring Organizations of the Treadway Commission. The Company's management is responsible for maintaining effective internal control over financial reporting and for its assessment of the effectiveness of internal control over financial reporting, included in the accompanying Management's Report on Internal Control Over Financial Reporting. Our responsibility is to express an opinion on the Company's internal control over financial reporting based on our audit.
We conducted our audit in accordance with the standards of the Public Company Accounting Oversight Board (United States). Those standards require that we plan and perform the audit to obtain reasonable assurance about whether effective internal control over financial reporting was maintained in all material respects. Our audit included obtaining an understanding of internal control over financial reporting, assessing the risk that a material weakness exists, testing and evaluating the design and operating effectiveness of internal control based on the assessed risk, and performing such other procedures as we considered necessary in the circumstances. We believe that our audit provides a reasonable basis for our opinion.
A company's internal control over financial reporting is a process designed by, or under the supervision of, the company's principal executive and principal financial officers, or persons performing similar functions, and effected by the company's board of directors, management, and other personnel to provide reasonable assurance regarding the reliability of financial reporting and the preparation of financial statements for external purposes in accordance with generally accepted accounting principles. A company's internal control over financial reporting includes those policies and procedures that (1) pertain to the maintenance of records that, in reasonable detail, accurately and fairly reflect the transactions and dispositions of the assets of the company; (2) provide reasonable assurance that transactions are recorded as necessary to permit preparation of financial statements in accordance with generally accepted accounting principles, and that receipts and expenditures of the company are being made only in accordance with authorizations of management and directors of the company; and (3) provide reasonable assurance regarding prevention or timely detection of unauthorized acquisition, use, or disposition of the company's assets that could have a material effect on the financial statements.
Because of the inherent limitations of internal control over financial reporting, including the possibility of collusion or improper management override of controls, material misstatements due to error or fraud may not be prevented or detected on a timely basis. Also, projections of any evaluation of the effectiveness of the internal control over financial reporting to future periods are subject to the risk that the controls may become inadequate because of changes in conditions, or that the degree of compliance with the policies or procedures may deteriorate.
In our opinion, the Company maintained, in all material respects, effective internal control over financial reporting as of December 31, 2015, based on the criteria established in Internal Control—Integrated Framework (2013) issued by the Committee of Sponsoring Organizations of the Treadway Commission.
We have also audited, in accordance with the standards of the Public Company Accounting Oversight Board (United States), the consolidated balance sheets of the Company as of December 31, 2015 and 2014, and the related consolidated statements of operations, stockholders' equity, and cash flows for each of the three years in the period ended December 31, 2015 and our report dated February 26, 2016 expressed an unqualified opinion on those financial statements.
/s/ DELOITTE & TOUCHE LLP
Houston,
Texas
February 26, 2016
84
REPORT OF INDEPENDENT REGISTERED PUBLIC ACCOUNTING FIRM
To
the Board of Directors and Stockholders of
Halcón Resources Corporation
Houston, Texas
We have audited the accompanying consolidated balance sheets of Halcón Resources Corporation and subsidiaries (the "Company") as of December 31, 2015 and 2014, and the related consolidated statements of operations, stockholders' equity, and cash flows for each of the three years in the period ended December 31, 2015. These financial statements are the responsibility of the Company's management. Our responsibility is to express an opinion on these financial statements based on our audits.
We conducted our audits in accordance with the standards of the Public Company Accounting Oversight Board (United States). Those standards require that we plan and perform the audit to obtain reasonable assurance about whether the financial statements are free of material misstatement. An audit includes examining, on a test basis, evidence supporting the amounts and disclosures in the financial statements. An audit also includes assessing the accounting principles used and significant estimates made by management, as well as evaluating the overall financial statement presentation. We believe that our audits provide a reasonable basis for our opinion.
In our opinion, such consolidated financial statements present fairly, in all material respects, the financial position of Halcón Resources Corporation and subsidiaries as of December 31, 2015 and 2014, and the results of their operations and their cash flows for each of the three years in the period ended December 31, 2015, in conformity with accounting principles generally accepted in the United States of America.
As discussed in Note 1 to the consolidated financial statements, the Company has changed its method of accounting for the classification for deferred taxes in the consolidated balance sheet for the year ended December 31, 2015 due to the prospective adoption of Financial Accounting Standards Board's Accounting Standards Update 2015-17, Balance Sheet Classification for Deferred Taxes.
We have also audited, in accordance with the standards of the Public Company Accounting Oversight Board (United States), the Company's internal control over financial reporting as of December 31, 2015, based on the criteria established in Internal Control—Integrated Framework (2013) issued by the Committee of Sponsoring Organizations of the Treadway Commission and our report dated February 26, 2016 expressed an unqualified opinion on the Company's internal control over financial reporting.
/s/ DELOITTE & TOUCHE LLP
Houston, Texas
February 26, 2015
85
HALCÓN RESOURCES CORPORATION
CONSOLIDATED STATEMENTS OF OPERATIONS
(In thousands, except per share amounts)
| |
Years Ended December 31, | |||||||||
|---|---|---|---|---|---|---|---|---|---|---|
| |
2015 | 2014 | 2013 | |||||||
Operating revenues: |
||||||||||
Oil, natural gas and natural gas liquids sales: |
||||||||||
Oil |
$ | 512,346 | $ | 1,071,319 | $ | 944,535 | ||||
Natural gas |
22,509 | 37,101 | 27,319 | |||||||
Natural gas liquids |
13,624 | 37,460 | 24,564 | |||||||
| | | | | | | | | | | |
Total oil, natural gas and natural gas liquids sales |
548,479 | 1,145,880 | 996,418 | |||||||
Other |
1,799 | 2,381 | 3,088 | |||||||
| | | | | | | | | | | |
Total operating revenues |
550,278 | 1,148,261 | 999,506 | |||||||
| | | | | | | | | | | |
Operating expenses: |
||||||||||
Production: |
||||||||||
Lease operating |
103,590 | 130,239 | 139,182 | |||||||
Workover and other |
20,862 | 16,193 | 6,268 | |||||||
Taxes other than income |
48,890 | 106,331 | 88,622 | |||||||
Gathering and other |
40,281 | 26,719 | 11,745 | |||||||
Restructuring |
2,886 | 987 | 4,471 | |||||||
General and administrative |
87,766 | 116,532 | 132,410 | |||||||
Depletion, depreciation and accretion |
364,204 | 534,421 | 463,655 | |||||||
Full cost ceiling impairment |
2,626,305 | 239,668 | 1,147,771 | |||||||
Other operating property and equipment impairment |
— | 35,558 | 67,454 | |||||||
Goodwill impairment |
— | — | 228,875 | |||||||
| | | | | | | | | | | |
Total operating expenses |
3,294,784 | 1,206,648 | 2,290,453 | |||||||
| | | | | | | | | | | |
Income (loss) from operations |
(2,744,506 | ) | (58,387 | ) | (1,290,947 | ) | ||||
Other income (expenses): |
||||||||||
Net gain (loss) on derivative contracts |
310,264 | 518,956 | (31,233 | ) | ||||||
Interest expense and other, net |
(232,878 | ) | (145,689 | ) | (58,198 | ) | ||||
Gain (loss) on extinguishment of debt |
761,804 | — | — | |||||||
Gain (loss) on extinguishment of Convertible Note and modification of February 2012 Warrants |
(8,219 | ) | — | — | ||||||
| | | | | | | | | | | |
Total other income (expenses) |
830,971 | 373,267 | (89,431 | ) | ||||||
| | | | | | | | | | | |
Income (loss) before income taxes |
(1,913,535 | ) | 314,880 | (1,380,378 | ) | |||||
Income tax benefit (provision) |
(9,086 | ) | 1,076 | 157,716 | ||||||
| | | | | | | | | | | |
Net income (loss) |
(1,922,621 | ) | 315,956 | (1,222,662 | ) | |||||
Series A preferred dividends |
(17,517 | ) | (19,838 | ) | (10,745 | ) | ||||
Preferred dividends and accretion on redeemable noncontrolling interest |
(66,820 | ) | (13,176 | ) | — | |||||
| | | | | | | | | | | |
Net income (loss) available to common stockholders |
$ | (2,006,958 | ) | $ | 282,942 | $ | (1,233,407 | ) | ||
| | | | | | | | | | | |
| | | | | | | | | | | |
| | | | | | | | | | | |
Net income (loss) per share of common stock: |
||||||||||
Basic |
$ | (18.66 | ) | $ | 3.40 | $ | (16.25 | ) | ||
| | | | | | | | | | | |
| | | | | | | | | | | |
| | | | | | | | | | | |
Diluted |
$ | (18.66 | ) | $ | 2.93 | $ | (16.25 | ) | ||
| | | | | | | | | | | |
| | | | | | | | | | | |
| | | | | | | | | | | |
Weighted average common shares outstanding: |
||||||||||
Basic |
107,531 | 83,155 | 75,925 | |||||||
| | | | | | | | | | | |
| | | | | | | | | | | |
| | | | | | | | | | | |
Diluted |
107,531 | 108,481 | 75,925 | |||||||
| | | | | | | | | | | |
| | | | | | | | | | | |
| | | | | | | | | | | |
The accompanying notes are an integral part of these consolidated financial statements.
86
HALCÓN RESOURCES CORPORATION
CONSOLIDATED BALANCE SHEETS
(In thousands, except share and per share amounts)
| |
December 31, | ||||||
|---|---|---|---|---|---|---|---|
| |
2015 | 2014 | |||||
Current assets: |
|||||||
Cash |
$ | 8,026 | $ | 43,713 | |||
Accounts receivable |
173,624 | 276,559 | |||||
Receivables from derivative contracts |
348,861 | 352,530 | |||||
Restricted cash |
16,812 | 16,131 | |||||
Inventory |
4,635 | 4,693 | |||||
Prepaids and other |
4,635 | 9,079 | |||||
| | | | | | | | |
Total current assets |
556,593 | 702,705 | |||||
| | | | | | | | |
Oil and natural gas properties (full cost method): |
|||||||
Evaluated |
7,060,721 | 6,390,820 | |||||
Unevaluated |
1,641,356 | 1,829,786 | |||||
| | | | | | | | |
Gross oil and natural gas properties |
8,702,077 | 8,220,606 | |||||
Less—accumulated depletion |
(5,933,688 | ) | (2,953,038 | ) | |||
| | | | | | | | |
Net oil and natural gas properties |
2,768,389 | 5,267,568 | |||||
| | | | | | | | |
Other operating property and equipment: |
|||||||
Gas gathering and other operating assets |
130,090 | 126,804 | |||||
Less—accumulated depreciation |
(22,435 | ) | (14,798 | ) | |||
| | | | | | | | |
Net other operating property and equipment |
107,655 | 112,006 | |||||
| | | | | | | | |
Other noncurrent assets: |
|||||||
Receivables from derivative contracts |
16,614 | 151,324 | |||||
Debt issuance costs, net |
7,633 | 4,656 | |||||
Deferred income taxes |
— | 136,826 | |||||
Equity in oil and natural gas partnership |
209 | 4,309 | |||||
Funds in escrow and other |
1,599 | 3,833 | |||||
| | | | | | | | |
Total assets |
$ | 3,458,692 | $ | 6,383,227 | |||
| | | | | | | | |
| | | | | | | | |
| | | | | | | | |
Current liabilities: |
|||||||
Accounts payable and accrued liabilities |
$ | 295,085 | $ | 607,750 | |||
Asset retirement obligations |
163 | 106 | |||||
Current portion of deferred income taxes |
— | 136,826 | |||||
| | | | | | | | |
Total current liabilities |
295,248 | 744,682 | |||||
| | | | | | | | |
Long-term debt, net |
2,873,637 | 3,695,488 | |||||
Other noncurrent liabilities: |
|||||||
Liabilities from derivative contracts |
290 | 9,387 | |||||
Asset retirement obligations |
46,853 | 38,371 | |||||
Other |
6,264 | 5,964 | |||||
Commitments and contingencies (Note 9) |
|||||||
Mezzanine equity: |
|||||||
Redeemable noncontrolling interest |
183,986 | 117,166 | |||||
Stockholders' equity: |
|||||||
Preferred stock: 1,000,000 shares of $0.0001 par value authorized; 244,724 and 345,000 shares of 5.75% Cumulative Perpetual Convertible Series A, issued and outstanding at December 31, 2015 and 2014, respectively |
— | — | |||||
Common stock: 1,340,000,000 shares of $0.0001 par value authorized; 122,523,559 and 85,561,662 shares issued and outstanding at December 31, 2015 and 2014, respectively |
12 | 8 | |||||
Additional paid-in capital |
3,283,097 | 2,995,436 | |||||
Accumulated deficit |
(3,230,695 | ) | (1,223,275 | ) | |||
| | | | | | | | |
Total stockholders' equity |
52,414 | 1,772,169 | |||||
| | | | | | | | |
Total liabilities and stockholders' equity |
$ | 3,458,692 | $ | 6,383,227 | |||
| | | | | | | | |
| | | | | | | | |
| | | | | | | | |
The accompanying notes are an integral part of these consolidated financial statements.
87
HALCÓN RESOURCES CORPORATION
CONSOLIDATED STATEMENTS OF STOCKHOLDERS' EQUITY
(In thousands)
| |
Preferred Stock | Common Stock | |
Treasury Stock | |
|
||||||||||||||||||||||
|---|---|---|---|---|---|---|---|---|---|---|---|---|---|---|---|---|---|---|---|---|---|---|---|---|---|---|---|---|
| |
Additional Paid-In Capital |
Accumulated Deficit |
Stockholders' Equity |
|||||||||||||||||||||||||
| |
Shares | Amount | Shares | Amount | Shares | Amount | ||||||||||||||||||||||
Balances at December 31, 2012 |
— | $ | — | 51,960 | $ | 5 | $ | 1,681,738 | $ | 1,650 | $ | (9,298 | ) | $ | (274,463 | ) | $ | 1,397,982 | ||||||||||
Net income (loss) |
— | — | — | — | — | — | — | (1,222,662 | ) | (1,222,662 | ) | |||||||||||||||||
Dividend on Series A preferred stock |
— | — | 409 | — | 9,092 | — | — | (9,092 | ) | — | ||||||||||||||||||
Preferred stock conversion |
— | — | 21,761 | 2 | 695,236 | — | — | — | 695,238 | |||||||||||||||||||
Sale of Series A preferred stock |
345 | — | — | — | 345,000 | — | — | — | 345,000 | |||||||||||||||||||
Common stock issuance |
— | — | 8,740 | 1 | 222,869 | — | — | — | 222,870 | |||||||||||||||||||
Offering costs |
— | — | — | — | (17,346 | ) | — | — | — | (17,346 | ) | |||||||||||||||||
Long-term incentive plan grants |
— | — | 654 | — | — | — | — | — | — | |||||||||||||||||||
Long-term incentive plan forfeitures |
— | — | (41 | ) | — | — | — | — | — | — | ||||||||||||||||||
Reduction in shares to cover individuals' tax withholding |
— | — | (6 | ) | — | (148 | ) | — | — | — | (148 | ) | ||||||||||||||||
Retirement of shares in treasury |
— | — | (89 | ) | — | (2,492 | ) | (442 | ) | 2,492 | — | — | ||||||||||||||||
Long-term incentive plan grants issued out of treasury |
— | — | (242 | ) | — | (6,806 | ) | (1,208 | ) | 6,806 | — | — | ||||||||||||||||
Share-based compensation |
— | — | — | — | 26,676 | — | — | — | 26,676 | |||||||||||||||||||
| | | | | | | | | | | | | | | | | | | | | | | | | | | | | |
Balances at December 31, 2013 |
345 | — | 83,146 | 8 | 2,953,819 | — | — | (1,506,217 | ) | 1,447,610 | ||||||||||||||||||
Net income (loss) |
— | — | — | — | — | — | — | 315,956 | 315,956 | |||||||||||||||||||
Dividends on Series A preferred stock |
— | — | 653 | — | 14,878 | — | — | (19,838 | ) | (4,960 | ) | |||||||||||||||||
Preferred dividends on redeemable noncontrolling interest |
— | — | — | — | — | — | — | (6,543 | ) | (6,543 | ) | |||||||||||||||||
Accretion of redeemable |
— | — | — | |||||||||||||||||||||||||
noncontrolling interest |
— | — | — | — | — | — | — | (6,633 | ) | (6,633 | ) | |||||||||||||||||
Offering costs |
— | — | — | — | 39 | — | — | — | 39 | |||||||||||||||||||
Long-term incentive plan grants |
— | — | 1,878 | — | — | — | — | — | — | |||||||||||||||||||
Long-term incentive plan forfeitures |
— | — | (91 | ) | — | — | — | — | — | — | ||||||||||||||||||
Reduction in shares to cover individuals' tax withholding |
— | — | (24 | ) | — | (453 | ) | — | — | — | (453 | ) | ||||||||||||||||
Share-based compensation |
— | — | — | — | 27,153 | — | — | — | 27,153 | |||||||||||||||||||
| | | | | | | | | | | | | | | | | | | | | | | | | | | | | |
Balances at December 31, 2014 |
345 | — | 85,562 | 8 | 2,995,436 | — | — | (1,223,275 | ) | 1,772,169 | ||||||||||||||||||
Net income (loss) |
— | — | — | — | — | — | — | (1,922,621 | ) | (1,922,621 | ) | |||||||||||||||||
Dividends on Series A preferred stock |
— | — | 1,354 | 1 | 9,801 | — | — | (17,979 | ) | (8,177 | ) | |||||||||||||||||
Conversion of Series A preferred stock |
(100 | ) | — | 3,258 | — | — | — | — | — | — | ||||||||||||||||||
Preferred dividends on redeemable noncontrolling interest |
— | — | — | — | — | — | — | (12,614 | ) | (12,614 | ) | |||||||||||||||||
Accretion of redeemable noncontrolling interest |
— | — | — | — | — | — | — | (53,561 | ) | (53,561 | ) | |||||||||||||||||
Change in fair value of redeemable noncontrolling interest |
— | — | — | — | — | — | — | (645 | ) | (645 | ) | |||||||||||||||||
Common stock issuance |
— | — | 1,888 | — | 15,356 | — | — | — | 15,356 | |||||||||||||||||||
Common stock issuance on conversion of senior notes |
— | — | 28,955 | 3 | 231,380 | — | — | — | 231,383 | |||||||||||||||||||
Modification of February 2012 Warrants |
— | — | — | — | 14,129 | — | — | — | 14,129 | |||||||||||||||||||
Offering costs |
— | — | — | — | (1,871 | ) | — | — | — | (1,871 | ) | |||||||||||||||||
Long-term incentive plan grants |
— | — | 2,048 | — | — | — | — | — | — | |||||||||||||||||||
Long-term incentive plan forfeitures |
— | — | (388 | ) | — | — | — | — | — | — | ||||||||||||||||||
Reduction in shares to cover individuals' tax withholding |
— | — | (153 | ) | — | (947 | ) | — | — | — | (947 | ) | ||||||||||||||||
Share-based compensation |
— | — | — | — | 19,813 | — | — | — | 19,813 | |||||||||||||||||||
| | | | | | | | | | | | | | | | | | | | | | | | | | | | | |
Balances at December 31, 2015 |
245 | $ | — | 122,524 | $ | 12 | $ | 3,283,097 | $ | — | $ | — | $ | (3,230,695 | ) | $ | 52,414 | |||||||||||
| | | | | | | | | | | | | | | | | | | | | | | | | | | | | |
| | | | | | | | | | | | | | | | | | | | | | | | | | | | | |
| | | | | | | | | | | | | | | | | | | | | | | | | | | | | |
The accompanying notes are an integral part of these consolidated financial statements.
88
HALCÓN RESOURCES CORPORATION
CONSOLIDATED STATEMENTS OF CASH FLOWS
(In thousands)
| |
Years Ended December 31, | |||||||||
|---|---|---|---|---|---|---|---|---|---|---|
| |
2015 | 2014 | 2013 | |||||||
Cash flows from operating activities: |
||||||||||
Net income (loss) |
$ | (1,922,621 | ) | $ | 315,956 | $ | (1,222,662 | ) | ||
Adjustments to reconcile net income (loss) to net cash provided by (used in) operating activities: |
||||||||||
Depletion, depreciation and accretion |
364,204 | 534,421 | 463,655 | |||||||
Full cost ceiling impairment |
2,626,305 | 239,668 | 1,147,771 | |||||||
Other operating property and equipment impairment |
— | 35,558 | 67,454 | |||||||
Goodwill impairment |
— | — | 228,875 | |||||||
Deferred income tax provision (benefit) |
— | — | (159,239 | ) | ||||||
Share-based compensation, net |
14,529 | 18,733 | 17,112 | |||||||
Unrealized loss (gain) on derivative contracts |
129,282 | (508,285 | ) | 8,728 | ||||||
Amortization and write-off of deferred loan costs |
7,357 | 4,315 | 2,656 | |||||||
Non-cash interest and amortization of discount and premium |
2,509 | 2,780 | 2,025 | |||||||
Loss (gain) on extinguishment of debt |
(761,804 | ) | — | — | ||||||
Loss (gain) on extinguishment of Convertible Note and modification of February 2012 Warrants |
8,219 | — | — | |||||||
Accrued settlements on derivative contracts |
(47,011 | ) | (25,868 | ) | — | |||||
Other expense (income) |
8,934 | (2,435 | ) | 1,427 | ||||||
Change in assets and liabilities, net of acquisitions: |
||||||||||
Accounts receivable |
86,411 | 85,767 | (96,216 | ) | ||||||
Inventory |
(592 | ) | 455 | (504 | ) | |||||
Prepaids and other |
4,306 | 7,019 | (8,734 | ) | ||||||
Accounts payable and accrued liabilities |
(53,029 | ) | (40,150 | ) | 41,576 | |||||
| | | | | | | | | | | |
Net cash provided by (used in) operating activities |
466,999 | 667,934 | 493,924 | |||||||
| | | | | | | | | | | |
Cash flows from investing activities: |
||||||||||
Oil and natural gas capital expenditures |
(659,419 | ) | (1,524,341 | ) | (2,380,445 | ) | ||||
Acquisition of Williston Basin Assets |
— | — | (32,713 | ) | ||||||
Proceeds received from sales of oil and natural gas assets |
1,222 | 484,184 | 448,299 | |||||||
Advance on carried interest |
— | (189,442 | ) | — | ||||||
Other operating property and equipment capital expenditures |
(10,838 | ) | (43,083 | ) | (139,295 | ) | ||||
Funds held in escrow and other |
1,903 | 1,589 | 3,455 | |||||||
| | | | | | | | | | | |
Net cash provided by (used in) investing activities |
(667,132 | ) | (1,271,093 | ) | (2,100,699 | ) | ||||
| | | | | | | | | | | |
Cash flows from financing activities: |
||||||||||
Proceeds from borrowings |
1,834,000 | 2,276,000 | 3,725,000 | |||||||
Repayments of borrowings |
(1,643,804 | ) | (1,719,000 | ) | (2,644,400 | ) | ||||
Debt issuance costs |
(29,568 | ) | (819 | ) | (23,873 | ) | ||||
Series A preferred stock issued |
— | — | 345,000 | |||||||
Series A preferred dividends |
(8,177 | ) | (4,960 | ) | — | |||||
Common stock issued |
15,356 | — | 222,870 | |||||||
HK TMS, LLC preferred stock issued |
— | 110,051 | — | |||||||
HK TMS, LLC tranche rights |
— | 4,516 | — | |||||||
Preferred dividends on redeemable noncontrolling interest |
— | (3,518 | ) | — | ||||||
Restricted cash |
(543 | ) | (16,131 | ) | — | |||||
Offering costs and other |
(2,818 | ) | (2,101 | ) | (17,494 | ) | ||||
| | | | | | | | | | | |
Net cash provided by (used in) financing activities |
164,446 | 644,038 | 1,607,103 | |||||||
| | | | | | | | | | | |
Net increase (decrease) in cash |
(35,687 | ) | 40,879 | 328 | ||||||
Cash at beginning of period |
43,713 | 2,834 | 2,506 | |||||||
| | | | | | | | | | | |
Cash at end of period |
$ | 8,026 | $ | 43,713 | $ | 2,834 | ||||
| | | | | | | | | | | |
| | | | | | | | | | | |
| | | | | | | | | | | |
The accompanying notes are an integral part of these consolidated financial statements.
89
HALCÓN RESOURCES CORPORATION
CONSOLIDATED STATEMENTS OF CASH FLOWS (Continued)
(In thousands)
| |
Years Ended December 31, | |||||||||
|---|---|---|---|---|---|---|---|---|---|---|
| |
2015 | 2014 | 2013 | |||||||
Supplemental cash flow information: |
||||||||||
Cash paid for interest, net of capitalized interest |
$ | 204,178 | $ | 132,557 | $ | 25,462 | ||||
Cash paid (refunded) for income taxes |
(3,078 | ) | (8,600 | ) | 9,014 | |||||
Disclosure of non-cash investing and financing activities: |
||||||||||
Accrued capitalized interest |
$ | (1,417 | ) | $ | (1,180 | ) | $ | 9,890 | ||
Asset retirement obligations |
6,742 | (1,262 | ) | (39,472 | ) | |||||
Series A preferred dividends paid in common stock |
9,802 | 14,878 | 9,092 | |||||||
Preferred dividends on redeemable noncontrolling interest paid-in-kind |
12,614 | 3,025 | — | |||||||
Accretion of redeemable noncontrolling interest |
53,561 | 6,633 | — | |||||||
Change in fair value of redeemable noncontrolling interest |
645 | — | — | |||||||
Common stock issued on conversion of senior notes |
231,383 | — | — | |||||||
Third Lien Notes issued on conversion of senior notes |
1,017,970 | — | — | |||||||
2022 Second Lien Notes issued on conversion of senior notes |
112,826 | — | — | |||||||
Payable for debt issuance costs |
1,176 | — | — | |||||||
Payable for acquisition of oil and natural gas properties |
— | — | 2,157 | |||||||
Receivable for sale of oil and natural gas properties |
— | 1,000 | — | |||||||
The accompanying notes are an integral part of these consolidated financial statements.
90
HALCÓN RESOURCES CORPORATION
NOTES TO THE CONSOLIDATED FINANCIAL STATEMENTS
1. SUMMARY OF SIGNIFICANT EVENTS AND ACCOUNTING POLICIES
Basis of Presentation and Principles of Consolidation
Halcón Resources Corporation (Halcón or the Company) is an independent energy company focused on the acquisition, production, exploration and development of onshore liquids-rich oil and natural gas assets in the United States. The consolidated financial statements include the accounts of all majority-owned, controlled subsidiaries and an equity method investment. The Company operates in one segment which focuses on oil and natural gas acquisition, production, exploration and development. The Company's oil and natural gas properties are managed as a whole rather than through discrete operating areas. Operational information is tracked by operating area; however, financial performance is assessed as a whole. Allocation of capital is made across the Company's entire portfolio without regard to operating area. All intercompany accounts and transactions have been eliminated. The Company has evaluated events or transactions through the date of issuance of this report in conjunction with the preparation of these consolidated financial statements.
On December 28, 2015, the Company completed a one-for-five reverse stock split. As a result, all share and per share information included for all periods presented in these consolidated financial statements reflect the reverse stock split.
Use of Estimates
The preparation of the Company's consolidated financial statements in conformity with accounting principles generally accepted in the United States requires the Company's management to make estimates and assumptions that affect the reported amounts of assets and liabilities and disclosure of contingent assets and liabilities, if any, at the date of the consolidated financial statements and the reported amounts of revenues and expenses during the respective reporting periods. Estimates and assumptions that, in the opinion of management of the Company, are significant include oil and natural gas revenue accruals, capital and operating expense accruals, oil and natural gas reserves, depletion relating to oil and natural gas properties, asset retirement obligations, fair value estimates, and income taxes. The Company bases its estimates and judgments on historical experience and on various other assumptions and information that are believed to be reasonable under the circumstances. Estimates and assumptions about future events and their effects cannot be perceived with certainty and, accordingly, these estimates may change as new events occur, as more experience is acquired, as additional information is obtained and as the Company's operating environment changes. Actual results may differ from the estimates and assumptions used in the preparation of the Company's consolidated financial statements.
Accounts Receivable and Allowance for Doubtful Accounts
The Company's accounts receivable are primarily receivables from joint interest owners and oil and natural gas purchasers. Accounts receivable are recorded at the amount due, less an allowance for doubtful accounts, when applicable. The Company establishes provisions for losses on accounts receivable if it determines that collection of all or part of the outstanding balance is doubtful. The Company regularly reviews collectability and establishes or adjusts the allowance for doubtful accounts as necessary using the specific identification method. There were no significant allowances for doubtful accounts as of December 31, 2015 or 2014.
91
HALCÓN RESOURCES CORPORATION
NOTES TO THE CONSOLIDATED FINANCIAL STATEMENTS (Continued)
1. SUMMARY OF SIGNIFICANT EVENTS AND ACCOUNTING POLICIES (Continued)
Oil and Natural Gas Properties
The Company uses the full cost method of accounting for its investment in oil and natural gas properties as prescribed by the United States Securities and Exchange Commission (SEC). Accordingly, all costs incurred in the acquisition, exploration and development of proved and unproved oil and natural gas properties, including the costs of abandoned properties, dry holes, geophysical costs, and annual lease rentals are capitalized. All general and administrative corporate costs unrelated to drilling activities are expensed as incurred. Sales or other dispositions of oil and natural gas properties are accounted for as adjustments to capitalized costs, with no gain or loss recorded unless the ratio of cost to proved reserves would significantly change. Depletion of evaluated oil and natural gas properties is computed on the units of production method based on proved reserves. The net capitalized costs of evaluated oil and natural gas properties are subject to a full cost ceiling limitation in which the costs are not allowed to exceed their related estimated future net revenues discounted at 10%, net of tax considerations.
Costs associated with unevaluated properties are excluded from the full cost pool until the Company has made a determination as to the existence of proved reserves. The Company reviews its unevaluated properties at the end of each quarter to determine whether the costs incurred should be transferred to the full cost pool and thereby subject to amortization. Investments in unevaluated oil and natural gas properties and exploration and development projects for which depletion expense is not currently recognized, and for which exploration or development activities are in progress, qualify for interest capitalization. The capitalized interest is determined by multiplying the Company's weighted-average borrowing cost on debt by the average amount of qualifying costs incurred that are excluded from the full cost pool; however, the amount of capitalized interest cannot exceed the amount of gross interest expense incurred in any given period.
Other Operating Property and Equipment
Gas gathering systems and equipment are recorded at cost. Depreciation is calculated using the straight-line method over a 30-year or 10-year estimated useful life applicable to gas gathering systems and compressed natural gas facilities, respectively. Upon disposition, the cost and accumulated depreciation are removed and any gains or losses are reflected in current operations. Maintenance and repair costs are charged to operating expense as incurred. Material expenditures which increase the life or productive capacity of an asset are capitalized and depreciated over the estimated remaining useful life of the asset. The Company capitalized $87.2 million and $83.1 million as of December 31, 2015 and 2014, respectively, related to the construction of its gas gathering systems, after any amounts impaired.
Other operating assets are recorded at cost. Depreciation is calculated using the straight-line method over the following estimated useful lives: automobiles and computers, three years; computer software, fixtures, furniture and equipment, five years or the lesser of lease term; trailers, seven years; heavy equipment, ten years; buildings, twenty years and leasehold improvements, lease term. Upon disposition, the cost and accumulated depreciation are removed and any gains or losses are reflected in current operations. Maintenance and repair costs are charged to operating expense as incurred. Material expenditures which increase the life of an asset are capitalized and depreciated over the estimated remaining useful life of the asset.
The Company reviews its gas gathering systems and equipment and other operating assets for impairment in accordance with ASC 360, Property, Plant, and Equipment (ASC 360). ASC 360 requires the Company to evaluate gas gathering systems and equipment and other operating assets for
92
HALCÓN RESOURCES CORPORATION
NOTES TO THE CONSOLIDATED FINANCIAL STATEMENTS (Continued)
1. SUMMARY OF SIGNIFICANT EVENTS AND ACCOUNTING POLICIES (Continued)
impairment as events occur or circumstances change that would more likely than not reduce the fair value below the carrying amount. If the carrying amount is not recoverable from its undiscounted cash flows, then the Company would recognize an impairment loss for the difference between the carrying amount and the current fair value. Further, the Company evaluates the remaining useful lives of its gas gathering systems and equipment and other operating assets at each reporting period to determine whether events and circumstances warrant a revision to the remaining depreciation periods. For the year ended December 31, 2014, the Company recorded a non-cash impairment charge for gas gathering systems and other related operating assets of $35.6 million, net of $1.9 million of accumulated depreciation. The majority of the impairment represents approximately half of the Company's gas gathering infrastructure, right- of-way and permitting investments in the Utica / Point Pleasant area. These infrastructure related investments were related to acreage in certain non-core areas of the Utica play which, at the time of evaluation for impairment in December 2014, the Company did not plan to develop in light of the downtrend in oil prices which rendered certain areas to be deemed uneconomical and/or non-strategic. For the year ended December 31, 2013, the Company recorded a non-cash impairment charge for midstream assets of $67.5 million. The impairment relates to the Company's gross investment of $72.1 million in gas gathering infrastructure that will not be economically recoverable due to the Company's shift in exploration, drilling and developmental plans from the Woodbine to El Halcón during the third quarter of 2013. The impairments of midstream assets were recorded in "Other operating property and equipment impairment" in the Company's consolidated statements of operations and in "Gas gathering and other operating assets" in the Company's consolidated balance sheets.
In accordance with ASC 820, Fair Value Measurements and Disclosures (ASC 820), a financial instrument's level within the fair value hierarchy is based on the lowest level of input that is significant to the fair value measurement. The estimate of the fair value of the Company's gas gathering systems was based on an income approach that estimated future cash flows associated with those assets over the remaining asset lives. This estimation includes the use of unobservable inputs, such as estimated future production, gathering and compression revenues and operating expenses. The use of these unobservable inputs results in the fair value estimate of the Company's gas gathering systems being classified as Level 3.
Revenue Recognition
Revenues from the sale of crude oil, natural gas, and natural gas liquids are recognized when the product is delivered at a fixed or determinable price, title has transferred, and collectability is reasonably assured and evidenced by a contract. The Company follows the entitlement method of accounting for crude oil and natural gas sales, recognizing as revenues only its net interest share of all production sold. Any amount attributable to the sale of production in excess of or less than the Company's net interest is recorded as a balancing asset or liability. At December 31, 2015 and 2014, the Company's imbalances were immaterial.
Concentrations of Credit Risk
The Company operates a substantial portion of its oil and natural gas properties. As the operator of a property, the Company makes full payments for costs associated with the property and seeks reimbursement from the other working interest owners in the property for their share of those costs. The Company's joint interest partners consist primarily of independent oil and natural gas producers. If
93
HALCÓN RESOURCES CORPORATION
NOTES TO THE CONSOLIDATED FINANCIAL STATEMENTS (Continued)
1. SUMMARY OF SIGNIFICANT EVENTS AND ACCOUNTING POLICIES (Continued)
the oil and natural gas exploration and production industry in general was adversely affected, the ability of the Company's joint interest partners to reimburse the Company could be adversely affected.
The purchasers of the Company's oil and natural gas production consist primarily of independent marketers, major oil and natural gas companies and gas pipeline companies. Historically, the Company has not experienced any significant losses from uncollectible accounts. In 2015, three individual purchasers of the Company's production, Crestwood Midstream Partners, formerly Arrow Field Services LLC (Crestwood), Sunoco Inc. (Sunoco) and Suncor Energy Marketing Inc. (Suncor), each accounted for more than 10% of total sales, collectively representing 57% of the Company's total sales for the year. In 2014, three individual purchasers of the Company's production, Sunoco, Crestwood and Suncor, each accounted for more than 10% of total sales, collectively representing 66% of the Company's total sales for the year. In 2013, four individual purchasers of the Company's production, Shell Trading US Co., Sunoco, Crestwood, and Suncor each accounted for more than 10% of total sales, collectively representing 63% of the Company's total sales for the year.
The Company is exposed to market risk on its open derivative contracts related to potential non-performance by its counterparties. It is the Company's policy to enter into derivative contracts only with counterparties that are creditworthy institutions deemed by management as competent and competitive market makers.
Risk Management Activities
The Company follows ASC 815, Derivatives and Hedging (ASC 815). From time to time, when derivative contracts are available at terms (or prices) acceptable to the Company, it may hedge a portion of its forecasted oil, natural gas, and natural gas liquids production. Derivative contracts entered into by the Company have consisted of transactions in which the Company hedges the variability of cash flow related to a forecasted transaction. The Company recognized all derivative instruments as either assets or liabilities in the consolidated balance sheets at fair value. The Company has elected to not designate any of its positions for hedge accounting. Accordingly, the Company records the net change in the mark-to-market valuation of these positions, as well as payments and receipts on settled contracts, in "Net gain (loss) on derivative contracts" on the consolidated statements of operations.
Income Taxes
The Company accounts for income taxes using the asset and liability method wherein deferred tax assets and liabilities are recognized for the future tax consequences attributable to differences between financial statement carrying amounts of existing assets and liabilities and their respective tax bases. Deferred tax assets and liabilities are measured using enacted tax rates expected to apply to taxable income in the years in which temporary differences are expected to be recovered or settled. Deferred tax assets are reduced by a valuation allowance if, based on the weight of available evidence, it is more likely than not that some portion or all of the deferred tax assets will not be realized.
The Company follows ASC 740, Income Taxes (ASC 740). ASC 740 creates a single model to address accounting for the uncertainty in income tax positions and prescribes a minimum recognition threshold a tax position must meet before recognition in the consolidated financial statements.
The evaluation of a tax position in accordance with ASC 740 is a two-step process. The first step is a recognition process to determine whether it is more likely than not that a tax position will be
94
HALCÓN RESOURCES CORPORATION
NOTES TO THE CONSOLIDATED FINANCIAL STATEMENTS (Continued)
1. SUMMARY OF SIGNIFICANT EVENTS AND ACCOUNTING POLICIES (Continued)
sustained upon examination, including resolution of any related appeals or litigation processes, based on the technical merits of the position. In evaluating whether a tax position has met the more likely than not recognition threshold, it is presumed that the position will be examined by the appropriate taxing authority with full knowledge of all relevant information. The second step is a measurement process whereby a tax position that meets the more likely than not recognition threshold is calculated to determine the amount of benefit/expense to recognize in the consolidated financial statements. The tax position is measured at the largest amount of benefit/expense that is more likely than not of being realized upon ultimate settlement.
The Company has no liability for unrecognized tax benefits as of December 31, 2015 and 2014. Accordingly, there is no amount of unrecognized tax benefits that, if recognized, would affect the effective tax rate and there is no amount of interest or penalties currently recognized in the consolidated statements of operations or consolidated balance sheets as of December 31, 2015. In addition, the Company does not believe that there are any positions for which it is reasonably possible that the total amount of unrecognized tax benefits will significantly increase or decrease within the next twelve months.
The Company includes interest and penalties relating to uncertain tax positions within "Interest expense and other, net" on the Company's consolidated statements of operations. Refer to Note 12, "Income Taxes," for more details.
Generally, the Company's tax years 2012 through 2015 are either currently under audit or remain open and subject to examination by federal tax authorities or the tax authorities in Louisiana, Mississippi, North Dakota, Oklahoma, Texas, Pennsylvania, Ohio and certain other state taxing jurisdictions where the Company has, or previously had, principal operations. In certain of these jurisdictions, the Company operates through more than one legal entity, each of which may have different open years subject to examination. Additionally, it is important to note that years are open for examination until the statute of limitations in each respective jurisdiction expires.
Tax audits may be ongoing at any point in time. Tax liabilities are recorded based on estimates of additional taxes which may be due upon the conclusion of these audits. Estimates of these tax liabilities are made based upon prior experience and are updated for changes in facts and circumstances. However, due to the uncertain and complex application of tax regulations, it is possible that the ultimate resolution of audits may result in liabilities which could be materially different from these estimates.
Asset Retirement Obligations
ASC 410, Asset Retirement and Environmental Obligations (ASC 410) requires that the fair value of an asset retirement cost, and corresponding liability, should be recorded as part of the cost of the related long-lived asset and subsequently allocated to expense using a systematic and rational method. The Company records asset retirement obligations to reflect the Company's legal obligations related to future plugging and abandonment of its oil and natural gas wells and gas gathering systems and equipment. The Company estimates the expected cash flows associated with the obligation and discounts the amounts using a credit-adjusted, risk-free interest rate. At least annually, the Company reassesses the obligation to determine whether a change in the estimated obligation is necessary. The Company evaluates whether there are indicators that suggest the estimated cash flows underlying the obligation have materially changed. Should these indicators suggest the estimated obligation may have materially changed on an interim basis (quarterly), the Company will accordingly update its assessment.
95
HALCÓN RESOURCES CORPORATION
NOTES TO THE CONSOLIDATED FINANCIAL STATEMENTS (Continued)
1. SUMMARY OF SIGNIFICANT EVENTS AND ACCOUNTING POLICIES (Continued)
Additional retirement obligations increase the liability associated with new oil and natural gas wells and gas gathering systems and equipment as these obligations are incurred.
Goodwill
Goodwill represents the excess of the purchase price over the estimated fair value of the assets acquired net of the fair value of liabilities assumed in an acquisition. ASC 350, Intangibles—Goodwill and Other (ASC 350) requires that intangible assets with indefinite lives, including goodwill, be evaluated on an annual basis for impairment or more frequently if events occur or circumstances change that could potentially result in impairment. The goodwill impairment test requires the allocation of goodwill and all other assets and liabilities to reporting units. However, the Company has only one reporting unit. The Company carried goodwill as of December 31, 2012 related to its acquisition of GeoResources, Inc. Refer to Note 3, "Acquisitions and Divestitures" for more details regarding the merger between the Company and GeoResources, Inc. The Company performs its goodwill impairment test annually, using a measurement date of July 1, or more often if circumstances require.
The Company performed its annual goodwill impairment test during the third quarter of 2013, and based on this review, the Company recorded a non-cash impairment charge of $228.9 million to reduce the carrying value of goodwill to zero. The Company recorded the goodwill impairment in "Goodwill impairment" in the Company's consolidated statements of operations. In the first step of the goodwill impairment test, the Company determined that the fair value of its reporting unit was less than the carrying amount, including goodwill, primarily due to pricing deterioration in the NYMEX forward pricing curve coupled with less favorable oil price differentials in the Company's core areas, both factors which adversely impacted the fair value of the Company's proved reserves. Therefore, the Company performed the second step of the goodwill impairment test, which led the Company to conclude that there would be no remaining implied fair value attributable to goodwill.
In estimating the fair value of its reporting unit, the Company used a combination of the income and market approaches. For purposes of estimating the fair value of the Company's oil and natural gas proved reserves, an income approach was used which estimated fair value based on the anticipated cash flows associated with the Company's proved reserves, discounted using a weighted average cost of capital rate. In estimating the fair value of the Company's unproved acreage, a market approach was used in which a review of recent transactions involving properties in the same geographical location indicated the fair value of the Company's unproved acreage from a market participant perspective.
The estimation of the fair value of the Company's reporting unit includes the use of unobservable inputs, such as estimates of proved reserves, unproved acreage values, the weighted average cost of capital (discount rate), future pricing beyond a certain period and estimated future capital and operating costs. The use of these unobservable inputs results in the fair value estimate being classified as Level 3. Although the Company believes the assumptions and estimates used in the fair value calculation of its reporting unit are reasonable and appropriate, different assumptions and estimates could materially impact the analysis and resulting conclusions. The assumptions used in estimating the fair value of the reporting unit and performing the goodwill impairment test are inherently uncertain and require management judgment.
401(k) Plan
The Company sponsors a 401(k) tax deferred savings plan, whereby the Company matches a portion of employees' contributions in cash. Participation in the plan is voluntary and all employees of
96
HALCÓN RESOURCES CORPORATION
NOTES TO THE CONSOLIDATED FINANCIAL STATEMENTS (Continued)
1. SUMMARY OF SIGNIFICANT EVENTS AND ACCOUNTING POLICIES (Continued)
the Company who are 18 years of age are eligible to participate. The Company provided matching contributions of $3.8 million, $4.5 million, and $4.9 million in 2015, 2014, and 2013, respectively. The Company matches employee contributions dollar-for-dollar on the first 10% of an employee's pre-tax earnings, subject to individual IRS limitations.
Recently Issued Accounting Pronouncements
In November 2015, the Financial Accounting Standards Board (FASB) issued Accounting Standards Update (ASU) No. 2015-17, Balance Sheet Classification of Deferred Taxes (ASU 2015-17). For public business entities, ASU 2015-17 is effective for fiscal years, and interim periods within those fiscal years, beginning after December 15, 2017 and early adoption is permitted. As part of the simplification initiative, ASU 2015-15 requires companies to present deferred tax assets and deferred tax liabilities as noncurrent in the balance sheet. At December 31, 2015, the Company early adopted ASU 2015-17 on a prospective basis and accordingly, presented all deferred tax assets and liabilities as noncurrent in the accompanying consolidated balance sheet as of December 31, 2015. The current portion of deferred tax liabilities that was presented as long-term on the consolidated balance sheet at December 31, 2015 was approximately $130.5 million.
In September 2015, the FASB issued ASU No. 2015-16, Business Combinations—Simplifying the Accounting for Measurement-Period Adjustments (ASU 2015-16). For public business entities, ASU 2015-16 is effective for fiscal years, and interim periods within those fiscal years, beginning after December 15, 2015 and early adoption is permitted. The amendments in this ASU require that an acquirer, in a business combination, recognize adjustments to provisional amounts that are identified during the measurement period in the reporting period in which the adjustment amounts are determined. To simplify the accounting for adjustments made to provisional amounts recognized in a business combination, the amendments in this ASU eliminate the requirement to retrospectively account for those adjustments, and instead present separately on the face of the income statement or disclose in the footnotes the portion of the amount recorded in current-period earnings by line item that would have been recorded in previous reporting periods. The Company does not expect the adoption of ASU 2015-16 to have a material impact to its financial statements or disclosures.
In August 2015, the FASB issued ASU No. 2015-15, Presentation and Subsequent Measurement of Debt Issuance Costs with Line-of-Credit Arrangements (ASU 2015-15). The previous guidance in ASU 2015-03, as defined below, did not address the presentation or subsequent measurement of debt issuance costs related to line-of-credit arrangements. Given the absence of authoritative guidance within ASU 2015-03, the SEC staff indicated it would not object to an entity deferring and presenting debt issuance costs as an asset and subsequently amortizing the deferred debt issuance costs ratably over the term of the line-of-credit arrangement, regardless of whether there are any outstanding borrowings on the line-of-credit arrangement. ASU 2015-15 is effective for public entities for fiscal years, and interim periods within those fiscal years, beginning after December 15, 2015. Early adoption is permitted and entities shall apply the guidance retrospectively to all prior year periods presented. The Company adopted ASU 2015-15 for the consolidated balance sheets included herein. Debt issuance costs of $7.6 million and $4.7 million on the senior revolving credit facility are presented as a noncurrent asset in "Debt issuance costs, net" in the consolidated balance sheets as of December 31, 2015 and 2014, respectively, and will continue to be amortized over the term of the arrangement.
In July 2015, the FASB issued ASU No. 2015-11, Simplifying the Measurement of Inventory (ASU 2015-11). ASU 2015-11 states that an entity should measure inventory at the lower of cost and
97
HALCÓN RESOURCES CORPORATION
NOTES TO THE CONSOLIDATED FINANCIAL STATEMENTS (Continued)
1. SUMMARY OF SIGNIFICANT EVENTS AND ACCOUNTING POLICIES (Continued)
net realizable value. Net realizable value is the estimated selling prices in the ordinary course of business, less reasonably predictable costs of completion, disposal, and transportation. For public entities, ASU 2015-11 is effective for fiscal years beginning after December 15, 2016, including interim periods within those fiscal years. The amendments in this update should be applied prospectively and early application is permitted. The Company does not expect the adoption of ASU 2015-11 to have a material impact to its financial statements or disclosures.
In April 2015, the FASB issued ASU No. 2015-05, Intangibles—Goodwill and Other—Internal-Use Software (ASU 2015-05). ASU 2015-05 provides guidance to customers about whether a cloud computing arrangement includes a software license. If a cloud computing arrangement includes a software license, then the customer should account for the software license element of the arrangement consistent with the acquisition of other software licenses. If a cloud computing arrangement does not include a software license, the customer should account for the arrangement as a service contract. For public business entities, the guidance is effective for annual periods, including interim periods within those annual periods, beginning after December 15, 2015. An entity can elect to adopt the guidance either (1) prospectively to all arrangements entered into or materially modified after the effective date or (2) retrospectively. Early adoption is permitted. The adoption of ASU 2015-05 did not have a material impact to the company's financial statements or disclosures.
In April 2015, the FASB issued ASU No. 2015-03, Simplifying the Presentation of Debt Issuance Costs (ASU 2015-03). To simplify presentation of debt issuance costs, ASU 2015-03 requires that debt issuance costs be presented in the balance sheet as a direct deduction from the carrying amount of the debt liability, consistent with debt discounts. ASU 2015-03 is effective for public entities for fiscal years, and interim periods within those fiscal years, beginning after December 15, 2015. Early adoption is permitted and entities shall apply the guidance retrospectively to all prior year periods presented. The Company adopted ASU 2015-03 for the balance sheets included herein. The effect, resulting in the reclassification of unamortized debt issue costs, except those on the senior revolving credit facility, from "Debt issuance costs, net" within assets to "Long-term debt, net" on the consolidated balance sheets as of December 31, 2015 and 2014, was $32.7 million and $51.2 million, respectively.
In February 2015, the FASB issued ASU No. 2015-02, Amendments to the Consolidation Analysis (ASU 2015-02). The amendments in ASU 2015-02 eliminate the previous presumption that a general partner controls a limited partner. ASU 2015-02 may impact the Company's accounting for its general partner interest in SBE Partners LP (SBE Partners), which is currently accounted for as an equity method investment. ASU 2015-02 is effective for public entities for fiscal years, and interim periods within those fiscal years, beginning after December 15, 2015. Early adoption is permitted. Entities may apply the guidance using a modified retrospective approach by recording a cumulative-effect adjustment to equity as of the beginning of the first fiscal year adopted or it may apply the amendment retrospectively. The Company is currently assessing the impact of ASU 2015-02 on its accounting for its general partner interest in SBE Partners.
In August 2014, the FASB issued ASU No. 2014-15, Presentation of Financial Statements—Going Concern (ASU 2014-15). ASU 2014-15 is effective for annual reporting periods (including interim periods within those periods) ending after December 15, 2016. Early application is permitted. The amendments in ASU 2014-15 create a new ASC Sub-topic 205-40, Presentation of Financial Statements—Going Concern and require management to assess for each annual and interim reporting period if conditions exist that raise substantial doubt about an entity's ability to continue as a going concern. The rule requires various disclosures depending on the facts and circumstances surrounding an
98
HALCÓN RESOURCES CORPORATION
NOTES TO THE CONSOLIDATED FINANCIAL STATEMENTS (Continued)
1. SUMMARY OF SIGNIFICANT EVENTS AND ACCOUNTING POLICIES (Continued)
entity's ability to continue as a going concern. The Company is in the process of assessing the effects of the application of the new guidance.
In May 2014, the FASB issued ASU No. 2014-09, Revenue from Contracts with Customers (ASU 2014-09). ASU 2014-09 states that an entity should recognize revenue to depict the transfer of promised goods or services to customers in an amount that reflects the consideration to which the entity expects to be entitled in exchange for those goods or services. The standard provides five steps an entity should apply in determining its revenue recognition. ASU 2014-09 must be applied retrospectively (using one of two retrospective application methods) and is effective for annual reporting periods, and interim periods with that reporting period, beginning after December 15, 2016, or after December 15, 2017, if companies choose to elect the deferred adoption date approved by the FASB. Early adoption is not permitted. The Company is in the process of assessing the effects of the application of the new guidance.
2. RESTRUCTURING
In 2015, the Company had reductions in its workforce due to the decrease in drilling and developmental activities planned for the year. Consequently, the Company incurred approximately $2.9 million in severance costs and accelerated stock-based compensation expense related to the termination of certain employees during the year.
In the fourth quarter of 2013, in conjunction with the Company's divestitures of certain non-core assets, see Note 3, "Acquisitions and Divestitures," the Company incurred and settled approximately $4.0 million in severance costs related to the termination of certain employees in these non-core areas. The severances were complete with the closing of the final non-core asset sale in December 2013.
In March 2012, the Company announced its intention to close its Plano, Texas office and began the process of relocating key administrative functions to Houston, Texas (the Restructuring). As part of the Restructuring, the Company offered certain severance and retention benefits, collectively known as the Severance Program, to the affected employees. The total expense of the Severance Program was approximately $2.9 million and related costs were recognized as restructuring expense over the requisite service periods through May 2013, as applicable.
The costs discussed above, were recorded in "Restructuring" on the consolidated statements of operations in each of the respective years.
3. ACQUISITIONS AND DIVESTITURES
Acquisitions
Williston Basin Assets
On December 6, 2012, the Company completed the acquisition of two wholly-owned subsidiaries of Petro-Hunt Holdings, LLC and Pillar Holdings, LLC (the Petro-Hunt Parties), which owned acreage prospective for the Bakken / Three Forks formations located in North Dakota, in Williams, Mountrail, McKenzie and Dunn counties (the Williston Basin Assets). The Company completed the acquisition of the Williston Basin Assets for total consideration of approximately $1.5 billion (the Williston Basin Acquisition). The Williston Basin Acquisition significantly expanded the Company's presence in North Dakota, adding undeveloped acreage, oil and natural gas reserves and production to its existing asset base and operations in this area.
99
HALCÓN RESOURCES CORPORATION
NOTES TO THE CONSOLIDATED FINANCIAL STATEMENTS (Continued)
3. ACQUISITIONS AND DIVESTITURES (Continued)
The transaction had an effective date of June 1, 2012 and was subject to customary closing conditions, as well as the execution and delivery of certain other agreements, including a Registration Rights Agreement, dated December 6, 2012.
GeoResources, Inc.
On August 1, 2012, the Company completed an acquisition of GeoResources, Inc. (GeoResources) by means of the merger of GeoResources into a wholly-owned subsidiary of the Company (the Merger) and began reflecting GeoResources' results of operations in the Company's consolidated statements of operations. The Company completed the Merger for a total purchase price plus liabilities assumed of approximately $1.3 billion. The acquisition expanded the Company's presence in the Bakken / Three Forks formations of North Dakota, and the Austin Chalk Trend and Eagle Ford Shale in Texas, adding oil and natural gas reserves and production to its existing asset base in these areas.
East Texas Assets
In August 2012, the Company completed the acquisition of oil and natural gas leaseholds in East Texas (the East Texas Assets) from CH4 Energy II, LLC, PetroMax Leon, LLC, Petro Texas LLC, King King LLC and several other selling parties for total consideration of approximately $426.8 million (the East Texas Acquisition). The East Texas Acquisition expanded the Company's presence in East Texas, adding oil and natural gas reserves and production to its existing asset base in this area.
Divestitures
East Texas Assets
On May 9, 2014, the Company completed the divestiture of certain non-core assets in East Texas (the East Texas Assets) to a privately-owned company for a total purchase price of $424.5 million after closing adjustments for (i) operating expenses, capital expenditures and revenues between the effective date and the closing date, (ii) title and environmental defects, and (iii) other purchase price adjustments customary in oil and gas purchase and sale agreements. The effective date of the transaction was April 1, 2014. Proceeds from the sale were recorded as a reduction to the carrying value of the Company's full cost pool with no gain or loss recorded.
Non-core Properties
During the third quarter of 2013, the Company entered into three separate purchase and sale agreements with unrelated parties to divest parcels of non-core properties located in the United States for total consideration, after post-closing adjustments, of approximately $276.2 million. All three of the divestitures were closed by December 31, 2013. The effective date of the transactions was July 1, 2013. Proceeds from the sales were recorded as a reduction to the carrying value of the Company's full cost pool with no gain or loss recorded.
100
HALCÓN RESOURCES CORPORATION
NOTES TO THE CONSOLIDATED FINANCIAL STATEMENTS (Continued)
3. ACQUISITIONS AND DIVESTITURES (Continued)
Eagle Ford Assets
On July 19, 2013, the Company completed the sale of its interest in Eagle Ford assets located in Fayette and Gonzales Counties, Texas, previously acquired as part of the Merger, to private buyers for proceeds of approximately $148.6 million, after post-closing adjustments. The transaction had an effective date of January 1, 2013. Proceeds from the sale were recorded as a reduction to the carrying value of the Company's full cost pool with no gain or loss recorded.
4. OIL AND NATURAL GAS PROPERTIES
Oil and natural gas properties as of December 31, 2015 and 2014 consisted of the following:
| |
December 31, | ||||||
|---|---|---|---|---|---|---|---|
| |
2015 | 2014 | |||||
| |
(In thousands) |
||||||
Subject to depletion |
$ | 7,060,721 | $ | 6,390,820 | |||
| | | | | | | | |
Not subject to depletion: |
|||||||
Exploration and extension wells in progress |
55,126 | 73,684 | |||||
Other capital costs: |
|||||||
Incurred in 2015 |
130,911 | — | |||||
Incurred in 2014 |
242,788 | 415,807 | |||||
Incurred in 2013 |
443,949 | 510,308 | |||||
Incurred in 2012 and prior |
768,582 | 829,987 | |||||
| | | | | | | | |
Total not subject to depletion |
1,641,356 | 1,829,786 | |||||
| | | | | | | | |
Gross oil and natural gas properties |
8,702,077 | 8,220,606 | |||||
Less accumulated depletion |
(5,933,688 | ) | (2,953,038 | ) | |||
| | | | | | | | |
Net oil and natural gas properties |
$ | 2,768,389 | $ | 5,267,568 | |||
| | | | | | | | |
| | | | | | | | |
| | | | | | | | |
The Company uses the full cost method of accounting for its investment in oil and natural gas properties. Under this method of accounting, all costs of acquisition, exploration and development of oil and natural gas reserves (including such costs as leasehold acquisition costs, geological expenditures, dry hole costs, tangible and intangible development costs and direct internal costs) are capitalized as the cost of oil and natural gas properties when incurred. To the extent capitalized costs of evaluated oil and natural gas properties, net of accumulated depletion, exceed the discounted future net revenues of proved oil and natural gas reserves, net of deferred taxes, such excess capitalized costs are charged to expense.
The Company assesses all properties classified as unevaluated property on a quarterly basis for possible impairment or reduction in value. The Company assesses properties on an individual basis or as a group, if properties are individually insignificant. The assessment includes consideration of the following factors, among others: intent to drill; remaining lease term; geological and geophysical evaluations; drilling results and activity; the assignment of proved reserves; and the economic viability of development if proved reserves are assigned. During any period in which these factors indicate impairment, the cumulative drilling costs incurred to date for such property and all or a portion of the associated leasehold costs are transferred to the full cost pool and are then subject to depletion and the
101
HALCÓN RESOURCES CORPORATION
NOTES TO THE CONSOLIDATED FINANCIAL STATEMENTS (Continued)
4. OIL AND NATURAL GAS PROPERTIES (Continued)
full cost ceiling test limitation. During the three months ended December 31, 2014, the Company transferred $211.5 million of unevaluated property costs to the full cost pool related to certain non-core areas of the Utica / Point Pleasant and Tuscaloosa Marine Shale plays. These costs pertain to acreage that the Company did not plan to develop, at the time of evaluation for impairment, in light of the downtrend in oil prices which rendered certain areas to be deemed uneconomical and/or non-strategic. During the three months ended September 30, 2013, the Company transferred $655.7 million of unevaluated property costs to the full cost pool primarily related to Woodbine assets in East Texas where capital was reallocated to El Halcón, and certain Utica / Point Pleasant assets in Northwest Pennsylvania related to non-economical drilling results obtained in the third quarter of 2013.
Investments in unevaluated oil and natural gas properties and exploration and development projects for which depletion expense is not currently recognized, and for which exploration or development activities are in progress, qualify for interest capitalization. The capitalized interest is determined by multiplying the Company's weighted-average borrowing cost on debt by the average amount of qualifying costs incurred that are excluded from the full cost pool; however, the amount of capitalized interest cannot exceed the amount of gross interest expense incurred in any given period. The capitalized interest amounts are recorded as additions to unevaluated oil and natural gas properties on consolidated balance sheets. As the costs excluded are transferred to the full cost pool, the associated capitalized interest is also transferred to the full cost pool. For the year ended December 31, 2015 and 2014, the Company capitalized interest costs of $112.7 million and $168.3 million, respectively. The decrease in capitalized interest was driven by decreases in the Company's unevaluated properties since 2014.
The ceiling test value of the Company's reserves was calculated based on the following prices:
| |
West Texas Intermediate (per barrel)(1) |
Henry Hub (per MMBtu)(1) |
|||||
|---|---|---|---|---|---|---|---|
December 31, 2015 |
$ | 50.28 | $ | 2.587 | |||
December 31, 2014 |
94.99 | 4.350 | |||||
December 31, 2013 |
96.94 | 3.670 | |||||
- (1)
- Unweighted average of the first day of the 12-months ended spot price, adjusted by lease or field for quality, transportation fees and market differentials.
The Company's net book value of oil and natural gas properties at March 31, June 30, September 30 and December 31, 2015 exceeded the ceiling amount. The Company recorded a full cost ceiling test impairment before income taxes of $2.6 billion ($1.7 billion after taxes, before valuation allowance) for the year ended December 31, 2015. The impairment for the year ended December 31, 2015 was driven by decreases in the first-day-of-the-month average prices for crude oil used in the ceiling test calculations from $94.99 per barrel at December 31, 2014 to $50.28 per Bbl at December 31, 2015.
The Company's net book value of oil and natural gas properties at March 31 and December 31, 2014 exceeded the ceiling amount. The Company recorded a full cost ceiling test impairment before income taxes of $239.7 million ($151.4 million after taxes) for the year ended December 31, 2014. The impairment for the year ended December 31, 2014 primarily relates to non-routine transfers of unevaluated properties to the full cost pool, due to the Company's shift in drilling, away from the
102
HALCÓN RESOURCES CORPORATION
NOTES TO THE CONSOLIDATED FINANCIAL STATEMENTS (Continued)
4. OIL AND NATURAL GAS PROPERTIES (Continued)
non-strategic areas of the Utica / Point Pleasant and Tuscaloosa Marine Shale until economics and return on investment improve, which would include a combination of lower drilling and completion costs and higher commodity prices.
The Company's net book value of oil and natural gas properties at September 30 and December 31, 2013 exceeded the ceiling amount. The Company recorded a full cost ceiling test impairment before income taxes of $1.1 billion ($727.2 million after taxes) for the year ended December 31, 2013. The combined impact of less favorable oil price differentials adversely affecting proved reserve values and the non-routine transfers of unevaluated Woodbine and Utica / Point Pleasant properties to the full cost pool contributed to the ceiling impairment.
The Company recorded the full cost ceiling test impairments in "Full cost ceiling impairment" in the Company's consolidated statements of operations and in "Accumulated depletion" in the Company's consolidated balance sheets.
Changes in commodity prices, production rates, levels of reserves, future development costs, transfers of unevaluated properties, capital spending, and other factors will determine the Company's actual ceiling test calculation and impairment analyses in future periods.
5. LONG-TERM DEBT
Long-term debt as of December 31, 2015 and 2014 consisted of the following:
| |
December 31, | ||||||
|---|---|---|---|---|---|---|---|
| |
2015 | 2014 | |||||
| |
(In thousands) |
||||||
Senior revolving credit facility |
$ | 62,000 | $ | 557,000 | |||
8.625% senior secured second lien notes due 2020(1) |
687,797 | — | |||||
12.0% senior secured second lien notes due 2022(2)(3) |
111,598 | — | |||||
13.0% senior secured third lien notes due 2022(4)(5) |
1,009,585 | — | |||||
9.25% senior notes due 2022(2)(4)(6) |
51,887 | 393,155 | |||||
8.875% senior notes due 2021(2)(4)(7) |
347,671 | 1,344,410 | |||||
9.75% senior notes due 2020(2)(4)(8) |
336,470 | 1,134,683 | |||||
8.0% convertible note due 2020(9) |
266,629 | 266,240 | |||||
| | | | | | | | |
|
$ | 2,873,637 | $ | 3,695,488 | |||
| | | | | | | | |
| | | | | | | | |
| | | | | | | | |
- (1)
- On May 1, 2015, the Company completed the issuance of $700.0 million aggregate principal amount of its 8.625% senior secured notes due 2020.
Amount is net of $12.2 million unamortized debt issuance costs at December 31, 2015. See "8.625% Senior Secured Second Lien Notes" below for more details.
- (2)
- On December 21, 2015, the Company completed the issuance of approximately $112.8 million aggregate principal amount of new 12.0% senior
secured notes due 2022 in exchange for approximately $289.6 million aggregate principal amount of senior unsecured notes held by certain holders of the Company's 9.75% senior notes due 2020,
8.875% senior notes due 2021 and 9.25% senior notes due 2022. See "12.0% Senior Secured Second Lien Notes" below for more details.
- (3)
- Amount is net of $1.2 million unamortized debt issuance costs at December 31, 2015.
103
HALCÓN RESOURCES CORPORATION
NOTES TO THE CONSOLIDATED FINANCIAL STATEMENTS (Continued)
5. LONG-TERM DEBT (Continued)
- (4)
- On September 10, 2015, the Company completed the issuance of approximately $1.02 billion aggregate principal amount of new 13.0% senior
secured notes due 2022 in exchange for approximately $1.57 billion aggregate principal amount of senior unsecured notes held by certain holders of the Company's 9.75% senior notes due 2020,
8.875% senior notes due 2021 and 9.25% senior notes due 2022.
- (5)
- Amount is net of $8.4 million unamortized debt issuance costs at December 31, 2015.
- (6)
- Amounts are net of $0.8 million and $6.8 million unamortized debt issuance costs at December 31, 2015 and 2014, respectively.
- (7)
- Amounts are net of a $1.0 million and a $4.6 million unamortized discount at December 31, 2015 and 2014, respectively, related to the
issuance of the original 2021 Notes. The unamortized premium related to the additional 2021 Notes was approximately $5.5 million and $24.6 million at December 31, 2015 and 2014,
respectively. Amounts are net of $5.8 million and $25.6 million unamortized debt issuance costs at December 31, 2015 and 2014, respectively. See "8.875% Senior Notes" below for
more details.
- (8)
- Amounts are net of a $1.9 million and a $7.9 million unamortized discount at December 31, 2015 and 2014, respectively, related to the
issuance of the original 2020 Notes. The unamortized premium related to the additional 2020 Notes was approximately $2.6 million and $9.7 million at December 31, 2015 and 2014,
respectively. Amounts are net of $4.3 million and $17.1 million unamortized debt issuance costs at December 31, 2015 and 2014, respectively. See "9.75% Senior Notes" below for
more details.
- (9)
- On May 6, 2015, an amendment to the 8.0% convertible note became effective and was accounted for as a debt extinguishment, resulting in an increase to the convertible notes' discount and the remaining unamortized debt issuance costs were expensed. Amounts are net of a $23.0 million and a $21.8 million unamortized discount at December 31, 2015 and 2014, respectively. Amounts are net of $1.6 million unamortized debt issuance costs at December 31, 2014. See "8.0% Convertible Note" below for more details.
Senior Revolving Credit Facility
On February 8, 2012, the Company entered into a senior secured revolving credit agreement (the Senior Credit Agreement) with JPMorgan Chase Bank, N.A., as administrative agent, and the other lenders party thereto. The Senior Credit Agreement currently provides for a $1.5 billion facility with a current borrowing base of approximately $827.4 million. Amounts borrowed under the Senior Credit Agreement will mature on August 1, 2019. The borrowing base will be redetermined semi-annually, with the lenders and the Company each having the right to one interim unscheduled redetermination between any two consecutive semi-annual redeterminations. The borrowing base takes into account the Company's oil and natural gas properties, proved reserves, total indebtedness, and other relevant factors consistent with customary oil and natural gas lending criteria. The borrowing base is subject to a reduction, in most cases, equal to the product of 0.25 multiplied by the stated principal amount (without regard to any initial issue discount) of any future notes or other long-term debt securities that the Company may issue. Funds advanced under the Senior Credit Agreement may be paid down and re-borrowed during the term of the facility. Amounts outstanding under the Senior Credit Agreement bear interest at specified margins over the base rate of 0.75% to 1.75% for ABR-based loans or at specified margins over LIBOR of 1.75% to 2.75% for Eurodollar-based loans. These margins fluctuate based on the Company's utilization of the facility. At December 31, 2015, the weighted average interest
104
HALCÓN RESOURCES CORPORATION
NOTES TO THE CONSOLIDATED FINANCIAL STATEMENTS (Continued)
5. LONG-TERM DEBT (Continued)
rate on our variable rate debt was 3.8% per year. Advances under the Senior Credit Agreement are secured by liens on substantially all of the Company's and its restricted subsidiaries' properties and assets. The Senior Credit Agreement contains customary representations, warranties and covenants including, among others, restrictions on the payment of dividends on the Company's capital stock and financial covenants, including minimum working capital levels (the ratio of current assets plus the unused commitment under the Senior Credit Agreement to current liabilities) of not less than 1.0 to 1.0 and a ratio of total secured debt (excluding the Third Lien Notes pursuant to the Eleventh Amendment, as defined and discussed below) to EBITDA (as defined in the Senior Credit Agreement) of no greater than 2.75 to 1.0.
At December 31, 2015, the Company had $62.0 million of indebtedness outstanding, $1.6 million of letters of credit outstanding and $763.8 million of borrowing capacity available under its Senior Credit Agreement.
On October 29, 2015, the Company entered into the Twelfth Amendment to our Senior Credit Agreement (the Twelfth Amendment) which, among other things, provided additional flexibility with respect to exchanges and repurchases of senior unsecured notes; reaffirmed the borrowing base; and scheduled the next borrowing base redetermination for March 2016. On September 10, 2015, in conjunction with the issuance of the Third Lien Notes (defined below), the Company entered into the Eleventh Amendment to its Senior Credit Agreement (the Eleventh Amendment) which, among other things, permitted the Company to incur the debt under the Third Lien Notes and to grant the liens in connection therewith; excluded the Third Lien Notes from the calculation of the total secured debt to EBITDA ratio; and reduced the borrowing base. On May 1, 2015, the Company entered into the Tenth Amendment to the Senior Credit Agreement (the Tenth Amendment) which, among other things, replaced the interest coverage test with a covenant that requires the ratio of total secured debt to EBITDA of no greater than 2.75 to 1.0, reduced the borrowing base and extended the maturity date of the Senior Credit Agreement to August 1, 2019. Prior to the Tenth Amendment, under the Ninth Amendment executed on February 25, 2015, the Senior Credit Agreement had a required minimum coverage of interest expenses of not less than 2.0 to 1.0 through March 31, 2016 and not less than 2.5 to 1.0 for subsequent periods.
At December 31, 2015, the Company was in compliance with the financial debt covenants under the Senior Credit Agreement.
8.625% Senior Secured Second Lien Notes
On May 1, 2015, the Company issued $700 million aggregate principal amount of its 8.625% second lien senior secured notes due 2020 (the 2020 Second Lien Notes) in a private offering. The 2020 Second Lien Notes were issued at par. The net proceeds from the sale of the 2020 Second Lien Notes were approximately $686.2 million (after deducting offering fees and expenses). The Company used the net proceeds from the offering to repay the majority of the then outstanding borrowings under its Senior Credit Agreement.
The 2020 Second Lien Notes bear interest at a rate of 8.625% per annum, payable semi-annually on February 1 and August 1 of each year, beginning on August 1, 2015. The 2020 Second Lien Notes will mature on February 1, 2020. The 2020 Second Lien Notes are secured by second-priority liens on substantially all of the Company's and its guarantors' assets to the extent such assets secure the Company's Senior Credit Agreement, its 2022 Second Lien Notes (defined below) and its Third Lien
105
HALCÓN RESOURCES CORPORATION
NOTES TO THE CONSOLIDATED FINANCIAL STATEMENTS (Continued)
5. LONG-TERM DEBT (Continued)
Notes (defined below) (the Collateral). Pursuant to the terms of the Intercreditor Agreement, dated May 1, 2015 (the Intercreditor Agreement), the security interest in those assets that secure the 2020 Second Lien Notes and the guarantees are contractually subordinated to liens that secure the Company's Senior Credit Agreement and certain other permitted indebtedness. Consequently, the 2020 Second Lien Notes and the guarantees are effectively subordinated to the Senior Credit Agreement and such other indebtedness to the extent of the value of such assets. The Collateral does not include any of the assets of HK TMS, LLC, a wholly owned subsidiary of the Company, or any of the Company's future unrestricted subsidiaries.
The 2020 Second Lien Notes are governed by an Indenture, dated as of May 1, 2015, by and among the Company, certain subsidiaries of the Company (the Guarantors) and U.S. Bank National Association, as Trustee, (the Trustee), which contains affirmative and negative covenants that, among other things, limit the ability of the Company and the Guarantors to incur indebtedness; purchase or redeem stock or subordinated indebtedness; make investments; create liens; enter into transactions with affiliates; sell assets; refinance certain indebtedness; merge with or into other companies or transfer substantially all of their assets; and, in certain circumstances, to pay dividends or make other distributions on stock. The indenture also contains customary events of default. Upon the occurrence of certain events of default, the Trustee or the holders of the 2020 Second Lien Notes may declare all outstanding 2020 Second Lien Notes to be due and payable immediately. The 2020 Second Lien Notes are fully and unconditionally guaranteed on a senior basis by the Guarantors and by certain future subsidiaries of the Company.
At any time prior to February 1, 2017, the Company may redeem the 2020 Second Lien Notes, in whole or in part, at a redemption price equal to 100% of their principal amount plus a make-whole premium, together with accrued and unpaid interest, if any, to the redemption date. The 2020 Second Lien Notes will be redeemable, in whole or in part, on or after February 1, 2017 at redemption prices equal to the principal amount multiplied by the percentage set forth below, plus accrued and unpaid interest:
Year
|
Percentage | |||
|---|---|---|---|---|
2017 |
104.313 | |||
2018 |
102.156 | |||
2019 and thereafter |
100.000 | |||
Additionally, the Company may redeem up to 35% of the 2020 Second Lien Notes on or prior to February 1, 2017 for a redemption price of 108.625% of the principal amount thereof, plus accrued and unpaid interest, utilizing net cash proceeds from certain equity offerings. In addition, upon a change of control of the Company, holders of the 2020 Second Lien Notes will have the right to require the Company to repurchase all or any part of their notes for cash at a price equal to 101% of the aggregate principal amount of the 2020 Second Lien Notes repurchased, plus any accrued and unpaid interest.
12.0% Senior Secured Second Lien Notes
On December 21, 2015, the Company completed the issuance of approximately $112.8 million aggregate principal amount of new 12.0% second lien senior secured notes due 2022 (the 2022 Second Lien Notes) in exchange for approximately $289.6 million principal amount of our senior unsecured
106
HALCÓN RESOURCES CORPORATION
NOTES TO THE CONSOLIDATED FINANCIAL STATEMENTS (Continued)
5. LONG-TERM DEBT (Continued)
notes, consisting of $116.6 million principal amount of its 9.75% senior notes due 2020, $137.7 million principal amount of its 8.875% senior notes due 2021 and $35.3 million principal amount of its 9.25% senior notes due 2022. At closing, the Company paid all accrued and unpaid interest since the respective interest payment dates of the unsecured notes surrendered in the exchange. The Company recorded the issuance of the 2022 Second Lien Notes at par value and also recognized a $174.5 million net gain on the extinguishment of debt, as a $176.7 million gain on the exchanges was partially offset by the writedown of $2.2 million associated with related issuance costs and discounts and premiums for the respective notes. The net gain is recorded in "Gain (loss) on extinguishment of debt" in the consolidated statements of operations. As a result of the issuance of the 2022 Second Lien Notes, the Company's borrowing base under its Senior Credit Agreement was reduced from $850.0 million to approximately $827.4 million.
The 2022 Second Lien Notes are secured by second-priority liens on the Collateral. Pursuant to the terms of the Intercreditor Agreement, dated December 21, 2015, the security interest in the Collateral securing the 2022 Second Lien Notes and the guarantees are (i) contractually subordinated to liens that secure the Company's Senior Credit Agreement and certain other permitted indebtedness, (ii) contractually equal with the liens that secure the 2020 Second Lien Notes and other future parity obligations and (iii) contractually senior to the liens securing junior lien obligations (including the Third Lien Notes). Consequently, the 2022 Second Lien Notes and the guarantees are effectively subordinated to the Senior Credit Agreement and such other indebtedness, effectively equal to the 2020 Second Lien Notes and effectively senior to the Third Lien Notes, any outstanding senior unsecured notes or other unsecured debt of the Company, in each case to the extent of the value of the Collateral. The Collateral does not include any of the assets of HK TMS, LLC, a wholly owned subsidiary of the Company, or any of the Company's future unrestricted subsidiaries.
The 2022 Second Lien Notes are governed by an Indenture, dated as of December 21, 2015, by and among the Company, the Guarantors and U.S. Bank National Association, as Trustee, which contains affirmative and negative covenants that are substantially the same as those contained in the indenture governing the 2020 Second Lien Notes, described above. The 2022 Second Lien Notes are fully and unconditionally guaranteed on a senior basis by the Guarantors and by certain future subsidiaries of the Company.
Interest is payable on the 2022 Second Lien Notes on February 15 and August 15 of each year, beginning on February 15, 2016. The 2022 Second Lien Notes will mature on February 15, 2022. At any time prior to August 15, 2018, the Company may redeem the 2022 Second Lien Notes, in whole or in part, at a redemption price equal to 100% of their principal amount plus a make-whole premium, together with accrued and unpaid interest, if any, to the redemption date. The 2022 Second Lien Notes will be redeemable, in whole or in part, on or after August 15, 2018 at redemption prices equal to the principal amount multiplied by the percentage set forth below, plus accrued and unpaid interest:
Year
|
Percentage | |||
|---|---|---|---|---|
2018 |
112.000 | |||
2019 |
106.000 | |||
2020 and thereafter |
100.000 | |||
Additionally, the Company may redeem up to 35% of the 2022 Second Lien Notes on or prior to August 15, 2018 for a redemption price of 112.000% of the principal amount thereof, plus accrued and
107
HALCÓN RESOURCES CORPORATION
NOTES TO THE CONSOLIDATED FINANCIAL STATEMENTS (Continued)
5. LONG-TERM DEBT (Continued)
unpaid interest, utilizing net cash proceeds from certain equity offerings. In addition, upon a change of control of the Company, holders of the 2022 Second Lien Notes will have the right to require the Company to repurchase all or any part of their 2022 Second Lien Notes for cash at a price equal to 101% of the aggregate principal amount of the 2022 Second Lien Notes repurchased, plus any accrued and unpaid interest.
The 2022 Second Lien Notes were issued in accordance with exemptions from the registration requirements of the Securities Act of 1933, as amended afforded by Rule 144A and Regulation S under the Securities Act.
13.0% Senior Secured Third Lien Notes
On September 10, 2015, the Company issued approximately $1.02 billion aggregate principal amount of its new 13.0% third lien senior secured notes due 2022 (the Third Lien Notes) in exchange for approximately $1.57 billion principal amount of our senior unsecured notes, consisting of $497.2 million principal amount of its 9.75% senior notes due 2020, $774.7 million principal amount of its 8.875% senior notes due 2021 and $294.4 million principal amount of its 9.25% senior notes due 2022 in privately negotiated transactions with certain holders of its outstanding senior unsecured notes. At closing, the Company paid all accrued and unpaid interest since the respective interest payment dates of the notes surrendered in the exchange. The Company recorded the issuance of the Third Lien Notes at par value and also recognized a $535.1 million net gain on the extinguishment of debt, as a $548.2 million gain on the exchanges was partially offset by the writedown of $13.1 million associated with related issuance costs and discounts and premiums for the respective notes. The net gain is recorded in "Gain (loss) on extinguishment of debt" in the consolidated statements of operations.
The Third Lien Notes bear interest at a rate of 13.0% per annum, payable semi-annually on February 15 and August 15, commencing on February 15, 2016. The Third Lien Notes mature on February 15, 2022. The Third Lien Notes are secured by third-priority liens on the same collateral securing the Company's Senior Credit Agreement, the 2020 Second Lien Notes and the 2022 Second Lien Notes. Pursuant to the terms of the Intercreditor Agreement, the security interest in those assets that secure the Third Lien Notes and the guarantees are contractually subordinated to liens that secure the Company's Senior Credit Agreement, the 2020 Second Lien Notes, the 2022 Second Lien Notes and certain other permitted indebtedness. Consequently, the Third Lien Notes and the guarantees are effectively subordinated to the Senior Credit Agreement, the 2020 Second Lien Notes, the 2022 Second Lien Notes and such other indebtedness to the extent of the value of such assets.
The Third Lien Notes are governed by an Indenture, dated as of September 10, 2015, by and among the Company, the Guarantors and U.S. Bank National Association, as Trustee, which contains affirmative and negative covenants that are substantially the same as those contained in the indenture governing the 2020 Second Lien Notes, described above. The Third Lien Notes are fully and unconditionally guaranteed on a senior basis by the Guarantors and by certain future subsidiaries of the Company.
At any time prior to August 15, 2018, the Company may redeem the Third Lien Notes, in whole or in part, at a redemption price equal to 100% of their principal amount plus a make-whole premium, together with accrued and unpaid interest, if any, to the redemption date. The Third Lien Notes will be
108
HALCÓN RESOURCES CORPORATION
NOTES TO THE CONSOLIDATED FINANCIAL STATEMENTS (Continued)
5. LONG-TERM DEBT (Continued)
redeemable, in whole or in part, on or after August 15, 2018, at redemption prices equal to the principal amount multiplied by the percentage set forth below, plus accrued and unpaid interest:
Year
|
Percentage | |||
|---|---|---|---|---|
2018 |
113.000 | |||
2019 |
106.500 | |||
2020 and thereafter |
100.000 | |||
Additionally, the Company may redeem up to 35% of the Third Lien Notes prior to August 15, 2018 for a redemption price of 113% of the principal amount thereof, plus accrued and unpaid interest, utilizing net cash proceeds from certain equity offerings. In addition, upon a change of control of the Company, holders of the Third Lien Notes will have the right to require the Company to repurchase all or any part of their notes for cash at a price equal to 101% of the aggregate principal amount of the Third Lien Notes repurchased, plus any accrued and unpaid interest.
The Company issued the Third Lien Notes in reliance on the exemption from registration provided by Section 4(a)(2) of the Securities Act of 1933, as amended. The Company relied on this exemption from registration based in part on representations made by the holders of the senior unsecured notes.
9.25% Senior Notes
On August 13, 2013, the Company issued at par $400.0 million aggregate principal amount of 9.25% senior notes due 2022 (the 2022 Notes). The net proceeds from the offering of approximately $392.1 million (after deducting commissions and offering expenses) were used to repay a portion of the then outstanding borrowings under the Company's Senior Credit Agreement.
The 2022 Notes bear interest at a rate of 9.25% per annum, payable semi-annually on February 15 and August 15 of each year, beginning on February 15, 2014. The 2022 Notes will mature on February 15, 2022. The 2022 Notes are senior unsecured obligations of the Company and are effectively subordinate to its secured debt, including secured debt under the Senior Credit Agreement, the 2020 Second Lien Notes, the 2022 Second Lien Notes and the Third Lien Notes and rank equally with all of its current and future senior indebtedness. The 2022 Notes are jointly and severally, fully and unconditionally guaranteed on a senior unsecured basis by the Guarantors and by certain future subsidiaries of the Company. Halcón, the issuer of the 2022 Notes, has no material independent assets or operations apart from the assets and operations of its subsidiaries.
On May 23, 2014, the Company completed a registered exchange offer of the outstanding 2022 Notes for new registered notes having terms substantially identical to the 2022 Notes.
On or before August 15, 2016, the Company may redeem up to 35% of the aggregate principal amount of the 2022 Notes with the net cash proceeds of certain equity offerings at a redemption price of 109.250% of the principal amount plus accrued and unpaid interest to the redemption date provided that: at least 65% in aggregate principal amount of the 2022 Notes originally issued remains outstanding immediately after the redemption and the redemption occurs within 180 days of the related equity offering. In addition, at any time prior to August 15, 2017, the Company may redeem some or all of the 2022 Notes for the principal amount thereof, plus accrued and unpaid interest plus a make whole premium equal to the excess, if any of (a) the present value at such time of (i) the redemption price of such note at August 15, 2017, plus (ii) any required interest payments due on the notes
109
HALCÓN RESOURCES CORPORATION
NOTES TO THE CONSOLIDATED FINANCIAL STATEMENTS (Continued)
5. LONG-TERM DEBT (Continued)
through August 15, 2017 (excluding currently accrued and unpaid interest) computed using a discount rate equal to the Treasury Rate plus 50 basis points, discounted to the redemption date on a semi-annual basis, over (b) the principal amount of such note.
On or after August 15, 2017, the Company may redeem all or a part of the 2022 Notes at any time or from time to time at the redemption prices (expressed as percentages of the principal amount) set forth in the following table plus accrued and unpaid interest, if any, to the applicable redemption date, if redeemed during the 12-month period beginning August 15, of the years indicated:
Year
|
Percentage | |||
|---|---|---|---|---|
2017 |
104.625 | |||
2018 |
102.313 | |||
2019 and thereafter |
100.000 | |||
In addition, upon a change of control of the Company, holders of the 2022 Notes will have the right to require the Company to repurchase all or any part of their 2022 Notes for cash at a price equal to 101% of the aggregate principal amount of the 2022 Notes repurchased, plus any accrued and unpaid interest. The 2022 Notes were issued pursuant to, and are governed by an Indenture dated August 13, 2013, between the Company and U.S. Bank National Association, as trustee and the Company's subsidiaries named therein as guarantors (the Indenture).
The Indenture governing the 2022 Notes contains affirmative and negative covenants that, among other things, limit the ability of the Company and its subsidiaries that guarantee the 2022 Notes to incur indebtedness; purchase or redeem stock or subordinated indebtedness; make investments; create liens; enter into transactions with affiliates; sell assets; refinance certain indebtedness; merge with or into other companies or transfer substantially all of their assets; and, in certain circumstances, to pay dividends or make other distributions on stock. With respect to indebtedness, the indenture limits the Company's ability to incur additional indebtedness, including borrowings under its Senior Credit Agreement, unless the Company meets one of two tests: the fixed charge coverage ratio test, which requires that after giving effect to the incurrence of additional debt the ratio of the Company's adjusted consolidated EBITDA (as defined in the Indenture) to its adjusted consolidated interest expense over the trailing four fiscal quarters will be at least 2.0 to 1.0; or, in the alternative, the Company may incur additional debt under Credit Facilities (as defined in the Indenture) if the amount of such additional indebtedness is not more than the greater of a fixed sum of $750 million or 30% of the Company's adjusted consolidated net tangible assets (as defined in the Indenture), which is determined primarily by the value of discounted future net revenues from proved oil and natural gas reserves as of the date of such determination.
During the second quarter of 2015, the Company entered into several exchange agreements with holders of the Company's 2022 Notes in which they agreed to exchange an aggregate $7.4 million principal amount of their senior notes for approximately 0.9 million shares of the Company's common stock. The exchanges closed on various dates from April 30, 2015 through May 15, 2015, at which time the Company also paid all accrued and unpaid interest since the prior interest payment date for the 2022 Notes. See "Senior Notes Exchanged for Common Stock" below for more details.
On September 10, 2015, the Company closed several separate, privately negotiated exchange agreements with holders of the Company's 2022 Notes in which they agreed to exchange an aggregate
110
HALCÓN RESOURCES CORPORATION
NOTES TO THE CONSOLIDATED FINANCIAL STATEMENTS (Continued)
5. LONG-TERM DEBT (Continued)
$294.4 million principal amount of their senior unsecured notes for approximately $191.3 million aggregate principal amount of Third Lien Notes. At closing, the Company paid all accrued and unpaid interest since the prior interest payment date in August 2015.
On December 21, 2015, the Company closed an exchange offer through a public tender to holders of the Company's 2022 Notes in which they agreed to exchange an aggregate $35.3 million principal amount of their senior unsecured notes for approximately $13.7 million aggregate principal amount of new 2022 Second Lien Notes. At closing, the Company paid all accrued and unpaid interest since the prior interest payment date in August 2015.
During the fourth quarter of 2015, the Company repurchased $10.3 million principal amount of the Company's 2022 Notes for cash. At closing, the Company paid all accrued and unpaid interest since the prior interest payment date in August 2015. As of December 31, 2015, $52.7 million principal amount of the Company's 2022 Notes remained outstanding.
Subsequent to December 31, 2015, the Company repurchased $15.0 million principal amount of the 2022 Notes for cash at prevailing market prices at the time of the transactions. Upon settlement of the repurchases, the Company paid all accrued and unpaid interest since the prior interest payment date of the 2022 Notes.
8.875% Senior Notes
On November 6, 2012, the Company issued $750.0 million aggregate principal amount of its 8.875% senior notes due 2021 (the 2021 Notes), at a price to the initial purchasers of 99.247% of par. The net proceeds from the offering were approximately $725.6 million after deducting the initial purchasers' discounts, commissions and offering expenses and were used to fund a portion of the cash consideration paid in the Williston Basin Acquisition.
On January 14, 2013, the Company issued an additional $600.0 million aggregate principal amount of the 2021 Notes at a price to the initial purchasers of 105% of par. The net proceeds from the sale of the additional 2021 Notes of approximately $619.5 million (after the initial purchasers' premiums, commissions and offering expenses) were used to repay all of the then outstanding borrowings under the Senior Credit Agreement and for general corporate purposes, including funding a portion of the Company's 2013 capital expenditures program. These notes were issued as "additional notes" under the indenture governing the 2021 Notes and under the indenture are treated as a single series with substantially identical terms as the 2021 Notes previously issued.
The 2021 Notes bear interest at a rate of 8.875% per annum, payable semi-annually on May 15 and November 15 of each year, beginning on May 15, 2013. The Notes will mature on May 15, 2021. The 2021 Notes are senior unsecured obligations of the Company and are effectively subordinate to its secured debt, including secured debt under the Senior Credit Agreement, the 2020 Second Lien Notes, the 2022 Second Lien Notes and the Third Lien Notes and rank equally with all of its current and future senior indebtedness. The 2021 Notes are jointly and severally, fully and unconditionally guaranteed on a senior unsecured basis by the Guarantors and by certain future subsidiaries of the Company. Halcón, the issuer of the 2021 Notes, has no material independent assets or operations apart from the assets and operations of its subsidiaries.
On June 4, 2013, the Company completed a registered exchange offer of outstanding 2021 Notes for new registered notes having terms substantially identical to the 2021 Notes.
111
HALCÓN RESOURCES CORPORATION
NOTES TO THE CONSOLIDATED FINANCIAL STATEMENTS (Continued)
5. LONG-TERM DEBT (Continued)
On or before November 15, 2015, the Company may redeem up to 35% of the aggregate principal amount of the 2021 Notes with the net cash proceeds of certain equity offerings at a redemption price of 108.875% of the principal amount plus accrued and unpaid interest to the redemption date provided that: at least 65% in aggregate principal amount of the 2021 Notes originally issued remains outstanding immediately after the redemption and the redemption occurs within 180 days of the date of closing of the related equity offering. In addition, at any time prior to November 15, 2016, the Company may redeem some or all of the 2021 Notes for the principal amount thereof, plus accrued and unpaid interest plus a make whole premium equal to the excess, if any of (a) the present value at such time of (i) the redemption price of such note at November 15, 2016, plus (ii) any required interest payments due on the notes through November 15, 2016 (excluding currently accrued and unpaid interest) computed using a discount rate equal to the Treasury Rate plus 50 basis points, discounted to the redemption date on a semi-annual basis, over (b) the principal amount of such note.
On or after November 15, 2016, the Company may redeem some or all of the 2021 Notes at any time or from time to time at the redemption prices (expressed as percentages of the principal amount) set forth in the following table plus accrued and unpaid interest, if any, to the applicable redemption date, if redeemed during the 12-month period beginning November 15 of the years indicated below:
Year
|
Percentage | |||
|---|---|---|---|---|
2016 |
104.438 | |||
2017 |
102.219 | |||
2018 and thereafter |
100.000 | |||
In addition, upon a change of control of the Company, holders of the 2021 Notes will have the right to require the Company to repurchase all or any part of their 2021 Notes for cash at a price equal to 101% of the aggregate principal amount of the 2021 Notes repurchased, plus any accrued and unpaid interest. The 2021 Notes were issued under and governed by an Indenture dated November 6, 2012, between the Company, U.S. Bank National Association, as trustee and the Company's subsidiaries named therein as guarantors. The indenture governing the 2021 Notes contains affirmative and negative covenants that are substantially the same as those contained in the indenture governing the 2022 Notes, described above.
In conjunction with the issuance of the 2021 Notes, the Company recorded a discount of approximately $5.7 million to be amortized over the remaining life of the 2021 Notes using the effective interest method. The remaining unamortized discount was $1.0 million at December 31, 2015. In conjunction with the issuance of the additional 2021 Notes, the Company recorded a premium of approximately $30.0 million to be amortized over the remaining life of the additional 2021 Notes using the effective interest method. The remaining unamortized premium was $5.5 million at December 31, 2015.
During the second quarter of 2015, the Company entered into several exchange agreements with holders of the Company's 2021 Notes in which they agreed to exchange an aggregate $60.6 million principal amount of their senior unsecured notes for approximately 6.9 million shares of the Company's common stock. The exchanges closed on various dates from April 29, 2015 through May 15, 2015, at which time the Company also paid all accrued and unpaid interest since the prior interest payment date for the 2021 Notes. See "Senior Notes Exchanged for Common Stock" below for more details.
112
HALCÓN RESOURCES CORPORATION
NOTES TO THE CONSOLIDATED FINANCIAL STATEMENTS (Continued)
5. LONG-TERM DEBT (Continued)
On September 10, 2015, the Company closed several separate, privately negotiated exchange agreements with holders of the Company's 2021 Notes in which they agreed to exchange an aggregate $774.7 million principal amount of their senior unsecured notes for approximately $503.6 million aggregate principal amount of Third Lien Notes. At closing, the Company paid all accrued and unpaid interest since the prior interest payment date in May 2015.
On December 21, 2015, the Company closed an exchange offered through a public tender to holders of the Company's 2021 Notes in which they agreed to exchange an aggregate $137.7 million principal amount of their senior unsecured notes for approximately $53.7 million aggregate principal amount of new 2022 Second Lien Notes. At closing, the Company paid all accrued and unpaid interest since the prior interest payment date in November 2015.
During the fourth quarter of 2015, the Company repurchased $28.0 million principal amount of the Company's 2021 Notes for cash. At closing, the Company paid all accrued and unpaid interest since the prior interest payment dates in May and November 2015. As of December 31, 2015, $348.9 million principal amount of the Company's 2021 Notes remained outstanding.
Subsequent to December 31, 2015, the Company repurchased an additional $51.8 million principal amount of the 2021 Notes for cash at prevailing market prices at the time of the transactions. Upon settlement of the repurchases, the Company paid all accrued and unpaid interest since the prior interest payment date of the 2021 Notes.
9.75% Senior Notes
On July 16, 2012, the Company issued $750.0 million aggregate principal amount of 9.75% senior notes due 2020 at 98.646% of par (the 2020 Notes). The net proceeds from the offering were approximately $723.1 million after deducting the initial purchasers' discounts, commissions and offering expenses and were used to fund a portion of the cash consideration paid in the Merger and the East Texas Assets acquisition.
On December 19, 2013, the Company issued an additional $400.0 million aggregate principal amount of the 2020 Notes at a price to the initial purchasers of 102.750% of par. The net proceeds from the sale of the additional 2020 Notes of approximately $406.3 million (after the initial purchasers' fees, commissions and offering expenses) were used to repay a portion of the then outstanding borrowings under the Senior Credit Agreement. These notes were issued as "additional notes" under the indenture governing the 2020 Notes and under the indenture are treated as a single series with substantially identical terms as the 2020 Notes previously issued.
The 2020 Notes bear interest at a rate of 9.75% per annum, payable semi-annually on January 15 and July 15 of each year, beginning on January 15, 2013. The 2020 Notes will mature on July 15, 2020. The 2020 Notes are senior unsecured obligations of the Company and are effectively subordinate to its secured debt, including secured debt under the Senior Credit Agreement, the 2020 Second Lien Notes, the 2022 Second Lien Notes and the Third Lien Notes and rank equally with all of its current and future senior indebtedness. The 2020 Notes are jointly and severally, fully and unconditionally guaranteed on a senior unsecured basis by the Guarantors and by certain future subsidiaries of the Company. Halcón, the issuer of the 2020 Notes, has no material independent assets or operations apart from the assets and operations of its subsidiaries.
On June 4, 2013, the Company completed a registered exchange offer of outstanding 2020 Notes for new registered notes having terms substantially identical to the 2020 Notes. On May 23, 2014, the
113
HALCÓN RESOURCES CORPORATION
NOTES TO THE CONSOLIDATED FINANCIAL STATEMENTS (Continued)
5. LONG-TERM DEBT (Continued)
Company completed a registered exchange offer of the outstanding additional 2020 Notes for new registered notes having terms substantially identical to the additional 2020 Notes.
On or before July 15, 2015, the Company may redeem up to 35% of the aggregate principal amount of the 2020 Notes with the net cash proceeds of certain equity offerings at a redemption price of 109.750% of the principal amount plus accrued and unpaid interest to the redemption date provided that: at least 65% in aggregate principal amount of the 2020 Notes originally issued remains outstanding immediately after the redemption and the redemption occurs within 180 days of the equity offering. In addition, at any time prior to July 15, 2016, the Company may redeem some or all of the 2020 Notes for the principal amount thereof, plus accrued and unpaid interest plus a make whole premium equal to the excess, if any of (a) the present value at such time of (i) the redemption price of such note at July 15, 2016, plus (ii) any required interest payments due on the notes through July 15, 2016 (excluding currently accrued and unpaid interest) computed using a discount rate equal to the Treasury Rate plus 50 basis points, discounted to the redemption date on a semi-annual basis, over (b) the principal amount of such note.
On or after July 15, 2016, the Company may redeem some or all of the 2020 Notes at any time or from time to time at the redemption prices (expressed as percentages of the principal amount) set forth in the following table plus accrued and unpaid interest, if any, to the applicable redemption date, if redeemed during the 12-month period beginning July 15 of the years indicated below:
Year
|
Percentage | |||
|---|---|---|---|---|
2016 |
104.875 | |||
2017 |
102.438 | |||
2018 and thereafter |
100.000 | |||
In addition, upon a change of control of the Company, holders of the 2020 Notes will have the right to require the Company to repurchase all or any part of their notes for cash at a price equal to 101% of the aggregate principal amount of the notes repurchased, plus any accrued and unpaid interest. The 2020 Notes were issued under and governed by an Indenture dated July 16, 2012, between the Company, U.S. Bank National Association, as trustee and the Company's subsidiaries named therein as guarantors. The indenture governing the 2020 Notes contains affirmative and negative covenants that are substantially the same as those contained in the indenture governing the 2022 Notes, described above.
In conjunction with the issuance of the 2020 Notes, the Company recorded a discount of approximately $10.2 million to be amortized over the remaining life of the 2020 Notes using the effective interest method. The remaining unamortized discount was $1.9 million at December 31, 2015. In conjunction with the issuance of the additional 2020 Notes, the Company recorded a premium of approximately $11.0 million to be amortized over the remaining life of the additional 2020 Notes using the effective interest method. The remaining unamortized premium was approximately $2.6 million at December 31, 2015.
During the second quarter of 2015, the Company entered into several exchange agreements with holders of the Company's 2020 Notes in which they agreed to exchange an aggregate $190.0 million principal amount of their senior notes for approximately 21.2 million shares of the Company's common stock. The exchanges closed on various dates from April 13, 2015 through May 4, 2015, at which time
114
HALCÓN RESOURCES CORPORATION
NOTES TO THE CONSOLIDATED FINANCIAL STATEMENTS (Continued)
5. LONG-TERM DEBT (Continued)
the Company also paid all accrued and unpaid interest since the prior interest payment date for the 2020 Notes. See "Senior Notes Exchanged for Common Stock" below for more details.
On September 10, 2015, the Company closed several separate, privately negotiated exchange agreements with holders of the Company's 2020 Notes in which they agreed to exchange an aggregate $497.2 million principal amount of their senior unsecured notes for approximately $323.1 million aggregate principal amount of Third Lien Notes. At closing, the Company paid all accrued and unpaid interest since the prior interest payment date in July 2015.
On December 21, 2015, the Company closed an exchange offer through a public tender to holders of the Company's 2020 Notes in which they agreed to exchange an aggregate $116.6 million principal amount of their senior unsecured notes for approximately $45.4 million aggregate principal amount of new 2022 Second Lien Notes. At closing, the Company paid all accrued and unpaid interest since the prior interest payment date in July 2015.
During the fourth quarter of 2015, the Company repurchased $6.2 million principal amount of the Company's 2020 Notes for cash. At closing, the Company paid all accrued and unpaid interest since the prior interest payment date in July 2015. As of December 31, 2015, $340.0 million principal amount of the Company's 2020 Notes remained outstanding.
Subsequent to December 31, 2015, the Company repurchased an additional $24.5 million principal amount of the 2020 Notes for cash at prevailing market prices at the time of the transactions. Upon settlement of the repurchases, the Company paid all accrued and unpaid interest since the prior interest payment date of the 2020 Notes.
8.0% Convertible Note
On February 8, 2012, the Company issued to HALRES, LLC (HALRES), a note in the principal amount of $275.0 million due 2017 (the Convertible Note) together with five year warrants (February 2012 Warrants) for an aggregate purchase price of $275.0 million. The Convertible Note bears interest at a rate of 8% per annum, payable quarterly on March 31, June 30, September 30 and December 31 of each year. Through the March 31, 2014 interest payment date, the Company was permitted to elect to pay the interest in kind, by adding to the principal of the Convertible Note, all or any portion of the interest due on the Convertible Note. The Company elected to pay the interest in kind on March 31, June 30 and September 30, 2012, and added $3.2 million, $5.7 million and $5.8 million of interest incurred, respectively, to the Convertible Note, increasing the principal amount to $289.7 million. The Company did not elect to pay-in-kind interest for the subsequent quarterly payments. The Convertible Note is a senior unsecured obligation of the Company.
On March 9, 2015, the Company entered into an amendment (the HALRES Note Amendment) to its Convertible Note. The HALRES Note Amendment extends the maturity date of the Convertible Note by three years, from February 8, 2017 to February 8, 2020. The Convertible Note originally provided for prepayment without premium or penalty at any time after February 8, 2014, at which time it also became convertible into shares of the Company's common stock at a conversion price of $22.50 per share. These dates have been extended pursuant to the HALRES Note Amendment and the conversion price has been adjusted, such that at any time after March 9, 2017, the Company may prepay the Convertible Note without premium or penalty, and HALRES may elect to convert all or any portion of unpaid principal and interest outstanding under the Convertible Note to shares of the Company's common stock at a conversion price of $12.20 per share, subject to adjustments for stock
115
HALCÓN RESOURCES CORPORATION
NOTES TO THE CONSOLIDATED FINANCIAL STATEMENTS (Continued)
5. LONG-TERM DEBT (Continued)
splits and other customary anti-dilution provisions as set forth in the Convertible Note. At the same time, the Company also entered into an amendment to the February 2012 Warrants (the Warrant Amendment) which extended the term of the February 2012 Warrants from February 8, 2017 to February 8, 2020 and adjusted the exercise price of the February 2012 Warrants from $22.50 to $12.20 per share.
In connection with the HALRES Note Amendment and the Warrant Amendment (the Amendments), the Company and HALRES also amended and restated the Registration Rights Agreement, dated February 8, 2012, as amended (the Amended Registration Rights Agreement), which provides for certain demand and piggyback registration rights for the shares of the Company's common stock issuable upon conversion of the Convertible Note and exercise of the February 2012 Warrants. The Amendments were approved by the Company's stockholders on May 6, 2015, in accordance with the rules of the New York Stock Exchange.
The Company accounted for the HALRES Note Amendment as a debt extinguishment because the change in the fair value of the embedded conversion option immediately before and after the modification was at least 10% of the carrying amount of the original Convertible Note immediately prior to the modification. The $7.3 million difference between the unamortized original issuance discount of $18.6 million and the post-amendment discount of $25.9 million, net of $1.4 million of unamortized initial issuance costs, resulted in a net gain recorded in "Gain (loss) on extinguishment of Convertible Note and modification of February 2012 Warrants" in the consolidated statements of operations. See Note 11, "Stockholders' Equity" for further discussion of the Warrant Amendment. The remaining unamortized discount was $23.0 million at December 31, 2015.
Senior Notes Exchanged for Common Stock
During the second quarter of 2015, the Company entered into several exchange agreements with existing holders of the Company's senior unsecured notes in which the holders agreed to exchange an aggregate $258.0 million principal amount of their senior notes for approximately 29.0 million shares of the Company's common stock.
On May 7, 2015, the Company entered into an exchange agreement with Union Square Park Partners, L.P., a holder of the Company's 2022 Notes and 2021 Notes, pursuant to which it agreed to exchange approximately $5.8 million principal amount of such notes for approximately 0.7 million shares of the Company's common stock, resulting in an effective exchange price of $8.50 per share. Of the aggregate $5.8 million principal amount of senior notes to be exchanged by the holders, approximately $2.0 million was principal amount of 2022 Notes and approximately $3.8 million was principal amount of 2021 Notes. The exchange closed on May 15, 2015, at which time the Company also paid all accrued and unpaid interest on the notes since the prior interest payment date for each of the 2022 Notes and 2021 Notes.
On April 24, 2015, the Company entered into an exchange agreement with several investment funds advised by Pioneer Investments, each of which was a holder of the Company's 2020 Notes, 2021 Notes and 2022 Notes (the Senior Notes), pursuant to which the funds agreed to exchange an aggregate $25.0 million principal amount of the Senior Notes for approximately 3.0 million shares of the Company's common stock, resulting in an effective exchange price of $8.45 per share. Of the aggregate $25.0 million principal amount of Senior Notes to be exchanged by the holders, approximately $2.8 million was principal amount of 2020 Notes, approximately $16.8 million was
116
HALCÓN RESOURCES CORPORATION
NOTES TO THE CONSOLIDATED FINANCIAL STATEMENTS (Continued)
5. LONG-TERM DEBT (Continued)
principal amount of 2021 Notes and approximately $5.4 million was principal amount of 2022 Notes. The exchanges closed on various dates from April 30, 2015 through May 4, 2015, at which time the Company also paid all accrued and unpaid interest since the relevant prior interest payment dates for each of the Senior Notes.
On April 22, 2015, the Company entered into an exchange agreement with J.P. Morgan Securities LLC, a holder of the Company's 2021 Notes, pursuant to which it agreed to exchange approximately $40.0 million principal amount of such notes for approximately 4.4 million shares of the Company's common stock, resulting in an effective exchange price of $9.00 per share. The exchange closed on April 29, 2015, at which time the Company also paid all accrued and unpaid interest on the notes since the prior interest payment date in November 2014.
On April 15, 2015, the Company entered into an exchange agreement with Goldman Sachs Asset Management, L.P., on behalf of certain of its funds and accounts which held the Company's 2020 Notes, pursuant to which the holders agreed to exchange approximately $70.7 million principal amount of such notes for approximately 7.8 million shares of the Company's common stock, resulting in an effective exchange price of $9.10 per share. The exchanges closed on various dates from April 22, 2015 through April 28, 2015, at which time the Company also paid all accrued and unpaid interest on the notes since the prior interest payment date in January 2015.
On April 7, 2015, the Company entered into an exchange agreement with two investment funds advised by Franklin Templeton Investments, each of which was a holder of the Company's 2020 Notes, pursuant to which the funds agreed to exchange an aggregate $116.5 million principal amount of such notes for approximately 13.1 million shares of the Company's common stock, resulting in an effective exchange price of $8.90 per share. The exchange closed on April 13, 2015, at which time the Company also paid all accrued and unpaid interest on the notes since the prior interest payment date in January 2015.
The Company recorded the issuance of common shares at fair value on the various dates the debt for equity exchanges occurred and recognized a $22.8 million net gain on the extinguishment of debt, as a $26.6 million gain on the exchanges was partially offset by the writedown of $3.8 million associated with related issuance costs and discounts and premiums for the respective notes. The net gain is recorded in "Gain (loss) on extinguishment of debt" in the consolidated statements of operations.
Debt Maturities
Aggregate maturities required on long-term debt at December 31, 2015 due in future years are as follows (in thousands, excluding discounts, premiums and debt issuance costs):
2016 |
$ | — | ||
2017 |
— | |||
2018 |
— | |||
2019 |
62,000 | |||
2020 |
1,329,704 | |||
Thereafter |
1,532,434 | |||
| | | | | |
Total |
$ | 2,924,138 | ||
| | | | | |
| | | | | |
| | | | | |
117
HALCÓN RESOURCES CORPORATION
NOTES TO THE CONSOLIDATED FINANCIAL STATEMENTS (Continued)
5. LONG-TERM DEBT (Continued)
Debt Issuance Costs
The Company capitalizes certain direct costs associated with the issuance of long-term debt and amortizes such costs over the lives of the respective debt. During 2015, the Company capitalized $30.7 million associated with the issuance of the 2020 Second Lien Notes, the 2022 Second Lien Notes, the Third Lien Notes and amendments to its Senior Credit Agreement. The Company expensed $37.3 million of debt issuance costs in conjunction with the exchanges of unsecured notes for secured notes, the debt repurchases, the debt for equity exchanges, the debt extinguishment for the HALRES Note Amendment, and decreases in the Company's borrowing base under the Senior Credit Agreement. At December 31, 2015 and 2014, the Company had approximately $40.3 million and $55.9 million, respectively, of debt issuance costs remaining that are being amortized over the lives of the respective debt. The Company adopted ASU 2015-03 and ASU 2015-15 for the consolidated balance sheets included herein and accordingly presented the debt issuance costs for the Senior Credit Agreement in "Debt issuance costs, net" within total assets, and the debt issuance costs for the Company's senior secured and unsecured debt in "Long-term debt, net" within total liabilities.
6. FAIR VALUE MEASUREMENTS
Pursuant to ASC 820, the Company's determination of fair value incorporates not only the credit standing of the counterparties involved in transactions with the Company resulting in receivables on the Company's consolidated balance sheets, but also the impact of the Company's nonperformance risk on its own liabilities. ASC 820 defines fair value as the price that would be received to sell an asset or paid to transfer a liability in an orderly transaction between market participants at the measurement date (exit price). ASC 820 establishes a fair value hierarchy that prioritizes the inputs to valuation techniques used to measure fair value. The hierarchy assigns the highest priority to unadjusted quoted prices in active markets for identical assets or liabilities (Level 1) and the lowest priority to unobservable inputs (Level 3). Level 2 measurements are inputs that are observable for assets or liabilities, either directly or indirectly, other than quoted prices included within Level 1. The Company utilizes market data or assumptions that market participants would use in pricing the asset or liability, including assumptions about risk and the risks inherent in the inputs to the valuation technique. These inputs can be readily observable, market corroborated, or generally unobservable. The Company classifies fair value balances based on the observability of those inputs.
The following tables set forth by level within the fair value hierarchy the Company's financial assets and liabilities that were accounted for at fair value as of December 31, 2015 and 2014. As required by ASC 820, a financial instrument's level within the fair value hierarchy is based on the lowest level of input that is significant to the fair value measurement. The Company's assessment of the significance of a particular input to the fair value measurement requires judgment, and may affect the
118
HALCÓN RESOURCES CORPORATION
NOTES TO THE CONSOLIDATED FINANCIAL STATEMENTS (Continued)
6. FAIR VALUE MEASUREMENTS (Continued)
valuation of fair value assets and liabilities and their placement within the fair value hierarchy levels. There were no transfers between fair value hierarchy levels for the year ended December 31, 2015.
| |
December 31, 2015 | ||||||||||||
|---|---|---|---|---|---|---|---|---|---|---|---|---|---|
| |
Level 1 | Level 2 | Level 3 | Total | |||||||||
| |
(In thousands) |
||||||||||||
Assets |
|||||||||||||
Receivables from derivative contracts |
$ | — | $ | 365,475 | $ | — | $ | 365,475 | |||||
| | | | | | | | | | | | | | |
| | | | | | | | | | | | | | |
| | | | | | | | | | | | | | |
Liabilities |
|||||||||||||
Liabilities from derivative contracts |
$ | — | $ | 105 | $ | 185 | $ | 290 | |||||
| | | | | | | | | | | | | | |
| | | | | | | | | | | | | | |
| | | | | | | | | | | | | | |
| |
December 31, 2014 | ||||||||||||
|---|---|---|---|---|---|---|---|---|---|---|---|---|---|
| |
Level 1 | Level 2 | Level 3 | Total | |||||||||
| |
(In thousands) |
||||||||||||
Assets |
|||||||||||||
Receivables from derivative contracts |
$ | — | $ | 503,854 | $ | — | $ | 503,854 | |||||
| | | | | | | | | | | | | | |
| | | | | | | | | | | | | | |
| | | | | | | | | | | | | | |
Liabilities |
|||||||||||||
Liabilities from derivative contracts |
$ | — | $ | 8,068 | $ | 1,319 | $ | 9,387 | |||||
| | | | | | | | | | | | | | |
| | | | | | | | | | | | | | |
| | | | | | | | | | | | | | |
Derivative contracts listed above as Level 2 include collars, swaps and swaptions that are carried at fair value. The Company records the net change in the fair value of these positions in "Net gain (loss) on derivative contracts" in the Company's consolidated statements of operations. The Company is able to value the assets and liabilities based on observable market data for similar instruments, which resulted in the Company reporting its derivatives as Level 2. This observable data includes the forward curves for commodity prices based on quoted markets prices and implied volatility factors related to changes in the forward curves. See Note 7, "Derivative and Hedging Activities" for additional discussion of derivatives.
Derivative contracts listed above as Level 3 include extendable collars that are carried at fair value. The significant unobservable inputs for these Level 3 contracts include unpublished forward strip prices and market volatilities. The following table sets forth a reconciliation of changes in the fair value of the Company's extendable collar contracts classified as Level 3 in the fair value hierarchy (in thousands):
| |
Significant Unobservable Inputs (Level 3) |
||||||
|---|---|---|---|---|---|---|---|
| |
December 31, | ||||||
| |
2015 | 2014 | |||||
Beginning Balance |
$ | (1,319 | ) | $ | (2,816 | ) | |
Net gain (loss) on derivative contracts |
1,134 | 1,497 | |||||
| | | | | | | | |
Ending Balance |
$ | (185 | ) | $ | (1,319 | ) | |
| | | | | | | | |
| | | | | | | | |
| | | | | | | | |
Change in unrealized gains (losses) included in earnings related to derivatives still held as of December 31, 2015 and 2014 |
$ | (185 | ) | $ | 1,497 | ||
| | | | | | | | |
| | | | | | | | |
| | | | | | | | |
119
HALCÓN RESOURCES CORPORATION
NOTES TO THE CONSOLIDATED FINANCIAL STATEMENTS (Continued)
6. FAIR VALUE MEASUREMENTS (Continued)
As of December 31, 2015 and 2014, the Company's derivative contracts were with major financial institutions with investment grade credit ratings which are believed to have a minimal credit risk. As such, the Company is exposed to credit risk to the extent of nonperformance by the counterparties in the derivative contracts; however, the Company does not anticipate such nonperformance.
The following disclosure of the estimated fair value of financial instruments is made in accordance with the requirements of ASC 825, Financial Instruments. The estimated fair value amounts have been determined at discrete points in time based on relevant market information. These estimates involve uncertainties and cannot be determined with precision. The estimated fair value of cash, accounts receivable and accounts payable approximates their carrying value due to their short-term nature. The estimated fair value of the Company's Senior Credit Agreement approximates carrying value because the interest rates approximate current market rates. The following table presents the estimated fair values of the Company's fixed interest rate, long-term debt instruments as of December 31, 2015 and 2014 (excluding discounts, premiums and debt issuance costs):
| |
December 31, 2015 | December 31, 2014 | |||||||||||
|---|---|---|---|---|---|---|---|---|---|---|---|---|---|
Debt
|
Principal Amount |
Estimated Fair Value |
Principal Amount |
Estimated Fair Value |
|||||||||
| |
(In thousands) |
||||||||||||
8.625% senior secured second lien notes |
700,000 | $ | 479,500 | $ | — | $ | — | ||||||
12.0% senior secured second lien notes |
112,826 | 77,286 | — | — | |||||||||
13.0% senior secured third lien notes |
1,017,970 | 333,385 | — | — | |||||||||
9.25% senior notes |
52,694 | 14,422 | 400,000 | 300,000 | |||||||||
8.875% senior notes |
348,944 | 95,506 | 1,350,000 | 1,005,750 | |||||||||
9.75% senior notes |
340,035 | 93,068 | 1,150,000 | 872,862 | |||||||||
8.0% convertible note |
289,669 | 87,393 | 289,669 | 260,643 | |||||||||
| | | | | | | | | | | | | | |
|
$ | 2,862,138 | $ | 1,180,560 | $ | 3,189,669 | $ | 2,439,255 | |||||
| | | | | | | | | | | | | | |
| | | | | | | | | | | | | | |
| | | | | | | | | | | | | | |
The fair value of the Company's fixed interest debt instruments was calculated using Level 2 criteria at December 31, 2015 and 2014. The fair value of the Company's senior notes is based on quoted market prices from trades of such debt. The fair value of the Company's convertible note is based on published market prices and risk-free rates.
During the second quarter of 2015, the Company entered into several exchange agreements with holders of the company's senior unsecured notes in which they agreed to exchange their senior notes for shares of the Company's common stock. The fair value of the common shares issued was determined by using quoted market prices of the Company's common stock, which is considered Level 1 criteria in the fair value hierarchy. See Note 5, "Long-term Debt," for further discussion of the exchanges and the net gain recorded on the transactions.
As discussed in Note 5, "Long-term Debt" and in Note 11, "Stockholders' Equity," on May 6, 2015, the HALRES Note Amendment and the Warrant Amendment became effective. The fair value estimates for the Convertible Note and the February 2012 Warrants include the use of observable inputs such as the Company's stock price, expected volatility, and credit spread and the risk-free rate. The use of these observable inputs results in the fair value estimates being classified as Level 2.
120
HALCÓN RESOURCES CORPORATION
NOTES TO THE CONSOLIDATED FINANCIAL STATEMENTS (Continued)
6. FAIR VALUE MEASUREMENTS (Continued)
On June 16, 2014, HK TMS, LLC, a subsidiary of the Company, entered into a transaction to develop its Tuscaloosa Marine Shale assets with funds and accounts managed by affiliates of Apollo Global Management, LLC and on June 1, 2015 amended this agreement. See Note 10, "Mezzanine Equity," for a discussion of the valuation approach used to allocate the investment proceeds to the transaction's components, for the valuation approach used to fair value the transactions components upon the amendments, for the classification of the estimate within the fair value hierarchy, and for a reconciliation of the beginning and ending balances for the redeemable non-controlling interest, tranche rights and the embedded derivative.
During the years ended December 31, 2014 and 2013, the Company recorded a non-cash impairment charge of $35.6 million and $67.5 million, respectively, related to its gas gathering systems and other operating assets. See Note 1, "Summary of Significant Events and Accounting Policies," for a discussion of the valuation approach used and the classification of the estimate within the fair value hierarchy.
As of July 1, 2013, the Company performed its annual goodwill impairment test which involved the fair value estimation of the Company's reporting unit. See Note 1, "Summary of Significant Events and Accounting Policies," for a discussion of the valuation approaches used and the classification of the estimate within the fair value hierarchy.
The Company follows the provisions of ASC 820, for nonfinancial assets and liabilities measured at fair value on a non-recurring basis. These provisions apply to the Company's initial recognition of asset retirement obligations for which fair value is used. The asset retirement obligation estimates are derived from historical costs and management's expectation of future cost environments; and therefore, the Company has designated these liabilities as Level 3. See Note 8, "Asset Retirement Obligations," for a reconciliation of the beginning and ending balances of the liability for the Company's asset retirement obligations.
7. DERIVATIVE AND HEDGING ACTIVITIES
The Company is exposed to certain risks relating to its ongoing business operations, such as commodity price risk and interest rate risk. Derivative contracts are utilized to hedge the Company's exposure to price fluctuations and reduce the variability in the Company's cash flows associated with anticipated sales of future oil and natural gas production. When derivative contracts are available at terms (or prices) acceptable to the Company, it generally hedges a substantial, but varying, portion of anticipated oil and natural gas production for future periods. Derivatives are carried at fair value on the consolidated balance sheets as assets or liabilities, with the changes in the fair value included in the consolidated statements of operations for the period in which the change occurs. The Company's hedge policies and objectives may change significantly as its operational profile changes and/or commodities prices change. The Company does not enter into derivative contracts for speculative trading purposes.
It is the Company's policy to enter into derivative contracts only with counterparties that are creditworthy financial institutions deemed by management as competent and competitive market makers. The Company did not post collateral under any of its derivative contracts as they are secured under the Company's Senior Credit Agreement or are uncollateralized trades.
The Company's crude oil and natural gas derivative positions at any point in time may consist of swaps, swaptions, costless put/call "collars," extendable costless collars and deferred put options. Swaps
121
HALCÓN RESOURCES CORPORATION
NOTES TO THE CONSOLIDATED FINANCIAL STATEMENTS (Continued)
7. DERIVATIVE AND HEDGING ACTIVITIES (Continued)
are designed so that the Company receives or makes payments based on a differential between fixed and variable prices for crude oil and natural gas. Swaptions are swap contracts that may be extended annually at the option of the counterparty on a designated date. A costless collar consists of a sold call, which establishes a maximum price the Company will receive for the volumes under contract and a purchased put that establishes a minimum price. Extendable collars are costless put/call contracts that may be extended annually at the option of the counterparty on a designated date. A sold put option limits the exposure of the counterparty's risk should the price fall below the strike price. Sold put options limit the effectiveness of purchased put options at the low end of the put/call collars to market prices in excess of the strike price of the put option sold. The Company has elected to not designate any of its derivative contracts for hedge accounting. Accordingly, the Company records the net change in the mark-to-market valuation of these derivative contracts, as well as all payments and receipts on settled derivative contracts, in "Net gain (loss) on derivative contracts" on the consolidated statements of operations.
At December 31, 2015, the Company had 36 open commodity derivative contracts summarized in the following tables: one natural gas collar arrangement, 16 crude oil collar arrangements, 13 crude oil swaps, five crude oil swaptions and one crude oil extendable collar.
At December 31, 2014, the Company had 72 open commodity derivative contracts summarized in the following tables: four natural gas collar arrangements, 42 crude oil collar arrangements, 16 crude oil swaps, eight crude oil swaptions and two crude oil extendable collars.
All derivative contracts are recorded at fair market value in accordance with ASC 815 and ASC 820 and included in the consolidated balance sheets as assets or liabilities. The following table summarizes the location and fair value amounts of all derivative contracts in the consolidated balance sheets as of December 31, 2015 and 2014:
| |
|
Asset derivative contracts |
|
Liability derivative contracts |
|||||||||||||
|---|---|---|---|---|---|---|---|---|---|---|---|---|---|---|---|---|---|
| |
|
December 31, | |
December 31, | |||||||||||||
Derivatives not designated as hedging contracts under ASC 815 |
|
|
|||||||||||||||
| Balance sheet location | 2015 | 2014 | Balance sheet location | 2015 | 2014 | ||||||||||||
| |
|
(In thousands) |
|
(In thousands) |
|||||||||||||
Commodity contracts |
Current assets—receivables from derivative contracts | $ | 348,861 | $ | 352,530 | Current liabilities—liabilities from derivative contracts | $ | — | $ | — | |||||||
Commodity contracts |
Other noncurrent assets—receivables from derivative contracts | 16,614 | 151,324 | Other noncurrent liabilities—liabilities from derivative contracts | (290 | ) | (9,387 | ) | |||||||||
| | | | | | | | | | | | | | | | | | |
Total derivatives not designated as hedging contracts under ASC 815 |
$ | 365,475 | $ | 503,854 | $ | (290 | ) | $ | (9,387 | ) | |||||||
| | | | | | | | | | | | | | | | | | |
| | | | | | | | | | | | | | | | | | |
| | | | | | | | | | | | | | | | | | |
122
HALCÓN RESOURCES CORPORATION
NOTES TO THE CONSOLIDATED FINANCIAL STATEMENTS (Continued)
7. DERIVATIVE AND HEDGING ACTIVITIES (Continued)
The following table summarizes the location and amounts of the Company's realized and unrealized gains and losses on derivative contracts in the Company's consolidated statements of operations:
| |
|
Amount of gain or (loss) recognized in income on derivative contracts for the year ended December 31, |
||||||||||
|---|---|---|---|---|---|---|---|---|---|---|---|---|
Derivatives not designated as hedging contracts under ASC 815 |
Location of gain or (loss) recognized in income on derivative contracts |
|||||||||||
| 2015 | 2014 | 2013 | ||||||||||
| |
|
(In thousands) |
||||||||||
Commodity contracts: |
||||||||||||
Unrealized gain (loss) on commodity contracts |
Other income (expenses)—net gain (loss) on derivative contracts | $ | (129,282 | ) | $ | 506,526 | $ | (10,150 | ) | |||
Realized gain (loss) on commodity contracts |
Other income (expenses)—net gain (loss) on derivative contracts | 439,546 | 12,430 | (21,083 | ) | |||||||
| | | | | | | | | | | | | |
Total net gain (loss) on derivative contracts |
Other income (expenses)—net gain (loss) on derivative contracts | $ | 310,264 | $ | 518,956 | $ | (31,233 | ) | ||||
| | | | | | | | | | | | | |
| | | | | | | | | | | | | |
| | | | | | | | | | | | | |
At December 31, 2015 and 2014, the Company had the following open crude oil and natural gas derivative contracts:
| |
|
|
December 31, 2015 | |||||||||||||||
|---|---|---|---|---|---|---|---|---|---|---|---|---|---|---|---|---|---|---|
| |
|
|
|
Floors | Ceilings | |||||||||||||
Period
|
Instrument | Commodity | Volume in Mmbtu's/ Bbl's |
Price/ Price Range |
Weighted Average Price |
Price/ Price Range |
Weighted Average Price |
|||||||||||
January 2016 - June 2016 |
Collars | Crude Oil | 182,000 | $90.00 | $ | 90.00 | $96.85 | $ | 96.85 | |||||||||
January 2016 - December 2016 |
Collars | Natural Gas | 732,000 | 4.00 | 4.00 | 4.22 | 4.22 | |||||||||||
January 2016 - December 2016(1) |
Collars | Crude Oil | 4,392,000 | 60.00 - 90.00 | 71.91 | 64.00 - 95.10 | 77.71 | |||||||||||
January 2016 - December 2016(2) |
Swaps | Crude Oil | 4,758,000 | 62.00 - 91.73 | 85.43 | |||||||||||||
January 2017 - December 2017 |
Collars | Crude Oil | 1,368,750 | 50.00 - 60.00 | 57.33 | 70.00 - 76.84 | 74.16 | |||||||||||
- (1)
- Includes an outstanding crude oil collar which may be extended by the counterparty at a floor of $60.00 per Bbl and a ceiling of
$75.00 per Bbl for a total of 365,000 Bbls for the year ended December 31, 2017.
- (2)
- Includes an outstanding crude oil swap which may be extended by the counterparty at a price of $88.25 per Bbl for a total of 730,000 Bbls for the year ended December 31, 2017. Also includes certain outstanding crude oil swaps which may be extended by the counterparty at a price of $88.00 per Bbl totaling 912,500 Bbls for the year ended December 31, 2017. Includes an outstanding crude oil swap which may be extended by the counterparty at a price of $88.87 per Bbl totaling 547,500 Bbls for the year ended December 31, 2017.
123
HALCÓN RESOURCES CORPORATION
NOTES TO THE CONSOLIDATED FINANCIAL STATEMENTS (Continued)
7. DERIVATIVE AND HEDGING ACTIVITIES (Continued)
| |
|
|
December 31, 2014 | |||||||||||||||
|---|---|---|---|---|---|---|---|---|---|---|---|---|---|---|---|---|---|---|
| |
|
|
|
Floors | Ceilings | |||||||||||||
Period
|
Instrument | Commodity | Volume in Mmbtu's/ Bbl's |
Price/ Price Range |
Weighted Average Price |
Price/ Price Range |
Weighted Average Price |
|||||||||||
January 2015 - June 2015 |
Collars | Crude Oil | 1,583,750 | $85.00 - 90.00 | $ | 86.29 | $91.00 - 98.50 | $ | 93.14 | |||||||||
January 2015 - December 2015(1) |
Collars | Crude Oil | 6,205,000 | 82.50 - 90.00 | 86.47 | 90.00 - 100.25 | 94.39 | |||||||||||
January 2015 - December 2015 |
Collars | Natural Gas | 6,387,500 | 4.00 | 4.00 | 4.55 - 4.85 | 4.68 | |||||||||||
January 2015 - December 2015(2) |
Swaps | Crude Oil | 1,825,000 | 91.00 - 92.75 | 91.76 | |||||||||||||
March 2015 - December 2015 |
Collars | Crude Oil | 306,000 | 87.50 | 87.50 | 92.50 | 92.50 | |||||||||||
April 2015 - December 2015 |
Collars | Crude Oil | 412,500 | 87.50 | 87.50 | 92.50 | 92.50 | |||||||||||
July 2015 - December 2015 |
Collars | Crude Oil | 1,104,000 | 85.00 - 87.50 | 85.83 | 90.00 - 92.50 | 90.92 | |||||||||||
January 2016 - June 2016 |
Collars | Crude Oil | 182,000 | 90.00 | 90.00 | 96.85 | 96.85 | |||||||||||
January 2016 - December 2016 |
Collars | Crude Oil | 1,830,000 | 87.50 - 90.00 | 88.55 | 92.70 - 95.10 | 93.84 | |||||||||||
January 2016 - December 2016 |
Collars | Natural Gas | 732,000 | 4.00 | 4.00 | 4.22 | 4.22 | |||||||||||
January 2016 - December 2016(3) |
Swaps | Crude Oil | 4,026,000 | 88.00 - 91.73 | 89.65 | |||||||||||||
- (1)
- Includes an outstanding crude oil collar which may be extended by the counterparty at a floor of $85.00 per Bbl and a ceiling of
$96.20 per Bbl for a total of 732,000 Bbls for the year ended December 31, 2016. Also includes an outstanding crude oil collar which may be extended by the counterparty at a floor of $85.00 per
Bbl and a ceiling of $96.00 per Bbl for a total of 366,000 Bbls for the year ended December 31, 2016.
- (2)
- Includes an outstanding crude oil swap which may be extended by the counterparty at a price of $91.25 per Bbl for 732,000 Bbls
for the year ended December 31, 2016. Also includes certain outstanding crude oil swaps which may be extended by the counterparty at a price of $91.00 per Bbl totaling 366,000 Bbls for the year
ended December 31, 2016.
- (3)
- Includes an outstanding crude oil swap which may be extended by the counterparty at a price of $88.25 per Bbl for a total of 730,000 Bbls for the year ended December 31, 2017. Also includes certain outstanding crude oil swaps which may be extended by the counterparty at a price of $88.00 per Bbl totaling 912,500 Bbls for the year ended December 31, 2017. Includes an outstanding crude oil swap which may be extended by the counterparty at a price of $88.87 per Bbl totaling 547,500 Bbls for the year ended December 31, 2017.
The Company presents the fair value of its derivative contracts at the gross amounts in the consolidated balance sheets. The following table shows the potential effects of master netting arrangements on the fair value of the Company's derivative contracts at December 31, 2015 and 2014:
| |
Derivative Assets | Derivative Liabilities |
|||||||||||
|---|---|---|---|---|---|---|---|---|---|---|---|---|---|
| |
December 31, | December 31, | |||||||||||
Offsetting of Derivative Assets and Liabilities
|
2015 | 2014 | 2015 | 2014 | |||||||||
| |
(In thousands) |
(In thousands) |
|||||||||||
Gross amounts presented in the consolidated balance sheet |
$ | 365,475 | $ | 503,854 | $ | (290 | ) | $ | (9,387 | ) | |||
Amounts not offset in the consolidated balance sheet |
(53 | ) | (9,655 | ) | 52 | 9,387 | |||||||
| | | | | | | | | | | | | | |
Net amount |
$ | 365,422 | $ | 494,199 | $ | (238 | ) | $ | — | ||||
| | | | | | | | | | | | | | |
| | | | | | | | | | | | | | |
| | | | | | | | | | | | | | |
The Company enters into an International Swap Dealers Association Master Agreement (ISDA) with each counterparty prior to a derivative contract with such counterparty. The ISDA is a standard contract that governs all derivative contracts entered into between the Company and the respective counterparty. The ISDA allows for offsetting of amounts payable or receivable between the Company and the counterparty, at the election of both parties, for transactions that occur on the same date and in the same currency.
124
HALCÓN RESOURCES CORPORATION
NOTES TO THE CONSOLIDATED FINANCIAL STATEMENTS (Continued)
8. ASSET RETIREMENT OBLIGATIONS
The Company records an asset retirement obligation (ARO) when it can reasonably estimate the fair value of an obligation to perform site reclamation, dismantle facilities or plug and abandon costs. For gas gathering systems and equipment, the Company records an ARO when the system is placed in service and it can reasonably estimate the fair value of an obligation to perform site reclamation and other necessary work when it is required. The Company records the ARO liability on the consolidated balance sheets and capitalizes a portion of the cost in "Oil and natural gas properties" or "Other operating property and equipment" during the period in which the obligation is incurred. The Company records the accretion of its ARO liabilities in "Depletion, depreciation and accretion" expense in the consolidated statements of operations. The additional capitalized costs are depreciated on a unit-of-production basis or straight-line basis.
The Company recorded the following activity related to its ARO liability for the years ended December 31, 2015 and 2014 (in thousands, inclusive of the current portion):
Liability for asset retirement obligation as of December 31, 2013 |
$ | 39,257 | ||
Liabilities settled and divested(1) |
(9,367 | ) | ||
Additions |
4,171 | |||
Acquisitions |
181 | |||
Accretion expense |
1,822 | |||
Revisions in estimated cash flows |
2,413 | |||
| | | | | |
Liability for asset retirement obligation as of December 31, 2014 |
$ | 38,477 | ||
Liabilities settled and divested |
(324 | ) | ||
Additions |
3,209 | |||
Accretion expense |
1,797 | |||
Revisions in estimated cash flows |
3,857 | |||
| | | | | |
Liability for asset retirement obligation as of December 31, 2015 |
$ | 47,016 | ||
| | | | | |
| | | | | |
| | | | | |
- (1)
- See Note 3, "Acquisitions and Divestitures" for additional information on the Company's divestiture activities in 2014.
9. COMMITMENTS AND CONTINGENCIES
Commitments
The Company leases corporate office space in Houston, Texas; and Denver, Colorado as well as a number of other field office locations. In addition, the Company has lease commitments for certain equipment under long-term operating lease agreements. The office and equipment operating lease agreements expire on various dates through 2024. Rent expense was approximately $8.6 million, $8.1 million and $8.7 million for the years ended December 31, 2015, 2014 and 2013, respectively.
125
HALCÓN RESOURCES CORPORATION
NOTES TO THE CONSOLIDATED FINANCIAL STATEMENTS (Continued)
9. COMMITMENTS AND CONTINGENCIES (Continued)
Approximate future minimum lease payments for subsequent annual periods for all non-cancelable operating leases as of December 31, 2015 are as follows (in thousands):
2016 |
$ | 8,875 | ||
2017 |
9,053 | |||
2018 |
9,291 | |||
2019 |
9,020 | |||
2020 |
6,838 | |||
Thereafter |
7,957 | |||
| | | | | |
Total |
$ | 51,034 | ||
| | | | | |
| | | | | |
| | | | | |
As of December 31, 2015, the Company has the following active drilling rig commitments (in thousands):
2016 |
$ | 17,742 | ||
2017 |
10,220 | |||
2018 |
3,360 | |||
2019 |
— | |||
2020 |
— | |||
Thereafter |
— | |||
| | | | | |
Total |
$ | 31,322 | ||
| | | | | |
| | | | | |
| | | | | |
As of December 31, 2015, early termination of these drilling rig commitments would require termination penalties of $21.9 million, which would be in lieu of paying the remaining drilling rig commitments of $31.3 million.
In response to the continued decline in crude oil prices, the Company has decreased its planned capital expenditures for 2016. As such, the Company expects to incur stacking charges on certain drilling rig commitments as follows (in thousands):
2016 |
$ | 11,341 | ||
2017 |
8,573 | |||
2018 |
2,068 | |||
2019 |
— | |||
2020 |
— | |||
Thereafter |
— | |||
| | | | | |
Total |
$ | 21,982 | ||
| | | | | |
| | | | | |
| | | | | |
Subsequent to December 31, 2015, the Company entered into an amendment to one of its drilling rig contracts with an original term ending date of August 31, 2016, whereby the Company will early terminate the rig contract, incur a termination fee of approximately $1.3 million and reduce its 2016 drilling commitments by extending part of the contract term on another of its drilling rig contracts out further in 2018. This amendment is not reflected in the tables above and the termination fee will be expensed when incurred.
126
HALCÓN RESOURCES CORPORATION
NOTES TO THE CONSOLIDATED FINANCIAL STATEMENTS (Continued)
9. COMMITMENTS AND CONTINGENCIES (Continued)
In January 2015, the Company made the decision to early terminate a drilling rig contract in response to the decline in crude oil prices, and as such, the Company incurred an early termination fee of $6.0 million, paid over the first half of 2015. If certain requirements are not met by two separate trigger dates, the first being January 1, 2017 and the second being January 12, 2020, the Company may incur up to an additional $3.0 million in connection with this drilling rig contract. This obligation is not included in the tables above.
The Company has other contractual commitments for infrastructure and seismic related expenditures totaling $0.9 million as of December 31, 2015 which are not included in the tables above.
The Company has entered into various long-term gathering, transportation and sales contracts in its Bakken/Three Forks formations in North Dakota which are not included in the tables above. As of December 31, 2015, the Company had in place ten long-term crude oil contracts and six long-term natural gas contracts in this area and the sales prices under these contracts are based on posted market rates. Under the terms of these contracts, the Company has committed a substantial portion of its Bakken/Three Forks production for periods ranging from one to ten years from the date of first production. The Company believes that there are sufficient available reserves and supplies in the Bakken/Three Forks formations to meet its commitments, as the proved reserves from this area represent approximately 83% of its total proved reserves. Historically, the Company has been able to meet its delivery commitments.
On December 20, 2013, the Company entered into a carry and earning agreement, as amended (the Agreement) with an independent third party (Seller) associated with the acquisition of certain properties in the Tuscaloosa Marine Shale (TMS), located primarily in Wilkinson County, Mississippi and in West Feliciana and East Feliciana Parishes, Louisiana. The Agreement required the Company to fund up to $189.4 million (the Carry Amount) in exchange for approximately 117,870 net acres. The Company paid $62.5 million of the Carry Amount at closing on February 28, 2014 and the remaining $126.9 million during the three months ended June 30, 2014, reflected as "Advance on carried interest" in the accompanying consolidated statements of cash flows. The Carry Amount is to be used by the Seller to fund wells in the TMS to be drilled by the Seller (the Carry Wells) on the Seller's retained acreage. As part of the transaction, the Company will also receive a 5% working interest in the Carry Wells. As of December 31, 2015, the Carry Amount was fully expended.
On June 16, 2014, HK TMS, LLC, a subsidiary of the Company entered into a transaction to develop its TMS assets with funds and accounts managed by affiliates of Apollo Global Management, LLC and on June 1, 2015 amended this agreement. See Note 10, "Mezzanine Equity," for a discussion of the drilling obligation associated with the amended transaction.
Contingencies
From time to time, the Company may be a plaintiff or defendant in a pending or threatened legal proceeding arising in the normal course of its business. While the outcome and impact of currently pending legal proceedings cannot be determined, the Company's management and legal counsel believe that the resolution of these proceedings through settlement or adverse judgment will not have a material effect on the Company's consolidated operating results, financial position or cash flows.
127
HALCÓN RESOURCES CORPORATION
NOTES TO THE CONSOLIDATED FINANCIAL STATEMENTS (Continued)
10. MEZZANINE EQUITY
On June 16, 2014, funds and accounts managed by affiliates of Apollo Global Management, LLC (Apollo) contributed $150 million in cash to HK TMS, LLC, a wholly owned Delaware limited liability company (HK TMS), that, as of June 16, 2014 held all of the Company's undeveloped acreage in the TMS formation, located in Mississippi and Louisiana, in exchange for the issuance by HK TMS of 150,000 preferred shares. At the closing, the Company also contributed $50 million in cash to HK TMS. Holders of the HK TMS preferred shares will receive quarterly cash dividends of 8% cumulative perpetual per annum, subject to HK TMS' option to pay such dividends "in-kind" through the issuance of additional preferred shares. The preferred shares will be automatically redeemed and cancelled when the holders receive cash dividends and distributions on the preferred shares equating to the greater of a 12% annual rate of return plus principal and 1.25 times their investment plus applicable fees (the Redemption Price), subject to adjustment under certain circumstances. The preferred shares have a liquidation preference in the event of dissolution in an amount equal to the Redemption Price plus any unpaid dividends not otherwise included in the calculation of the Redemption Price through the date of liquidation payment. HK TMS may also redeem the preferred shares at any time after December 31, 2016 by paying the Redemption Price, or may be required to redeem the preferred shares for the Redemption Price plus certain fees under certain circumstances.
On June 1, 2015, HK TMS and Apollo entered into an amendment to the original agreement (the HK TMS Amendment) which, among other things, i) commits HK TMS to drill a minimum of 6.5 net wells in each of the five consecutive twelve month periods beginning December 31, 2015 and ii) allows for the redemption of preferred shares at the Redemption Price between March 1, 2016 and June 30, 2016 at the election of Apollo to the extent there is available cash above the minimum cash balance, which is discussed further below. For any commitment period in which HK TMS does not meet its drilling obligation, HK TMS must use available cash, above the minimum cash balance, to redeem preferred shares at the Redemption Price.
The preferred shares have been classified as "Redeemable noncontrolling interest" and included in "Mezzanine equity" between total liabilities and stockholders' equity on the consolidated balance sheets pursuant to ASC 480-10-S99-3A. The preferred shares, while not currently redeemable, are considered probable of becoming redeemable and therefore will be subsequently remeasured each reporting period by accreting the initial value to the estimated required redemption value through March 1, 2016. The accretion is presented as a deemed dividend and recorded in "Redeemable noncontrolling interest" on the consolidated balance sheets and within "Preferred dividends and accretion on redeemable noncontrolling interest" on the consolidated statements of operations. In accordance with ASC 480-10-S99-3A, an adjustment to the carrying amount presented in mezzanine equity will be recognized as charges against retained earnings and will reduce income available to common shareholders in the calculation of earnings per share. Adjustments to the carrying amount may not be necessary if the application of ASC No. 810, Consolidation (ASC 810) results in a noncontrolling interest balance in excess of what is required pursuant to ASC 480-10-S99-3A.
Under certain circumstances, Apollo could have acquired up to an additional 250,000 preferred shares of HK TMS on the same terms, with HK TMS receiving up to an additional $250 million in cash proceeds (Tranche Rights). The Tranche Rights were recognized separately as a liability instrument within "Other noncurrent liabilities" in the consolidated balance sheets, as of December 31, 2014, in accordance with ASC 480 as the shares underlying the Tranche Rights were redeemable equity instruments. The Tranche Rights were subsequently remeasured at fair value each reporting period in accordance with ASC 480, with fair value changes recorded in "Interest expense and other, net" on the
128
HALCÓN RESOURCES CORPORATION
NOTES TO THE CONSOLIDATED FINANCIAL STATEMENTS (Continued)
10. MEZZANINE EQUITY (Continued)
consolidated statements of operations. In March 2015, Apollo delivered a withdrawal notice to HK TMS indicating their election not to participate in the Tranche Rights (the Withdrawal Notice). As such, the fair value of the liability associated with the Tranche Rights was expensed during the three months ended March 31, 2015. Upon issuance of the Withdrawal Notice, HK TMS incurs a fee escalating from $2.50 per share to $20.00 per share for the next eight full fiscal quarters for any preferred shares then outstanding, which began in the quarter ended June 30, 2015 (the Withdrawal Exit Fee). The Withdrawal Exit Fee is payable upon redemption of the preferred shares. As of December 31, 2015, HK TMS incurred Withdrawal Exit Fees of approximately $2.5 million. The Withdrawal Exit Fees were recorded at fair value within "Other noncurrent liabilities" on the consolidated balance sheets.
In conjunction with the issuance of the preferred shares, HK TMS conveyed a 4.0% overriding royalty interest (ORRI), subject to reduction to 2.0% under certain circumstances, in 75 net wells to be drilled and completed on its TMS acreage. The number of wells subject to the ORRI would have increased to the extent that Apollo subscribed for additional preferred shares, with a maximum of 200 net operated wells subject to such ORRI if Apollo subscribed for the full additional 250,000 preferred shares. However, upon issuance of the Withdrawal Notice, Apollo forfeited the rights to the ORRI in the additional 125 wells. The ORRI was recognized separately as a conveyance of oil and natural gas properties in "Unevaluated properties" on the consolidated balance sheets and within "Proceeds received from the sale of oil and natural gas assets" on the consolidated statements of cash flows. As part of the transaction, there are certain restrictions on the transfer of assets, including cash, to the Company from HK TMS. HK TMS is required to maintain a minimum cash balance equal to two quarterly dividend payments, of approximately $3.0 million each, plus $10.0 million, which is presented on the consolidated balance sheets in "Restricted cash." Additionally, the quarterly 8% dividends paid to holders of the HK TMS preferred shares have priority over other cash distributions. No dividends shall be paid to the Company from HK TMS prior to December 31, 2016. HK TMS is restricted from transferring more than 20% of its maximum net acres and from transferring any assets exceeding 20% of HK TMS's proved reserves at any one time. Finally, proceeds from any such transfers of acres or other assets must be used for HK TMS's capital or operating expenditures, or to redeem the preferred shares.
For purposes of estimating the fair values of the original and amended transaction components, an income approach was used that estimated fair value based on the anticipated cash flows associated with the Company's proved reserves, discounted using a weighted average cost of capital rate. The estimation of the fair value of these components includes the use of unobservable inputs, such as estimates of proved reserves, the weighted average cost of capital (discount rate), estimated future revenues, and estimated future capital and operating costs. The use of these unobservable inputs results in the fair value estimates being classified as Level 3. Although the Company believes the assumptions and estimates used in the fair value calculation of the original and amended transaction components are reasonable and appropriate, different assumptions and estimates could materially impact the analysis and resulting conclusions. The assumptions used in estimating the fair value of the original and amended transaction components are inherently uncertain and require management judgment.
129
HALCÓN RESOURCES CORPORATION
NOTES TO THE CONSOLIDATED FINANCIAL STATEMENTS (Continued)
10. MEZZANINE EQUITY (Continued)
The following table sets forth a reconciliation of the changes in fair value of the Tranche Rights and embedded derivative classified as Level 3 in the fair value hierarchy (in thousands):
| |
Tranche rights |
Embedded derivative |
|||||
|---|---|---|---|---|---|---|---|
Balances at June 16, 2014 |
$ | 4,516 | $ | 857 | |||
Change in fair value |
(7,150 | ) | 5,106 | ||||
| | | | | | | | |
Balances at December 31, 2014 |
(2,634 | ) | 5,963 | ||||
Change in fair value |
2,634 | 137 | |||||
| | | | | | | | |
Balances at December 31, 2015 |
$ | — | $ | 6,100 | |||
| | | | | | | | |
| | | | | | | | |
| | | | | | | | |
The Company recorded the following activity related to the preferred shares in "Mezzanine equity" on the consolidated balance sheets for the years ended December 31, 2015 and 2014 (in thousands, except share amounts):
| |
Redeemable noncontrolling interest (Mezzanine equity) |
||||||
|---|---|---|---|---|---|---|---|
| |
Shares | Amount | |||||
Balances at December 31, 2013 |
— | $ | — | ||||
Issuance of HK TMS, LLC preferred stock |
150,000 | 110,051 | |||||
Offering costs |
— | (2,543 | ) | ||||
Dividends paid in-kind |
3,025 | 3,025 | |||||
Accretion of redeemable noncontrolling interest |
— | 6,633 | |||||
| | | | | | | | |
Balances at December 31, 2014 |
153,025 | 117,166 | |||||
Dividends paid in-kind |
12,614 | 12,614 | |||||
Accretion of redeemable noncontrolling interest |
— | 53,561 | |||||
Deemed dividend for change in fair value due to the HK TMS Amendment |
— | 645 | |||||
| | | | | | | | |
Balances at December 31, 2015 |
165,639 | $ | 183,986 | ||||
| | | | | | | | |
| | | | | | | | |
| | | | | | | | |
For the year ended December 31, 2015, HK TMS issued 12,614 additional preferred shares to Apollo for dividends paid in-kind. For the year ended December 31, 2014, HK TMS paid approximately $3.5 million in cash dividends and issued 3,025 additional preferred shares for dividends paid-in-kind. These dividends are presented within "Preferred dividends and accretion on redeemable noncontrolling interest" on the consolidated statements of operations. Upon the election of in-kind dividends, HK TMS must pay a fee of $5.00 per preferred share then outstanding (PIK exit fee). Such fees will be due upon redemption of the preferred shares. For the years ended December 31 2015 and 2014, HK TMS incurred PIK exit fees totaling $3.1 million and $0.8 million, respectively, which were recorded at fair value within "Other noncurrent liabilities" on the consolidated balance sheets.
130
HALCÓN RESOURCES CORPORATION
NOTES TO THE CONSOLIDATED FINANCIAL STATEMENTS (Continued)
11. STOCKHOLDERS' EQUITY
Preferred Stock
On December 6, 2012, the Company completed the Williston Basin Acquisition for a total adjusted purchase price of approximately $1.5 billion, consisting of approximately $788.8 million in cash and approximately $695.2 million in newly issued shares of Halcón preferred stock that automatically converted into 21.8 million shares of Halcón common stock (equivalent to a conversion price of approximately $37.25 per share of Halcón common stock), following stockholder approval on January 17, 2013 of such conversion and an amendment to Halcón's certificate of incorporation to increase the number of shares of common stock that Halcón is authorized to issue. The shares of preferred stock were issued to the Petro-Hunt Parties in a private placement pursuant to the exemptions from registration under Section 4(2) of the Securities Act of 1933, as amended.
On January 17, 2013, the Company received the results from the special stockholders' meeting authorizing and approving the issuance of 21.8 million shares of common stock upon the conversion of the convertible preferred stock issued to the Petro-Hunt Parties. Following the approval by the stockholders, on January 18, 2013, each outstanding share of the Company's preferred stock converted into 2,000 shares of its common stock at an effective conversion price of approximately $37.25 per share. No proceeds were received by the Company upon conversion of the preferred stock. No cash dividends were paid on the preferred stock since, pursuant to the terms of the Certificate of Designation of the preferred stock, conversion occurred prior to April 6, 2013. On June 13, 2013, the Company filed a Certificate of Elimination with the Delaware Secretary of State eliminating all provisions of the Certificate of Designation.
5.75% Series A Convertible Perpetual Preferred Stock
On June 18, 2013, the Company completed its offering of 345,000 shares of its 5.75% Series A Convertible Perpetual Preferred Stock (the Series A Preferred Stock) at a public offering price of $1,000 per share (the Liquidation Preference). The Company filed a Certificate of Designations, Preferences, Rights and Limitations of 5.75% Series A Convertible Preferred Stock on June 17, 2013 (the Series A Designation). The net proceeds to the Company from the offering of the Series A Preferred Stock were approximately $335.2 million, after deducting the underwriting discount and offering expenses. The Company used the net proceeds from the offering to repay a portion of the then outstanding borrowings under its Senior Credit Agreement.
Holders of the Series A Preferred Stock are entitled to receive, when, as and if declared by the Company's board of directors, cumulative dividends at the rate of 5.75% per annum (the dividend rate) on the Liquidation Preference per share of the Series A Preferred Stock, payable quarterly in arrears on each dividend payment date. Dividends may be paid in cash or, where freely transferable by any non-affiliate recipient thereof, in common stock of the Company or a combination thereof, and are payable on March 1, June 1, September 1 and December 1 of each year, commencing on September 1, 2013. During the year ended December 31, 2015, 2014 and 2013, the Company incurred cumulative, declared dividends of $18.0 million by paying $8.2 million in cash and issuing approximately 1.4 million shares of common stock, $19.8 million by paying $5.0 million in cash and issuing approximately 0.7 million shares of common stock, and $9.1 million by issuing approximately 0.4 million shares of common stock, respectively, reflected as cash and non-cash dividends. As of December 31, 2015 and 2014, cumulative, undeclared dividends on the Series A Preferred Stock amounted to approximately $1.2 million and $1.7 million, respectively. In January 2016, the Company announced that future
131
HALCÓN RESOURCES CORPORATION
NOTES TO THE CONSOLIDATED FINANCIAL STATEMENTS (Continued)
11. STOCKHOLDERS' EQUITY (Continued)
quarterly dividends on the Series A Preferred Stock will be suspended due to the weakened market conditions as a result of low commodity prices.
The Series A Preferred Stock has no maturity date, is not redeemable by the Company at any time, and will remain outstanding unless converted by the holders or mandatorily converted by the Company as described below.
Each share of Series A Preferred Stock is convertible, at the holder's option at any time, initially into approximately 32.49 shares of common stock of the Company (which is equivalent to an initial conversion price of approximately $30.80 per share), subject to specified adjustments as set forth in the Series A Designation. Based on the initial conversion rate, approximately 11.2 million shares of common stock of the Company would be issuable upon conversion of all the shares of Series A Preferred Stock. As of December 31, 2015, 100,276 shares of Series A Preferred Stock have been converted into approximately 3.3 million shares of common stock.
On or after June 6, 2018, the Company may, at its option, give notice of its election to cause all outstanding shares of the Series A Preferred Stock to be automatically converted into shares of common stock of the Company at the conversion rate (as defined in the Series A Designation), if the closing sale price of the Company's common stock equals or exceeds 150% of the conversion price for at least 20 trading days in a period of 30 consecutive trading days.
If the Company undergoes a fundamental change (as defined in the Series A Designation) and a holder converts its shares of the Series A Preferred Stock at any time beginning at the opening of business on the trading day immediately following the effective date of such fundamental change and ending at the close of business on the 30th trading day immediately following such effective date, the holder will receive, for each share of the Series A Preferred Stock surrendered for conversion, a number of shares of common stock of the Company equal to the greater of: (1) the sum of (i) the conversion rate and (ii) the make-whole premium, if any, as described in the Series A Designation; and (2) the conversion rate which will be increased to equal (i) the sum of the $1,000 liquidation preference plus all accumulated and unpaid dividends to, but excluding, the settlement date for such conversion, divided by (ii) the average of the closing sale prices of the Company's common stock for the five consecutive trading days ending on the third business day prior to such settlement date; provided that the prevailing conversion rate as adjusted pursuant to this will not exceed 58.48 shares of common stock of the Company per share of the Series A Preferred Stock (subject to adjustment in the same manner as the conversion rate).
Except as required by Delaware law, holders of the Series A Preferred Stock will have no voting rights unless dividends are in arrears and unpaid for six or more quarterly periods. Until such arrearage is paid in full, the holders (voting as a single class with the holders of any other preferred shares having similar voting rights) will be entitled to elect two additional directors and the number of directors on the Company's board of directors will increase by that same number.
Common Stock
On December 28, 2015, the Company completed a one-for-five reverse stock split. Retroactive application of the reverse stock split is required and all share and per share information included for all periods presented in these financial statements reflects the reverse stock split.
132
HALCÓN RESOURCES CORPORATION
NOTES TO THE CONSOLIDATED FINANCIAL STATEMENTS (Continued)
11. STOCKHOLDERS' EQUITY (Continued)
During the second quarter of 2015, the Company entered into several exchange agreements with holders of the Company's senior unsecured notes in which they agreed to exchange an aggregate $258.0 million principal amount of their senior notes for approximately 29.0 million shares of the Company's common stock. The Company recorded the issuance of common shares at fair value on the various dates the debt for equity exchanges occurred.
On March 18, 2015, the Company entered into an Equity Distribution Agreement (the Equity Distribution Agreement) with BMO Capital Markets Corp., Jefferies LLC and MLV & Co. LLC (collectively, the Managers). Pursuant to the terms of the Equity Distribution Agreement, the Company sold, by means of ordinary brokers' transactions through the facilities of the New York Stock Exchange at market prices, a total of approximately 1.9 million shares of our common stock for net proceeds of approximately $15.0 million, after deducting offering expenses. The shares sold have been registered under the Securities Act pursuant to a Registration Statement on Form S-3 (No. 333-188640), which was filed with the SEC and became effective March 13, 2015. The Company used the net proceeds from the offering to repay a portion of outstanding borrowings under its Senior Credit Agreement and for general corporate purposes.
On May 22, 2014, with stockholder approval, the Company filed a Certificate of Amendment of the Amended and Restated Certificate of Incorporation with the Delaware Secretary of State to increase its authorized common stock by approximately 670.0 million shares for a total of 1.34 billion authorized shares of common stock.
On August 13, 2013, the Company completed the issuance and sale of 8.7 million shares of its common stock in an underwritten public offering. The shares of common stock sold were registered under the Securities Act pursuant to a Registration Statement on Form S-3 (No. 333-188640), which was filed with the SEC and became automatically effective on May 16, 2013. The net proceeds to the Company from the offering of common stock were approximately $215.2 million, after deducting the underwriting discount and offering expenses. The Company used the net proceeds from the offering to repay a portion of the then outstanding borrowings under its Senior Credit Agreement.
On January 17, 2013, with stockholder approval, the Company filed a Certificate of Amendment of the Amended and Restated Certificate of Incorporation with the Delaware Secretary of State to increase its authorized common stock by approximately 333.3 million shares for a total of 670.0 million authorized shares of common stock.
Warrants
In February 2012, in conjunction with the issuance of the Convertible Note, the Company issued the February 2012 Warrants to purchase 7.3 million shares of the Company's common stock at an exercise price of $22.50 per share of common stock. The Company allocated $43.6 million to the February 2012 Warrants which is reflected in "Additional paid-in capital" on the consolidated balance sheets, net of $0.6 million in issuance costs. The February 2012 Warrants entitle the holders to exercise the warrants in whole or in part at any time prior to the expiration date of February 8, 2017.
On March 9, 2015, in conjunction with the HALRES Note Amendment, the Company entered into an amendment to the February 2012 Warrants, the Warrant Amendment, which extended the term of the February 2012 Warrants from February 8, 2017 to February 8, 2020 and adjusted the exercise price from $22.50 to $12.20 per share. The Amendments were approved by the Company's stockholders on
133
HALCÓN RESOURCES CORPORATION
NOTES TO THE CONSOLIDATED FINANCIAL STATEMENTS (Continued)
11. STOCKHOLDERS' EQUITY (Continued)
May 6, 2015, in accordance with the rules of the New York Stock Exchange. The Company expensed approximately $14.1 million for the change in the fair value of the February 2012 Warrants immediately before and after the Warrant Amendment in "Gain (loss) on extinguishment of Convertible Note and modification of February 2012 Warrants" on the consolidated statements of operations. See Note 5, "Long-term debt," for further discussion of the Amendments.
Incentive Plan
On May 8, 2006, the Company's stockholders first approved its 2006 Long-Term Incentive Plan (the Plan). On May 23, 2013, shareholders approved an increase in authorized shares under the Plan from 2.3 million to 8.3 million. On May 6, 2015, shareholders last approved an increase in authorized shares under the Plan from 8.3 million to 16.3 million. As of December 31, 2015 and 2014, a maximum of 6.3 million and 1.0 million shares of common stock, respectively, remained reserved for issuance under the Plan.
The Company accounts for share-based payment accruals under authoritative guidance on stock compensation, as set forth in ASC Topic 718. The guidance requires all share-based payments to employees and directors, including grants of performance units, stock options and restricted stock, to be recognized in the financial statements based on their fair values.
For the years ended December 31, 2015, 2014 and 2013, respectively, the Company recognized $14.5 million, $18.7 million, and $17.1 million, respectively, of share-based compensation expense as a component of "General and administrative" on the consolidated statements of operations.
Performance Share Units
As of December 31, 2015 and 2014, the Company had outstanding performance share units (PSU) under the Plan covering 0.3 million shares of common stock granted to senior management of the Company in 2014. The PSU provides that the number of shares of common stock received upon vesting will vary if the market price of the Company's common stock exceeds certain pre-established target thresholds as measured by the average of the adjusted closing price of a share of the Company's common stock during the sixty trading days preceding the third anniversary of issuance, or the measurement date. The PSU utilizes $20.00 as the floor price, below which the PSU will not vest and will expire. If the average market price at the measurement date is equal to $20.00, the PSU will vest and represent the right to receive 50% of the number of shares of common stock underlying the PSU. At $35.00, the PSU will vest and represent the right to receive the full number of shares of common stock underlying the PSU; and at $50.00, the PSU will vest and represent the right to receive 200% of the number of shares of common stock underlying the PSU. All stock price targets are subject to customary adjustments based upon changes in the Company's capital structure. In the event the average market price falls between targeted price thresholds, the PSU will represent the right to receive a proportionate number of shares, e.g., 75% of the number of shares of common stock underlying the PSU if the average market price at such time is $27.50, 150% of the number of shares of common stock underlying the PSU if the average market price at such time is $42.50, and so forth. The Company has reserved for issuance under the Plan the maximum number of shares that participants might have the right to receive upon vesting of the PSU, or 0.6 million shares of common stock.
No PSUs were granted in 2015. The weighted average grant date fair value of PSUs granted in 2014 was $4.9 million. At December 31, 2015 and 2014, the unrecognized compensation expense related
134
HALCÓN RESOURCES CORPORATION
NOTES TO THE CONSOLIDATED FINANCIAL STATEMENTS (Continued)
11. STOCKHOLDERS' EQUITY (Continued)
to non-vested PSUs totaled $1.9 million and $3.6 million, respectively. The weighted average remaining vesting period as of December 31, 2015 and 2014 was 1.2 years and 2.2 years, respectively.
The following table sets forth the PSU transactions for the years ended December 31, 2015 and 2014:
| |
Number of Shares |
Weighted Average Grant Date Fair Value Per Share |
Aggregate Intrinsic Value(1) (In thousands) |
|||||||
|---|---|---|---|---|---|---|---|---|---|---|
Unvested outstanding shares at December 31, 2013 |
— | $ | — | $ | — | |||||
Granted |
320,830 | 15.40 | ||||||||
Vested |
— | — | ||||||||
Forfeited |
— | — | ||||||||
| | | | | | | | | | | |
Unvested outstanding shares at December 31, 2014 |
320,830 | $ | 15.40 | $ | — | |||||
Granted |
— | — | ||||||||
Vested |
— | — | ||||||||
Forfeited |
— | — | ||||||||
| | | | | | | | | | | |
Unvested outstanding shares at December 31, 2015 |
320,830 | $ | 15.40 | $ | — | |||||
| | | | | | | | | | | |
| | | | | | | | | | | |
| | | | | | | | | | | |
- (1)
- The intrinsic value of PSUs was calculated as the average closing market price on December 31, 2015 and 2014 of the underlying stock multiplied by the number of PSUs that would be convertible. There were no vested PSUs as of December 31, 2015 and 2014.
The assumptions used in calculating the Monte Carlo simulation model fair value of the Company's PSU for the year ended December 31, 2014 are disclosed in the following table:
| |
Year Ended December 31, 2014 |
|
|---|---|---|
Weighted average value per option granted during the period |
$15.40 | |
Assumptions: |
||
Stock price volatility(1) |
48.00% | |
Risk free rate of return |
0.68% | |
Expected term |
3 years |
- (1)
- Due to the Company's limited historical data, expected volatility was estimated using volatilities of similar entities whose share or options prices and assumptions were publicly available.
Stock Options
From time to time, the Company grants stock options under the Plan covering shares of common stock to employees of the Company. Stock options, when exercised, are settled through the payment of the exercise price in exchange for new shares of stock underlying the option. These awards typically vest over a three year period at a rate of one-third on the annual anniversary date of the grant and expire ten years from the grant date.
135
HALCÓN RESOURCES CORPORATION
NOTES TO THE CONSOLIDATED FINANCIAL STATEMENTS (Continued)
11. STOCKHOLDERS' EQUITY (Continued)
The weighted average grant date fair value of options granted in 2015, 2014, and 2013 was $4.9 million, $13.2 million, and $16.4 million, respectively. At December 31, 2015 and 2014, the unrecognized compensation expense related to non-vested stock options totaled $6.2 million and $12.4 million, respectively. The weighted average remaining vesting period as of December 31, 2015 and 2014 was 1.3 years and 1.2 years, respectively.
The following table sets forth the stock option transactions for the years ended December 31, 2015, 2014 and 2013:
| |
Number | Weighted Average Exercise Price Per Share |
Aggregate Intrinsic Value(1) (In thousands) |
Weighted Average Remaining Contractual Life (Years) |
|||||||||
|---|---|---|---|---|---|---|---|---|---|---|---|---|---|
Outstanding at December 31, 2012 |
962,354 | $ | 36.10 | $ | 2,944 | 9.7 | |||||||
Granted |
1,234,200 | 35.35 | |||||||||||
Exercised |
— | — | |||||||||||
Forfeited |
(113,317 | ) | 34.00 | ||||||||||
| | | | | | | | | | | | | | |
Outstanding at December 31, 2013 |
2,083,237 | $ | 35.75 | $ | — | 9.0 | |||||||
Granted |
1,936,764 | 14.70 | |||||||||||
Exercised |
— | — | |||||||||||
Forfeited |
(235,269 | ) | 31.05 | ||||||||||
| | | | | | | | | | | | | | |
Outstanding at December 31, 2014 |
3,784,732 | $ | 25.25 | $ | 724 | 8.7 | |||||||
Granted |
1,922,467 | 5.36 | |||||||||||
Exercised |
— | — | |||||||||||
Forfeited |
(847,066 | ) | 22.97 | ||||||||||
| | | | | | | | | | | | | | |
Outstanding at December 31, 2015 |
4,860,133 | $ | 17.80 | $ | — | 8.4 | |||||||
| | | | | | | | | | | | | | |
| | | | | | | | | | | | | | |
| | | | | | | | | | | | | | |
- (1)
- The intrinsic value of a stock option is the amount by which the current market value of the underlying stock exceeds the exercise price of the option. No stock options were exercised during the years ended December 31, 2015, 2014 and 2013.
Options outstanding at December 31, 2015 consisted of the following:
| |
Outstanding | Exercisable(1) | |||||||||||||||||||||||
|---|---|---|---|---|---|---|---|---|---|---|---|---|---|---|---|---|---|---|---|---|---|---|---|---|---|
| |
Range of Grant Prices Per Share |
Number | Weighted Average Exercise Price per Share |
Weighted Average Remaining Contractual Live (Years) |
Number | Weighted Average Exercise Price per Share |
Aggregate Intrinsic Value |
Weighted Average Remaining Contractual Live (Years) |
|||||||||||||||||
| $ | 2.36 - $ 2.76 | 1,194,974 | $ | 2.76 | 9.9 | — | $ | — | $ | — | — | ||||||||||||||
| $ | 7.85 - $ 9.85 | 1,252,126 | 8.88 | 9.1 | — | — | — | — | |||||||||||||||||
| $ | 15.20 - $18.35 | 814,472 | 18.34 | 8.2 | — | — | — | — | |||||||||||||||||
| $ | 19.80 - $34.60 | 505,160 | 29.64 | 6.9 | — | — | — | — | |||||||||||||||||
| $ | 35.45 - $37.80 | 839,612 | 35.54 | 7.2 | — | — | — | — | |||||||||||||||||
| $ | 38.00 - $57.75 | 253,789 | 48.59 | 6.4 | — | — | — | — | |||||||||||||||||
- (1)
- At December 31, 2015, none of the Company's options were exercisable due to service performance conditions or option exercise prices below the current market value of the underlying stock as of December 31, 2015.
136
HALCÓN RESOURCES CORPORATION
NOTES TO THE CONSOLIDATED FINANCIAL STATEMENTS (Continued)
11. STOCKHOLDERS' EQUITY (Continued)
The aggregate intrinsic value of vested and exercisable options as of December 31, 2015 was zero. The aggregate intrinsic value of options vested as of December 31, 2015 was zero. The intrinsic value is based on the current market value of the underlying stock price of $1.26 as of December 31, 2015.
The assumptions used in calculating the Black-Scholes-Merton valuation model fair value of the Company's stock options for the years ended December 31, 2015, 2014 and 2013 are disclosed in the following table:
| |
Years Ended December 31, | |||||
|---|---|---|---|---|---|---|
| |
2015 | 2014 | 2013 | |||
Weighted average value per option granted during the period |
$2.56 | $6.80 | $13.25 | |||
Assumptions: |
||||||
Stock price volatility(1) |
56.45% | 51.48% | 57.31% | |||
Risk free rate of return |
1.66% | 1.56% | 0.89% | |||
Expected term |
5 years | 5 years | 5 years | |||
- (1)
- Due to the Company's limited historical data, expected volatility was estimated using volatilities of similar entities whose share or options prices and assumptions were publicly available.
Restricted Stock
From time-to-time, the Company grants shares of restricted stock to employees and non-employee directors of the Company. Employee shares typically vest over a three year period at a rate of one-third on the annual anniversary date of the grant, and the non-employee directors' shares vest six months from the date of grant.
The weighted average grant date fair value of the shares granted in 2015, 2014, and 2013 was $8.5 million, $23.7 million and $22.5 million, respectively. At December 31, 2015 and 2014, the unrecognized compensation expense related to non-vested restricted stock totaled $11.1 million and $18.4 million, respectively. The weighted average remaining vesting period as of December 31, 2015 and 2014 was 1.5 years.
137
HALCÓN RESOURCES CORPORATION
NOTES TO THE CONSOLIDATED FINANCIAL STATEMENTS (Continued)
11. STOCKHOLDERS' EQUITY (Continued)
The following table sets forth the restricted stock transactions for the years ended December 31, 2015, 2014 and 2013:
| |
Number of Shares |
Weighted Average Grant Date Fair Value Per Share |
Aggregate Intrinsic Value(1) (In thousands) |
|||||||
|---|---|---|---|---|---|---|---|---|---|---|
Unvested outstanding shares at December 31, 2012 |
53,580 | $ | 43.60 | $ | 1,854 | |||||
Granted |
653,290 | 34.50 | ||||||||
Vested |
(108,715 | ) | 32.15 | |||||||
Accelerated vesting(2) |
(28,522 | ) | 35.50 | |||||||
Forfeited |
(40,957 | ) | 34.80 | |||||||
| | | | | | | | | | | |
Unvested outstanding shares at December 31, 2013 |
528,676 | $ | 35.80 | $ | 10,204 | |||||
Granted |
1,877,608 | 12.60 | ||||||||
Vested |
(246,232 | ) | 34.05 | |||||||
Forfeited |
(91,141 | ) | 23.05 | |||||||
| | | | | | | | | | | |
Unvested outstanding shares at December 31, 2014 |
2,068,911 | $ | 15.55 | $ | 18,413 | |||||
Granted |
2,047,785 | 4.15 | ||||||||
Vested |
(858,708 | ) | 16.24 | |||||||
Forfeited |
(387,583 | ) | 12.86 | |||||||
| | | | | | | | | | | |
Unvested outstanding shares at December 31, 2015 |
2,870,405 | $ | 7.55 | $ | 3,617 | |||||
| | | | | | | | | | | |
| | | | | | | | | | | |
| | | | | | | | | | | |
- (1)
- The intrinsic value of restricted stock was calculated as the closing market price on December 31, 2015, 2014, and 2013 of
the underlying stock multiplied by the number of restricted shares. The total fair value of shares vested were $5.2 million, $5.1 million and $3.5 million for the years ended
2015, 2014, and 2013, respectively.
- (2)
- Represents accelerated vesting of unvested employee restricted stock at the time of severance in conjunction with the Company's divestiture of non-core assets.
12. INCOME TAXES
Income tax benefit (provision) for the indicated periods is comprised of the following:
| |
Years Ended December 31, | |||||||||
|---|---|---|---|---|---|---|---|---|---|---|
| |
2015 | 2014 | 2013 | |||||||
| |
(In thousands) |
|||||||||
Current: |
||||||||||
Federal |
$ | (8,580 | ) | $ | 1,295 | $ | (1,523 | ) | ||
State |
(506 | ) | (219 | ) | — | |||||
| | | | | | | | | | | |
|
$ | (9,086 | ) | 1,076 | (1,523 | ) | ||||
| | | | | | | | | | | |
Deferred: |
||||||||||
Federal |
(39,331 | ) | 2,653 | 145,098 | ||||||
State |
39,331 | (2,653 | ) | 14,141 | ||||||
| | | | | | | | | | | |
|
— | — | 159,239 | |||||||
| | | | | | | | | | | |
Total income tax benefit (provision) |
$ | (9,086 | ) | $ | 1,076 | $ | 157,716 | |||
| | | | | | | | | | | |
| | | | | | | | | | | |
| | | | | | | | | | | |
138
HALCÓN RESOURCES CORPORATION
NOTES TO THE CONSOLIDATED FINANCIAL STATEMENTS (Continued)
12. INCOME TAXES (Continued)
The actual income tax benefit (provision) differs from the expected income tax benefit (provision) as computed by applying the United States Federal corporate income tax rate of 35% for each period as follows:
| |
Years Ended December 31, | |||||||||
|---|---|---|---|---|---|---|---|---|---|---|
| |
2015 | 2014 | 2013 | |||||||
| |
(In thousands) |
|||||||||
Expected tax benefit (provision) |
$ | 669,737 | $ | (110,208 | ) | $ | 483,132 | |||
State income tax expense, net of federal benefit(1) |
41,003 | (4,615 | ) | 15,904 | ||||||
Goodwill impairment |
— | — | (80,106 | ) | ||||||
Debt related costs |
(7,102 | ) | (5,467 | ) | (2,465 | ) | ||||
Cancellation of indebtedness income |
(89,081 | ) | — | — | ||||||
Increase (reduction) in deferred tax asset |
(6,369 | ) | 19,233 | 4,616 | ||||||
Change in valuation allowance and related items |
(598,429 | ) | 102,068 | (262,847 | ) | |||||
IRC section 108 attribute reduction |
(13,744 | ) | — | — | ||||||
Other |
(5,101 | ) | 65 | (518 | ) | |||||
| | | | | | | | | | | |
Total income tax benefit (provision) |
$ | (9,086 | ) | $ | 1,076 | $ | 157,716 | |||
| | | | | | | | | | | |
| | | | | | | | | | | |
| | | | | | | | | | | |
- (1)
- Included in this amount for the year ended December 31, 2013, is approximately $4.4 million related to the goodwill impairment.
139
HALCÓN RESOURCES CORPORATION
NOTES TO THE CONSOLIDATED FINANCIAL STATEMENTS (Continued)
12. INCOME TAXES (Continued)
The components of net deferred income tax assets and (liabilities) recognized are as follows:
| |
December 31, | ||||||
|---|---|---|---|---|---|---|---|
| |
2015(1) | 2014 | |||||
| |
(In thousands) |
||||||
Deferred current income tax assets: |
|||||||
Unrealized hedging transactions |
$ | — | $ | — | |||
Other |
— | 245 | |||||
| | | | | | | | |
Gross deferred current income tax assets |
— | 245 | |||||
Valuation allowance |
— | (57 | ) | ||||
| | | | | | | | |
Deferred current income tax assets |
$ | — | $ | 188 | |||
| | | | | | | | |
| | | | | | | | |
| | | | | | | | |
Deferred current income tax liabilities: |
|||||||
Unrealized hedging transactions |
$ | — | $ | (132,939 | ) | ||
Change in accounting method(2) |
— | (4,075 | ) | ||||
| | | | | | | | |
Deferred current income tax liabilities |
$ | — | $ | (137,014 | ) | ||
| | | | | | | | |
| | | | | | | | |
| | | | | | | | |
Net current deferred income tax assets (liabilities) |
$ | — | $ | (136,826 | ) | ||
| | | | | | | | |
| | | | | | | | |
| | | | | | | | |
Deferred noncurrent income tax assets: |
|||||||
Net operating loss carry-forwards |
$ | 555,044 | $ | 601,566 | |||
Share-based compensation expense |
15,027 | 15,035 | |||||
Asset retirement obligations |
14,616 | 14,089 | |||||
Investment in unconsolidated entities |
59,429 | 62,340 | |||||
Book-tax differences in property basis |
234,900 | — | |||||
Other |
19,376 | 9,591 | |||||
| | | | | | | | |
Gross deferred noncurrent income tax assets |
898,392 | 702,621 | |||||
Valuation allowance |
(761,493 | ) | (163,007 | ) | |||
| | | | | | | | |
Deferred noncurrent income tax assets |
$ | 136,899 | $ | 539,614 | |||
| | | | | | | | |
| | | | | | | | |
| | | | | | | | |
Deferred noncurrent income tax liabilities: |
|||||||
Book-tax differences in property basis |
$ | — | $ | (345,189 | ) | ||
Change in accounting method(2) |
(4,057 | ) | (4,075 | ) | |||
Unrealized hedging transactions |
(132,842 | ) | (53,524 | ) | |||
| | | | | | | | |
Deferred noncurrent income tax liabilities |
$ | (136,899 | ) | $ | (402,788 | ) | |
| | | | | | | | |
| | | | | | | | |
| | | | | | | | |
Net noncurrent deferred income tax assets (liabilities) |
$ | — | $ | 136,826 | |||
| | | | | | | | |
| | | | | | | | |
| | | | | | | | |
- (1)
- At December 31, 2015, the Company early adopted ASU 2015-17 on a prospective basis and accordingly, presented all deferred
tax assets and liabilities as noncurrent on the consolidated balance sheet as of December 31, 2015.
- (2)
- In December 2013 the Company filed Form 3115, Application for Change in Accounting Method, related to certain property, plant and equipment expenditures and the tax impacts of the filing are reflected in the amounts above.
140
HALCÓN RESOURCES CORPORATION
NOTES TO THE CONSOLIDATED FINANCIAL STATEMENTS (Continued)
12. INCOME TAXES (Continued)
ASC 740, Income Taxes (ASC 740) prescribes a recognition threshold and a measurement attribute for the financial statement recognition and measurement of income tax positions taken or expected to be taken in an income tax return. For those benefits to be recognized, an income tax position must be more-likely-than-not to be sustained upon examination by taxing authorities. The Company has no unrecognized tax benefits for the years ended December 31, 2015, 2014 or 2013.
Generally, the Company's income tax years 2012 through 2015 remain open and subject to examination by Federal tax authorities or the tax authorities in Louisiana, Mississippi, North Dakota, Oklahoma, Texas, Pennsylvania, Ohio and certain other state taxing jurisdictions where the Company has, or previously had, its principal operations. In certain jurisdictions the Company operates through more than one legal entity, each of which may have different open years subject to examination.
The Company recognizes interest and penalties accrued to unrecognized benefits in "Interest expense and other, net" in its consolidated statements of operations. For the years ended December 31, 2015, 2014 and 2013 the Company recognized no interest and penalties.
As of December 31, 2015, the Company has available, to reduce future taxable income, United States net operating loss carryforwards (NOLs) of approximately $1.5 billion (net of excess income tax benefits not recognized of $4.2 million) before consideration of any valuation allowance which expires in the years 2020 thru 2034. A portion of these net operating loss carryforwards are subject to the ownership change limitation provisions of Section 382 of the Internal Revenue Code (IRC). The Company also has various net state NOL carryforwards of approximately $829.5 million, before consideration of any valuation allowance with varying lengths of allowable carryforward periods ranging from five to 20 years that can be used to offset future state taxable income.
The Company assesses the recoverability of its deferred tax assets each period by considering whether it is more likely than not that all or a portion of the deferred tax assets will not be realized. The Company considers all available evidence (both positive and negative) in determining whether a valuation allowance is required. The Company evaluated possible sources of taxable income that may be available to realize the benefit of deferred tax assets, including projected future taxable income, the reversal of existing temporary differences, taxable income in carryback years and available tax planning strategies in making this assessment. A significant item of objective negative evidence considered was the cumulative book loss over the three-year period ended December 31, 2015 driven primarily by the full cost ceiling impairments over that period which limits the ability to consider other subjective evidence such as the Company's anticipated future growth. As a result of the Company's analysis, it was concluded that as of December 31, 2015 a valuation allowance should continue to be applied against the Company's net deferred tax asset. The Company recorded a valuation allowance as of December 31, 2015 of $761.5 million, an increase of $598.4 million from December 31, 2014. The Company will continue to monitor facts and circumstances in the reassessment of the likelihood that operating loss carryforwards, credits and other deferred tax assets will be utilized.
During the first quarter of 2014, the Internal Revenue Service commenced an audit of GeoResources' tax returns for the years ending December 31, 2010 through August 1, 2012. The audit closed during April 2015 resulting in a favorable adjustment to the Company of $0.1 million.
141
HALCÓN RESOURCES CORPORATION
NOTES TO THE CONSOLIDATED FINANCIAL STATEMENTS (Continued)
13. EARNINGS PER SHARE
The following represents the calculation of earnings per share:
| |
Years Ended December 31, | |||||||||
|---|---|---|---|---|---|---|---|---|---|---|
| |
2015 | 2014 | 2013 | |||||||
| |
(In thousands, except per share amounts) |
|||||||||
Basic: |
||||||||||
Net income (loss) available to common stockholders |
$ | (2,006,958 | ) | $ | 282,942 | $ | (1,233,407 | ) | ||
| | | | | | | | | | | |
| | | | | | | | | | | |
| | | | | | | | | | | |
Weighted average basic number of common shares outstanding |
107,531 | 83,155 | 75,925 | |||||||
| | | | | | | | | | | |
Basic net income (loss) per common share |
$ | (18.66 | ) | $ | 3.40 | $ | (16.25 | ) | ||
| | | | | | | | | | | |
| | | | | | | | | | | |
| | | | | | | | | | | |
Diluted: |
||||||||||
Net income (loss) available to common stockholders |
$ | (2,006,958 | ) | $ | 282,942 | $ | (1,233,407 | ) | ||
| | | | | | | | | | | |
Net income from assumed conversions |
— | 35,140 | — | |||||||
| | | | | | | | | | | |
Net income (loss) available to common stockholders after assumed conversions |
$ | (2,006,958 | ) | $ | 318,082 | $ | (1,233,407 | ) | ||
| | | | | | | | | | | |
| | | | | | | | | | | |
| | | | | | | | | | | |
Weighted average basic number of common shares outstanding |
107,531 | 83,155 | 75,925 | |||||||
Common stock equivalent shares representing shares issuable upon: |
||||||||||
Exercise of stock options |
Anti-dilutive | 75 | Anti-dilutive | |||||||
Exercise of February 2012 Warrants |
Anti-dilutive | 784 | Anti-dilutive | |||||||
Exercise of August 2012 Warrants(1) |
— | — | Anti-dilutive | |||||||
Vesting of restricted shares |
Anti-dilutive | 310 | Anti-dilutive | |||||||
Vesting of performance units |
— | 73 | — | |||||||
Conversion of Convertible Note |
Anti-dilutive | 12,875 | Anti-dilutive | |||||||
Conversion of preferred stock(2) |
— | — | Anti-dilutive | |||||||
Conversion of Series A Preferred Stock |
Anti-dilutive | 11,209 | — | |||||||
| | | | | | | | | | | |
Weighted average diluted number of common shares outstanding |
107,531 | 108,481 | 75,925 | |||||||
| | | | | | | | | | | |
Diluted net income (loss) per common share |
$ | (18.66 | ) | $ | 2.93 | $ | (16.25 | ) | ||
| | | | | | | | | | | |
| | | | | | | | | | | |
| | | | | | | | | | | |
- (1)
- The August 2012 Warrants expired on June 9, 2013.
- (2)
- The preferred stock converted into shares of common stock on January 18, 2013.
Common stock equivalents, including stock options, restricted shares, warrants, convertible debt and preferred stock totaling 47.1 million shares were not included in the computation of diluted earnings per share of common stock because the effect would have been anti-dilutive for the year ended December 31, 2015 due to the net loss.
Common stock equivalents, including stock options, restricted shares and warrants, totaling 6.2 million shares were not included in the computation of diluted earnings per share of common stock because the effect would have been anti-dilutive for the year ended December 31, 2014.
142
HALCÓN RESOURCES CORPORATION
NOTES TO THE CONSOLIDATED FINANCIAL STATEMENTS (Continued)
13. EARNINGS PER SHARE (Continued)
Common stock equivalents, including stock options, restricted shares, warrants, convertible debt and convertible preferred stock, totaling 29.9 million shares were not included in the computation of diluted earnings per share of common stock because the effect would have been anti-dilutive for the year ended December 31, 2013 due to the net loss.
14. ADDITIONAL FINANCIAL STATEMENT INFORMATION
Certain balance sheet amounts are comprised of the following:
| |
December 31, | ||||||
|---|---|---|---|---|---|---|---|
| |
2015 | 2014 | |||||
| |
(In thousands) |
||||||
Accounts receivable: |
|||||||
Oil, natural gas and natural gas liquids revenues |
$ | 55,129 | $ | 104,370 | |||
Joint interest accounts |
67,626 | 140,352 | |||||
Accrued settlements on derivative contracts |
47,011 | 25,929 | |||||
Affiliated partnership |
176 | 661 | |||||
Other |
3,682 | 5,247 | |||||
| | | | | | | | |
|
$ | 173,624 | $ | 276,559 | |||
| | | | | | | | |
| | | | | | | | |
| | | | | | | | |
Prepaids and other: |
|||||||
Prepaid |
$ | 4,585 | $ | 6,030 | |||
Income tax receivable |
— | 2,991 | |||||
Other |
50 | 58 | |||||
| | | | | | | | |
|
$ | 4,635 | $ | 9,079 | |||
| | | | | | | | |
| | | | | | | | |
| | | | | | | | |
Accounts payable and accrued liabilities: |
|||||||
Trade payables |
$ | 47,261 | $ | 60,512 | |||
Accrued oil and natural gas capital costs |
54,651 | 308,604 | |||||
Revenues and royalties payable |
64,002 | 100,498 | |||||
Accrued interest expense |
88,499 | 82,942 | |||||
Accrued employee compensation |
2,829 | 3,171 | |||||
Accrued lease operating expenses |
20,036 | 29,681 | |||||
Drilling advances from partners |
7,964 | 21,220 | |||||
Income taxes payable |
9,172 | — | |||||
Affiliated partnership |
365 | 762 | |||||
Other |
306 | 360 | |||||
| | | | | | | | |
|
$ | 295,085 | $ | 607,750 | |||
| | | | | | | | |
| | | | | | | | |
| | | | | | | | |
143
HALCÓN RESOURCES CORPORATION
NOTES TO THE CONSOLIDATED FINANCIAL STATEMENTS (Continued)
15. CONDENSED CONSOLIDATING FINANCIAL INFORMATION
The Company's obligations under its 2020 Second Lien Notes, 2022 Second Lien Notes, Third Lien Notes and senior unsecured notes are fully and unconditionally guaranteed, jointly and severally, by all of the Company's existing 100% owned subsidiaries, other than HK TMS. See Note 5, "Long-term Debt," for information regarding the Company's Senior Credit Agreement, the 2020 Second Lien Notes, the 2022 Second Lien Notes, the Third Lien Notes and senior unsecured notes. On June 16, 2014, the Company contributed its TMS undeveloped acreage located in Mississippi and Louisiana into HK TMS. See Note 10, "Mezzanine Equity," for a discussion of the restrictions on the transfer of assets between the Company and HK TMS.
The following condensed consolidating statements of operations, condensed consolidating balance sheets, and condensed consolidating statements of cash flows for the parent company, subsidiary guarantors on a combined basis, the non-guarantor subsidiary, the consolidating adjustments and the total consolidated amounts are presented as of and for the years then ended December 31, 2015 and 2014. Investments in the subsidiaries are accounted for under the equity method. Such condensed consolidating financial information may not necessarily be indicative of the financial position, results of operations or cash flows had these subsidiaries operated as independent entities.
144
HALCÓN RESOURCES CORPORATION
NOTES TO THE CONSOLIDATED FINANCIAL STATEMENTS (Continued)
15. CONDENSED CONSOLIDATING FINANCIAL INFORMATION (Continued)
CONDENSED CONSOLIDATING STATEMENTS OF OPERATIONS
| |
Year Ended December 31, 2015 | |||||||||||||||
|---|---|---|---|---|---|---|---|---|---|---|---|---|---|---|---|---|
| |
Parent Company |
Guarantor Subsidiaries |
Non-Guarantor Subsidiary |
Eliminations | Consolidated | |||||||||||
| |
(In thousands) |
|||||||||||||||
Operating revenues: |
||||||||||||||||
Oil, natural gas and natural gas liquids sales: |
||||||||||||||||
Oil |
$ | — | $ | 495,645 | $ | 16,701 | $ | — | $ | 512,346 | ||||||
Natural gas |
— | 22,509 | — | — | 22,509 | |||||||||||
Natural gas liquids |
— | 13,624 | — | — | 13,624 | |||||||||||
| | | | | | | | | | | | | | | | | |
Total oil, natural gas and natural gas liquids sales |
— | 531,778 | 16,701 | — | 548,479 | |||||||||||
Other |
— | 1,799 | — | — | 1,799 | |||||||||||
| | | | | | | | | | | | | | | | | |
Total operating revenues |
— | 533,577 | 16,701 | — | 550,278 | |||||||||||
| | | | | | | | | | | | | | | | | |
Operating expenses: |
||||||||||||||||
Production: |
||||||||||||||||
Lease operating |
— | 101,303 | 2,287 | — | 103,590 | |||||||||||
Workover and other |
— | 20,819 | 43 | — | 20,862 | |||||||||||
Taxes other than income |
— | 47,945 | 945 | — | 48,890 | |||||||||||
Gathering and other |
— | 40,281 | — | — | 40,281 | |||||||||||
Restructuring |
— | 2,886 | — | — | 2,886 | |||||||||||
General and administrative |
56,704 | 30,809 | 2,355 | (2,102 | ) | 87,766 | ||||||||||
Depletion, depreciation and accretion |
2,184 | 347,010 | 26,215 | (11,205 | ) | 364,204 | ||||||||||
Full cost ceiling impairment |
— | 2,390,927 | 224,173 | 11,205 | 2,626,305 | |||||||||||
| | | | | | | | | | | | | | | | | |
Total operating expenses |
58,888 | 2,981,980 | 256,018 | (2,102 | ) | 3,294,784 | ||||||||||
| | | | | | | | | | | | | | | | | |
Income (loss) from operations |
(58,888 | ) | (2,448,403 | ) | (239,317 | ) | 2,102 | (2,744,506 | ) | |||||||
Other income (expenses): |
||||||||||||||||
Net gain (loss) on derivative contracts |
— | 310,264 | — | — | 310,264 | |||||||||||
Interest expense and other, net |
(337,180 | ) | 107,037 | (2,735 | ) | — | (232,878 | ) | ||||||||
Gain (loss) on extinguishment of debt |
761,804 | — | — | — | 761,804 | |||||||||||
Gain (loss) on extinguishment of Convertible Note and modification of February 2012 Warrants |
(8,219 | ) | — | — | — | (8,219 | ) | |||||||||
| | | | | | | | | | | | | | | | | |
Total other income (expenses) |
416,405 | 417,301 | (2,735 | ) | — | 830,971 | ||||||||||
| | | | | | | | | | | | | | | | | |
Income (loss) before income taxes |
357,517 | (2,031,102 | ) | (242,052 | ) | 2,102 | (1,913,535 | ) | ||||||||
Income tax benefit (provision) |
(9,086 | ) | — | — | — | (9,086 | ) | |||||||||
Equity in earnings of subsidiary, net of tax |
(2,337,872 | ) | (306,770 | ) | — | 2,644,642 | — | |||||||||
| | | | | | | | | | | | | | | | | |
Net income (loss) |
(1,989,441 | ) | (2,337,872 | ) | (242,052 | ) | 2,646,744 | (1,922,621 | ) | |||||||
Series A preferred dividends |
(17,517 | ) | — | — | — | (17,517 | ) | |||||||||
Preferred dividends and accretion on redeemable noncontrolling interest |
— | — | (66,820 | ) | — | (66,820 | ) | |||||||||
| | | | | | | | | | | | | | | | | |
Net income (loss) available to common stockholders |
$ | (2,006,958 | ) | $ | (2,337,872 | ) | $ | (308,872 | ) | $ | 2,646,744 | $ | (2,006,958 | ) | ||
| | | | | | | | | | | | | | | | | |
| | | | | | | | | | | | | | | | | |
| | | | | | | | | | | | | | | | | |
145
HALCÓN RESOURCES CORPORATION
NOTES TO THE CONSOLIDATED FINANCIAL STATEMENTS (Continued)
15. CONDENSED CONSOLIDATING FINANCIAL INFORMATION (Continued)
| |
Year Ended December 31, 2014 | |||||||||||||||
|---|---|---|---|---|---|---|---|---|---|---|---|---|---|---|---|---|
| |
Parent Company |
Guarantor Subsidiaries |
Non-Guarantor Subsidiary |
Eliminations | Consolidated | |||||||||||
| |
(In thousands) |
|||||||||||||||
Operating revenues: |
||||||||||||||||
Oil, natural gas and natural gas liquids sales: |
||||||||||||||||
Oil |
$ | — | $ | 1,055,460 | $ | 15,859 | $ | — | $ | 1,071,319 | ||||||
Natural gas |
— | 37,101 | — | — | 37,101 | |||||||||||
Natural gas liquids |
— | 37,460 | — | — | 37,460 | |||||||||||
| | | | | | | | | | | | | | | | | |
Total oil, natural gas and natural gas liquids sales |
— | 1,130,021 | 15,859 | — | 1,145,880 | |||||||||||
Other |
— | 2,381 | — | — | 2,381 | |||||||||||
| | | | | | | | | | | | | | | | | |
Total operating revenues |
— | 1,132,402 | 15,859 | — | 1,148,261 | |||||||||||
| | | | | | | | | | | | | | | | | |
Operating expenses: |
||||||||||||||||
Production: |
||||||||||||||||
Lease operating |
— | 129,510 | 729 | — | 130,239 | |||||||||||
Workover and other |
— | 16,193 | — | — | 16,193 | |||||||||||
Taxes other than income |
634 | 105,372 | 325 | — | 106,331 | |||||||||||
Gathering and other |
— | 26,719 | — | — | 26,719 | |||||||||||
Restructuring |
— | 987 | — | — | 987 | |||||||||||
General and administrative |
72,168 | 43,611 | 4,850 | (4,097 | ) | 116,532 | ||||||||||
Depletion, depreciation and accretion |
2,646 | 520,705 | 20,130 | (9,060 | ) | 534,421 | ||||||||||
Full cost ceiling impairment |
— | 95,359 | 139,599 | 4,710 | 239,668 | |||||||||||
Other operating property and equipment impairment |
— | 35,558 | — | — | 35,558 | |||||||||||
| | | | | | | | | | | | | | | | | |
Total operating expenses |
75,448 | 974,014 | 165,633 | (8,447 | ) | 1,206,648 | ||||||||||
| | | | | | | | | | | | | | | | | |
Income (loss) from operations |
(75,448 | ) | 158,388 | (149,774 | ) | 8,447 | (58,387 | ) | ||||||||
Other income (expenses): |
||||||||||||||||
Net gain (loss) on derivative contracts |
— | 518,956 | — | — | 518,956 | |||||||||||
Interest expense and other, net |
(317,556 | ) | 169,752 | 2,115 | — | (145,689 | ) | |||||||||
| | | | | | | | | | | | | | | | | |
Total other income (expenses) |
(317,556 | ) | 688,708 | 2,115 | — | 373,267 | ||||||||||
| | | | | | | | | | | | | | | | | |
Income (loss) before income taxes |
(393,004 | ) | 847,096 | (147,659 | ) | 8,447 | 314,880 | |||||||||
Income tax benefit (provision) |
— | (31,960 | ) | (1,417 | ) | 34,453 | 1,076 | |||||||||
Equity in earnings of subsidiary, net of tax |
695,784 | (119,352 | ) | — | (576,432 | ) | — | |||||||||
| | | | | | | | | | | | | | | | | |
Net income (loss) |
302,780 | 695,784 | (149,076 | ) | (533,532 | ) | 315,956 | |||||||||
Series A preferred dividends |
(19,838 | ) | — | — | — | (19,838 | ) | |||||||||
Preferred dividends and accretion on redeemable noncontrolling interest |
— | — | (13,176 | ) | — | (13,176 | ) | |||||||||
| | | | | | | | | | | | | | | | | |
Net income (loss) available to common stockholders |
$ | 282,942 | $ | 695,784 | $ | (162,252 | ) | $ | (533,532 | ) | $ | 282,942 | ||||
| | | | | | | | | | | | | | | | | |
| | | | | | | | | | | | | | | | | |
| | | | | | | | | | | | | | | | | |
146
HALCÓN RESOURCES CORPORATION
NOTES TO THE CONSOLIDATED FINANCIAL STATEMENTS (Continued)
15. CONDENSED CONSOLIDATING FINANCIAL INFORMATION (Continued)
CONDENSED CONSOLIDATING BALANCE SHEETS
| |
December 31, 2015 | |||||||||||||||
|---|---|---|---|---|---|---|---|---|---|---|---|---|---|---|---|---|
| |
Parent Company |
Guarantor Subsidiaries |
Non-Guarantor Subsidiary |
Eliminations | Consolidated | |||||||||||
| |
(In thousands) |
|||||||||||||||
Current assets: |
||||||||||||||||
Cash |
$ | — | $ | 100 | $ | 7,926 | $ | — | $ | 8,026 | ||||||
Accounts receivable |
88 | 166,770 | 9,985 | (3,219 | ) | 173,624 | ||||||||||
Receivables from derivative contracts |
— | 348,861 | — | — | 348,861 | |||||||||||
Restricted cash |
138 | — | 16,674 | — | 16,812 | |||||||||||
Inventory |
— | 4,554 | 81 | — | 4,635 | |||||||||||
Prepaids and other |
328 | 4,307 | — | — | 4,635 | |||||||||||
| | | | | | | | | | | | | | | | | |
Total current assets |
554 | 524,592 | 34,666 | (3,219 | ) | 556,593 | ||||||||||
| | | | | | | | | | | | | | | | | |
Oil and natural gas properties (full cost method): |
||||||||||||||||
Evaluated |
— | 6,634,426 | 430,645 | (4,350 | ) | 7,060,721 | ||||||||||
Unevaluated |
— | 1,566,705 | 74,651 | — | 1,641,356 | |||||||||||
| | | | | | | | | | | | | | | | | |
Gross oil and natural gas properties |
— | 8,201,131 | 505,296 | (4,350 | ) | 8,702,077 | ||||||||||
Less—accumulated depletion |
— | (5,527,948 | ) | (410,090 | ) | 4,350 | (5,933,688 | ) | ||||||||
| | | | | | | | | | | | | | | | | |
Net oil and natural gas properties |
— | 2,673,183 | 95,206 | — | 2,768,389 | |||||||||||
| | | | | | | | | | | | | | | | | |
Other operating property and equipment: |
||||||||||||||||
Gas gathering and other operating assets |
12,474 | 117,441 | 175 | — | 130,090 | |||||||||||
Less—accumulated depreciation |
(8,705 | ) | (13,676 | ) | (54 | ) | — | (22,435 | ) | |||||||
| | | | | | | | | | | | | | | | | |
Net other operating property and equipment |
3,769 | 103,765 | 121 | — | 107,655 | |||||||||||
| | | | | | | | | | | | | | | | | |
Other noncurrent assets: |
||||||||||||||||
Receivables from derivative contracts |
— | 16,614 | — | — | 16,614 | |||||||||||
Debt issuance costs, net |
7,633 | — | — | — | 7,633 | |||||||||||
Intercompany notes and accounts receivable |
4,749,760 | 302,096 | — | (5,051,856 | ) | — | ||||||||||
Equity in oil and natural gas partnership |
— | 209 | — | — | 209 | |||||||||||
Funds in escrow and other |
517 | 1,082 | — | — | 1,599 | |||||||||||
| | | | | | | | | | | | | | | | | |
Total assets |
$ | 4,762,233 | $ | 3,621,541 | $ | 129,993 | $ | (5,055,075 | ) | $ | 3,458,692 | |||||
| | | | | | | | | | | | | | | | | |
| | | | | | | | | | | | | | | | | |
| | | | | | | | | | | | | | | | | |
Current liabilities: |
||||||||||||||||
Accounts payable and accrued liabilities |
$ | — | $ | 326,655 | $ | 6,102 | $ | (37,672 | ) | $ | 295,085 | |||||
Asset retirement obligations |
— | 163 | — | — | 163 | |||||||||||
| | | | | | | | | | | | | | | | | |
Total current liabilities |
— | 326,818 | 6,102 | (37,672 | ) | 295,248 | ||||||||||
| | | | | | | | | | | | | | | | | |
Long-term debt, net |
2,873,637 | — | — | — | 2,873,637 | |||||||||||
Other noncurrent liabilities: |
||||||||||||||||
Liabilities from derivative contracts |
— | 290 | — | — | 290 | |||||||||||
Asset retirement obligations |
— | 45,602 | 1,251 | — | 46,853 | |||||||||||
Intercompany notes and accounts payable |
302,096 | 4,749,760 | — | (5,051,856 | ) | — | ||||||||||
Investment in subsidiary |
1,534,086 | 32,993 | — | (1,567,079 | ) | — | ||||||||||
Other |
— | 164 | 6,100 | — | 6,264 | |||||||||||
Commitments and contingencies |
||||||||||||||||
Mezzanine equity: |
||||||||||||||||
Redeemable noncontrolling interest |
— | — | 183,986 | — | 183,986 | |||||||||||
Stockholders' equity: |
||||||||||||||||
Preferred stock |
— | — | — | — | — | |||||||||||
Common stock |
12 | — | — | — | 12 | |||||||||||
Additional paid-in capital |
3,283,097 | — | 403,678 | (403,678 | ) | 3,283,097 | ||||||||||
Retained earnings (accumulated deficit) |
(3,230,695 | ) | (1,534,086 | ) | (471,124 | ) | 2,005,210 | (3,230,695 | ) | |||||||
| | | | | | | | | | | | | | | | | |
Total stockholders' equity |
52,414 | (1,534,086 | ) | (67,446 | ) | 1,601,532 | 52,414 | |||||||||
| | | | | | | | | | | | | | | | | |
Total liabilities and stockholders' equity |
$ | 4,762,233 | $ | 3,621,541 | $ | 129,993 | $ | (5,055,075 | ) | $ | 3,458,692 | |||||
| | | | | | | | | | | | | | | | | |
| | | | | | | | | | | | | | | | | |
| | | | | | | | | | | | | | | | | |
147
HALCÓN RESOURCES CORPORATION
NOTES TO THE CONSOLIDATED FINANCIAL STATEMENTS (Continued)
15. CONDENSED CONSOLIDATING FINANCIAL INFORMATION (Continued)
| |
December 31, 2014 | |||||||||||||||
|---|---|---|---|---|---|---|---|---|---|---|---|---|---|---|---|---|
| |
Parent Company |
Guarantor Subsidiaries |
Non-Guarantor Subsidiary |
Eliminations | Consolidated | |||||||||||
| |
(In thousands) |
|||||||||||||||
Current assets: |
||||||||||||||||
Cash |
$ | — | $ | 15 | $ | 43,698 | $ | — | $ | 43,713 | ||||||
Accounts receivable |
— | 262,543 | 14,858 | (842 | ) | 276,559 | ||||||||||
Receivables from derivative contracts |
— | 352,530 | — | — | 352,530 | |||||||||||
Restricted cash |
— | — | 16,131 | — | 16,131 | |||||||||||
Inventory |
— | 4,619 | 74 | — | 4,693 | |||||||||||
Prepaids and other |
372 | 8,707 | — | — | 9,079 | |||||||||||
| | | | | | | | | | | | | | | | | |
Total current assets |
372 | 628,414 | 74,761 | (842 | ) | 702,705 | ||||||||||
| | | | | | | | | | | | | | | | | |
Oil and natural gas properties (full cost method): |
||||||||||||||||
Evaluated |
— | 6,169,553 | 225,617 | (4,350 | ) | 6,390,820 | ||||||||||
Unevaluated |
— | 1,558,412 | 271,374 | — | 1,829,786 | |||||||||||
| | | | | | | | | | | | | | | | | |
Gross oil and natural gas properties |
— | 7,727,965 | 496,991 | (4,350 | ) | 8,220,606 | ||||||||||
Less—accumulated depletion |
— | (2,797,606 | ) | (159,782 | ) | 4,350 | (2,953,038 | ) | ||||||||
| | | | | | | | | | | | | | | | | |
Net oil and natural gas properties |
— | 4,930,359 | 337,209 | — | 5,267,568 | |||||||||||
| | | | | | | | | | | | | | | | | |
Other operating property and equipment: |
||||||||||||||||
Gas gathering and other operating assets |
14,523 | 112,103 | 178 | — | 126,804 | |||||||||||
Less—accumulated depreciation |
(6,522 | ) | (8,259 | ) | (17 | ) | — | (14,798 | ) | |||||||
| | | | | | | | | | | | | | | | | |
Net other operating property and equipment |
8,001 | 103,844 | 161 | — | 112,006 | |||||||||||
| | | | | | | | | | | | | | | | | |
Other noncurrent assets: |
||||||||||||||||
Receivables from derivative contracts |
— | 151,324 | — | — | 151,324 | |||||||||||
Debt issuance costs, net |
4,656 | — | — | — | 4,656 | |||||||||||
Deferred income taxes |
(54 | ) | 136,880 | — | — | 136,826 | ||||||||||
Intercompany notes and accounts receivable |
4,891,427 | 239,250 | — | (5,130,677 | ) | — | ||||||||||
Investment in subsidiary |
803,786 | 274,553 | — | (1,078,339 | ) | — | ||||||||||
Equity in oil and natural gas partnership |
— | 4,309 | — | — | 4,309 | |||||||||||
Funds in escrow and other |
515 | 684 | 2,634 | — | 3,833 | |||||||||||
| | | | | | | | | | | | | | | | | |
Total assets |
$ | 5,708,703 | $ | 6,469,617 | $ | 414,765 | $ | (6,209,858 | ) | $ | 6,383,227 | |||||
| | | | | | | | | | | | | | | | | |
| | | | | | | | | | | | | | | | | |
| | | | | | | | | | | | | | | | | |
Current liabilities: |
||||||||||||||||
Accounts payable and accrued liabilities |
$ | — | $ | 592,340 | $ | 50,706 | $ | (35,296 | ) | $ | 607,750 | |||||
Asset retirement obligations |
— | 106 | — | — | 106 | |||||||||||
Current portion of deferred income taxes |
1,794 | 135,032 | — | — | 136,826 | |||||||||||
| | | | | | | | | | | | | | | | | |
Total current liabilities |
1,794 | 727,478 | 50,706 | (35,296 | ) | 744,682 | ||||||||||
| | | | | | | | | | | | | | | | | |
Long-term debt, net |
3,695,488 | — | — | — | 3,695,488 | |||||||||||
Other noncurrent liabilities: |
||||||||||||||||
Liabilities from derivative contracts |
— | 9,387 | — | — | 9,387 | |||||||||||
Asset retirement obligations |
— | 37,538 | 833 | — | 38,371 | |||||||||||
Intercompany notes and accounts payable |
239,250 | 4,891,427 | — | (5,130,677 | ) | — | ||||||||||
Other |
2 | 1 | 5,961 | — | 5,964 | |||||||||||
Commitments and contingencies |
||||||||||||||||
Mezzanine equity: |
||||||||||||||||
Redeemable noncontrolling interest |
— | — | 117,166 | — | 117,166 | |||||||||||
Stockholders' equity: |
||||||||||||||||
Preferred stock |
— | — | — | — | — | |||||||||||
Common stock |
8 | — | — | — | 8 | |||||||||||
Additional paid-in capital |
2,995,436 | — | 402,351 | (402,351 | ) | 2,995,436 | ||||||||||
Retained earnings (accumulated deficit) |
(1,223,275 | ) | 803,786 | (162,252 | ) | (641,534 | ) | (1,223,275 | ) | |||||||
| | | | | | | | | | | | | | | | | |
Total stockholders' equity |
1,772,169 | 803,786 | 240,099 | (1,043,885 | ) | 1,772,169 | ||||||||||
| | | | | | | | | | | | | | | | | |
Total liabilities and stockholders' equity |
$ | 5,708,703 | $ | 6,469,617 | $ | 414,765 | $ | (6,209,858 | ) | $ | 6,383,227 | |||||
| | | | | | | | | | | | | | | | | |
| | | | | | | | | | | | | | | | | |
| | | | | | | | | | | | | | | | | |
148
HALCÓN RESOURCES CORPORATION
NOTES TO THE CONSOLIDATED FINANCIAL STATEMENTS (Continued)
15. CONDENSED CONSOLIDATING FINANCIAL INFORMATION (Continued)
CONDENSED CONSOLIDATING STATEMENTS OF CASH FLOWS
| |
Year Ended December 31, 2015 | |||||||||||||||
|---|---|---|---|---|---|---|---|---|---|---|---|---|---|---|---|---|
| |
Parent Company |
Guarantor Subsidiaries |
Non-Guarantor Subsidiary |
Eliminations | Consolidated | |||||||||||
| |
(In thousands) |
|||||||||||||||
Cash flows from operating activities: |
||||||||||||||||
Net cash provided by (used in) operating activities |
$ | (382,515 | ) | $ | 839,449 | $ | 10,065 | $ | — | $ | 466,999 | |||||
Cash flows from investing activities: |
||||||||||||||||
Oil and natural gas capital expenditures |
— | (614,122 | ) | (45,297 | ) | — | (659,419 | ) | ||||||||
Proceeds received from sales of oil and natural gas assets |
— | 1,222 | — | — | 1,222 | |||||||||||
Other operating property and equipment capital expenditures |
(872 | ) | (9,969 | ) | 3 | — | (10,838 | ) | ||||||||
Advances to subsidiary |
216,849 | — | — | (216,849 | ) | — | ||||||||||
Funds held in escrow and other |
1,549 | 354 | — | — | 1,903 | |||||||||||
| | | | | | | | | | | | | | | | | |
Net cash provided by (used in) investing activities |
217,526 | (622,515 | ) | (45,294 | ) | (216,849 | ) | (667,132 | ) | |||||||
| | | | | | | | | | | | | | | | | |
Cash flows from financing activities: |
||||||||||||||||
Proceeds from borrowings |
1,834,000 | — | — | — | 1,834,000 | |||||||||||
Repayments of borrowings |
(1,643,804 | ) | — | — | — | (1,643,804 | ) | |||||||||
Debt issuance costs |
(29,568 | ) | — | — | — | (29,568 | ) | |||||||||
Series A preferred dividends |
(8,177 | ) | — | — | — | (8,177 | ) | |||||||||
Common stock issued |
15,356 | — | — | — | 15,356 | |||||||||||
Restricted cash |
— | — | (543 | ) | — | (543 | ) | |||||||||
Proceeds from subsidiary |
— | (216,849 | ) | — | 216,849 | — | ||||||||||
Offering costs and other |
(2,818 | ) | — | — | — | (2,818 | ) | |||||||||
| | | | | | | | | | | | | | | | | |
Net cash provided by (used in) financing activities |
164,989 | (216,849 | ) | (543 | ) | 216,849 | 164,446 | |||||||||
| | | | | | | | | | | | | | | | | |
Net increase (decrease) in cash |
— | 85 | (35,772 | ) | — | (35,687 | ) | |||||||||
Cash at beginning of period |
— |
15 |
43,698 |
— |
43,713 |
|||||||||||
| | | | | | | | | | | | | | | | | |
Cash at end of period |
$ | — | $ | 100 | $ | 7,926 | $ | — | $ | 8,026 | ||||||
| | | | | | | | | | | | | | | | | |
| | | | | | | | | | | | | | | | | |
| | | | | | | | | | | | | | | | | |
149
HALCÓN RESOURCES CORPORATION
NOTES TO THE CONSOLIDATED FINANCIAL STATEMENTS (Continued)
15. CONDENSED CONSOLIDATING FINANCIAL INFORMATION (Continued)
| |
Year Ended December 31, 2014 | |||||||||||||||
|---|---|---|---|---|---|---|---|---|---|---|---|---|---|---|---|---|
| |
Parent Company |
Guarantor Subsidiaries |
Non-Guarantor Subsidiary |
Eliminations | Consolidated | |||||||||||
| |
(In thousands) |
|||||||||||||||
Cash flows from operating activities: |
||||||||||||||||
Net cash provided by (used in) operating activities |
$ | (368,406 | ) | $ | 1,029,056 | $ | 11,634 | $ | (4,350 | ) | $ | 667,934 | ||||
Cash flows from investing activities: |
||||||||||||||||
Oil and natural gas capital expenditures |
— | (1,404,492 | ) | (124,199 | ) | 4,350 | (1,524,341 | ) | ||||||||
Proceeds received from sales of oil and natural gas assets |
— | 450,407 | 33,777 | — | 484,184 | |||||||||||
Advance on carried interest |
— | (62,500 | ) | (126,942 | ) | — | (189,442 | ) | ||||||||
Other operating property and equipment capital expenditures |
(1,132 | ) | (41,863 | ) | (88 | ) | — | (43,083 | ) | |||||||
Advances to subsidiary |
(179,123 | ) | (154,138 | ) | — | 333,261 | — | |||||||||
Funds held in escrow and other |
— | 1,589 | — | — | 1,589 | |||||||||||
| | | | | | | | | | | | | | | | | |
Net cash provided by (used in) investing activities |
(180,255 | ) | (1,210,997 | ) | (217,452 | ) | 337,611 | (1,271,093 | ) | |||||||
| | | | | | | | | | | | | | | | | |
Cash flows from financing activities: |
||||||||||||||||
Proceeds from borrowings |
2,276,000 | — | — | — | 2,276,000 | |||||||||||
Repayments of borrowings |
(1,719,000 | ) | — | — | — | (1,719,000 | ) | |||||||||
Debt issuance costs |
(819 | ) | — | — | — | (819 | ) | |||||||||
Series A preferred dividends |
(4,960 | ) | — | — | — | (4,960 | ) | |||||||||
HK TMS, LLC preferred stock issued |
— | — | 110,051 | — | 110,051 | |||||||||||
HK TMS, LLC tranche rights |
— | — | 4,516 | — | 4,516 | |||||||||||
Preferred dividends on redeemable noncontrolling interest |
— | — | (3,518 | ) | — | (3,518 | ) | |||||||||
Restricted cash |
— | — | (16,131 | ) | — | (16,131 | ) | |||||||||
Proceeds from subsidiary |
— | 179,123 | 154,138 | (333,261 | ) | — | ||||||||||
Offering costs and other |
(2,561 | ) | — | 460 | — | (2,101 | ) | |||||||||
| | | | | | | | | | | | | | | | | |
Net cash provided by (used in) financing activities |
548,660 | 179,123 | 249,516 | (333,261 | ) | 644,038 | ||||||||||
| | | | | | | | | | | | | | | | | |
Net increase (decrease) in cash |
(1 | ) | (2,818 | ) | 43,698 | — | 40,879 | |||||||||
Cash at beginning of period |
1 |
2,833 |
— |
— |
2,834 |
|||||||||||
| | | | | | | | | | | | | | | | | |
Cash at end of period |
$ | — | $ | 15 | $ | 43,698 | $ | — | $ | 43,713 | ||||||
| | | | | | | | | | | | | | | | | |
| | | | | | | | | | | | | | | | | |
| | | | | | | | | | | | | | | | | |
150
SUPPLEMENTAL OIL AND GAS INFORMATION (UNAUDITED)
Oil and Natural Gas Reserves
Users of this information should be aware that the process of estimating quantities of "proved" and "proved developed" oil and natural gas reserves is very complex, requiring significant subjective decisions in the evaluation of all available geological, engineering and economic data for each reservoir. The data for a given reservoir may also change substantially over time as a result of numerous factors including, but not limited to, additional development activity, evolving production history and continual reassessment of the viability of production under varying economic conditions. As a result, revisions to existing reserve estimates may occur from time to time. Although every reasonable effort is made to ensure reserve estimates reported represent the most accurate assessments possible, the subjective decisions and variances in available data for various reservoirs make these estimates generally less precise than other estimates included in the financial statement disclosures.
Proved reserves represent estimated quantities of natural gas, crude oil and condensate and natural gas liquids that geological and engineering data demonstrate, with reasonable certainty, to be recoverable in future years from known reservoirs under economic and operating conditions in effect when the estimates were made. Proved developed reserves are proved reserves expected to be recovered through wells and equipment in place and under operating methods used when the estimates were made.
The proved reserves estimates shown herein for the years ended December 31, 2015, 2014 and 2013 have been independently evaluated by Netherland, Sewell, a worldwide leader of petroleum property analysis for industry and financial organizations and government agencies. Netherland, Sewell was founded in 1961 and performs consulting petroleum engineering services under Texas Board of Professional Engineers Registration No. F-2699. Within Netherland, Sewell, the technical persons primarily responsible for preparing the estimates set forth in the Netherland, Sewell reserves report incorporated herein are Mr. J. Carter Henson, Jr. and Mr. David E. Nice. Mr. Henson, a Licensed Professional Engineer in the State of Texas (No. 73964), has been practicing consulting petroleum engineering at Netherland, Sewell since 1989 and has over 8 years of prior industry experience. He graduated from Rice University in 1981 with a Bachelor of Science Degree in Mechanical Engineering. Mr. Nice, a Licensed Professional Geoscientist in the State of Texas (No. 346), has been practicing consulting petroleum geoscience at Netherland, Sewell since 1998 and has over 13 years of prior industry experience. He graduated from University of Wyoming in 1982 with a Bachelor of Science Degree in Geology and in 1985 with a Master of Science Degree in Geology. Netherland, Sewell has reported to the Company, that both technical principals meet or exceed the education, training, and experience requirements set forth in the Standards Pertaining to the Estimating and Auditing of Oil and Gas Reserves Information promulgated by the Society of Petroleum Engineers; both are proficient in judiciously applying industry standard practices to engineering and geoscience evaluations as well as applying SEC and other industry reserves definitions and guidelines.
The Company's board of directors has established an independent reserves committee composed of three outside directors, all of whom have experience in energy company reserve evaluations. The Company's independent engineering firm reports jointly to the reserves committee and to the Senior Vice President of Corporate Reserves. The reserves committee is charged with ensuring the integrity of the process of selection and engagement of the independent engineering firm and in making a recommendation to the board of directors as to whether to accept the report prepared by the independent consulting petroleum engineers. Ms. Tina Obut, the Company's Senior Vice President of Corporate Reserves was the technical person primarily responsible for overseeing the preparation of the annual reserve report by Netherland, Sewell. She graduated from Marietta College with a Bachelor of Science degree in Petroleum Engineering, received a Master of Science degree in Petroleum and
151
Natural Gas Engineering from Penn State University and a Master of Business Administration degree from the University of Houston.
The reserves information in this Annual Report on Form 10-K represents only estimates. There are a number of uncertainties inherent in estimating quantities of proved reserves, including many factors beyond the Company's control, such as commodity pricing. Reserve engineering is a subjective process of estimating underground accumulations of oil and natural gas that cannot be measured in an exact manner. The accuracy of any reserve estimate is a function of the quality of available data and of engineering and geological interpretation and judgment. As a result, estimates of different engineers may vary. In addition, results of drilling, testing and production subsequent to the date of an estimate may lead to revising the original estimate. Accordingly, initial reserve estimates are often different from the quantities of oil and natural gas that are ultimately recovered. The meaningfulness of such estimates depends primarily on the accuracy of the assumptions upon which they were based. Except to the extent the Company acquires additional properties containing proved reserves or conducts successful exploration and development activities or both, the Company's proved reserves will decline as reserves are produced.
The following table illustrates the Company's estimated net proved reserves, including changes, and proved developed reserves for the periods indicated. The oil and natural gas liquids prices as of December 31, 2015, 2014 and 2013 are based on the respective 12-month unweighted average of the first of the month prices of the West Texas Intermediate spot price which equates to $50.28 per barrel, $94.99 per barrel and $96.94 per barrel, respectively. The natural gas prices as of December 31, 2015, 2014 and 2013 are based on the respective 12-month unweighted average of the first of the month prices of the Henry Hub spot price which equates to $2.587 per MMBtu, $4.350 per MMBtu and $3.670 per MMBtu, respectively. All prices are adjusted by lease or field for energy content,
152
transportation fees, and market differentials. All prices are held constant in accordance with SEC guidelines. All proved reserves are located in the United States.
| |
Proved Reserves | ||||||||||||
|---|---|---|---|---|---|---|---|---|---|---|---|---|---|
| |
Oil (MBbls) | Natural Gas (MMcf) |
Natural Gas Liquids (MBbls) |
Equivalent (MBoe) |
|||||||||
Proved reserves, December 31, 2012 |
87,378 | 96,145 | 5,383 | 108,785 | |||||||||
Extensions and discoveries |
61,160 | 25,364 | 4,344 | 69,731 | |||||||||
Purchase of minerals in place |
2,770 | 1,791 | 162 | 3,231 | |||||||||
Production |
(10,148 | ) | (8,003 | ) | (683 | ) | (12,165 | ) | |||||
Sale of minerals in place |
(17,417 | ) | (25,717 | ) | (1,611 | ) | (23,314 | ) | |||||
Revision of previous estimates |
(9,233 | ) | (19,832 | ) | 2,237 | (10,301 | ) | ||||||
| | | | | | | | | | | | | | |
Proved reserves, December 31, 2013 |
114,510 | 69,748 | 9,832 | 135,967 | |||||||||
| | | | | | | | | | | | | | |
Extensions and discoveries |
61,312 | 31,937 | 5,984 | 72,619 | |||||||||
Purchase of minerals in place |
942 | 767 | 45 | 1,115 | |||||||||
Production |
(12,787 | ) | (8,812 | ) | (1,113 | ) | (15,369 | ) | |||||
Sale of minerals in place |
(14,487 | ) | (8,125 | ) | (1,789 | ) | (17,630 | ) | |||||
Revision of previous estimates |
6,084 | 18,147 | 3,327 | 12,435 | |||||||||
| | | | | | | | | | | | | | |
Proved reserves, December 31, 2014 |
155,574 | 103,662 | 16,286 | 189,137 | |||||||||
| | | | | | | | | | | | | | |
Extensions and discoveries |
10,117 | 6,838 | 1,215 | 12,472 | |||||||||
Purchase of minerals in place |
36 | 17 | 4 | 43 | |||||||||
Production |
(12,019 | ) | (10,123 | ) | (1,457 | ) | (15,163 | ) | |||||
Sale of minerals in place |
(5 | ) | (2 | ) | (1 | ) | (6 | ) | |||||
Revision of previous estimates |
(33,010 | ) | (21,950 | ) | (3,010 | ) | (39,679 | ) | |||||
| | | | | | | | | | | | | | |
Proved reserves, December 31, 2015 |
120,693 | 78,442 | 13,037 | 146,804 | |||||||||
| | | | | | | | | | | | | | |
| | | | | | | | | | | | | | |
| | | | | | | | | | | | | | |
| |
Proved Developed Reserves | ||||||||||||
|---|---|---|---|---|---|---|---|---|---|---|---|---|---|
| |
Oil (MBbls) | Natural Gas (MMcf) |
Natural Gas Liquids (MBbls) |
Equivalent (MBoe) |
|||||||||
December 31, 2015 |
66,123 | 49,201 | 7,561 | 81,885 | |||||||||
December 31, 2014 |
62,770 | 47,851 | 6,681 | 77,427 | |||||||||
December 31, 2013 |
44,113 | 37,714 | 4,206 | 54,605 | |||||||||
| |
Proved Undeveloped Reserves | ||||||||||||
|---|---|---|---|---|---|---|---|---|---|---|---|---|---|
| |
Oil (MBbls) | Natural Gas (MMcf) |
Natural Gas Liquids (MBbls) |
Equivalent (MBoe) |
|||||||||
December 31, 2015 |
54,570 | 29,241 | 5,476 | 64,919 | |||||||||
December 31, 2014 |
92,804 | 55,811 | 9,605 | 111,710 | |||||||||
December 31, 2013 |
70,397 | 32,034 | 5,626 | 81,362 | |||||||||
The Company's reserves have been estimated using deterministic methods. The total proved reserve decrease of 42.3 MMBoe during 2015 is the result of an increase in proved developed reserves of 4.5 MMBoe offset by a decrease of 46.8 MMBoe in proved undeveloped (PUD) reserves.
During 2015, the Company added 12.5 MMBoe in proved reserves by drilling extensions and infill development primarily in the Bakken / Three Forks and El Halcón areas. Extensions and discoveries were offset by negative revisions due to the sustained decline in commodity prices, resulting in an overall negative revision of 39.7 MMBoe.
153
During 2014, the Company added 72.6 MMBoe in proved reserves by drilling extensions and infill development in the Bakken / Three Forks and El Halcón areas and an additional 12.4 MMBoe in positive revisions driven by better performance in the Bakken / Three Forks area. Sales of 17.6 MMBoe of proved reserves are primarily attributable to the divestiture of the East Texas Assets.
During 2013, the Company divested 23.3 MMBoe of non-core assets. As a result of the Company's development program, 69.7 MMBoe of proved reserves were added, primarily in the Bakken / Three Forks and El Halcón areas. The negative revision of 10.3 MMBoe is largely due to Woodbine drilling results leading to a general reduction in estimated ultimate recovery (EUR).
At December 31, 2015, the Company's estimated PUD reserves were approximately 64.9 MMBoe, a 46.8 MMBoe net decrease over the previous year's estimate of 111.7 MMBoe. The following details the changes in PUD reserves for 2015 (MBoe):
Beginning proved undeveloped reserves at December 31, 2014 |
111,710 | |||
Undeveloped reserves transferred to developed |
(14,594 | ) | ||
Revisions |
(38,110 | ) | ||
Extension and discoveries |
5,913 | |||
| | | | | |
Ending proved undeveloped reserves at December 31, 2015 |
64,919 | |||
| | | | | |
| | | | | |
| | | | | |
The decrease in PUD reserves was due to a negative revision associated with the decline in the unweighted 12-month average prices of oil and natural gas during 2015. Negative revisions of approximately 38 MMBoe were largely associated with PUD locations in the Bakken / Three Forks and El Halcón areas that became uneconomic at the lower unweighted 12-month average prices of oil and natural gas as of December 31, 2015, or were removed because they no longer met the SEC five year development requirement as the Company has reduced its capital spending since the prior year as a result of the sustained decline in oil and natural gas prices. Further reductions of approximately 15 MMBoe in PUD reserves were the direct result of the Company's development of PUD reserves through its drilling program and the associated transfer of those reserves to proved developed reserves, primarily in the Bakken / Three Forks and El Halcón areas.
As of December 31, 2015 all of the Company's PUD reserves are planned to be developed within five years from the date they were initially recorded. During 2015, approximately $285.2 million in capital expenditures went toward the development of proved undeveloped reserves, which includes drilling, completion and other facility costs associated with developing proved undeveloped wells.
For wells classified as proved developed producing where sufficient production history existed, reserves were based on individual well performance evaluation and production decline curve extrapolation techniques. For undeveloped locations and wells that lacked sufficient production history, reserves were based on analogy to producing wells within the same area exhibiting similar geologic and reservoir characteristics, combined with volumetric methods. The volumetric estimates were based on geologic maps and rock and fluid properties derived from well logs, core data, pressure measurements, and fluid samples. Well spacing was determined from drainage patterns derived from a combination of performance-based recoveries and volumetric estimates for each area or field. PUD locations were limited to areas of uniformly high quality reservoir properties, between existing commercial producers.
Reliable technologies were used to determine areas where PUD locations are more than one offset location away from a producing well. These technologies include seismic data, wire line open hole log data, core data, log cross-sections, performance data, and statistical analysis. In such areas, these data demonstrated consistent, continuous reservoir characteristics in addition to significant quantities of economic EURs from individual producing wells. The Company's management team has been a leader in data gathering and evaluation in these areas and was instrumental in developing consortiums that allow various operators to exchange data. The Company relied only on production flow tests and
154
historical production data, along with the reliable geologic data mentioned above to estimate proved reserves. No other alternative methods or technologies were used to estimate proved reserves.
Capitalized Costs Relating to Oil and Natural Gas Producing Activities
The following table illustrates the total amount of capitalized costs relating to oil and natural gas producing activities and the total amount of related accumulated depletion, depreciation and accretion.
| |
December 31, | |||||||||
|---|---|---|---|---|---|---|---|---|---|---|
| |
2015 | 2014 | 2013 | |||||||
| |
(In thousands) |
|||||||||
Evaluated oil and natural gas properties(1) |
$ | 7,060,721 | $ | 6,390,820 | $ | 4,960,467 | ||||
Unevaluated oil and natural gas properties |
1,641,356 | 1,829,786 | 2,028,044 | |||||||
| | | | | | | | | | | |
|
8,702,077 | 8,220,606 | 6,988,511 | |||||||
Accumulated depletion(1) |
(5,933,688 | ) | (2,953,038 | ) | (2,189,515 | ) | ||||
| | | | | | | | | | | |
|
$ | 2,768,389 | $ | 5,267,568 | $ | 4,798,996 | ||||
| | | | | | | | | | | |
| | | | | | | | | | | |
| | | | | | | | | | | |
- (1)
- Amounts do not include costs for the Company's gas gathering systems and related support equipment.
Costs Incurred in Oil and Natural Gas Property Acquisition, Exploration and Development Activities
Costs incurred in property acquisition, exploration and development activities were as follows:
| |
Years Ended December 31, | |||||||||
|---|---|---|---|---|---|---|---|---|---|---|
| |
2015 | 2014 | 2013 | |||||||
| |
(In thousands) |
|||||||||
Property acquisition costs, proved(1) |
$ | (582 | ) | $ | 16,037 | $ | 71,443 | |||
Property acquisition costs, unproved |
268 | 220,044 | 436,438 | |||||||
Exploration and extension well costs |
194,683 | 1,107,549 | 1,182,110 | |||||||
Development costs |
285,194 | 374,252 | 748,962 | |||||||
| | | | | | | | | | | |
Total costs |
$ | 479,563 | $ | 1,717,882 | $ | 2,438,953 | ||||
| | | | | | | | | | | |
| | | | | | | | | | | |
| | | | | | | | | | | |
- (1)
- Proved property acquisition costs in 2015 primarily consist of purchase price adjustments related to prior year acquisitions.
Standardized Measure of Discounted Future Net Cash Flows Relating to Proved Oil and Natural Gas Reserves
The following Standardized Measure of Discounted Future Net Cash Flows (Standardized Measure) has been developed utilizing ASC 932, Extractive Activities—Oil and Gas (ASC 932) procedures and based on oil and natural gas reserve and production volumes estimated by the Company's engineering staff. It can be used for some comparisons, but should not be the only method used to evaluate the Company or its performance. Further, the information in the following table may not represent realistic assessments of future cash flows, nor should the Standardized Measure be viewed as representative of the current value of the Company.
The Company believes that the following factors should be taken into account when reviewing the following information:
- •
- future costs and selling prices will probably differ from those required to be used in these calculations;
155
- •
- due to future market conditions and governmental regulations, actual rates of production in future years may vary significantly from
the rate of production assumed in the calculations;
- •
- a 10% discount rate may not be reasonable as a measure of the relative risk inherent in realizing future net oil and natural gas
revenues; and
- •
- future net revenues may be subject to different rates of income taxation.
At December 31, 2015, 2014 and 2013, as specified by the SEC, the prices for oil and natural gas used in this calculation were the unweighted 12-month average of the first day of the month prices, except for volumes subject to fixed price contracts. Estimates of future income taxes are computed using current statutory income tax rates including consideration for estimated future statutory depletion and tax credits. The resulting net cash flows are reduced to present value amounts by applying a 10% discount factor.
The Standardized Measure is as follows:
| |
Years Ended December 31, | |||||||||
|---|---|---|---|---|---|---|---|---|---|---|
| |
2015 | 2014 | 2013 | |||||||
| |
(In thousands) |
|||||||||
Future cash inflows |
$ | 5,406,179 | $ | 14,439,301 | $ | 11,351,887 | ||||
Future production costs |
(2,414,629 | ) | (4,804,728 | ) | (3,680,190 | ) | ||||
Future development costs |
(813,814 | ) | (2,795,208 | ) | (2,182,509 | ) | ||||
Future income tax expense |
— | (1,979,245 | ) | (108,871 | ) | |||||
| | | | | | | | | | | |
Future net cash flows before 10% discount |
2,177,736 | 4,860,120 | 5,380,317 | |||||||
10% annual discount for estimated timing of cash flows |
(1,067,171 | ) | (1,603,750 | ) | (2,634,322 | ) | ||||
| | | | | | | | | | | |
Standardized measure of discounted future net cash flows |
$ | 1,110,565 | $ | 3,256,370 | $ | 2,745,995 | ||||
| | | | | | | | | | | |
| | | | | | | | | | | |
| | | | | | | | | | | |
Changes in Standardized Measure of Discounted Future Net Cash Flows Relating to Proved Oil and Natural Gas Reserves
The following is a summary of the changes in the Standardized Measure for the Company's proved oil and natural gas reserves during each of the years in the three year period ended December 31, 2015:
| |
Years Ended December 31, | |||||||||
|---|---|---|---|---|---|---|---|---|---|---|
| |
2015 | 2014 | 2013 | |||||||
| |
(In thousands) |
|||||||||
Beginning of year |
$ | 3,256,370 | $ | 2,745,995 | $ | 1,954,052 | ||||
Sale of oil and natural gas produced, net of production costs |
(375,137 | ) | (893,117 | ) | (761,716 | ) | ||||
Purchase of minerals in place |
946 | 22,142 | 94,844 | |||||||
Sales of minerals in place |
(96 | ) | (475,096 | ) | (434,421 | ) | ||||
Extensions and discoveries |
94,679 | 1,298,611 | 1,125,162 | |||||||
Changes in income taxes, net |
170,546 | (151,690 | ) | 344,165 | ||||||
Changes in prices and costs |
(2,452,581 | ) | 64,467 | (107,780 | ) | |||||
Previously estimated development costs incurred |
295,258 | 424,504 | 340,577 | |||||||
Net changes in future development costs |
456,726 | (10,774 | ) | 211,350 | ||||||
Revisions of previous quantities |
(718,932 | ) | 226,499 | (219,424 | ) | |||||
Accretion of discount |
342,692 | 276,485 | 231,707 | |||||||
Changes in production rates and other |
40,094 | (271,656 | ) | (32,521 | ) | |||||
| | | | | | | | | | | |
End of year |
$ | 1,110,565 | $ | 3,256,370 | $ | 2,745,995 | ||||
| | | | | | | | | | | |
| | | | | | | | | | | |
| | | | | | | | | | | |
156
SELECTED QUARTERLY FINANCIAL DATA (UNAUDITED)
The following table presents selected quarterly financial data derived from the Company's unaudited consolidated interim financial statements. The following data is only a summary and should be read with the Company's historical consolidated financial statements and related notes contained in this document.
| |
Quarters Ended | ||||||||||||
|---|---|---|---|---|---|---|---|---|---|---|---|---|---|
| |
March 31 | June 30 | September 30 | December 31 | |||||||||
| |
(In thousands, except per share amounts) |
||||||||||||
2015 |
|||||||||||||
Total operating revenues |
$ | 136,194 | $ | 168,024 | $ | 129,939 | $ | 116,121 | |||||
Income (loss) from operations |
(626,169 | ) | (954,387 | ) | (528,685 | ) | (635,265 | ) | |||||
Net income (loss) |
(587,641 | ) | (1,088,612 | ) | 147,075 | (393,443 | ) | ||||||
Net income (loss) available to common stockholders(1) |
(601,193 | ) | (1,104,581 | ) | 123,528 | (424,712 | ) | ||||||
Net income (loss) per share of common stock: |
|||||||||||||
Basic |
$ | (7.16 | ) | $ | (10.13 | ) | $ | 1.05 | $ | (3.56 | ) | ||
Diluted |
$ | (7.16 | ) | $ | (10.13 | ) | $ | 0.88 | $ | (3.56 | ) | ||
| |
Quarters Ended | ||||||||||||
|---|---|---|---|---|---|---|---|---|---|---|---|---|---|
| |
March 31 | June 30 | September 30 | December 31 | |||||||||
| |
(In thousands, except per share amounts) |
||||||||||||
2014 |
|||||||||||||
Total operating revenues |
$ | 275,149 | $ | 327,144 | $ | 306,509 | $ | 239,459 | |||||
Income (loss) from operations |
(8,369 | ) | 91,290 | 71,503 | (212,811 | ) | |||||||
Net income (loss) |
(72,964 | ) | (67,477 | ) | 197,635 | 258,762 | |||||||
Net income (loss) available to common stockholders(2) |
(77,923 | ) | (73,333 | ) | 186,853 | 247,345 | |||||||
Net income (loss) per share of common stock: |
|||||||||||||
Basic |
$ | (0.94 | ) | $ | (0.88 | ) | $ | 2.24 | $ | 2.96 | |||
Diluted |
$ | (0.94 | ) | $ | (0.88 | ) | $ | 1.79 | $ | 2.38 | |||
- (1)
- The volatility in "Net income (loss) available to common stockholders" is substantially due to a) the Company's full cost
ceiling impairments, b) the gains on the extinguishment of debt and c) the Company's realized and unrealized gains and losses on its derivative contracts. See Note 4, "Oil and
Natural Gas Properties", Note 5, "Long-term Debt" and Note 7, "Derivative and Hedging Activities" for additional information.
- (2)
- The volatility in "Net income (loss) available to common stockholders" is substantially due to a) the Company's full cost ceiling impairments recorded during the first and fourth quarters of 2014, b) the Company's other operating property equipment impairments in the first and fourth quarters of 2014 and c) unrealized gains and losses on the Company's derivative contracts. See Note 1, "Summary of Significant Events and Accounting Policies," Note 4, "Oil and Natural Gas Properties" and Note 7, "Derivative and Hedging Activities" for additional information.
157
ITEM 9. CHANGES IN AND DISAGREEMENTS WITH ACCOUNTANTS ON ACCOUNTING AND FINANCIAL DISCLOSURE
None.
ITEM 9A. CONTROLS AND PROCEDURES
Management's Evaluation of Disclosure Controls and Procedures
In accordance with Rules 13a-15(f) and 15d-15(f), of the Exchange Act, we carried out an evaluation, under the supervision and with the participation of management, including our Chief Executive Officer and our Chief Financial Officer, of the effectiveness of our disclosure controls and procedures based on the Internal Control—Integrated Framework issued by the Committee of Sponsoring Organizations of the Treadway Commission in 2013 as of the end of the period covered by this report. Based on that evaluation, our Chief Executive Officer and Chief Financial Officer concluded that our disclosure controls and procedures were effective as of December 31, 2015 to provide reasonable assurance that information required to be disclosed in our reports filed or submitted under the Exchange Act is recorded, processed, summarized and reported within the time periods specified in the SEC's rules and forms. Our disclosure controls and procedures include controls and procedures designed to ensure that information required to be disclosed in reports filed or submitted under the Exchange Act is accumulated and communicated to our management, including our Chief Executive Officer and Chief Financial Officer, as appropriate, to allow timely decisions regarding required disclosure.
Management's Report on Internal Control over Financial Reporting
Management has assessed, and our independent registered public accounting firm, Deloitte & Touche LLP, has audited, our internal control over financial reporting as of December 31, 2015. The unqualified reports of management and Deloitte & Touche LLP thereon are included in Item 8. Consolidated Financial Statements and Supplementary Data of this Annual Report on Form 10-K and are incorporated by reference herein.
Changes in Internal Control over Financial Reporting
There has been no change in our internal control over financial reporting, as defined in Rules 13a-15(f) and 15d-15(f) of the Exchange Act, during the three months ended December 31, 2015 that has materially affected, or is reasonably likely to materially affect, our internal control over financial reporting.
None.
158
ITEM 10. DIRECTORS, EXECUTIVE OFFICERS AND CORPORATE GOVERNANCE
Pursuant to General Instruction 6 to Form 10-K, we incorporate by reference into this Item the information to be disclosed in our definitive proxy statement for our 2016 Annual Meeting of Stockholders.
The Company's Code of Conduct and Code of Ethics for the Chief Executive Officer and Senior Financial Officers can be found on the Company's website located at www.halconresources.com. Any stockholder may request a printed copy of such materials by submitting a written request to the Company's Corporate Secretary. If the Company amends the Code of Ethics or grants a waiver, including an implicit waiver, from the Code of Ethics, the Company will disclose the information on its website. The waiver information will remain on the website for at least twelve months after the initial disclosure of such waiver.
ITEM 11. EXECUTIVE COMPENSATION
Pursuant to General Instruction 6 to Form 10-K, we incorporate by reference into this Item the information to be disclosed in our definitive proxy statement for our 2016 Annual Meeting of Stockholders.
ITEM 12. SECURITY OWNERSHIP OF CERTAIN BENEFICIAL OWNERS AND MANAGEMENT AND RELATED STOCKHOLDER MATTERS
Equity Compensation Plan Information
The following table sets forth certain information as of December 31, 2015 with respect to compensation plans (including individual compensation arrangements) under which our equity securities are authorized for issuance.
Plan Category
|
Number of Securities to be Issued Upon Exercise of Outstanding Options and Rights(a) |
Weighted-Average Exercise Price of Outstanding Options and Rights |
Number of Securities Remaining Available for Future Issuance Under Equity Compensation Plans (Excluding Securities Reflected in Column(a)) |
|||||||
|---|---|---|---|---|---|---|---|---|---|---|
Equity compensation plans approved by security holders(1) |
8,051,368 | (2) | $ | 17.80 | 6,281,499 | |||||
Equity compensation plans not approved by security holders |
— | — | — | |||||||
| | | | | | | | | | | |
|
8,051,368 | (2) | $ | 17.80 | 6,281,499 | |||||
| | | | | | | | | | | |
| | | | | | | | | | | |
| | | | | | | | | | | |
- (1)
- Represents information for the 2012 Long-Term Incentive Plan.
- (2)
- Includes 2,870,405 shares of restricted stock not yet vested.
Pursuant to General Instruction 6 to Form 10-K, we incorporate by reference into this Item the information to be disclosed in our definitive proxy statement for our 2016 Annual Meeting of Stockholders.
159
ITEM 13. CERTAIN RELATIONSHIPS AND RELATED TRANSACTIONS, AND DIRECTOR INDEPENDENCE
Pursuant to General Instruction 6 to Form 10-K, we incorporate by reference into this Item the information to be disclosed in our definitive proxy statement for our 2016 Annual Meeting of Stockholders.
ITEM 14. PRINCIPAL ACCOUNTANT FEES AND SERVICES
Pursuant to General Instruction 6 to Form 10-K, we incorporate by reference into this Item the information to be disclosed in our definitive proxy statement for our 2016 Annual Meeting of Stockholders.
160
ITEM 15. EXHIBITS AND FINANCIAL STATEMENT SCHEDULES
- (1)
- Consolidated Financial Statements:
The consolidated financial statements of the Company and its subsidiaries and reports of independent registered public accounting firms listed in Section 8 of this Annual Report on Form 10-K are filed as a part of this Annual Report on Form 10-K.
- (2)
- Consolidated Financial Statements Schedules:
All schedules are omitted because they are inapplicable or because the required information is contained in the financial statements or included in the notes thereto.
- (3)
- Exhibits:
| 3.1 | Amended and Restated Certificate of Incorporation of Halcón Resources Corporation dated May 6, 2015 (Incorporated by reference to Exhibit 3.1 of our Current Report on Form 8-K filed May 7, 2015). | ||
| 3.1.1 | * | Certificate of Amendment of the Amended and Restated Certificate of Incorporation of Halcón Resources Corporation, dated December 22, 2015. | |
| 3.1.2 | Certificate of Designations, Preferences, Rights and Limitations of 5.75% Series A Convertible Perpetual Preferred Stock of Halcón Resources Corporation (Incorporated by reference to Exhibit 3.1 of our Current Report on Form 8-K filed June 18, 2013). | ||
| 3.2 | Fifth Amended and Restated Bylaws of Halcón Resources Corporation (Incorporated by reference to Exhibit 3.2 of our Current Report on Form 8-K filed May 7, 2015). | ||
| 4.1 | Indenture dated as of July 16, 2012, among Halcón Resources Corporation, the subsidiary guarantors named therein and U.S. Bank National Association, as Trustee, relating to Halcón Resources Corporation's 9.75% Senior Notes due 2020 (Incorporated by reference to Exhibit 4.1 of our Current Report on Form 8-K filed July 17, 2012). | ||
| 4.2 | First Supplemental Indenture dated as of August 1, 2012, by and among Halcón Resources Corporation, the parties named therein as subsidiary guarantors, and U.S. Bank National Association, as Trustee, relating to the 9.75% senior notes due 2020 (Incorporated by reference to Exhibit 4.1 of our Current Report on Form 8-K filed August 2, 2012). | ||
| 4.3 | Second Supplemental Indenture dated as of August 1, 2012, by and among Halcón Resources Corporation, the parties named therein as subsidiary guarantors, and U.S. Bank National Association, as Trustee, relating to the 9.75% senior notes due 2020 (Incorporated by reference to Exhibit 4.2 of our Current Report on Form 8-K filed August 2, 2012). | ||
| 4.4 | Indenture dated as of November 6, 2012, among Halcón Resources Corporation, the subsidiary guarantors named therein and U.S. Bank National Association, as Trustee, relating to Halcón Resources Corporation's 8.875% senior notes due 2021 (Incorporated by reference to Exhibit 4.1 of our Current Report on Form 8-K filed November 7, 2012). | ||
| 4.5 | First Supplemental Indenture dated December 6, 2012, among Halcón Williston I, LLC and Halcón Williston II, LLC, the existing guarantors, Halcón Resources Corporation, the parties named therein as subsidiary guarantors and U.S. Bank National Association, as trustee, relating to the 8.875% senior notes due 2021 (Incorporated by reference to Exhibit 4.3 of our Current Report on Form 8-K filed December 11, 2012). | ||
161
| 4.6 | Third Supplemental Indenture dated December 6, 2012, among Halcón Resources Corporation and U.S. Bank National Association, as Trustee, relating to the 9.75% senior notes due 2020 (Incorporated by reference to Exhibit 4.4 of our Current Report on Form 8-K filed December 11, 2012). | ||
| 4.7 | Fourth Supplemental Indenture dated December 20, 2013, among Halcón Resources Corporation and U.S. Bank National Association, as Trustee, relating to the 9.75% senior notes due 2020 (Incorporated by reference to Exhibit 4.5 of our Registration Statement on Form S-4 filed March 14, 2014). | ||
| 4.8 | Registration Rights Agreement dated December 6, 2012, between Halcón Resources Corporation and Petro-Hunt Holdings LLC and Pillar Holdings LLC (Incorporated by reference to Exhibit 4.1 of our Current Report on Form 8-K filed December 11, 2012). | ||
| 4.9 | First Amendment to Registration Rights Agreement dated December 6, 2012, between Halcón Resources Corporation and HALRES LLC (formerly Halcón Resources LLC) (Incorporated by reference to Exhibit 4.2 of our Current Report on Form 8-K filed December 11, 2012). | ||
| 4.10 | Waiver, dated July 3, 2013, relating to Registration Rights Agreement dated December 6, 2012 by and among Halcón Resources Corporation and Petro-Hunt Holdings, LLC and Pillar Holdings, LLC (Incorporated by reference to Exhibit 4.1 of our Current Report on Form 8-K filed July 10, 2013). | ||
| 4.11 | Indenture dated as of August 13, 2013, among Halcón Resources Corporation, the subsidiary guarantors named therein and U.S. Bank National Association, as trustee, relating to Halcón Resources Corporation's 9.25% senior notes due 2022 (Incorporated by reference to Exhibit 4.1 of our Current Report on Form 8-K filed August 13, 2013). | ||
| 4.12 | First Supplemental Indenture dated December 20, 2013, among Halcón Resources Corporation, the subsidiary guarantors named therein, and U.S. Bank National Association, as trustee, relating to Halcón Resources Corporation's 9.25% senior notes due 2022 (Incorporated by reference to Exhibit 4.7 of our Registration Statement on Form S-4 filed March 14, 2014). | ||
| 4.13 | Indenture dated as of May 1, 2015, among Halcón Resources Corporation, the subsidiary guarantors named therein and U.S. Bank National Association, as trustee, relating to Halcón Resources Corporation's 8.625% Senior Secured Notes due 2020 (Incorporated by reference to Exhibit 4.1 of our Current Report on Form 8-K filed May 4, 2015). | ||
| 4.14 | Indenture dated as of September 10, 2015, among Halcón Resources Corporation, the subsidiary guarantors named therein and U.S. Bank National Association, as trustee, relating to Halcón Resouces Corporation's 13.0% Third Lien Senior Secured Notes due 2022 (Incorporated by reference to Exhibit 4.1 of our Current Report on Form 8-K filed September 15, 2015). | ||
| 4.15 | Indenture, dated as of December 21, 2015, among Halcón Resources Corporation, the guarantors named therein and U.S. Bank National Association, as Trustee, relating to Halcón Resouces Corporation's 12.0% Second Lien Senior Secured Notes due 2022 (Incorporated by reference to Exhibit 4.1 of our Current Report on Form 8-K filed December 22, 2015). | ||
| 4.16 | Amended and Restated Convertible Promissory Note dated March 9, 2015, between Halcón Resources Corporation and HALRES LLC (Incorporated by reference to Exhibit 4.1 of our Current Report on Form 8-K filed March 10, 2015). | ||
162
| 4.17 | Amended and Restated Warrant Certificate dated March 9, 2015, between Halcón Resources Corporation and HALRES LLC (Incorporated by reference to Exhibit 4.2 of our Current Report on Form 8-K filed March 10, 2015). | ||
| 4.18 | Amended and Restated Registration Rights Agreement dated March 9, 2015, between Halcón Resources Corporation and HALRES LLC (Incorporated by reference to Exhibit 4.3 of our Current Report on Form 8-K filed March 10, 2015). | ||
| 10.1 | Senior Revolving Credit Agreement dated as of February 8, 2012, among Halcón Resources Corporation, as borrower, each of the lenders from time to time party thereto, and JPMorgan Chase Bank, N.A., as administrative agent for the lenders (Incorporated by reference to Exhibit 10.1 of our Current Report on Form 8-K filed February 9, 2012). | ||
| 10.2 | First Amendment to Senior Revolving Credit Agreement, dated as of August 1, 2012, among Halcón Resources Corporation, as borrower, each of the lenders from time to time party thereto, and JPMorgan Chase Bank, N.A., as administrative agent for the lenders (Incorporated by reference to Exhibit 10.1 of our Current Report on Form 8-K filed August 2, 2012). | ||
| 10.3 | Second Amendment to Senior Revolving Credit Agreement, dated as of January 25, 2013, among Halcón Resources Corporation, as borrower, each of the lenders from time to time party thereto, and JPMorgan Chase Bank, N.A., as administrative agent for the lenders (Incorporated by reference to Exhibit 10.1 of our Current Report on Form 8-K filed January 30, 2013). | ||
| 10.4 | Third Amendment to Senior Revolving Credit Agreement, dated as of April 26, 2013, among Halcón Resources Corporation, as borrower, each of the lenders from time to time party thereto, and JPMorgan Chase Bank, N.A., as administrative agent for the lenders (Incorporated by reference to Exhibit 10.2 of our Quarterly Report on Form 10-Q for the quarterly period ended March 31, 2013 filed May 2, 2013). | ||
| 10.5 | Fourth Amendment to Senior Revolving Credit Agreement, dated as of May 8, 2013, among Halcón Resources Corporation, as borrower, each of the lenders from time to time party thereto, and JPMorgan Chase Bank, N.A., as administrative agent for the lenders (Incorporated by reference to Exhibit 10.1 of our Current Report on Form 8-K filed May 14, 2013). | ||
| 10.6 | Fifth Amendment to Senior Revolving Credit Agreement, dated as of June 11, 2013, among Halcón Resources Corporation, as borrower, each of the lenders party thereto, and JPMorgan Chase Bank, N.A., as administrative agent for the lenders (Incorporated by reference to Exhibit 10.1 of our Current Report on Form 8-K filed June 17, 2013). | ||
| 10.7 | Sixth Amendment to Senior Revolving Credit Agreement, dated as of October 31, 2013, among Halcón Resources Corporation, as borrower, each of the lenders party thereto, and JPMorgan Chase Bank, N.A., as administrative agent for the lenders (Incorporated by reference to Exhibit 10.11 of our Quarterly Report on Form 10-Q for the quarterly period ended September 30, 2013 filed November 4, 2013). | ||
| 10.8 | Seventh Amendment to Senior Revolving Credit Agreement, dated as of March 21, 2014, among Halcón Resources Corporation, as borrower, each of the lenders party thereto, and JPMorgan Chase Bank, N.A., as administrative agent for the lenders (Incorporated by reference to Exhibit 10.1 of our Current Report on Form 8-K filed March 27, 2014). | ||
163
| 10.9 | Eighth Amendment to Senior Revolving Credit Agreement, dated as of September 30, 2014, among Halcón Resources Corporation, as borrower, each of the lenders party thereto, and JPMorgan Chase Bank, N.A., as administrative agent for the lenders (Incorporated by reference to Exhibit 10.1 of our Current Report on Form 8-K filed October 2, 2014). | ||
| 10.10 | Ninth Amendment to Senior Revolving Credit Agreement, dated as of February 25, 2015, among Halcón Resources Corporation, as borrower, each of the lenders party thereto, and JPMorgan Chase Bank, N.A., as administrative agent for the lenders (Incorporated by reference to Exhibit 10.1 of our Current Report on Form 8-K filed February 25, 2015). | ||
| 10.11 | Tenth Amendment to Senior Revolving Credit Agreement, dated as of May 1, 2015, among Halcón Resources Corporation, as borrower, each of the lenders party thereto, and JPMorgan Chase Bank, N.A., as administrative agent for the lenders (Incorporated by reference to Exhibit 10.4 of our Current Report on Form 8-K filed May 4, 2015). | ||
| 10.12 | Eleventh Amendment to Senior Revolving Credit Agreement, dated as of September 10, 2015, among Halcón Resources Corporation, as borrower, each of the guarantors party thereto, each of the lenders party thereto, and JPMorgan Chase Bank, N.A., as administrative agent for the lenders (Incorporated by reference to Exhibit 10.4 of our Current Report on Form 8-K filed September 15, 2015). | ||
| 10.13 | * | Twelfth Amendment to Senior Revolving Credit Agreement, dated as of October 29, 2015, among Halcón Resources Corporation, as borrower, each of the guarantors party thereto, each of the lenders party thereto, and JPMorgan Chase Bank, N.A., as administrative agent for the lenders. | |
| 10.14 | Guarantee and Collateral Agreement dated as of February 8, 2012, among Halcón Resources Corporation, as borrower, each of the lenders from time to time party thereto, and JPMorgan Chase Bank, N.A., as administrative agent for the lenders (Incorporated by reference to Exhibit 10.2 of our Current Report on Form 8-K filed February 9, 2012). | ||
| 10.15 | Intercreditor Agreement, dated as of May 1, 2015, among Halcón Resources Corporation, the subsidiary guarantors named therein, U.S. Bank National Association, as second lien collateral trustee, and JPMorgan Chase Bank, N.A., as priority lien agent for the lenders (Incorporated by reference to Exhibit 10.1 of our Current Report on Form 8-K filed May 4, 2015). | ||
| 10.16 | Collateral Trust Agreement, dated as of May 1, 2015, among Halcón Resources Corporation, the subsidiary guarantors named therein and U.S. Bank National Association, as trustee, the other parity lien debt representatives from time to time party thereto and U.S. Bank National Association, as collateral trustee (Incorporated by reference to Exhibit 10.2 of our Current Report on Form 8-K filed May 4, 2015). | ||
| 10.17 | Second Lien Security Agreement, dated as of May 1, 2015, among Halcón Resources Corporation, the subsidiary guarantors named therein and U.S. Bank National Association, as collateral trustee (Incorporated by reference to Exhibit 10.3 of our Current Report on Form 8-K filed May 4, 2015). | ||
| 10.18 | Priority Confirmation Joinder, dated as of September 10, 2015, by and between JPMorgan Chase Bank, N.A., as Priority Lien Agent, and U.S. Bank National Association, as Third Lien Collateral Trustee (Incorporated by reference to Exhibit 10.3 of our Current Report on Form 8-K filed September 15, 2015). | ||
164
| 10.19 | Collateral Trust Agreement, dated as of September 10, 2015, among Halcón Resources Corporation, the guarantors from time to time party thereto, U.S. Bank National Association, as Trustee, the other Third Lien Representatives from time to time party thereto and U.S. Bank National Association, as Collateral Trustee (Incorporated by reference to Exhibit 10.1 of our Current Report on Form 8-K filed September 15, 2015). | ||
| 10.20 | Third Lien Security Agreement, dated as of September 10, 2015, by and among Halcón Resources Corporation, the grantors from time to time party thereto in favor of U.S. Bank National Association, as Collateral Trustee (Incorporated by reference to Exhibit 10.2 of our Current Report on Form 8-K filed September 15, 2015). | ||
| 10.21 | Collateral Trust Joinder, dated as of December 21, 2015, by U.S. Bank National Association, as New Notes Trustee, and U.S. Bank National Association, as Collateral Trustee (Incorporated by reference to Exhibit 10.1 of our Current Report on Form 8-K filed December 22, 2015). | ||
| 10.22 | First Amendment to Second Lien Security Agreement, dated as of December 21, 2015, by and among Halcón Resources Corporation and the grantors from time to time party thereto, in favor of U.S. Bank National Association, as Collateral Trustee (Incorporated by reference to Exhibit 10.2 of our Current Report on Form 8-K filed December 22, 2015). | ||
| 10.23 | Priority Confirmation Joinder, dated as of December 21, 2015, by and between JPMorgan Chase Bank, N.A., as Priority Lien Agent, U.S. Bank National Association, as New Representative, U.S. Bank National Association, as Second Lien Collateral Trustee, and U.S. Bank National Association, as Third Lien Collateral Trustee (Incorporated by reference to Exhibit 10.3 of our Current Report on Form 8-K filed December 22, 2015). | ||
| 10.24 | * | First Amended and Restated Summary of Non-Employee Director Compensation adopted on February 25, 2015. | |
| 10.25 | * | Amended and Restated Stock Ownership Guidelines Policy adopted on February 25, 2015. | |
| 10.26 | Form of Indemnity Agreement (Incorporated by reference to Exhibit 10.1 of our Current Report on Form 8-K filed March 9, 2012). | ||
| 10.27 | † | Halcón Resources Corporation First Amended and Restated 2012 Long-Term Incentive Plan (Incorporated by reference to Exhibit 10.01 of our Current Report on Form 8-K filed March 4, 2013). | |
| 10.28 | † | Amendment No. 1 to the Halcón Resources Corporation First Amended and Restated 2012 Long-Term Incentive Plan (Incorporated by reference to Exhibit 10.1 of our Current Report on Form 8-K filed May 29, 2013). | |
| 10.29 | † | Amendment No. 2 to the Halcón Resources Corporation First Amended and Restated 2012 Long-Term Incentive Plan (Incorporated by reference to Exhibit 10.1 of our Current Report on Form 8-K filed May 7, 2015). | |
| 10.30 | † | Employment Agreement between Floyd C. Wilson and Halcón Resources Corporation dated June 1, 2012 (Incorporated by reference to Exhibit 10.1 of our Current Report on Form 8-K filed June 5, 2012). | |
| 10.31 | † | Employment Agreement between Stephen W. Herod and Halcón Resources Corporation dated June 1, 2012 (Incorporated by reference to Exhibit 10.2 of our Current Report on Form 8-K filed June 5, 2012). | |
165
| 10.32 | † | Employment Agreement between Mark J. Mize and Halcón Resources Corporation dated June 1, 2012 (Incorporated by reference to Exhibit 10.3 of our Current Report on Form 8-K filed June 5, 2012). | |
| 10.33 | † | Employment Agreement between David S. Elkouri and Halcón Resources Corporation dated June 1, 2012 (Incorporated by reference to Exhibit 10.4 of our Current Report on Form 8-K filed June 5, 2012). | |
| 10.34 | † | Employment Agreement between Joseph S. Rinando, III and Halcón Resources Corporation dated June 1, 2012 (Incorporated by reference to Exhibit 10.5 of our Current Report on Form 8-K filed June 5, 2012). | |
| 10.35 | † | Employment Agreement between Charles E. Cusack, III and Halcón Resources Corporation dated November 8, 2012 (Incorporated by reference to Exhibit 10.2 of our Current Report on Form 8-K filed March 27, 2014). | |
| 10.36 | † | Form of Stock Option Award Agreement (Incorporated by reference to Exhibit 10.1 of our Current Report on Form 8-K filed June 13, 2012). | |
| 10.37 | † | Form of Employee Restricted Stock Agreement (Incorporated by reference to Exhibit 10.2 of our Current Report on Form 8-K filed June 13, 2012). | |
| 10.38 | † | Form of Non-Employee Director Restricted Stock Agreement (Incorporated by reference to Exhibit 10.3 of our Current Report on Form 8-K filed June 13, 2012). | |
| 10.39 | † | Form of Performance Unit Award Agreement (Incorporated by reference to Exhibit 10.3 of our Quarterly Report on Form 10-Q for the quarterly period ended June 30, 2014 filed July 31, 2014). | |
| 10.40 | Stockholders Agreement dated December 6, 2012, between Halcón Resources Corporation and CPP Investment Board PMI-2 Inc. (Incorporated by reference to Exhibit 10.1 of our Current Report on Form 8-K filed December 11, 2012). | ||
| 10.41 | Equity Distribution Agreement, dated March 18, 2015, by and among Halcón Resources Corporation, BMO Capital Markets Corp., Jefferies LLC and MLV & Co. LLC (Incorporated by reference to Exhibit 1.1 of our Current Report on Form 8-K filed March 18, 2015). | ||
| 10.42 | Purchase Agreement, dated April 21, 2015, by and among Halcón Resources Corporation, the guarantors named therein, J.P. Morgan Securities LLC, as representative of the initial purchasers named therein (Incorporated by reference to Exhibit 10.1 of our Current Report on Form 8-K filed April 24, 2015). | ||
| 12.1 | * | Computation of Ratio of Earnings to Combined Fixed Charges and Preference Dividends | |
| 21.1 | * | List of Subsidiaries of Halcón Resources Corporation | |
| 23.1 | * | Consent of Deloitte & Touche LLP | |
| 23.2 | * | Consent of Netherland, Sewell & Associates, Inc. | |
| 31.1 | * | Sarbanes-Oxley Section 302 certification of Principal Executive Officer | |
| 31.2 | * | Sarbanes-Oxley Section 302 certification of Principal Financial Officer | |
| 32 | * | Sarbanes-Oxley Section 906 certification of Principal Executive Officer and Principal Financial Officer | |
| 99.1 | * | Report of Netherland, Sewell & Associates, Inc. | |
166
| 101.INS | * | XBRL Instance Document | |
| 101.SCH | * | XBRL Taxonomy Extension Schema Document | |
| 101.CAL | * | XBRL Taxonomy Extension Calculation Linkbase Document | |
| 101.DEF | * | XBRL Taxonomy Extension Definition Document | |
| 101.LAB | * | XBRL Taxonomy Extension Label Linkbase Document | |
| 101.PRE | * | XBRL Taxonomy Extension Presentation Linkbase Document |
- *
- Attached hereto.
- †
- Indicates management contract or compensatory plan or arrangement.
The registrant has not filed with this report copies of the instruments defining rights of all holders of long-term debt of the registrant and its consolidated subsidiaries based upon the exception set forth in Item 601(b)(4)(iii)(A) of Regulation S-K. Copies of such instruments will be furnished to the SEC upon request.
167
Pursuant to the requirements of the Securities Exchange Act of 1934, the registrant has duly caused this report to be signed on its behalf by the undersigned thereunto duly authorized.
| HALCÓN RESOURCES CORPORATION | ||||
Date: February 26, 2016 |
By: |
/s/ FLOYD C. WILSON Floyd C. Wilson Chairman of the Board and Chief Executive Officer |
||
Pursuant to the requirements of the Securities Exchange Act of 1934, this report has been signed below by the following persons on behalf of the registrant and in the capacities and on the dates indicated.
Signature
|
Title
|
Date
|
||
|---|---|---|---|---|
| /s/ FLOYD C. WILSON Floyd C. Wilson |
Chairman of the Board, Chief Executive Officer and Director | February 26, 2016 | ||
/s/ MARK J. MIZE Mark J. Mize |
Executive Vice President, Chief Financial Officer and Treasurer |
February 26, 2016 |
||
/s/ JOSEPH S. RINANDO, III Joseph S. Rinando, III |
Senior Vice President, Chief Accounting Officer and Controller |
February 26, 2016 |
||
/s/ TUCKER S. BRIDWELL Tucker S. Bridwell |
Director |
February 26, 2016 |
||
/s/ JAMES W. CHRISTMAS James W. Christmas |
Director |
February 26, 2016 |
||
/s/ THOMAS R. FULLER Thomas R. Fuller |
Director |
February 26, 2016 |
||
/s/ KEVIN E. GODWIN Kevin E. Godwin |
Director |
February 26, 2016 |
168
Signature
|
Title
|
Date
|
||
|---|---|---|---|---|
| /s/ DAVID B. MILLER David B. Miller |
Director | February 26, 2016 | ||
/s/ DANIEL A. RIOUX Daniel A. Rioux |
Director |
February 26, 2016 |
||
/s/ MICHAEL A. VLASIC Michael A. Vlasic |
Director |
February 26, 2016 |
||
/s/ MARK A. WELSH IV Mark A. Welsh IV |
Director |
February 26, 2016 |
169