Attached files
| file | filename |
|---|---|
| EX-31.2 - RULE 13(A) - 14(A) CERTIFICATION OF OUR PRINCIPAL FINANCIAL OFFICER - BATTALION OIL CORP | d294152dex312.htm |
| EX-32.1 - SECTION 1350 CERTIFICATION OF OUR PRINCIPAL EXECUTIVE OFFICER - BATTALION OIL CORP | d294152dex321.htm |
| EX-99.1 - REPORT OF FORREST A. GARB & ASSOCIATES, INC. - BATTALION OIL CORP | d294152dex991.htm |
| EX-23.2 - CONSENT OF FORREST A. GARB & ASSOCIATES, INC - BATTALION OIL CORP | d294152dex232.htm |
| EX-21.1 - SUBSIDIARIES OF THE REGISTRANT - BATTALION OIL CORP | d294152dex211.htm |
| EX-32.2 - SECTION 1350 CERTIFICATION OF OUR PRINCIPAL FINANCIAL OFFICER - BATTALION OIL CORP | d294152dex322.htm |
| EX-23.1 - CONSENT OF UHY LLP - BATTALION OIL CORP | d294152dex231.htm |
| EXCEL - IDEA: XBRL DOCUMENT - BATTALION OIL CORP | Financial_Report.xls |
| EX-31.1 - RULE 13(A) - 14(A) CERTIFICATION OF OUR PRINCIPAL EXECUTIVE OFFICER - BATTALION OIL CORP | d294152dex311.htm |
Table of Contents
UNITED STATES
SECURITIES AND EXCHANGE COMMISSION
Washington, D.C. 20549
Form 10-K
| x | ANNUAL REPORT PURSUANT TO SECTION 13 OR 15(d) OF THE SECURITIES EXCHANGE ACT OF 1934 |
For the fiscal year ended December 31, 2011
or
| ¨ | TRANSITION REPORT PURSUANT TO SECTION 13 OR 15(d) OF THE SECURITIES EXCHANGE ACT OF 1934 |
For the transition period from to
Commission File Number: 000-50682
Halcón Resources Corporation
(Exact name of registrant as specified in its charter)
| Delaware | 20-0700684 | |
| (State or other jurisdiction of incorporation or organization) |
(I.R.S. Employer Identification Number) | |
| 1000 Louisiana Street, Suite 6700 Houston, Texas |
77002 | |
| (Address of principal executive office) | (Zip Code) | |
(832) 538-0300
(Registrant’s telephone number, including area code)
Securities registered pursuant to Section 12(b) of the Act:
Common Stock, $.0001 par value
Securities registered pursuant to Section 12(g) of the Act:
None
Indicate by check mark if the registrant is a well-known seasoned issuer, as defined in Rule 405 of the Securities Act. Yes ¨ No x
Indicate by check mark if the registrant is not required to file reports pursuant to Section 13 or Section 15(d) of the Exchange Act. Yes ¨ No x
Indicate by check mark whether the registrant (1) has filed all reports required to be filed by Section 13 or 15(d) of the Securities Exchange Act of 1934 during the preceding 12 months (or for such shorter period that the registrant was required to file such reports) and (2) has been subject to such filing requirements for the past 90 days. Yes x No ¨
Indicate by check mark whether the registrant has submitted electronically and posted on its corporate Web site, if any, every Interactive Data File required to be submitted and posted pursuant to Rule 405 of Regulation S-T (232.405 of this chapter) during the preceding 12 months (or for such shorter period that the registrant was required to submit and post such files). Yes x No ¨
Indicate by check mark if disclosure of delinquent filers pursuant to Item 405 of Regulation S-K is not contained herein, and will not be contained, to the best of registrant’s knowledge, in definitive proxy or information statements incorporated by reference in Part III of this Form 10-K or any amendment to this Form 10-K. ¨
Indicate by check mark whether the registrant is a large accelerated filer, an accelerated filer, a non-accelerated filer, or a smaller reporting company. See the definitions of “large accelerated filer,” “accelerated filer” and “smaller reporting company” in Rule 12b-2 of the Exchange Act. (Check one):
| Large accelerated filer | ¨ | Non-accelerated filer | ¨ | |||
| Accelerated filer | x (Do not check if a smaller reporting company) | Smaller reporting company | ¨ | |||
Indicate by check mark whether the registrant is a shell company (as defined in Rule 12b-2 of the Exchange Act). Yes ¨ No x
As of March 5, 2012, there were outstanding 99,377,446 shares of registrant’s $.0001 par value common stock. Based upon the closing price for the registrant’s common stock on the NASDAQ Capital Market as of June 30, 2011, the aggregate market value of shares of common stock held by non-affiliates of the registrant was approximately $50.0 million. Documents incorporated by reference: The information called for by Part III is incorporated by reference to the definitive proxy statement for the Registrant’s 2012 annual meeting of stockholders, which will be filed with the Securities and Exchange Commission, or SEC, no later than 120 days after December 31, 2011.
Table of Contents
HALCÓN RESOURCES CORPORATION
ANNUAL REPORT ON FORM 10-K
FOR THE YEAR ENDED DECEMBER 31, 2011
2
Table of Contents
FORWARD LOOKING STATEMENTS
The information discussed in this report, our other filings with the SEC and our public releases include “forward-looking statements” within the meaning of Section 27A of the Securities Act and Section 21E of the Securities Exchange Act of 1934, as amended (the “Exchange Act”). All statements, other than statements of historical facts, concerning, among other things, planned capital expenditures, pursuit of potential acquisition opportunities, business strategy and other plans and objectives for future operation, increases in oil and natural gas production, the number and location of wells to be drilled in the future, future cash flows and borrowings, and our financial position, are forward-looking statements. These forward-looking statements may be, but are not always, identified by their use of terms and phrases such as “may,” “expect,” “estimate,” “project,” “plan,” “believe,” “intend,” “achievable,” “anticipate,” “will,” “continue,” “potential,” “should,” “could” and similar terms and phrases. Although we believe that the expectations reflected in these forward-looking statements are reasonable, they do involve certain assumptions, risks and uncertainties. Actual results could differ materially from those anticipated in these forward-looking statements as a result of certain factors, including, among others:
| • | volatility in commodity prices for oil and natural gas; |
| • | our ability to successfully identify and acquire oil and natural gas properties, prospects and leaseholds, including undeveloped acreage in new and emerging resource plays; |
| • | our ability to successfully integrate acquired oil and natural gas businesses and operations; |
| • | our ability to profitably deploy our capital; |
| • | management’s ability to execute our plans to meet our goals; |
| • | exploration and development risks; |
| • | our ability to attract and retain key members of senior management and key technical employees; |
| • | competition, including competition for acreage in resource play areas; |
| • | the possibility that our industry may be subject to future regulatory or legislative actions (including any additional taxes and changes in environmental regulation); |
| • | the presence or recoverability of estimated oil and natural gas reserves and the actual future production rates and associated costs; |
| • | our ability to replace oil and natural gas reserves; |
| • | environmental risks; |
| • | drilling and operating risks; |
| • | the cost and availability of goods and services, such as drilling rigs, fracture stimulation services and tubulars; |
| • | general economic conditions, whether internationally, nationally or in the regional and local market areas in which we do business, may be less favorable than expected, including the possibility that economic conditions in the United States will worsen and that capital markets are disrupted, which could adversely affect demand for oil and natural gas and make it difficult to access financial markets; |
| • | social unrest, political instability, armed conflict, or acts of terrorism or sabotage in oil and natural gas producing regions, such as the Middle East or our markets; and |
| • | other economic, competitive, governmental, legislative, regulatory, geopolitical and technological factors that may negatively impact our business, operations or pricing. |
Finally, our future results will depend upon various other risks and uncertainties, including, but not limited to, those detailed in the section entitled “Risk Factors” included in this report and in our Quarterly Reports on Form 10-Q. All forward-looking statements are expressly qualified in their entirety by the cautionary statements
3
Table of Contents
in this paragraph and elsewhere in this document. Other than as required under the securities laws, we do not assume a duty to update these forward-looking statements, whether as a result of new information, subsequent events or circumstances, changes in expectations or otherwise.
Glossary of Oil and Natural Gas Terms
The definitions set forth below apply to the indicated terms as used in this report. All volumes of natural gas referred to herein are stated at the legal pressure base of the state or area where the reserves exist and at 60 degrees Fahrenheit and in most instances are rounded to the nearest major multiple.
Bbl. One stock tank barrel, or 42 U.S. gallons liquid volume, used herein in reference to crude oil or other liquid hydrocarbons.
Bcf. One billion cubic feet of natural gas.
Boe. Barrels of oil equivalent in which six Mcf of natural gas equals one Bbl of oil.
Btu. British thermal unit, which is the heat required to raise the temperature of a one-pound mass of water from 58.5 to 59.5 degrees Fahrenheit.
Completion. The installation of permanent equipment for the production of oil or natural gas or, in the case of a dry hole, the reporting of abandonment to the appropriate agency.
Development well. A well drilled within the proved areas of an oil or natural gas reservoir to the depth of a stratigraphic horizon known to be productive.
Dry hole or well. A well found to be incapable of producing hydrocarbons in sufficient quantities such that proceeds from the sale of such production exceed production expenses and taxes.
Exploratory well. A well drilled to find a new field or to find a new reservoir in a field previously found to be productive of oil or natural gas in another reservoir.
Field. An area consisting of a single reservoir or multiple reservoirs all grouped on or related to the same individual geological structural feature and/or stratigraphic condition.
Gross acres or gross wells. The total acres or wells, as the case may be, in which a working interest is owned.
MBbls. One thousand barrels of crude oil or other liquid hydrocarbons.
MBoe. One thousand Boe.
MMBoe. One million Boe.
Mcf. One thousand cubic feet of natural gas.
MMBbls. One million barrels of crude oil or other liquid hydrocarbons.
MMBtu. One million Btus.
MMcf. One million cubic feet of natural gas.
Net acres or net wells. The sum of the fractional working interests owned in gross acres or gross wells, as the case may be.
4
Table of Contents
Operator. The individual or company responsible for the exploration, exploitation and production of an oil or natural gas well or lease.
Productive well. A well that is found to be capable of producing hydrocarbons in sufficient quantities such that proceeds from the sale of such production exceed production expenses and taxes.
Proved developed producing reserves. Proved developed reserves that are expected to be recovered from completion intervals currently open in existing wells and capable of production.
Proved developed reserves. Proved reserves that are expected to be recovered from existing wellbores, whether or not currently producing, without drilling additional wells. Production of such reserves may require a recompletion.
Proved reserves. Those quantities of oil and natural gas, which, by analysis of geoscience and engineering data, can be estimated with reasonable certainty to be economically producible — from a given date forward, from known reservoirs, and under existing economic conditions, operating methods, and government regulations — prior to the time at which contracts providing the right to operate expire, unless evidence indicates that renewal is reasonably certain, regardless of whether deterministic or probabilistic methods are used for estimation.
Proved undeveloped location. A site on which a development well can be drilled consistent with spacing rules for purposes of recovering proved undeveloped reserves.
Proved undeveloped reserves. Proved reserves that are expected to be recovered from new wells on undrilled acreage or from existing wells where a relatively major expenditure is required for recompletion.
Recompletion. The completion for production of an existing wellbore in another formation from that in which the well has been previously completed.
Reserve-to-production ratio or Reserve life. A ratio determined by dividing our estimated existing reserves determined as of the stated measurement date by production from such reserves for the prior twelve month period.
Reservoir. A porous and permeable underground formation containing a natural accumulation of producible oil and/or natural gas that is confined by impermeable rock or water barriers and is individual and separate from other reservoirs.
3-D seismic. The method by which a three dimensional image of the earth’s subsurface is created through the interpretation of reflection seismic data collected over a surface grid. 3-D seismic surveys allow for a more detailed understanding of the subsurface than do conventional surveys and contribute significantly to field appraisal, exploitation and production.
Undeveloped acreage. Lease acreage on which wells have not been drilled or completed to a point that would permit the production of commercial quantities of oil and natural gas regardless of whether such acreage contains proved reserves.
Working interest. The operating interest that gives the owner the right to drill, produce and conduct operating activities on the property and a share of production.
Workover. Operations on a producing well to restore or increase production.
5
Table of Contents
PART I
| Item 1. | Business |
Overview
We have included definitions of technical terms important to an understanding of our business under “Glossary of Oil and Natural Gas Terms.”
Unless the context otherwise requires, all references in this report to “Halcón Resources,” “our,” “us,” and “we” refer to Halcón Resources Corporation (formerly known as RAM Energy Resources, Inc.) and its subsidiaries, as a combined entity. On February 10, 2012, we effected a one-for-three reverse split of our common stock. All share and per share numbers in this report have been adjusted to reflect the effect of the reverse split.
We are an independent energy company engaged in the acquisition, production, exploration and development of onshore oil and natural gas properties in the United States. Our producing properties are located in highly prolific basins with long histories of oil and natural gas operations. We have been active in our core producing areas of Texas, Oklahoma and Louisiana since our inception in 1987 and have grown through a balanced strategy of acquisitions, development and exploratory drilling. Through December 31, 2011, we have drilled or participated in the drilling of 907 gross oil and natural gas wells, approximately 94% of which were successfully completed and produced hydrocarbons in commercial quantities. Our management team has extensive technical and operating expertise in all areas of our geographic focus.
Our oil and natural gas assets are characterized by a combination of developing and mature reserves and properties. We have mature oil and natural gas reserves located primarily in Wichita, Wilbarger and Starr Counties, Texas, Pontotoc County, Oklahoma, and in several parishes in Louisiana.
As of December 31, 2011, our estimated net proved reserves were 21.1 MMBoe, of which approximately 59% were crude oil, 32% were natural gas, and 9% were natural gas liquids, or NGLs, based on benchmark prices of $96.19 per Bbl of oil and $4.12 per Mcf of natural gas. The benchmark prices reflect the unweighted arithmetic average of the first-day-of-the-month price for oil and natural gas during each month of 2011, as required by SEC Release No. 33-8995, “Modernization of Oil and Gas Reporting” effective December 31, 2009. For more information, see Item 2, “Properties — Oil and Natural Gas Reserves.” At December 31, 2011, our proved developed reserves comprised 64% of our total proved reserves.
At December 31, 2011, we owned interests in approximately 4,000 gross wells and were the operator of leases upon which approximately 3,200 of these wells are located. We also own a drilling rig, various gathering systems, a natural gas processing plant, service rigs and a supply company that service our properties.
During the twelve months ended December 31, 2011, we drilled or participated in the drilling of 61 gross wells on our oil and natural gas properties, 49 of which were successfully completed as producing wells, five of which were abandoned wells and seven of which were either drilling or waiting to be completed at the end of that period. For the twelve months ended December 31, 2011, we produced 1,504 MBoe, averaging approximately 4,100 Boe per day.
Recent Developments
Recapitalization by Halcón Resources, LLC
On February 8, 2012, Halcón Resources, LLC, a newly-formed company led by Floyd C. Wilson, former Chairman and Chief Executive Officer of Petrohawk Energy Corporation, recapitalized us with a $550.0 million investment structured as the purchase of $275.0 million in new common stock, a $275.0 million five-year 8%
6
Table of Contents
convertible note and warrants for the purchase of an additional 36,666,666 million shares of our common stock at an exercise price of $4.50 per share. At closing, Floyd C. Wilson was appointed as our Chairman, President and Chief Executive Officer, and our name was changed to Halcón Resources Corporation. Mark Mize was also appointed as our Executive Vice President, Chief Financial Officer, Treasurer and was designated as our Principal Accounting Officer, and the composition of our board was altered to consist of 10 new individuals: Floyd C. Wilson, Tucker S. Bridwell, James W. Christmas, Thomas R. Fuller, James L. Irish III, E. Murphy Markham IV, David B. Miller, Daniel Rioux, Stephen P. Smiley and Mark A. Welsh IV. Mr. Wilson was elected Chairman of the Board and Mr. Irish was named Lead Independent Director. The Audit Committee of the Board is composed of Mr. Irish (Chairman) and Messrs. Christmas and Smiley. The Nominating and Corporate Governance Committee is composed of Mr. Christmas (Chairman) and Messrs. Fuller, Rioux and Welsh. The Compensation Committee is composed of Mr. Smiley (Chairman) and Messrs. Bridwell, Markham and Rioux. Additionally, the Board established a Reserves Committee composed of Mr. Fuller (Chairman) and Messrs. Bridwell and Welsh. Information as to our recent recapitalization is set forth under Note N to the Consolidated Financial Statements.
In connection with the closing of the Halcón Transaction, we entered into a Senior Revolving Credit Agreement (the “credit agreement”) with JPMorgan Chase Bank, N.A., as administrative agent, and the other lenders named therein on February 8, 2012. The credit agreement provides for a $500.0 million facility with an initial borrowing base of $225.0 million. Amounts borrowed under the credit agreement will initially mature on February 8, 2017. The borrowing base will be redetermined semi-annually, with the company and the lenders each having the right to one interim unscheduled redetermination between any two consecutive semi-annual redeterminations. The borrowing base takes into account our oil and natural gas properties, proved reserves, total indebtedness, and other relevant factors consistent with customary oil and gas lending criteria. The borrowing base is subject to a reduction equal to the product of 0.25 multiplied by the stated principal amount (without regard to any initial issue discount) of any notes or other long-term debt securities that we may issue.
Following the recapitalization, our primary focus is to expand our leasehold position in areas we have determined are prospective for oil or liquids-rich resource plays. We have identified several target resource plays for potential leasehold acquisition, including the Utica Shale/Point Pleasant formations in Ohio and Pennsylvania, the Mississippian Lime formation in Northern Oklahoma and Southern Kansas, the Wilcox formation in Southwest Louisiana and the Woodbine/Eagle Ford formation in East Texas. In addition to our ongoing lease acquisition efforts in our targeted resource plays, we have identified several new exploratory areas we believe are prospective for oil and liquids-rich hydrocarbons.
Private Placement of Convertible Preferred Stock
On March 5, 2012, we sold in a private placement to certain institutional accredited investors 4,444.4511 shares of 8% automatically convertible preferred stock, par value $0.0001 per share, each share of which will convert into 10,000 shares of our common stock (or a proportionate number of shares of common stock with respect to any fractional shares of preferred stock), subject to certain adjustments, for approximately $400.0 million, or $9.00 per share of common stock, before offering expenses. The convertible preferred stock will convert into common stock automatically on the 20th calendar day after we mail a definitive information statement to holders of our common stock notifying them that our majority stockholder has consented to the issuance of common stock upon conversion of the convertible preferred stock. No dividend will be paid on the convertible preferred stock if it converts into common stock on or before May 31, 2012.
As a result of the recapitalization and the sale of the convertible preferred stock, we have substantial liquidity available to support our anticipated 2012 capital expenditures.
7
Table of Contents
Our Business Strategy
We are an independent energy company engaged in the acquisition, production, exploration and development of onshore oil and natural gas properties located in the United States. Our primary objective is to increase stockholder value by growing reserves, production and cash flow. To accomplish this objective, we intend to execute the following business strategies:
| • | Pursue Strategic Acreage Positions in Liquids-Rich Regions. Our management intends to employ a process, based on analysis of the best available geologic and engineering data, to identify and lease or acquire acreage with economically attractive hydrocarbon potential. We intend to aggressively pursue acreage in our key focus areas. |
| • | Develop Acquired Acreage Positions Using Our Development Expertise. We plan to leverage our management team’s expertise and the latest available technologies to explore and develop our properties. We will also evaluate industry drilling results to improve our operating practices, and we expect that our drilling and completion techniques will continue to evolve. |
| • | Pursue Asset and Corporate Acquisitions. We plan to continually review opportunities to acquire assets in liquids-rich resource plays. We will rely on our technical expertise to evaluate the geology in various regions and identify highly prospective acreage. We will then use our business development teams to acquire acreage in the most economic manner possible. This could include leasing or acquiring acreage, as described above, or the acquisition of asset packages or existing operating companies. |
| • | Manage Our Property Portfolio Actively. We continually evaluate our property base to identify non-core, higher cost or lower volume producing properties with limited development potential. This strategy allows us to focus on a portfolio of core properties with significant potential to increase our proved reserves and production. We expect that divestitures of non-core assets will provide us with cash to reinvest in our business, reducing our reliance on the capital markets for financing. |
| • | Maintain Financial Flexibility. We have significant cash available for potential acquisitions, exploration and development drilling, and other corporate purposes. We believe our cash, internally generated cash flows, borrowing capacity and access to the capital markets will provide us with sufficient liquidity to execute our current capital program and strategy. We could also generate additional funds by divesting non-core assets. We intend to use a hedging program to protect our cash flow that will be used for capital spending. |
We were incorporated in Delaware on February 5, 2004. Our executive offices are located at 1000 Louisiana Street, Suite 6700, Houston, Texas 77002 and our telephone number is (832) 538-0300. We also have offices in Plano and Houston, Texas and Tulsa, Oklahoma.
8
Table of Contents
| Item 1A. | Risk Factors |
We face a variety of risks that are inherent in our business and our industry, including operational, legal and regulatory risks. The following are the known, material risks that could affect our business and our results of operations.
Risks Related to Our Business
We may not be able to profitably deploy our capital.
We currently have $916.8 million of cash and liquidity available to us, and we do not have commitments or specific contemplated acquisitions or other uses for all of those funds. Our future growth and profitability will be largely dependent upon our ability to profitably invest our capital in projects and properties that produce commercial quantities of oil and natural gas and generate acceptable returns on investment. We may be unable to identify a sufficient number of suitable acquisition opportunities, negotiate acceptable terms or successfully acquire identified targets. Moreover, the oil and natural gas exploration and production business is inherently risky and we cannot be certain that the projects and properties in which we invest will enable us to develop and produce oil and natural gas in the quantities or for the costs we anticipate. We cannot be certain that our deployment of capital will produce a profitable return for our stockholders.
The volatility of oil and natural gas prices greatly affects our profitability.
Our revenues, operating results, profitability, future rate of growth and the carrying value of our oil and natural gas properties depend primarily upon the prevailing prices for oil and natural gas. Historically, oil and natural gas prices have been volatile and are subject to fluctuations in response to changes in supply and demand, market uncertainty and a variety of additional factors that are beyond our control. Any substantial decline in the price of oil and natural gas will likely have a material adverse effect on our operations, financial condition and level of expenditures for the development of our oil and natural gas reserves, and may result in further write-downs of the carrying values of our oil and natural gas properties as a result of our use of the full cost accounting method.
Wide fluctuations in oil and natural gas prices may result from relatively minor changes in the supply of and demand for oil and natural gas, market uncertainty and other factors that are beyond our control, including:
| • | worldwide and domestic supplies of oil and natural gas; |
| • | speculation in the price of commodities in the commodity futures market; |
| • | weather conditions; |
| • | the level of consumer demand; |
| • | the price and availability of alternative fuels; |
| • | the availability of drilling rigs and completion equipment; |
| • | the availability of pipeline capacity; |
| • | the price and volume of foreign imports; |
| • | domestic and foreign governmental regulations and taxes; |
| • | the ability of the members of the Organization of Petroleum Exporting Countries to agree to and maintain oil price and production controls; |
| • | political instability or armed conflict in oil-producing regions; and |
| • | the overall economic environment. |
9
Table of Contents
These factors and the volatility of the energy markets make it extremely difficult to predict future oil and natural gas price movements with any certainty.
Oil and natural gas prices could decline to a point where it would be uneconomic for us to sell our oil and natural gas at those prices, which could result in a decision to shut in production until the prices increase.
Production costs, also called “lifting costs,” consist of those costs, including certain taxes, incurred in the production and storage of crude oil and natural gas before its removal from the property for sale or transportation. The economic viability of each of our crude oil and natural gas properties is dependent on revenues received from the sale of crude oil and natural gas produced from such property being sufficient to recover the lifting costs incurred on such property. Many of our crude oil properties are in secondary recovery units with relatively high lifting costs per Boe. In the event commodity prices decline to the point where revenues from a property are insufficient to cover lifting costs, royalties and other required payments out of production, we will be required to shut in the affected property until such time, if ever, that prices increase sufficiently to enable us to recover such costs.
A decline of oil and natural gas prices or a prolonged period of reduced oil and natural gas prices could result in a decrease in our exploration and development expenditures, which could negatively impact our future production.
If oil and natural gas prices decline or reduce to lower levels for a prolonged period of time, we may be unable to continue to fund capital expenditures at historical levels due to the decreased cash flows that will result from such reduced oil and natural gas prices. Additionally, a decline in oil and natural gas prices or a prolonged period of lower oil and natural gas prices could result in a reduction of our borrowing base under our credit agreement, which will further reduce the availability of cash to fund our operations, should we desire to borrow under our credit agreement. As a result, we may have to reduce our capital expenditures in future years. A decrease in our capital expenditures will likely result in a decrease in our production levels.
Continued weakness in economic conditions or uncertainty in financial markets may have material adverse impacts on our business that we cannot predict.
U.S. and global economies and financial systems have experienced episodes of turmoil and upheaval characterized by extreme volatility in prices of securities, diminished liquidity and credit availability, inability to access capital markets, the bankruptcy, failure, collapse or sale of financial institutions, and continue to be affected by continued high levels of unemployment and an unprecedented level of intervention by the U.S. federal and other governments. Continued weakness in the U.S. or global economies could materially adversely affect our business and financial condition. For example:
| • | the demand for oil and natural gas in the U.S. may decline from present levels and may remain at low levels if economic conditions remain weak, and negatively impact our revenues, margins, profitability, operating cash flows, liquidity and financial condition; |
| • | the tightening of credit or lack of credit availability to our customers could adversely affect our ability to collect our trade receivables; |
| • | our ability to access the capital markets may be restricted at a time when we would like, or need, to raise capital for our business, including for exploration and/or development of our reserves; and |
| • | our commodity hedging arrangements could become ineffective if our counterparties are unable to perform their obligations or seek bankruptcy protection. |
Our success depends on acquiring or finding additional reserves.
Our future success depends upon our ability to find, develop or acquire additional oil and natural gas reserves that are economically recoverable. Our proved reserves will generally decline as reserves are produced,
10
Table of Contents
except to the extent that we conduct successful exploration or development activities or acquire properties containing proved reserves, or both. To increase reserves and production, we must commence exploratory drilling, undertake other replacement activities or utilize third parties to accomplish these activities. There can be no assurance, however, that we will have sufficient resources to undertake these actions, that our exploratory projects or other replacement activities will result in significant additional reserves or that we will succeed in drilling productive wells at low finding and development costs. Furthermore, although our revenues may increase if prevailing oil and natural gas prices increase significantly, our finding costs for additional reserves could also increase.
In accordance with customary industry practice, we rely in part on independent third party service providers to provide most of the services necessary to drill new wells, including drilling rigs and related equipment and services, horizontal drilling equipment and services, trucking services, tubular goods, fracing and completion services and production equipment. The oil and natural gas industry has experienced significant volatility in cost for these services in recent years and this trend is expected to continue into the future. Any future cost increases could significantly increase our development costs and decrease the return possible from drilling and development activities, and possibly render the development of certain proved undeveloped reserves uneconomical.
Our exploration and development drilling efforts and the operation of our wells may not be profitable or achieve our targeted returns.
Exploration, development, drilling and production activities are subject to many risks, including the risk that commercially productive reservoirs will not be discovered. We plan to invest in property, including undeveloped leasehold acreage, which we believe will result in projects that will add value over time. However, we cannot guarantee that all of our prospects will result in viable projects or that we will not abandon our initial investments. Additionally, we cannot guarantee that the leasehold acreage we acquire will be profitably developed, that new wells drilled by us will be productive or that we will recover all or any portion of our investment in such leasehold acreage or wells. Drilling for oil and natural gas may involve unprofitable efforts, not only from dry wells but also from wells that are productive but do not produce sufficient net reserves to return a profit after deducting operating and other costs. In addition, wells that are profitable may not achieve our targeted rate of return. Our ability to achieve our target results are dependent upon the current and future market prices for oil and natural gas, costs associated with producing oil and natural gas and our ability to add reserves at an acceptable cost. We significantly rely on 3-D seismic data and other advanced technologies in identifying leasehold acreage prospects and in conducting our exploration activities. The 3-D seismic data and other technologies we use do not allow us to know conclusively prior to our acquisition of leasehold acreage or drilling a well whether oil or gas is present or may be produced economically. The use of 3-D seismic data and other technologies also requires greater pre-drilling expenditures than traditional drilling strategies. All of the foregoing factors may affect our ability to achieve our estimated 2012 production and related costs guidance.
Many of the emerging resource plays that we have targeted have limited or no production history using the drilling and completion methods that we expect to employ. Accordingly, these operations are subject to more uncertainties than our drilling activities in more established fields and formations and may not meet our expectations for reserves or production. If initially successful, the ultimate success of these drilling and completion strategies and techniques in these new formations will be better evaluated over time as more wells are drilled and production profiles are better established.
In addition, we may not be successful in controlling and reducing our drilling and production costs in order to improve our overall return. The cost of drilling, completing and operating a well is often uncertain and cost factors can adversely affect the economics of a project. We cannot predict the cost of drilling and completion, and we may be forced to limit, delay or cancel drilling and completion operations as a result of a variety of factors, including:
| • | unexpected drilling conditions; |
| • | pressure or irregularities in formations; |
11
Table of Contents
| • | equipment failures or accidents and shortages or delays in the availability of oilfield services or drilling rigs and other equipment; |
| • | adverse weather conditions, including hurricanes; and |
| • | compliance with governmental requirements. |
The actual quantities and present values of our proved oil and natural gas reserves may be less than we have estimated.
This report and other SEC filings by us contain estimates of our proved oil and natural gas reserves and the estimated future net revenues from those reserves. These estimates are based on various assumptions, including assumptions required by the SEC relating to oil and natural gas prices, drilling and operating expenses, capital expenditures, taxes, timing of operations, and availability of funds. The process of estimating oil and natural gas reserves is complex. The process involves significant decisions and assumptions in the evaluation of available geological, geophysical, engineering, and economic data for each reservoir. These estimates are dependent on many variables, and therefore changes often occur as these variables evolve. Therefore, these estimates are inherently imprecise. For example, total revisions of our previous reserve estimates decreased proved reserves by 2.2 MMBoe or approximately 9% of our reserves at the beginning of the year. The revisions included a positive increase of 0.9 MMBoe or 4% of the beginning of the year reserves caused by higher oil and gas prices. This positive revision was offset by the downward revision of 1.4 MMBoe caused by the transfer of proved reserves to unproved categories as a result of updated geological and engineering evaluations and changes to the company development plans during 2011, and 1.7 MMBoe of the downward revisions were mostly due to changes in well performance.
Actual future production, oil and natural gas prices, revenues, production taxes, development expenditures, operating expenses, and quantities of producible oil and natural gas reserves will most likely vary from those estimated. Any significant variance could materially affect the estimated quantities of and present values related to proved reserves disclosed by us, and the actual quantities and present values may be less than we have previously estimated. In addition, we may adjust estimates of proved reserves to reflect production history, results of exploration and development activity, prevailing oil and natural gas prices, costs to develop and operate properties, and other factors, many of which are beyond our control. Our properties may also be susceptible to hydrocarbon drainage from production on adjacent properties.
As of December 31, 2011, approximately 37%, or 7.7 MMBoe, of our estimated proved reserves were proved undeveloped, and approximately 5%, or 1.1 MMBoe, were proved developed non-producing. In order to develop our proved undeveloped reserves, we estimate approximately $87.4 million of capital expenditures will be required. Production revenues from proved developed non-producing reserves will not be realized until sometime in the future and after some investment of capital. Although we have estimated our reserves and the costs associated with these reserves in accordance with industry standards, estimated costs may not be accurate, development may not occur as scheduled and actual results may not occur as estimated.
You should not assume that the standardized measure of discounted future net cash flows included in this report represent the current market value of our estimated proved oil and natural gas reserves. Management has based the estimated discounted future net cash flows from proved reserves on price and cost assumptions required by the SEC, whereas actual future prices and costs may be materially higher or lower. For example, our proved reserves as of December 31, 2011, were estimated using the 12-month unweighted arithmetic average of the first-day-of-the-month price of $96.19 per Bbl of oil (NYMEX West Texas Intermediate settle price) and $4.12 per Mcf of natural gas (Platts Henry Hub spot price). We then adjust these base prices to reflect appropriate basis, quality, and location differentials over that period in estimating our proved reserves. During 2011, our monthly average realized oil prices, excluding the effect of hedging, were as high as $107.75 per Bbl and as low as $85.06 per Bbl. For the same period, our monthly average realized natural gas prices before hedging were as high as $4.36 per Mcf and as low as $3.51 per Mcf. Many other factors will affect actual future net cash flows, including:
12
Table of Contents
| • | Amount and timing of actual production; |
| • | Supply and demand for oil and natural gas; |
| • | Curtailments or increases in consumption by oil purchasers and natural gas pipelines; and |
| • | Changes in government regulations or taxes. |
The timing of production from oil and natural gas properties and of related expenses affects the timing of actual future net cash flows from proved reserves, and thus their actual present value used in calculating standardized measure. Our actual future net cash flows could be less than the estimated future net cash flows for purposes of computing standardized measure. In addition, the ten percent discount factor required by the SEC to be used to calculate standardized measure for reporting purposes is not necessarily the most appropriate discount factor given actual interest rates, costs of capital, and other risks to which our business and the oil and natural gas industry in general are subject.
Our business could suffer if we lose the services of key personnel.
Our success will depend in large measure on the abilities, expertise and judgment of our management and other personnel in conducting our business. We are in the process of building our management team, and are therefore particularly dependent upon Floyd C. Wilson, our Chairman, Chief Executive Officer and President, and Mark J. Mize, our Executive Vice President, Chief Financial Officer, and Treasurer. The loss of Mr. Wilson, Mr. Mize or other key personnel could have a material adverse effect on our company. We do not maintain key-man insurance on the life of Mr. Wilson or Mr. Mize.
The terms of Mr. Wilson’s Executive Retention Agreement may limit our growth opportunities prior to November 1, 2012.
Floyd C. Wilson, our Chairman, Chief Executive Officer and President, is subject to certain noncompetition and nonsolicitation provisions with Petrohawk Energy Corporation. As a result of his ownership status and director and officer positions with us, these noncompetition provisions will generally prohibit us from pursuing any oil and gas operations within a 50-mile radius of any oil and gas operations of BHP Billiton Petroleum (North America) Inc. (the successor to Petrohawk) or its affiliates, prior to November 1, 2012. The terms of the Executive Retention Agreement also prohibit Mr. Wilson, and as a result, us, from soliciting certain specified customers, employees and contractors of BHP Billiton prior to November 1, 2012. These noncompetition provisions may limit our ability to pursue advantageous acquisition or leasing opportunities and may limit our ability to attract and retain executive-level management and technical, financial and field personnel in the near future, which may adversely affect our business, operating results and financial condition.
Failure to attract and retain skilled managers and other personnel could limit growth.
Our business plan contemplates a significant increase in the size and scope of our operations, and we will have to expand our workforce to support this anticipated growth. Our future success will depend in large part upon our ability to attract and retain additional highly skilled executive-level management and technical, financial and field personnel having experience in the oil and natural gas exploration and production business. Competition for qualified personnel is intense, and we can give no assurance that we will be successful in attracting, training and retaining such personnel. Our inability to hire an adequate number of additional qualified personnel may lead to higher recruiting, relocation and compensation costs for such personnel. If we fail to attract, train and retain key personnel, our business, operating results and financial condition will be materially and adversely affected.
13
Table of Contents
The continued tightness in the financial and credit markets may expose us to counterparty risk with respect to our sales of oil and natural gas.
We sell our crude oil, natural gas and natural gas liquids to a variety of purchasers. Some of these parties may not be as creditworthy as we are and may experience liquidity problems. Nonperformance by a trade creditor could result in our incurring losses.
Operating hazards and uninsured risks may result in substantial losses.
Our operations are subject to all of the hazards and operating risks inherent in drilling for, and the production of, oil and natural gas, including the risk of fire, explosions, blow-outs, pipe failure, abnormally pressured formations and environmental hazards such as oil spills, gas leaks, ruptures or discharges of toxic gases. The occurrence of any of these events could result in substantial losses to us due to injury or loss of life, severe damage to or destruction of property, natural resources and equipment, pollution or other environmental damage, clean-up responsibilities, regulatory investigation and penalties and suspension of operations. In accordance with customary industry practice, we maintain insurance against some, but not all, of these risks. There can be no assurance that any insurance will be adequate to cover any losses or liabilities. We cannot predict the continued availability of insurance, or its availability at premium levels that justify its purchase. In addition, we may be liable for environmental damage caused by previous owners of properties purchased by us, which liabilities would not be covered by our insurance.
Title to properties in which we own or acquire an interest may be impaired by title defects.
We generally obtain title opinions on significant properties that we drill or acquire. However, we can provide no assurance that we will not suffer a monetary loss from title defects or title failure. Additionally, we are actively pursuing acquisitions of undeveloped acreage, which normally presents a greater risk of title defects than developed acreage. Generally, under the terms of the operating agreements affecting our properties, any monetary loss is borne by all parties to any such agreement in proportion to their interests in the property. If there are any title defects or defects in assignment of leasehold rights in properties in which we hold or acquire an interest, we will suffer a financial loss.
We will be subject to risks in connection with acquisitions, and the integration of significant acquisitions may be difficult.
Our business plan contemplates significant acquisitions of reserves, properties, prospects and leaseholds and other strategic transactions that appear to fit within our overall business strategy, which may include the acquisition of asset packages of producing properties or existing companies or businesses operating in our industry. The successful acquisition of producing properties requires an assessment of several factors, including:
| • | recoverable reserves; |
| • | future oil and natural gas prices and their appropriate differentials; |
| • | development and operating costs; and |
| • | potential environmental and other liabilities. |
The accuracy of these assessments is inherently uncertain. In connection with these assessments, we perform a review of the subject properties that we believe to be generally consistent with industry practices. Our review will not reveal all existing or potential problems nor will it permit us to become sufficiently familiar with the properties to fully assess their deficiencies and potential recoverable reserves. Inspections may not always be performed on every well, and environmental problems are not necessarily observable even when an inspection is undertaken. Even when problems are identified, the seller may be unwilling or unable to provide effective contractual protection against all or part of the problems. We are not entitled to contractual indemnification for environmental liabilities and acquire properties on an “as is” basis.
14
Table of Contents
Significant acquisitions of existing companies or businesses and other strategic transactions may involve additional risks, including:
| • | diversion of our management’s attention to evaluating, negotiating and integrating significant acquisitions and strategic transactions; |
| • | the challenge and cost of integrating acquired operations, information management and other technology systems and business cultures with our own while carrying on our ongoing business; |
| • | difficulty associated with coordinating geographically separate organizations; and |
| • | the challenge of attracting and retaining personnel associated with acquired operations. |
The process of integrating operations could cause an interruption of, or loss of momentum in, the activities of our business. Members of our senior management may be required to devote considerable amounts of time to this integration process, which will decrease the time they will have to manage our business. If our senior management is not able to manage the integration process effectively, or if any significant business activities are interrupted as a result of the integration process, our business could be materially and adversely affected.
The Electra/Burkburnett Fields occasionally experience saline water discharges as a result of unplugged or inadequately plugged wells.
The Electra/Burkburnett Fields have been the subject of extensive exploration and production activities for nearly a century. As a result, there are numerous inactive wellbores throughout the fields. Many may not have been properly plugged and abandoned according to modern standards. As a consequence, waterflood operations occasionally cause “breakouts” of brine or produced water when the injected water moves up the casing of such a well and emerges at the surface. When these breakouts have been detected in the past, the incident has been reported to the local office of the Texas Railroad Commission, a berm has been constructed to contain the effluent, which has been recovered and properly disposed of in an injection well, the source of the breakout is located, and mitigation measures have been implemented that usually involve plugging or replugging the discharging conduit. We may incur costs to respond to future breakouts in the Electra/Burkburnett Fields, and we may be subject to federal or state enforcement action if such breakouts enter surface waters before they can be detected and captured.
Our operations are subject to various governmental regulations that require compliance that can be burdensome and expensive.
Our operations are subject to various federal, state and local governmental regulations that may be changed from time to time in response to economic and political conditions. Matters subject to regulation include discharge from drilling operations, drilling bonds, reports concerning operations, the spacing of wells, unitization and pooling of properties and taxation. From time to time, regulatory agencies have imposed price controls and limitations on production by restricting the rate of flow of oil and natural gas wells below actual production capacity to conserve supplies of oil and natural gas. In addition, the production, handling, storage, transportation and disposal of oil and natural gas, by-products thereof and other substances and materials produced or used in connection with oil and natural gas operations are subject to regulation under federal, state and local laws and regulations primarily relating to protection of human health and the environment. These laws and regulations have continually imposed increasingly strict requirements for water and air pollution control and solid waste management, and compliance with these laws may cause delays in the additional drilling and development of our properties. Significant expenditures may be required to comply with governmental laws and regulations applicable to us. We believe the trend of more expansive and stricter environmental legislation and regulations will continue. While historically we have not experienced any material adverse effect from regulatory delays, there can be no assurance that such delays will not occur in the future.
15
Table of Contents
Unusual weather patterns or natural disasters, whether due to climate change or otherwise, could negatively impact our financial condition.
Our business depends, in part, on normal weather patterns across the United States. Natural gas demand and prices are particularly susceptible to seasonal weather trends. Warmer than usual winters can result in reduced demand and high season-end storage volumes, which can depress prices. In addition, because a majority of our properties are located in Texas, Louisiana and Oklahoma, our operations are constantly at risk of extreme adverse weather conditions such as hurricanes and tornadoes. Any unusual or prolonged adverse weather patterns in our areas of operations or markets, whether due to climate change or otherwise, could have a material and adverse impact on our business, financial condition and cash flow. In addition, our business, financial condition and cash flow could be adversely affected if the businesses of our key vendors, purchasers, contractors, suppliers or transportation service providers were disrupted due to severe weather, such as hurricanes or floods, whether due to climate change or otherwise.
Climate change and government laws and regulations related to climate change could negatively impact our financial condition.
In addition to other climate-related risks set forth in this “Risk Factors” section, we are and will be, directly and indirectly, subject to the effects of climate change and may, directly or indirectly, be affected by government laws and regulations related to climate change. We cannot predict with any degree of certainty what effect, if any, possible climate change and new and developing government laws and regulations related to climate change will have on our operations, whether directly or indirectly. While we believe that it is difficult to assess the timing and effect of climate change and pending legislation and regulation related to climate change on our business, we believe that climate change and government laws and regulations related to climate change may affect, directly or indirectly, (i) the cost of the equipment and services we purchase, (ii) our ability to continue to operate as we have in the past, including drilling, completion and operating methods, (iii) the timeliness of delivery of the materials and services we need and the cost of transportation paid by us and our vendors and other providers of services, (iv) insurance premiums, deductibles and the availability of coverage, and (v) the cost of utility services, particularly electricity, in connection with the operation of our properties. In addition, climate change may increase the likelihood of property damage and the disruption of our operations, especially in coastal states. As a result, our financial condition could be negatively impacted by significant climate change and related governmental regulation, and that impact could be material.
Regulation and recent court decisions related to greenhouse gas emissions could have an adverse effect on our operations and demand for oil and natural gas.
The U.S. Congress has previously considered legislation to reduce emissions of “greenhouse gases,” including carbon dioxide, methane and nitrous oxide among others, which some studies have suggested may be contributing to warming of the earth’s atmosphere. However, legislation to reduce greenhouse gases appears less likely in the near term. As a result, near term regulation of greenhouse gases, if any, is more likely to come from regulatory action by EPA or by the several states that have already taken legal measures to reduce emissions of greenhouse gases.
As a result of the U.S. Supreme Court’s decision on April 2, 2007 in Massachusetts, et al. v. EPA, 549 U.S. 497 (2007), finding that greenhouse gases fall within the Clean Air Act (“CAA”) definition of “air pollutant,” the Environmental Protection Agency (“EPA”) was required to determine whether emissions of greenhouse gases “endanger” public health or welfare. As a result, the EPA has adopted regulations requiring Clean Air Act (“CAA”) permitting of greenhouse gas emissions from stationary and mobile sources. On December 15, 2009, EPA promulgated its final rule, “Endangerment and Cause or Contribute Findings for Greenhouse Gases Under Section 202(a) of the Clean Air Act,” finding that (i) the current and projected emissions of six key well-mixed greenhouse gases, including carbon dioxide and methane, constitute a threat to public health and welfare, and (ii) the combined emissions from motor vehicles cause and contribute to the
16
Table of Contents
climate change problem which threatens public health and welfare. These findings did not themselves impose any requirements on industry or other entities, but were a prerequisite to EPA’s adoption of greenhouse gas emission standards for motor vehicles. On May 7, 2010, EPA and the Department of Transportation’s National Highway Traffic and Safety Administration, or NHTSA, promulgated a final action establishing a national program providing new standards for certain motor vehicles to reduce greenhouse gas emissions and improve fuel economy, with EPA adopting the standards under the CAA, and NHTSA adopting the standards as Corporate Average Fuel Economy standards under the Energy Policy and Conservation Act. While these motor vehicle regulations do not directly impact oil and natural gas production operations, the result of these actions are significant in that they automatically trigger application of certain CAA permit programs for stationary greenhouse gas emissions sources, potentially including oil and natural gas production operations. These programs, the Prevention of Significant Deterioration (“PSD”) and Title V Operating Permit programs, have historically applied to sources of air pollutants “subject to regulation” with emissions exceeding 100 and 250 tons per year. To avoid the broad impact of such low permitting thresholds for greenhouse gas emission sources, on June 3, 2010, EPA promulgated its “Prevention of Significant Deterioration and Title V Greenhouse Gas Tailoring Rule,” to add new higher thresholds of 75,000 tons per year carbon dioxide equivalents (“CO 2 e”) for modifications and 100,000 tons per year CO 2 e for new sources.
Additionally, EPA has promulgated separate regulations requiring greenhouse gas emission reporting from certain industry sectors, including natural gas production. On October 30, 2009, EPA promulgated a final mandatory greenhouse gas reporting rule which will assist EPA in developing policy approaches to greenhouse gas regulation. This reporting rule became effective on December 29, 2009. On November 30, 2010, EPA promulgated additional mandatory greenhouse gas reporting rules that apply specifically to oil and natural gas production for implementation in 2011.
Though under review by the D.C. Circuit, EPA’s rules promulgated thus far have survived petitions for stay, and are currently final and effective, and will remain so unless vacated or remanded by the court, or unless Congress adopts legislation preempting EPA’s regulatory authority to address greenhouse gases under the CAA.
EPA has also proposed new air emission technology standards specifically applicable to the oil and natural gas sector which enlarge the scope of regulated equipment. These proposed rules, if promulgated, will add another layer of additional indirect GHG regulation.
Beyond legislative and regulatory developments, there have been several recent court cases impacting this area of risk related to greenhouse gas emissions. The final decisions in these cases may expose us to similar litigation risk.
The decisions in these cases may expose us, as potentially an emitter of significant direct and indirect emission sources of greenhouse gases, to similar litigation risk.
International treaties. Other nations have already agreed to regulate emissions of greenhouse gases pursuant to the United Nations Framework Convention on Climate Change, also known as the “Kyoto Protocol,” an international treaty pursuant to which participating countries (not including the United States) agreed to reduce their emissions of greenhouse gases to below 1990 levels by 2012. Though the 16th meeting of the Council of the Parties in Mexico in November and December 2010 did not produce a legally binding final agreement, international negotiations continue, with the participation of the United States.
International developments, passage of state or federal climate control legislation or other regulatory initiatives, the implementation of regulations by EPA and analogous state agencies that restrict emissions of greenhouse gases in areas in which we conduct business, or further development of case law allowing claims based upon greenhouse gas emissions, could have an adverse effect on our operations and financial condition as a result of material increases in operating and production costs and litigation expense due to expenses associated with monitoring, reporting, permitting and controlling greenhouse gas emissions or litigating claims related to emissions of greenhouse gases, and the demand for oil and natural gas and increase the costs of our operations.
17
Table of Contents
Potential legislative and regulatory actions relating to Federal income taxation could increase our costs, reduce our revenue and cash flow from oil and natural gas sales, reduce our liquidity or otherwise alter the way we conduct our business.
In 2009, 2010, 2011, and 2012 the administration of President Obama made budget proposals which, if enacted into law by Congress, would potentially increase and accelerate the payment of federal income taxes by independent producers of oil and natural gas. Proposals have included, but have not been limited to, repealing the enhanced oil recovery credit, repealing the credit for oil and gas produced from marginal wells, repealing the expensing of intangible drilling costs, repealing the deduction for the cost of qualified tertiary expenses, repealing the exception to the passive loss limitation for working interests in oil and natural gas properties, repealing the percentage depletion allowance, repealing the manufacturing tax deduction for oil and natural gas companies, and increasing the amortization period of geological and geophysical expenses. In 2009, 2010, and 2011, legislation which would have implemented the proposed changes was introduced but not enacted. It is unclear whether legislation supporting any of the above described proposals, or designed to accomplish similar objectives, will be introduced or, if introduced, would be enacted into law or, if enacted, how soon resulting changes would become effective. However, the passage of any legislation designed to implement changes in the U.S. federal income tax laws similar to the changes included in the budget proposals offered by the White House in 2009, 2010, 2011 and 2012 could eliminate certain tax deductions currently available with respect to oil and gas exploration and development, and any such changes (i) could make it more costly for us to explore for and develop our oil and natural gas resources and (ii) could negatively affect our financial condition and results of operations.
Federal and state legislation and regulatory initiatives relating to hydraulic fracturing could result in increased costs and additional operating restrictions or delays.
We utilize hydraulic fracturing as a means to enhance the productive capability of our wells. Congress has previously considered legislation to amend the federal Safe Drinking Water Act to require the disclosure of chemicals used by the oil and natural gas industry in the hydraulic fracturing process. Hydraulic fracturing involves the injection of water, sand and chemicals under pressure into rock formations to stimulate natural gas production. Sponsors of bills previously proposed before the Senate and House of Representatives have asserted that chemicals used in the fracturing process could adversely affect drinking water supplies. That proposed legislation would require the reporting and public disclosure of chemicals used in the fracturing process, which could make it easier for third parties opposing the hydraulic fracturing process to initiate legal proceedings based on allegations that specific chemicals used in the fracturing process could adversely affect groundwater. In addition, these bills, if adopted, could repeal the exemptions for hydraulic fracturing from the Safe Drinking Water Act. These legislative efforts have halted while EPA studies the issue of hydraulic fracturing. In 2010, EPA initiated a Hydraulic Fracturing Research Study to address concerns that hydraulic fracturing may affect the safety of drinking water. As part of that process, EPA requested and received information from the major fracturing service providers regarding the chemical composition of fluids, standard operating procedures and the sites where they engage in hydraulic fracturing. In February 2011, EPA released its Draft Plan to Study the Potential Impacts of Hydraulic Fracturing on Drinking Water Resources, proposing to study the lifecycle of hydraulic fracturing fluid and providing a comprehensive list of chemicals identified in fracturing fluid and flowback/produced water. These developments, as well as increased scrutiny of hydraulic fracturing activities by state authorities, may result in additional levels of regulation or level of complexity with respect to existing regulation at the federal and state levels that could lead to operational delays or increased operating costs and could result in additional regulatory burdens that could make it more difficult to perform hydraulic fracturing, which could result in limiting the productive capability of future wells in which we likely would utilize hydraulic fracturing and increase our costs of compliance and doing business.
Our method of accounting for investments in oil and natural gas properties may result in a further impairment of asset value, which could affect our stockholder equity and net profit or loss.
We use the full cost method of accounting for our investment in oil and natural gas properties. Under the full cost method of accounting, all costs of acquisition, exploration and development of oil and natural gas
18
Table of Contents
reserves are capitalized into a “full cost pool.” Capitalized costs in the pool are amortized and charged to operations using the units-of-production method based on the ratio of current production to total proved oil and natural gas reserves. To the extent that such capitalized costs, net of amortization, exceed the after tax present value of estimated future net revenues from our proved oil and natural gas reserves (using a 10% discount rate) at any reporting date, such excess costs are charged to operations. We incurred no impairment charge for 2011 and 2010. In 2009, we recorded a $47.6 million charge for the impairment of our oil and natural gas properties. Any writedowns are not reversible at a later date, even if the present value of our proved oil and natural gas reserves increases as a result of an increase in oil or natural gas prices. Further price declines could result in additional impairments of asset value.
We face intensive competition in our industry.
We operate in a highly competitive environment. We compete with major and independent oil and natural gas companies, many of whom have financial and other resources substantially in excess of those available to us. These competitors may be better positioned to take advantage of industry opportunities and to withstand changes affecting the industry, such as fluctuations in oil and natural gas prices and production, the availability of alternative energy sources and the application of government regulation.
Our use of derivative contracts is subject to risks that our counterparties may default on their contractual obligations to us and may cause us to forego additional future profits or result in our making cash payments.
Our use of derivative contracts could have the effect of reducing our revenues and the value of our common stock. To reduce our exposure to changes in the prices of oil and natural gas, we have entered into and will in the future enter into derivative contracts for a portion of our oil and natural gas production. Our derivative contracts are subject to mark-to-market accounting treatment, which means that the change in the fair market value of these instruments is reported as a non-cash item in our statement of operations each quarter, which typically result in significant variability in our net income. Derivative contracts expose us to the risk of financial loss and may limit our ability to benefit from increases in oil and natural gas prices in some circumstances, including the following:
| • | the counterparty to the derivative contract may default on its contractual obligations to us; |
| • | there is a widening of the price differentials between delivery points for our production and the delivery point assumed in the derivative contract; or |
| • | our production is less than our hedged volumes. |
The ultimate settlement amount of these unrealized derivative contracts is dependent on future commodity prices. We may incur significant unrealized losses in the future from our use of derivative contracts to the extent market prices increase and our derivatives contracts remain in place. See “Item 7A. Quantitative and Qualitative Disclosures About Market Risk — Commodity Price Risk” appearing elsewhere in this report.
Our ability to generate cash depends on many factors beyond our control, and any failure to meet our debt obligations could harm our business, financial condition and results of operations.
Our ability to make payments on borrowings under our credit agreement or other indebtedness we may incur and to fund planned capital expenditures will depend on our ability to generate cash from operations and other resources in the future. This, to a certain extent, is subject to general economic, financial, competitive, legislative, regulatory and other factors that are beyond our control, including the prices that we receive for oil and natural gas.
Our business may not generate sufficient cash flow from operations and future borrowings may not be available to us in an amount sufficient to enable us to pay our indebtedness or to fund our other liquidity needs. If
19
Table of Contents
our cash flow and capital resources are insufficient to fund our debt obligations, we may be forced to sell assets, seek additional equity or debt capital or restructure our debt. None of these remedies may, if necessary, be effected on commercially reasonable terms, or at all. In addition, any failure to make scheduled payments of interest and principal on our outstanding indebtedness would likely result in a reduction of our credit rating, which could harm our ability to incur additional indebtedness on acceptable terms. Our cash flow and capital resources may be insufficient for payment of interest on and principal of our debt in the future, which could cause us to default on our obligations and could impair our liquidity.
Restrictive debt covenants could limit our growth and our ability to finance our operations, fund our capital needs, respond to changing conditions and engage in other business activities that may be in our best interests.
Our credit agreement contains a number of significant covenants that, among other things, restrict our ability to:
| • | dispose of assets; |
| • | incur or guarantee additional indebtedness and issue certain types of preferred stock; |
| • | pay dividends on our capital stock; |
| • | create liens on our assets; |
| • | enter into sale or leaseback transactions; |
| • | enter into specified investments or acquisitions; |
| • | repurchase, redeem or retire our capital stock or subordinated debt; |
| • | merge or consolidate, or transfer all or substantially all of our assets and the assets of our subsidiaries; |
| • | engage in specified transactions with subsidiaries and affiliates; or |
| • | pursue other corporate activities. |
We may be prevented from taking advantage of business opportunities that arise because of the limitations imposed on us by the restrictive covenants under our credit agreement. Also, our credit agreement requires us to maintain compliance with specified financial ratios and satisfy certain financial condition tests. Our ability to comply with these ratios and financial condition tests may be affected by events beyond our control and, as a result, we may be unable to meet these ratios and financial condition tests. These financial ratio restrictions and financial condition tests could limit our ability to obtain future financings, make needed capital expenditures, withstand a future downturn in our business or the economy in general or otherwise conduct necessary corporate activities. A decline in oil and natural gas prices, or a prolonged period of oil and natural gas prices at lower levels, could eventually result in our failing to meet one or more of the financial covenants under our credit agreement, which could require us to refinance or amend the agreement resulting in the payment of consent fees or higher interest rates, or require us to raise additional capital at an inopportune time or on terms not favorable to us.
A breach of any of these covenants or our inability to comply with the required financial ratios or financial condition tests could result in a default under our credit agreement. A default under our credit agreement, if not cured or waived, could result in acceleration of all indebtedness outstanding under our credit agreement. The accelerated debt would become immediately due and payable. If that should occur, we may be unable to pay all such debt or to borrow sufficient funds to refinance it. Even if new financing were then available, it may not be on terms that are acceptable to us.
20
Table of Contents
We may be classified as an inadvertent investment company if we are unable to reinvest our cash.
We are not engaged in the business of investing, reinvesting, or trading in securities, and we do not hold ourselves out as being engaged in those activities. However, under the Investment Company Act of 1940 (the “1940 Act”), a company may be classified as an “inadvertent investment company” under section 3(a)(1)(C) of the 1940 Act if (absent an available exemption or exclusion under the 1940 Act categories) the value of investment securities is more than 40% of its total assets (exclusive of government securities and cash items). Total asset value includes amounts for assets recorded on the financial statements, as well as additional amounts which the board of directors believes reflect the fair value of those assets.
Classification as an investment company would require prompt registration with the SEC as an investment company under the 1940 Act. If an investment company, even an inadvertent one, fails to register, it would have to stop conducting almost all business, and its contracts would become voidable. Registration is time consuming and restrictive; we would be very constrained in the kind of business we could conduct as a registered investment company.
Risks Related to Our Common Stock
We do not currently pay dividends on our common stock and do not anticipate doing so in the future.
We intend to retain any future earnings to fund our operations; therefore, we do not anticipate paying any cash dividends on our common stock in the foreseeable future. Also, our credit agreement does not permit us to pay dividends on our common stock.
Substantial stock ownership by our affiliates may limit the ability of our non-affiliate stockholders to influence the outcome of director elections and other matters requiring stockholder approval.
Halcón Resources, LLC owns approximately 74% of our outstanding common stock. Accordingly, it will have significant influence in the election of our directors and, therefore, our policies and direction. This concentration of voting power could have the effect of delaying or preventing a change in our control or discouraging a potential acquirer from attempting to obtain control of us, which in turn could have a material adverse effect on the market price of our common stock or prevent our stockholders from realizing a premium over the market price for their shares of common stock.
You may experience dilution of your ownership interests due to the future issuance of additional shares of our common stock, which could have an adverse effect on our stock price.
We may in the future issue our previously authorized and unissued securities, resulting in the dilution of the ownership interests of our present stockholders. We are currently authorized to issue approximately 336.7 million shares of common stock and 1.0 million shares of preferred stock with such designations, preferences and rights as determined by our board of directors. As of the date of this report, after giving effect to the securities issued in the recapitalization, we had outstanding approximately 99.4 million shares of common stock. Additionally, we have issued shares of preferred stock convertible into approximately 44.4 million shares of common stock and, in the recapitalization, we issued warrants exercisable for approximately 36.7 million shares of common stock and a convertible note that is convertible into approximately 61.1 million shares of common stock. We have also reserved an additional 1.7 million shares for future issuance to our directors, officers and employees as restricted stock or stock option awards pursuant to our 2006 Long-Term Incentive Plan. The potential issuance of such additional shares of common stock may create downward pressure on the trading price of our common stock. We may also issue additional shares of our common stock or other securities that are convertible into or exercisable for common stock in connection with future acquisitions, future issuances of our securities for capital raising purposes or for other business purposes. Future sales of substantial amounts of our common stock, or the perception that sales could occur, could have a material adverse effect on the price of our common stock.
21
Table of Contents
The trading price of our common stock may be volatile.
The trading price of shares of our common stock has from time to time fluctuated widely and in the future may be subject to similar fluctuations. The trading price may be affected by a number of factors including the risk factors set forth in this report, as well as our operating results, financial condition, drilling activities and general conditions in the oil and natural gas exploration and development industry, the economy, the securities markets and other events. In addition, we have agreed to file a registration statement to permit the public resale of the shares of common stock acquired, or that may be acquired, by Halcón Resources, LLC and the shares of common stock underlying the convertible preferred stock sold on March 5, 2012. The influx of such a substantial number of shares into the public market could have a significant negative effect on the trading price of our common stock. In recent years broad stock market indices, in general, and smaller capitalization companies, in particular, have experienced substantial price fluctuations. In a volatile market, we may experience wide fluctuations in the market price of our common stock. These fluctuations may have an extremely negative effect on the market price of our common stock.
A delay in the automatic conversion of our outstanding 8% automatically convertible preferred stock into common stock or in the effectiveness of the registration statement for the resale of the common stock into which the preferred stock is convertible will trigger significant payment obligations which we may be unable to satisfy.
Each share of our outstanding preferred stock is automatically convertible into 10,000 shares of common stock, subject to certain adjustments, on the 20th calendar day after we mail a definitive information statement to our stockholders notifying them that our majority stockholder has consented to the issuance of common stock upon conversion of the preferred stock. If the preferred stock has not been converted into common stock on or before May 31, 2012, then the preferred stock will accrue dividends from the date of initial issuance at a rate of 8% per annum until such time as it has converted. In addition, we are required to file a registration statement to register for resale the common stock into which the preferred stock is convertible and to obtain its effectiveness within 120 days of the date of issuance of the preferred stock or we will become liable, for so long as such delay continues, to pay the holders of the preferred stock (or the common stock issued upon conversion thereof) a cash penalty of 0.0165% per day of the price at which the preferred stock was sold, if the preferred stock has not converted into common stock, and a cash penalty of 0.0333% of the price at which the preferred stock was sold, if the preferred stock has converted into common stock.
In addition, we will be required to redeem all of the outstanding preferred stock if it has not converted into common stock on or before February 9, 2018. No assurance can be given that we would have sufficient cash to satisfy the preferred stock quarterly cash dividend payments, registration penalties or redemption obligations in the event that the automatic conversion of the preferred stock or registration of the common stock into which it is convertible is delayed.
Certain provisions of Delaware law, our certificate of incorporation and bylaws could hinder, delay or prevent a change in control of our company, which could adversely affect the price of our common stock.
Certain provisions of Delaware law, our certificate of incorporation and bylaws could have the effect of discouraging, delaying or preventing transactions that involve an actual or threatened change in control of our company. Delaware law imposes restrictions on mergers and other business combinations between us and any holder of 15% or more of our outstanding common stock. In addition, our certificate of incorporation and bylaws include the following provisions:
| • | Classified Board of Directors. Our board of directors is divided into three classes with staggered terms of office of three years each. The classification and staggered terms of office of our directors make it more difficult for a third party to gain control of our board of directors. At least two annual meetings of stockholders, instead of one, generally would be required to effect a change in a majority of the board of directors. |
22
Table of Contents
| • | Removal of Directors. Under Delaware law, directors that serve on a classified board, such as our directors, may be removed only for cause by the affirmative vote of the holders of at least a majority of the voting power of the outstanding shares of our capital stock entitled to vote. |
| • | Number of Directors, Board Vacancies, Term of Office. Our certificate of incorporation and our bylaws provide that only the board of directors may set the number of directors. We have elected to be subject to certain provisions of Delaware law which vest in the board of directors the exclusive right, by the affirmative vote of a majority of the remaining directors, to fill vacancies on the board even if the remaining directors do not constitute a quorum. When effected, these provisions of Delaware law, which are applicable even if other provisions of Delaware law or the charter or bylaws provide to the contrary, also provide that any director elected to fill a vacancy shall hold office for the remainder of the full term of the class of directors in which the vacancy occurred, rather than the next annual meeting of stockholders as would otherwise be the case, and until his or her successor is elected and qualifies. |
| • | Advance Notice Provisions for Stockholder Nominations and Proposals. Our bylaws require advance written notice for stockholders to nominate persons for election as directors at, or to bring other business before, any meeting of stockholders. This bylaw provision limits the ability of stockholders to make nominations of persons for election as directors or to introduce other proposals unless we are notified in a timely manner prior to the meeting. |
| • | Amending the Bylaws. Our certificate of incorporation permits our board of directors to adopt, alter or repeal any provision of the bylaws or to make new bylaws. Our bylaws also may be amended by the affirmative vote of our stockholders. |
| • | Authorized but Unissued Shares. Under our certificate of incorporation, our board of directors has authority to cause the issuance of preferred stock from time to time in one or more series and to establish the terms, preferences and rights of any such series of preferred stock, all without approval of our stockholders. Nothing in our certificate of incorporation precludes future issuances without stockholder approval of the authorized but unissued shares of our common stock. |
We could issue shares of preferred stock which could be entitled to dividend, liquidation and other special rights and preferences not shared by holders of our common stock or which could have anti-takeover effects.
We are authorized to issue up to 1.0 million shares of preferred stock, which shares may be issued from time to time in one or more series as our board of directors, by resolution or resolutions, may from time to time determine. The voting powers, preferences and relative, participating, optional and other special rights, and the qualifications, limitations or restrictions thereof, if any, of each such series of our preferred stock may differ from those of any and all other series of preferred stock at any time outstanding, and, subject to certain limitations of our certificate of incorporation and Delaware law, our board of directors may fix or alter, by resolution or resolutions, the designation, number, voting powers, preferences and relative, participating, optional and other special rights, and qualifications, limitations and restrictions thereof, of each such series of our preferred stock. The issuance of any such preferred stock could materially adversely affect the rights of holders of our common stock and, therefore, could reduce the value of our common stock.
In addition, specific rights granted to future holders of preferred stock could be used to restrict our ability to merge with, or sell our assets to, a third party. The ability of our board of directors to issue preferred stock could discourage, delay or prevent a takeover of us, thereby preserving our control by the current stockholders.
| Item 1B. | Unresolved Staff Comments |
None.
23
Table of Contents
| Item 2. | Properties |
The table below summarizes our operations by state. Our principal properties in Texas primarily consist of the Electra/Burkburnett fields in Wichita and Wilbarger Counties and the La Copita field in Starr County. Our principal Oklahoma properties are the Northeast Fitts and Allen fields in Pontotoc and Seminole Counties. In Louisiana, our most significant property is the Lake Enfermer field in Lafourche Parish. During 2011, we drilled 49 gross wells (44.7 net) that were capable of production and experienced a success rate of 91%.
The following table summarizes our estimated proved oil and gas reserves by area as of December 31, 2011, and our average daily production by area for calendar year 2011:
| Average Daily Production Boe |
Oil MBbls |
Gas MMcf |
NGL MBbls |
Equivalent MBoe |
Percent of Proved Reserves |
|||||||||||||||||||
| Texas |
2,482 | 6,533 | 23,675 | 1,776 | 12,255 | 58 | % | |||||||||||||||||
| Oklahoma |
1,047 | 5,286 | 2,781 | 94 | 5,844 | 28 | % | |||||||||||||||||
| Louisiana |
419 | 346 | 12,249 | — | 2,387 | 11 | % | |||||||||||||||||
| Other |
173 | 206 | 1,349 | 140 | 571 | 3 | % | |||||||||||||||||
|
|
|
|
|
|
|
|
|
|
|
|
|
|||||||||||||
| 4,121 | 12,371 | 40,054 | 2,010 | 21,057 | 100 | % | ||||||||||||||||||
Texas Fields
The average daily production from our Texas fields was 2,482 Boe per day (60% of our total daily production) in 2011, a decrease of 36% from the previous year due to the production related to the assets sold in December 2010 and natural production declines not offset by increased drilling. We drilled a total of 41 gross (38.8 net) wells in our Texas fields, 40 gross (38.6 net) wells of which were completed as wells capable of production and one gross (0.2 net) well was abandoned. An additional four gross (4.0 net) wells were awaiting completion or pipeline connection at year end or in the process of drilling. As of December 31, 2011, the proved reserves in our Texas fields were 12.3 MMBoe and account for 58% of our total proved reserves. Our most significant Texas fields are as follows:
Electra/Burkburnett Fields. We drilled a total of 38 gross (38.0 net) wells, which were completed as wells capable of production during 2011 in our Electra/Burkburnett fields in Wichita and Wilbarger Counties, Texas and have drilled more than 389 wells in these fields since November 1, 2004. We own our own drilling rig and pulling units deployed exclusively for operations in these fields, and employ approximately 92 field personnel. We continue to focus on reducing operating costs in these fields and are also working to improve production performance through recompletions, workovers and improved water injection performance. As of December 31, 2011, the estimated proved reserves in these fields were 6.2 MMBoe (30% of our total proved reserves).
South Texas. During 2011, our net daily production from our South Texas properties averaged 865 Boe per day and make up 24% (5.1 MMBoe) of our total proved reserves. We did not drill any new wells in our La Copita field in Starr County, Texas during 2011. We are the operator of all of the wells in our La Copita field.
Oklahoma Fields
We produced an average of 1,047 Boe per day (25% of our total daily production) from our Oklahoma fields in 2011, a decrease of 19% over the previous year primarily due to production related to the assets sold in December 2010 and natural production declines. We drilled a total of eleven gross (10.2 net) wells in our Oklahoma fields, of which seven gross (6.2 net) wells were completed as wells capable of production and four gross (4.0 net) wells were either abandoned or temporarily abandoned. An additional two gross (1.9 net) wells were drilled to their objective depth and awaiting completion or pipeline connection at year end. As of December 31, 2011, the proved reserves in our Oklahoma fields were 5.8 MMBoe and account for 28% of our total proved reserves. Our most significant Oklahoma fields are as follows:
24
Table of Contents
Northeast Fitts and Allen Fields. During 2011, we initiated the drilling of one gross (0.2 net) development well and two gross (1.9 net) exploratory wells in our Northeast Fitts unit in Pontotoc County, Oklahoma. The Northeast Fitts field produces from shallow McAlester and Hunton formations at depths less than 4,000 feet. We are the operator of the units and, as such, control the pace of operations. The majority of our value in the Northeast Fitts field is primarily a mature waterflood. Our Allen Field has undeveloped opportunities in shallow multi-pay reservoirs. The combined proved reserves from these two areas are 5.2 MMBoe (25% of our total proved reserves).
Osage Concession. During 2011, we drilled ten gross (10.0 net) exploratory wells in our Osage County concession in northeastern Oklahoma. The Osage concession is in the Mississippian Lime formation and is predominantly crude oil and NGLs production. Initially developed using vertical wells, we plan to use horizontal drilling technology to reinvigorate previously exhausted areas.
Louisiana Fields
The average daily production from our Louisiana fields was 419 Boe per day (10% of our total daily production) in 2011, a decrease of 21% over the previous year due to a shut-in of one well as a result of a major workover and natural production declines. We did not drill any new wells in our Louisiana fields during 2011. As of December 31, 2011, the proved reserves in our Louisiana fields were 2.4 MMBoe and account for 11% of our total proved reserves.
The following table summarizes our 2011 drilling activity:
| Developed | Exploratory | |||||||||||||||||||||||
| Gross Wells Drilled(1) |
Net Wells Drilled(1) |
Completion Rate (%) |
Gross wells Drilled(2) |
Net Wells Drilled(2) |
Completion Rate (%) |
|||||||||||||||||||
| Texas |
41.0 | 38.8 | 98 | % | — | — | — | |||||||||||||||||
| Oklahoma |
1.0 | 0.2 | 100 | % | 10.0 | 10.0 | 60 | % | ||||||||||||||||
| Louisiana |
— | — | — | — | — | — | ||||||||||||||||||
| Other |
2.0 | — | 100 | % | — | — | — | |||||||||||||||||
|
|
|
|
|
|
|
|
|
|
|
|
|
|||||||||||||
| 44.0 | 39.0 | 98 | % | 10.0 | 10.0 | 60 | % | |||||||||||||||||
| (1) | Does not include five gross (4.0 net) wells that were in the process of being completed at December 31, 2011, and does not include seven gross (5.8 net) wells that were drilled in 2010 and waiting on pipeline connection. |
| (2) | Does not include two gross (1.9 net) wells that was in the process of being completed at December 31, 2011. |
Development, Exploitation and Exploration Programs
Development and Exploitation Program. Our future production and performance depends in part on the successful development of our existing reserves of oil and natural gas. We have identified multiple development projects on our existing properties, and these projects involve both the drilling of development wells and extension wells. We are the operator of leases covering approximately 2,600 of the gross wells capable of production in which we own interests, and as such we are able to control expenses, capital allocation and the timing of development activities on these properties. We also own interests in, and operate, approximately 600 gross injection wells. During the year ended December 31, 2011, we drilled or participated in the drilling of 43 gross (38.8 net) development wells capable of production. Capital expenditures in connection with these activities during this period aggregated approximately $17.4 million.
Another determinant of future performance is the exploitation of existing wells that can be recompleted or otherwise reworked to extract additional hydrocarbons. We have identified approximately 22 operated projects involving recompletions in existing wells that we operate, all of which involve reserves included in our proved reserves at December 31, 2011.
25
Table of Contents
Exploration Program. Historically, an important component of our strategy to expand our reserves and production has been an active exploration program focused on adding long-lived oil and natural gas reserves from our core areas and other resource plays. We have obtained a concession in Osage County, Oklahoma on 45,280 gross acres with 100% working interest. We have 3-D seismic data covering approximately 31,000 acres.
We have an experienced technical staff, including geologists, landmen, engineers and other technical personnel devoted to prospect generation and identification of potential drilling locations. We seek to reduce exploration risk by exploring at moderate depths that are deep enough to discover sizeable oil and natural gas accumulations (generally less than 13,000 feet). Our established presence in our core areas has provided our staff with substantial expertise. For exploration prospects we generate, we typically will own a greater interest in these projects than our drilling partners, if any, and will operate the wells. As a result, we will be able to influence the areas of exploration and the acquisition of leases, as well as the timing and drilling of each well. During the year ended December 31, 2011, we participated in the drilling of ten gross (10.0 net) exploratory wells.
Our capital expenditure budget for 2012 is approximately $1.1 billion (65% leasehold acquisitions, 25% drilling and completions, 7% infrastructure and 3% seismic) and is subject to revision based on various factors. The amount and timing of our actual capital expenditures for calendar year 2012 may vary significantly depending on a variety of factors, including prevailing market prices for oil and natural gas, the availability of acreage at acceptable prices in our targeted areas, results of our drilling operations, projects proposed by third party operators on jointly owned acreage, rig and service company availability, and other factors that we cannot predict and that may be beyond our control.
We expect to fund our 2012 capital budget with funds received from our recent recapitalization, proceeds received from our recent convertible preferred stock offering, cash flows from operations, proceeds from potential asset dispositions and borrowings under our credit agreement. We strive to maintain financial flexibility and may access capital markets as necessary to maintain substantial borrowing capacity under our credit agreement and selectively expand our acreage position and pursue growth opportunities. In the event our cash flows, proceeds from potential asset dispositions and other capital resources are not sufficient to fund our capital spending budget, we may access the capital markets. In the event we are unable to raise additional capital on acceptable terms, we may reduce our capital spending.
Oil and Natural Gas Reserves
Our proved reserve estimates for crude oil and natural gas were prepared by Forrest A. Garb & Associates, an independent petroleum engineering firm, in accordance with the generally accepted petroleum engineering and evaluation principles and most recent definitions and guidelines established by the Securities and Exchange Commission (“SEC”). A copy of Forrest A. Garb & Associates’ summary reserve report is attached as an exhibit to this report. All reserve definitions comply with the definitions of Rules 4-10 (a) (1)-(32) of SEC Regulation S-X.
To determine our estimated proved reserves, and as required by the SEC, we used the 12-month unweighted arithmetic average of the first-day-of-the-month price for the months of January through December 2011 calculated to be $4.12 per Mcf of natural gas and $96.19 per Bbl of oil. These prices were held constant for the life of the properties and adjusted for the appropriate market differentials.
As of December 31, 2011, our proved crude oil and natural gas reserves are presented below by reserve category. All of our proved reserves are located within the United States.
| Oil MBbl |
Gas MMcf |
NGL MBbl |
MBoe | Reserve % |
||||||||||||||||
| Proved developed producing |
8,342 | 16,697 | 1,158 | 12,283 | 58 | % | ||||||||||||||
| Proved developed nonproducing |
301 | 4,300 | 80 | 1,098 | 5 | % | ||||||||||||||
| Proved undeveloped |
3,728 | 19,057 | 772 | 7,676 | 37 | % | ||||||||||||||
|
|
|
|
|
|
|
|
|
|
|
|||||||||||
| Total proved |
12,371 | 40,054 | 2,010 | 21,057 | 100 | % | ||||||||||||||
| Developed |
8,643 | 20,997 | 1,238 | 13,381 | ||||||||||||||||
| % Developed |
70 | % | 52 | % | 62 | % | 64 | % | ||||||||||||
26
Table of Contents
Our properties have a 13.7 year reserve-to-production ratio.
Proved Undeveloped Reserves
At December 31, 2011, our total proved undeveloped reserves were 7.7 MMBoe, comprised of 4.5 MMBbl of crude oil and natural gas liquids and 19.1 Bcf of natural gas. As a result of our 2011 development activities, we converted approximately 78.1 MBoe, or 1%, of our 2010 proved undeveloped reserves to proved developed. The capital costs to develop these reserves were approximately $1.5 million. Also during 2011, we drilled wells at 43 locations that did not include proved reserves as of December 31, 2010. During 2011, we added three new proved undeveloped locations, which resulted in the addition of approximately 33.1 MBoe of proved reserves. At December 31, 2011, our projected costs to develop our remaining proved undeveloped reserves were $32.5 million in 2012, $27.7 million in 2013, $13.0 million in 2014, $5.3 million in 2015 and $8.9 million in 2016.
Unproved Reserves
The new SEC guidelines allow for the disclosure of probable and possible reserves, which are unproved reserves. Disclosure of unproved reserves is optional and we have elected not to disclose any unproved reserves in this report.
Technologies Used to Establish Additions to Reserve Estimates
The revised rules permit the use of reliable technologies that have been field tested as evidence proven to establish with “reasonable certainty” quantities of proved reserves. They also permit assigning reserves to locations more than one offset away from standard development spacing if reasonable certainty can be established, and the estimates are economically producible. Our 2011 reserve estimates have not relied on the new rule as a means of assigning proved reserves. We are, however, actively using seismic interpretation to high grade our potential drilling locations. In future filings, we may use reliable technologies to assign reserves if the application has been demonstrated to provide reasonably certain results with consistency and repeatability in the formation being evaluated, or in an analogous formation.
Internal Controls over Reserves Estimate
Our policies regarding internal controls over the recording of reserves are structured to objectively and accurately estimate our oil and gas reserve quantities and values in compliance with SEC regulations. Responsibility for compliance in reserve bookings is delegated to our reservoir engineering group, which is led by our Chief Operating Officer.
Technical reviews are performed throughout the year by our engineering and geologic staff who evaluate pertinent geological and engineering data. This data in conjunction with economic data and ownership information is used in making a determination of proved reserve quantities. The reserve process is overseen by our Director of Business Development. Our internal reservoir engineering staff has an average experience of more than 20 years in the area of reserve estimating and reservoir evaluations. We have internal auditing guidelines and controls in place to monitor the reservoir data and reporting parameters used in preparing the year-end reserves. Technologies and economic data used include updated production data, well performance, formation logs, geological maps, reservoir pressure tests and wellbore mechanical integrity information. Final approval of the reserves is required by our Chief Operating Officer.
Our reserve estimates are certified by the independent petroleum engineering firm of Forrest A. Garb & Associates using their own engineering assumptions and the economic data which we provide. Forrest A. Garb & Associates is an independent petroleum engineering consulting firm that provides petroleum consulting services throughout the world. Forrest A. Garb is chairman of the board of his firm, and is a registered professional engineer with more than 50 years of practical petroleum industry experience. The Forrest A. Garb & Associates report is included as Exhibit 99.1.
27
Table of Contents
In addition to third party reserve report preparation, our reserves are reviewed by senior management and the Reserves Committee of our Board of Directors. Senior management, which includes our President and Chief Executive Officer, and Chief Financial Officer, is responsible for reviewing and verifying that the estimate of proved reserves is reasonable, complete, and accurate. The Reserves Committee reviews the final reserves estimate in conjunction with Forrest A. Garb & Associates’ certified reserve report letter. They may also meet with the key representative from Forrest A. Garb & Associates to discuss their process and findings.
Estimated quantities of proved reserves and future net revenues are affected by oil and natural gas prices, which have fluctuated widely in recent years. There are numerous uncertainties inherent in estimating oil and natural gas reserves and their values, including many factors beyond the control of the producer. The reserve data set forth in this report represent only estimates. Reservoir engineering is a subjective process of estimating underground accumulations of oil and natural gas that cannot be measured in an exact manner. The accuracy of any reserve estimate is a function of the quality of available data and of engineering and geological interpretation and judgment. As a result, estimates of different engineers, including those used by us, may vary. In addition, estimates of reserves are subject to revisions based upon actual production, results of future development and exploration activities, prevailing oil and natural gas prices, operating costs and other factors, which revisions may be material. Proved reserves include proved developed and proved undeveloped reserves.
Reserve Reconciliation
Our total proved reserve reconciliation starting at year-end 2010 and ending year-end 2011 is as follows:
| Oil MBbl |
Gas MMcf |
NGL MBbl |
MBoe | |||||||||||||
| Total proved |
||||||||||||||||
| As of December 31, 2010 |
13,086 | 53,608 | 2,375 | 24,396 | ||||||||||||
| Extensions, discoveries and additions(a) |
339 | 20 | 1 | 343 | ||||||||||||
| Purchases |
5 | — | — | 5 | ||||||||||||
| Production |
(884 | ) | (2,662 | ) | (176 | ) | (1,504 | ) | ||||||||
| Revisions of previous estimates(b) |
(175 | ) | (10,912 | ) | (190 | ) | (2,183 | ) | ||||||||
|
|
|
|
|
|
|
|
|
|||||||||
| As of December 31, 2011 |
12,371 | 40,054 | 2,010 | 21,057 | ||||||||||||
| (a) | We added 0.3 MMBoe in proved reserve extensions, discoveries and additions in 2011 primarily as a result of our development drilling in our Electra/Burkburnett field in North Texas and in our La Copita field in South Texas. A significant portion of these reserves is a result of drilling locations in our Electra/Burkburnett, Northeast Fitts and Allen fields that were not booked as proved locations at year-end 2010. |
| (b) | Total revisions of previous reserve estimates decreased proved reserves by 2.2 MMBoe or approximately 9% of our reserves at the beginning of the year. The revisions included a positive increase of 0.9 MMBoe or 4% of the beginning of the year reserves caused by higher oil and gas prices. This positive revision was offset by the downward revision of 1.4 MMBoe caused by the transfer of proved reserves to unproved categories as a result of updated geological and engineering evaluations and changes to the company development plans during 2011, and 1.7 MMBoe of downward revisions were mostly due to changes in well performance. |
Our proved developed reserves and total proved reserves by year are as follows:
| As of December 31, | ||||||||||||
| 2011 | 2010 | 2009 | ||||||||||
| Reserve Data: |
||||||||||||
| Proved developed reserves: |
||||||||||||
| Oil (MBbls) |
8,643 | 8,414 | 8,814 | |||||||||
| Natural gas (MMcf) |
20,997 | 31,776 | 46,159 | |||||||||
| Natural gas liquids (MBbls) |
1,238 | 1,486 | 2,788 | |||||||||
| Total (MBoe) |
13,381 | 15,196 | 19,295 | |||||||||
28
Table of Contents
| As of December 31, | ||||||||||||
| 2011 | 2010 | 2009 | ||||||||||
| Total Proved reserves: |
||||||||||||
| Oil (MBbls) |
12,371 | 13,086 | 14,067 | |||||||||
| Natural gas (MMcf) |
40,054 | 53,608 | 89,227 | |||||||||
| Natural gas liquids (MBbls) |
2,010 | 2,375 | 4,983 | |||||||||
| Total (MBoe) |
21,057 | 24,396 | 33,922 | |||||||||
The following is a summary of the standardized measure of discounted net cash flows using methodology provided for in Topic 932 of the Accounting Standards Codification TM (the “Codification”) implemented by the Financial Accounting Standards Board (“FASB”), related to our estimated proved oil and natural gas reserves. For these calculations, estimated future cash flows from estimated future production of proved reserves for the years ended December 31, 2011, 2010 and 2009, were computed using benchmark prices based on the unweighted arithmetic average of the first-day-of-the-month prices for oil and natural gas during each month of 2011, 2010 and 2009, as required by SEC Release No. 33-8995, “Modernization of Oil and Gas Reporting.” Future development and production costs attributable to the proved reserves were estimated assuming that existing conditions would continue over the economic lives of the individual leases and costs were not escalated for the future. Estimated future income tax expenses were calculated by applying future statutory tax rates (based on the current tax law adjusted for permanent differences and tax credits) to the estimated future pretax net cash flows related to proved oil and natural gas reserves, less the tax basis of the properties involved. Future income tax expense for 2011 increased from prior year amounts primarily due to an increase in net future cash flows and the re-measurement of net operating loss carry forwards that are limited under the Internal Revenue Code Section 382, resulting in fewer losses expected to be available for future years. Future income tax expenses increased in 2010 because net operating loss carryforward was used to offset capital gains realized in the property divestitures and also due to a decrease in net operating loss carryforwards related to Internal Revenue Code Section 382 limitation, leaving less net operating loss carryforward available for future years. Additionally, future development costs are less than the previous year. For further information regarding the standardized measure of discounted net cash flows related to our estimated proved oil and natural gas reserves for the years ended December 31, 2011, 2010 and 2009, please review Note O in the notes to our year-end 2011 financial statements appearing elsewhere in this report. The standardized measure of discounted future net cash flows relating to our estimated proved oil and natural gas reserves is summarized as follows:
| Years Ended December 31, | ||||||||||||
| 2011 | 2010 | 2009 | ||||||||||
| (In thousands) | ||||||||||||
| Future cash inflows |
$ | 1,440,088 | $ | 1,355,233 | $ | 1,314,714 | ||||||
| Future production costs |
(582,662 | ) | (548,638 | ) | (535,784 | ) | ||||||
| Future development costs |
(102,231 | ) | (117,860 | ) | (148,956 | ) | ||||||
| Future income tax expenses |
(205,457 | ) | (161,736 | ) | (123,943 | ) | ||||||
|
|
|
|
|
|
|
|||||||
| Future net cash flows |
549,738 | 526,999 | 506,031 | |||||||||
| 10% annual discount for estimated timing of cash flows |
(262,849 | ) | (248,952 | ) | (231,797 | ) | ||||||
|
|
|
|
|
|
|
|||||||
| Standardized measure of discounted future net cash flows |
$ | 286,889 | $ | 278,047 | $ | 274,234 | ||||||
|
|
|
|
|
|
|
|||||||
In general, the volume of production from oil and natural gas properties declines as reserves are depleted. Except to the extent we acquire properties containing proved reserves or conduct successful exploration and development activities, our proved reserves will decline as reserves are produced. Our future oil and natural gas production is, therefore, highly dependent upon our level of success in finding or acquiring additional reserves.
29
Table of Contents
Net Production, Unit Prices and Costs
The following table presents certain information with respect to our oil and natural gas production and prices and costs attributable to all oil and natural gas properties owned by us for the periods shown. Average realized prices reflect the actual realized prices received by us, before and after giving effect to the results of our derivative contracts. Our derivative contracts are financial, and our production of oil, natural gas and NGLs, and the average realized prices we receive from our production, are not affected by our derivative contracts.
| Years Ended December 31, | ||||||||||||
| 2011 | 2010 | 2009 | ||||||||||
| Production volumes: |
||||||||||||
| Oil (MBbls) |
884 | 995 | 1,138 | |||||||||
| NGL (MBbls) |
176 | 364 | 406 | |||||||||
| Natural gas (MMcf) |
2,662 | 4,816 | 5,994 | |||||||||
| Total (MBoe) |
1,504 | 2,161 | 2,542 | |||||||||
| Average sale prices received: |
||||||||||||
| Oil (per Bbl) |
$ | 93.86 | $ | 76.95 | $ | 58.24 | ||||||
| NGL (per Bbl) |
56.14 | 38.89 | 27.26 | |||||||||
| Natural gas (per Mcf) |
4.01 | 4.21 | 3.47 | |||||||||
| Total per Boe |
$ | 68.83 | $ | 51.36 | $ | 38.62 | ||||||
| Cash effect of derivative contracts: |
||||||||||||
| Oil (per Bbl) |
$ | (3.51 | ) | $ | (6.14 | ) | $ | 4.94 | ||||
| NGL (per Bbl) |
— | — | — | |||||||||
| Natural gas (per Mcf) |
0.76 | 0.19 | 2.27 | |||||||||
| Total per Boe |
$ | (0.72 | ) | $ | (2.40 | ) | $ | 7.57 | ||||
| Average prices computed after cash effect of settlement of derivative contracts: |
||||||||||||
| Oil (per Bbl) |
$ | 90.35 | $ | 70.81 | $ | 63.18 | ||||||
| NGL (per Bbl) |
56.14 | 38.89 | 27.26 | |||||||||
| Natural gas (per Mcf) |
4.77 | 4.40 | 5.74 | |||||||||
| Total per Boe |
$ | 68.11 | $ | 48.96 | $ | 46.19 | ||||||
| Expenses (per Boe): |
||||||||||||
| Oil and natural gas production taxes |
$ | 3.82 | $ | 2.81 | $ | 2.09 | ||||||
| Oil and natural gas production expenses |
22.16 | 15.68 | 14.73 | |||||||||
| Amortization of full cost pool |
13.55 | 12.11 | 12.06 | |||||||||
| General and administrative |
11.42 | 6.85 | 6.56 | |||||||||
| Impairment |
— | — | 18.73 | |||||||||
Fields containing 15% or more of total proved reserves at December 31, 2011:
| Years Ended December 31, | ||||||||||||
| 2011 | 2010 | 2009 | ||||||||||
| La Copita: |
||||||||||||
| Production volumes: |
||||||||||||
| Oil (MBbls) |
24 | 41 | 58 | |||||||||
| Natural gas liquids (MBbls) |
83 | 126 | 118 | |||||||||
| Natural gas (MMcf) |
1,079 | 1,682 | 1,586 | |||||||||
| Total (MBoe) |
287 | 447 | 441 | |||||||||
| Average realized prices (1): |
||||||||||||
| Oil (per Bbl) |
$ | 93.64 | $ | 76.65 | $ | 58.41 | ||||||
| Natural gas liquids (per Bbl) |
52.05 | 39.89 | 29.28 | |||||||||
| Natural gas (per Mcf) |
3.97 | 4.32 | 3.95 | |||||||||
| Total per Boe |
37.82 | 34.49 | 29.78 | |||||||||
| Oil and natural gas production expenses (per Boe) |
$ | 7.16 | $ | 4.31 | $ | 3.62 | ||||||
30
Table of Contents
| Years Ended December 31, | ||||||||||||
| 2011 | 2010 | 2009 | ||||||||||
| Electra/Burkburnett: |
||||||||||||
| Production volumes: |
||||||||||||
| Oil (MBbls) |
441 | 471 | 537 | |||||||||
| Natural gas liquids (MBbls) |
44 | 41 | 70 | |||||||||
| Natural gas (MMcf) |
— | — | — | |||||||||
| Total (MBoe) |
485 | 512 | 607 | |||||||||
| Average realized prices (1): |
||||||||||||
| Oil (per Bbl) |
$ | 93.33 | $ | 77.24 | $ | 57.99 | ||||||
| Natural gas liquids (per Bbl) |
68.92 | 55.67 | 27.85 | |||||||||
| Natural gas (per Mcf) |
— | — | — | |||||||||
| Total per Boe |
91.10 | 75.49 | 54.51 | |||||||||
| Oil and natural gas production expenses (per Boe) |
$ | 32.11 | $ | 28.21 | $ | 22.46 | ||||||
| (1) | Excludes impact of cash effect of settlement of derivative contracts. |
Acquisition, Development and Exploration Capital Expenditures
The following table presents information regarding our net costs incurred in our acquisitions of proved and unproved properties, and our development and exploration activities (in thousands):
| Years Ended December 31, | ||||||||||||
| 2011 | 2010 | 2009 | ||||||||||
| Proved property acquisition costs |
$ | 724 | $ | 1,133 | $ | 1,311 | ||||||
| Development costs |
17,355 | 27,850 | 28,239 | |||||||||
| Exploration costs |
7,135 | 4,552 | 321 | |||||||||
|
|
|
|
|
|
|
|||||||
| Total costs incurred |
$ | 25,214 | $ | 33,535 | $ | 29,871 | ||||||
|
|
|
|
|
|
|
|||||||
Finding Costs
The following table sets forth the estimated proved reserves we acquired or discovered, including revisions of previous estimates, during each stated period. In calculating finding costs, we include acquisition costs related to proved property acquisitions, development costs, and exploration costs with respect to exploratory wells drilled and completed. Most of our drilling in 2011 was in our mature fields on proved undeveloped properties, which does not result in significant reserve additions. Because in 2011 and 2010 we had no significant acquisitions of producing properties, discoveries were limited and no significant reserves were added, our finding cost in 2011 and 2010 were substantially greater per Boe as compared to 2009. Our three-year average finding cost was $18.27 per Boe.
| Years Ended December 31, | ||||||||||||
| 2011 | 2010 | 2009 | ||||||||||
| Proved reserves acquired/discovered (MBoe) |
348 | 545 | 3,957 | |||||||||
| Total cost per Boe of reserves acquired/discovered |
$ | 72.45 | $ | 61.53 | $ | 7.55 | ||||||
31
Table of Contents
Producing Wells
The following table sets forth the number of productive wells in which we owned an interest as of December 31, 2011. Productive wells consist of producing wells and wells capable of production, including wells awaiting pipeline connections or connection to production facilities. Wells that we complete in more than one producing horizon are counted as one well.
| Gross | Net | |||||||
| Oil |
2,586 | 2,177.9 | ||||||
| Natural gas |
577 | 339.4 | ||||||
|
|
|
|
|
|||||
| Total |
3,163 | 2,517.3 | ||||||
|
|
|
|
|
|||||
Acreage
The following table sets forth our developed and undeveloped gross and net leasehold acreage as of December 31, 2011:
| Gross | Net | |||||||
| Developed |
112,368 | 60,316 | ||||||
| Undeveloped |
171,320 | 55,670 | ||||||
|
|
|
|
|
|||||
| Total |
283,688 | 115,986 | ||||||
|
|
|
|
|
|||||
Our undeveloped acreage includes leased acres on which wells have not been drilled or completed to a point that would permit the production of commercial quantities of oil and natural gas, regardless of whether or not such acreage is held by production or contains proved reserves. A gross acre is an acre in which we own an interest. A net acre is deemed to exist when the sum of fractional ownership interests in gross acres equals one. The number of net acres is the sum of the fractional interests owned in gross acres.
Drilling Activities
During the periods indicated, we drilled or participated in drilling the following wells:
| Years Ended December 31, | ||||||||||||||||||||||||
| 2011(1) | 2010(2) | 2009(3) | ||||||||||||||||||||||
| Gross | Net | Gross | Net | Gross | Net | |||||||||||||||||||
| Development wells: |
||||||||||||||||||||||||
| Productive |
43.0 | 38.8 | 59.0 | 51.0 | 45.0 | 44.0 | ||||||||||||||||||
| Non-productive |
1.0 | 0.2 | — | — | 1.0 | 0.9 | ||||||||||||||||||
| Exploratory wells: |
||||||||||||||||||||||||
| Productive |
6.0 | 6.0 | 3.0 | 3.0 | — | — | ||||||||||||||||||
| Non-productive |
4.0 | 4.0 | 1.0 | 0.2 | — | — | ||||||||||||||||||
|
|
|
|
|
|
|
|
|
|
|
|
|
|||||||||||||
| Total |
54.0 | 49.0 | 63.0 | 54.2 | 46.0 | 44.9 | ||||||||||||||||||
|
|
|
|
|
|
|
|
|
|
|
|
|
|||||||||||||
| (1) | Does not include seven gross (5.9 net) wells that were either in the process of being completed or drilling at December 31, 2011, and does not include seven gross (5.8 net) wells that were drilled in 2010 and waiting on pipeline connection. |
| (2) | Does not include seven gross (5.8 net) wells that were in the process of being completed at December 31, 2010, and does not include three gross (0.2 net) wells that were drilled in 2009 and waiting on pipeline connection. |
| (3) | Does not include three gross (0.16 net) wells that were in the process of being completed at December 31, 2009, and does not include two gross (one net) wells that were drilled in 2008 and waiting on pipeline connection. |
32
Table of Contents
Oil and Natural Gas Marketing and Derivative Activities
During the year ended December 31, 2011, Shell Trading (US) Company, or STUSCO, accounted for $70.4 million, or 68%, of our oil and natural gas revenue for that period. No other purchaser accounted for 10% or more of our oil and natural gas revenue during 2011. During the year ending December 31, 2011, we were subject to a crude purchase contract with STUSCO covering all of our production in our Electra Field in Wichita and Wilbarger Counties, Texas. The contract term covered the period of January 1, 2011 through December 31, 2011 and provided for a price equal to STUSCO West Texas Intermediate Posting plus $1.34 per barrel.
We were also subject to a crude purchase contract with STUSCO during 2011 covering all of our oil production in our Fitts and Allen fields in Oklahoma. For the period of January 1, 2011 through March 31, 2011, the contract price was Sunoco Oklahoma Sweet Posting plus $0.92 per barrel. Effective April 1, 2011, through May 31, 2011, the contract price was amended to Sunoco Oklahoma Sweet Posting plus Argus P-Plus Posting less $1.92 per barrel. Effective June 1, 2011 through November 30, 2011, the contract price was amended to Sunoco Oklahoma Sweet Posting plus $1.30 per barrel. We cancelled the crude purchase contract with STUSCO effective December 1, 2011, and entered into a new crude oil purchase agreement with Sunoco Partners Marketing & Terminals L.P., or Sunoco, for a term of December 1, 2011 through May 31, 2012. Sunoco’s purchase price is Sunoco West Texas Intermediate Posting plus $1.33.
There are other purchasers in the fields, and we believe such other purchasers would be available to purchase our production should our current purchaser discontinue operations. We have no reason to believe that any such cessation is likely to occur.
To reduce exposure to fluctuations in oil and natural gas prices and to achieve more predictable cash flow, we periodically utilize various derivative strategies to manage the price received for a portion of our future oil and natural gas production. Our derivative strategies customarily involve the purchase of put options to provide a price floor for our production; the sale of put options, which limit the effectiveness of purchased put options at the low end of the put/call collars to market prices in excess of the strike price of the put option sold; put/call collars that establish both a floor and a ceiling price to provide price certainty within a fixed range; call options that establish a secondary floor above a put/call collar ceiling; and swap arrangements that establish an index-related price above which we pay the derivative counterparty and below which we are paid by the derivative counterparty. These contracts allow us to predict with greater certainty the effective oil and natural gas prices to be received for our production and benefit us when market prices are less than the base floor prices or swap prices under our derivative contracts. However, we will not benefit from market prices that are higher than the ceiling or swap prices in these contracts for our hedged production.
See “Item 7A. Quantitative and Qualitative Disclosures About Market Risk” for further information about our derivative positions at December 31, 2011.
Competition
The oil and natural gas industry is highly competitive. We compete for the acquisition of oil and natural gas properties, primarily on the basis of the price to be paid for such properties, with numerous entities including major oil companies, other independent oil and natural gas concerns and individual producers and operators. Many of these competitors are large, well-established companies and have financial and other resources substantially greater than ours. Our ability to acquire additional oil and natural gas properties and to discover reserves in the future will depend upon our ability to evaluate and select suitable properties and to consummate transactions in a highly competitive environment.
Title to Properties
We believe that we have satisfactory title to our properties in accordance with standards generally accepted in the oil and natural gas industry. As is customary in the oil and natural gas industry, we make only a cursory
33
Table of Contents
review of title to farmout acreage and to undeveloped oil and natural gas leases upon execution of any contracts. Prior to the commencement of drilling operations, a title examination is conducted and curative work is performed with respect to significant defects. To the extent title opinions or other investigations reflect title defects, we, rather than the seller of the undeveloped property, typically are responsible to cure any such title defects at our expense. If we were unable to remedy or cure any title defect of a nature such that it would not be prudent for us to commence drilling operations on the property, we could suffer a loss of our entire investment in the property. We have obtained title opinions or reports on substantially all of our producing properties. Prior to completing an acquisition of producing oil and natural gas leases, we perform a title review on a material portion of the leases. Our oil and natural gas properties are subject to customary royalty interests, liens for current taxes and other burdens that we believe do not materially interfere with the use of or affect the value of such properties.
Facilities
Our executive offices are located at 1000 Louisiana Street, Suite 6700, Houston, Texas 77002, which we occupy under a lease with a remaining term ending in July 2018, at an annual rental of approximately $0.8 million, subject to escalation for taxes and utilities. Our Mid Continent Division executive and operating offices are located at Suite 650, Meridian Tower, 5100 E. Skelly Drive, Tulsa, Oklahoma 74135 which we occupy under a lease with a remaining term ending in January 2014, at an annual rental of approximately $0.5 million, subject to escalations for taxes and utilities. We also have an operating office at 4965 Preston Park Blvd., Suite 800, in Plano, Texas, subject to a lease extending through October 2013. Currently, rent under the lease is approximately $0.7 million annually. We have subleased a portion of our Plano office and will receive approximately $0.1 million annually. We also lease a small office in Houston, Texas. We believe that our facilities are adequate for our current needs.
Regulation
General. Various aspects of our oil and gas operations are subject to extensive and continually changing regulation, as legislation affecting the oil and gas industry is under constant review for amendment or expansion. Numerous departments and agencies, both federal and state, are authorized by statute to issue, and have issued, rules and regulations binding upon the oil and gas industry and our individual members.
Regulation of Sales and Transportation of Natural Gas. The Federal Energy Regulatory Commission, or the FERC, regulates the transportation and sale for resale of natural gas in interstate commerce pursuant to the Natural Gas Act of 1938 and the Natural Gas Policy Act of 1978. In the past, the federal government has regulated the prices at which natural gas can be sold. While sales by producers of natural gas can currently be made at uncontrolled market prices, Congress could reenact price controls in the future. Our sales of natural gas are affected by the availability, terms and cost of transportation. The price and terms for access to pipeline transportation are subject to extensive regulation and proposed regulation designed to increase competition within the natural gas industry, to remove various barriers and practices that historically limited non-pipeline natural gas sellers, including producers, from effectively competing with interstate pipelines for sales to local distribution companies and large industrial and commercial customers and to establish the rates interstate pipelines may charge for their services. Similarly, the Oklahoma Corporation Commission and the Texas Railroad Commission have been reviewing changes to their regulations governing transportation and gathering services provided by intrastate pipelines and gatherers. While the changes being considered by these federal and state regulators would affect us only indirectly, they are intended to further enhance competition in natural gas markets. We cannot predict what further action the FERC or state regulators will take on these matters; however, we do not believe that any actions taken will have an effect materially different than the effect on other natural gas producers with which we compete.
Additional proposals and proceedings that might affect the natural gas industry are pending before Congress, the FERC, state commissions and the courts. The natural gas industry historically has been very
34
Table of Contents
heavily regulated; therefore, there is no assurance that the less stringent regulatory approach recently pursued by the FERC and Congress will continue.
Oil Price Controls and Transportation Rates. Our sales of crude oil, condensate and natural gas liquids are not currently regulated and are made at market prices. The price we receive from the sale of these products may be affected by the cost of transporting the products to market.
Environmental. Our oil and natural gas operations are subject to pervasive federal, state, and local laws and regulations concerning the protection and preservation of the environment (e.g., ambient air, and surface and subsurface soils and waters), human health, worker safety, natural resources and wildlife. These laws and regulations affect virtually every aspect of our oil and natural gas operations, including our exploration for, and production, storage, treatment, and transportation of, hydrocarbons and the disposal of wastes generated in connection with those activities. These laws and regulations increase our costs of planning, designing, drilling, installing, operating, and abandoning oil and natural gas wells and appurtenant properties, such as gathering systems, pipelines, and storage, treatment and salt water disposal facilities.
In December 2009, the EPA promulgated a finding that serves as the foundation under the Clean Air Act to issue other rules that would result in federal greenhouse gas (“GHG”) regulations and emissions limits under the Clean Air Act, even without Congressional action. As part of this array of new regulations, in September 2009 and December 2010, the EPA also promulgated a GHG monitoring and reporting rule that requires certain parties, including participants in the oil and gas industry, to monitor and report their GHG emissions, including methane and carbon dioxide, to the EPA. These regulations may apply to our operations. The EPA has promulgated two other rules that would regulate GHGs, one of which would regulate GHGs from stationary sources, and which will likely affect sources in the oil and gas exploration and production industry and pipeline industry. EPA has also proposed new air emission technology standards specifically applicable to the oil and natural gas sector which enlarge the scope of regulated equipment. These proposed rules, if promulgated, will add another layer of additional indirect GHG regulation.
The GHG reporting rule and the stationary source GHG permitting rules to regulate the emissions of GHGs constitute federal regulation of carbon dioxide emissions and other GHGs, and may affect the outcome of other climate change lawsuits pending in United States federal courts in a manner unfavorable to our industry. See “Risk factors — Risks relating to our business — Regulation related to greenhouse gas emissions could have an adverse effect on our operations and demand for oil and natural gas.”
We have expended and will continue to expend significant financial and managerial resources to comply with applicable environmental laws and regulations, including permitting requirements. Our failure to comply with these laws and regulations can subject us to substantial civil and criminal penalties, claims for injury to persons and damage to properties and natural resources, and clean-up and other remedial obligations. Although we believe that the operation of our properties generally complies with applicable environmental laws and regulations, the risks of incurring substantial costs and liabilities are inherent in the operation of oil and natural gas wells and appurtenant properties. We could also be subject to liabilities related to the past operations conducted by others at properties now owned by us, without regard to any wrongful or negligent conduct by us.
We cannot predict what effect future environmental legislation and regulation will have upon our oil and natural gas operations. The possible legislative reclassification of certain wastes generated in connection with oil and natural gas operations as “hazardous wastes” would have a significant impact on our operating costs, as well as the oil and natural gas industry in general. The cost of compliance with more stringent environmental laws and regulations, or the more vigorous administration and enforcement of those laws and regulations, could result in material expenditures by us to remove, acquire, modify, and install equipment, store and dispose of wastes, remediate facilities, employ additional personnel, and implement systems to ensure compliance with those laws and regulations. These accumulative expenditures could have a material adverse effect upon our profitability and future capital expenditures.
35
Table of Contents
Regulation of Oil and Gas Exploration and Production. Our exploration and production operations are subject to various types of regulation at the federal, state and local levels. Such regulations include requiring permits and drilling bonds for the drilling of wells, regulating the location of wells, the method of drilling and casing wells, and the surface use and restoration of properties upon which wells are drilled. Many states also have statutes or regulations addressing conservation matters, including provisions for the unitization or pooling of oil and natural gas properties, the establishment of maximum rates of production from oil and natural gas wells and the regulation of spacing, plugging and abandonment of such wells. Some state statutes limit the rate at which oil and natural gas can be produced from our properties.
Employees
At December 31, 2011, we had 188 employees. Our future success will depend partially on our ability to attract, retain and motivate qualified personnel. We are not a party to any collective bargaining agreement and we have not experienced any strikes or work stoppages. We consider our relations with our employees to be satisfactory.
Available Information
Copies of our Annual Report on Form 10-K, Quarterly Reports on Form 10-Q, Current Reports on Form 8-K, and amendments to those reports filed or furnished pursuant to Section 13(a) or 15(d) of the Securities Exchange Act of 1934, as amended, are available free of charge through our website (www.halconresources.com) as soon as reasonably practicable after we electronically file the material with, or furnish it to, the SEC. Our SEC filings are also available from the SEC’s website at: http://www.sec.gov. The references to our website address do not constitute incorporation by reference of the information contained on the website and should not be considered part of this report.
| Item 3. | Legal Proceedings |
From time to time, we are a party to litigation or other legal proceedings that we consider to be a part of the ordinary course of our business. We are not currently involved in any legal proceedings, nor are we a party to any pending or threatened claims, that could reasonably be expected to have a material adverse effect on our financial condition or results of operations.
| Item 4. | Mine Safety Disclosures |
Not applicable.
36
Table of Contents
PART II
| Item 5. | Market for Registrant’s Common Equity, Related Stockholder Matters and Issuer Purchases of Equity Securities |
Market for Common Stock
Our common stock is traded on the Nasdaq Capital Market under the symbol HK. The following table sets forth the range of high and low closing bid prices for our common stock for the periods indicated. All share prices reflect the one-for-three reverse stock split, which was effective February 10, 2012.
| Common Stock | ||||||||
| High | Low | |||||||
| 2012: |
||||||||
| First Quarter (through March 2, 2012) |
$ | 12.76 | $ | 8.46 | ||||
| 2011: |
||||||||
| First Quarter |
$ | 7.35 | $ | 4.68 | ||||
| Second Quarter |
6.36 | 3.66 | ||||||
| Third Quarter |
3.75 | 2.04 | ||||||
| Fourth Quarter |
9.39 | 2.01 | ||||||
| 2010: |
||||||||
| First Quarter |
$ | 6.69 | $ | 4.20 | ||||
| Second Quarter |
6.90 | 4.47 | ||||||
| Third Quarter |
6.51 | 4.11 | ||||||
| Fourth Quarter |
5.76 | 4.14 | ||||||
| 2009: |
||||||||
| First Quarter |
$ | 3.72 | $ | 1.20 | ||||
| Second Quarter |
3.27 | 2.04 | ||||||
| Third Quarter |
3.90 | 1.92 | ||||||
| Fourth Quarter |
6.72 | 4.23 | ||||||
Holders
As of February 13, 2012, there were 78 holders of record of our common stock. We believe that at February 13, 2012, there were 9,076 beneficial holders of our common stock.
Dividends
It is the present intention of our board of directors to retain all earnings, if any, for use in our business operations and, accordingly, our board does not anticipate declaring any dividends in the foreseeable future. In addition, our credit agreement does not permit us to pay dividends on our common stock.
Compensation Plan Information
In February 2012, our Board of Directors amended our 2006 Long-Term Incentive Plan to increase the shares of common stock that may be issued under the Plan from 2,466,667 shares to 3,700,000 shares. Share numbers reflect the one-for-three reverse stock split, which was effective February 10, 2012.
37
Table of Contents
The following table provides information for all equity compensation plans as of February 29, 2011, under which our equity securities were authorized for issuance:
| Number of Securities to be Issued Upon Exercise of Outstanding Options, Warrants and Rights |
Weighted Average Exercise Price of Outstanding Options, Warrants and Rights |
Number of Securities Remaining Available for Future Issuance Under Equity Compensation Plans |
||||||||||
| Plan Category |
||||||||||||
| Equity compensation plans approved by security holders(1) |
193,334 | $ | 11.28 | 1,531,450 | (2) | |||||||
| Equity compensation plans not approved by security holders |
— | — | — | |||||||||
|
|
|
|
|
|
|
|||||||
| Total |
193,334 | $ | 11.28 | 1,531,450 | ||||||||
|
|
|
|
|
|
|
|||||||
| (1) | Shares awarded under all above plans may be newly issued, from our treasury or acquired in the open market. |
| (2) | This number reflects shares available for issuance under our 2006 Long-Term Incentive Plan as of February 29, 2012. |
38
Table of Contents
Stockholder Return Performance Presentation
The following graph and table compare the cumulative 5-year total return provided to our stockholders on our common stock beginning December 31, 2006, through December 31, 2011, relative to the cumulative total returns of the Nasdaq Composite index and the Dow Jones Wilshire MicroCap Exploration & Production index. The comparison assumes an investment of $100 (with reinvestment of all dividends) was made in our common stock on December 31, 2006, and in each of the indexes and its relative performance is tracked through December 31, 2011. The identity of the 50+ companies included in the Dow Jones Wilshire MicroCap Exploration & Production Index will be provided upon request.
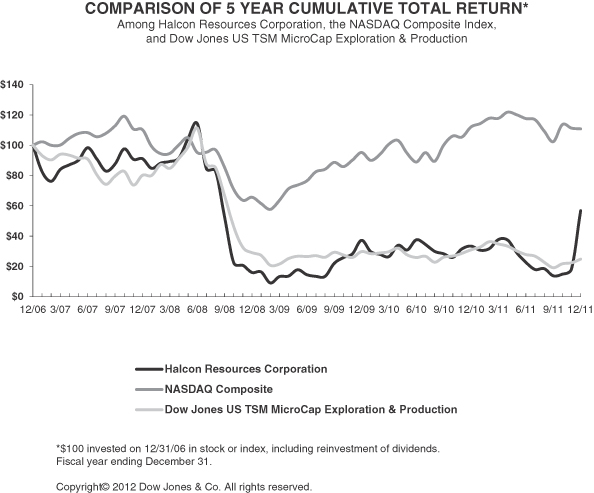
| Years Ended December 31, | ||||||||||||||||||||
| 2011 | 2010 | 2009 | 2008 | 2007 | ||||||||||||||||
| Halcón Resources Corporation |
$ | 57 | $ | 33 | $ | 37 | $ | 16 | $ | 91 | ||||||||||
| Nasdaq Composite |
111 | 112 | 95 | 66 | 110 | |||||||||||||||
| Dow Jones Wilshire MicroCap Exploration & Production Index |
25 | 31 | 30 | 29 | 80 | |||||||||||||||
39
Table of Contents
| Item 6. | Selected Financial Data |
We acquired Ascent Energy Inc. on November 29, 2007, by the merger of our wholly owned subsidiary with and into Ascent. The Ascent acquisition was accounted for under the purchase method of accounting. Upon completion of the Ascent acquisition, Ascent adopted the full cost method of accounting for exploration, development and production of oil and natural gas.
The selected consolidated financial information presented below should be read in conjunction with our consolidated financial statements and the related notes, and “Management’s Discussion and Analysis of Financial Condition and Results of Operations” contained elsewhere in this report. Our financial position and results of operations for 2011, 2010, 2009, 2008 and 2007 may not be comparative to other periods as a result of certain divestitures and acquisitions, as more fully described in our consolidated financial statements included elsewhere in this report.
Selected Financial Data
(In thousands, except share data)
| Years Ended December 31, | ||||||||||||||||||||
| 2011 | 2010 | 2009 | 2008 | 2007 | ||||||||||||||||
| Revenues and Other Operating Income: |
||||||||||||||||||||
| Oil sales |
$ | 82,968 | $ | 76,563 | $ | 66,281 | $ | 117,036 | $ | 55,000 | ||||||||||
| Natural gas sales |
10,673 | 20,265 | 20,818 | 47,884 | 17,830 | |||||||||||||||
| Natural gas liquids sales |
9,880 | 14,156 | 11,068 | 17,770 | 9,047 | |||||||||||||||
| Realized gains (losses) on derivatives |
(1,078 | ) | (5,193 | ) | 19,255 | (10,472 | ) | (2,669 | ) | |||||||||||
| Unrealized gains (losses) on derivatives |
5,269 | 6,386 | (30,561 | ) | 33,257 | (10,056 | ) | |||||||||||||
| Other |
168 | 157 | 217 | 382 | 488 | |||||||||||||||
|
|
|
|
|
|
|
|
|
|
|
|||||||||||
| Total revenues and other operating income |
107,880 | 112,334 | 87,078 | 205,857 | 69,640 | |||||||||||||||
| Operating Expenses: |
||||||||||||||||||||
| Oil and natural gas production taxes |
5,740 | 6,063 | 5,320 | 10,480 | 4,869 | |||||||||||||||
| Oil and natural gas production expenses |
33,330 | 33,891 | 37,455 | 38,030 | 21,574 | |||||||||||||||
| Depreciation and amortization |
21,345 | 27,225 | 31,650 | 46,512 | 18,948 | |||||||||||||||
| Accretion expense |
1,641 | 1,527 | 1,976 | 2,207 | 704 | |||||||||||||||
| Impairment |
— | — | 47,613 | 269,886 | — | |||||||||||||||
| Share-based compensation |
3,584 | 3,110 | 2,179 | 2,563 | 989 | |||||||||||||||
| Restructuring costs |
1,071 | — | — | — | — | |||||||||||||||
| General and administrative, net of operator’s overhead fees |
17,179 | 14,799 | 16,667 | 20,305 | 11,891 | |||||||||||||||
|
|
|
|
|
|
|
|
|
|
|
|||||||||||
| Total operating expenses |
83,890 | 86,615 | 142,860 | 389,983 | 58,975 | |||||||||||||||
|
|
|
|
|
|
|
|
|
|
|
|||||||||||
| Operating income (loss) |
23,990 | 25,719 | (55,782 | ) | (184,126 | ) | 10,665 | |||||||||||||
| Other Income (Expense): |
||||||||||||||||||||
| Interest expense |
(17,373 | ) | (22,655 | ) | (18,590 | ) | (24,182 | ) | (20,757 | ) | ||||||||||
| Interest income |
5 | 27 | 82 | 208 | 1,047 | |||||||||||||||
| Loss on interest rate derivatives |
(712 | ) | — | — | — | — | ||||||||||||||
| Other income (expense) |
(511 | ) | 321 | (440 | ) | (13,536 | ) | (57 | ) | |||||||||||
|
|
|
|
|
|
|
|
|
|
|
|||||||||||
| Income (Loss) Before Income Taxes |
5,399 | 3,412 | (74,730 | ) | (221,636 | ) | (9,102 | ) | ||||||||||||
| Income Tax Provision (Benefit) |
6,802 | 995 | (16,347 | ) | (91,683 | ) | (7,852 | ) | ||||||||||||
|
|
|
|
|
|
|
|
|
|
|
|||||||||||
| Net income (loss) |
$ | (1,403 | ) | $ | 2,417 | $ | (58,383 | ) | $ | (129,953 | ) | $ | (1,250 | ) | ||||||
|
|
|
|
|
|
|
|
|
|
|
|||||||||||
40
Table of Contents
Selected Financial Data (continued)
(In thousands, except share data)
| Years Ended December 31, | ||||||||||||||||||||
| 2011 | 2010 | 2009 | 2008 | 2007 | ||||||||||||||||
| Cash dividends per share |
$ | — | $ | — | $ | — | $ | — | $ | — | ||||||||||
| Earnings (loss) per share: |
||||||||||||||||||||
| Basic |
$ | (0.05 | ) | $ | 0.09 | $ | (2.26 | ) | $ | (5.40 | ) | $ | (0.09 | ) | ||||||
| Diluted |
(0.05 | ) | 0.09 | (2.26 | ) | (5.40 | ) | (0.09 | ) | |||||||||||
| Weighted average shares outstanding: |
||||||||||||||||||||
| Basic |
26,258,230 | 26,142,060 | 25,867,019 | 24,078,250 | 14,029,206 | |||||||||||||||
| Diluted |
26,258,230 | 26,142,060 | 25,867,019 | 24,078,250 | 14,029,206 | |||||||||||||||
| Statement of Cash Flow Data |
||||||||||||||||||||
| Cash provided by (used in) |
||||||||||||||||||||
| Operating activities |
$ | 29,835 | $ | 37,875 | $ | 32,372 | $ | 74,454 | $ | 17,042 | ||||||||||
| Investing activities |
(25,376 | ) | 14,970 | (23,921 | ) | (82,568 | ) | (241,192 | ) | |||||||||||
| Financing activities |
(4,447 | ) | (52,937 | ) | (8,486 | ) | 1,405 | 224,302 | ||||||||||||
| Other Data |
||||||||||||||||||||
| Capital expenditures(1) |
$ | 25,214 | $ | 33,535 | $ | 29,871 | $ | 84,723 | $ | 344,795 | ||||||||||
| As of December 31, | ||||||||||||||||||||
| 2011 | 2010 | 2009 | 2008 | 2007 | ||||||||||||||||
| Balance Sheet Data |
||||||||||||||||||||
| Total assets |
$ | 267,802 | $ | 265,001 | $ | 311,162 | $ | 403,964 | $ | 580,242 | ||||||||||
| Long-term debt, including current portion |
202,000 | 197,092 | 246,167 | 250,696 | 335,747 | |||||||||||||||
| Stockholders’ equity (deficit) |
5,948 | 4,167 | (526 | ) | 57,840 | 98,698 | ||||||||||||||
| (1) | Includes costs of acquisitions. |
41
Table of Contents
| Item 7. | Management’s Discussion and Analysis of Financial Condition and Results of Operations |
General
We are an independent energy company engaged in the acquisition, production, exploration and development of onshore oil and natural gas properties. Through our RAM Energy subsidiary, we have been active in our core producing areas of Texas, Louisiana and Oklahoma since 1987. Our management team has extensive technical and operating expertise in all areas of our geographic focus.
Recent Developments
On February 8, 2012, Halcón Resources, LLC, a newly-formed company led by Floyd C. Wilson, former Chairman and Chief Executive Officer of Petrohawk Energy Corporation, recapitalized us with a $550.0 million investment structured as the purchase of $275.0 million in new common stock, a $275.0 million five-year 8% convertible note and warrants for the purchase of an additional 36,666,666 million shares of our common stock at an exercise price of $4.50 per share. At closing, Floyd C. Wilson was appointed as our Chairman, President and Chief Executive Officer, and our name was changed to Halcón Resources Corporation. Mark Mize was also appointed as our Executive Vice President, Chief Financial Officer, Treasurer and was designated as our Principal Accounting Officer, and the composition of our board was altered to consist of 10 new individuals. Information as to our recent recapitalization is set forth under Note N to the Consolidated Financial Statements.
In connection with the closing of the Halcón Transaction, we entered into a Senior Revolving Credit Agreement (the “credit agreement”) with JPMorgan Chase Bank, N.A., as administrative agent, and the other lenders named therein on February 8, 2012. The credit agreement provides for a $500.0 million facility with an initial borrowing base of $225.0 million. Amounts borrowed under the credit agreement will initially mature on February 8, 2017. The borrowing base will be redetermined semi-annually, with the company and the lenders each having the right to one interim unscheduled redetermination between any two consecutive semi-annual redeterminations. The borrowing base takes into account our oil and natural gas properties, proved reserves, total indebtedness, and other relevant factors consistent with customary oil and gas lending criteria. The borrowing base is subject to a reduction equal to the product of 0.25 multiplied by the stated principal amount (without regard to any initial issue discount) of any notes or other long-term debt securities that we may issue.
Following the recapitalization, our primary focus is to expand our leasehold position in areas we have determined are prospective for oil or liquids-rich resource plays. We have identified several target resource plays for potential leasehold acquisition, including the Utica Shale/Point Pleasant formations in Ohio and Pennsylvania, the Mississippian Lime formation in Northern Oklahoma and Southern Kansas, the Wilcox formation in Southwest Louisiana and the Woodbine/Eagle Ford formation in East Texas. In addition to our ongoing lease acquisition efforts in our targeted resource plays, we have identified several new exploratory areas we believe are prospective for oil and liquids-rich hydrocarbons.
On March 5, 2012, we sold in a private placement to certain institutional accredited investors 4,444.4511 shares of 8% automatically convertible preferred stock, par value $0.0001 per share, each share of which will convert into 10,000 shares of our common stock (or a proportionate number of shares of common stock with respect to any fractional shares of preferred stock), subject to certain adjustments, for approximately $400.0 million, or $9.00 per share of common stock, before offering expenses. The convertible preferred stock will convert into common stock automatically on the 20th calendar day after we mail a definitive information statement to holders of our common stock notifying them that our majority stockholder has consented to the issuance of common stock upon conversion of the convertible preferred stock. No dividend will be paid on the convertible preferred stock if it converts into common stock on or before May 31, 2012.
As a result of the recapitalization and the sale of the convertible preferred stock, we have substantial liquidity available to support our anticipated 2012 capital expenditures.
42
Table of Contents
On December 8, 2010, we completed the sale to Milagro Producing, LLC, a privately owned company located in Houston, Texas, of all of our oil and natural gas properties and related assets located in the Boonsville and Newark East fields of Jack and Wise Counties, Texas. The effective date of the sale was October 1, 2010. The sale properties included all of our Bend Conglomerate shallow gas properties and all of our North Texas Barnett Shale properties, including both producing properties and undeveloped leasehold. We received net cash proceeds at closing of $42.3 million subject to customary post-closing adjustments. As of December 31, 2010, net proceeds including post-closing adjustments were $41.0 million. Proved reserves from these properties accounted for approximately 26.4 billion cubic feet equivalent (Bcfe) of natural gas, natural gas liquids and oil, or an estimated 13% of our year-end 2009 proved reserves of 204 Bcfe. Information as to our recent divestitures is set forth under Note B to the Consolidated Financial Statements.
Oil and natural gas prices have historically been volatile. In 2011, our average realized prices (before the impact of derivative financial instruments) for oil and natural gas were $93.86 per Bbl and $4.01 per Mcf, respectively, compared to 2010 average realized prices of $76.95 per Bbl and $4.21 per Mcf, respectively. A significant decline in annual average prices for oil and natural gas began during the last half of 2008 and continued into the first quarter of 2009. It is difficult to predict the frequency, duration or outcome of crude oil and natural gas price movements or the long-term impact on drilling and operating costs and the impacts, whether favorable or unfavorable, to our results of operations and liquidity. We continue to monitor operations and planned capital budget expenditures as the economics of many projects may diminish as a result of prolonged price declines.
Critical Accounting Policies
The preparation of our financial statements in conformity with generally accepted accounting principles requires our management to make estimates and assumptions that affect our reported assets, liabilities and contingencies as of the date of the financial statements and our reported revenues and expenses during the related reporting period. Our actual results could differ from those estimates. See Note A to our Consolidated Financial Statements included in Item 8 of this report for further discussions of our significant accounting policies and recently adopted accounting standards.
We follow the full cost method of accounting for oil and natural gas operations. Under this method all productive and nonproductive costs incurred in connection with the acquisition, exploration, and development of oil and natural gas reserves are capitalized. No gains or losses are recognized upon the sale or other disposition of oil and natural gas properties except in transactions that would significantly alter the relationship between capitalized costs and proved reserves. The costs of unevaluated oil and natural gas properties are excluded from the amortizable base until the time that either proven reserves are found or it has been determined that such properties are impaired. As properties become evaluated, the related costs transfer to proved oil and natural gas properties using full cost accounting.
Under the full cost method the net book value of oil and natural gas properties, less related deferred income taxes, may not exceed the estimated after-tax future net revenues from proved oil and natural gas properties, discounted at 10% (the “Ceiling Limitation”). In arriving at estimated future net revenues, estimated lease operating expenses, development costs, and certain production-related and ad valorem taxes are deducted. In calculating future net revenues, prices and costs are held constant indefinitely, except for changes that are fixed and determinable by existing contracts. The net book value is compared to the Ceiling Limitation on a quarterly and yearly basis. The excess, if any, of the net book value above the Ceiling Limitation is charged to expense in the period in which it occurs and is not subsequently reinstated. At March 31, 2009, the net book value of our oil and natural gas properties exceeded the Ceiling Limitation resulting in reduction in the carrying value of our oil and natural gas properties by $47.6 million, or $30.3 million net of tax. We incurred no impairment charge in 2010 or 2011.
The ceiling calculation dictates that we use the unweighted arithmetic average price of oil and natural gas as of the first day of each month for the 12-month period ending at the balance sheet date. If this unweighted
43
Table of Contents
average oil and natural gas price at December 31, 2011 had been 10% lower while all other factors remain constant, our ceiling amount related to our net book value of oil and natural gas properties would have been reduced approximately $44.5 million. This reduction would not have resulted in a full cost ceiling impairment.
Estimates of our crude oil and natural gas reserves are prepared by independent petroleum and geological engineers in accordance with guidelines established by the SEC. Proved reserves, estimated future net revenues and the present value of our reserves are estimated based upon a combination of historical data and estimates of future activity. There are numerous uncertainties inherent in estimating quantities of proved crude oil and natural gas reserves. Reserve estimates may be different from the quantities of crude oil and natural gas that are ultimately recovered. Estimates of proved crude oil and natural gas reserves may significantly affect the amount at which oil and natural gas properties are recorded and significantly affect our amortization and depreciation expense.
Our rate of recording depreciation, depletion and amortization expense (DD&A) is primarily dependent upon our estimate of proved reserves, which is utilized in our unit-of-production method calculation. If the estimates of proved reserves were to be reduced, the rate at which we record DD&A expense would increase, reducing net income. Such a reduction in reserves may result from calculated lower market prices, which may make it non-economic to drill for and produce higher cost reserves. A five percent positive revision to proved reserves would decrease the DD&A rate by approximately $0.68 per Boe, and a five percent negative revision to proved reserves would increase the DD&A rate by approximately $0.75 per Boe.
Future development costs include costs incurred to obtain access to proved reserves such as drilling costs and the installation of production equipment. Future abandonment cots include costs to dismantle and relocate or dispose of our production facilities, gathering systems and related structures and restoration costs. We develop estimates of these costs for each of our properties based upon their geographic, type of production structure, well depth, currently available procedures and ongoing consultations with construction and engineering consultants. Because these costs typically extend many years into the future, estimating these future costs is difficult and requires management to make judgments that are subject to future revisions based upon numerous factors, including changing technology and the political and regulatory environment. We review our assumptions and estimates of future development and future abandonment costs on an annual basis. A five percent decrease or increase in future development and abandonment costs would decrease or increase the DD&A rate by approximately $0.30 per Boe.
On December 31, 2008, the SEC issued Release No. 33-8995 amending its oil and natural gas reporting requirements for oil and natural gas producing companies. Companies were not permitted to comply at an earlier date. Among other things, Release No. 33-8995:
| • | Revises a number of definitions relating to proved oil and natural gas reserves to make them consistent with the Petroleum Resource Management System, which includes certain non-traditional resources in proved reserves; |
| • | Permits the use of new technologies for determining proved oil and natural gas reserves; |
| • | Requires the use of average prices for the trailing twelve-month period in the estimation of oil and natural gas reserve quantities and, for companies using the full cost method of accounting, in computing the Ceiling Limitation, in place of a single day price as of the end of the fiscal year; |
| • | Permits the disclosure in filings with the SEC of probable and possible reserves and reserves sensitivity to changes in prices; |
| • | Requires additional disclosures (outside of the financial statements) regarding the status of undeveloped reserves and changes in status of these from period to period; and |
| • | Requires a discussion of the internal controls in place to assure objectivity in the reserve estimation process and disclosure of the technical qualifications of the technical person having primary responsibility for preparing the reserve estimates. |
44
Table of Contents
Our independent petroleum engineers applied the procedures specified in SEC Release No. 33-8995 in preparing the estimate of our proved reserves as of December 31, 2010 and 2011, as reflected in this report.
Topic 410 of the Codification addresses financial accounting and reporting for obligations associated with the retirement of tangible long-lived assets and the associated asset retirement costs and amends Statement of Financial Accounting Standards No. 19, now Topic 932 of the Codification. Topic 410 requires that the fair value of a liability for an asset retirement obligation be recognized in the period in which it is incurred if a reasonable estimate of fair value can be made, and that the associated asset retirement costs be capitalized as part of the carrying amount of the long-lived asset. We determine our asset retirement obligation on our oil and natural gas properties by calculating the present value of the estimated cash flows related to the liability.
As set forth in Topic 740 of the Codification, deferred income taxes are recognized at each period end for the future tax consequences of differences between the tax bases of assets and liabilities and their financial reporting amounts based on tax laws and statutory tax rates applicable to the periods in which the differences are expected to affect taxable income. We routinely assess the realizability of our deferred tax assets. We consider future taxable income in making such assessments. If we conclude that it is more likely than not that some portion or all of the deferred tax assets will not be realized under accounting standards, it is reduced by a valuation allowance. However, despite our attempt to make an accurate estimate, the ultimate utilization of our deferred tax assets is highly dependent upon our actual production and the realization of taxable income in future periods.
We account for our derivative arrangements as set forth in Topic 815 of the Codification. Topic 815 requires the accounting recognition of all derivative instruments on the balance sheet as either assets or liabilities measured at fair value. We may or may not elect to designate a derivative instrument as a hedge against changes in the fair value of an asset or a liability (a “fair value hedge”) or against exposure to variability in expected future cash flows (a “cash flow hedge”). The accounting treatment for the changes in fair value of a derivative instrument is dependent upon whether or not a derivative instrument is a cash flow hedge or a fair value hedge, and upon whether or not the derivative is designated by us as a hedge. Changes in fair value of a derivative designated as a cash flow hedge are recognized, to the extent the hedge is effective, in other comprehensive income until the hedged item is recognized in earnings. Changes in the fair value of a derivative instrument designated as a fair value hedge, to the extent the hedge is effective, have no effect on the statement of operations due to the fact that changes in fair value of the derivative offsets changes in the fair value of the hedged item. Where hedge accounting is not elected or if a derivative instrument does not qualify as either a fair value hedge or a cash flow hedge, changes in the fair value are recognized in earnings. We have not elected to designate our derivative instruments as hedges as required by Topic 815 in order to receive hedge accounting treatment. Accordingly, all gains and losses on the derivative instrument have been recorded in earnings.
During June 2008, the FASB issued authoritative guidance on whether instruments granted in share-based payment transactions are participating securities prior to vesting and, therefore, need to be included in computing basic earnings per share. The guidance was effective for fiscal years beginning after December 15, 2008, and interim periods within those years. Additionally, all prior period earnings per share must be adjusted retrospectively. As our restricted stock awards granted under our Long-Term Incentive Plan qualify as participating securities, we adopted the guidance during 2009, which resulted in an increase in our basic and diluted weighted average shares outstanding.
We account for share-based payments under authoritative guidance, as set forth in Topic 718 of the Codification. Topic 718 requires all share-based payments to employees, including grants of employee stock options, to be recognized in the financial statements based on their fair values.
We account for uncertain tax positions under the guidance set forth in Topic 740 of the Codification. This Topic prescribes guidance for the financial statement recognition and measurement of a tax position taken or expected to be taken in a tax return. To recognize a tax position, the enterprise determines whether it is more
45
Table of Contents
likely than not that the tax position will be sustained upon examination, including resolution of any related appeals or litigation, based solely on the technical merits of the position. A tax position that meets the more likely than not threshold is measured to determine the amount of benefit to be recognized in the financial statements. The amount of tax benefit recognized with respect to any tax position is measured as the largest amount of benefit that is greater than 50 percent likely of being realized upon settlement.
New Accounting Pronouncements
In December 2010, the FASB issued an update to authoritative guidance, as set forth in Topic 805 of the Codification, relating to business combinations. This update provides clarification requiring public companies that have completed material acquisitions to disclose the revenue and earnings of the combined business as if the acquisition took place at the beginning of the comparable prior annual reporting period, and also expands the supplemental pro forma disclosures to include a description of the nature and amount of material, non-recurring pro forma adjustments directly attributable to the business combination included in the reported pro forma revenue and earnings. We will be required to apply this guidance prospectively for business combinations for which the acquisition date is on or after January 1, 2011. Adoption of this guidance on January 1, 2011 did not have a material impact on our financial position or statement of operations.
In May 2011, the FASB issued Accounting Standards Update (“ASU”) No. 2011-04, “Amendments to Achieve Common Fair Value Measurement and Disclosure Requirements in U.S. GAAP and International Financial Accounting Reporting Standards (“IFRS”)”. This pronouncement was issued to provide a consistent definition of fair value and ensure that the fair value measurement and disclosure requirements are similar between U.S. GAAP and IFRS. ASU 2011-04 changes certain fair value measurement principles and enhances the disclosure requirements particularly for level 3 fair value measurements. This update is effective for reporting periods beginning on or after December 15, 2011. The adoption of ASU 2011-04 did not have a significant impact on our financial position or results of operations.
In June 2011, the FASB issued ASU No. 2011-05, “Presentation of Comprehensive Income”. ASU 2011-05 eliminates the option to report other comprehensive income and its components in the statement of changes in stockholders’ equity and requires an entity to present the total of comprehensive income, the components of net income and the components of other comprehensive income either in a single continuous statement or in two separate but consecutive statements. This update is effective for fiscal years, and interim periods within those years beginning after December 15, 2011. In December 2011, the FASB issued ASU No. 2011-12, which becomes effective at the same time as ASU 2011-05, to defer the effective date of provisions of ASU 2011-05 that relate to the presentation of reclassification adjustments. We expect adoption of ASU 2011-05 or ASU 2011-12 will not have an impact on our financial position or results of operations.
In December 2011, the FASB issued ASU No. 2011-11 which will enhance disclosures by requiring an entity to disclose information about netting arrangements, including rights of offset, to enable users of its financial statements to understand the effect of those arrangements on its financial position. This pronouncement was issued to facilitate comparison between financial statements prepared on the basis of U.S. GAAP and IFRS. This update is effective for annual and interim reporting periods beginning on or after January 1, 2013 and is to be applied retroactively for all comparative periods presented. The adoption of ASU 2011-11 is not expected to have a significant impact on our financial position or results of operations.
46
Table of Contents
Results of Operations
Year Ended December 31, 2011 Compared to the Year Ended December 31, 2010
The following tables summarize our oil and natural gas production volumes, average sale prices and comparisons for the years ended December 31, 2011 and 2010:
| Texas | Oklahoma | Louisiana | Other | Total | ||||||||||||||||
| Year Ended December 31, 2011 |
||||||||||||||||||||
| Aggregate Net Production |
||||||||||||||||||||
| Oil (MBbls) |
499 | 297 | 60 | 28 | 884 | |||||||||||||||
| NGLs (MBbls) |
147 | 16 | — | 13 | 176 | |||||||||||||||
| Natural Gas (MMcf) |
1,562 | 410 | 558 | 132 | 2,662 | |||||||||||||||
|
|
|
|
|
|
|
|
|
|
|
|||||||||||
| MBoe |
906 | 382 | 153 | 63 | 1,504 | |||||||||||||||
|
|
|
|
|
|
|
|
|
|
|
|||||||||||
| Year Ended December 31, 2010 |
||||||||||||||||||||
| Aggregate Net Production |
||||||||||||||||||||
| Oil (MBbls) |
559 | 322 | 79 | 35 | 995 | |||||||||||||||
| NGLs (MBbls) |
341 | 10 | — | 13 | 364 | |||||||||||||||
| Natural Gas (MMcf) |
3,128 | 849 | 689 | 150 | 4,816 | |||||||||||||||
|
|
|
|
|
|
|
|
|
|
|
|||||||||||
| MBoe |
1,421 | 473 | 194 | 73 | 2,161 | |||||||||||||||
|
|
|
|
|
|
|
|
|
|
|
|||||||||||
| Change in MBoe |
(515 | ) | (91 | ) | (41 | ) | (10 | ) | (657 | ) | ||||||||||
| Percentage Change in MBoe |
-36.2 | % | -19.2 | % | -21.1 | % | -13.7 | % | -30.4 | % | ||||||||||
| Years
Ended December 31, |
||||||||||||
| 2011 | 2010 | Increase/ (Decrease) | ||||||||||
| Average sale prices: |
||||||||||||
| Oil (per Bbl) |
$ | 93.86 | $ | 76.95 | 22.0% | |||||||
| NGL (per Bbl) |
56.14 | 38.89 | 44.4% | |||||||||
| Natural gas (per Mcf) |
4.01 | 4.21 | (4.8%) | |||||||||
| Per Boe |
68.83 | 51.36 | 34.0% | |||||||||
In December 2010, we sold assets located in Texas and Oklahoma for net proceeds including post-closing adjustments of $48.8 million. The following table provides pro forma results for the year ended December 31, 2010 excluding those sold properties to assist our description of results of operations:
| Year ended December 31, 2010 | ||||||||||||
| Actual | Sold Assets |
Pro Forma |
||||||||||
| Oil and natural gas sales (in thousands): |
||||||||||||
| Oil |
$ | 76,563 | $ | 1,144 | $ | 75,419 | ||||||
| Natural gas |
20,265 | 4,936 | 15,329 | |||||||||
| NGLs |
14,156 | 4,882 | 9,274 | |||||||||
|
|
|
|
|
|
|
|||||||
| Total oil and natural gas sales |
$ | 110,984 | $ | 10,962 | $ | 100,022 | ||||||
| Production expenses (in thousands): |
||||||||||||
| Oil and natural gas production taxes |
$ | 6,063 | $ | 486 | $ | 5,577 | ||||||
| Oil and natural gas production expenses |
33,891 | 1,692 | 32,199 | |||||||||
| Production volumes (MBoe): |
||||||||||||
| Texas |
1,421 | 298 | 1,123 | |||||||||
| Oklahoma |
473 | 63 | 410 | |||||||||
| Other |
267 | — | 267 | |||||||||
|
|
|
|
|
|
|
|||||||
| Total production |
2,161 | 361 | 1,800 | |||||||||
47
Table of Contents
Oil and natural gas sales decreased $7.5 million, or 7%, to $103.5 million for the year ended December 31, 2011, as compared to $111.0 million for the year ended December 31, 2010. Excluding asset sales, oil and natural gas sales increased $3.5 million for the year ended December 31, 2011, as compared to the year ended December 31, 2010. This increase was driven by commodity price increases on a per Boe basis of 34% for the year ended December 31, 2011 as compared to 2010 partially offset by decreased production.
Production volumes decreased 30% overall during the year ended December 31, 2011, as compared to the year ended December 31, 2010. Excluding the activities related to the asset divestitures, our production volume decreased 16% as compared to the same period last year primarily due to a shut-in of one well as a result of a major workover in Louisiana and natural production declines. Production from our Texas fields decreased by 217 MBoe in the current year, excluding asset sales, due to decline in well performance in our South Texas gas properties. Drilling activity included 45 gross (42.8 net) development wells in our Texas fields. Of the 45 gross development wells in our Texas fields, 40 gross (38.6 net) wells were capable of production, four gross (4.0 net) wells were either drilling or waiting on completion and one gross (0.2 net) well was abandoned. Production from our Oklahoma fields decreased 28 MBoe for the current year, excluding asset sales, primarily due to natural production declines. Drilling activity in Oklahoma included one gross (0.2 net) development well and twelve gross (11.9 net) exploratory wells. Production from our Louisiana fields decreased 41 MBoe for the year ended December 31, 2011 primarily due to a shut-in of one well and normal production declines. We did not drill any new wells in our Louisiana fields during the year ended December 31, 2011. Lower development capital expenditures resulted in decreased production in 2011 from natural production declines not offset by increased drilling.
The average realized sales prices increased substantially for the year ended December 31, 2011, as compared to the year ended December 31, 2010. The average realized sales price for oil was $93.86 per barrel for the year ended December 31, 2011, an increase of 22%, compared to $76.95 per barrel for 2010. The average realized sales price for NGLs was $56.14 for the year ended December 31, 2011, an increase of 44%, compared to $38.89 per barrel for 2010. The average realized sales price for natural gas was $4.01 per Mcf for the year ended December 31, 2011, a decrease of 5%, compared to $4.21 per Mcf for 2010. The positive impact from the 34% increase in total average price per Boe for the year 2011 did not fully offset the impact of asset sales and normal production declines, causing oil and natural gas sales for the year ended December 31, 2011 to decline to $103.5 million compared to $111.0 million for the year ended December 31, 2010.
We recorded income before income taxes of $5.4 million for the year ended December 31, 2011, an increase of $2.0 million, as compared to $3.4 million for the year ended December 31, 2010. Excluding unrealized gains on derivatives of $5.3 million and debt extinguishment and loan amortization costs of $2.7 million, our adjusted income before income taxes for the year ended December 31, 2011 was $2.8 million. Excluding unrealized gains on derivatives of $6.4 million, our adjusted loss before income taxes for the year ended December 31, 2010 was $3.0 million.
Realized and Unrealized Gain (Loss) from Derivatives. For the year ended December 31, 2011, our gain from derivatives was $4.2 million compared to $1.2 million for the year ended December 31, 2010. Our gains and losses for these periods were the net result of recording actual contract settlements, the amortization of premiums paid and received for our derivative contracts, and unrealized gains and losses attributable to mark-to-market values of our derivative contracts at the end of the periods. Of the $1.1 million realized losses on derivatives for 2011, we recognized $0.9 million in realized losses on the unwinding of the excess crude oil and natural gas derivatives and $0.5 million in fees paid to complete the novation of derivative contracts to counterparties that are lenders within our credit facilities, both of which are included with other settlements of $0.3 million in realized gains on derivatives and required under the terms of the credit facilities. The significant shift from 2010 to 2011 was primarily a result of higher crude oil and lower natural gas market prices in the 2011 period.
During the third quarter of 2011, we received $5.0 million in premiums in exchange for selling $70 put options on crude oil put/call “collars” with a $95 per barrel floor price and a $105 per barrel ceiling price. The
48
Table of Contents
sold put options limit the effectiveness of purchased put options at the low end of the collar to market prices in excess of the strike price of the put option sold. The premiums received initially reduced our net derivative asset by $5.0 million.
| Years Ended December 31, |
||||||||
| 2011 | 2010 | |||||||
| (In thousands) | ||||||||
| Contract settlements and premium costs: |
||||||||
| Oil |
$ | (3,103 | ) | $ | (6,110 | ) | ||
| Natural gas |
2,025 | 917 | ||||||
|
|
|
|
|
|||||
| Realized losses |
(1,078 | ) | (5,193 | ) | ||||
| Mark-to-market gains (losses): |
||||||||
| Oil |
5,341 | 4,817 | ||||||
| Natural gas |
(72 | ) | 1,569 | |||||
|
|
|
|
|
|||||
| Unrealized gains |
5,269 | 6,386 | ||||||
|
|
|
|
|
|||||
| Realized and unrealized gains |
$ | 4,191 | $ | 1,193 | ||||
|
|
|
|
|
|||||
Oil and Natural Gas Production Taxes. Our oil and natural gas production taxes were $5.7 million for the year ended December 31, 2011, compared to $5.6 million, excluding asset sales, for the year ended December 31, 2010. The increase is due primarily to higher commodity prices during the 2011 period. Production taxes vary by state. Most are based on realized prices at the wellhead, while Louisiana production tax is based on volumes for natural gas and value for oil. As revenues or volumes from oil and natural gas sales increase or decrease, production taxes on these sales also increase or decrease directly. As a percentage of oil and natural gas sales, oil and natural gas production taxes were 6% and 5% for the years ended December 31, 2011 and 2010, respectively.
Oil and Natural Gas Production Expense. Our oil and natural gas production expense was $33.3 million for the year ended December 31, 2011, an increase of $1.1 million, or 4%, from the $32.2 million, excluding asset sales, for the year ended December 31, 2010. For the year ended December 31, 2011, our oil and natural gas production expense was $22.16 per Boe compared to $15.68 per Boe for the year ended December 31, 2010, an increase of 41%. The increase in Boe is primarily due to the asset sales, as the sold assets in 2010 were predominantly shale gas producing assets which had relatively lower lease operating expenses per Boe.
Depreciation and Amortization Expense. Our depreciation and amortization expense decreased $5.9 million, or 22%, for the year ended December 31, 2011, compared to the year ended December 31, 2010. The decrease was a result of a decrease in production during 2011, partially offset by a higher depletion rate per Boe. On an equivalent basis, our amortization of the full-cost pool of $20.4 million was $13.55 per Boe for the year ended December 31, 2011, an increase of 12% per Boe compared to $26.2 million, or $12.11 per Boe for the year ended December 31, 2010.
Accretion Expense. Topic 410 of the Codification, Accounting for Asset Retirement Obligations, includes, among other things, the reporting of the “fair value” of asset retirement obligations. Accretion expense is a function of changes in the discounted liability from period to period. We recorded $1.6 million for the year ended December 31, 2011, compared to $1.5 million for the year ended December 31, 2010.
Share-Based Compensation. From time to time, our Board of Directors grants restricted stock awards and/or stock appreciation rights, or SARs, under our 2006 Long-Term Incentive Plan. Each of the restricted stock grants vests in equal increments over the vesting period provided for the particular award, typically from one to four years. The share-based compensation on the restricted stock grants was calculated using the closing price per share on each of the grant dates, and the total share-based compensation on all restricted stock grants will be recognized over their respective vesting periods. Share-based compensation expense attributable to SARs is based on the fair value re-measured at each reporting period and recognized over the four-year vesting period.
49
Table of Contents
The fair value calculation resulted in $0.8 million of compensation expense recognized for the year ended December 31, 2011. For the year ended December 31, 2011, we recognized a total of $3.4 million share-based compensation related to restricted stock awards compared to $3.1 million for the year ended December 31, 2010. The increase was due to accelerated vesting for retired employees pursuant to our restructuring, and a higher number of shares outstanding in the 2011 period. During the year ended December 31, 2011, $2.8 million of recognized compensation related to restricted stock awards was recorded as compensation expense, $0.1 million was recorded as restructuring costs and $0.5 million was recorded as capitalized internal costs. During the year ended December 31, 2010, all recognized compensation was recorded to compensation expense.
Restructuring Costs. During 2011, we announced a company-wide reorganization of our operating and administrative functions (the “Reorganization”). As part of the Reorganization, we recognized restructuring expense of $1.1 million, including $0.7 million of one-time severance benefits, $0.2 million of retention payments, $0.2 million of share-based compensation related to the acceleration of employee restricted stock awards and payment of share appreciation rights. There were no restructuring costs incurred for the year ended December 31, 2010.
General and Administrative Expense. For the year ended December 31, 2011, our general and administrative expense was $17.2 million, compared to $14.8 million for the year ended December 31, 2010, an increase of $2.4 million, or 16%. The increase is primarily due to divestiture costs recognized in 2011 on a transaction that was terminated.
Interest Expense. We recorded interest expense of $17.4 million for the year ended December 31, 2011, compared to $22.7 million incurred during the previous year. Of that $17.4 million, we incurred $2.7 million in debt extinguishment and loan amortization costs and $0.4 million in payment-in-kind interest related to our old credit facility in 2011. The decrease in interest expense was due to lower interest rates and lower average outstanding borrowings throughout the 2011 period. As of December 31, 2011 and 2010, our blended interest rate was 6.2% and 8.0%, respectively.
Loss on Interest Rate Derivatives. We incurred $0.7 million net realized and unrealized loss attributable to interest rate swaps for the year ended December 31, 2011. Our realized and unrealized loss was the net result of recording actual contract settlements and unrealized losses attributable to the mark-to-market values of our interest rate swap contract at the end of the period. We had no interest rate derivatives in effect in the year ended December 31, 2010.
Other Income (Expense). Our other expense was $0.5 million in 2011 compared to other income of $0.3 million in 2010. The increase in other expense is primarily due to a litigation settlement recorded in 2011. For the year ended December 31, 2010, we reduced a contingency accrual by $0.6 million related to settlement of pending litigation offset by a charge relating to pipe inventory write-off.
Income Taxes. For the year ended December 31, 2011, we recorded an income tax provision of $6.8 million on a pre-tax income of $5.4 million. The income tax provision for 2011 included a $6.0 million decrease to deferred tax assets, including a Section 382 adjustment related to net operating loss limitations and a decrease in the valuation allowance of $1.9 million. For the year ended December 31, 2010, we recorded an income tax provision of $1.0 million on a pre-tax income of $3.4 million. The income tax provision for 2010 included a $5.7 million decrease to deferred tax assets under Section 382 related to net operating loss limitations and a decrease in the valuation allowance of $6.6 million for revisions to future taxable income projections.
50
Table of Contents
Year Ended December 31, 2010 Compared to the Year Ended December 31, 2009
The following tables summarize our oil and natural gas production volumes, average sale prices and comparisons for the years ended December 31, 2010 and 2009:
| Texas | Oklahoma | Louisiana | Other | Total | ||||||||||||||||
| Year Ended December 31, 2010 |
||||||||||||||||||||
| Aggregate Net Production |
||||||||||||||||||||
| Oil (MBbls) |
559 | 322 | 79 | 35 | 995 | |||||||||||||||
| NGLs (MBbls) |
341 | 10 | — | 13 | 364 | |||||||||||||||
| Natural Gas (MMcf) |
3,128 | 849 | 689 | 150 | 4,816 | |||||||||||||||
|
|
|
|
|
|
|
|
|
|
|
|||||||||||
| MBoe |
1,421 | 473 | 194 | 73 | 2,161 | |||||||||||||||
|
|
|
|
|
|
|
|
|
|
|
|||||||||||
| Year Ended December 31, 2009 |
||||||||||||||||||||
| Aggregate Net Production |
||||||||||||||||||||
| Oil (MBbls) |
664 | 356 | 83 | 35 | 1,138 | |||||||||||||||
| NGLs (MBbls) |
375 | 15 | — | 16 | 406 | |||||||||||||||
| Natural Gas (MMcf) |
3,821 | 1,266 | 743 | 164 | 5,994 | |||||||||||||||
|
|
|
|
|
|
|
|
|
|
|
|||||||||||
| MBoe |
1,676 | 582 | 207 | 77 | 2,542 | |||||||||||||||
|
|
|
|
|
|
|
|
|
|
|
|||||||||||
| Change in MBoe |
(255 | ) | (109 | ) | (13 | ) | (4 | ) | (381 | ) | ||||||||||
| Percentage Change in MBoe |
(15.2 | )% | (18.7 | )% | (6.3 | )% | (5.2 | )% | (15.0 | )% | ||||||||||
| Years Ended | ||||||||||||
| December 31, | ||||||||||||
| 2010 | 2009 | Increase | ||||||||||
| Average sale prices: |
||||||||||||
| Oil (per Bbl) |
$ | 76.95 | $ | 58.24 | 32.1 | % | ||||||
| NGL (per Bbl) |
38.89 | 27.26 | 42.7 | % | ||||||||
| Natural gas (per Mcf) |
4.21 | 3.47 | 21.3 | % | ||||||||
| Per Boe |
51.36 | 38.62 | 33.0 | % | ||||||||
Oil and natural gas sales increased $12.8 million, or 13%, to $111.0 million for the year ended December 31, 2010, as compared to $98.2 million for the year ended December 31, 2009. This increase was driven by commodity price increases on a per Boe basis of 33% for the year ended December 31, 2010, as compared to 2009.
Production volumes decreased 15% overall during the year ended December 31, 2010, as compared to the year ended December 31, 2009, primarily due to natural production declines and weather-related interruptions. Production from our Texas fields decreased by 255 MBoe in the current year.
Drilling activity in our Texas fields included 58 gross (51.1 net) wells in 2010, all of which were completed as producing wells, and three gross (3.0 net) wells in the process of being completed at December 31, 2010. Production from our Oklahoma fields decreased by 109 MBoe over the prior year. Drilling activity in our Oklahoma fields included three gross (2.9 net) wells, all of which were completed as producing, and three gross (2.8 net) wells waiting on completion at December 31, 2010. Production from our Louisiana fields decreased by 13 MBoe over the prior year. Drilling activity in our Louisiana fields included one gross (0.2 net) well, which was a dry hole, in 2010. Lower development capital expenditures resulted in decreased production in 2010 from natural production declines not offset by increased drilling.
The average realized sales price for oil was $76.95 per barrel for the year ended December 31, 2010, an increase of 32%, compared to $58.24 per barrel for 2009. The average realized sales price for NGLs was $38.89 for the year ended December 31, 2010, an increase of 43%, compared to $27.26 per barrel for 2009. The average realized sales price for natural gas was $4.21 per Mcf for the year ended December 31, 2010, an increase of 21%, compared to $3.47 per Mcf for 2009.
51
Table of Contents
Realized and Unrealized Gain (Loss) from Derivatives. For the year ended December 31, 2010, our gain from derivatives was $1.2 million compared to a loss of $11.3 million for the year ended December 31, 2009. Our gains and losses for these periods were the net result of recording actual contract settlements, the premiums paid for our derivative contracts, and unrealized gains and losses attributable to mark-to-market values of our derivative contracts at the end of the periods. The significant shift from 2009 to 2010 was primarily a result of higher market prices in the 2010 period.
| Years Ended December 31, |
||||||||
| 2010 | 2009 | |||||||
| (In thousands) | ||||||||
| Contract settlements and premium costs: |
||||||||
| Oil |
$ | (6,110 | ) | $ | 5,626 | |||
| Natural gas |
917 | 13,629 | ||||||
|
|
|
|
|
|||||
| Realized gains (losses) |
(5,193 | ) | 19,255 | |||||
| Mark-to-market gains (losses): |
||||||||
| Oil |
4,817 | (23,724 | ) | |||||
| Natural gas |
1,569 | (6,837 | ) | |||||
|
|
|
|
|
|||||
| Unrealized gains (losses) |
6,386 | (30,561 | ) | |||||
|
|
|
|
|
|||||
| Realized and unrealized gains (losses) |
$ | 1,193 | $ | (11,306 | ) | |||
|
|
|
|
|
|||||
Oil and Natural Gas Production Taxes. Our oil and natural gas production taxes were $6.1 million for the year ended December 31, 2010, compared to $5.3 million for the year ended December 31, 2009, due primarily to higher commodity prices during the 2010 period. Production taxes vary by state. Most are based on realized prices at the wellhead, while Louisiana production tax is based on volumes for natural gas and value for oil. As revenues or volumes from oil and natural gas sales increase or decrease, production taxes on these sales also increase or decrease directly. As a percentage of oil and natural gas sales, oil and natural gas production taxes were 5% for the year ended December 31, 2010 and 2009.
Oil and Natural Gas Production Expense. Our oil and natural gas production expense was $33.9 million for the year ended December 31, 2010, a decrease of $3.6 million, or 10%, from the $37.5 million for the year ended December 31, 2009, due primarily to cost-saving measures implemented in 2010. For the year ended December 31, 2010, our oil and natural gas production expense was $15.68 per Boe compared to $14.73 per Boe for the year ended December 31, 2009, an increase of 6%.
Depreciation and Amortization Expense. Our depreciation and amortization expense decreased $4.4 million, or 14%, for the year ended December 31, 2010, compared to the year ended December 31, 2009. The decrease was a result of a decrease in production during 2010, partially offset by a higher depletion rate per Boe. On an equivalent basis, our amortization of the full-cost pool of $26.2 million was $12.11 per Boe for the year ended December 31, 2010, an increase of less than 1% per Boe compared to $30.7 million, or $12.06 per Boe for the year ended December 31, 2009.
Accretion Expense. Topic 410 of the Codification includes, among other things, the accounting for asset retirement obligations. Accretion expense is a function of changes in the discounted liability from period to period. We recorded $1.5 million for the year ended December 31, 2010, compared to $2.0 million for the year ended December 31, 2009.
Impairment Charge. For the year ended December 31, 2010, we incurred no impairment charges. We incurred a $47.6 million impairment on the carrying value of our oil and gas properties for the year ended December 31, 2009. The impairment of our oil and gas properties was primarily due to a reduction in the tax
affected estimated present value of future net revenues, caused by dramatic decline in natural gas prices, from our proved oil and gas reserves between December 31, 2008, and March 31, 2009.
52
Table of Contents
Share-Based Compensation. From time to time, our board of directors grants restricted stock awards under our 2006 Long-Term Incentive Plan. Each of these grants vests in equal increments over the vesting period provided for the particular award, generally from one to five years. The share-based compensation expense related to these grants is calculated using the closing price per share on each of the grant dates and the total share-based compensation on all these grants will be recognized over their respective vesting periods. For the year ended December 31, 2010, we recorded a total of $3.1 million share-based compensation expense compared to $2.2 million for the year ended December 31, 2009. The increase in share-based compensation expense was primarily due to additional grants and increased stock price during the 2010 period.
General and Administrative Expense. For the year ended December 31, 2010, our general and administrative expense was $14.8 million, compared to $16.7 million for the year ended December 31, 2009, a decrease of $1.9 million, or 11%. The decrease is primarily due to decreased professional fees and lower employee-related costs in 2010.
Interest Expense. We recorded interest expense of $22.7 million for the year ended December 31, 2010, compared to $18.6 million incurred during the previous year. Interest rates were higher in 2010 compared to 2009 due to the Second Amendment to our credit facility executed June 26, 2009. Our blended interest rate was 8.0% during 2010 compared to 7.6% in the 2009 period. As a result of higher interest rates for the period, our interest expense increased by $4.1 million for the year ended December 31, 2010, compared to 2009.
Other Income (Expense). Our other income was $0.3 million in 2010 compared to other expense of $0.4 million in 2009. For the year ended December 31, 2010, we reduced a contingency accrual by $0.6 million related to settlement of pending litigation offset by a charge relating to pipe inventory write-off. For the year ended December 31, 2009, we recorded $0.4 million charge to other expense primarily for expenses related to settlement of pending litigation.
Income Taxes. For the year ended December 31, 2010, we recorded an income tax provision of $1.0 million on a pre-tax income of $3.4 million. The income tax provision for 2010 included a $5.7 million decrease to deferred tax assets under Section 382 of the Internal Revenue Code related to net operating loss limitations and a decrease in the valuation allowance of $6.6 million for revisions to future taxable income projections. For the year ended December 31, 2009, we recorded an income tax benefit of $16.3 million on a pre-tax loss of $74.7 million. Included in the income tax benefit for 2009 is an increase in valuation allowance of $9.5 million to reflect our estimate of reduced tax benefits expected to be realized from net deferred tax assets of the company. The effective tax rates for the year ended December 31, 2010 and 2009, were 29.2% and 21.9%, respectively.
Liquidity and Capital Resources
On February 8, 2012, Halcón Resources, LLC, a newly-formed company led by Floyd C. Wilson, former Chairman and Chief Executive Officer of Petrohawk Energy Corporation, recapitalized us with a $550.0 million investment structured as the purchase of $275.0 million in new common stock, a $275.0 million five-year 8% convertible note and warrants for the purchase of an additional 36,666,666 million shares of our common stock at an exercise price of $4.50 per share.
In connection with the closing of the Halcón transaction, we entered into a Senior Revolving Credit Agreement (the “credit agreement”) with JPMorgan Chase Bank, N.A., as administrative agent, and the other lenders named therein on February 8, 2012. The credit agreement provides for a $500.0 million facility with an initial borrowing base of $225.0 million. Amounts borrowed under the credit agreement will initially mature on February 8, 2017. The borrowing base will be redetermined semi-annually, with the company and the lenders each having the right to one interim unscheduled redetermination between any two consecutive semi-annual redeterminations. The borrowing base will be based on our oil and natural gas properties, proved reserves, total indebtedness, and other relevant factors consistent with customary oil and gas lending criteria. The borrowing base is subject to a reduction equal to the product of 0.25 multiplied by the stated principal amount (without regard to any initial issue discount) of any notes or other long-term debt securities that we may issue.
53
Table of Contents
Funds advanced under the credit agreement may be paid down and re-borrowed during the term of the credit agreement, and bear interest at LIBOR plus a margin ranging from 1.5% to 2.5% based on a percentage of usage. Advances under the credit agreement are secured by liens on substantially all of our and our subsidiaries assets.
On March 5, 2012, we sold in a private placement to certain institutional accredited investors 4,444.4511 shares of 8% automatically convertible preferred stock, par value $0.0001 per share, each share of which will convert into 10,000 shares of our common stock (or a proportionate number of shares of common stock with respect to any fractional shares of preferred stock), subject to certain adjustments, for approximately $400.0 million, or $9.00 per share of common stock, before offering expenses. The convertible preferred stock will convert into common stock automatically on the 20th calendar day after we mail a definitive information statement to holders of our common stock notifying them that our majority stockholder has consented to the issuance of common stock upon conversion of the convertible preferred stock. No dividend will be paid on the convertible preferred stock if it converts into common stock on or before May 31, 2012.
Previous Credit Facilities
In March 2011, we entered into credit facilities, which included a $250.0 million first lien revolving credit facility and a $75.0 million second lien term loan facility. SunTrust Bank was the administrative agent for the revolving facility, and Guggenheim Corporate Funding, LLC was the administrative agent for the term loan facility. The borrowing base under the revolving credit facility was $150.0 million. This credit facility allowed for funds advanced under the revolving credit facility to be paid down and re-borrowed during the five-year term of the revolver, and bore interest at LIBOR plus a margin ranging from 2.5% to 3.25% based on a percentage of usage. The term loan portion of our credit facility provided for payments of interest only during its 5.5-year term, with the interest rate being LIBOR plus 9.0% with a 2.0% LIBOR Floor, or if any period we elected to pay a portion of the interest under our term loan “in kind,” then the interest rate would be LIBOR plus 10.0% with a 2.0% LIBOR floor, and with 7.0% of the interest amount paid in cash and the remaining 3.0% paid in kind by being added to principal.
Our previous credit facility entered into November 2007 included a $500.0 million credit facility with Guggenheim Corporate Funding, LLC, for itself and on behalf of other institutional lenders. This facility included a $250.0 million revolving credit facility, a $200.0 million term loan facility, and an additional $50.0 million available under the term loan as requested by us and approved by the lenders. Funds advanced under the revolving credit facility initially bore interest at LIBOR plus a margin ranging from 1.25% to 2.0% based on a percentage of usage. The term loan portion of our credit facility initially provided for payments of interest only during its five-year term, with the initial interest rate being LIBOR plus 7.5%.
On June 26, 2009, we renegotiated certain terms of our previous credit facility to provide us greater flexibility in complying with certain of the financial covenants under the loan agreement. In exchange for the added flexibility afforded by these changes to the credit facility, we agreed to increase the base cash interest rate on both the revolving credit facility and the term loan credit facility by 1.0% per annum, establish a LIBOR floor of 1.5% and pay an additional 2.75% per annum of non-cash, payment-in-kind, or PIK, interest on the term portion of the facility. Accrued PIK interest was added to the principal balance of the term loan on a monthly basis and was paid in connection with the closing of the new credit facilities in March 2011.
In December 2010, we used $33.8 million in proceeds from asset sales to pay down the term facility and $24.0 million in proceeds from asset sales to pay down the revolving credit facility. PIK interest of $3.0 million was added to the term facility in 2010, and $0.4 million was added to the term facility in the first quarter of 2011, bringing the balance of the term facility to $80.6 million at the date of the closing of the credit facilities entered into on March 14, 2011. Both the revolving credit facility and the term loan facility were paid down in connection with the Halcón recapitalization on February 8, 2012 and we entered into the new $500.0 million credit agreement, discussed above.
54
Table of Contents
At December 31, 2011, we had $202.0 million of indebtedness outstanding, including $127.0 million under our prior revolving credit facility and $75.0 million under our prior term loan credit facility. As of December 31, 2011, we had an accumulated deficit of $216.3 million and a working capital deficit of $6.1 million.
At-The-Market Program . On March 17, 2011, we filed a prospectus supplement under which we may, from time to time, sell up to $25.0 million of our common stock through an “at-the-market” equity distribution program (the “At-The-Market Program”). As of December 31, 2011, we had made no sales of common stock through the At-The-Market Program.
Cash Flow
Our primary source of cash in 2011, 2010 and 2009 was from operating activities. Additionally, during 2010, we received $49.4 million in proceeds from sales of oil and gas property. In 2011 and 2009, nonacquisition capital expenditures made up the majority of cash used in investing activities. In 2010, proceeds from property sales offset capital expenditures. In 2011 and 2009, cash used in financing activities was largely due to payments for deferred loan costs, and during 2010, primarily due to payments on long-term debt. Operating cash flow fluctuations were substantially driven by changes in commodity prices and changes in our production volumes. Working capital was substantially influenced by these variables. Fluctuation in commodity prices and our overall cash flow may result in an increase or decrease in our future capital expenditures. Prices for oil and natural gas have historically been subject to seasonal fluctuations characterized by peak demand and higher prices in the winter heating season; however, the impact of other risks and uncertainties have influenced prices throughout recent years. See Results of Operations below for a review of the impact of prices and volumes on sales.
| Years Ended December 31, | ||||||||||||
| 2011 | 2010 | 2009 | ||||||||||
| (In thousands) | ||||||||||||
| Cash flows provided by operating activities |
$ | 29,835 | $ | 37,875 | $ | 32,372 | ||||||
| Cash flows provided by (used in) investing activities |
(25,376 | ) | 14,970 | (23,921 | ) | |||||||
| Cash flows used in financing activities |
(4,447 | ) | (52,937 | ) | (8,486 | ) | ||||||
|
|
|
|
|
|
|
|||||||
| Net increase (decrease) in cash |
$ | 12 | $ | (92 | ) | $ | (35 | ) | ||||
|
|
|
|
|
|
|
|||||||
Cash Flow From Operating Activities. Net cash flows provided by operating activities were $29.8 million, $37.9 million and $32.4 million for the years ended December 31, 2011, 2010 and 2009, respectively. Key drivers of net operating cash flows are commodity prices, production volumes and operating costs.
Our cash flow from operating activities is comprised of three main items: net income (loss), adjustments to reconcile net income (loss) to cash provided (used) before changes in working capital, and changes in working capital. For the year ended December 31, 2011, our net loss was $1.4 million, as compared to net income of $2.4 million for the year ended December 31, 2010, and a net loss of $58.4 million for the year ended December 31, 2009. Adjustments (primarily non-cash items such as depreciation and amortization, asset impairment charge, amortization of deferred loan costs, unrealized gain or loss on derivatives, deferred income taxes and share-based compensation) were $34.4 million, $35.5 million and $102.4 million for the years ended December 31, 2011, 2010 and 2009, respectively. Significant decreases in commodity prices in 2009 resulted in a $47.6 million asset impairment charge and $30.6 million of unrealized losses on derivatives. Depreciation and amortization adjustments declined 14% from 2009 to 2010 primarily as a result of the asset impairment writedown in 2009. The Milagro property sale in 2010 was the primary reason for the 22% decline in depreciation and amortization in 2011 as compared to 2010.
Working capital changes for the year ended December 31, 2011, were a negative $8.1 million offset by a positive $4.9 million in derivatives premiums received. The majority of derivatives premiums resulted from $5.0 million in premiums we received in the third quarter of 2011 for selling put options. For the years ended December 31, 2010 and December 31, 2009, working capital changes were negative $0.05 million and negative $11.7 million, respectively.
55
Table of Contents
Cash Flow From Investing Activities. The primary driver of cash used in investing activities is capital spending, inclusive of acquisitions and net of divestitures. Net cash flows provided by (used in) operating activities were $(25.4) million, $15.0 million and $(23.9) million for the years ended December 31, 2011, 2010 and 2009, respectively. Our capital expenditures were $25.9 million, $34.4 million and $30.5 million in 2011, 2010 and 2009, respectively. Proceeds from sales of oil and natural gas properties of $49.4 million offset capital expenditures in 2010 as a result of property divestitures in conjunction with the execution of our strategic alternative initiative to reduce debt.
Cash Flow From Financing Activities. Net cash flows used in financing activities were $4.4 million, $52.9 million and $8.5 million for the years ended December 31, 2011, 2010 and 2009, respectively.
We refinanced our credit facility in 2011, which resulted in $7.8 million in payments for deferred loan costs. Cash used in 2011 also included $1.0 million in payments for equity issuance costs and $0.2 million for stock withheld to cover employee income taxes on the vesting of stock under our 2006 Long-Term Incentive Plan, offset by $4.5 million net borrowings on long-term debt. The cash used in 2010 included $52.1 million in net payments on long-term debt and $0.8 million for stock repurchased to cover employee income taxes on the vesting of stock under our 2006 Long- Term Incentive Plan. The cash used in 2009 included $6.2 million in net payments on long-term debt and $2.3 million for deferred loan costs.
Capital Commitments
During 2011, we had capital expenditures of $25.2 million relating to our oil and natural gas operations, of which $17.4 million was allocated to developmental drilling and recompletions, $7.1 million was allocated to exploration, including leasehold acquisition, seismic and exploratory drilling, and $0.7 million was allocated to acquisition of proved properties.
Our capital expenditure budget for 2012 is approximately $1.1 billion (65% leasehold acquisitions, 25% drilling and completions, 7% infrastructure and 3% seismic) and is subject to revision based on various factors. The amount and timing of our actual capital expenditures for calendar year 2012 may vary significantly depending on a variety of factors, including prevailing market prices for oil and natural gas, the availability of acreage at acceptable prices in our targeted areas, results of our drilling operations, projects proposed by third party operators on jointly owned acreage, rig and service company availability, and other factors that we cannot predict and that may be beyond our control.
We expect to fund our 2012 capital budget with funds received from our recent recapitalization, proceeds received from our recent convertible preferred stock offering, cash flows from operations, proceeds from potential asset dispositions and borrowings under our credit agreement. We strive to maintain financial flexibility and may access capital markets as necessary to maintain substantial borrowing capacity under our credit agreement and selectively expand our acreage position and pursue growth opportunities. In the event our cash flows, proceeds from potential asset dispositions and other capital resources are not sufficient to fund our capital spending budget, we may access the capital markets. In the event we are unable to raise additional capital on acceptable terms, we may reduce our capital spending.
The credit markets are undergoing significant volatility. Many financial institutions have liquidity concerns, prompting government intervention to mitigate pressure on the credit markets. Our exposure to the current credit market crisis includes our revolving credit agreement, counterparty risks related to our trade credit and risks related to our cash investments. Should the current tightness in the credit markets continue, future extensions of credit may contain terms that are less favorable than those of our current credit agreement.
Current market conditions also elevate the concern over our cash deposits, which totaled approximately $691.8 million as of the date of this report, but fluctuate throughout the year, and counterparty risks related to our trade credit. Our cash accounts and deposits with any financial institution that exceed the amount insured by the
56
Table of Contents
Federal Deposit Insurance Corporation are at risk in the event one of these financial institutions fails. We sell our crude oil, natural gas and NGLs to a variety of purchasers. Some of these parties are not as creditworthy as we are and may experience liquidity problems. Nonperformance by a trade creditor could result in losses.
The table below sets forth our contractual cash obligations as of December 31, 2011:
| Total | 2012 | 2013-2014 | 2015-2016 | and after | ||||||||||||||||
| (In thousands) | ||||||||||||||||||||
| Contractual Cash Obligations |
||||||||||||||||||||
| Long-term debt (1) |
$ | 202,000 | $ | — | $ | — | $ | 202,000 | $ | — | ||||||||||
| Operating leases |
2,527 | 1,285 | 1,199 | 43 | — | |||||||||||||||
|
|
|
|
|
|
|
|
|
|
|
|||||||||||
| Total contractual cash obligations |
$ | 204,527 | $ | 1,285 | $ | 1,199 | $ | 202,043 | $ | — | ||||||||||
|
|
|
|
|
|
|
|
|
|
|
|||||||||||
| (1) | Note this was paid off in February 2012 with proceeds from the Halcón recapitalization. Does not reflect the $275.0 million convertible note issued in February 2012 in the Halcón recapitalization, which matures in 2017. |
| Item 7A. | Quantitative and Qualitative Disclosures About Market Risk |
The carrying amounts reported in our consolidated balance sheets for cash and cash equivalents, trade receivables and payables, installment notes and variable rate long-term debt approximate their fair values.
Interest Rate Sensitivity
We are exposed to changes in interest rates. Changes in interest rates affect the interest earned on our cash and cash equivalents and the interest rate paid on our borrowings. In March 2011, we entered into an interest rate swap agreement to manage our cash flow on refinanced debt. Under the agreement, $50.0 million of our debt as of December 31, 2011 is subject to a fixed rate of 2.51%, with a swap floating rate of 3-month LIBOR, subject to a 2% floor. The interest rate swap was paid off in connection with the Halcón closing on February 8, 2012. See Note N to the Consolidated Financial Statements for additional information.
Our long-term debt as of December 31, 2011, is denominated in U.S. dollars. Our debt has been issued at variable rates, and as such, interest expense would be impacted by interest rate changes. The revolving credit facility entered into March 2011 is not subject to LIBOR floors, and the impact of 100-basis point increase in LIBOR interest rates would have resulted in an increase in interest expense of approximately $1.3 million annually based on the $127.0 million balance of our revolver as of December 31, 2011. LIBOR rates were less
57
Table of Contents
than 100-basis points as of December 31, 2011, so any decrease in interest rates would have resulted in a nominal decrease in interest expense under our revolver as of December 31, 2011. The term loan portion of our credit facility includes a 2.0% LIBOR floor. The impact of a 100-basis point increase in LIBOR rates above our 2.0% floor would result in an increase in interest expense under our term loan of $0.3 million annually based on the $25.0 million balance of our term loan which is not subject to the interest rate swap as of December 31, 2011. A 100-basis point decrease would have no effect on interest expense under our term loan until the LIBOR rate exceeds 2.0%.
Commodity Price Risk
Our revenue, profitability and future growth depend substantially on prevailing prices for oil and natural gas. Prices also affect the amount of cash flow available for capital expenditures and our ability to borrow and raise additional capital. Lower prices may also reduce the amount of oil and natural gas that we can economically produce. We currently sell most of our oil and natural gas production under market price contracts.
To reduce exposure to fluctuations in oil and natural gas prices and to achieve more predictable cash flow, and as required by our lenders, we utilize various derivative strategies to manage the price received for a portion of our future oil and natural gas production. We have not established derivatives that create potential liability to us covering volumes in excess of our expected production.
Our open crude oil and natural gas derivative positions at December 31, 2011 consist of put/call “collars,” sold put options and bare purchased put options. A collar consists of a sold call, which establishes a maximum price we will receive for the volumes under contract and a purchased put that establishes a minimum price. A sold put option limits the exposure of the counterparty’s risk should the price fall below the strike price. Sold put options limit the effectiveness of purchased put options at the low end of the put/call collars to market prices in excess of the strike price of the put option sold. Bare purchased put options, also called “bare floors,” provide a floor price without a corresponding ceiling. The details of our oil and natural gas derivative positions are provided in the following table:
| Crude Oil (Bbls) | Natural Gas (Mmbtu) | |||||||||||||||||||||||
| Collars | Collars | |||||||||||||||||||||||
| Floors | Ceilings | Put Options Sold | Floors | Ceilings | Bare Floors | |||||||||||||||||||
| Year |
Per Day | Price | Per Day | Price | Per Day | Price | Per Day | Price | Per Day | Price | Per Day | Price | ||||||||||||
| Q1 2012 |
2,000 | $80.00 | 2,000 | $105.00 | 1,000 | $70.00 | — | — | — | — | 6,700 | $4.35 | ||||||||||||
| Q2 2012 |
2,000 | $80.00 | 2,000 | $105.00 | 1,000 | $70.00 | 5,000 | $4.00 | 5,000 | $6.00 | — | — | ||||||||||||
| Q3 2012 |
1,900 | $92.63 | 1,900 | $105.66 | 1,238 | $70.00 | 5,000 | $4.00 | 5,000 | $6.00 | — | — | ||||||||||||
| Q4 2012 |
1,750 | $92.14 | 1,750 | $104.83 | 1,138 | $70.00 | — | — | — | — | — | — | ||||||||||||
| Q1 2013 |
1,800 | $95.28 | 1,800 | $101.39 | 1,450 | $70.00 | — | — | — | — | — | — | ||||||||||||
| Q2 2013 |
1,650 | $95.00 | 1,650 | $99.93 | 1,325 | $70.00 | — | — | — | — | — | — | ||||||||||||
| Q3 2013 |
1,600 | $95.00 | 1,600 | $99.94 | — | — | — | — | — | — | — | — | ||||||||||||
| Q4 2013 |
1,550 | $95.00 | 1,550 | $99.71 | — | — | — | — | — | — | — | — | ||||||||||||
| Q1 2014 |
1,600 | $95.00 | 1,600 | $100.03 | 1,600 | $70.00 | — | — | — | — | — | — | ||||||||||||
| Q2 2014 |
1,500 | $95.00 | 1,500 | $99.13 | 1,500 | $70.00 | — | — | — | — | — | — | ||||||||||||
Based on December 31, 2011, NYMEX forward curves of natural gas and crude oil futures prices, adjusted for volatility by 123 and 300 basis points, we would expect to receive future cash payments of $0.3 million under our natural gas and crude oil derivative arrangements as they mature. If future prices of natural gas and crude oil were to decline by 10%, we would expect to receive future cash payments under our natural gas and crude oil derivative arrangements of $10.5 million, and if future prices were to increase by 10%, we would pay future cash payments of $12.7 million.
58
Table of Contents
| Item 8. | Financial Statements and Supplementary Data |
INDEX TO CONSOLIDATED FINANCIAL STATEMENTS
59
Table of Contents
REPORT OF INDEPENDENT REGISTERED PUBLIC ACCOUNTING FIRM
Board of Directors and Stockholders
Halcón Resources Corporation
We have audited the accompanying consolidated balance sheets of Halcón Resources Corporation (formerly RAM Energy Resources, Inc., a Delaware corporation) and subsidiaries (the “Company”) as of December 31, 2011 and 2010, and the related consolidated statements of operations, stockholders’ equity (deficit) and cash flows for each of the three years in the period ended December 31, 2011. These consolidated financial statements are the responsibility of the Company’s management. Our responsibility is to express an opinion on these consolidated financial statements based on our audits.
We conducted our audits in accordance with the standards of the Public Company Accounting Oversight Board (United States). Those standards require that we plan and perform the audits to obtain reasonable assurance about whether the consolidated financial statements are free of material misstatement. An audit includes examining, on a test basis, evidence supporting the amounts and disclosures in the consolidated financial statements. An audit also includes assessing the accounting principles used and significant estimates made by management, as well as evaluating the overall financial statement presentation. We believe that our audits provide a reasonable basis for our opinion.
In our opinion, the consolidated financial statements referred to above present fairly, in all material respects, the consolidated financial position of Halcón Resources Corporation and subsidiaries at December 31, 2011 and 2010, and the consolidated results of their operations and their cash flows for each of the three years in the period ended December 31, 2011, in conformity with accounting principles generally accepted in the United States of America.
We also have audited, in accordance with the standards of the Public Company Accounting Oversight Board (United States), the effectiveness of Halcón Resources Corporation and subsidiaries’ internal control over financial reporting as of December 31, 2011, based on criteria established in Internal Control—Integrated Framework issued by the Committee of Sponsoring Organizations of the Treadway Commission (COSO), and our report dated March 5, 2012 expressed an unqualified opinion on the effective operation of internal control over financial reporting.
/s/ UHY LLP
Houston, Texas
March 5, 2012
60
Table of Contents
Consolidated Balance Sheets
(In thousands, except share and per share amounts)
| As of December 31, | ||||||||
| 2011 | 2010 | |||||||
| ASSETS | ||||||||
| CURRENT ASSETS: |
||||||||
| Cash and cash equivalents |
$ | 49 | $ | 37 | ||||
| Accounts receivable: |
||||||||
| Oil and natural gas sales, net of allowance of $0 ($50 at December 31, 2010) |
9,519 | 9,797 | ||||||
| Joint interest operations, net of allowance of $280 ($479 at December 31, 2010) |
597 | 631 | ||||||
| Other, net of allowance of $14 ($48 at December 31, 2010) |
172 | 155 | ||||||
| Derivative assets |
260 | 1,340 | ||||||
| Prepaid expenses |
936 | 1,657 | ||||||
| Deferred tax asset |
2,601 | 3,526 | ||||||
| Inventory |
4,310 | 3,382 | ||||||
| Other current assets |
1,793 | 4 | ||||||
|
|
|
|
|
|||||
| Total current assets |
20,237 | 20,529 | ||||||
| PROPERTIES AND EQUIPMENT, AT COST: |
||||||||
| Proved oil and natural gas properties and equipment, using full cost accounting |
715,666 | 689,472 | ||||||
| Other property and equipment |
9,979 | 10,072 | ||||||
|
|
|
|
|
|||||
| 725,645 | 699,544 | |||||||
| Less accumulated depreciation, amortization and impairment |
(509,126 | ) | (489,634 | ) | ||||
|
|
|
|
|
|||||
| Total properties and equipment |
216,519 | 209,910 | ||||||
| OTHER ASSETS: |
||||||||
| Deferred tax asset |
24,102 | 31,001 | ||||||
| Deferred loan costs, net of accumulated amortization of $1,053 ($5,012 at December 31, 2010) |
5,966 | 2,609 | ||||||
| Other |
978 | 952 | ||||||
|
|
|
|
|
|||||
| Total assets |
$ | 267,802 | $ | 265,001 | ||||
|
|
|
|
|
|||||
| LIABILITIES AND STOCKHOLDERS’ EQUITY | ||||||||
| CURRENT LIABILITIES: |
||||||||
| Accounts payable: |
||||||||
| Trade |
$ | 12,890 | $ | 17,149 | ||||
| Oil and natural gas proceeds due others |
8,564 | 9,414 | ||||||
| Other |
359 | 452 | ||||||
| Accrued liabilities: |
||||||||
| Compensation |
1,600 | 1,948 | ||||||
| Interest |
464 | 2,448 | ||||||
| Income taxes |
406 | 699 | ||||||
| Other |
778 | 10 | ||||||
| Derivative liabilities |
265 | — | ||||||
| Asset retirement obligations |
1,010 | 639 | ||||||
| Long-term debt due within one year |
— | 127 | ||||||
|
|
|
|
|
|||||
| Total current liabilities |
26,336 | 32,886 | ||||||
| DERIVATIVE LIABILITIES |
805 | 203 | ||||||
| LONG-TERM DEBT |
202,000 | 196,965 | ||||||
| ASSET RETIREMENT OBLIGATIONS |
32,703 | 30,770 | ||||||
| OTHER LONG-TERM LIABILITIES |
10 | 10 | ||||||
| COMMITMENTS AND CONTINGENCIES |
||||||||
| STOCKHOLDERS’ EQUITY: |
||||||||
| Common stock, $0.0001 par value, 33,333,333 shares authorized, 27,694,583 and 27,532,610 shares issued, |
||||||||
| 26,244,452 and 26,128,995 shares outstanding at December 31, 2011 and 2010, respectively |
3 | 3 | ||||||
| Additional paid-in capital |
229,414 | 226,047 | ||||||
| Treasury stock—1,450,131 shares (1,403,615 shares at December 31, 2010) at cost |
(7,159 | ) | (6,976 | ) | ||||
| Accumulated deficit |
(216,310 | ) | (214,907 | ) | ||||
|
|
|
|
|
|||||
| Stockholders’ equity |
5,948 | 4,167 | ||||||
|
|
|
|
|
|||||
| Total liabilities and stockholders’ equity |
$ | 267,802 | $ | 265,001 | ||||
|
|
|
|
|
|||||
The accompanying notes are an integral part of these consolidated financial statements.
61
Table of Contents
Consolidated Statements of Operations
(In thousands, except share and per share amounts)
| Years ended December 31, | ||||||||||||
| 2011 | 2010 | 2009 | ||||||||||
| REVENUES AND OTHER OPERATING INCOME: |
||||||||||||
| Oil and natural gas sales |
||||||||||||
| Oil |
$ | 82,968 | $ | 76,563 | $ | 66,281 | ||||||
| Natural gas |
10,673 | 20,265 | 20,818 | |||||||||
| NGLs |
9,880 | 14,156 | 11,068 | |||||||||
|
|
|
|
|
|
|
|||||||
| Total oil and natural gas sales |
103,521 | 110,984 | 98,167 | |||||||||
| Realized gains (losses) on derivatives |
(1,078 | ) | (5,193 | ) | 19,255 | |||||||
| Unrealized gains (losses) on derivatives |
5,269 | 6,386 | (30,561 | ) | ||||||||
| Other |
168 | 157 | 217 | |||||||||
|
|
|
|
|
|
|
|||||||
| Total revenues and other operating income |
107,880 | 112,334 | 87,078 | |||||||||
| OPERATING EXPENSES: |
||||||||||||
| Oil and natural gas production taxes |
5,740 | 6,063 | 5,320 | |||||||||
| Oil and natural gas production expenses |
33,330 | 33,891 | 37,455 | |||||||||
| Depreciation and amortization |
21,345 | 27,225 | 31,650 | |||||||||
| Accretion expense |
1,641 | 1,527 | 1,976 | |||||||||
| Impairment |
— | — | 47,613 | |||||||||
| Share-based compensation |
3,584 | 3,110 | 2,179 | |||||||||
| Restructuring costs |
1,071 | — | — | |||||||||
| General and administrative, overhead and other expenses, net of operator’s overhead fees |
17,179 | 14,799 | 16,667 | |||||||||
|
|
|
|
|
|
|
|||||||
| Total operating expenses |
83,890 | 86,615 | 142,860 | |||||||||
|
|
|
|
|
|
|
|||||||
| Operating income (loss) |
23,990 | 25,719 | (55,782 | ) | ||||||||
| OTHER INCOME (EXPENSE): |
||||||||||||
| Interest expense |
(17,373 | ) | (22,655 | ) | (18,590 | ) | ||||||
| Interest income |
5 | 27 | 82 | |||||||||
| Loss on interest rate derivatives |
(712 | ) | — | — | ||||||||
| Other income (expense) |
(511 | ) | 321 | (440 | ) | |||||||
|
|
|
|
|
|
|
|||||||
| INCOME (LOSS) BEFORE INCOME TAXES |
5,399 | 3,412 | (74,730 | ) | ||||||||
| INCOME TAX PROVISION (BENEFIT) |
6,802 | 995 | (16,347 | ) | ||||||||
|
|
|
|
|
|
|
|||||||
| Net income (loss) |
$ | (1,403 | ) | $ | 2,417 | $ | (58,383 | ) | ||||
|
|
|
|
|
|
|
|||||||
| BASIC INCOME (LOSS) PER SHARE |
$ | (0.05 | ) | $ | 0.09 | $ | (2.26 | ) | ||||
|
|
|
|
|
|
|
|||||||
| BASIC WEIGHTED AVERAGE SHARES OUTSTANDING |
26,258,230 | 26,142,060 | 25,867,019 | |||||||||
|
|
|
|
|
|
|
|||||||
| DILUTED INCOME (LOSS) PER SHARE |
$ | (0.05 | ) | $ | 0.09 | $ | (2.26 | ) | ||||
|
|
|
|
|
|
|
|||||||
| DILUTED WEIGHTED AVERAGE SHARES OUTSTANDING |
26,258,230 | 26,142,060 | 25,867,019 | |||||||||
|
|
|
|
|
|
|
|||||||
The accompanying notes are an integral part of these consolidated financial statements.
62
Table of Contents
Consolidated Statements of Stockholders’ Equity (Deficit)
Years ended December 31, 2011, 2010, and 2009
(In thousands, except share amounts)
| Common Stock | Additional Paid-In Capital |
Treasury Stock | Accumulated Deficit |
Stockholders’ Equity (Deficit) |
||||||||||||||||||||||||
| Shares | Amount | Shares | Amount | |||||||||||||||||||||||||
| BALANCE, January 1, 2009 |
26,474,525 | $ | 3 | $ | 220,805 | 297,147 | $ | (4,027 | ) | $ | (158,941 | ) | $ | 57,840 | ||||||||||||||
| Long term incentive plan grants |
447,667 | — | — | — | — | — | — | |||||||||||||||||||||
| Long term incentive plan forfeitures |
(5,967 | ) | — | — | — | — | — | — | ||||||||||||||||||||
| Net loss |
— | — | — | — | — | (58,383 | ) | (58,383 | ) | |||||||||||||||||||
| Repurchase of stock |
— | — | — | 7,180 | (28 | ) | — | (28 | ) | |||||||||||||||||||
| Receipt of common stock for settlement of contingent receivable |
— | — | — | 961,270 | (2,134 | ) | — | (2,134 | ) | |||||||||||||||||||
| Share-based compensation |
— | — | 2,179 | — | — | — | 2,179 | |||||||||||||||||||||
|
|
|
|
|
|
|
|
|
|
|
|
|
|
|
|||||||||||||||
| BALANCE, December 31, 2009 |
26,916,225 | 3 | 222,984 | 1,265,597 | (6,189 | ) | (217,324 | ) | (526 | ) | ||||||||||||||||||
| Long term incentive plan grants |
623,885 | — | — | — | — | — | — | |||||||||||||||||||||
| Long term incentive plan forfeitures |
(7,500 | ) | — | — | — | — | — | — | ||||||||||||||||||||
| Net income |
— | — | — | — | — | 2,417 | 2,417 | |||||||||||||||||||||
| Repurchase of stock |
— | — | — | 138,018 | (787 | ) | — | (787 | ) | |||||||||||||||||||
| Share-based compensation |
— | — | 3,063 | — | — | — | 3,063 | |||||||||||||||||||||
|
|
|
|
|
|
|
|
|
|
|
|
|
|
|
|||||||||||||||
| BALANCE, December 31, 2010 |
27,532,610 | 3 | 226,047 | 1,403,615 | (6,976 | ) | (214,907 | ) | 4,167 | |||||||||||||||||||
| Long term incentive plan grants |
279,907 | — | — | — | — | — | — | |||||||||||||||||||||
| Long term incentive plan forfeitures |
(117,934 | ) | — | — | — | — | — | — | ||||||||||||||||||||
| Net loss |
— | — | — | — | — | (1,403 | ) | (1,403 | ) | |||||||||||||||||||
| Repurchase of stock |
— | — | — | 46,516 | (183 | ) | — | (183 | ) | |||||||||||||||||||
| Share-based compensation |
— | — | 3,367 | — | — | — | 3,367 | |||||||||||||||||||||
|
|
|
|
|
|
|
|
|
|
|
|
|
|
|
|||||||||||||||
| BALANCE, December 31, 2011 |
27,694,583 | $ | 3 | $ | 229,414 | 1,450,131 | $ | (7,159 | ) | $ | (216,310 | ) | $ | 5,948 | ||||||||||||||
|
|
|
|
|
|
|
|
|
|
|
|
|
|
|
|||||||||||||||
The accompanying notes are an integral part of these consolidated financial statements.
63
Table of Contents
Consolidated Statements of Cash Flows
(In thousands)
| Years ended December 31, | ||||||||||||
| 2011 | 2010 | 2009 | ||||||||||
| OPERATING ACTIVITIES: |
||||||||||||
| Net income (loss) |
$ | (1,403 | ) | $ | 2,417 | $ | (58,383 | ) | ||||
| Adjustments to reconcile net income (loss) to net cash provided by operating activities- |
||||||||||||
| Depreciation and amortization |
21,345 | 27,225 | 31,650 | |||||||||
| Amortization of deferred loan costs |
3,663 | 2,088 | 1,642 | |||||||||
| Non-cash interest |
362 | 3,086 | 1,605 | |||||||||
| Accretion expense |
1,641 | 1,527 | 1,976 | |||||||||
| Impairment |
— | — | 47,613 | |||||||||
| Unrealized (gain) loss on derivatives, net of premium amortization |
(3,460 | ) | (1,498 | ) | 32,147 | |||||||
| Unrealized loss on interest rate derivatives |
506 | — | — | |||||||||
| Deferred income tax provision (benefit) |
6,549 | 577 | (16,865 | ) | ||||||||
| Other expense (income) |
193 | (574 | ) | 448 | ||||||||
| Share-based compensation |
3,584 | 3,110 | 2,179 | |||||||||
| Restructuring costs |
90 | — | — | |||||||||
| Loss (gain) on disposal of other property, equipment and subsidiary |
(60 | ) | (38 | ) | 35 | |||||||
| Changes in operating assets and liabilities- |
||||||||||||
| Accounts receivable |
295 | 3,704 | (650 | ) | ||||||||
| Prepaid expenses, inventory and other assets |
(231 | ) | 1,857 | 905 | ||||||||
| Derivative premiums |
4,889 | (4,468 | ) | (1,781 | ) | |||||||
| Accounts payable and proceeds due others |
(5,219 | ) | 543 | (10,641 | ) | |||||||
| Accrued liabilities and other |
(2,322 | ) | (1,527 | ) | (15,387 | ) | ||||||
| Restricted cash |
— | — | 16,000 | |||||||||
| Income taxes payable |
(294 | ) | 44 | 256 | ||||||||
| Asset retirement obligations |
(293 | ) | (198 | ) | (377 | ) | ||||||
|
|
|
|
|
|
|
|||||||
| Total adjustments |
31,238 | 35,458 | 90,755 | |||||||||
|
|
|
|
|
|
|
|||||||
| Net cash provided by operating activities |
29,835 | 37,875 | 32,372 | |||||||||
| INVESTING ACTIVITIES: |
||||||||||||
| Payments for oil and natural gas properties and equipment |
(25,214 | ) | (33,535 | ) | (29,871 | ) | ||||||
| Proceeds from sales of oil and natural gas properties |
462 | 49,366 | 6,120 | |||||||||
| Payments for other property and equipment |
(672 | ) | (865 | ) | (604 | ) | ||||||
| Proceeds from sales of other property and equipment |
48 | 4 | 434 | |||||||||
|
|
|
|
|
|
|
|||||||
| Net cash provided by (used in) investing activities |
(25,376 | ) | 14,970 | (23,921 | ) | |||||||
|
|
|
|
|
|
|
|||||||
| FINANCING ACTIVITIES: |
||||||||||||
| Payments on long-term debt |
(245,621 | ) | (98,490 | ) | (36,156 | ) | ||||||
| Proceeds from borrowings on long-term debt |
250,167 | 46,340 | 30,022 | |||||||||
| Payments for deferred loan costs |
(7,825 | ) | — | (2,324 | ) | |||||||
| Payments for equity issuance costs |
(985 | ) | — | — | ||||||||
| Stock repurchased |
(183 | ) | (787 | ) | (28 | ) | ||||||
|
|
|
|
|
|
|
|||||||
| Net cash used in financing activities |
(4,447 | ) | (52,937 | ) | (8,486 | ) | ||||||
|
|
|
|
|
|
|
|||||||
| INCREASE (DECREASE) IN CASH AND CASH EQUIVALENTS |
12 | (92 | ) | (35 | ) | |||||||
| CASH AND CASH EQUIVALENTS, beginning of year |
37 | 129 | 164 | |||||||||
|
|
|
|
|
|
|
|||||||
| CASH AND CASH EQUIVALENTS, end of year |
$ | 49 | $ | 37 | $ | 129 | ||||||
|
|
|
|
|
|
|
|||||||
| SUPPLEMENTAL CASH FLOW INFORMATION: |
||||||||||||
| Cash paid for income taxes |
$ | 554 | $ | 380 | $ | 303 | ||||||
|
|
|
|
|
|
|
|||||||
| Cash paid for interest |
$ | 15,326 | $ | 17,988 | $ | 13,428 | ||||||
|
|
|
|
|
|
|
|||||||
| DISCLOSURE OF NON CASH INVESTING AND FINANCING ACTIVITIES: |
||||||||||||
| Asset retirement obligations |
$ | 956 | $ | 3,006 | $ | (4,724 | ) | |||||
|
|
|
|
|
|
|
|||||||
| Receipt of common stock for settlement of contingent receivable |
$ | — | $ | — | $ | 2,134 | ||||||
|
|
|
|
|
|
|
|||||||
The accompanying notes are an integral part of these consolidated financial statements.
64
Table of Contents
Notes to Consolidated Financial Statements
December 31, 2011 and 2010
| A– | SUMMARY OF SIGNIFICANT ACCOUNTING POLICIES, ORGANIZATION AND BASIS OF PRESENTATION |
| 1. | Nature of Operations and Organization |
On November 29, 2007, RAM Energy Resources, Inc. (“RAM”) acquired Ascent Energy Inc., an acquisition that significantly increased the size of RAM.
On February 8, 2012, RAM sold RAM’s common stock and issued a senior convertible promissory note together with five-year warrants to purchase shares of RAM’s common stock to Halcón Resources, LLC (“Halcón LLC”) for an aggregate of $550.0 million, resulting in a change of control. Subsequent to completion of the transaction, RAM’s name was changed to Halcón Resources Corporation (the “Company”) and the Company effected a one-for-three reverse stock split. See Note N for further discussion of the transaction.
The Company operates exclusively in the upstream segment of the oil and gas industry with activities including the drilling, completion, and operation of oil and gas wells. The Company conducts the majority of its operations in the states of Texas, Louisiana and Oklahoma. The Company also owns and operates oil and natural gas properties in New Mexico, Mississippi and West Virginia.
| 2. | Basis of Presentation |
The consolidated financial statements include the accounts of the Company and its wholly-owned subsidiaries. All significant intercompany balances and transactions have been eliminated.
| 3. | Properties and Equipment |
The Company follows the full cost method of accounting for oil and natural gas operations. Under this method all productive and nonproductive costs incurred in connection with the acquisition, exploration, and development of oil and natural gas reserves are capitalized. No gains or losses are recognized upon the sale or other disposition of oil and natural gas properties except in transactions that would significantly alter the relationship between capitalized costs and proved reserves. The costs of unevaluated oil and natural gas properties are excluded from the amortizable base until the time that either proven reserves are found or it has been determined that such properties are impaired. As properties become evaluated, the related costs transfer to proved oil and natural gas properties using full cost accounting. All capitalized costs were included in the amortization base as of December 31, 2011 and 2010.
Under the full cost method, the net book value of oil and natural gas properties, less related deferred income taxes, may not exceed the estimated after-tax future net revenues from proved oil and natural gas properties, discounted at 10% (the “Ceiling Limitation”). In arriving at estimated future net revenues, estimated lease operating expenses, development costs, and certain production-related and ad valorem taxes are deducted. In calculating future net revenues, prices and costs are held constant indefinitely, except for changes that are fixed and determinable by existing contracts. The net book value is compared to the Ceiling Limitation on a quarterly and yearly basis. The excess, if any, of the net book value above the Ceiling Limitation is charged to expense in the period in which it occurs and is not subsequently reinstated. At December 31, 2011, 2010 and 2009, the net book value of the Company’s oil and natural gas properties did not exceed the Ceiling Limitation. At March 31, 2009, the net book value of the Company’s oil and natural gas properties exceeded the Ceiling Limitation resulting in a reduction in the carrying value of the Company’s oil and natural gas properties of $47.6 million. The after-tax effect of this reduction was $30.3 million.
The Company has capitalized internal costs of approximately $4.3 million, $3.1 million and $3.2 million for the years ended December 31, 2011, 2010, and 2009, respectively. Such capitalized costs include salaries and related benefits of individuals directly involved in the Company’s acquisition, exploration and development activities based on the percentage of their time devoted to such activities.
65
Table of Contents
Other property and equipment consists principally of furniture, equipment and leasehold improvements. Other property and equipment and related accumulated depreciation and amortization are relieved upon retirement or sale and the gain or loss is included in the Company’s statements of operations. Renewals and replacements that extend the useful life of property and equipment are treated as capital additions. Accumulated depreciation of other property and equipment at December 31, 2011 and 2010 is approximately $7.1 million and $6.7 million, respectively.
In accordance with authoritative guidance on accounting for the impairment or disposal of long-lived assets, as set forth in Topic 360 of the Accounting Standards CodificationTM (the “Codification”) implemented by the Financial Accounting Standards Board (the “FASB”), the Company assesses the recoverability of the carrying value of its non-oil and gas long-lived assets when events occur that indicate an impairment in value may exist. An impairment loss is indicated if the sum of the expected undiscounted future net cash flows is less than the carrying amount of the assets. If this occurs, an impairment loss is recognized for the amount by which the carrying amount of the assets exceeds the estimated fair value of the asset.
| 4. | Depreciation and Amortization |
All capitalized costs of oil and natural gas properties and equipment, including the estimated future costs to develop proved reserves, are amortized using the unit-of-production method based on total proved reserves. Depreciation of other equipment is computed on the straight-line method over the estimated useful lives of the assets, which range from three to twenty years. Amortization of leasehold improvements is computed based on the straight-line method over the term of the associated lease or estimated useful life, whichever is shorter.
| 5. | Natural Gas Sales and Gas Imbalances |
The Company follows the entitlement method of accounting for natural gas sales, recognizing as revenues only its net interest share of all production sold. Any amount attributable to the sale of production in excess of or less than the Company’s net interest is recorded as a gas balancing asset or liability. At December 31, 2011 and 2010 the Company’s gas imbalances were immaterial.
| 6. | Cash Equivalents |
All highly liquid unrestricted investments with a maturity of three months or less when purchased are considered to be cash equivalents.
| 7. | Credit and Market Risk |
The Company sells oil and natural gas to various customers and participates with other parties in the drilling, completion and operation of oil and natural gas wells. Joint interest and oil and natural gas sales receivables related to these operations are generally unsecured. In 2011, 2010, and 2009 approximately 68%, 61% and 61%, respectively, of total revenues were to one customer. The Company provides an allowance for doubtful accounts for certain purchasers and certain joint interest owners’ receivable balances when the Company believes the receivable balance may not be collected. Accounts receivable are presented net of the related allowance for doubtful accounts.
In 2011 and 2010 the Company had cash deposits in certain banks that at times exceeded the maximum insured by the Federal Deposit Insurance Corporation. The Company monitors the financial condition of the banks and has experienced no losses on these accounts.
| 8. | Other Assets |
Costs incurred in advance of closing a new credit facility, debt issuance or equity offering are capitalized and deferred until the transaction is consummated, at which time the assets are properly recorded as deferred loan costs, debt issuance costs or a reduction against the proceeds recorded in stockholders’
66
Table of Contents
equity. Costs are expensed when it is probable that the debt or equity financing will not be consummated. At December 31, 2011, $1.8 million of costs related to the issuance of convertible debt, common stock and warrants were recorded as deferred costs awaiting consummation of the transactions. See Note N for additional discussion of these transactions.
| 9. | Deferred Loan Costs |
Deferred loan costs are stated at cost, net of amortization, computed using the straight-line method over the term of the related loan agreement, which approximates the interest method.
In March 2011, the Company entered into a revolving credit facility and a second lien term facility, which replaced the $500.0 million facility in place at December 31, 2010. See Note C. In accordance with Topic 470 of the Codification, the Company expensed the remaining debt loan costs associated with the previous facility totaling approximately $2.7 million in the first quarter of 2011.
The estimated future amortization expense on the revolving credit facility and the second lien term facility is as follows (in thousands):
| Year ending December 31, |
||||
| 2012 |
$ | 1,344 | ||
| 2013 |
$ | 1,344 | ||
| 2014 |
$ | 1,343 | ||
| 2015 |
$ | 1,343 | ||
| 2016 |
$ | 592 |
In February 2012, the Company entered into a new credit agreement, which replaced the $250.0 million revolving credit facility and the $75.0 million second lien term loan facility in place at December 31, 2011 and issued a senior convertible promissory note. See Note N for additional discussion on subsequent events related to debt. In accordance with Topic 470 of the Codification, the Company was required to expense $6.0 million of existing deferred loan costs during the first quarter of 2012 upon retirement of the existing debt. The deferred loan costs incurred to issue the new debt instruments will be amortized over the term of the related new debt.
| 10. | General and Administrative Expense |
The Company receives fees for the operation of jointly owned oil and natural gas properties and records such reimbursements as reductions of general and administrative expense. Such fees totaled approximately $0.5 million, $0.6 million and $0.6 million for the years ended December 31, 2011, 2010, and 2009, respectively.
| 11. | Use of Estimates |
The preparation of financial statements in conformity with accounting principles generally accepted in the United States of America requires management to make estimates and assumptions that affect the reported amounts of assets and liabilities and disclosure of contingent assets and liabilities at the date of the financial statements and the reported amounts of revenues and expenses during the reporting period. Actual results could differ from those estimates. Estimates and assumptions that, in the opinion of management of the Company, are significant include oil and natural gas reserves, amortization relating to oil and natural gas properties, asset retirement obligations, derivative instrument valuations and income taxes. The Company evaluates its estimates and assumptions on a regular basis. Estimates are based on historical experience and various other assumptions that are believed to be reasonable under the circumstances, the results of which form the basis for making judgments about the carrying values of assets and liabilities that are not readily apparent from other sources. Actual results may differ from these estimates used in preparation of the Company’s financial statements. In addition, alternatives can exist among various accounting methods. In such cases, the choice of accounting method can have a significant impact on reported amounts.
67
Table of Contents
| 12. | Oil and Natural Gas Reserves Estimates |
Independent petroleum and geological engineers prepare estimates of the Company’s oil and natural gas reserves. Proved reserves, estimated future net revenues and the present value of the Company’s reserves are estimated based upon a combination of historical data and estimates of future activity. Consistent with Securities and Exchange Commission’s (“SEC”) requirements, the Company has based its estimate of proved reserves on spot prices on the date of the estimate for periods prior to December 31, 2009. However, in accordance with the SEC’s Release No. 33-8995, “Modernization of Oil and Gas Reporting,” and Topic 932 of the Codification, at December 31, 2009 and for subsequent periods, the Company calculates its estimate of proved reserves using a twelve month average price, calculated as the unweighted arithmetic average of the first-day-of-the-month price for each period within the twelve-month period prior to the end of the reporting period. The reserve estimates are used in the assessment of the Company’s Ceiling Limitation and in calculating depletion, depreciation and amortization. Significant assumptions are required in the valuation of proved oil and natural gas reserves which, as described herein, may affect the amount at which oil and natural gas properties are recorded. Actual results could differ materially from these estimates.
| 13. | Fair Value of Financial Instruments |
Cash and cash equivalents, trade receivables and payables, and installment notes: The carrying amounts reported on the consolidated balance sheets approximate fair value due to the short-term nature of these instruments.
Credit facilities: The carrying amount reported on the consolidated balance sheets approximates fair value because this debt instrument carries a variable interest rate based on market interest rates.
Derivative contracts: The carrying amount reported on the consolidated balance sheets is the estimated fair value of the Company’s derivative instruments. See Notes I and J.
Share appreciation rights (“SARs”): The carrying amount reported on the consolidated balance sheets is the estimated fair value of the Company’s SARs. See Note I.
| 14. | Reclassifications |
Certain reclassifications of previously reported amounts for 2010 and 2009 have been made to conform to the 2011 presentation. These reclassifications had no effect on net income or loss or cash flows from operating, investing or financing activities.
| 15. | Derivatives |
The Company recognizes all derivative instruments as either assets or liabilities in the balance sheet at fair value in accordance with authoritative guidance as set forth in Topic 815 of the Codification.
During 2011, 2010 and 2009, the Company entered into numerous derivative contracts to reduce the impact of oil and natural gas price fluctuations and as required by the terms of its credit facilities. See Notes C and J. During the first quarter of 2011, the Company also entered into interest rate swaps to manage the impact of interest rate fluctuations. The Company did not designate these transactions as hedges. Accordingly, all gains and losses on the derivative instruments during 2011, 2010 and 2009 have been recorded in the statements of operations.
68
Table of Contents
| 16. | Income (Loss) per Common Share |
Basic and diluted income (loss) per share is computed by dividing net income (loss) by the weighted average number of common shares outstanding for the period. A reconciliation of net income (loss) and weighted average shares used in computing basic and diluted net income (loss) per share are as follows for the years ended December 31 (in thousands, except share and per share amounts):
| 2011 | 2010 | 2009 | ||||||||||
| Net income (loss) |
$ | (1,403 | ) | $ | 2,417 | $ | (58,383 | ) | ||||
|
|
|
|
|
|
|
|||||||
| Weighted average shares – basic |
26,258,230 | 26,142,060 | 25,867,019 | |||||||||
| Dilutive effect |
— | — | — | |||||||||
|
|
|
|
|
|
|
|||||||
| Weighted average shares - dilutive |
26,258,230 | 26,142,060 | 25,867,019 | |||||||||
|
|
|
|
|
|
|
|||||||
| Basic income (loss) per share |
$ | (0.05 | ) | $ | 0.09 | $ | (2.26 | ) | ||||
|
|
|
|
|
|
|
|||||||
| Diluted income (loss) per share |
$ | (0.05 | ) | $ | 0.09 | $ | (2.26 | ) | ||||
|
|
|
|
|
|
|
|||||||
On February 10, 2012, the Company effected a one-for-three reverse stock split. All share and per share information included for all periods presented in these financial statements reflects the reverse stock split.
| 17. | Asset Retirement Obligations |
Authoritative guidance, set forth in Topic 410 of the Codification, addresses financial accounting and reporting for obligations associated with the retirement of tangible long-lived assets and the associated asset retirement costs. The authoritative guidance requires that the fair value of a liability for an asset retirement obligation be recognized in the period in which it is incurred if a reasonable estimate of fair value can be made, and that the associated asset retirement costs be capitalized as part of the carrying amount of the long-lived asset. The Company determines its asset retirement obligation on its oil and gas properties by calculating the present value of the estimated cash flows related to the estimated liability. Periodic accretion of the discount of the estimated liability on the Company’s oil and natural gas properties is recorded in the statements of operations.
The Company recorded the following activity related to the asset retirement obligations for the years ended December 31, 2011 and 2010 (in thousands):
| 2011 | 2010 | |||||||
| Liability for asset retirement obligations, beginning of year |
$ | 31,409 | $ | 27,074 | ||||
| Accretion expense |
1,641 | 1,527 | ||||||
| Change in estimates |
970 | 3,475 | ||||||
| Obligations for wells acquired and wells drilled |
207 | 191 | ||||||
| Obligations for wells sold or retired |
(514 | ) | (858 | ) | ||||
|
|
|
|
|
|||||
| Liability for asset retirement obligations, end of year |
33,713 | 31,409 | ||||||
| Less: current asset retirement obligation |
1,010 | 639 | ||||||
|
|
|
|
|
|||||
| Long-term asset retirement obligations |
$ | 32,703 | $ | 30,770 | ||||
|
|
|
|
|
|||||
| 18. | Income Taxes |
The Company accounts for income taxes under the liability method as prescribed by authoritative guidance set forth in Topic 740 of the Codification. Deferred tax liabilities and assets are determined based on the difference between the financial statement and tax basis of assets and liabilities using enacted rates expected to be in effect during the year in which the basis differences reverse. The realizability of deferred tax assets are evaluated quarterly and a valuation allowance is established to reduce the deferred tax assets if it is more likely than not that the related tax benefits will not be realized in the Company’s tax returns.
69
Table of Contents
| 19. | Uncertain Tax Positions |
The Company follows guidance in Topic 740 of the Codification for its accounting for uncertain tax positions. Topic 740 prescribes guidance for the financial statement recognition and measurement of a tax position taken or expected to be taken in a tax return. To recognize a tax position, the Company determines whether it is more-likely-than-not that the tax position will be sustained upon examination, including resolution of any related appeals or litigation, based solely on the technical merits of the position. A tax position that meets the more-likely-than-not threshold is measured to determine the amount of benefit to be recognized in the financial statements. The amount of tax benefit recognized with respect to any tax position is measured as the largest amount of benefit that is greater than 50 percent likely of being realized upon settlement.
The Company has no liability for unrecognized tax benefits recorded as of December 31, 2011 and 2010. Accordingly, there is no amount of unrecognized tax benefits that, if recognized, would affect the effective tax rate and there is no amount of interest or penalties currently recognized in the statement of operations or statement of financial position as of December 31, 2011. In addition, the Company does not believe that there are any positions for which it is reasonably possible that the total amounts of unrecognized tax benefits will significantly increase or decrease within the next twelve months. The Company recognizes related interest and penalties as a component of income tax expense.
Tax years open for audit by federal tax authorities as of December 31, 2011 are the years ended December 31, 2008, 2009, 2010 and 2011. Tax years ending prior to 2008 are open for audit to the extent that net operating losses generated in those years are being carried forward or utilized in an open year.
| 20. | New Accounting Pronouncements |
In December 2010, the FASB issued an update to authoritative guidance, as set forth in Topic 805 of the Codification, relating to business combinations. This update provides clarification requiring public companies that have completed material acquisitions to disclose the revenue and earnings of the combined business as if the acquisition took place at the beginning of the comparable prior annual reporting period, and also expands the supplemental pro forma disclosures to include a description of the nature and amount of material, non-recurring pro forma adjustments directly attributable to the business combination included in the reported pro forma revenue and earnings. The Company will be required to apply this guidance prospectively for business combinations for which the acquisition date is on or after January 1, 2011. Adoption of this guidance on January 1, 2011 did not have a material impact on the Company’s financial position or statement of operations.
In May 2011, the FASB issued Accounting Standards Update (“ASU”) No. 2011-04, “Amendments to Achieve Common Fair Value Measurement and Disclosure Requirements in U.S. GAAP and International Financial Accounting Reporting Standards (“IFRS”)”. This pronouncement was issued to provide a consistent definition of fair value and ensure that the fair value measurement and disclosure requirements are similar between U.S. GAAP and IFRS. ASU 2011-04 changes certain fair value measurement principles and enhances the disclosure requirements particularly for Level 3 fair value measurements. This update is effective for reporting periods beginning on or after December 15, 2011. The adoption of ASU 2011-04 is not expected to have a significant impact on the Company’s financial position or results of operations.
In June 2011, the FASB issued ASU No. 2011-05, “Presentation of Comprehensive Income”. ASU 2011-05 eliminates the option to report other comprehensive income and its components in the statement of changes in stockholders’ equity and requires an entity to present the total of comprehensive income, the components of net income and the components of other comprehensive income either in a single continuous statement or in two separate but consecutive statements. This update is effective for fiscal years, and interim periods within those years beginning after December 15, 2011. In December 2011, the FASB issued ASU No. 2011-12, which becomes effective at the same time as ASU 2011-05, to defer the effective date of
70
Table of Contents
provisions of ASU 2011-05 that relate to the presentation of reclassification adjustments. Adoption of ASU 2011-05 or ASU 2011-12 will not have an impact on the Company’s financial position or results of operations.
In December 2011, the FASB issued ASU No. 2011-11 which will enhance disclosures by requiring an entity to disclose information about netting arrangements, including rights of offset, to enable users of its financial statements to understand the effect of those arrangements on its financial position. This pronouncement was issued to facilitate comparison between financial statements prepared on the basis of U.S. GAAP and IFRS. This update is effective for annual and interim reporting periods beginning on or after January 1, 2013 and is to be applied retroactively for all comparative periods presented. The adoption of ASU 2011-11 is not expected to have a significant impact on the Company’s financial position or results of operations.
| 21. | Subsequent Events |
The Company evaluates events and transactions after the balance sheet date but before the financial statements are filed with the U.S. Securities and Exchange Commission. No events other than those described in these notes, have occurred that require disclosure. See Note N.
| B– | SIGNIFICANT DIVESTITURES & DIVESTITURE EXPENSES |
| 1. | North Texas Barnett Shale & Boonsville |
On December 8, 2010, the Company closed the sale on all of its oil and natural gas properties and related assets in the Boonsville and Newark East fields of Jack and Wise Counties in Texas to Milagro Producing, LLC for $43.7 million (prior to closing adjustments). The effective date under the agreement was October 1, 2010. In accordance with the full cost method of accounting, the Company did not record a gain or loss on the sale. The full cost pool at December 31, 2010 was reduced by the net proceeds, including closing adjustments, of $41.0 million. Proceeds of $16.0 million were used to reduce the outstanding balance on the Company’s revolving credit facility and the remaining net proceeds were used to reduce the outstanding balance on the Company’s term loan. See Note C.
| 2. | Eastern Oklahoma |
On December 30, 2010, the Company closed the sale on certain non-operated natural gas properties located in eastern Oklahoma for $8.0 million (prior to closing adjustments). The effective date under the agreement was December 1, 2010. The full cost pool at December 31, 2010 was reduced by the net proceeds, including closing adjustments, of $7.8 million in accordance with the full cost method of accounting. The proceeds were used to reduce outstanding borrowings under the Company’s revolving credit facility. See Note C.
| 3. | Electra/Burkburnett |
During 2011, the Company entered into an agreement in principle to sell a majority interest in the Company’s Electra/Burkburnett field to Argent Energy Trust, a recently formed Canadian energy trust. Argent filed a preliminary prospectus with Canadian regulatory authorities for an initial public offering (“IPO”) of its trust units in Canada. The sale of the Company’s Electra/Burkburnett field was contingent upon several conditions, including completion of the Argent IPO. The IPO was not completed and the agreement between the Company and Argent terminated during December 2011. The Company incurred approximately $2.4 million in related fees. Due to the termination of the agreement these fees are reflected in general and administrative expense during 2011.
71
Table of Contents
| C– | LONG-TERM DEBT |
Long-term debt at December 31 consists of the following (in thousands):
| 2011 | 2010 | |||||||
| Credit facilities |
$ | 202,000 | $ | 196,521 | ||||
| Accrued payment-in-kind interest |
— | 221 | ||||||
| Installment loan agreements |
— | 350 | ||||||
|
|
|
|
|
|||||
| 202,000 | 197,092 | |||||||
| Less amount due within one year |
— | 127 | ||||||
|
|
|
|
|
|||||
| $ | 202,000 | $ | 196,965 | |||||
|
|
|
|
|
|||||
The amounts of required principal payments as of December 31, 2011, are as follows (in thousands):
| 2012 |
$ | — | ||
| 2013 |
— | |||
| 2014 |
— | |||
| 2015 |
— | |||
| 2016 |
202,000 | |||
|
|
|
|||
| $ | 202,000 | |||
|
|
|
On February 8, 2012, the Company paid in full the outstanding balances under the revolving credit facility and the term loan facility and both facilities were terminated. Additionally, the Company entered into a new credit agreement in connection with the Halcón transaction. See Note N for additional discussion.
Credit Facilities
Credit Facilities. In March 2011, the Company entered into a $250.0 million first lien revolving credit facility and a $75.0 million second lien term loan facility, replacing the previous facility. SunTrust Bank is the administrative agent for the revolving facility, and Guggenheim Corporate Funding, LLC is the administrative agent for the term loan facility. The initial borrowing base under the revolving credit facility was $150.0 million. The borrowing base is reviewed and redetermined effective March 31 and September 30 of each year, and between scheduled redeterminations upon request. On September 30, 2011, the borrowing base was reaffirmed at $150.0 million based on the value of the Company’s proved reserves at June 30, 2011. Funds advanced under the revolving credit facility may be paid down and re-borrowed during the five-year term of the revolver, and bear interest at LIBOR plus a margin ranging from 2.5% to 3.25% based on a percentage of usage. The term loan credit facility provides for payments of interest only during its 5.5-year term, with the interest rate being LIBOR plus 9.0% with a 2.0% LIBOR floor, or if any period the Company elects to pay a portion of the interest under its term loan “in kind”, then the interest rate will be LIBOR plus 10.0% with a 2.0% LIBOR floor, and with 7.0% of the interest amount paid in cash and the remaining 3.0% paid in kind by being added to principal. At December 31, 2011, $127.0 million was outstanding under the revolving credit facility and $75.0 million was outstanding under the term loan credit facility.
Advances under the new credit facilities are secured by liens on substantially all properties and assets of the Company and its subsidiaries. The new credit facilities contain representations, warranties and covenants customary in transactions of this nature, including restrictions on the payment of dividends on the Company’s capital stock and financial covenants relating to current ratio, minimum interest coverage ratio, maximum leverage ratio and a required ratio of asset value to indebtedness. The Company is required to maintain commodity hedges on a rolling basis for the first 12 months of not less than 60%, but not more than 85%, and for the next 18 months of not less than 50%, but not more than 85%, of projected quarterly production volumes, until the leverage ratio is less than or equal to 1.5 to 1.0. During June 2011, the Company entered into the First Amendment to the revolving credit facility. The First Amendment amended certain definitions affecting covenant calculations and modified the terms of the Company’s natural gas derivative counterparty requirements.
72
Table of Contents
The Company’s previous credit facility entered into in November 2007, in conjunction with the Ascent acquisition, included a $500.0 million credit facility with Guggenheim Corporate Funding, LLC, for itself and on behalf of other institutional lenders. The previous credit facility included a $250.0 million revolving credit facility and a $200.0 million term loan facility and an additional $50.0 million available under the term loan as requested by the Company and approved by the lenders. The borrowing base under the revolving credit facility initially was set at $175.0 million, a portion of which was advanced at the closing of the Ascent acquisition. Borrowings under the facility were used to refinance RAM Energy’s existing indebtedness, fund the cash requirements in connection with the closing of the Ascent acquisition, and for working capital and other general corporate purposes. Funds advanced under the revolving credit facility initially bore interest at LIBOR plus a margin ranging from 1.25% to 2.0% based on a percentage of usage. The previous term loan provided for payments of interest only during its term, with the initial interest rate being LIBOR plus 7.5%. Effective September 30, 2010, the borrowing base was redetermined at $165.0 million based on the value of the Company’s proved reserves at June 30, 2010. As a result of the reduction in collateral, represented by the North Texas Barnett Shale and Boonsville asset sale, the Company’s borrowing base of $165.0 million was reset at $145.0 million. The Eastern Oklahoma asset sale had no impact on the Company’s borrowing base. See Note B.
Advances under the previous credit facility were secured by liens on substantially all properties and assets of the Company and its subsidiaries. The loan agreement contained representations, warranties and covenants customary in transactions of this nature.
During June 2009, the Company entered into the Second Amendment to the previous credit facility. The Second Amendment amended certain definitions and certain financial and negative covenant terms to provide greater flexibility for the Company through the remaining term of the previous credit facility. Additionally, the Second Amendment increased the interest rates applicable to borrowings under both the revolver and term loans. Advances under the revolver bore interest at LIBOR, with a minimum LIBOR rate, or “floor,” of 1.5%, plus a margin ranging from 2.25% to 3.0% based on a percentage of usage. The term loan bore interest at LIBOR, also with a floor of 1.5%, plus a margin of 8.5%, and an additional 2.75% of payment-in-kind interest that was added to the term loan principal balance on a monthly basis and paid at maturity. At December 31, 2010, $116.5 million was outstanding under the previous revolving credit facility and $80.2 million was outstanding under the previous term loan facility, including $0.2 million accrued payment-in-kind interest. Due to refinancing of the Company’s previous credit facility prior to the issuance of the financial statements in 2010, the current portion of debt outstanding at December 31, 2010 was considered long-term.
| D– | LEASES |
The Company leases office space and certain equipment under non-cancelable operating lease agreements that expire on various dates through 2016. Approximate future minimum lease payments for operating leases at December 31, 2011 are as follows (in thousands):
| Year Ending December 31, |
||||
| 2012 |
$ | 1,285 | ||
| 2013 |
1,110 | |||
| 2014 |
89 | |||
| 2015 |
38 | |||
| 2016 |
5 | |||
|
|
|
|||
| $ | 2,527 | |||
|
|
|
|||
Rent expense of approximately $1.3 million was incurred annually under operating leases in the years ended December 31, 2011, 2010, and 2009. In 2010, the Company sub-leased a portion of its leased office space for the duration of the operating lease agreement. Approximate future minimum lease receipts for the sub-lease at December 31, 2011 are $0.1 million annually for 2012 and 2013.
73
Table of Contents
| E– | DEFINED CONTRIBUTION PLAN |
The Company sponsors a 401(k) defined contribution plan for the benefit of substantially all of its employees. The plan allows eligible employees to contribute up to 100% of their annual compensation, not to exceed the maximum amount permitted by IRS regulations. Employer contributions to the plan are discretionary. The Company provided matching contributions to the plan in 2011, 2010, and 2009 of $0.7 million, annually.
| F– | CAPITAL STOCK |
On May 8, 2006, the shareholders of the Company approved the Company’s 2006 Long-Term Incentive Plan (the “Plan”). Under the terms of the Plan, at such time as restricted stock awards vest, the grantee has the right to request the Company to repurchase, at the closing market price of the Company’s common stock as of the vesting date, the number of vested shares necessary to satisfy minimum income tax withholding requirements. Pursuant to this provision, since inception of the Plan in 2006, the Company has repurchased, upon vesting, a total of 242,470 shares of common stock at an average price of $7.62 per share. The shares purchased by the Company are held as treasury shares.
The Company had outstanding options to purchase up to 91,667 units at any time on or prior to May 11, 2009 at an exercise price of $29.70 per unit, with each unit consisting of one share of the Company’s common stock and two warrants. All of the unit purchase options expired unexercised.
During January 2012, the Company approved a one-for-three reverse stock split, which was implemented on February 10, 2012. Retroactive application of the reverse stock split is required and all share and per share information included for all periods presented in these financial statements reflect the reverse stock split.
See Note N for discussion on subsequent events, including an increase in the Company’s authorized shares, an increase in the number of shares that may be issued under the Company’s 2006 Long-Term Incentive Plan, and the issuance of convertible preferred stock, common stock and warrants.
| G– | INCOME TAXES |
The (provision) benefit for income taxes is comprised of (in thousands):
| Years Ended December 31, | ||||||||||||
| 2011 | 2010 | 2009 | ||||||||||
| Current |
$ | (253 | ) | $ | (418 | ) | $ | (518 | ) | |||
| Deferred |
(6,549 | ) | (577 | ) | 16,865 | |||||||
|
|
|
|
|
|
|
|||||||
| (Provision) benefit for income tax |
$ | (6,802 | ) | $ | (995 | ) | $ | 16,347 | ||||
|
|
|
|
|
|
|
|||||||
The provision for income taxes differs from the amount computed by applying the statutory federal income tax rate to income before provision for income taxes. The significant differences between pre-tax book income and taxable book income relate to non-deductible expenses, state income taxes, change in valuation allowance, Section 382 net operating loss limitations and other adjustments to deferred tax balances.
74
Table of Contents
The sources and tax effects of the differences are as follows (in thousands):
| Years Ended December 31, | ||||||||||||
| 2011 | 2010 | 2009 | ||||||||||
| Income tax benefit (expense) at the federal statutory rate (34%) |
$ | (1,836 | ) | $ | (1,160 | ) | $ | 25,408 | ||||
| State income tax expense, net of federal benefit |
(557 | ) | (124 | ) | (508 | ) | ||||||
| Meals and entertainment expense |
(19 | ) | (25 | ) | (27 | ) | ||||||
| Non-deductible dues |
(124 | ) | (69 | ) | 12 | |||||||
| Reduction in deferred tax asset |
(5,957 | ) | (5,731 | ) | — | |||||||
| Change in valuation allowance and related items |
1,883 | 6,572 | (7,433 | ) | ||||||||
| Share-based compensation |
(260 | ) | (393 | ) | (559 | ) | ||||||
| Other |
68 | (65 | ) | (546 | ) | |||||||
|
|
|
|
|
|
|
|||||||
| Income tax benefit (provision) |
$ | (6,802 | ) | $ | (995 | ) | $ | 16,347 | ||||
|
|
|
|
|
|
|
|||||||
The Company’s income tax benefit (provision) was computed based on the federal statutory rate and the average state statutory rates, net of the related federal benefit. Deferred income taxes reflect the net tax effects of temporary differences between the carrying amounts of assets and liabilities for financial reporting purposes and the amounts used for income tax purposes.
Significant components of the Company’s deferred tax assets and liabilities are as follows (in thousands):
| December 31, | ||||||||
| 2011 | 2010 | |||||||
| Deferred tax assets: |
||||||||
| Current: |
||||||||
| Derivative liabilities |
$ | 796 | $ | 2,298 | ||||
| Accrued expenses and other |
2,372 | 1,873 | ||||||
|
|
|
|
|
|||||
| Total current deferred tax assets |
$ | 3,168 | $ | 4,171 | ||||
| Valuation allowance |
(245 | ) | (445 | ) | ||||
|
|
|
|
|
|||||
| Net current deferred tax assets |
$ | 2,923 | $ | 3,726 | ||||
|
|
|
|
|
|||||
| Noncurrent: |
||||||||
| Depreciable/depletable property, plant and equipment |
$ | 8,041 | $ | 13,268 | ||||
| Net operating loss carryforward |
16,901 | 20,254 | ||||||
| Accrued liabilities and other |
1,382 | 1,381 | ||||||
|
|
|
|
|
|||||
| Total noncurrent deferred tax assets |
$ | 26,324 | $ | 34,903 | ||||
| Valuation allowance |
(2,040 | ) | (3,723 | ) | ||||
|
|
|
|
|
|||||
| Net noncurrent deferred tax assets |
$ | 24,284 | $ | 31,180 | ||||
|
|
|
|
|
|||||
| Deferred tax liabilities: |
||||||||
| Current: |
||||||||
| Prepaid expenses and other |
$ | (322 | ) | $ | (200 | ) | ||
|
|
|
|
|
|||||
| Total current deferred tax liability |
(322 | ) | (200 | ) | ||||
|
|
|
|
|
|||||
| Noncurrent: |
||||||||
| Depreciable/depletable property, plant and equipment |
$ | — | $ | — | ||||
| Other |
(182 | ) | (179 | ) | ||||
|
|
|
|
|
|||||
| Total noncurrent deferred tax liabilities |
$ | (182 | ) | $ | (179 | ) | ||
|
|
|
|
|
|||||
| Net deferred tax liability |
$ | (504 | ) | $ | (379 | ) | ||
|
|
|
|
|
|||||
| Net deferred tax asset |
$ | 26,703 | $ | 34,527 | ||||
|
|
|
|
|
|||||
As of December 31, 2011, the Company has net operating loss carryforwards of approximately $136.0 million for federal income tax reporting purposes, the majority of which were an inherited attribute from the
75
Table of Contents
Ascent acquisition during 2007. If not used, the net operating losses will generally expire between 2020 and 2029. The majority of these net operating loss carryforwards are subject to the ownership change limitation provisions of Section 382 of the Internal Revenue Code (the “Code”). Based on the value of Ascent at the time of the acquisition, the annual limitation on utilization of losses imposed by Section 382 and other increases for anticipated recognized built-in gains, it is estimated that approximately $95.0 million of these net operating losses will expire without being utilized; accordingly, no deferred tax asset has been established for the amount of net operating losses that are not expected to be utilized under the applicable provisions of the tax law prior to their expiration. In addition, the Company has generated net operating loss carryforwards for state income tax purposes, which the Company believes will more likely than not be realized during the relevant carryforward periods; however, such amounts have not been separately disclosed in the financial statements as the Company does not believe that these net operating losses are material to the amounts presented herein.
A valuation allowance has been established with respect to the portion of the deferred tax asset associated with its net operating losses for which the Company currently does not reasonably believe under the deferred tax asset realization criteria set forth in Topic 740 that it will more likely than not realize a benefit in future periods. During the year ended December 31, 2011, the Company recorded a decrease in the valuation allowance of $1.9 million.
During February 2012, an “ownership change” occurred under Section 382 of the Code. See Note N for additional discussion on the change-in-control of the Company.
| H– | COMMITMENTS AND CONTINGENCIES |
The Company is involved in legal proceedings and litigation in the ordinary course of business. In the opinion of management, the outcome of such matters will not have a material adverse effect on the Company’s financial position or results of operations.
In May of 2008, the Company drilled the Woolley #1-23 well in Oklahoma. On July 21, 2008 the Oklahoma Corporation Commission (the “OCC”) entered a forced pooling order for the Woolley #1-23 well and the Company acquired all of the working interests attributable to those parties who did not elect to participate in the drilling of the Woolley #1-23 well. Subsequent to the pooling, certain predecessors in interest that were erroneously omitted from the forced pooling order disputed the pooling order and sought a determination that they were entitled to share in the pooled acreage. The OCC determined that the omitted predecessors in interest were not entitled to share in the pooled acreage; however, the ruling of the OCC was reversed on appeal. As a result, the Company lost a portion of its working interest in the Woolley #1-23 well and in the McAlester formation of the 40-acre tract in which the well is located. During the second quarter of 2011, the Company recorded a charge to other expense of $0.8 million, a reduction in proved oil and gas properties of $0.2 million and a liability of $0.6 million to record the estimated settlement of the dispute. During August of 2011, the Company cash settled the $0.6 million liability.
| I– | FAIR VALUE MEASUREMENTS |
The Company measures the fair value of its derivative instruments and SARs according to the fair value hierarchy, as set forth in Topic 820 of the Codification. Topic 820 establishes a fair value hierarchy that prioritizes the inputs to valuation techniques used to measure fair value. The hierarchy assigns the highest priority to unadjusted quoted prices in active markets for identical assets or liabilities (“Level 1”) and the lowest priority to unobservable inputs (“Level 3”). Level 2 measurements are inputs that are observable for assets or liabilities, either directly or indirectly, other than quoted prices included within Level 1. The fair value measurement of the Company’s net oil and natural gas derivative liabilities as of December 31, 2011 was $0.3 million and of its net derivative assets as of December 31, 2010 was $1.1 million, based on Level 2 criteria. Additionally, the Company’s interest rate derivative liability at December 31, 2011 was $0.5 million, based on Level 2 criteria. See Note J for additional discussion on the Company’s derivatives.
76
Table of Contents
The Company grants SARs under its Plan. The SARs are recorded at fair value and re-measured each period and recognized over the vesting period. The fair value of the Company’s SARs as of December 31, 2011 was $0.8 million, based on Level 2 criteria.
At December 31, 2011, the carrying value of cash, receivables and payables reflected in the Company’s consolidated financial statements approximates fair value due to their short-term nature. Additionally, the carrying value of the Company’s long-term debt under the credit facilities approximates fair value because the credit facilities carry a variable interest rate based on market interest rates. See Note C for discussion of long-term debt.
| J– | DERIVATIVE CONTRACTS |
The Company periodically utilizes various hedging strategies to achieve a more predictable cash flow. Various derivative instruments are used to manage the price received for a portion of its future oil and natural gas production and interest rate swaps are used to manage the interest rate paid for a portion of the Company’s outstanding debt.
During 2011, 2010 and 2009, the Company entered into numerous derivative contracts to manage the impact of oil and natural gas price fluctuations and as required by the terms of its credit facilities. During the first quarter of 2011, the Company also entered into interest rate swaps to manage the impact of interest rate fluctuations. The Company did not designate these transactions as hedges. Accordingly, all gains and losses on the derivative instruments during 2011, 2010 and 2009 have been recorded in the statements of operations.
The Company’s crude oil and natural gas derivative positions at December 31, 2011 consist of put/call “collars,” sold put options and bare purchased put options. A collar consists of a sold call, which establishes a maximum price the Company will receive for the volumes under contract and a purchased put that establishes a minimum price. A sold put option limits the exposure of the counterparty’s risk should the price fall below the strike price. Sold put options limit the effectiveness of purchased put options at the low end of the put/call collars to market prices in excess of the strike price of the put option sold. Bare purchased put options, also called “bare floors,” provide a floor price without a corresponding ceiling. The details of the Company’s oil and natural gas derivative positions are provided in the following table:
| Crude Oil (Bbls) | Natural Gas (Mmbtu) | |||||||||||||||||||||||||||||||||||||||||||||||
| Collars | Collars | |||||||||||||||||||||||||||||||||||||||||||||||
| Floors | Ceilings | Put Options Sold | Floors | Ceilings | Bare Floors | |||||||||||||||||||||||||||||||||||||||||||
| Year |
Per Day | Price | Per Day | Price | Per Day | Price | Per Day | Price | Per Day | Price | Per Day | Price | ||||||||||||||||||||||||||||||||||||
| Q1 2012 |
2,000 | $ | 80.00 | 2,000 | $ | 105.00 | 1,000 | $ | 70.00 | — | — | — | — | 6,700 | $ | 4.35 | ||||||||||||||||||||||||||||||||
| Q2 2012 |
2,000 | $ | 80.00 | 2,000 | $ | 105.00 | 1,000 | $ | 70.00 | 5,000 | $ | 4.00 | 5,000 | $ | 6.00 | — | — | |||||||||||||||||||||||||||||||
| Q3 2012 |
1,900 | $ | 92.63 | 1,900 | $ | 105.66 | 1,238 | $ | 70.00 | 5,000 | $ | 4.00 | 5,000 | $ | 6.00 | — | — | |||||||||||||||||||||||||||||||
| Q4 2012 |
1,750 | $ | 92.14 | 1,750 | $ | 104.83 | 1,138 | $ | 70.00 | — | — | — | — | — | — | |||||||||||||||||||||||||||||||||
| Q1 2013 |
1,800 | $ | 95.28 | 1,800 | $ | 101.39 | 1,450 | $ | 70.00 | — | — | — | — | — | — | |||||||||||||||||||||||||||||||||
| Q2 2013 |
1,650 | $ | 95.00 | 1,650 | $ | 99.93 | 1,325 | $ | 70.00 | — | — | — | — | — | — | |||||||||||||||||||||||||||||||||
| Q3 2013 |
1,600 | $ | 95.00 | 1,600 | $ | 99.94 | — | — | — | — | — | — | — | — | ||||||||||||||||||||||||||||||||||
| Q4 2013 |
1,550 | $ | 95.00 | 1,550 | $ | 99.71 | — | — | — | — | — | — | — | — | ||||||||||||||||||||||||||||||||||
| Q1 2014 |
1,600 | $ | 95.00 | 1,600 | $ | 100.03 | 1,600 | $ | 70.00 | — | — | — | — | — | — | |||||||||||||||||||||||||||||||||
| Q2 2014 |
1,500 | $ | 95.00 | 1,500 | $ | 99.13 | 1,500 | $ | 70.00 | — | — | — | — | — | |
— |
| |||||||||||||||||||||||||||||||
During the third quarter of 2011, the Company received $5.0 million in premiums in exchange for selling $70 crude oil put options on put/call “collars” with a $95 per barrel floor price and a $105 per barrel ceiling price. The sold put options limit the effectiveness of purchased put options at the low end of the collar to market prices in excess of the strike price of the put option sold. The premiums received will be recognized as realized gains on derivatives during the applicable contract periods.
77
Table of Contents
The Company’s interest rate derivative positions at December 31, 2011, consisting of interest rate swaps, are shown in the following table.
| Interest Rate Swaps (1) | ||||||||||||
| Year |
Notional Amount (in millions) |
Fixed Rate | Counterparty Floating Rate (2) |
Months Covered | ||||||||
| 2012 |
$ | 50 | 2.51 | % | 3-Month LIBOR | January - December | ||||||
| 2013 |
$ | 50 | 2.51 | % | 3-Month LIBOR | January - December | ||||||
| 2014 |
$ | 50 | 2.51 | % | 3-Month LIBOR | January - March | ||||||
| (1) | Settlement is paid to the Company if the counterparty floating rate exceeds the fixed rate and settlement is paid by the Company if the counterparty floating rate is below the fixed rate. Settlement is calculated as the difference in the fixed rate and the counterparty. |
| (2) | Subject to a minimum rate of 2%. |
The Company estimates the fair value of its derivative instruments based on published forward commodity price curves as of the date of the estimate, less discounts to recognize present values. The Company estimated the fair value of its derivatives using a pricing model which also considered market volatility, counterparty credit risk and additional criteria in determining discount rates. See Note I. The discount rate used in the discounted cash flow projections was based on published LIBOR rates, Eurodollar futures rates and interest swap rates. The counterparty credit risk was determined by calculating the difference between the derivative counterparty’s bond rate and published bond rates. The Company incorporates its credit risk when the derivative position is a liability by using its LIBOR spread rate.
Gross fair values of the Company’s derivative instruments, prior to netting of assets and liabilities subject to a master netting arrangement, as of December 31, 2011 and 2010 and the consolidated statements of operations for the years ended December 31, 2011, 2010 and 2009 are as follows (in thousands):
CONSOLIDATED BALANCE SHEETS
| Fair Value as of December 31, |
||||||||||
| Gross Assets and Liabilities |
Balance Sheet Location |
2011 | 2010 | |||||||
| Current Assets - Derivative assets |
Current Assets -Derivative assets |
$ | 1,850 | $ | 1,904 | |||||
| Other Assets - Derivative assets |
Long-Term Liabilities -Derivative liabilities |
2,050 | 207 | |||||||
| Current Liabilities - Derivative liabilities |
Current Assets - Derivative assets |
(1,590 | ) | (564 | ) | |||||
| Current Liabilities - Interest rate swaps derivative liabilities |
Current Liabilities - Derivative liabilities |
|
(265 |
) |
|
— |
| |||
| Long-Term Liabilities - Derivative liabilities |
Long-Term Liabilities -Derivative liabilities |
(2,602 | ) | (410 | ) | |||||
| Long-Term Liabilities - Interest rate swaps derivative liabilities |
Long-Term Liabilities -Derivative liabilities |
(253 | ) | — | ||||||
|
|
|
|
|
|||||||
| Total Derivatives Not Designated as Hedging Instruments |
$ | (810 | ) | $ | 1,137 | |||||
|
|
|
|
|
|||||||
78
Table of Contents
CONSOLIDATED STATEMENTS OF OPERATIONS
| Years Ended December 31, | Type of Derivative | |||||||||||||
| Location |
2011 | 2010 | 2009 | |||||||||||
| Revenue - Unrealized gains (losses) on derivatives |
$ | 5,269 | $ | 6,386 | $ | (30,561 | ) | Oil and natural gas derivatives - unrealized | ||||||
| Revenue - Realized gains (losses) on derivatives |
$ | (1,078 | ) | $ | (5,193 | ) | $ | 19,255 | Oil and natural gas derivatives - realized | |||||
| Other Income (Expense) - Loss on interest rate derivatives |
$ | (506 | ) | $ | — | $ | — | Interes t rate derivatives - unrealized | ||||||
| Other Income (Expense) - Loss on interest rate derivatives |
$ | (206 | ) | $ | — | $ | — | Interes t rate derivatives - realized | ||||||
During April 2011, pursuant to the Company’s credit facilities entered into in March 2011, the Company was required to reduce the volume of its existing crude oil and natural gas derivatives so it would not exceed the maximum allowable volumes for future production periods and to novate derivative contracts to counterparties that are lenders within the new credit facilities. During the second quarter of 2011, the Company recognized $0.9 million in realized losses on the unwinding of the excess crude oil and natural gas derivatives and $0.5 million in fees paid to complete the novation, both of which are included in realized gains and losses on derivative in the income statement.
| K– | LIQUIDITY |
As of December 31, 2011, the Company has an accumulated deficit of $216.3 million and a working capital deficit of $6.1 million. Subsequent to the transactions with Halcón LLC, as discussed in Note N, the Company has significant cash available for potential acquisitions, exploration and development drilling, and other corporate purposes. Management believes our cash, internally generated cash flows, borrowing capacity and access to the capital markets will provide the Company with sufficient liquidity to execute its current capital program and strategy for the foreseeable future. The actual amount and timing of future capital requirements may differ materially from estimates as a result of, among other things, changes in product pricing and regulatory, technological and competitive developments. Sources of additional financing may include commercial bank borrowings, issuance of equity securities and issuance of debt securities. The Company could also generate additional funds by divesting of non-core assets.
| L– | SHARE-BASED COMPENSATION |
The Company accounts for share-based payment accruals under authoritative guidance on stock compensation, as set forth in Topic 718 of the Codification. The guidance requires all share-based payments to employees, including grants of employee stock options, to be recognized in the financial statements based on their fair values.
On May 8, 2006, the Company’s stockholders approved its Plan . The Company reserved a maximum of 800,000 shares of its common stock for issuances under the Plan. On May 8, 2008, the Plan was amended to increase the maximum authorized number of shares to be issued under the Plan from 800,000 to 2,000,000. On May 3, 2010, the Plan was amended to increase the maximum authorized number of shares to be issued under the Plan from 2,000,000 to 2,466,667. As of December 31, 2011, a maximum of 491,450 shares of common stock remained reserved for issuance under the Plan. See Note N for discussion of Plan amendments effective February 8, 2012.
79
Table of Contents
The number of shares repurchased and their weighted average prices for the three year period ended December 31, 2011 were as follows:
| Shares Repurchased | ||||
| Year ended |
Number |
Weighted Average Closing Price | ||
| December 31, 2009 |
7,180 |
$3.99 | ||
| December 31, 2010 |
138,018 |
$5.70 | ||
| December 31, 2011 |
46,516 |
$3.93 | ||
A summary of the status of the non-vested shares as of December 31, 2011, and changes during the three year period ended December 31, 2011, is presented below:
| Nonvested Shares |
Shares | Weighted-Average Grant Date Fair Value |
||||||
| Nonvested at January 1, 2009 |
489,415 | $ | 14.37 | |||||
| Granted |
447,667 | $ | 2.85 | |||||
| Vested |
(143,117 | ) | $ | 14.43 | ||||
| Forfeited |
(5,967 | ) | $ | 3.60 | ||||
|
|
|
|||||||
| Nonvested at December 31, 2009 |
787,998 | $ | 7.92 | |||||
| Granted |
623,885 | $ | 5.97 | |||||
| Vested |
(519,159 | ) | $ | 7.95 | ||||
| Forfeited |
(7,500 | ) | $ | 6.81 | ||||
|
|
|
|||||||
| Nonvested at December 31, 2010 |
885,224 | $ | 6.51 | |||||
| Granted |
279,907 | $ | 5.23 | |||||
| Vested |
(209,710 | ) | $ | 7.81 | ||||
| Forfeited |
(117,934 | ) | $ | 5.26 | ||||
|
|
|
|||||||
| Nonvested at December 31, 2011 |
837,487 | $ | 5.92 | |||||
|
|
|
|||||||
Each grant vests in equal increments over periods ranging from eight months to five years from the date of grant. At the request of certain of the grantees, the Company repurchased a portion of the vested shares at the closing market price of the Company’s common stock as of the vesting date, to satisfy the requesting grantees’ federal and state income tax withholding requirements. The repurchased shares were held by the Company as treasury stock at December 31, 2011.
As of December 31, 2011, the Company had $2.7 million of unrecognized share-based compensation related to common stock awards granted under the Plan scheduled to be recognized over a weighted-average period of two years. The related compensation recognized during the years ended December 31, 2011, 2010 and 2009 was $3.4 million, $3.1 million and $2.2 million, respectively. During the year ended December 31, 2011, $2.8 million of recognized compensation was recorded as share-based compensation expense, $0.1 million as restructuring costs and $0.5 million was recorded as capitalized internal costs. During the years ended December 31, 2010 and 2009, all recognized compensation was recorded to compensation expense. See Note N – Subsequent Event for discussion of accelerated vesting of the common stock awards during February 2012.
In May 2011, the Company granted 510,167 SARs under the Plan at an exercise price of $5.19 per share, which was the weighted average closing price of the Company’s common stock on the date of grant. Compensation expense related to the SARs is based on fair value re-measured at each reporting period and recognized over the vesting period (generally four years). As of December 31, 2011, the fair value calculation resulted in $0.8 million expense recognized as share-based compensation expense and $0.1 million as restructuring costs during the year ended December 31, 2011. The SARs are scheduled to expire ten years from date of grant and upon exercise. The Company will settle the SARs in cash, net of applicable taxes. See Note N – Subsequent Event for discussion of accelerated vesting and exercise of the SARs during February 2012.
80
Table of Contents
A summary of the status of the non-vested SARs as of December 31, 2011, and changes during the year ended December 31, 2011, is presented below:
| Nonvested SARs |
Shares | Weighted- Average Grant Date Fair Value |
||||||
| Nonvested at December 31, 2010 |
— | $ | 0.00 | |||||
| Granted |
510,167 | $ | 5.19 | |||||
| Vested |
(20,000 | ) | $ | 5.19 | ||||
| Forfeited |
(71,834 | ) | $ | 5.19 | ||||
|
|
|
|||||||
| Nonvested at December 31, 2011 |
418,333 | $ | 5.19 | |||||
The Company uses the Black-Scholes option pricing model to compute the fair value of the SARs. The following assumptions were used in calculating fair value:
| • | The risk-free interest rate is based on the zero coupon United States Treasury yield for the expected life of the grant |
| • | The dividend yield on the Company’s common stock is assumed to be zero since the Company does not pay dividends and has no current plans to do so in the future. |
| • | The volatility of the Company’s common stock is based on volatility of the market price of the Company’s common stock over a period of time equal to the expected term and ending on the grant date. |
During January 2012, the Company approved a one-for-three reverse stock split, which was implemented on February 10, 2012. Retroactive application of the reverse stock split is required and all share and per share information included for all periods presented in these financial statements reflect the reverse stock split.
| M– | REORGANIZATION |
During October 2011, the Company implemented a Company-wide reorganization of its operating and administrative functions. The reorganization included terminations and retirements and offered certain severance benefits to the affected employees and officers. The reorganization was completed in full during the quarter ended December 31, 2011. The Company recognized restructuring expense of $1.1 million, including $0.7 million of one-time severance benefits, $0.2 million of retention payments, $0.2 million of share based compensation related to the acceleration of employee restricted stock awards and payment of share appreciation rights.
| N– | SUBSEQUENT EVENTS |
1. Recapitalization
On December 21, 2011, the Company entered into a Securities Purchase Agreement (the “Purchase Agreement”) with Halcón LLC. Pursuant to the Purchase Agreement, (i) Halcón LLC purchased and the Company sold 73,333,333 shares of the Company’s common stock (the “Shares”) for a purchase price of $275,000,000 and (ii) Halcón LLC purchased and the Company issued a senior convertible promissory note in the principal amount of $275,000,000 (the “Note”), together with five year warrants to purchase 36,666,666 shares of the Company’s common stock at an exercise price of $4.50 per share (the “Warrants”), for an aggregate purchase price of $275,000,000, which is initially convertible after February 8, 2014 into 61,111,111 shares of common stock at a conversion price of $4.50 per share. The Company and Halcón LLC closed the transaction contemplated by the Purchase Agreement on February 8, 2012 (the “Closing”).
During January 2012, shareholders holding a majority of the Company’s outstanding shares of common stock approved the issuance of the Shares, the Note and the Warrants pursuant to the terms of the Purchase Agreement. Additionally, the board approved, effective upon the Closing (i) the amendment of the Company’s certificate of incorporation to (A) increase the Company’s authorized shares of common stock
81
Table of Contents
from 33,333,333 shares to 336,666,666 shares; (B) a one-for-three reverse stock split of the Company’s common stock; and (C) a name change from RAM Energy Resources, Inc. to Halcón Resources Corporation; (ii) the amendment of the Company’s 2006 Long-Term Incentive Plan to increase the number of shares that may be issued under the plan from 2,466,666 to 3,700,000 shares; and (iii) on an advisory (non-binding) basis, the compensation to be paid to the Company’s named executive officers that is based on or otherwise relates to the transactions contemplated by the Purchase Agreement.
The Closing of the transaction resulted in a change in control of the Company. Material events and items resulting from the transaction include the following:
| • | Completion of transactions contemplated by the Purchase Agreement and shareholder approval as discussed above; |
| • | The appointment of a new board of directors; |
| • | The resignation and termination of the Company’s four executive officers and the resignation of certain other officers; |
| • | Appointment of a new president and chief executive officer and chief financial officer; |
| • | Change in control payments of $4.6 million to the officers of the Company; |
| • | Change in control payment of $0.8 million pursuant to a retainer agreement with the Company’s outside law firm; |
| • | Accelerated vesting of all unvested employee restricted stock shares and accelerated vesting and exercise of all unvested stock appreciation rights resulting in $4.5 million of share-based compensation expense; |
| • | Payoff and termination of the Company’s revolving credit facility of $133.0 million plus accrued interest as well as the expensing of the related unamortized debt issue costs of $3.0 million; |
| • | Payoff and termination of the Company’s second lien term facility of $75.0 million plus accrued interest and a prepayment fee of $1.5 million as well as the expensing of the related unamortized debt issue costs of $2.9 million; and |
| • | Closing costs of $11.2 million related to engagement fees and various professional fees. |
On February 8, 2012, the Company entered into a $500.0 million five-year senior secured revolving credit agreement with J.P. Morgan Chase Bank, N.A. as the administrative agent and lead arranger, which replaces the Company’s previous revolving credit facility. The new agreement increases the revolving borrowing base to $225.0 million, extends the maturity to February 8, 2017, lowers the interest rate and improves the financial flexibility of the covenant package when compared to the Company’s prior revolving credit facility. The borrowing base will be redetermined semi-annually, and is subject to a reduction equal to the product of 0.25 multiplied by the stated principal amount (without regard to any initial issue discount) of any future notes or other long-term debt securities that the Company may issue. Funds advanced under the revolving credit agreement may be paid down and re-borrowed during the five-year term of the revolver. The pricing on the new agreement is LIBOR plus 150 to 250 basis points based on the utilization of the borrowing base.
During February 2012, pursuant to the new credit agreement financing, the Company novated its oil and natural gas derivative instruments to counterparties that are lenders within the new credit facility for a fee of $0.4 million and terminated the interest rate derivatives resulting in a $0.6 realized loss.
During January 2012, the Company approved a one-for-three reverse stock split, which was implemented on February 10, 2012. Retroactive application of the reverse stock split is required and all share and per share information included for all periods presented in these financial statements reflect the reverse stock split.
During February 2012, the transaction with Halcón LLC resulted in an “ownership change” as defined under Section 382 of the Code. As a consequence, the Company will have additional limitations on its ability to use the net operating losses it accrued before the change-in-control as a deduction against any taxable income the Company realizes after the change-in-control.
82
Table of Contents
2. Private Placement of Convertible Preferred Stock
On March 5, 2012, the Company sold in a private placement to certain institutional accredited investors 4,444.4511 shares of 8% automatically convertible preferred stock, par value $0.0001 per share, each share of which will convert into 10,000 shares of common stock (or a proportionate number of shares of common stock with respect to any fractional shares of preferred stock), subject to certain adjustments, for approximately $400.0 million, or $9.00 per share of common stock, before offering expenses. The convertible preferred stock will convert into common stock automatically on the 20th calendar day after the Company mails a definitive information statement to holders of its common stock notifying them that its majority stockholder has consented to the issuance of common stock upon conversion of the convertible preferred stock. No dividend will be paid on the convertible preferred stock if it converts into common stock on or before May 31, 2012.
| O– | SUPPLEMENTARY OIL AND NATURAL GAS RESERVE INFORMATION (UNAUDITED) |
The Company has interests in oil and natural gas properties that are principally located in Texas, Louisiana and Oklahoma. The Company does not own or lease any oil and natural gas properties outside the United States of America.
The Company retains independent engineering firms to provide year-end estimates of the Company’s future net recoverable oil, natural gas and natural gas liquids reserves. Estimated proved net recoverable reserves as shown below include only those quantities that can be expected to be commercially recoverable. Estimated reserves for the years ended December 31, 2011, 2010 and 2009 were computed using benchmark prices based on the unweighted arithmetic average of the first-day-of-the-month prices for oil and natural gas during each month of 2011, 2010 and 2009, as required by SEC Release No. 33-8995 “Modernization of Oil and Gas Reporting,” effective December 31, 2009. Costs were estimated using costs in effect at the balance sheet dates under existing regulatory practices and with conventional equipment and operating methods.
Proved developed reserves represent only those reserves expected to be recovered through existing wells. Proved undeveloped reserves include those reserves expected to be recovered from new wells on undrilled acreage or from existing wells on which a relatively major expenditure is required for re-completion.
Capitalized costs relating to oil and natural gas producing activities and related accumulated depreciation and amortization at December 31 are summarized as follows (in thousands):
| 2011 | 2010 | 2009 | ||||||||||
| Proved oil and natural gas properties |
$ | 715,666 | $ | 689,472 | $ | 702,502 | ||||||
| Accumulated depreciation, amortization and impairment |
(501,993 | ) | (482,886 | ) | (456,720 | ) | ||||||
|
|
|
|
|
|
|
|||||||
| $ | 213,673 | $ | 206,586 | $ | 245,782 | |||||||
|
|
|
|
|
|
|
|||||||
Costs incurred in oil and natural gas producing activities for the years ended December 31 are as follows (in thousands, except per equivalent oil barrel):
| 2011 | 2010 | 2009 | ||||||||||
| Acquisition of proved properties |
$ | 724 | $ | 1,133 | $ | 1,311 | ||||||
| Acquisition of unproved properties |
— | — | — | |||||||||
| Development costs |
17,355 | 27,850 | 28,239 | |||||||||
| Exploration costs |
7,135 | 4,552 | 321 | |||||||||
|
|
|
|
|
|
|
|||||||
| $ | 25,214 | $ | 33,535 | $ | 29,871 | |||||||
| Amortization rate per equivalent oil barrel |
$ | 13.55 | $ | 12.11 | $ | 12.06 | ||||||
83
Table of Contents
Net quantities of proved and proved developed reserves of oil and natural gas, including condensate and natural gas liquids, are summarized as follows:
| Crude Oil (Thousand Barrels) |
Natural Gas (Million Cubic Feet) |
Natural Gas Liquids (Thousand Barrels) |
||||||||||
| December 31, 2008 |
14,285 | 96,952 | 4,325 | |||||||||
| Extensions and discoveries |
1,771 | 10,070 | 508 | |||||||||
| Sales of reserves in place |
(15 | ) | (3,808 | ) | — | |||||||
| Purchases of reserves in place |
— | — | — | |||||||||
| Revisions of previous estimates |
(836 | ) | (7,993 | ) | 556 | |||||||
| Production |
(1,138 | ) | (5,994 | ) | (406 | ) | ||||||
|
|
|
|
|
|
|
|||||||
| December 31, 2009 |
14,067 | 89,227 | 4,983 | |||||||||
| Extensions and discoveries |
347 | 821 | 61 | |||||||||
| Sales of reserves in place |
(174 | ) | (14,591 | ) | (2,004 | ) | ||||||
| Purchases of reserves in place |
— | — | — | |||||||||
| Revisions of previous estimates |
(159 | ) | (17,033 | ) | (301 | ) | ||||||
| Production |
(995 | ) | (4,816 | ) | (364 | ) | ||||||
|
|
|
|
|
|
|
|||||||
| December 31, 2010 |
13,086 | 53,608 | 2,375 | |||||||||
| Extensions and discoveries |
339 | 20 | 1 | |||||||||
| Sales of reserves in place |
— | — | — | |||||||||
| Purchases of reserves in place |
5 | — | — | |||||||||
| Revisions of previous estimates |
(175 | ) | (10,912 | ) | (190 | ) | ||||||
| Production |
(884 | ) | (2,662 | ) | (176 | ) | ||||||
|
|
|
|
|
|
|
|||||||
| December 31, 2011 |
12,371 | 40,054 | 2,010 | |||||||||
|
|
|
|
|
|
|
|||||||
| Proved developed reserves: |
||||||||||||
| December 31, 2009 |
8,814 | 46,159 | 2,788 | |||||||||
| December 31, 2010 |
8,414 | 31,776 | 1,486 | |||||||||
| December 31, 2011 |
8,643 | 20,997 | 1,238 | |||||||||
The Company added 0.3 million barrels of oil equivalent in proved reserve extensions and discoveries in 2011 primarily as a result of its development drilling in its Electra/Burkburnett field in North Texas and in its La Copita field in South Texas. A significant portion of these reserves is a result of drilling locations in Electra/Burkburnett, Northeast Fitts and Allen fields that were not booked as proved locations as of December 31, 2010. The revisions of previous reserve estimates in 2011 decreased proved reserves by 2.2 million barrels of oil equivalent or approximately 9% of proved reserves at the beginning of the year. The revisions include a positive increase of 0.9 million barrels of oil equivalent or 4% of the beginning of the year proved reserves caused by higher crude oil and natural gas prices. This positive revision was offset by the downward revision of 1.4 million barrels of oil equivalent caused by the transfer of proved reserves to unproved categories as a result of updated geological and engineering evaluations and changes to the Company development plans during 2011, and 1.7 million barrels of oil equivalent of downward revisions were mostly due to changes in well performance.
The Company added 0.5 million barrels of oil equivalent in proved reserve extensions and discoveries in 2010 as a result of development drilling in its Electra/Burkburnett field in North Texas and in its La Copita field in South Texas. A significant portion of these reserves is a result of drilling locations in its Electra/Burkburnett field that were not booked as proved location at year-end 2009. The remainder of the extensions and discoveries in 2010 is primarily from wells drilled in South Texas not previously booked as proved and from a discovery well in Osage County, Oklahoma. Sales of reserves in place during 2010 were primarily due to sales of assets during December 2010 of the Company’s North Texas Barnett Shale and Boonsville properties and certain non-operated natural gas properties located in eastern Oklahoma. The revisions of previous reserve estimates decreased proved reserves by 3.3 million barrels of oil equivalent or approximately 10% of proved reserves at the beginning of the year. The revisions included a positive
84
Table of Contents
increase of 1.8 million barrels of oil equivalent caused by higher oil and gas prices. This positive revision was offset by a downward revision of 1.1 million barrels of oil equivalent caused by the transfer of proved undeveloped to unproved categories as a result of changes to the Company’s development plans during 2010, and 4.0 million barrels of oil equivalent of the downward revisions were mostly due to changes in well performance in the Company’s gas properties in South Texas. The Company added 3.9 million barrels of oil equivalent in proved reserve extensions and discoveries in 2009, primarily as a result of success in development drilling in the La Copita field of South Texas and the mature oil area of Electra/Burkburnett in North Texas.
Standardized Measure
The following is a summary of a standardized measure of discounted net cash flows related to the Company’s proved oil and natural gas reserves. For these calculations, estimated future cash flows from estimated future production of proved reserves for the years ended December 31, 2011, 2010 and 2009 were computed using benchmark prices based on the unweighted arithmetic average of the first-day-of-the-month prices for oil and natural gas during each month of 2011, 2010 and 2009, as required by SEC Release No. 33-8995, “Modernization of Oil and Gas Reporting,” effective December 31, 2009. Future development and production costs attributable to the proved reserves were estimated assuming that existing conditions would continue over the economic lives of the individual leases and costs were not escalated for the future. Estimated future income tax expenses were calculated by applying future statutory tax rates (based on the current tax law adjusted for permanent differences and tax credits) to the estimated future pretax net cash flows related to proved oil and natural gas reserves, less the tax basis of the properties involved.
The Company cautions against using this data to determine the fair value of its oil and natural gas properties. To obtain the best estimate of fair value of the oil and natural gas properties, forecasts of future economic conditions, varying discount rates, and consideration of other than proved reserves would have to be incorporated into the calculation. In addition, there are significant uncertainties inherent in estimating quantities of proved reserves and in projecting rates of production that impair the usefulness of the data.
The standardized measure of discounted future net cash flows relating to proved oil and natural gas reserves at December 31 are summarized as follows (in thousands):
| 2011 | 2010 | 2009 | ||||||||||
| Future cash inflows |
$ | 1,440,088 | $ | 1,355,233 | $ | 1,314,714 | ||||||
| Future production costs |
(582,662 | ) | (548,638 | ) | (535,784 | ) | ||||||
| Future development costs |
(102,231 | ) | (117,860 | ) | (148,956 | ) | ||||||
| Future income tax expenses |
(205,457 | ) | (161,736 | ) | (123,943 | ) | ||||||
|
|
|
|
|
|
|
|||||||
| Future net cash flows |
549,738 | 526,999 | 506,031 | |||||||||
| 10% annual discount for estimated timing of cash flows |
(262,849 | ) | (248,952 | ) | (231,797 | ) | ||||||
|
|
|
|
|
|
|
|||||||
| Standardized measure of discounted future net cash flows |
$ | 286,889 | $ | 278,047 | $ | 274,234 | ||||||
|
|
|
|
|
|
|
|||||||
85
Table of Contents
The following are the principal sources of change in the standardized measure of discounted future net cash flows of the Company for each of the three years in the period ended December 31 (in thousands):
| 2011 | 2010 | 2009 | ||||||||||
| Standardized measure of discounted future net cash flows at beginning of year |
$ | 278,047 | $ | 274,234 | $ | 284,453 | ||||||
| Changes during the year: |
||||||||||||
| Sales and transfers of oil and natural gas produced, net of production costs |
(64,451 | ) | (71,028 | ) | (55,393 | ) | ||||||
| Net changes in prices and production costs |
67,429 | 119,370 | 1,272 | |||||||||
| Extensions and discoveries, less related costs |
24,659 | 13,888 | 31,264 | |||||||||
| Development costs incurred and revisions |
13,149 | 15,656 | 28,602 | |||||||||
| Sales of reserves in place |
— | (25,267 | ) | (5,598 | ) | |||||||
| Purchases of reserves in place |
104 | — | — | |||||||||
| Revisions of previous quantity estimates |
(49,782 | ) | (58,029 | ) | (18,323 | ) | ||||||
| Net change in income taxes |
(18,691 | ) | (24,382 | ) | (24,245 | ) | ||||||
| Accretion of discount |
36,425 | 33,605 | 32,202 | |||||||||
|
|
|
|
|
|
|
|||||||
| Net change |
8,842 | 3,813 | (10,219 | ) | ||||||||
|
|
|
|
|
|
|
|||||||
| Standardized measure of discounted future net cash flows at end of year |
$ | 286,889 | $ | 278,047 | $ | 274,234 | ||||||
|
|
|
|
|
|
|
|||||||
Prices used in computing these calculations of future cash flows from estimated future production of proved reserves were $94.23, $76.80, and $58.63 per barrel of oil at December 31, 2011, 2010, and 2009, respectively, $4.05, $4.51, and $3.76 per thousand cubic feet of natural gas at December 31, 2011, 2010, and 2009, respectively and $55.85, $45.62, and $31.03 per barrel of natural gas liquids at December 31, 2011, 2010, and 2009, respectively.
| P– | QUARTERLY DATA (UNAUDITED) |
| 2011 - Quarter Ended | ||||||||||||||||
| December 31, | September 30, | June 30, | March 31, | |||||||||||||
| (In thousands except per share data) | ||||||||||||||||
| Net revenue |
$ | 12,439 | $ | 47,006 | $ | 36,782 | $ | 11,653 | ||||||||
| Net operating expenses |
25,545 | 18,456 | 19,881 | 20,008 | ||||||||||||
|
|
|
|
|
|
|
|
|
|||||||||
| Operating income (loss) |
(13,106 | ) | 28,550 | 16,901 | (8,355 | ) | ||||||||||
| Interest expense |
(3,623 | ) | (3,637 | ) | (3,563 | ) | (6,550 | ) | ||||||||
| Interest income |
1 | 1 | 3 | — | ||||||||||||
| Other income (expense) |
47 | (22 | ) | (1,163 | ) | (85 | ) | |||||||||
|
|
|
|
|
|
|
|
|
|||||||||
| Income (loss) before income taxes |
(16,681 | ) | 24,892 | 12,178 | (14,990 | ) | ||||||||||
| Income tax provision (benefit) |
(4,477 | ) | 13,116 | 3,242 | (5,079 | ) | ||||||||||
|
|
|
|
|
|
|
|
|
|||||||||
| Net income (loss) |
$ | (12,204 | ) | $ | 11,776 | $ | 8,936 | $ | (9,911 | ) | ||||||
|
|
|
|
|
|
|
|
|
|||||||||
| Basic net income (loss) applicable to common stockholders per common share |
$ | (0.46 | ) | $ | 0.45 | $ | 0.34 | $ | (0.38 | ) | ||||||
| Diluted net income (loss) applicable to common stockholders per common share |
$ | (0.46 | ) | $ | 0.45 | $ | 0.34 | $ | (0.38 | ) | ||||||
86
Table of Contents
| 2010 - Quarter Ended | ||||||||||||||||
| December 31, | September 30, | June 30, | March 31, | |||||||||||||
| (In thousands except per share data) | ||||||||||||||||
| Net revenue |
$ | 25,362 | $ | 27,083 | $ | 28,968 | $ | 30,921 | ||||||||
| Net operating expenses |
22,244 | 21,068 | 22,237 | 21,066 | ||||||||||||
|
|
|
|
|
|
|
|
|
|||||||||
| Operating income |
3,118 | 6,015 | 6,731 | 9,855 | ||||||||||||
| Interest expense |
(5,539 | ) | (5,767 | ) | (5,714 | ) | (5,635 | ) | ||||||||
| Interest income |
3 | 20 | 2 | 2 | ||||||||||||
| Other income (expense) |
28 | (268 | ) | 570 | (9 | ) | ||||||||||
|
|
|
|
|
|
|
|
|
|||||||||
| Income (loss) before income taxes |
(2,390 | ) | — | 1,589 | 4,213 | |||||||||||
| Income tax provision (benefit) |
1,904 | (1,564 | ) | (1,140 | ) | 1,795 | ||||||||||
|
|
|
|
|
|
|
|
|
|||||||||
| Net income (loss) |
$ | (4,294 | ) | $ | 1,564 | $ | 2,729 | $ | 2,418 | |||||||
|
|
|
|
|
|
|
|
|
|||||||||
| Basic net income (loss) applicable to common stockholders per common share |
$ | (0.16 | ) | $ | 0.06 | $ | 0.10 | $ | 0.09 | |||||||
| Diluted net income (loss) applicable to common stockholders per common share |
$ | (0.16 | ) | $ | 0.06 | $ | 0.10 | $ | 0.09 | |||||||
| Item 9. | Changes in and Disagreements with Accountants on Accounting and Financial Disclosure |
No items to report.
| Item 9A. | Controls and Procedures |
Conclusion Regarding the Effectiveness of Disclosure Controls and Procedures
Disclosure Controls and Procedures. We maintain controls and procedures designed to ensure that information required to be disclosed in the reports we file with the U.S. Securities and Exchange Commission (“SEC”), is recorded, processed, summarized and reported within the time periods specified in the rules and forms of the SEC and that such information is accumulated and communicated to our management, including our Chief Executive Officer and Chief Financial Officer, as appropriate, to allow for timely decisions regarding required disclosure.
Our management, including our Chief Executive Officer and Chief Financial Officer, does not expect that our disclosure controls or our internal controls over financial reporting will prevent all errors and all fraud. A control system, no matter how well conceived and operated, can provide only reasonable, not absolute, assurance that the objectives of the control system are met. Further, the design of a control system must reflect the fact that there are resource constraints, and the benefits of controls must be considered relative to their costs. Because of the inherent limitations in all control systems, no evaluation of controls can provide absolute assurance that all control issues and instances of fraud, if any, within the Company have been detected. These inherent limitations include the realities that judgments in decision-making can be faulty, and that simple errors or mistakes can occur. Additionally, controls can be circumvented by the individual acts of some persons, by collusion of two or more people, or by management override of the control. The design of any system of controls also is based, in part, upon certain assumptions about the likelihood of future events, and there can be no assurance that any design will succeed in achieving its stated goals under all potential future conditions. Over time, controls may become inadequate because of changes in conditions, or the degree of compliance with the policies or procedures may deteriorate. Because of the inherent limitations in a cost-effective control system, misstatements due to error or fraud may occur and not be detected. We monitor our disclosure controls and internal controls and make modifications as necessary; our intent in this regard is that the disclosure controls and the internal controls will be maintained as systems change and conditions warrant.
An evaluation of the effectiveness of the design and operation of our disclosure controls and procedures (as defined in Rule 13a-15(e) or Rule 15d-15(e) of the Securities Exchange Act) was performed as of the end of the
87
Table of Contents
period covered by this report. This evaluation was performed by our management, with the participation of our Chief Executive Officer and Chief Financial Officer. Based on this evaluation, our Chief Executive Officer and Chief Financial Officer concluded that these controls and procedures were effective at December 31, 2011.
Management’s Annual Report on Internal Control over Financial Reporting. Our management is responsible for establishing and maintaining effective internal control over financial reporting as defined in Rules 13a-15(f) and 15-d15(f) under the Securities Exchange Act of 1934. Our internal control over financial reporting is designed to provide reasonable assurance to our management and Board of Directors regarding the preparation and fair presentation of published financial statements. Our internal controls are designed to provide reasonable assurance that our assets are protected from unauthorized use and that transactions are executed in accordance with established authorizations and properly recorded. The internal controls are supported by written policies and are complemented by a staff of competent business process owners supported by competent and qualified external resources used to assist in testing the operating effectiveness of our internal control over financial reporting.
Our management, including our Chief Executive Officer and Chief Financial Officer, assessed the effectiveness of our internal control over financial reporting as of December 31, 2011. In making this assessment, management used the criteria set forth by the Committee of Sponsoring Organizations of the Treadway Commission (“COSO”) in Internal Control — Integrated Framework . Our management concluded that the design and operations of our internal control over financial reporting at December 31, 2011, were effective and provide reasonable assurance the books and records accurately reflect the transactions of the Company.
There was no change in our internal control over financial reporting during the year ended December 31, 2011, that materially affected, or is reasonably likely to materially affect, our internal control over financial reporting.
The effectiveness of our internal control over financial reporting has been audited by UHY LLP, an independent registered public accounting firm, as stated in their report which is included herein.
| /s/ FLOYD C. WILSON |
/s/ MARK J. MIZE | |||||
| Floyd C. Wilson Chairman, President and Chief Executive Officer March 5, 2012 |
Mark J. Mize Executive Vice President and Chief Financial Officer March 5, 2012 |
88
Table of Contents
REPORT OF INDEPENDENT REGISTERED PUBLIC ACCOUNTING FIRM
Board of Directors and Stockholders
Halcón Resources Corporation
We have audited Halcón Resources Corporation (formerly RAM Energy Resources, Inc., a Delaware corporation) and subsidiaries’ internal control over financial reporting as of December 31, 2011, based on criteria established in Internal Control — Integrated Framework issued by the Committee of Sponsoring Organizations of the Treadway Commission (COSO). The Company’s management is responsible for maintaining effective internal control over financial reporting and for its assessment of the effectiveness of internal control over financial reporting. Our responsibility is to express an opinion on the Company’s internal control over financial reporting based on our audit.
We conducted our audit in accordance with the standards of the Public Company Accounting Oversight Board (United States). Those standards require that we plan and perform the audits to obtain reasonable assurance about whether effective internal control over financial reporting was maintained in all material respects. Our audit included obtaining an understanding of internal control over financial reporting, assessing the risk that a material weakness exist, testing and evaluating the design and operating effectiveness of internal control and performing such other procedures as we considered necessary in the circumstances. We believe that our audit provides a reasonable basis for our opinion.
A company’s internal control over financial reporting is a process designed to provide reasonable assurance regarding the reliability of financial reporting and the preparation of financial statements for external purposes in accordance with generally accepted accounting principles. A company’s internal control over financial reporting includes those policies and procedures that (1) pertain to the maintenance of records that, in reasonable detail, accurately and fairly reflect the transactions and dispositions of the assets of the company; (2) provide reasonable assurance that transactions are recorded as necessary to permit preparation of financial statements in accordance with generally accepted accounting principles, and that receipts and expenditures of the company are being made only in accordance with authorizations of management and directors of the company; and (3) provide reasonable assurance regarding prevention or timely detection of unauthorized acquisition, use, or disposition of the company’s assets that could have a material effect on the financial statements.
Because of its inherent limitations, internal control over financial reporting may not prevent or detect misstatements. Also, projections of any evaluation of effectiveness to future periods are subject to the risk that controls may become inadequate because of changes in conditions, or that the degree of compliance with the policies or procedures may deteriorate.
In our opinion, Halcón Resources Corporation and subsidiaries maintained, in all material respects, effective internal control over financial reporting as of December 31, 2011, based on criteria established in Internal Control — Integrated Framework issued by COSO.
We have also audited, in accordance with the standards of the Public Company Accounting Oversight Board (United States), the consolidated balance sheets of Halcón Resources Corporation and subsidiaries as of December 31, 2011 and 2010, and the related consolidated statements of operations, stockholders’ equity (deficit), and cash flows for each of the three years in the period ended December 31, 2011, and our report dated March 5, 2012, expressed an unqualified opinion on those consolidated financial statements.
/s/ UHY LLP
Houston, Texas
March 5, 2012
89
Table of Contents
| Item 9B. | Other Information |
No items to report.
PART III
| Item 10. | Directors, Executive Officers and Corporate Governance |
We have adopted a code of ethics that applies to all directors, officers and employees, including our principal executive officer and principal accounting officer. A copy of our code of ethics is available on our website at www.halconresources.com. We intend to disclose any amendments to or waivers of our code of ethics by posting the required information on our website, www.halconresources.com, or by filing a Form 8-K within the required time periods.
The information required by this item will be set forth in our Definitive Proxy Statement on Schedule 14A relating to our 2012 Annual Meeting, which will be filed with the Securities and Exchange Commission pursuant to Regulation 14A under the Securities Exchange Act of 1934, as amended, (the “Proxy Statement”). The Proxy Statement relates to a meeting of stockholders involving the election of directors and the portions therefrom required to be set forth in this Form 10-K by this item are incorporated herein by reference pursuant to General Instruction G(3) to Form 10-K.
| Item 11. | Executive Compensation |
The information required by this item will be set forth in the Proxy Statement. The Proxy Statement relates to a meeting of stockholders involving the election of directors and the portions therefrom required to be set forth in this Form 10-K by this item are incorporated herein by reference pursuant to General Instruction G(3) to Form 10-K.
| Item 12. | Security Ownership of Certain Beneficial Owners and Management and Related Stockholder Matters |
The information required by this item will be set forth in the Proxy Statement. The Proxy Statement relates to a meeting of stockholders involving the election of directors and the portions therefrom required to be set forth in this Form 10-K by this item are incorporated herein by reference pursuant to General Instruction G(3) to Form 10-K.
| Item 13. | Certain Relationships and Related Transactions and Director Independence |
The information required by this item will be set forth in the Proxy Statement. The Proxy Statement relates to a meeting of stockholders involving the election of directors and the portions therefrom required to be set forth in this Form 10-K by this item are incorporated herein by reference pursuant to General Instruction G(3) to Form 10-K.
| Item 14. | Principal Accountant Fees and Services |
The information required by this item will be set forth in the Proxy Statement. The Proxy Statement relates to a meeting of stockholders involving the election of directors and the portions therefrom required to be set forth in this Form 10-K by this item are incorporated herein by reference pursuant to General Instruction G(3) to Form 10-K.
90
Table of Contents
PART IV
| Item 15. | Exhibits and Financial Statement Schedules |
(a) (1) The following consolidated financial statements of Halcón Resources Corporation are included in Item 8:
| Halcón Resources Corporation | ||||
| Report of Independent Registered Public Accounting Firm |
60 | |||
| Consolidated Balance Sheets as of December 31, 2011 and 2010 |
61 | |||
| Consolidated Statements of Operations for the years ended December 31, 2011, 2010 and 2009 |
62 | |||
| Consolidated Statements of Stockholders’ Equity (Deficit) for the years ended December 31, 2011, 2010 and 2009 |
63 | |||
| Consolidated Statements of Cash Flows for the years ended December 31, 2011, 2010 and 2009 |
64 | |||
| Notes to Consolidated Financial Statements |
65 | |||
All other schedules have been omitted since the required information is not present, or not present in amounts sufficient to require submission of the schedule, or because the information required is included in the consolidated financial statements or notes thereto.
(a) (3) Exhibits
The following exhibits are filed as a part of this report:
| Exhibit |
Description |
Method of Filing | ||
| 2.1 | Securities Purchase Agreement dated December 21, 2011 by and between RAM Energy Resources, Inc. and Halcon Resources LLC. | (26) [2.1] | ||
| 2.1.1 | First Amendment to Securities Purchase Agreement dated January 4, 2012 by and between RAM Energy Resources, Inc. and Halcon Resources LLC | (27) [2.1.1] | ||
| 3.1 | Amended and Restated Certificate of Incorporation of the Company dated February 8, 2012 |
(28) [3.1] | ||
| 3.1.1 | Amendment of the Amended and Restated Certificate of Incorporation of the Company, effective as of February 10, 2012 | (28) [3.2] | ||
| 3.2 | Second Amended and Restated Bylaws of the Company | (27) [3.2] | ||
| 4.1 | Convertible Promissory Note, dated February 8, 2012, between the Company and Halcon Resources LLC | (28) [4.1] | ||
| 4.2 | Warrant Certificate, dated February 8, 2012, between the Company and Halcon Resources LLC | (28) [4.2] | ||
| 4.3 | Registration Rights Agreement, dated February 8, 2012, between the Company and Halcon Resources LLC | (28) [4.3] | ||
| 10.1 | Employment Agreement between Registrant and Larry E. Lee dated May 8, 2006.* | (1) [10.15] | ||
| 10.1.1 | First Amendment to Employment Agreement between Registrant and Larry E. Lee dated October 18, 2006.* | (5) [10.1] | ||
| 10.1.2 | Second Amendment to Employment Agreement of Larry E. Lee dated February 25, 2008.* | (10) [10.6.2] | ||
| 10.1.3 | Third Amendment to Employment Agreement of Larry E. Lee dated December 30, 2008.* | (13) [10.6.3] | ||
| 10.1.4 | Fourth Amendment to Employment Agreement of Larry E. Lee dated March 24, 2009.* | (14) [10.6.4] | ||
91
Table of Contents
| Exhibit |
Description |
Method of Filing | ||
| 10.1.5 | Fifth Amendment to Employment Agreement of Larry E. Lee dated March 17, 2010.* | (17) [10.6.5] | ||
| 10.1.6 | Sixth Amendment to Employment Agreement of Larry E. Lee dated March 8, 2011.* | (21) [10.2.6] | ||
| 10.2 | Agreement between RAM and Shell Trading-US dated February 1, 2006. | (1) [10.22] | ||
| 10.3 | Agreement between RAM and Targa dated January 30, 1998. | (1) [10.23] | ||
| 10.3.1 | Amendment to Agreement between RAM Energy and Targa dated effective as of April 1, 2006, filed as an exhibit to Registrant’s Form 8-K dated June 5, 2006, and incorporated by reference herein. | (6) [10.23.1] | ||
| 10.4 | Long-Term Incentive Plan of the Registrant. Included as Annex C of the Registrant’s Definitive Proxy Statement (No. 000-50682), dated April 12, 2006, and incorporated by reference herein.* | (4) [Annex C] | ||
| 10.4.1 | First Amendment to the RAM Energy Resources, Inc. 2006 Long-Term Incentive Plan effective May 8, 2008.* | (11) [Exhibit A] | ||
| 10.4.2 | Second Amendment to the RAM Energy Resources, Inc. 2006 Long-Term Incentive Plan effective May 3, 2010.* | (18) [10.8.2] | ||
| 10.4.3 | Third Amendment to the RAM Energy Resources, Inc. 2006 Long-Term Incentive Plan | (28) [10.3] | ||
| 10.5 | Deferred Bonus Compensation Plan of RAM Energy, Inc. dated as of April 21, 2004.* | (7) [10.14] | ||
| 10.6 | Loan Agreement dated November 29, 2007, by and between RAM Energy Resources, Inc., as Borrower, and Guggenheim Corporate Funding, LLC, as the Arranger and Administrative Agent, Wells Fargo Foothill, Inc., as the Documentation Agent and WestLB AG, New York Branch and CIT Capital USA Inc., as the Co-Syndication Agents, and the financial institutions named therein as the Lenders. | (9) [10.1] | ||
| 10.6.1 | First Amendment to Loan Agreement dated February 6, 2009, by and between RAM Energy Resources, Inc., as Borrower, and Guggenheim Corporate Funding, LLC, as the Arranger and Administrative Agent, Wells Fargo Foothill, Inc., as the Documentation Agent and WestLB AG, New York Branch and CIT Capital USA Inc., as the Co-Syndication Agents, and the financial institutions named therein as the Lenders. | (15) [10.17.1] | ||
| 10.6.2 | Second Amendment to Loan Agreement dated June 26, 2009, by and between RAM Energy Resources, Inc., as Borrower, and Guggenheim Corporate Funding, LLC, as the Arranger and Administrative Agent, Wells Fargo Foothill, Inc., as the Documentation Agent and WestLB AG, New York Branch and CIT Capital USA Inc., as the Co-Syndication Agents, and the financial institutions named therein as the Lenders. | (16) [10.17.2] | ||
| 10.6.3 | Third Amendment to Loan Agreement dated November 29, 2010, effective December 3, 2010, by and between RAM Energy Resources, Inc., as Borrower, and Guggenheim Corporate Funding, LLC, as the Arranger and Administrative Agent, Wells Fargo Foothill, Inc., as the Documentation Agent and WestLB AG, New York Branch and CIT Capital USA Inc., as the Co-Syndication Agents, and the financial institutions named therein as the Lenders. | (20) [10.8.3] | ||
| 10.7 | Description of Compensation Arrangement with G. Les Austin.* | (12) [10.18] | ||
92
Table of Contents
| Exhibit |
Description |
Method of Filing | ||
| 10.7.1 | First Amendment to Employment Agreement of G. Les Austin dated December 30, 2008.* | (13) [10.18.1] | ||
| 10.7.2 | Second Amendment to Employment Agreement of G. Les Austin, dated March 23, 2011.* | (24) [10.11.2] | ||
| 10.8 | Change in Control Separation Benefit Plan of Ram Energy Resources, Inc. and Participating Subsidiaries. | (15) [10.19] | ||
| 10.9 | Purchase and Sale Agreement dated October 29, 2010, by and between RWG Energy, Inc., as Seller, and Milagro Producing, LLC, as Buyer. | (19) [10.13] | ||
| 10.10 | Revolving Credit Agreement dated March 14, 2011 among RAM Energy Resources, Inc., as Borrower, SunTrust Bank, as Administrative Agent, Capital One, N.A., as Syndication Agent, and the financial institutions named therein as the Lenders | (22) [10.14] | ||
| 10.11.1 | First Amendment to Revolving Credit Agreement dated as of June 10, 2011, by and between RAM Energy Resources, Inc., as Borrower, and Sun Trust Bank, as Administrative Agent, Capital One, N.A., as Syndication Agent, and the financial institutions named therein as the Lenders. | (25) [10.14.1] | ||
| 10.12 | Second Lien Term Loan Agreement dated March 14, 2011 among RAM Energy Resources, Inc., as Borrower, Guggenheim Corporate Funding, LLC, as Administrative Agent, and the financial institutions named therein as the Lenders | (22) [10.15] | ||
| 10.13 | Equity Distribution Agreement, dated March 17, 2011. | (23) [1.1] | ||
| 10.14 | Senior Revolving Credit Agreement, dated as of February 8, 2012, among the Company, as Borrower, JPMorgan Chase Bank, N.A., as Administrative Agent, Wells Fargo Bank, N.A. as Syndication Agent, Bank of Montreal, as Documentation Agent, and the Lenders Party thereto | (28) [10.1] | ||
| 10.15 | Guarantee and Collateral Agreement, dated February 8, 2012, among the Grantors named therein and JPMorgan Chase Bank, N.A., as Administrative Agent | (28) [10.2] | ||
| 21.1 | Subsidiaries of the Registrant. | ** | ||
| 23.1 | Consent of UHY LLP. | ** | ||
| 23.2 | Consent of Forrest A. Garb & Associates, Inc. | ** | ||
| 31.1 | Rule 13(A) — 14(A) Certification of our Principal Executive Officer. | ** | ||
| 31.2 | Rule 13(A) — 14(A) Certification of our Principal Financial Officer. | ** | ||
| 32.1 | Section 1350 Certification of our Principal Executive Officer. | ** | ||
| 32.2 | Section 1350 Certification of our Principal Financial Officer. | ** | ||
| 99.1 | Report of Forrest A. Garb & Associates, Inc. | ** | ||
| 101.INS | XBRL Instance Document | *** | ||
| 101.SCH | XBRL Taxonomy Extension Schema Document | *** | ||
| 101.CAL | XBRL Taxonomy Extension Calculation Linkbase Document | *** | ||
| 101.DEF | XBRL Taxonomy Extension Definition Document | *** | ||
| 101.LAB | XBRL Taxonomy Extension Label Linkbase Document | *** | ||
| 101.PRE | XBRL Taxonomy Extension Presentation Linkbase Document | *** | ||
| * | Management contract or compensatory plan or arrangement. |
93
Table of Contents
| ** | Filed herewith. |
| *** | Furnished with this report. In accordance with Rule 406T of Regulation S-T, the information in these exhibits shall not be deemed to be “filed” for purposes of Section 18 of the Securities Exchange Act of 1934, as amended, or otherwise subject to liability under that section, and shall not be incorporated by reference into any registration statement or other document filed under the Securities Act of 1933, as amended, except as expressly set forth by specific reference in such filing. |
| (1) | Filed as an exhibit to the Registrant’s Current Report on Form 8-K filed on May 12, 2006, as the exhibit number indicated in brackets and incorporated by reference herein. |
| (2) | Filed as an exhibit to the Registrant’s Registration Statement on Form S-1 (SEC File No. 333-113583) as the exhibit number indicated in brackets and incorporated by reference herein. |
| (3) | Filed as an exhibit to the Registrant’s Current Report on Form 8-K filed on October 26, 2005, as the exhibit number indicated in brackets and incorporated by reference herein. |
| (4) | Included as an annex to the Registrant’s Definitive Proxy Statement (No. 000-50682), dated April 12, 2006, as the annex letter indicated in brackets and incorporated by reference herein. |
| (5) | Filed as an exhibit to the Registrant’s Current Report on Form 8-K on October 20, 2006, as the exhibit number indicated in brackets and incorporated by reference herein. |
| (6) | Filed as an exhibit to the Registrant’s Current Report on Form 8-K on June 5, 2006, as the exhibit number indicated in brackets and incorporated by reference herein. |
| (7) | Filed as an exhibit to the Registrant’s Registration Statement on Form S-1 (SEC File No. 333-138922) as the exhibit number indicated in brackets and incorporated by reference herein. |
| (8) | Filed as an exhibit to the Registrant’s Current Report on Form 8-K filed on February 2, 2007, as the exhibit number indicated in brackets and incorporated by reference herein. |
| (9) | Filed as an exhibit to Registrant’s Form 8-K dated November 29, 2007, as the exhibit number indicated in brackets and incorporated by reference herein. |
| (10) | Filed as an exhibit to Registrant’s Form 8-K dated February 26, 2008, as the exhibit number indicated in brackets and incorporated by reference herein. |
| (11) | Filed as an exhibit to Registrant’s Definitive Proxy Statement (No. 000-50682), dated April 14, 2008, as the exhibit number indicated in brackets and incorporated by reference herein. |
| (12) | Filed as an exhibit to Registrant’s Form 10-Q dated May 9, 2008, as the exhibit number indicated in brackets and incorporated by reference herein. |
| (13) | Filed as an exhibit to Registrant’s Form 8-K dated January 5, 2009, as the exhibit number indicated in brackets and incorporated by reference herein. |
| (14) | Filed as an exhibit to Registrant’s Form 8-K dated March 25, 2009, as the exhibit number indicated in brackets and incorporated by reference herein. |
| (15) | Filed as an exhibit to Registrant’s Annual Report on Form 10-K filed on March 12, 2009, as the exhibit number indicated in brackets and incorporated by reference herein. |
| (16) | Filed as an exhibit to Registrant’s Form 8-K filed July 2, 2009, as the exhibit number indicated in brackets and incorporated by reference herein. |
| (17) | Filed as an exhibit to Registrant’s Form 8-K filed March 18, 2010, as the exhibit number indicated in brackets and incorporated by reference herein. |
| (18) | Filed as an exhibit to Registrant’s Form 8-K filed May 7, 2010, as the exhibit number indicated in brackets and incorporated by reference herein. |
| (19) | Filed as an exhibit to Registrant’s Form 8-K filed November 2, 2010, as the exhibit number indicated in brackets and incorporated by reference herein. |
| (20) | Filed as an exhibit to Registrant’s Form 8-K filed December 8, 2010, as the exhibit number indicated in brackets and incorporated by reference herein. |
| (21) | Filed as an exhibit to Registrant’s Form 8-K filed March 10, 2011, as the exhibit number indicated in brackets and incorporated by reference herein. |
| (22) | Filed as an exhibit to Registrant’s Form 10-K filed March 16, 2011, as the exhibit number indicated in brackets and incorporated by reference herein. |
| (23) | Filed as an exhibit to Registrant’s Form 8-K filed March 17, 2011, as the exhibit number indicated in brackets and incorporated by reference herein. |
94
Table of Contents
| (24) | Filed as an exhibit to Registrant’s Form 8-K filed March 24, 2011, as the exhibit number indicated in brackets and incorporated by reference herein. |
| (25) | Filed as an exhibit to Registrant’s Form 8-K filed June 15, 2011, as the exhibit number indicated in brackets and incorporated by reference herein. |
| (26) | Filed as an exhibit to Registrant’s Form 8-K filed December 22, 2011, as the exhibit number indicated in brackets and incorporated by reference herein. |
| (27) | Filed as an exhibit to Registrant’s Form 8-K filed January 5, 2012, as the exhibit number indicated in brackets and incorporated by reference herein. |
| (28) | Filed as an exhibit to Registrant’s Form 8-K filed February 9, 2012, as the exhibit number indicated in brackets and incorporated by reference herein. |
95
Table of Contents
SIGNATURES
Pursuant to the requirements of Section 13 or 15(d) of the Securities Exchange Act of 1934, the registrant has duly caused this report to be signed on its behalf by the undersigned, thereunto duly authorized, in the City of Tulsa, State of Oklahoma, on March 5, 2012.
| HALCÓN RESOURCES CORPORATION | ||
| By | /s/ FLOYD C. WILSON | |
| Floyd C. Wilson, | ||
| Chairman of the Board, President and Chief Executive Officer | ||
Pursuant to the requirements of the Securities Exchange Act of 1934, this report has been signed by the following persons in the capacities indicated, on March 5, 2012.
| Signature |
Title | |
| /s/ FLOYD C. WILSON Floyd C. Wilson |
Chairman of the Board, President and Chief Executive Officer and Director (Principal Executive Officer) | |
| /s/ MARK J. MIZE Mark J. Mize |
Executive Vice President and Chief Financial Officer (Principal Financial Officer and Principal Accounting Officer) | |
| /s/ DAVID B. MILLER David B. Miller |
Director | |
| /s/ E. MURPHY MARKHAM IV E. Murphy Markham IV |
Director | |
| /s/ MARK A. WELSH IV Mark A. Welsh IV |
Director | |
| /s/ DANIEL A. RIOUX Daniel A. Rioux |
Director | |
| /s/ TUCKER S. BRIDWELL Tucker S. Bridwell |
Director | |
| /s/ JAMES L. IRISH III James L. Irish III |
Director | |
| /s/ THOMAS R. FULLER Thomas R. Fuller |
Director | |
| /s/ STEPHEN P. SMILEY Stephen P. Smiley |
Director | |
| /s/ JAMES W. CHRISTMAS James W. Christmas |
Director | |
96
Table of Contents
INDEX TO EXHIBITS
| Exhibit |
Description |
Method of Filing | ||
| 2.1 | Securities Purchase Agreement dated December 21, 2011 by and between RAM Energy Resources, Inc. and Halcon Resources LLC. | (26) [2.1] | ||
| 2.1.1 | First Amendment to Securities Purchase Agreement dated January 4, 2012 by and between RAM Energy Resources, Inc. and Halcon Resources LLC | (27) [2.1.1] | ||
| 3.1 | Amended and Restated Certificate of Incorporation of the Company dated February 8, 2012 | (28) [3.1] | ||
| 3.1.1 | Amendment of the Amended and Restated Certificate of Incorporation of the Company, effective as of February 10, 2012 | (28) [3.2] | ||
| 3.2 | Second Amended and Restated Bylaws of the Company | (27) [3.2] | ||
| 4.1 | Convertible Promissory Note, dated February 8, 2012, between the Company and Halcon Resources LLC | (28) [4.1] | ||
| 4.2 | Warrant Certificate, dated February 8, 2012, between the Company and Halcon Resources LLC | (28) [4.2] | ||
| 4.3 | Registration Rights Agreement, dated February 8, 2012, between the Company and Halcon Resources LLC | (28) [4.3] | ||
| 10.1 | Employment Agreement between Registrant and Larry E. Lee dated May 8, 2006.* | (1) [10.15] | ||
| 10.1.1 | First Amendment to Employment Agreement between Registrant and Larry E. Lee dated October 18, 2006.* | (5) [10.1] | ||
| 10.1.2 | Second Amendment to Employment Agreement of Larry E. Lee dated February 25, 2008.* | (10) [10.6.2] | ||
| 10.1.3 | Third Amendment to Employment Agreement of Larry E. Lee dated December 30, 2008.* | (13) [10.6.3] | ||
| 10.1.4 | Fourth Amendment to Employment Agreement of Larry E. Lee dated March 24, 2009.* | (14) [10.6.4] | ||
| 10.1.5 | Fifth Amendment to Employment Agreement of Larry E. Lee dated March 17, 2010.* | (17) [10.6.5] | ||
| 10.1.6 | Sixth Amendment to Employment Agreement of Larry E. Lee dated March 8, 2011.* | (21) [10.2.6] | ||
| 10.2 | Agreement between RAM and Shell Trading-US dated February 1, 2006. | (1) [10.22] | ||
| 10.3 | Agreement between RAM and Targa dated January 30, 1998. | (1) [10.23] | ||
| 10.3.1 | Amendment to Agreement between RAM Energy and Targa dated effective as of April 1, 2006, filed as an exhibit to Registrant’s Form 8-K dated June 5, 2006, and incorporated by reference herein. | (6) [10.23.1] | ||
| 10.4 | Long-Term Incentive Plan of the Registrant. Included as Annex C of the Registrant’s Definitive Proxy Statement (No. 000-50682), dated April 12, 2006, and incorporated by reference herein.* | (4) [Annex C] | ||
| 10.4.1 | First Amendment to the RAM Energy Resources, Inc. 2006 Long-Term Incentive Plan effective May 8, 2008.* | (11) [Exhibit A] | ||
| 10.4.2 | Second Amendment to the RAM Energy Resources, Inc. 2006 Long-Term Incentive Plan effective May 3, 2010.* | (18) [10.8.2] | ||
97
Table of Contents
| Exhibit |
Description |
Method of Filing | ||
| 10.4.3 | Third Amendment to the RAM Energy Resources, Inc. 2006 Long-Term Incentive Plan | (28) [10.3] | ||
| 10.5 | Deferred Bonus Compensation Plan of RAM Energy, Inc. dated as of April 21, 2004.* | (7) [10.14] | ||
| 10.6 | Loan Agreement dated November 29, 2007, by and between RAM Energy Resources, Inc., as Borrower, and Guggenheim Corporate Funding, LLC, as the Arranger and Administrative Agent, Wells Fargo Foothill, Inc., as the Documentation Agent and WestLB AG, New York Branch and CIT Capital USA Inc., as the Co-Syndication Agents, and the financial institutions named therein as the Lenders. | (9) [10.1] | ||
| 10.6.1 | First Amendment to Loan Agreement dated February 6, 2009, by and between RAM Energy Resources, Inc., as Borrower, and Guggenheim Corporate Funding, LLC, as the Arranger and Administrative Agent, Wells Fargo Foothill, Inc., as the Documentation Agent and WestLB AG, New York Branch and CIT Capital USA Inc., as the Co-Syndication Agents, and the financial institutions named therein as the Lenders. | (15) [10.17.1] | ||
| 10.6.2 | Second Amendment to Loan Agreement dated June 26, 2009, by and between RAM Energy Resources, Inc., as Borrower, and Guggenheim Corporate Funding, LLC, as the Arranger and Administrative Agent, Wells Fargo Foothill, Inc., as the Documentation Agent and WestLB AG, New York Branch and CIT Capital USA Inc., as the Co-Syndication Agents, and the financial institutions named therein as the Lenders. | (16) [10.17.2] | ||
| 10.6.3 | Third Amendment to Loan Agreement dated November 29, 2010, effective December 3, 2010, by and between RAM Energy Resources, Inc., as Borrower, and Guggenheim Corporate Funding, LLC, as the Arranger and Administrative Agent, Wells Fargo Foothill, Inc., as the Documentation Agent and WestLB AG, New York Branch and CIT Capital USA Inc., as the Co-Syndication Agents, and the financial institutions named therein as the Lenders. | (20) [10.8.3] | ||
| 10.7 | Description of Compensation Arrangement with G. Les Austin.* | (12) [10.18] | ||
| 10.7.1 | First Amendment to Employment Agreement of G. Les Austin dated December 30, 2008.* | (13) [10.18.1] | ||
| 10.7.2 | Second Amendment to Employment Agreement of G. Les Austin, dated March 23, 2011.* | (24) [10.11.2] | ||
| 10.8 | Change in Control Separation Benefit Plan of Ram Energy Resources, Inc. and Participating Subsidiaries. | (15) [10.19] | ||
| 10.9 | Purchase and Sale Agreement dated October 29, 2010, by and between RWG Energy, Inc., as Seller, and Milagro Producing, LLC, as Buyer. | (19) [10.13] | ||
| 10.10 | Revolving Credit Agreement dated March 14, 2011 among RAM Energy Resources, Inc., as Borrower, SunTrust Bank, as Administrative Agent, Capital One, N.A., as Syndication Agent, and the financial institutions named therein as the Lenders | (22) [10.14] | ||
| 10.11.1 | First Amendment to Revolving Credit Agreement dated as of June 10, 2011, by and between RAM Energy Resources, Inc., as Borrower, and Sun Trust Bank, as Administrative Agent, Capital One, N.A., as Syndication Agent, and the financial institutions named therein as the Lenders. | (25) [10.14.1] | ||
98
Table of Contents
| Exhibit |
Description |
Method of Filing | ||
| 10.12 | Second Lien Term Loan Agreement dated March 14, 2011 among RAM Energy Resources, Inc., as Borrower, Guggenheim Corporate Funding, LLC, as Administrative Agent, and the financial institutions named therein as the Lenders | (22) [10.15] | ||
| 10.13 | Equity Distribution Agreement, dated March 17, 2011. | (23) [1.1] | ||
| 10.14 | Senior Revolving Credit Agreement, dated as of February 8, 2012, among the Company, as Borrower, JPMorgan Chase Bank, N.A., as Administrative Agent, Wells Fargo Bank, N.A. as Syndication Agent, Bank of Montreal, as Documentation Agent, and the Lenders Party thereto | (28) [10.1] | ||
| 10.15 | Guarantee and Collateral Agreement, dated February 8, 2012, among the Grantors named therein and JPMorgan Chase Bank, N.A., as Administrative Agent | (28) [10.2] | ||
| 21.1 | Subsidiaries of the Registrant. | ** | ||
| 23.1 | Consent of UHY LLP. | ** | ||
| 23.2 | Consent of Forrest A. Garb & Associates, Inc. | ** | ||
| 31.1 | Rule 13(A) — 14(A) Certification of our Principal Executive Officer. | ** | ||
| 31.2 | Rule 13(A) — 14(A) Certification of our Principal Financial Officer. | ** | ||
| 32.1 | Section 1350 Certification of our Principal Executive Officer. | ** | ||
| 32.2 | Section 1350 Certification of our Principal Financial Officer. | ** | ||
| 99.1 | Report of Forrest A. Garb & Associates, Inc. | ** | ||
| 101.INS | XBRL Instance Document | *** | ||
| 101.SCH | XBRL Taxonomy Extension Schema Document | *** | ||
| 101.CAL | XBRL Taxonomy Extension Calculation Linkbase Document | *** | ||
| 101.DEF | XBRL Taxonomy Extension Definition Document | *** | ||
| 101.LAB | XBRL Taxonomy Extension Label Linkbase Document | *** | ||
| 101.PRE | XBRL Taxonomy Extension Presentation Linkbase Document | *** | ||
| * | Management contract or compensatory plan or arrangement. |
| ** | Filed herewith. |
| *** | Furnished with this report. In accordance with Rule 406T of Regulation S-T, the information in these exhibits shall not be deemed to be “filed” for purposes of Section 18 of the Securities Exchange Act of 1934, as amended, or otherwise subject to liability under that section, and shall not be incorporated by reference into any registration statement or other document filed under the Securities Act of 1933, as amended, except as expressly set forth by specific reference in such filing. |
| (1) | Filed as an exhibit to the Registrant’s Current Report on Form 8-K filed on May 12, 2006, as the exhibit number indicated in brackets and incorporated by reference herein. |
| (2) | Filed as an exhibit to the Registrant’s Registration Statement on Form S-1 (SEC File No. 333-113583) as the exhibit number indicated in brackets and incorporated by reference herein. |
| (3) | Filed as an exhibit to the Registrant’s Current Report on Form 8-K filed on October 26, 2005, as the exhibit number indicated in brackets and incorporated by reference herein. |
| (4) | Included as an annex to the Registrant’s Definitive Proxy Statement (No. 000-50682), dated April 12, 2006, as the annex letter indicated in brackets and incorporated by reference herein. |
| (5) | Filed as an exhibit to the Registrant’s Current Report on Form 8-K on October 20, 2006, as the exhibit number indicated in brackets and incorporated by reference herein. |
| (6) | Filed as an exhibit to the Registrant’s Current Report on Form 8-K on June 5, 2006, as the exhibit number indicated in brackets and incorporated by reference herein. |
99
Table of Contents
| (7) | Filed as an exhibit to the Registrant’s Registration Statement on Form S-1 (SEC File No. 333-138922) as the exhibit number indicated in brackets and incorporated by reference herein. |
| (8) | Filed as an exhibit to the Registrant’s Current Report on Form 8-K filed on February 2, 2007, as the exhibit number indicated in brackets and incorporated by reference herein. |
| (9) | Filed as an exhibit to Registrant’s Form 8-K dated November 29, 2007, as the exhibit number indicated in brackets and incorporated by reference herein. |
| (10) | Filed as an exhibit to Registrant’s Form 8-K dated February 26, 2008, as the exhibit number indicated in brackets and incorporated by reference herein. |
| (11) | Filed as an exhibit to Registrant’s Definitive Proxy Statement (No. 000-50682), dated April 14, 2008, as the exhibit number indicated in brackets and incorporated by reference herein. |
| (12) | Filed as an exhibit to Registrant’s Form 10-Q dated May 9, 2008, as the exhibit number indicated in brackets and incorporated by reference herein. |
| (13) | Filed as an exhibit to Registrant’s Form 8-K dated January 5, 2009, as the exhibit number indicated in brackets and incorporated by reference herein. |
| (14) | Filed as an exhibit to Registrant’s Form 8-K dated March 25, 2009, as the exhibit number indicated in brackets and incorporated by reference herein. |
| (15) | Filed as an exhibit to Registrant’s Annual Report on Form 10-K filed on March 12, 2009, as the exhibit number indicated in brackets and incorporated by reference herein. |
| (16) | Filed as an exhibit to Registrant’s Form 8-K filed July 2, 2009, as the exhibit number indicated in brackets and incorporated by reference herein. |
| (17) | Filed as an exhibit to Registrant’s Form 8-K filed March 18, 2010, as the exhibit number indicated in brackets and incorporated by reference herein. |
| (18) | Filed as an exhibit to Registrant’s Form 8-K filed May 7, 2010, as the exhibit number indicated in brackets and incorporated by reference herein. |
| (19) | Filed as an exhibit to Registrant’s Form 8-K filed November 2, 2010, as the exhibit number indicated in brackets and incorporated by reference herein. |
| (20) | Filed as an exhibit to Registrant’s Form 8-K filed December 8, 2010, as the exhibit number indicated in brackets and incorporated by reference herein. |
| (21) | Filed as an exhibit to Registrant’s Form 8-K filed March 10, 2011, as the exhibit number indicated in brackets and incorporated by reference herein. |
| (22) | Filed as an exhibit to Registrant’s Form 10-K filed March 16, 2011, as the exhibit number indicated in brackets and incorporated by reference herein. |
| (23) | Filed as an exhibit to Registrant’s Form 8-K filed March 17, 2011, as the exhibit number indicated in brackets and incorporated by reference herein. |
| (24) | Filed as an exhibit to Registrant’s Form 8-K filed March 24, 2011, as the exhibit number indicated in brackets and incorporated by reference herein. |
| (25) | Filed as an exhibit to Registrant’s Form 8-K filed June 15, 2011, as the exhibit number indicated in brackets and incorporated by reference herein. |
| (26) | Filed as an exhibit to Registrant’s Form 8-K filed December 22, 2011, as the exhibit number indicated in brackets and incorporated by reference herein. |
| (27) | Filed as an exhibit to Registrant’s Form 8-K filed January 5, 2012, as the exhibit number indicated in brackets and incorporated by reference herein. |
| (28) | Filed as an exhibit to Registrant’s Form 8-K filed February 9, 2012, as the exhibit number indicated in brackets and incorporated by reference herein. |
100