Attached files
| file | filename |
|---|---|
| EX-99.1 - EX-99.1 - BATTALION OIL CORP | a2234329zex-99_1.htm |
| EX-32 - EX-32 - BATTALION OIL CORP | a2234329zex-32.htm |
| EX-31.2 - EX-31.2 - BATTALION OIL CORP | a2234329zex-31_2.htm |
| EX-31.1 - EX-31.1 - BATTALION OIL CORP | a2234329zex-31_1.htm |
| EX-23.2 - EX-23.2 - BATTALION OIL CORP | a2234329zex-23_2.htm |
| EX-23.1 - EX-23.1 - BATTALION OIL CORP | a2234329zex-23_1.htm |
| EX-21.1 - EX-21.1 - BATTALION OIL CORP | a2234329zex-21_1.htm |
| EX-12.1 - EX-12.1 - BATTALION OIL CORP | a2234329zex-12_1.htm |
| EX-10.23 - EX-10.23 - BATTALION OIL CORP | a2234329zex-10_23.htm |
| EX-10.22 - EX-10.22 - BATTALION OIL CORP | a2234329zex-10_22.htm |
| EX-10.21 - EX-10.21 - BATTALION OIL CORP | a2234329zex-10_21.htm |
Use these links to rapidly review the document
TABLE OF CONTENTS
ITEM 8. CONSOLIDATED FINANCIAL STATEMENTS AND SUPPLEMENTARY DATA
UNITED STATES
SECURITIES AND EXCHANGE COMMISSION
WASHINGTON, D.C. 20549
FORM 10-K
ANNUAL REPORT PURSUANT TO SECTION 13 OR 15(d) OF
THE SECURITIES EXCHANGE ACT OF 1934
For the fiscal year ended December 31, 2017
Commission File Number: 001-35467
Halcón Resources Corporation
(Exact name of registrant as specified in its charter)
| Delaware (State or other jurisdiction of incorporation or organization) |
20-0700684 (I.R.S. Employer Identification Number) |
1000 Louisiana Street, Suite 1500, Houston, TX 77002
(Address of principal executive offices)
(832) 538-0300
(Registrant's telephone number)
Securities registered pursuant to Section 12(b) of the Act:
| Title of each class | Name of each exchange on which registered | |
|---|---|---|
| Common Stock, par value $.0001 per share | New York Stock Exchange |
Securities registered pursuant to Section 12(g) of the Act: None
Indicate by check mark if the registrant is a well-known seasoned issuer, as defined in Rule 405 of the Securities Act. Yes ý No o
Indicate by check mark if the registrant is not required to file reports pursuant to Section 13 or Section 15(d) of the Act. Yes o No ý
Indicate by check mark whether the registrant (1) has filed all reports required to be filed by Section 13 or 15(d) of the Securities Exchange Act of 1934 during the preceding 12 months (or for such shorter period that the registrant was required to file such reports) and (2) has been subject to such filing requirements for the past 90 days. Yes ý No o
Indicate by check mark whether the registrant has submitted electronically and posted on its corporate Web site, if any, every Interactive Data File required to be submitted and posted pursuant to Rule 405 of Regulation S-T (§232.405 of this chapter) during the preceding 12 months (or for such shorter period that the registrant was required to submit and post such files). Yes ý No o
Indicate by check mark if disclosure of delinquent filers pursuant to Item 405 of Regulation S-K (§229.405 of this chapter) is not contained herein, and will not be contained, to the best of registrant's knowledge, in definitive proxy or information statements incorporated by reference in Part III of this Form 10-K or any amendment to this Form 10-K. ý
Indicate by check mark whether the registrant is a large accelerated filer, an accelerated filer, a non-accelerated filer, a smaller reporting company, or an emerging growth company. See the definitions of "large accelerated filer," "accelerated filer," "smaller reporting company" and "emerging growth company" in Rule 12b-2 of the Exchange Act.
| Large accelerated filer o | Accelerated filer ý | Non-accelerated filer o (Do not check if a smaller reporting company) |
Smaller reporting company o Emerging growth company o |
If an emerging growth company, indicate by check mark if the registrant has elected not to use the extended transition period for complying with any new or revised financial accounting standards provided pursuant to Section 13(a) of the Exchange Act. o
Indicate by check mark whether the registrant is a shell company (as defined in Rule 12b-2 of the Act). Yes o No ý
As of February 23, 2018, there were 158,586,610 shares outstanding of registrant's $.0001 par value common stock. Based upon the closing price for the registrant's common stock on the New York Stock Exchange as of June 30, 2017, the aggregate market value of shares of common stock held by non-affiliates of the registrant was approximately $421.7 million.
DOCUMENTS INCORPORATED BY REFERENCE
Information required by Part III, Items 10, 11, 12, 13, and 14, is incorporated by reference to portions of the registrant's definitive proxy statement for its 2018 annual meeting of stockholders which will be filed no later than 120 days after December 31, 2017.
2
Special note regarding forward-looking statements
This Annual Report on Form 10-K contains forward-looking statements within the meaning of the federal securities laws. All statements, other than statements of historical facts, concerning, among other things, planned capital expenditures, potential increases in oil and natural gas production, the number and location of wells to be drilled in the future, future cash flows and borrowings, pursuit of potential acquisition opportunities, our financial position, business strategy and other plans and objectives for future operations, are forward-looking statements. These forward-looking statements are identified by their use of terms and phrases such as "may," "expect," "estimate," "project," "plan," "objective," "believe," "predict," "intend," "achievable," "anticipate," "will," "continue," "potential," "should," "could" and similar terms and phrases. Although we believe that the expectations reflected in these forward-looking statements are reasonable, they do involve certain assumptions, risks and uncertainties. Actual results could differ materially from those anticipated in these forward-looking statements. Readers should consider carefully the risks described under the "Risk Factors" section of this report and other sections of this report which describe factors that could cause our actual results to differ from those anticipated in forward-looking statements, including, but not limited to, the following factors:
- •
- volatility in prices for oil, natural gas and NGLs;
- •
- our ability to generate sufficient cash flow from operations, borrowings or other sources to enable us to fund our operations, satisfy our
obligations and develop our undeveloped acreage position;
- •
- our ability to replace our oil and natural gas reserves and production;
- •
- the possibility that acquisitions and divestitures may involve unexpected costs or delays, and that acquisitions may not achieve intended
benefits and may divert management's time and energy;
- •
- our ability to successfully integrate acquired oil and natural gas businesses and operations;
- •
- we have historically had substantial indebtedness and may incur more debt in the future;
- •
- higher levels of indebtedness make us more vulnerable to economic downturns and adverse developments in our business;
- •
- the presence or recoverability of estimated oil and natural gas reserves attributable to our properties and the actual future production rates
and associated costs of producing those oil and natural gas reserves;
- •
- our ability to successfully develop our large inventory of undeveloped acreage;
- •
- our ability to retain key members of senior management, the board of directors, and key technical employees;
- •
- access to and availability of water and other treatment materials to carry out fracture stimulations in our resource play;
- •
- access to adequate gathering systems, processing facilities, transportation take-away capacity to move our production to market and marketing
outlets to sell our production at market prices;
- •
- the cost and availability of goods and services, such as drilling rigs, fracture stimulation services and tubulars;
- •
- contractual limitations that affect our management's discretion in managing our business, including covenants that, among other things, limit
our ability to incur debt, make investments and pay cash dividends;
- •
- the potential for production decline rates for our wells to be greater than we expect;
3
- •
- competition, including competition for acreage in our resource play;
- •
- environmental risks;
- •
- drilling and operating risks;
- •
- exploration and development risks;
- •
- the possibility that the industry may be subject to future regulatory or legislative actions (including additional taxes and changes in
environmental regulations);
- •
- general economic conditions, whether internationally, nationally or in the regional and local market areas in which we do business, may be less
favorable than expected, including the possibility that economic conditions in the United States will worsen and that capital markets are disrupted, which could adversely affect demand for oil and
natural gas and make it difficult to access capital;
- •
- social unrest, political instability or armed conflict in major oil and natural gas producing regions outside the United States, such as the
Middle East, and armed conflict or acts of terrorism or sabotage;
- •
- other economic, competitive, governmental, regulatory, legislative, including federal and state regulations and laws, geopolitical and
technological factors that may negatively impact our business, operations or oil and natural gas prices;
- •
- our insurance coverage may not adequately cover all losses that we may sustain;
- •
- title to the properties in which we have an interest may be impaired by title defects; and
- •
- senior management's ability to execute our plans to meet our goals.
All forward-looking statements are expressly qualified in their entirety by the cautionary statements in this paragraph and elsewhere in this document. Other than as required under the securities laws, we do not assume a duty to update these forward-looking statements, whether as a result of new information, subsequent events or circumstances, changes in expectations or otherwise.
4
Glossary of Oil and Natural Gas Terms
The definitions set forth below apply to the indicated terms as used in this report. All volumes of natural gas referred to herein are stated at the legal pressure base of the state or area where the reserves exist at 60 degrees Fahrenheit and in most instances are rounded to the nearest major multiple.
Bbl. One stock tank barrel, or 42 U.S. gallons liquid volume, used herein in reference to crude oil or other liquid hydrocarbons.
Bcf. One billion cubic feet of natural gas.
Boe. Barrels of oil equivalent in which six Mcf of natural gas equals one Bbl of oil. This ratio does not assume price equivalency and, given price differentials, the price for a barrel of oil equivalent for natural gas differs significantly from the price for a barrel of oil. A barrel of NGLs also differs significantly in price from a barrel of oil.
Boe/d. Barrels of oil equivalent per day.
Btu. British thermal unit, which is the heat required to raise the temperature of a one-pound mass of water from 58.5 to 59.5 degrees Fahrenheit.
Completion. The installation of permanent equipment for the production of oil or natural gas or, in the case of a dry hole, the reporting of abandonment to the appropriate agency.
Developed property. Property where wells have been drilled and production equipment has been installed.
Development well. A well drilled within the proved areas of an oil or natural gas reservoir to the depth of a stratigraphic horizon known to be productive.
Dry hole or well. A well found to be incapable of producing hydrocarbons in sufficient quantities such that proceeds from the sale of such production exceed production expenses and taxes.
Extension well. A well drilled to extend the limits of a known reservoir.
Exploratory well. A well drilled to find a new field or to find a new reservoir in a field previously found to be productive of oil or natural gas in another reservoir.
Field. An area consisting of a single reservoir or multiple reservoirs all grouped on or related to the same individual geological structural feature and/or stratigraphic condition.
Gross acres or gross wells. The total acres or wells, as the case may be, in which a working interest is owned.
Hydraulic fracturing. The injection of water, sand and chemicals under pressure into rock formations to stimulate oil and natural gas production.
MBbls. One thousand barrels of crude oil or other liquid hydrocarbons.
MBoe. One thousand Boe.
MMBoe. One million Boe.
Mcf. One thousand cubic feet of natural gas.
MMBbls. One million barrels of crude oil or other liquid hydrocarbons.
MMBtu. One million Btu.
5
MMcf. One million cubic feet of natural gas.
Net acres or net wells. The sum of the fractional working interests owned in gross acres or gross wells, as the case may be.
NGLs. Natural gas liquids, i.e. hydrocarbons removed as a liquid, such as ethane, propane and butane.
Operator. The individual or company responsible for the exploration, exploitation and production of an oil or natural gas well or lease.
Productive well. A well that is found to be capable of producing hydrocarbons in sufficient quantities such that proceeds from the sale of such production exceed production expenses and taxes.
Proved developed producing reserves. Proved developed reserves that are expected to be recovered from completion intervals currently open in existing wells and capable of production.
Proved developed reserves. Proved reserves that are expected to be recovered from existing wellbores, whether or not currently producing, without drilling additional wells. Production of such reserves may require a recompletion.
Proved reserves. Those quantities of oil and natural gas, which, by analysis of geoscience and engineering data, can be estimated with reasonable certainty to be economically producible—from a given date forward, from known reservoirs, and under existing economic conditions, operating methods, and government regulations—prior to the time at which contracts providing the right to operate expire, unless evidence indicates that renewal is reasonably certain, regardless of whether deterministic or probabilistic methods are used for estimation.
Proved undeveloped location. A site on which a development well can be drilled consistent with spacing rules for purposes of recovering proved undeveloped reserves.
Proved undeveloped reserves. Proved reserves that are expected to be recovered from new wells on undrilled acreage or from existing wells where a relatively major expenditure is required for recompletion.
Recompletion. The completion for production of an existing wellbore in another formation from that in which the well has been previously completed.
Reserve-to-production ratio or Reserve life. A ratio determined by dividing estimated existing reserves determined as of the stated measurement date by production from such reserves for the prior twelve month period.
Reservoir. A porous and permeable underground formation containing a natural accumulation of producible oil and/or natural gas that is confined by impermeable rock or water barriers and is individual and separate from other reservoirs.
Spud. Commencement of actual drilling operations.
3-D seismic. The method by which a three dimensional image of the earth's subsurface is created through the interpretation of reflection seismic data collected over a surface grid. 3-D seismic surveys allow for a more detailed understanding of the subsurface than do conventional surveys and contribute significantly to field appraisal, exploitation and production.
Undeveloped acreage. Lease acreage on which wells have not been drilled or completed to a point that would permit the production of commercial quantities of oil and natural gas regardless of whether such acreage contains proved reserves.
Working interest. The operating interest that gives the owner the right to drill, produce and conduct operating activities on the property and a share of production.
Workover. Operations on a producing well to restore or increase production.
6
Overview
Unless the context otherwise requires, all references in this report to "Halcón," "our," "us," and "we" refer to Halcón Resources Corporation and its subsidiaries, as a common entity.
Prior year financial statements are not comparable to our current year financial statements due to the adoption of fresh-start accounting. References to "Successor" or "Successor Company" relate to the financial position and results of operations of the reorganized Company subsequent to September 9, 2016. References to "Predecessor" or "Predecessor Company" relate to the financial position and results of operations of the Company prior to, and including, September 9, 2016.
We are an independent energy company focused on the acquisition, production, exploration and development of onshore liquids-rich oil and natural gas assets in the United States. As discussed below in more detail under "Recent Developments," we recently acquired certain properties in the Delaware Basin and divested our assets located in the Williston Basin in North Dakota and in the El Halcón area of East Texas. As a result, our properties and drilling activities are currently focused in the Delaware Basin, where we have an extensive drilling inventory that we believe offers more attractive economics. The Williston Divestiture discussed under "Recent Developments," improved our liquidity and significantly reduced our debt, better enabling us to accelerate development of our Delaware Basin properties and execute our growth plans in the basin. At December 31, 2017, our estimated total proved oil and natural gas reserves, as prepared by our independent reserve engineering firm, Netherland, Sewell & Associates, Inc. (Netherland, Sewell) using the Securities and Exchange Commission (SEC) prices for crude oil and natural gas, which are based on the West Texas Intermediate (WTI) crude oil spot price of $51.34 per Bbl and Henry Hub natural gas spot price of $2.976 per MMBtu, were approximately 51.1 MMBoe, consisting of 34.1 MMBbls of oil, 9.2 MMBbls of natural gas liquids, and 46.7 Bcf of natural gas. Approximately 31% of our proved reserves were classified as proved developed as of December 31, 2017. We maintain operational control of approximately 99% of our proved reserves. Substantially all of our proved reserves and production at December 31, 2017 are associated with our Delaware Basin properties.
Our total operating revenues for 2017 were approximately $378.0 million, compared to total operating revenues for the period of September 10, 2016 through December 31, 2016 and the period of January 1, 2016 through September 9, 2016 of approximately $153.4 million and $266.8 million, respectively, or $420.2 million combined. Full year 2017 production averaged 27,397 Boe/d. During the period of September 10, 2016 through December 31, 2016 and the period of January 1, 2016 through September 9, 2016, production averaged 37,637 Boe/d and 36,787 Boe/d, respectively, or 37,049 Boe/d combined. The decrease in total operating revenues and average daily production year over year was driven by our divestitures in 2017. In 2017, we participated in the drilling of 124 gross (33.7 net) wells, none of which were dry holes.
Recent Developments
Pending Acquisition of West Quito Draw Properties
On February 6, 2018, one of our wholly owned subsidiaries entered into a Purchase and Sale Agreement (the Shell PSA) with SWEPI LP (Shell), an affiliate of Shell Oil Company, pursuant to which we agreed to purchase an aggregate 10,524 net acres and related assets in the Southern Delaware Basin located in Ward County, Texas (the West Quito Draw Properties) for a total purchase price of $200.0 million. The effective date of the proposed acquisition is February 1, 2018, and we expect the closing date to occur in early April 2018.
7
The purchase price is subject to adjustments for (i) operating expenses, capital expenditures and revenues between the effective date and the closing date, (ii) title and environmental defects, and (iii) other purchase price adjustments customary in oil and gas purchase and sale agreements. Pursuant to the terms of the Shell PSA, we paid a deposit into escrow totaling $20.0 million, which amount will be applied to the purchase price if the transaction closes. The completion of the acquisition of the West Quito Draw Properties is subject to customary closing conditions. Either party may terminate the Shell PSA if certain closing conditions have not been satisfied, or if the transaction has not closed on or before April 20, 2018. If one or more of the closing conditions are not satisfied, or if the transaction is otherwise terminated, the acquisition may not be completed. Our escrow deposit with Shell is refundable only in specified circumstances if the transaction is not consummated.
Each party makes customary representations and warranties in the Shell PSA for transactions of this type. The Shell PSA also includes customary covenants relating to the operation of the West Quito Draw Properties prior to the closing date and other matters. The parties have agreed to indemnify one another for breaches of their respective representations and warranties, as well as the operation of the West Quito Draw Properties prior to (in the case of the Shell) and after (in the case of us) the closing date. Indemnities for breaches of representations and warranties, and any purchase price adjustments attributable to title or environmental defects, are subject to certain threshold limitations. Specifically, indemnification claims are subject to an individual claim threshold of $50,000, and Shell is required to indemnify us for claims totaling in excess of 2% of the purchase price, or $4.0 million. Our right to indemnification in certain circumstances is subject to a cap equal to 15% of the purchase price, or $30.0 million. The total amount of uncured title defect claims or unremedied environmental claims must be more than 1.5% of the purchase price, or $3.0 million, respectively, before we will be entitled to a downward adjustment to the purchase price consideration for either type of claim.
We intend to fund the cash consideration for the acquisition of the West Quito Draw Properties with the net proceeds from our recent issuance of Additional 2025 Notes and common stock, discussed below. There can be no assurance that we will acquire the West Quito Draw Properties on the terms or timing described herein or at all, or close without material adjustments. Even if we consummate the acquisition of the West Quito Draw Properties, we may not be able to achieve the benefits we expect from it. If we do not consummate the acquisition of the West Quito Draw Properties, we intend to use the net proceeds from the issuance of the Additional 2025 Notes and common stock for general corporate purposes, including to fund our 2018 drilling program.
Issuance of Additional 2025 Notes
On February 15, 2018, we issued an additional $200.0 million aggregate principal amount of our 2025 Notes (defined below) at a price to the initial purchasers of 103.0% of par (the Additional 2025 Notes). The net proceeds from the sale of the Additional 2025 Notes were approximately $203.0 million after deducting initial purchasers' premiums, commissions and estimated offering expenses. These notes were issued under the Indenture, dated as of February 16, 2017, among us, certain of our subsidiaries and U.S. Bank National Association, as trustee, which governs our 6.75% senior notes due 2025 that were issued on February 16, 2017 (the 2025 Notes).
The Additional 2025 Notes are treated as a single class with, and have the same terms as, the 2025 Notes, except that the Additional 2025 Notes will initially be subject to transfer restrictions and have the benefit of certain registration rights and provisions for the payment of additional interest in the event of a breach with respect to such registration rights pursuant to the terms of a Registration Rights Agreement, entered into on February 15, 2018 between us and J.P. Morgan Securities, LLC on behalf of itself and the initial purchasers of the Additional 2025 Notes. The Additional 2025 Notes were issued in a private placement exempt from registration under the Securities Act pursuant to Rule 144A and Regulation S under the Securities Act and applicable state securities laws.
8
Issuance of Common Stock
On February 9, 2018, we sold 9.2 million shares of common stock, par value $0.0001 per share, in a public offering at a price of $6.90 per share. The net proceeds to us from the offering were approximately $60.8 million, after deducting underwriters' discounts and estimated offering expenses.
Amended and Restated Senior Secured Revolving Credit Agreement
On September 7, 2017, we entered into the Senior Credit Agreement by and among us, as borrower, JPMorgan Chase Bank, N.A., as administrative agent, and certain other financial institutions party thereto, as lenders. The Senior Credit Agreement amends and restates in its entirety the original Senior Secured Revolving Credit Agreement entered into on September 9, 2016. Pursuant to the Senior Credit Agreement, the lenders party thereto have agreed to provide us with a $1.0 billion senior secured reserve-based revolving credit facility with a current borrowing base of $100.0 million. The maturity date of the Senior Credit Agreement is September 7, 2022. The borrowing base will be redetermined semi-annually, with the lenders and us each having the right to one interim unscheduled redetermination between any two consecutive semi-annual redeterminations. The next scheduled redetermination date is May 2018. The borrowing base takes into account the estimated value of our oil and natural gas properties, proved reserves, total indebtedness, and other relevant factors consistent with customary oil and natural gas lending criteria. Amounts outstanding under the Senior Credit Agreement bear interest at specified margins over the base rate of 1.25% to 2.25% for ABR-based loans or at specified margins over LIBOR of 2.25% to 3.25% for Eurodollar-based loans. These margins fluctuate based on our utilization of the facility.
On February 2, 2018, we entered into the Second Amendment (the Second Amendment) to the Senior Credit Agreement which among other things, for certain fiscal quarters in 2018, provided flexibility with respect to certain financial covenants as specified in the Senior Credit Agreement. The Second Amendment provides for (i) the use of annualized financial data in determining EBITDA (as defined in the Senior Credit Agreement) for the fiscal quarters ending June 30, 2018, September 30, 2018 and December 31, 2018, (ii) an increase in the ratio of our Consolidated Total Net Debt (as defined in the Senior Credit Agreement) to EBITDA of 4.50:1.00 for the fiscal quarter ending June 30, 2018, and a ratio of 4.00:1.00 for any fiscal quarter thereafter, (iii) a waiver of compliance with the covenant relating to the Total Net Indebtedness Leverage Ratio (as defined in the Senior Credit Agreement) for the fiscal quarter ending March 31, 2018, and (iv) a waiver of the automatic reduction to the borrowing base that would otherwise have resulted from our issuance of the Additional 2025 Notes. The Senior Credit Agreement also contains a financial covenant to maintain a Current Ratio (as defined in the Senior Credit Agreement) not to be less than 1.00:1.00.
Recent Acquisition of Additional Properties in Monument Draw (Ward and Winkler Counties, Texas)
On December 13, 2017, one of our wholly owned subsidiaries acquired 4,093 net acres and related assets in the Delaware Basin in an area contiguous to the western and southern areas of our existing Monument Draw properties in Ward County, Texas (the Additional Monument Draw Properties) from a private company for a total purchase price of approximately $101.6 million. The effective date of the acquisition was September 1, 2017. We estimate that at the time of acquisition the Additional Monument Draw Properties include a 88% average working interest, with approximately 99% held by production.
Divestiture of Williston Basin Non-Operated Assets
On September 19, 2017, certain of our wholly owned subsidiaries entered into an agreement with a privately-owned company pursuant to which we sold our non-operated properties and related assets located in the Williston Basin in North Dakota and Montana (the Non-Operated Williston Assets) for a
9
total adjusted sales price of approximately $105.2 million, before certain closing adjustments as provided for in the sales agreement. The effective date of the transaction was April 1, 2017 and the transaction closed on November 9, 2017. Estimated proved reserves associated with the Non-Operated Williston Assets were approximately 7.4 MMBoe, or approximately 5% of our year-end 2016 proved reserves. The Non-Operated Williston Assets generated net production of approximately 2,500 Boe/d, or approximately 7% of our average daily production for the nine months ended September 30, 2017. Upon closing of the sale of the Non-Operated Williston Assets, the borrowing base on our Senior Credit Agreement was reduced from $140.0 million to $100.0 million.
Divestiture of Williston Basin Operated Assets
On July 10, 2017, we and certain of our wholly owned subsidiaries entered into an agreement with Bruin Williston Holdings, LLC pursuant to which we sold all of our operated oil and natural gas leases, oil and natural gas wells and related assets in the Williston Basin in North Dakota, as well as 100% of the membership interests in two of our subsidiaries (the Williston Assets) for a total cash sales price of approximately $1.4 billion, before certain closing adjustments as provided for in the sales agreement (the Williston Divestiture). The effective date of the Williston Divestiture was June 1, 2017, and we closed the transaction on September 7, 2017. Estimated proved reserves associated with the Williston Assets were approximately 104.9 MMBoe, or approximately 71% of our year-end 2016 proved reserves. The Williston Assets generated net production of approximately 26,180 Boe/d, or approximately 76% of our average daily production for the nine months ended September 30, 2017. We used the proceeds from the Williston Divestiture to repay borrowings outstanding under our Senior Credit Agreement, repurchase approximately $425.0 million principal amount (or one-half) of our 6.75% senior notes due 2025, and redeem all of our outstanding 12% senior secured second lien notes, as well as for general corporate purposes.
Repurchase of 2025 Notes
On September 7, 2017, we commenced an offer to purchase for cash up to $425.0 million of the $850.0 million outstanding aggregate principal amount of our 2025 Notes at 103.0% of principal plus accrued and unpaid interest, up to, but not including, the date of purchase. Pursuant to the indenture governing the 2025 Notes, we were required to make an offer to all holders of the 2025 Notes to purchase for cash an aggregate principal amount up to $425.0 million of the notes as a consequence of the Williston Divestiture. The offer to purchase expired on October 6, 2017, with holders having tendered such notes representing in excess of $425.0 million of principal amount. Accordingly, on October 10, 2017, we completed the repurchase of approximately $425.0 million principal amount of the 2025 Notes on a pro rata basis at 103.0% of par plus accrued and unpaid interest, up to, but not including, the date of purchase of approximately $4.1 million.
Redemption of 2022 Second Lien Notes
Using a portion of the net proceeds from the Williston Divestiture, on October 7, 2017 (the Redemption Date), we fully redeemed $112.8 million aggregate principal amount constituting all of our outstanding 12.0% senior secured second lien notes due 2022 (the 2022 Second Lien Notes). We redeemed the 2022 Second Lien Notes at a redemption price equal to the principal amount plus a make whole premium of approximately $23.0 million, together with accrued and unpaid interest to, but not including, the Redemption Date of approximately $2.0 million.
Both the redemption of the 2022 Second Lien Notes and the repurchase of the 2025 Notes, discussed above, were required under the indentures governing such notes.
10
Issuance of 2025 Notes and Repurchase of 2020 Second Lien Notes
On February 16, 2017, we issued $850.0 million aggregate principal amount of our 2025 Notes in a private placement exempt from registration under the Securities Act of 1933, as amended (Securities Act), pursuant to Rule 144A and Regulation S, and applicable state securities laws. The 2025 Notes were issued at par and bear interest at a rate of 6.75% per annum, payable semi-annually on February 15 and August 15 of each year, beginning on August 15, 2017. Proceeds from the private placement were approximately $834.1 million after deducting initial purchasers' discounts and commissions and offering expenses. We used a portion of the net proceeds to fund the repurchase and redemption of our outstanding 8.625% senior secured second lien notes due 2020 (the 2020 Second Lien Notes), discussed further below, and for general corporate purposes.
On February 9, 2017, we commenced a cash tender offer for any and all of our 2020 Second Lien Notes and on the expiration thereof, being February 15, 2017, having received approximately $289.2 million or 41% of the outstanding aggregate principal amount of 2020 Second Lien Notes which were validly tendered (and not validly withdrawn), on February 16, 2017, we paid approximately $303.5 million for approximately $289.2 million principal amount of 2020 Second Lien Notes, a make-whole premium of $13.2 million plus accrued and unpaid interest of approximately $1.1 million to repurchase such notes. For all of the 2020 Second Lien Notes that remained outstanding, on February 16, 2017, we issued a redemption notice to holders of the remaining 2020 Second Lien Notes. On February 21, 2017, we paid approximately $1.2 million for approximately $1.2 million of principal amount of 2020 Second Lien Notes, a make-whole premium of approximately $54,000 plus accrued and unpaid interest to, but not including, the redemption date to redeem such notes pursuant to guaranteed delivery procedures. On March 20, 2017, we paid approximately $432.0 million for $409.6 million aggregate principal amount of 2020 Second Lien Notes outstanding, a make-whole premium of $17.7 million and unpaid interest to, but not including, the redemption date of approximately $4.8 million to redeem the remaining notes at a price of 104.313% of the principal amount.
Divestiture of East Texas Eagle Ford Assets
On January 24, 2017, certain of our subsidiaries entered into an agreement with a subsidiary of Hawkwood Energy, LLC (Hawkwood) for the sale of all of our oil and natural gas properties and related assets located in the Eagle Ford formation of East Texas (the El Halcón Assets) for a total adjusted sales price of $491.1 million (the El Halcón Divestiture). The effective date of the El Halcón Divestiture was January 1, 2017, and the transaction closed on March 9, 2017. We used the net proceeds from the sale to repay amounts outstanding under our Senior Credit Agreement and for general corporate purposes. The El Halcón Assets included approximately 80,500 net acres prospective for the Eagle Ford formation in East Texas. As of December 31, 2016, estimated proved reserves from the El Halcón Assets were approximately 35.1 MMBoe, or 24% of our estimated year-end 2016 proved reserves. The Halcón Assets generated net production of approximately 7,600 Boe/d (80% oil) for the year ended December 31, 2016.
Private Placement of Automatically Convertible Preferred Stock
On January 24, 2017, we entered into a stock purchase agreement with certain accredited investors to sell, in a private placement exempt from registration requirements of the Securities Act pursuant to Section 4(a)(2), approximately 5,518 shares of 8% Automatically Convertible Preferred Stock, par value $0.0001 per share (the Preferred Stock), each share of which was convertible into 10,000 shares of common stock. Also on January 24, 2017, we received an executed written consent in lieu of a stockholders' meeting authorizing and approving the conversion of the Preferred Stock into common stock. On February 27, 2017, we filed with the Delaware Secretary of State a Certificate of Designation, Preferences, Rights and Limitations of the Preferred Stock (the Certificate of Designation), which created the series of preferred stock issued by us on that same date. We issued the Preferred Stock at
11
$72,500 per share. Gross proceeds were approximately $400.1 million, or $7.25 per share of common stock. We incurred approximately $11.9 million in expenses associated with this offering, including placement agent fees. We used the net proceeds from the sale of the Preferred Stock to partially fund the Pecos County Acquisition, which is discussed further below.
On March 16, 2017, we mailed a definitive information statement to stockholders of record notifying them that a majority of our stockholders approved the issuance of common stock, par value $0.0001 per share, and upon the automatic conversion of the Preferred Stock, we issued 55.2 million shares of common stock on April 6, 2017 in accordance with the terms of the Certificate of Designation. No cash dividends were paid on the Preferred Stock since, pursuant to the terms of the Certificate of Designation, conversion occurred prior to June 1, 2017.
In accordance with the stock purchase agreement, we agreed to file a registration statement to register the resale of the shares of common stock issued upon conversion of the Preferred Stock and to pay penalties in the event such registration was not effective by June 27, 2017. We filed such registration statement on March 3, 2017 and it was declared effective by the SEC on April 7, 2017.
Acquisition of Hackberry Draw Assets (Pecos and Reeves Counties, Texas)
On January 18, 2017, we entered into an agreement with Samson Exploration, LLC (Samson), pursuant to which we acquired a total of 20,901 net acres and related assets in the Hackberry Draw area of the Delaware Basin, located in Pecos and Reeves Counties, Texas (collectively, the Pecos County Assets), for a total purchase price of $699.2 million (the Pecos County Acquisition). The effective date of the Pecos County Acquisition was November 1, 2016, and we closed the transaction on February 28, 2017. Based on information provided by Samson, we estimate that net production from the Pecos County Assets at the acquisition date was approximately 2,200 Boe/d (72% oil, 15% NGLs, 13% natural gas). As of the acquisition date, we estimate that the Pecos County Assets included a 75% average working interest, with approximately 44% held by production. We funded the Pecos County Acquisition with net proceeds from the private placement of the Preferred Stock and borrowings under our Senior Credit Agreement.
Option Agreement to Acquire Monument Draw Assets (Ward and Winkler Counties, Texas)
On December 9, 2016, one of our wholly owned subsidiaries entered into an agreement with a private company, pursuant to which we acquired the rights to purchase up to 15,040 net acres in the Monument Draw area of the Delaware Basin, located in Ward and Winkler Counties, Texas (the Ward County Assets) prospective for the Wolfcamp and Bone Spring formations. The Ward County Assets are divided into two tracts (the Southern Tract and Northern Tract) with separate options for each tract. Pursuant to the terms of the agreement (as amended), on June 15, 2017, we purchased the Southern Tract acreage for approximately $87.4 million and on January 9, 2018, we purchased the Northern Tract acreage for approximately $108.2 million. Each of the Southern Tract and Northern Tract are 100% operated and have an average working interest of 100%.
Reorganization
On July 27, 2016, we and certain of our subsidiaries (the Halcón Entities) filed voluntary petitions for relief under chapter 11 of the United States Bankruptcy Code in the U.S. Bankruptcy Court in the District of Delaware (the Bankruptcy Court) to pursue a prepackaged plan of reorganization in accordance with the terms of the Restructuring Support Agreement discussed below. Prior to filing the chapter 11 bankruptcy petitions, on June 9, 2016, the Halcón Entities entered into a restructuring support agreement (the Restructuring Support Agreement) with certain holders of our 13% senior secured third lien notes due 2022 (the Third Lien Noteholders), our 8.875% senior unsecured notes due 2021, 9.25% senior unsecured notes due 2022 and 9.75% senior unsecured notes due 2020
12
(collectively, the Unsecured Noteholders), the holder of our 8% senior unsecured convertible note due 2020 (the Convertible Noteholder), and certain holders of our 5.75% Series A Convertible Perpetual Preferred Stock (the Preferred Holders), to support a restructuring in accordance with the terms of a plan of reorganization as described therein (the Plan). On September 8, 2016, the Halcón Entities received confirmation of their joint prepackaged plan of reorganization from the Bankruptcy Court and subsequently emerged from chapter 11 bankruptcy on September 9, 2016 (the Effective Date). Refer to Item 8. Consolidated Financial Statements and Supplementary Data—Note 2, "Reorganization," for further details.
Fresh-start Accounting
Upon our emergence from chapter 11 bankruptcy, on September 9, 2016, we adopted fresh-start accounting in accordance with the provisions set forth in Accounting Standards Codification (ASC) 852, Reorganizations, as (i) the Reorganization Value of our assets immediately prior to the date of confirmation was less than the post-petition liabilities and allowed claims and (ii) the holders of our existing voting shares of the Predecessor entity received less than 50% of the voting shares of the emerging entity.
Adopting fresh-start accounting results in a new financial reporting entity with no beginning or ending retained earnings or deficit balances as of the fresh-start reporting date. Upon the adoption of fresh-start accounting, our assets and liabilities were recorded at their fair values as of the fresh-start reporting date. Our adoption of fresh-start accounting may materially affect our results of operations following the fresh-start reporting date, as we have a new basis in our assets and liabilities. As a result of the adoption of fresh-start reporting and the effects of the implementation of the Plan, our consolidated financial statements subsequent to September 9, 2016 are not comparable to our consolidated financial statements prior to September 9, 2016. References to "Successor" or "Successor Company" relate to the financial position and results of operations of the reorganized Company subsequent to September 9, 2016. References to "Predecessor" or "Predecessor Company" related to the financial position and results of operations of the Company prior to, and including, September 9, 2016, as such, "black-line" financial statements are presented to distinguish between the Predecessor and Successor companies. Refer to Item 8. Consolidated Financial Statements and Supplementary Data—Note 3, "Fresh-start Accounting," for further details.
2018 Capital Budget
We expect to spend approximately $280 million to $320 million on drilling and completion capital expenditures during 2018. In addition, we expect to spend approximately $30 million to $40 million on infrastructure, seismic and other in 2018. Our 2018 drilling and completion budget currently contemplates running an average of three operated rigs in the Delaware Basin during the year and is subject to change. After the pending acquisition of the West Quito Draw Properties closes, discussed above in "Recent Developments," our 2018 capital budget will be revised.
We expect to fund our budgeted 2018 capital expenditures with cash on hand, cash flows from operations, proceeds from debt and equity issuances and borrowings under our Senior Credit Agreement. We strive to maintain financial flexibility and may access capital markets as necessary to maintain adequate borrowing capacity under our Senior Credit Agreement, facilitate drilling on our large undeveloped acreage position and permit us to selectively expand our acreage position. In the event our cash flows are materially less than anticipated and other sources of capital we historically have utilized are not available on acceptable terms, we may reduce our capital spending.
Our financial results depend upon many factors, but are largely driven by the volume of our oil and natural gas production and the price that we receive for that production. Our production volumes will decline as reserves are depleted unless we expend capital in successful development and
13
exploration activities or acquire properties with existing production. The amount we realize for our production depends predominately upon commodity prices and our related commodity price hedging activities, which are affected by changes in market demand and supply, as impacted by overall economic activity, weather, pipeline capacity constraints, inventory storage levels, basis differentials and other factors. Accordingly, finding and developing oil and natural gas reserves in an economical manner is critical to our long-term success.
Business Strategy
Our primary long-term objective is to increase stockholder value by growing our inventory of economic drilling locations in addition to growing our reserves, production and cash flow. To accomplish this objective, we intend to execute the following business strategies:
- •
- Develop our Acreage Position to Grow Production, Reserves and Cash Flow
Efficiently. We are the operator for the majority of our acreage, which gives us control over the timing of capital expenditures, execution and
costs. It also allows us to adjust our capital spending based on drilling results and the economic environment. Our leasing strategy is to pursue long-term contracts that allow us to maintain flexible
development plans and avoid short-term obligations to drill wells, as have been common in other resource plays. As operator, we are also able to evaluate industry drilling results and implement
improved operating practices which may enhance our initial production rates, ultimate recovery factors and rate of return on invested capital.
- •
- Maintain Strong Balance Sheet and Financial
Flexibility. We believe our cash on hand, internally generated cash flows, borrowing capacity under our Senior Credit Agreement and access to
capital markets will provide us with sufficient liquidity to execute our current capital program and strategy. We have no near term debt maturities. Our management team is focused on maintaining a
strong balance sheet. We also employ a hedging program to reduce the variability of our cash flows used to support our capital spending.
- •
- Grow Our Liquids Rich Acreage
Positions. We plan to continue to selectively acquire high quality assets in our liquids-rich resource play to expand our drilling inventory. We
will leverage our management team's acquisition and divestiture, geologic, engineering and financial expertise to selectively identify and source acquisitions of additional acreage at attractive
prices.
- •
- Manage Our Property Portfolio Actively. We continually evaluate our property base to identify and divest or trade acreage that does not fit our plans to drill long-lateral operated wells (i.e. primarily 10,000 foot laterals). We may also divest non-core or less economic properties over time which will allow us to focus on a portfolio of core properties with the greatest economic potential to increase our proved reserves and production.
Our Competitive Strengths
We have a number of competitive strengths that we believe will allow us to successfully execute our business strategies:
- •
- Proven Management Team. Our
management team and technical professionals, including geologists and engineers, have decades of combined experience in the industry and a track record for creating stockholder value.
- •
- Premier Asset Base. Our proved reserves, production and acreage are located in concentrated positions in a premier onshore U.S. basin, the Delaware Basin. The Delaware Basin provides exposure to a variety of reservoir formations, each of which has its own characteristics that impact the costs to drill, complete and operate as well as the composition (and therefore value)
14
- •
- Extensive Experience in Resource
Plays. Our team has significant experience in all aspects of the development of resource plays. We have been successful in consistently improving
drilling times and reserve recoveries through innovation, the use of new technologies and a focus on controlling costs. In addition to our core strength in exploration and production, our personnel
have experience in building midstream infrastructure and managing oilfield service activities.
- •
- Strong Technical Team. We believe that there are certain competitive advantages to be gained by employing a highly skilled technical staff. Our technical team has significant experience and expertise in applying the most sophisticated technologies used in unconventional resource style plays, including 3-D seismic interpretation, horizontal drilling, deep onshore drilling, comprehensive multi-stage hydraulic fracture stimulation programs, and other exploration, production, and processing technologies. We believe this technical expertise is partly responsible for our management team's strong track record of successful exploration and development, including new discoveries and defining core producing areas in emerging plays.
of the hydrocarbon stream. We believe that this diversity in reservoir zones provides us with broad flexibility to direct our capital resources to projects with the greatest potential returns.
Oil and Natural Gas Reserves
The proved reserves estimates reported herein for the years ended December 31, 2017, 2016 and 2015 have been independently evaluated by Netherland, Sewell, a worldwide leader of petroleum property analysis for industry and financial organizations and government agencies. Netherland, Sewell was founded in 1961 and performs consulting petroleum engineering services under Texas Board of Professional Engineers Registration No. F-2699. Within Netherland, Sewell, the technical persons primarily responsible for preparing the estimates set forth in the Netherland, Sewell reserves reports incorporated herein are Mr. Neil H. Little, Mr. J. Carter Henson, Jr. and Mr. Mike K. Norton. Mr. Little, a Licensed Professional Engineer in the State of Texas (No. 117966), has been practicing consulting petroleum engineering at Netherland, Sewell since 2011 and has over nine years of prior industry experience. He graduated from Rice University in 2002 with a Bachelor of Science Degree in Chemical Engineering and from University of Houston in 2007 with a Master of Business Administration Degree. Mr. Henson, a Licensed Professional Engineer in the State of Texas (No. 73964), has been practicing consulting petroleum engineering at Netherland, Sewell since 1989 and has over eight years of prior industry experience. He graduated from Rice University in 1981 with a Bachelor of Science Degree in Mechanical Engineering. Mr. Norton, a Licensed Professional Geoscientist in the State of Texas (No. 441), has been a practicing petroleum geoscience consultant at Netherland, Sewell since 1989 and has over ten years of prior industry experience. He graduated from Texas A&M University in 1978 with a Bachelor of Science Degree in Geology. Netherland, Sewell has reported to us that the technical principals meet or exceed the education, training, and experience requirements set forth in the Standards Pertaining to the Estimating and Auditing of Oil and Gas Reserves Information promulgated by the Society of Petroleum Engineers; they are proficient in judiciously applying industry standard practices to engineering and geoscience evaluations as well as applying SEC and other industry reserves definitions and guidelines.
Our board of directors has established a reserves committee composed of three independent directors, all of whom have experience in energy company reserve evaluations. Our independent engineering firm reports jointly to the reserves committee and to our Senior Vice President of Corporate Reserves. The reserves committee is charged with ensuring the integrity of the process of selection and engagement of the independent engineering firm and in making a recommendation to our board of directors as to whether to approve the report prepared by our independent engineering firm. Ms. Tina Obut, our Senior Vice President of Corporate Reserves, is primarily responsible for overseeing the preparation of the annual reserve report by Netherland, Sewell. She graduated from Marietta College with a Bachelor of Science degree in Petroleum Engineering, received a Master of
15
Science degree in Petroleum and Natural Gas Engineering from Penn State University and a Master of Business Administration degree from the University of Houston.
The reserves information in this Annual Report on Form 10-K represents only estimates. Reserve evaluation is a subjective process of estimating underground accumulations of oil and natural gas that cannot be measured in an exact manner. The accuracy of any reserve estimate is a function of the quality of available data and of engineering and geological interpretation and judgment. As a result, estimates of different engineers may vary significantly. In addition, results of drilling, testing and production subsequent to the date of an estimate may lead to revising the original estimate. Accordingly, initial reserve estimates are often different from the quantities of oil and natural gas that are ultimately recovered. The meaningfulness of such estimates depends primarily on the accuracy of the assumptions upon which they were based. Except to the extent we acquire additional properties containing proved reserves or conduct successful exploration and development activities or both, our proved reserves will decline as reserves are produced. For additional information regarding estimates of proved reserves, the preparation of such estimates by Netherland, Sewell and other information about our oil and natural gas reserves, see Item 8. Consolidated Financial Statements and Supplementary Data—"Supplemental Oil and Gas Information (Unaudited)."
Proved reserve estimates are based on the unweighted arithmetic average prices on the first day of each month for the 12-month period ended December 31, 2017. Average prices for the 12-month period were as follows: WTI crude oil spot price of $51.34 per Bbl, adjusted by lease or field for quality, transportation fees, and market differentials and a Henry Hub natural gas spot price of $2.976 per MMBtu, as adjusted by lease or field for energy content, transportation fees, and market differentials. All prices and costs associated with operating wells were held constant in accordance with SEC guidelines.
The following table presents certain proved reserve information as of December 31, 2017.
Proved Reserves (MBoe)(1) |
||||
Developed |
16,018 | |||
Undeveloped |
35,101 | |||
| | | | | |
Total |
51,119 | |||
| | | | | |
| | | | | |
| | | | | |
- (1)
- Natural gas reserves are converted to oil reserves using a ratio of six Mcf to one Bbl of oil. This ratio does not assume price equivalency and, given price differentials, the price for a barrel of oil equivalent for natural gas may differ significantly from the price for a barrel of oil.
The following table sets forth the number of productive oil and natural gas wells in which we owned an interest as of December 31, 2017 and 2016. Shut-in wells currently not capable of production are excluded from the well information below.
| |
Years Ended December 31, | ||||||||||||
|---|---|---|---|---|---|---|---|---|---|---|---|---|---|
| |
2017 | 2016 | |||||||||||
| |
Gross | Net | Gross | Net | |||||||||
Oil |
36 | 30.7 | 1,470 | 356.9 | |||||||||
Natural Gas |
2 | 1.7 | 71 | 36.8 | |||||||||
| | | | | | | | | | | | | | |
Total |
38 | 32.4 | 1,541 | 393.7 | |||||||||
| | | | | | | | | | | | | | |
| | | | | | | | | | | | | | |
| | | | | | | | | | | | | | |
16
Oil and Natural Gas Production
As discussed elsewhere, during 2017 we divested our assets located in the Williston Basin in North Dakota and in the El Halcón area of East Texas, which represented substantially all of our proved reserves and production at the time, and we acquired certain properties in the Delaware Basin, discussed in greater detail below. As a consequence, our estimated proved reserves, oil and natural gas production and anticipated capital expenditures are currently focused entirely in this core area.
Core Resource Play—Delaware Basin
We have working interests in approximately 40,000 net acres in the Delaware Basin as of December 31, 2017 in Pecos, Reeves, Ward and Winkler Counties, Texas. This core resource play is characterized by high oil and liquids-rich natural gas content in thick, continuous sections of source rock that can provide repeatable drilling opportunities and significant initial production rates. Our primary targets in this area are the Wolfcamp and Bone Spring formations. As noted above under "2018 Capital Budget," our current capital budget contemplates running an average of three operated rigs in the Delaware Basin during 2018. After the pending acquisition of the West Quito Draw Properties closes, our 2018 capital budget will be revised. As of December 31, 2017, we had approximately 31 operated wells producing in this area in addition to minor working interests in three non-operated wells. Our average daily net production from this area for the year ended December 31, 2017 was approximately 3,700 Boe/d. As of December 31, 2017, estimated proved reserves for the Delaware Basin were approximately 51.1 MMBoe, of which approximately 31% were classified as proved developed and approximately 69% as proved undeveloped.
Risk Management
We have designed a risk management policy for the use of derivative instruments to provide partial protection against certain risks relating to our ongoing business operations, such as commodity price declines. Derivative contracts are utilized to hedge our exposure to price fluctuations and reduce the variability in our cash flows associated with anticipated sales on future oil and natural gas production. Our objective generally is to hedge 70-80% of our anticipated oil and natural gas production for the next 18 to 24 months. However, our decision on the quantity and price at which we choose to hedge our production is based in part on our view of current and future market conditions. Our hedge policies and objectives change as our operational profile changes and/or commodity prices. Our future performance is subject to commodity price risks and our future cash flows from operations may be subject to greater volatility than historically. We do not enter into derivative contracts for speculative trading purposes.
While there are many different types of derivatives available, we typically use costless collar agreements and swap agreements to attempt to manage price risk more effectively. The costless collar agreements are put and call options used to establish floor and ceiling commodity prices for a fixed volume of production during a certain time period. All costless collar agreements provide for payments to counterparties if the index price exceeds the ceiling and payments from the counterparties if the index price is below the floor. The swap agreements call for payments to, or receipts from, counterparties depending on whether the index price of oil or natural gas for the period is greater or less than the fixed price established for the period contracted under the swap agreement.
It is our policy to enter into derivative contracts only with counterparties that are creditworthy financial institutions deemed by management as competent and competitive market makers. We did not post collateral under any of our derivative contracts as they are secured under our Senior Credit Agreement or are uncollateralized trades. We will continue to evaluate the benefit of employing derivatives in the future. See Item 7A. Quantitative and Qualitative Disclosures about Market Risk and
17
Item 8. Consolidated Financial Statements and Supplementary Data—Note 9, "Derivative and Hedging Activities," for additional information.
Oil and Natural Gas Operations
Our principal properties consist of leasehold interests in developed and undeveloped oil and natural gas properties and the reserves associated with these properties. Generally, oil and natural gas leases remain in force as long as production in paying quantities is maintained. Leases on undeveloped oil and natural gas properties are typically for a primary term of three to five years within which we are generally required to develop the property or the lease will expire. In some cases, the primary term of leases on our undeveloped properties can be extended by option payments; the amount of any payments and time extended vary by lease.
The table below sets forth the results of our drilling activities for the periods indicated:
| |
Years Ended December 31, | ||||||||||||||||||
|---|---|---|---|---|---|---|---|---|---|---|---|---|---|---|---|---|---|---|---|
| |
2017 | 2016 | 2015 | ||||||||||||||||
| |
Gross | Net | Gross | Net | Gross | Net | |||||||||||||
Exploratory Wells: |
|||||||||||||||||||
Productive(1) |
— | — | — | — | — | — | |||||||||||||
Dry |
— | — | — | — | — | — | |||||||||||||
| | | | | | | | | | | | | | | | | | | | |
Total Exploratory |
— | — | — | — | — | — | |||||||||||||
| | | | | | | | | | | | | | | | | | | | |
| | | | | | | | | | | | | | | | | | | | |
| | | | | | | | | | | | | | | | | | | | |
Extension Wells: |
|||||||||||||||||||
Productive(1) |
84 | 13.0 | 54 | 8.5 | 72 | 18.1 | |||||||||||||
Dry |
— | — | — | — | — | — | |||||||||||||
| | | | | | | | | | | | | | | | | | | | |
Total Extension |
84 | 13.0 | 54 | 8.5 | 72 | 18.1 | |||||||||||||
| | | | | | | | | | | | | | | | | | | | |
| | | | | | | | | | | | | | | | | | | | |
| | | | | | | | | | | | | | | | | | | | |
Development Wells: |
|||||||||||||||||||
Productive(1) |
40 | 20.7 | 36 | 22.1 | 112 | 30.9 | |||||||||||||
Dry |
— | — | — | — | — | — | |||||||||||||
| | | | | | | | | | | | | | | | | | | | |
Total Development |
40 | 20.7 | 36 | 22.1 | 112 | 30.9 | |||||||||||||
| | | | | | | | | | | | | | | | | | | | |
| | | | | | | | | | | | | | | | | | | | |
| | | | | | | | | | | | | | | | | | | | |
Total Wells: |
|||||||||||||||||||
Productive(1) |
124 | 33.7 | 90 | 30.6 | 184 | 49.0 | |||||||||||||
Dry |
— | — | — | — | — | — | |||||||||||||
| | | | | | | | | | | | | | | | | | | | |
Total |
124 | 33.7 | 90 | 30.6 | 184 | 49.0 | |||||||||||||
| | | | | | | | | | | | | | | | | | | | |
| | | | | | | | | | | | | | | | | | | | |
| | | | | | | | | | | | | | | | | | | | |
- (1)
- Although a well may be classified as productive upon completion, future changes in oil and natural gas prices, operating costs and production may result in the well becoming uneconomical, particularly extension or exploratory wells where there is no production history.
We own interests in developed and undeveloped oil and natural gas acreage in the locations set forth in the table below. These ownership interests generally take the form of working interests in oil
18
and natural gas leases that have varying provisions. The following table presents a summary of our acreage interests as of December 31, 2017:
| |
Developed Acreage | Undeveloped Acreage | Total Acreage | ||||||||||||||||
|---|---|---|---|---|---|---|---|---|---|---|---|---|---|---|---|---|---|---|---|
State
|
Gross | Net | Gross | Net | Gross | Net | |||||||||||||
Montana |
14,750 | 66 | 1,353 | 562 | 16,103 | 628 | |||||||||||||
North Dakota |
3,830 | 702 | 37,084 | 14,750 | 40,914 | 15,452 | |||||||||||||
Ohio |
— | — | 29,577 | 28,465 | 29,577 | 28,465 | |||||||||||||
Oklahoma |
— | — | 26,604 | 14,657 | 26,604 | 14,657 | |||||||||||||
Pennsylvania |
— | — | 42,176 | 40,199 | 42,176 | 40,199 | |||||||||||||
Texas |
30,207 | 23,685 | 28,978 | 18,739 | 59,185 | 42,424 | |||||||||||||
| | | | | | | | | | | | | | | | | | | | |
Total Acreage |
48,787 | 24,453 | 165,772 | 117,372 | 214,559 | 141,825 | |||||||||||||
| | | | | | | | | | | | | | | | | | | | |
| | | | | | | | | | | | | | | | | | | | |
| | | | | | | | | | | | | | | | | | | | |
The table below reflects the percentage of our total net undeveloped acreage as of December 31, 2017 that will expire each year if we do not establish production in paying quantities on the units in which such acreage is included or do not pay (to the extent we have the contractual right to pay) delay rentals or obtain other extensions to maintain the lease.
Year
|
Percentage Expiration |
|||
|---|---|---|---|---|
2018 |
31 | % | ||
2019 |
1 | % | ||
2020 |
14 | % | ||
2021 |
— | |||
2022 & beyond |
54 | % | ||
| | | | | |
|
100 | % | ||
| | | | | |
| | | | | |
| | | | | |
For our proved undeveloped locations that are not scheduled to be drilled until after lease expiration, we continually review our near-term lease expirations, actively pursue lease extensions and renewals and modify our drilling schedules in order to preserve the leases. Of the acreage with 2018 expiration dates, approximately 8,600 net acres relates to acreage in the Delaware Basin, our core area of operations. We intend to preserve this acreage through our 2018 drilling plan supplemented with lease extensions or renewals, where necessary. We have no current plans to drill on acreage in other areas that we held as of December 31, 2017, outside of our core area of operations.
At December 31, 2017, we had estimated proved reserves of approximately 51.1 MMBoe comprised of 34.1 MMBbls of crude oil, 9.2 MMBbls of natural gas liquids, and 46.7 Bcf of natural gas. The following table sets forth, at December 31, 2017, these reserves:
| |
Proved Developed |
Proved Undeveloped |
Total Proved |
|||||||
|---|---|---|---|---|---|---|---|---|---|---|
Oil (MBbls) |
10,150 | 23,983 | 34,133 | |||||||
Natural Gas Liquids (MBbls) |
3,151 | 6,045 | 9,196 | |||||||
Natural Gas (MMcf) |
16,303 | 30,435 | 46,738 | |||||||
Equivalent (MBoe)(1) |
16,018 | 35,101 | 51,119 | |||||||
- (1)
- Natural gas reserves are converted to oil reserves using a ratio of six Mcf to one Bbl of oil. This ratio does not assume price equivalency and, given price differentials, the price for a barrel of oil equivalent for natural gas may differ significantly from the price for a barrel of oil.
At December 31, 2017, total proved reserves were approximately 51.1 MMBoe, a 97.5 MMBoe net decrease over the previous year's estimate of 148.6 MMBoe. The net decrease in total proved reserves
19
was the result of divestitures totaling 160.3 MMBoe and production of 10.0 MMBoe, partially offset by acquisitions totaling 26.8 MMBoe, additions and extensions of 25.7 MMBoe and net positive revisions of 20.4 MMBoe. In 2017, we divested of all of our assets in the Bakken/Three Forks formations in North Dakota, and the Eagle Ford formation in East Texas, and other non-core assets, which in its entirety comprised all of our proved reserves at December 31, 2016. Substantially all of our proved reserves at December 31, 2017 are associated with our Delaware Basin properties.
At December 31, 2017, our estimated proved undeveloped (PUD) reserves were approximately 35.1 MMBoe, a 27.6 MMBoe net decrease over the previous year's estimate of 62.7 MMBoe. The net decrease in total proved undeveloped reserves was the result of divestitures of 59.8 MMBoe and development of 7.4 MMBoe, partially offset by acquisitions of 17.6 MMBoe, additions and extensions of 17.4 MMBoe and net positive revisions of 4.6 MMBoe.
As of December 31, 2017, all of our PUD reserves are planned to be developed within five years from the date they were initially recorded. During 2017, approximately $143.3 million in capital expenditures went toward the development of proved undeveloped reserves, which includes drilling, completion and other facility costs associated with developing proved undeveloped wells.
Reliable technologies were used to determine areas where PUD locations are more than one offset location away from a producing well. These technologies include seismic data, wire line openhole log data, core data, log cross-sections, performance data, and statistical analysis. In such areas, these data demonstrated consistent, continuous reservoir characteristics in addition to significant quantities of economic estimated ultimate recoveries from individual producing wells. Our management team has been a leader in data gathering and evaluation in these areas and was instrumental in developing consortiums that allow various operators to exchange data. We relied only on production flow tests and historical production data, along with the reliable geologic data mentioned above to estimate proved reserves. No other alternative methods or technologies were used to estimate proved reserves. Out of total proved undeveloped reserves of 35.1 MMBoe at December 31, 2017, 7.9 MMBoe were associated with 9 gross PUD locations that were more than one offset location from a producing well.
The estimates of quantities of proved reserves contained in this report were made in accordance with the definitions contained in SEC Release No. 33-8995, Modernization of Oil and Gas Reporting. For additional information on our oil and natural gas reserves, including a table detailing the changes by year of our proved reserves, see Item 8. Consolidated Financial Statements and Supplementary Data—"Supplemental Oil and Gas Information (Unaudited)."
We account for our oil and natural gas producing activities using the full cost method of accounting in accordance with SEC regulations. Accordingly, all costs incurred in the acquisition, exploration, and development of proved and unproved oil and natural gas properties, including the costs of abandoned properties, dry holes, geophysical costs, direct internal costs and annual lease rentals are capitalized. All general and administrative corporate costs unrelated to drilling activities are expensed as incurred. Sales or other dispositions of oil and natural gas properties are accounted for as adjustments to capitalized costs, with no gain or loss recorded unless the ratio of cost to proved reserves would significantly change. Depletion of evaluated oil and natural gas properties is computed on the units of production method based on proved reserves. The net capitalized costs of evaluated oil and natural gas properties are subject to a quarterly full cost ceiling test. See further discussion in Item 8. Consolidated Financial Statements and Supplementary Data—Note 6, "Oil and Natural Gas Properties."
20
Capitalized costs of our evaluated and unevaluated properties at December 31, 2017, 2016 and 2015 are summarized as follows (in thousands):
| |
|
|
|
|
||||||||
|---|---|---|---|---|---|---|---|---|---|---|---|---|
| |
Successor |
|
Predecssor | |||||||||
| |
|
|||||||||||
| |
December 31, 2017 |
December 31, 2016 |
|
December 31, 2015 |
||||||||
| |
|
|||||||||||
| |
|
|||||||||||
Oil and natural gas properties (full cost method): |
||||||||||||
Evaluated |
$ | 877,316 | $ | 1,269,034 | $ | 7,060,721 | ||||||
Unevaluated |
765,786 | 316,439 | 1,641,356 | |||||||||
| | | | | | | | | | | | | |
Gross oil and natural gas properties |
1,643,102 | 1,585,473 | 8,702,077 | |||||||||
Less—accumulated depletion |
(570,155 | ) | (465,849 | ) | (5,933,688 | ) | ||||||
| | | | | | | | | | | | | |
Net oil and natural gas properties |
$ | 1,072,947 | $ | 1,119,624 | $ | 2,768,389 | ||||||
| | | | | | | | | | | | | |
| | | | | | | | | | | | | |
| | | | | | | | | | | | | |
21
The following table summarizes our oil, natural gas and natural gas liquids production volumes, average sales price per unit and average costs per unit. In addition, this table summarizes our production for each field that contains 15% or more of our total proved reserves:
| |
|
|
|
|
|
||||||||||
|---|---|---|---|---|---|---|---|---|---|---|---|---|---|---|---|
| |
Successor |
|
Predecessor | ||||||||||||
| |
|
||||||||||||||
| |
|
Period from September 10, 2016 through December 31, 2016 |
|
Period from January 1, 2016 through September 9, 2016 |
|
||||||||||
| |
Year Ended December 31, 2017 |
|
Year Ended December 31, 2015 |
||||||||||||
| |
|
||||||||||||||
| |
|
||||||||||||||
Production: |
|||||||||||||||
Crude oil—MBbl |
|||||||||||||||
Bakken / Three Forks |
6,235 | 2,639 | 5,282 | 8,702 | |||||||||||
Delaware |
919 | — | — | — | |||||||||||
El Halcón |
302 | 566 | 1,613 | 2,840 | |||||||||||
Other |
55 | 45 | 223 | 477 | |||||||||||
| | | | | | | | | | | | | | | | |
Total |
7,511 | 3,250 | 7,118 | 12,019 | |||||||||||
| | | | | | | | | | | | | | | | |
| | | | | | | | | | | | | | | | |
| | | | | | | | | | | | | | | | |
Natural gas—MMcf |
|||||||||||||||
Bakken / Three Forks |
4,584 | 1,966 | 4,003 | 5,673 | |||||||||||
Delaware |
1,230 | — | — | — | |||||||||||
El Halcón |
198 | 314 | 817 | 1,489 | |||||||||||
Other |
1,427 | 731 | 1,740 | 2,961 | |||||||||||
| | | | | | | | | | | | | | | | |
Total |
7,439 | 3,011 | 6,560 | 10,123 | |||||||||||
| | | | | | | | | | | | | | | | |
| | | | | | | | | | | | | | | | |
| | | | | | | | | | | | | | | | |
Natural gas liquids—MBbl |
|||||||||||||||
Bakken / Three Forks |
924 | 384 | 791 | 918 | |||||||||||
Delaware |
218 | — | — | — | |||||||||||
El Halcón |
41 | 78 | 213 | 382 | |||||||||||
Other |
66 | 39 | 92 | 157 | |||||||||||
| | | | | | | | | | | | | | | | |
Total |
1,249 | 501 | 1,096 | 1,457 | |||||||||||
| | | | | | | | | | | | | | | | |
| | | | | | | | | | | | | | | | |
| | | | | | | | | | | | | | | | |
Production: |
|||||||||||||||
Total MBoe(1) |
10,000 | 4,253 | 9,307 | 15,163 | |||||||||||
Average daily production—Boe(1) |
27,397 | 37,637 | 36,787 | 41,542 | |||||||||||
Average price per unit:(2) |
|||||||||||||||
Crude oil price—Bbl |
$ | 45.36 | $ | 43.01 | $ | 34.85 | $ | 42.63 | |||||||
Natural gas price—Mcf |
2.18 | 2.24 | 1.45 | 2.22 | |||||||||||
Natural gas liquids price—Bbl |
15.19 | 12.01 | 7.23 | 9.35 | |||||||||||
Barrel of oil equivalent price—Boe(1) |
37.58 | 35.87 | 28.53 | 36.17 | |||||||||||
Average cost per Boe: |
|||||||||||||||
Production: |
|||||||||||||||
Lease operating |
$ | 6.17 | $ | 5.26 | $ | 5.38 | $ | 6.83 | |||||||
Workover and other |
2.17 | 2.47 | 2.42 | 1.38 | |||||||||||
Taxes other than income |
3.08 | 2.91 | 2.63 | 3.22 | |||||||||||
Gathering and other |
4.08 | 3.45 | 3.15 | 2.66 | |||||||||||
- (1)
- Natural gas reserves are converted to oil reserves using a ratio of six Mcf to one Bbl of oil. This ratio does not assume price
equivalency and, given price differentials, the price for a barrel of oil equivalent for natural gas may differ significantly from the price for a barrel of
oil.
- (2)
- Amounts exclude the impact of cash paid or received on settled commodities derivative contracts as we did not elect to apply hedge accounting.
22
The average crude oil and natural gas sales prices above do not reflect the impact of cash paid on, or cash received from, settled derivative contracts as these amounts are reflected as "Net gain (loss) on derivative contracts" in the consolidated statements of operations, consistent with our decision not to elect hedge accounting. Including this impact, for the year ended December 31, 2017, the average crude oil sales price was $47.62 per Bbl and the average natural gas sales price was $2.29 per Mcf. Including this impact, during the period of September 10, 2016 through December 31, 2016 and the period of January 1, 2016 through September 9, 2016, average crude oil sales prices were $68.99 and $69.25 per Bbl and average natural gas sales prices were $2.33 and $1.58 per Mcf, respectively. For the year ended December 31, 2015, including the impact of our settled derivative contracts, the average crude oil sales price was $78.50 per Bbl and the average natural gas sales price was $3.06 per Mcf.
Competitive Conditions in the Business
The oil and natural gas industry is highly competitive and we compete with a substantial number of other companies that have greater financial and other resources. Many of these companies explore for, produce and market oil and natural gas, as well as carry on refining operations and market the resultant products on a worldwide basis. The primary areas in which we encounter substantial competition are in locating and acquiring desirable leasehold acreage for our drilling and development operations, locating and acquiring attractive producing oil and natural gas properties, obtaining sufficient availability of drilling and completion equipment and services, obtaining purchasers and transporters of the oil and natural gas we produce and hiring and retaining key employees. There is also competition between oil and natural gas producers and other industries producing energy and fuel. Furthermore, competitive conditions may be substantially affected by various forms of energy legislation and/or regulation considered from time to time by the government of the United States and the states in which our properties are located. It is not possible to predict the nature of any such legislation or regulation which may ultimately be adopted or its effects upon our future operations. Such laws and regulations may substantially increase the costs of exploring for, developing or producing oil and natural gas and may prevent or delay the commencement or continuation of a given operation.
Other Business Matters
Markets and Major Customers
The purchasers of our oil and natural gas production consist primarily of independent marketers, major oil and natural gas companies and gas pipeline companies. Historically, we have not experienced any significant losses from uncollectible accounts. In 2017 and 2016, two individual purchasers of our production, Crestwood Midstream Partners, formerly Arrow Field Services LLC (Crestwood), and Suncor Energy Marketing Inc. (Suncor), each accounted for more than 10% of our total sales, collectively representing 58% of our total sales for each year. In 2015, three individual purchasers, Crestwood, Sunoco Inc. and Suncor, each accounted for more than 10% of our total sales, collectively representing 57% of our total sales for the year.
Seasonality of Business
Weather conditions affect the demand for, and prices of, natural gas and can also delay drilling activities, disrupting our overall business plans. Demand for natural gas is typically higher during the winter, resulting in higher natural gas prices for our natural gas production during our first and fourth fiscal quarters. Due to these seasonal fluctuations, our results of operations for individual quarterly periods may not be indicative of the results that we may realize on an annual basis.
23
Operational Risks
Oil and natural gas exploration and development involves a high degree of risk, which even a combination of experience, knowledge and careful evaluation may not be able to overcome. There is no assurance that we will discover or acquire additional oil and natural gas in commercial quantities. Oil and natural gas operations also involve the risk that well fires, blowouts, equipment failure, human error and other events may cause accidental releases of toxic or hazardous materials, such as petroleum liquids or drilling fluids into the environment, or cause significant injury to persons or property. In such event, substantial liabilities to third parties or governmental entities may be incurred, the satisfaction of which could substantially reduce available cash and possibly result in loss of oil and natural gas properties. Such hazards may also cause damage to or destruction of wells, producing formations, production facilities and pipeline or other processing facilities.
As is common in the oil and natural gas industry, we will not insure fully against all risks associated with our business either because such insurance is not available or because we believe the premium costs are prohibitive. A loss not fully covered by insurance could have a material effect on our operating results, financial position or cash flows. For further discussion on risks see Item 1A. Risk Factors.
Regulations
All of the jurisdictions in which we own or operate producing oil and natural gas properties have statutory provisions regulating the exploration for and production of oil and natural gas, including provisions related to permits for the drilling of wells, bonding requirements to drill or operate wells, the location of wells, the method of drilling and casing wells, the surface use and restoration of properties upon which wells are drilled, sourcing and disposal of water used in the drilling and completion process, and the plugging and abandonment of wells. Our operations are also subject to various conservation laws and regulations. These laws and regulations govern the size of drilling and spacing units, the density of wells that may be drilled in oil and natural gas properties and the unitization or pooling of oil and natural gas properties. In this regard, some states allow the forced pooling or integration of land and leases to facilitate exploration while other states rely primarily or exclusively on voluntary pooling of land and leases. In areas where pooling is primarily or exclusively voluntary, it may be difficult to form spacing units and therefore difficult to develop a project if the operator owns less than 100% of the leasehold. In addition, state conservation laws establish maximum rates of production from oil and natural gas wells, generally prohibit the venting or flaring of natural gas, and impose specified requirements regarding the ratability of production. On some occasions, local authorities have imposed moratoria or other restrictions on exploration and production activities pending investigations and studies addressing potential local impacts of these activities before allowing oil and natural gas exploration and production to proceed.
The effect of these regulations is to limit the amount of oil and natural gas that we can produce from our wells and to limit the number of wells or the locations at which we can drill, although we can apply for exceptions to such regulations or to have reductions in well spacing. Failure to comply with applicable laws and regulations can result in substantial penalties. The regulatory burden on the industry increases the cost of doing business and affects profitability. Moreover, each state generally imposes a production or severance tax with respect to the production and sale of oil, natural gas and natural gas liquids within its jurisdiction.
Environmental Regulations
Our operations are subject to stringent federal, state and local laws regulating the discharge of materials into the environment or otherwise relating to health and safety or the protection of the environment. Numerous governmental agencies, such as the United States Environmental Protection
24
Agency, commonly referred to as the EPA, issue regulations to implement and enforce these laws, which often require difficult and costly compliance measures. Among other things, environmental regulatory programs typically govern the permitting, construction and operation of a facility. Many factors, including public perception, can materially impact the ability to secure an environmental construction or operation permit. Failure to comply with environmental laws and regulations may result in the assessment of substantial administrative, civil and criminal penalties, as well as the issuance of injunctions limiting or prohibiting our activities. In addition, some laws and regulations relating to protection of the environment may, in certain circumstances, impose strict liability for environmental contamination, which could result in liability for environmental damages and cleanup costs without regard to negligence or fault on our part.
Beyond existing requirements, new programs and changes in existing programs may address various aspects of our business, including natural occurring radioactive materials, oil and natural gas exploration and production, air emissions, waste management, and underground injection of waste material. Environmental laws and regulations have been subject to frequent changes over the years, and the imposition of more stringent requirements could have a material adverse effect on our financial condition and results of operations. The following is a summary of the more significant existing environmental, health and safety laws and regulations to which our business operations are subject and for which compliance in the future may have a material adverse impact on our capital expenditures, earnings and competitive position.
Hazardous Substances and Wastes
The federal Comprehensive Environmental Response, Compensation and Liability Act, referred to as CERCLA or the Superfund law, and comparable state laws impose liability, without regard to fault, on certain classes of persons that are considered to be responsible for the release of a hazardous substance into the environment. These persons may include the current or former owner or operator of the disposal site or sites where the release occurred and companies that disposed or arranged for the disposal of hazardous substances that have been released at the site. Under CERCLA, these persons may be subject to joint and several liability for the costs of investigating and cleaning up hazardous substances that have been released into the environment, for damages to natural resources and for the costs of some health studies. In addition, it is not uncommon for neighboring landowners and other third parties to file claims for personal injury and property damage allegedly caused by hazardous substances or other pollutants released into the environment.
Under the federal Solid Waste Disposal Act, as amended by the Resource Conservation and Recovery Act of 1976, referred to as RCRA, most wastes generated by the exploration and production of oil and natural gas are not regulated as hazardous waste. Periodically, however, there are proposals to lift the existing exemption for oil and gas wastes and reclassify them as hazardous wastes or to subject them to enhanced solid waste regulation. If such proposals were to be enacted, they could have a significant impact on our operating costs and on those of all the industry in general. In the ordinary course of our operations, moreover some wastes generated in connection with our exploration and production activities may be regulated as solid waste under RCRA, as hazardous waste under existing RCRA regulations or as hazardous substances under CERCLA. From time to time, releases of materials or wastes have occurred at locations we own or at which we have operations. These properties and the materials or wastes released thereon may be subject to CERCLA, RCRA and analogous state laws. Under these laws, we have been and may be required to remove or remediate such materials or wastes.
Water Discharges
Our operations also may be subject to the federal Clean Water Act and analogous state statutes. Those laws regulate discharges of wastewater, oil, and other pollutants to surface water bodies, such as
25
lakes, rivers, wetlands, and streams. Failure to obtain permits for such discharges could result in civil and criminal penalties, orders to cease such discharges, and costs to remediate and pay natural resources damages. These laws also require the preparation and implementation of Spill Prevention, Control, and Countermeasure Plans in connection with on-site storage of significant quantities of oil. In the event of a discharge of oil into U.S. waters we could be liable under the Oil Pollution Act for clean up costs, damages and economic losses.
Our oil and natural gas production also generates salt water, which we dispose of by underground injection. The federal Safe Drinking Water Act (SDWA), the Underground Injection Control (UIC) regulations promulgated under the SDWA and related state programs regulate the drilling and operation of salt water disposal wells. The EPA directly administers the UIC program in some states, and in others it is delegated to the state for administering. Permits must be obtained before drilling salt water disposal wells, and casing integrity monitoring must be conducted periodically to ensure the casing is not leaking salt water to groundwater. Contamination of groundwater by oil and natural gas drilling, production, and related operations may result in fines, penalties, and remediation costs, among other sanctions and liabilities under the SDWA and state laws. In addition, third party claims may be filed by landowners and other parties claiming damages for alternative water supplies, property damages, and bodily injury.
Hydraulic Fracturing
Our completion operations are subject to regulation, which may increase in the short- or long-term. In particular, the well completion technique known as hydraulic fracturing, which is used to stimulate production of oil and natural gas, has come under increased scrutiny by the environmental community, and many local, state and federal regulators. Hydraulic fracturing involves the injection of water, sand and additives under pressure, usually down casing that is cemented in the wellbore, into prospective rock formations at depths to stimulate oil and natural gas production. We engage third parties to provide hydraulic fracturing or other well stimulation services to us in connection with substantially all of the wells for which we are the operator.
Working at the direction of Congress, the EPA issued a study in 2016 finding that hydraulic fracturing could potentially harm drinking water resources under adverse circumstances such as injection directly into groundwater or into production wells lacking mechanical integrity. The EPA also promulgated pre-treatment standards under the Clean Water Act for wastewater discharges from shale hydraulic fracturing operations to municipal sewage treatment plants. Beyond that, several environmental groups have petitioned the EPA to extend toxic release reporting requirements under the Emergency Planning and Community Right-to-Know Act to the oil and natural gas extraction industry and to require disclosure under the Toxic Substances Control Act of chemicals used in fracturing. Congress might likewise consider legislation to amend the federal SDWA to require the disclosure of chemicals used by the oil and natural gas industry in the hydraulic fracturing process. Certain states, including Colorado, Utah and Wyoming, already have issued similar disclosure rules.
In addition, the Department of the Interior promulgated regulations concerning the use of hydraulic fracturing on lands under its jurisdiction, which includes lands on which we conduct or plan to conduct operations while the Trump Administration rescinded those rules that decision is being challenged in court. Regardless of how the federal issues are eventually resolved, states have been imposing new restrictions or bans on hydraulic fracturing. Even local jurisdictions, such as Denton, Texas and several cities in Colorado, have adopted, or tried to adopt, regulations restricting hydraulic fracturing. Additional hydraulic fracturing requirements at the federal, state or local level may limit our ability to operate or increase our operating costs.
26
Air Emissions
The federal Clean Air Act and comparable state laws regulate emissions of various air pollutants through permitting programs and the imposition of other requirements. In addition, the EPA has developed and may continue to develop stringent regulations governing emissions of toxic air pollutants at specified sources, including oil and natural gas production. Federal and state regulatory agencies can impose administrative, civil and criminal penalties for non-compliance with air permits or other requirements of the federal Clean Air Act and associated state laws and regulations. Our operations, or the operations of service companies engaged by us, may in certain circumstances and locations be subject to permits and restrictions under these statutes for emissions of air pollutants.
In 2012 and 2016, the EPA issued air regulations for the oil and natural gas industry that address emissions from certain new sources of volatile organic compounds, sulfur dioxide, air toxics, and methane. The rules included the first federal air standards for natural gas and oil wells that are hydraulically fractured, or refractured, as well as requirements for other processes and equipment, including storage tanks. Compliance with these regulations has imposed additional requirements and costs on our operations. The Trump Administration may rescind some or all of the 2016 requirements, but supporters of the existing regulations likely would seek judicial review of any such decision.
In October 2015, the EPA announced that it was lowering the primary national ambient air quality standard for ozone from 75 parts per billion to 70 parts per billion. Implementation will take place over several years; however, the new standard could result in a significant expansion of ozone nonattainment areas across the United States, including areas in which we operate. Oil and natural gas operations in ozone nonattainment areas would likely be subject to increased regulatory burdens in the form of more stringent emission controls, emission offset requirements, and increased permitting delays and costs.
Climate Change
Studies over recent years have indicated that emissions of certain gases may be contributing to warming of the Earth's atmosphere. In response, governments increasingly have been adopting domestic and international climate change regulations that require reporting and reductions of the emission of such greenhouse gases. Methane, a primary component of natural gas, and carbon dioxide, a byproduct of burning oil, natural gas and refined petroleum products, are considered greenhouse gases. Internationally, the United Nations Framework Convention on Climate Change, the Kyoto Protocol and the Paris Agreement address greenhouse gas emissions, and several countries, including those comprising the European Union, have established greenhouse gas regulatory systems. In the United States, at the state level, many states, either individually or through multi-state regional initiatives, have been implementing legal measures to reduce emissions of greenhouse gases, primarily through emission inventories, emissions targets, greenhouse gas cap and trade programs or incentives for renewable energy generation, while others have considered adopting such greenhouse gas programs.
At the federal level, the EPA has issued regulations requiring us and other companies to annually report certain greenhouse gas emissions from our oil and natural gas facilities. Beyond its measuring and reporting rules, the EPA has issued an "Endangerment Finding" under section 202(a) of the Clean Air Act, concluding greenhouse gas pollution threatens the public health and welfare of current and future generations. The finding served as the first step in issuing regulations that require permits for and reductions in greenhouse gas emissions for certain facilities.
In addition, the Obama Administration developed a Strategy to Reduce Methane Emissions that was intended to result by 2025 in a 40-45% decrease in methane emissions from the oil and gas industry as compared to 2012 levels. Consistent with that strategy, the EPA issued air rules for oil and gas production sources, and the federal Bureau of Land Management (BLM) promulgated standards for reducing venting and flaring on public lands. The Trump Administration has been trying to roll back
27
many of the Obama-era policies and rules; however, the long-term direction of federal climate regulation is uncertain.
Any laws or regulations that may be adopted to restrict or reduce emissions of greenhouse gases could require us to incur additional operating costs, such as costs to purchase and operate emissions control systems or other compliance costs, and reduce demand for our products.
The National Environmental Policy Act
Oil and natural gas exploration and production activities may be subject to the National Environmental Policy Act, or NEPA. NEPA requires federal agencies, including the Department of the Interior, to evaluate major agency actions that have the potential to significantly impact the environment. In the course of such evaluations, an agency will prepare an Environmental Assessment that assesses the potential direct, indirect and cumulative impacts of a proposed project and, if necessary, will prepare a more detailed Environmental Impact Statement that may be made available for public review and comment. All of our current exploration and production activities, as well as proposed exploration and development plans, on federal lands require governmental permits that are subject to the requirements of NEPA. This process has the potential to delay the development of oil and natural gas projects.
Threatened and endangered species, migratory birds, and natural resources
Various state and federal statutes prohibit certain actions that adversely affect endangered or threatened species and their habitat, migratory birds, wetlands, and natural resources. These statutes include the Endangered Species Act, the Migratory Bird Treaty Act and the Clean Water Act. The United States Fish and Wildlife Service may designate critical habitat areas that it believes are necessary for survival of threatened or endangered species. A critical habitat designation could result in further material restrictions on federal land use or on private land use and could delay or prohibit land access or development. Where takings of or harm to species or damages to wetlands, habitat, or natural resources occur or may occur, government entities or at times private parties may act to prevent or restrict oil and gas exploration activities or seek damages for any injury, whether resulting from drilling or construction or releases of oil, wastes, hazardous substances or other regulated materials, and in some cases, criminal penalties, may result.
Occupational Safety and Health Act
We are subject to the requirements of the federal Occupational Safety and Health Act and comparable state statutes that regulate the protection of the health and safety of workers. In addition, the Occupational Safety and Health Administration's hazard communication standard requires that information be maintained about hazardous materials used or produced in operations and that this information be provided to employees.
Employees and Principal Office
As of December 31, 2017, we had 119 full-time employees. We hire independent contractors on an as needed basis. We have no collective bargaining agreements with our employees. We believe that our employee relationships are satisfactory.
As of December 31, 2017, we leased corporate office space in Houston, Texas at 1000 Louisiana Street, where our principal offices are located. We also lease corporate office space in Denver, Colorado.
28
Access to Company Reports
We file periodic reports, proxy statements and other information with the SEC in accordance with the requirements of the Securities Exchange Act of 1934, as amended. We make our Annual Reports on Form 10-K, Quarterly Reports on Form 10-Q, Current Reports on Form 8-K and Forms 3, 4 and 5 filed on behalf of directors and officers, and any amendments to such reports, available free of charge through our corporate website at www.halconresources.com as soon as reasonably practicable after such reports are filed with, or furnished to, the SEC. In addition, our insider trading policy, regulation FD policy, equity-based incentive grant policy, corporate governance guidelines, code of conduct, code of ethics, audit committee charter, compensation committee charter, nominating and corporate governance committee charter and reserves committee charter are available on our website under the heading "Investors—Corporate Governance". Within the time period required by the SEC and the NYSE, as applicable, we will post on our website any modifications to the code of conduct and the code of ethics for our chief executive officer and senior financial officers and any waivers applicable to senior officers as defined in the applicable code, as required by the Sarbanes-Oxley Act of 2002. You may also read and copy any document we file with the SEC at the SEC's Public Reference Room at 100 F Street, N.E., Washington, D.C. 20549. You may obtain information on the operation of the Public Reference Room by calling the SEC at 1-800-SEC-0330. In addition, our reports, proxy and information statements, and our other filings are also available to the public over the internet at the SEC's website at www.sec.gov. Unless specifically incorporated by reference in this Annual Report on Form 10-K, information that you may find on our website is not part of this report.
Oil and natural gas prices are volatile, and low prices could have a material adverse impact on our business.
Our revenues, profitability and future growth and the carrying value of our properties depend substantially on prevailing oil and natural gas prices. Prices also affect the amount of cash flow available for capital expenditures and our ability to borrow and raise additional capital. The amount we will be able to borrow under our Senior Credit Agreement will be subject to periodic redeterminations based in part on current oil and natural gas prices and on changing expectations of future prices. Lower prices may also reduce the amount of oil and natural gas that we can economically produce and have an adverse effect on the value of our properties.
Historically, the markets for oil and natural gas have been volatile, and they are likely to continue to be volatile in the future. Among the factors that can cause volatility are:
- •
- the domestic and foreign supply of oil and natural gas;
- •
- the ability of members of the Organization of Petroleum Exporting Countries and other producing countries to agree upon and maintain oil prices
and production levels;
- •
- social unrest and political instability, particularly in major oil and natural gas producing regions outside the United States, such as the
Middle East, and armed conflict or terrorist attacks, whether or not in oil or natural gas producing regions;
- •
- the level of consumer product demand;
- •
- the growth of consumer product demand in emerging markets, such as China;
- •
- labor unrest in oil and natural gas producing regions;
- •
- weather conditions, including hurricanes and other natural occurrences that affect the supply and/or demand of oil and natural gas;
- •
- the price and availability of alternative fuels;
29
- •
- the price of foreign imports;
- •
- worldwide economic conditions; and
- •
- the availability of liquid natural gas imports.
These external factors and the volatile nature of the energy markets make it difficult to estimate future prices of oil and natural gas.
We are substantially dependent upon our drilling success on our Delaware Basin properties, which are largely undeveloped and with which we have less experience.
We divested substantially all of our proved reserves and production when we sold our Williston Basin and El Halcón assets in 2017. The disposition of these assets, combined with our other recent acquisition and divestiture activities, transformed our Company from multiple basin operations in which we had years of accumulated operational experience and substantial proved developed acreage to a pure-play, single-basin operator, with largely unproven acreage concentrated in the Delaware Basin in West Texas, an area in which we have only limited recent experience. As a consequence, we are subject to the greater risks associated with a more concentrated, less developed property portfolio in an area where we have less experience, and are more dependent upon our future drilling success in that area. If our drilling results are less than anticipated, or the risks associated with a more concentrated property portfolio, such as regional supply and demand factors and delays or interruptions in production from governmental regulation, transportation constraints, market limitations, water shortages or other conditions, adversely impact our ability to produce or market our production, it could have a material adverse effect on our business, financial condition, results of operations, and cash flows.
Future sales of our common stock in the public market or the issuance of securities senior to our common stock, or the perception that these sales may occur, could adversely affect the trading price of our common stock and our ability to raise funds in stock offerings.
A large percentage of our shares of common stock are held by a relatively small number of investors. Further, we entered into registration rights agreements with certain of those investors pursuant to which we filed a registration statement with the SEC to facilitate potential future sales of such shares by them. Sales by us or our stockholders of a substantial number of shares of our common stock in the public markets, or even the perception that these sales might occur, could cause the market price of our common stock to decline or could impair our ability to raise capital through a future sale of, or pay for acquisitions using, our equity securities.
We are currently authorized to issue 1.0 billion shares of common stock and 1.0 million shares of preferred stock, with such designations, rights, preferences, privileges and restrictions as determined by the board of directors. As of February 23, 2018, we had outstanding approximately 158.6 million shares of common stock and warrants and options to purchase an aggregate of 11.4 million shares of our common stock.
As of February 23, 2018, we have also reserved an additional 7.9 million shares for future issuance to our directors, officers and employees as restricted stock or stock option awards pursuant to our 2016 Long-Term Incentive Plan. The potential issuance of such additional shares of common stock may create downward pressure on the trading price of our common stock.
We may issue common stock or other equity securities senior to our common stock in the future for a number of reasons, including to finance acquisitions, to adjust our leverage ratio, and to satisfy our obligations upon the exercise of warrants and options, or for other reasons. We cannot predict the effect, if any, that future sales or issuances of shares of our common stock or other equity securities, or the availability of shares of common stock or such other equity securities for future sale or issuance, will have on the trading price of our common stock.
30
There may be circumstances in which the interests of our significant stockholders could be in conflict with the interests of our other stockholders.
Funds advised by Franklin Advisors, Inc. and Ares Management LLC hold a significant portion of our common stock. Circumstances may arise in which these stockholders may have an interest in pursuing or preventing acquisitions, divestitures or other transactions, including the issuance of additional shares or debt, that, in their judgment, could enhance their investment in us or another company in which they invest. Such transactions might adversely affect us or other holders of our common stock. In addition, our significant concentration of share ownership may adversely affect the trading price of our common shares because investors may perceive disadvantages in owning shares in companies with significant stockholders.
We may have difficulty financing our planned capital expenditures which could adversely affect our growth.
Our business requires substantial capital expenditures primarily to fund our drilling program. We may also continue to selectively increase our acreage position, which would require capital in addition to the capital necessary to drill on our existing acreage. In addition, it is possible that we will acquire acreage in other areas that we believe are prospective for oil and natural gas production and expend capital to develop such acreage. We expect to use borrowings under our Senior Credit Agreement and proceeds from potential future capital markets transactions, if necessary, to fund capital expenditures that are in excess of our operating cash flow and cash on hand.
Our Senior Credit Agreement limits our borrowings to the lesser of the borrowing base and the total commitments. As of December 31, 2017, our Senior Credit Agreement had a borrowing base of approximately $100.0 million. As of December 31, 2017, we had no indebtedness outstanding, approximately $1.6 million of letters of credit outstanding and approximately $98.4 million of borrowing capacity available under our Senior Credit Agreement. Our borrowing base is determined semi-annually, and may also be redetermined periodically at the discretion of our lenders. A reduction in our borrowing base could require us to repay any indebtedness in excess of the borrowing base. Our Senior Credit Agreement also contains certain financial covenants, including the maintenance of (i) a Total Net Indebtedness Leverage Ratio (as defined in the Senior Credit Agreement) not to exceed 4.00:1.00 and (ii) a Current Ratio (as defined in the Senior Credit Agreement) not to be less than 1.00:1.00.
On February 2, 2018, we entered into the Second Amendment to the Senior Credit Agreement which among other things, for certain fiscal quarters in 2018, provided flexibility with respect to certain financial covenants as specified in the Senior Credit Agreement. The Second Amendment provides for (i) the use of annualized financial data in determining EBITDA (as defined in the Senior Credit Agreement) for the fiscal quarters ending June 30, 2018, September 30, 2018 and December 31, 2018, (ii) an increase in the ratio of our Consolidated Total Net Debt (as defined in the Senior Credit Agreement) to EBITDA of 4.50:1.00 for the fiscal quarter ending June 30, 2018, and a ratio of 4.00:1.00 for any fiscal quarter thereafter, (iii) a waiver of compliance with the covenant relating to the Total Net Indebtedness Leverage Ratio (as defined in the Senior Credit Agreement) for the fiscal quarter ending March 31, 2018, and (iv) a waiver of the automatic reduction to the borrowing base that would otherwise have resulted from our issuance of the Additional 2025 Notes. In the event we have difficulty meeting the total net indebtedness leverage ratio test or the current ratio test in the future, we would be required to seek additional relief, and there is no assurance that it would be granted.
Additionally, the indenture governing our senior debt contain covenants limiting our ability to incur additional indebtedness, including borrowings under our Senior Credit Agreement, unless we meet one of two alternative tests or utilize the limited exceptions available. The first test applies to all indebtedness and requires that, after giving effect to the incurrence of additional debt, our fixed charge coverage ratio (which is the ratio of our adjusted consolidated EBITDA (as defined in our indenture)
31
to our adjusted consolidated interest expense over the trailing four fiscal quarters) will be at least 2.00:1.00. The second test allows us to incur additional indebtedness, beyond the limitations of the fixed charge coverage ratio test, as long as this additional debt is incurred under Credit Facilities (as defined in our indenture) and generally, the amount thereof is not more than, subject to certain exceptions, the greater of (i) $350 million, (ii) the borrowing base in effect under our Senior Credit Agreement, and (iii) 30% of our adjusted consolidated net tangible assets, or ACNTA. ACNTA is defined in our indenture and is determined primarily by the value of discounted future net revenues from proved oil and natural gas reserves plus the capitalized cost attributable to our unevaluated properties. Currently, we are permitted to incur additional indebtedness under the indenture, but may be limited in the future. Lower oil and natural gas prices in the future could reduce our adjusted consolidated EBITDA, as well as our ACNTA, and thus could reduce our ability to incur additional indebtedness.
Additionally, our ability to complete future equity offerings is limited by general market conditions. If we are not able to borrow sufficient amounts under our Senior Credit Agreement and/or are unable to raise sufficient capital to fund our capital expenditures, we may be required to curtail our drilling, development, land acquisition and other activities, which could result in a decrease in our production of oil and natural gas, forfeiture of leasehold interests if we are unable or unwilling to renew them, and could force us to sell some of our assets on an untimely or unfavorable basis, each of which could have a material adverse effect on our results and future operations.
We may be required to take non-cash asset write downs.
We may be required under full cost accounting rules to write down the carrying value of oil and natural gas properties if oil and natural gas prices decline or if there are substantial downward adjustments to our estimated proved reserves, increases in our estimates of development costs or deterioration in our exploration results. We utilize the full cost method of accounting for oil and natural gas exploration and development activities. Under full cost accounting, we are required by SEC regulations to perform a ceiling test each quarter. The ceiling test is an impairment test and generally establishes a maximum, or "ceiling," of the book value of oil and natural gas properties that is equal to the expected after tax present value (discounted at 10%) of the future net cash flows from proved reserves, including the effect of cash flow hedges when hedge accounting is applied, calculated using the unweighted arithmetic average of the first day of each month for the 12-month period ending at the balance sheet date. If the net book value of oil and natural gas properties (reduced by any related net deferred income tax liability and asset retirement obligation) exceeds the ceiling limitation, SEC regulations require us to impair or "write down" the book value of our oil and natural gas properties.
We experienced write downs in the recent past. For instance, during 2016, the net book value of our oil and natural gas properties at March 31, June 30, and September 30, 2016 exceeded the respective ceiling amounts for each quarter end. As a result, we recorded full cost ceiling test impairments before income taxes of $420.9 million for the period of September 10, 2016 through September 30, 2016 and $754.8 million for the period January 1, 2016 through September 9, 2016. The impairment at September 30, 2016 primarily reflects the pricing differences between the first-day-of-the-month average price for the preceding twelve months required by Regulation S-X, Rule 4-10 and ASC 932 used in calculating the ceiling test and the forward-looking prices required by ASC 852 to estimate the fair value of the Company's oil and natural gas properties on the fresh-start reporting date, September 9, 2016. The ceiling test impairments at March 31 and June 30, 2016 were driven by decreases in the first-day-of-the-month average prices for crude oil used in the ceiling test calculations since December 31, 2015. As ceiling test computations depend in part upon the unweighted arithmetic average prices of oil and natural gas prices, which are inherently volatile, sustained lower commodity prices will have a material impact upon our full cost ceiling test calculation. Continued write downs of oil and natural gas properties could continue to occur until such time as commodity prices have recovered, and remained at recovered levels, so as to increase the 12-month average price
32
used in the ceiling calculation. Depending on the magnitude, a ceiling test write down could materially affect our results of operations.
Costs associated with unevaluated properties, which were approximately $765.8 million at December 31, 2017, are not initially subject to the ceiling test limitation. Rather, we assess all items classified as unevaluated property on a quarterly basis for possible impairment or reduction in value based upon our intentions with respect to drilling on such properties, the remaining lease term, geological and geophysical evaluations, drilling results, the assignment of proved reserves, and the economic viability of development if proved reserves are assigned. These factors are significantly influenced by our expectations regarding future commodity prices, development costs, and access to capital at acceptable cost. During any period in which these factors indicate impairment, the cumulative drilling costs incurred to date for such property and all or a portion of the associated leasehold costs are transferred to the full cost pool and are then subject to depletion and the ceiling test limitation. Accordingly, a significant change in these factors, many of which are beyond our control, may shift a significant amount of cost from unevaluated properties into the full cost pool that is subject to depletion and the ceiling test limitation.
Our exploration and development drilling efforts and the operation of our wells may not be profitable or achieve our targeted returns.
We require significant amounts of undeveloped leasehold acreage to further our development efforts. Exploration, development, drilling and production activities are subject to many risks, including the risk that commercially productive reservoirs will not be discovered. We invest in property, including undeveloped leasehold acreage, which we believe will result in projects that will add value over time. However, we cannot guarantee that our leasehold acreage will be profitably developed, that new wells drilled by us will be productive or that we will recover all or any portion of our investment in such leasehold acreage or wells. Drilling for oil and natural gas may involve unprofitable efforts, not only from dry wells but also from wells that are productive but do not produce sufficient net reserves to return a profit after deducting operating and other costs. In addition, wells that are profitable may not achieve our targeted rate of return. Our ability to achieve our target results are dependent upon the current and future market prices for oil and natural gas, costs associated with producing oil and natural gas and our ability to add reserves at an acceptable cost.
In addition, we may not be successful in controlling our drilling and production costs to improve our overall return. The cost of drilling, completing and operating a well is often uncertain and cost factors can adversely affect the economics of a project. We cannot predict the cost of drilling and completing a well, and we may be forced to limit, delay or cancel drilling operations as a result of a variety of factors, including:
- •
- unexpected drilling conditions;
- •
- pressure or irregularities in formations;
- •
- equipment failures or accidents and shortages or delays in the availability of drilling and completion equipment and services;
- •
- adverse weather conditions, including hurricanes; and
- •
- compliance with governmental requirements.
We will be subject to risks in connection with acquisitions, and the integration of significant acquisitions may be difficult and may involve unexpected costs or delays.
We have completed in the past and may complete in the future significant acquisitions of reserves, properties, prospects and leaseholds and other strategic transactions that appear to fit within our
33
overall business strategy, which may include the acquisition of asset packages of producing properties, undeveloped acreage or existing companies or businesses operating in our industry. The successful acquisition of assets in our industry requires an assessment of several factors, including:
- •
- recoverable reserves;
- •
- future oil, natural gas and natural gas liquids prices and their appropriate differentials;
- •
- development and operating costs; and
- •
- potential environmental and other liabilities.
The accuracy of these assessments is inherently uncertain. In connection with these assessments, we perform a review of the subject properties that we believe to be generally consistent with industry practices. Our review will not reveal all existing or potential problems nor will it permit us to become sufficiently familiar with the properties to fully assess their deficiencies and potential recoverable reserves. Inspections may not always be performed on every well or well site, and environmental problems are not necessarily observable even when an inspection is undertaken. Even when problems are identified, the seller may be unwilling or unable to provide effective contractual protection against all or part of the problems. We are generally not able to obtain contractual indemnification for environmental liabilities and normally acquire properties on an "as is" basis.
Significant acquisitions of existing companies or businesses and other strategic transactions may involve additional risks, including:
- •
- diversion of our management's attention to evaluating, negotiating and integrating significant acquisitions and strategic transactions;
- •
- the challenge and cost of integrating acquired operations, information management and other technology systems and business cultures with our
own while carrying on our ongoing business;
- •
- difficulty associated with coordinating geographically separate organizations;
- •
- the challenge of integrating environmental compliance systems to meet requirements of rapidly changing regulations;
- •
- the challenge of attracting and retaining personnel associated with acquired operations; and
- •
- failure to realize the full benefit that we expect in estimated proved reserves, production volume, cost savings from operating synergies or other benefits anticipated from an acquisition, or to realize these benefits within our expected time frame.
The process of integrating operations could cause an interruption of, or loss of momentum in, the activities of our business. Members of our senior management may be required to devote considerable amounts of time to this integration process, which will decrease the time they will have to manage our business. If our senior management is not able to manage the integration process effectively, or if any significant business activities are interrupted as a result of the integration process, our business could be materially and adversely affected.
Historically, we have had substantial indebtedness and we may incur substantially more debt in the future. Higher levels of indebtedness make us more vulnerable to economic downturns and adverse developments in our business.
We have incurred debt amounting to approximately $425.0 million principal amount as of December 31, 2017. In addition, on February 15, 2018, we issued $200.0 million aggregate principal amount of our 6.75% senior notes due 2025 in a private placement exempt from registration under the Securities Act of 1933, as amended, pursuant to Rule 144A and Regulation S, and applicable state securities laws. As a result of our indebtedness, we will need to use a portion of our cash flow to pay
34
interest, which will reduce the amount we will have available to finance our operations and other business activities and could limit our flexibility in planning for or reacting to changes in our business and the industry in which we operate. Our indebtedness under our Senior Credit Agreement is at a variable interest rate, and so a rise in interest rates will generate greater interest expense to the extent we do not have hedging arrangements that are effective in mitigating interest rate fluctuations. The amount of our debt may also cause us to be more vulnerable to economic downturns and adverse developments in our business.
We may incur substantially more debt in the future. The indenture governing our outstanding senior notes contain restrictions on our incurrence of additional indebtedness. These restrictions, however, are subject to a number of qualifications and exceptions, and under certain circumstances, we could incur substantial additional indebtedness in compliance with these restrictions. Moreover, these restrictions do not prevent us from incurring obligations that do not constitute "indebtedness" as defined under the indenture. At December 31, 2017, our Senior Credit Agreement had a borrowing base of approximately $100.0 million. At December 31, 2017, we had no indebtedness outstanding, approximately $1.6 million of letters of credit outstanding and approximately $98.4 million of borrowing capacity available under our Senior Credit Agreement.
Our ability to meet our debt obligations and other expenses will depend on our future performance, which will be affected by financial, business, economic, regulatory and other factors, many of which we are unable to control. If our cash flow is not sufficient to service our debt, we may be required to refinance debt, sell assets or sell additional shares of common or preferred stock on terms that we may not find attractive if it may be done at all. Further, our failure to comply with the financial and other restrictive covenants relating to our indebtedness could result in a default under that indebtedness, which could adversely affect our business, financial condition and results of operations.
A downgrade in our credit rating could negatively impact our cost of and ability to access capital.
As of the date of this filing, our corporate credit rating was "B–" with a stable outlook by Standard and Poor's (S&P) and "B3" with a stable outlook by Moody's Investors Service (Moody's). Although we are not aware of any current plans of these or other rating agencies to lower their respective ratings on us or our senior debt, we cannot be assured that our credit ratings will not be downgraded. A downgrade in our credit ratings could negatively impact our cost of capital and our ability to effectively execute aspects of our strategy. If our credit rating were downgraded, it could be difficult for us to raise debt in the public debt markets and the cost of that new debt could be higher than debt we could raise with our current ratings. In addition, a downgrade could impact requirements for us to provide financial assurance of performance under contractual arrangements or derivative agreements.
Unless we replace our reserves, our reserves and production will decline, which would adversely affect our financial condition, results of operations and cash flows.
Producing oil and natural gas reservoirs generally are characterized by declining production rates that vary depending upon reservoir characteristics and other factors. Decline rates are typically greatest early in the productive life of a well. Estimates of the decline rate of an oil or natural gas well are inherently imprecise, and are less precise with respect to new or emerging oil and natural gas formations with limited production histories than for more developed formations with established production histories. Our production levels and the reserves that we currently expect to recover from our wells will change if production from our existing wells declines in a different manner than we have estimated and can change under other circumstances. Thus, our future oil and natural gas reserves and production and, therefore, our cash flow and results of operations are highly dependent upon our success in efficiently developing and exploiting our current properties and economically finding or acquiring additional recoverable reserves. We may not be able to develop, find or acquire additional
35
reserves to replace our current and future production at acceptable costs. If we are unable to replace our current and future production, our cash flows and the value of our reserves may decrease, adversely affecting our business, financial condition, results of operations, cash flows and potentially the borrowing capacity under our Senior Credit Agreement.
Estimates of proved oil and natural gas reserves involve assumptions and any material inaccuracies in these assumptions will materially affect the quantities and the value of our reserves.
This Annual Report on Form 10-K contains estimates of our proved oil and natural gas reserves. These estimates are based upon various assumptions, including assumptions required by the SEC relating to oil and natural gas prices, drilling and operating expenses, capital expenditures, taxes and availability of funds. The process of estimating oil and natural gas reserves is complex. This process requires significant decisions and assumptions in the evaluation of available geological, geophysical, engineering and economic data for each reservoir. Therefore, these estimates are inherently imprecise.
Actual future production, oil and natural gas prices, revenues, taxes, development expenditures, operating expenses and quantities of recoverable oil and natural gas reserves will vary from those estimated. Any significant variance could materially affect the estimated quantities and the value of our reserves. Our properties may also be susceptible to hydrocarbon drainage from production by other operators on adjacent properties. In addition, we may adjust estimates of proved reserves to reflect production history, results of exploration and development, prevailing oil and natural gas prices and other factors, many of which are beyond our control.
At December 31, 2017, approximately 69% of our estimated proved reserves were classified as proved undeveloped. Recovery of proved undeveloped reserves requires significant capital expenditures and successful drilling operations. The reserve data assumes that we will make significant capital expenditures to develop our reserves. The estimates of these oil and natural gas reserves and the costs associated with development of these reserves have been prepared in accordance with SEC regulations, however, actual capital expenditures will likely vary from estimated capital expenditures, development may not occur as scheduled and actual results may not be as estimated.
We may not be able to drill wells on a substantial portion of our acreage.
We may not be able to drill on a substantial portion of our acreage for various reasons. We may not generate or be able to raise sufficient capital to do so. Commodities pricing may also make drilling some acreage uneconomic. Our actual drilling activities and future drilling budget will depend on drilling results, oil and natural gas prices, the availability and cost of capital, drilling and production costs, availability of drilling services and equipment, lease expirations, gathering system and pipeline transportation constraints, regulatory approvals and other factors. In addition, any drilling activities we are able to conduct may not be successful or add additional proved reserves to our overall proved reserves, which could have a material adverse effect on our future business, financial condition and results of operations.
Certain of our undeveloped leasehold acreage is subject to leases that will expire over the next several years unless production is established on units containing the acreage.
As of December 31, 2017, we owned leasehold interests in approximately 40,000 net acres in the Delaware Basin in West Texas of which approximately 19,000 net acres are undeveloped. Unless production in paying quantities is established on units containing these leases during their terms or unless we pay (to the extent we have the contractual right to pay) delay rentals or obtain other extensions to maintain the lease, these leases will expire. If our leases expire, we will lose our right to develop the related properties. We have no current plans to drill on acreage in other areas that we held as of December 31, 2017, outside of our core area of operations.
36
Our drilling plans are subject to change based upon various factors, many of which are beyond our control, including drilling results, oil and natural gas prices, the availability and cost of capital, drilling and production costs, availability of drilling services and equipment, gathering system and pipeline transportation constraints, and regulatory approvals. Further, some of our acreage is located in sections where we do not hold the majority of the acreage and therefore it is likely that we will not be named operator of these sections. As a non-operating leaseholder we have less control over the timing of drilling and are therefore subject to additional risk of expirations.
We depend substantially on the continued presence of key personnel for critical management decisions and industry contacts.
Our success depends upon the continued contributions of our executive officers and key employees, particularly with respect to providing the critical management decisions and contacts necessary to manage and maintain growth within a highly competitive industry. Competition for qualified personnel can be intense, particularly in the oil and natural gas industry, and there are a limited number of people with the requisite knowledge and experience. Under these conditions, we could be unable to attract and retain these personnel. The loss of the services of any of our executive officers or other key employees for any reason could have a material adverse effect on our business, operating results, financial condition and cash flows.
Our oil and natural gas activities are subject to various risks which are beyond our control.
Our operations are subject to many risks and hazards incident to exploring and drilling for, producing, transporting, marketing and selling oil and natural gas. Although we may take precautionary measures, many of these risks and hazards are beyond our control and unavoidable under the circumstances. Many of these risks or hazards could materially and adversely affect our revenues and expenses, the ability of certain of our wells to produce oil and natural gas in commercial quantities, the rate of production and the economics of the development of, and our investment in the prospects in which we have or will acquire an interest. Any of these risks and hazards could materially and adversely affect our financial condition, results of operations and cash flows. Such risks and hazards include:
- •
- human error, accidents, labor force and other factors beyond our control that may cause personal injuries or death to persons and destruction
or damage to equipment and facilities;
- •
- blowouts, fires, hurricanes, pollution and equipment failures that may result in damage to or destruction of wells, producing formations,
production facilities and equipment;
- •
- unavailability of materials and equipment;
- •
- engineering and construction delays;
- •
- unanticipated transportation costs and delays;
- •
- unfavorable weather conditions;
- •
- hazards resulting from unusual or unexpected geological or environmental conditions;
- •
- environmental regulations and requirements;
- •
- accidental leakage of toxic or hazardous materials, such as petroleum liquids, drilling fluids or salt water, into the environment;
- •
- hazards resulting from the presence of hydrogen sulfide (H2S) or other contaminants in gas we produce;
- •
- changes in laws and regulations, including laws and regulations applicable to oil and natural gas activities or markets for the oil and natural gas produced;
37
- •
- fluctuations in supply and demand for oil and natural gas causing variations of the prices we receive for our oil and natural gas production;
and
- •
- the availability of alternative fuels and the price at which they become available.
As a result of these risks, expenditures, quantities and rates of production, revenues and operating costs may be materially affected and may differ materially from those anticipated by us.
Our ability to sell our production and/or receive market prices for our production may be adversely affected by transportation capacity constraints and interruptions.
If the amount of natural gas, condensate or oil being produced by us and others exceeds the capacity of the various transportation pipelines and gathering systems available in our operating areas, it will be necessary for new transportation pipelines and gathering systems to be built. Or, in the case of oil and condensate, it will be necessary for us to rely more heavily on trucks to transport our production, which is more expensive and less efficient than transportation via pipeline. The construction of new pipelines and gathering systems is capital intensive and construction may be postponed, interrupted or cancelled in response to changing economic conditions and the availability and cost of capital. In addition, capital constraints could limit our ability to build gathering systems to transport our production to transportation pipelines. In such event, costs to transport our production may increase materially or we might have to shut in our wells awaiting a pipeline connection or capacity and/or sell our production at much lower prices than market or than we currently project, which would adversely affect our results of operations.
A portion of our production may also be interrupted, or shut in, from time to time for numerous other reasons, including as a result of weather conditions (which may worsen due to climate changes), accidents, loss of pipeline or gathering system access, field labor issues or strikes, or we might voluntarily curtail production in response to market conditions. If a substantial amount of our production is interrupted at the same time, it could adversely affect our cash flow.
The unavailability or high cost of drilling rigs, pressure pumping equipment and crews, other equipment, supplies, water, personnel and oil field services could adversely affect our ability to execute our exploration and development plans on a timely basis and within our budget.
Our industry is cyclical and, from time to time, there is a shortage of drilling rigs, equipment, supplies, water or qualified personnel. During these periods, the costs and delivery times of rigs, equipment and supplies are substantially greater. In addition, the demand for, and wage rates of, qualified drilling rig crews rise as the number of active rigs in service increases. Increasing levels of exploration and production may increase the demand for oilfield services and equipment, and the costs of these services and equipment may increase, while the quality of these services and equipment may suffer. The unavailability or high cost of drilling rigs, pressure pumping equipment, supplies or qualified personnel can materially and adversely affect our operations and profitability. In order to secure drilling rigs and pressure pumping equipment, we may enter into certain contracts that extend over several months or years. If demand for drilling rigs and pressure pumping equipment subside during the period covered by these contracts, the price we are required to pay may be significantly more than the market rate for similar services.
38
We are subject to various contractual limitations that affect the discretion of our management in operating our business.
The indenture governing our debt and our Senior Credit Agreement contain various provisions that may limit our management's discretion in certain respects. In particular, these agreements limit our and our subsidiaries' ability to, among other things:
- •
- pay dividends on, redeem or repurchase shares of our common stock and, under certain circumstances, our convertible preferred stock, and redeem
or repurchase our subordinated debt;
- •
- make loans to others;
- •
- make investments;
- •
- incur additional indebtedness;
- •
- create certain liens;
- •
- sell assets;
- •
- enter into agreements that restrict dividends or other payments from our restricted subsidiaries to us;
- •
- consolidate, merge or transfer all or substantially all of our assets and those of our restricted subsidiaries taken as a whole;
- •
- engage in transactions with affiliates;
- •
- enter into hedging contracts;
- •
- create unrestricted subsidiaries; and
- •
- enter into sale and leaseback transactions.
Compliance with these and other limitations may limit our ability to operate and finance our business and engage in certain transactions in the manner we might otherwise. In addition, if we fail to comply with the limitations under our indenture or Senior Credit Agreement, our creditors, if the agreements so provide, may accelerate the related indebtedness as well as any other indebtedness to which a cross-acceleration or cross-default provision applies. In addition, lenders may be able to terminate any commitments they had made to make further funds available to us.
Our business is highly competitive.
The oil and natural gas industry is highly competitive in many respects, including identification of attractive oil and natural gas properties for acquisition, drilling and development, securing financing for such activities and obtaining the necessary equipment and personnel to conduct such operations and activities. In seeking suitable opportunities, we compete with a number of other companies, including large oil and natural gas companies and other independent operators with greater financial resources, larger numbers of personnel and facilities, and, in some cases, with more expertise. There can be no assurance that we will be able to compete effectively with these entities.
We are subject to complex federal, state, local and other laws and regulations that frequently are amended to impose more stringent requirements that could adversely affect the cost, manner or feasibility of doing business.
Companies that explore for and develop, produce, sell and transport oil and natural gas in the United States are subject to extensive federal, state and local laws and regulations, including complex tax and environmental, health and safety laws and the corresponding regulations, and are required to obtain various permits and approvals from federal, state and local agencies. If these permits are not
39
issued or unfavorable restrictions or conditions are imposed on our drilling activities, we may not be able to conduct our operations as planned. We may be required to make large expenditures to comply with governmental regulations. Matters subject to regulation include:
- •
- water discharge and disposal permits for drilling operations;
- •
- drilling bonds;
- •
- drilling permits;
- •
- reports concerning operations;
- •
- air quality, air emissions, noise levels and related permits;
- •
- spacing of wells;
- •
- rights-of-way and easements;
- •
- unitization and pooling of properties;
- •
- pipeline construction;
- •
- gathering, transportation and marketing of oil and natural gas;
- •
- taxation; and
- •
- waste transport and disposal permits and requirements.
Failure to comply with applicable laws may result in the suspension or termination of operations and subject us to liabilities, including administrative, civil and criminal penalties. Compliance costs can be significant. Moreover, the laws governing our operations or the enforcement thereof could change in ways that substantially increase the costs of doing business. Any such liabilities, penalties, suspensions, terminations or regulatory changes could materially and adversely affect our business, financial condition and results of operations.
Under environmental, health and safety laws and regulations, we also could be held liable for personal injuries, property damage (including site clean-up and restoration costs) and other damages including the assessment of natural resource damages. Such laws may impose strict as well as joint and several liability for environmental contamination, which could subject us to liability for the conduct of others or for our own actions that were in compliance with all applicable laws at the time such actions were taken. Environmental and other governmental laws and regulations also increase the costs to plan, design, drill, install, operate and abandon oil and natural gas wells. Moreover, public interest in environmental protection has increased in recent years, and environmental organizations have opposed, with some success, certain drilling projects. Part of the regulatory environment in which we operate includes, in some cases, federal requirements for performing or preparing environmental assessments, environmental impact studies and/or plans of development before commencing exploration and production activities. In addition, our activities are subject to regulation by oil and natural gas producing states relating to conservation practices and protection of correlative rights. Such regulations affect our operations and limit the quantity of oil and natural gas we may produce and sell. Delays in obtaining regulatory approvals or necessary permits, the failure to obtain a permit or the receipt of a permit with excessive conditions or costs could have a material adverse effect on our ability to explore on, develop or produce our properties. Additionally, the oil and natural gas regulatory environment could change in ways that might substantially increase the financial and managerial costs to comply with the requirements of these laws and regulations and, consequently, adversely affect our profitability. By way of example, in 2015 the EPA lowered the primary national ambient air quality standard for ozone from 75 parts per billion to 70 parts per billion. Implementation will take place over several years; however, the new standard eventually could result in more stringent emissions controls and additional permitting obligations for our operations.
40
Part of our strategy involves drilling in shale formations, using horizontal drilling and completion techniques. The results of our drilling program using these techniques may be subject to more uncertainties than conventional drilling programs, especially in areas that are new and emerging. These uncertainties could result in an inability to meet our expectations for reserves and production.
The results of our drilling in shale formations are more uncertain initially than drilling results in areas that are more developed and have a longer history of established production. Newer or emerging formations and areas have limited or no production history; consequently our predictions of drilling results in these areas are more uncertain. In addition, the use of horizontal drilling and completion techniques used in all of our shale formations involve certain risks and complexities that do not exist in conventional wells. The ultimate success of our drilling and completion strategies and techniques will be better evaluated over time as more wells are drilled and production profiles are better established.
If our drilling results are less than anticipated our investment in these areas may not be as attractive as we anticipate and could result in material write downs of unevaluated properties and future declines in the value of our undeveloped acreage.
Federal, state and local legislation and regulatory initiatives relating to hydraulic fracturing could result in increased costs and additional operating restrictions or delays.
We engage third parties to provide hydraulic fracturing or other well stimulation services to us in connection with many of the wells for which we are the operator. Federal, state and local governments have been adopting or considering restrictions on or prohibitions of fracturing in areas where we currently conduct operations, or in the future plan to conduct operations. Consequently, we could be subject to additional levels of regulation, operational delays or increased operating costs and could have additional regulatory burdens imposed upon us that could make it more difficult to perform hydraulic fracturing and increase our costs of compliance and doing business.
From time to time, for example, legislation has been proposed in Congress to amend the federal SDWA to require federal permitting of hydraulic fracturing and the disclosure of chemicals used in the hydraulic fracturing process. Further, the EPA issued a study in 2016 finding that hydraulic fracturing could potentially harm drinking water resources under adverse circumstances such as injection directly into groundwater or into production wells lacking mechanical integrity. Other governmental reviews have also been conducted that focus on environmental aspects of hydraulic fracturing. Such activities eventually could result in additional regulatory scrutiny that could make it more difficult to perform hydraulic fracturing and increase our costs of compliance and doing business.
Certain states, including Texas where we conduct our operations, likewise are considering or have adopted more stringent requirements for various aspects of hydraulic fracturing operations, such as permitting, disclosure, air emissions, well construction, seismic monitoring, waste disposal and water use. In addition to state laws, local land use restrictions, such as city ordinances, may restrict or prohibit drilling in general or hydraulic fracturing in particular. Such efforts have extended to bans on hydraulic fracturing.
The proliferation of regulations may limit our ability to operate. If the use of hydraulic fracturing is limited, prohibited or subjected to further regulation, these requirements could delay or effectively prevent the extraction of oil and natural gas from formations which would not be economically viable without the use of hydraulic fracturing. This could have a material adverse effect on our business, financial condition, results of operations and cash flows.
41
Regulation related to global warming and climate change could have an adverse effect on our operations and demand for oil and natural gas.
Studies over recent years have indicated that emissions of certain gases may be contributing to warming of the Earth's atmosphere. In response, governments increasingly have been adopting domestic and international climate change regulations that require reporting and reductions of the emission of such greenhouse gases. Methane, a primary component of natural gas, and carbon dioxide, a byproduct of burning oil, natural gas and refined petroleum products, are considered greenhouse gases. Internationally, the United Nations Framework Convention on Climate Change, the Kyoto Protocol and the Paris Agreement address greenhouse gas emissions, and international negotiations over climate change and greenhouse gases are continuing. Meanwhile, several countries, including those comprising the European Union, have established greenhouse gas regulatory systems.
In the United States, many states, either individually or through multi-state regional initiatives, have begun implementing legal measures to reduce emissions of greenhouse gases, primarily through emission inventories, emission targets, greenhouse gas cap and trade programs or incentives for renewable energy generation, while others have considered adopting such greenhouse gas programs.
At the federal level, the Obama Administration addressed climate change through a variety of administrative actions. The EPA thus issued greenhouse gas monitoring and reporting regulations that cover oil and natural gas facilities, among other industries. Beyond measuring and reporting, the EPA issued an "Endangerment Finding" under section 202(a) of the Clean Air Act, concluding certain greenhouse gas pollution threatens the public health and welfare of current and future generations. The finding served as the first step to issuing regulations that require permits for and reductions in greenhouse gas emissions for certain facilities. In March 2014, moreover, then President Obama released a Strategy to Reduce Methane Emissions that included consideration of both voluntary programs and targeted regulations for the oil and gas sector. Consistent with that strategy, the EPA issued final rules in 2016 for new and modified oil and gas production sources (including hydraulically fractured oil wells, natural gas well sites, natural gas processing plants, natural gas gathering and boosting stations and natural gas transmission sources) to reduce emissions of methane as well as volatile organic compound and toxic pollutants. In addition, the BLM has promulgated standards for reducing venting and flaring on public lands. The Trump Administration has been trying to roll back many of the Obama-era policies and rules, but those efforts have resulted in court challenges. At this point, the long-term direction of federal climate regulation is uncertain.
In the courts, several decisions have been issued that may increase the risk of claims being filed by governments and private parties against companies that have significant greenhouse gas emissions. Such cases may seek to challenge air emissions permits that greenhouse gas emitters apply for and seek to force emitters to reduce their emissions or seek damages for alleged climate change impacts to the environment, people, and property.
The direction of future U.S. climate change regulation is difficult to predict given the current uncertainties surrounding the policies of the Trump Administration. The EPA may or may not continue developing regulations to reduce greenhouse gas emissions from the oil and gas industry. Even if federal efforts in this area slow, states may continue pursuing climate regulations. Any laws or regulations that may be adopted to restrict or reduce emissions of greenhouse gases could require us to incur additional operating costs, such as costs to purchase and operate emissions controls, to obtain emission allowances or to pay emission taxes, and reduce demand for our products.
42
Our operations substantially depend on the availability of water. Restrictions on our ability to obtain, dispose of or recycle water may impact our ability to execute our drilling and development plans in a timely or cost-effective manner.
Water is an essential component of our drilling and hydraulic fracturing processes. If we are unable to obtain water to use in our operations from local sources, we may be unable to economically produce oil, natural gas liquids and natural gas, which could have an adverse effect on our business, financial condition and results of operations. Wastewaters from our operations typically are disposed of via underground injection. Some studies have linked earthquakes in certain areas to underground injection, which is leading to greater public scrutiny of disposal wells. Any new environmental initiatives or regulations that restrict injection of fluids, including, but not limited to, produced water, drilling fluids and other wastes associated with the exploration, development or production of oil and gas, or that limit the withdrawal, storage or use of surface water or ground water necessary for hydraulic fracturing of our wells, could increase our operating costs and cause delays, interruptions or cessation of our operations, the extent of which cannot be predicted, and all of which would have an adverse effect on our business, financial condition, results of operations and cash flows.
The ongoing implementation of federal legislation enacted in 2010 could have an adverse impact on our ability to use derivative instruments to reduce the effects of commodity prices, interest rates and other risks associated with our business.
We have entered into a number of commodity derivative contracts in order to hedge a portion of our oil and natural gas production. On July 21, 2010, then President Obama signed into law the Dodd-Frank Wall Street Reform and Consumer Protection Act, or the Dodd-Frank Act, which requires the SEC and the Commodity Futures Trading Commission (or CFTC), along with other federal agencies, to promulgate regulations implementing the new legislation.
The CFTC has finalized other regulations implementing the Dodd-Frank Act's provisions regarding trade reporting, margin, clearing, and trade execution; however, some regulations remain to be finalized and it is not possible at this time to predict when the CFTC will adopt final rules. For example, the CFTC has re-proposed regulations setting position limits for certain futures and option contracts in the major energy markets and for swaps that are their economic equivalents. Certain bona fide hedging transactions are expected to be made exempt from these limits. Also, it is possible that under recently adopted margin rules, some registered swap dealers may require us to post initial and variation margins in connection with certain swaps not subject to central clearing.
The Dodd-Frank Act and any additional implementing regulations could significantly increase the cost of some commodity derivative contracts (including through requirements to post collateral, which could adversely affect our available liquidity), materially alter the terms of some commodity derivative contracts, limit our ability to trade some derivatives to hedge risks, reduce the availability of some derivatives to protect against risks we encounter, and reduce our ability to monetize or restructure our existing commodity derivative contracts. If we reduce our use of derivatives as a consequence, our results of operations may become more volatile and our cash flows may be less predictable, which could adversely affect our ability to plan for and fund capital expenditures. Increased volatility may make us less attractive to certain types of investors. Finally, the Dodd-Frank Act was intended, in part, to reduce the volatility of oil and natural gas prices, which some legislators attributed to speculative trading in derivatives and commodity instruments related to oil and natural gas. If the implementing regulations result in lower commodity prices, our revenues could be adversely affected. Any of these consequences could adversely affect our business, financial condition and results of operations.
43
We cannot be certain that the insurance coverage maintained by us will be adequate to cover all losses that may be sustained in connection with all oil and natural gas activities.
We maintain general and excess liability policies, which we consider to be reasonable and consistent with industry standards. These policies generally cover:
- •
- personal injury;
- •
- bodily injury;
- •
- third party property damage;
- •
- medical expenses;
- •
- legal defense costs;
- •
- pollution in some cases;
- •
- well blowouts in some cases; and
- •
- workers compensation.
As is common in the oil and natural gas industry, we will not insure fully against all risks associated with our business either because such insurance is not available or because we believe the premium costs are prohibitive. A loss not fully covered by insurance could have a material effect on our financial position, results of operations and cash flows. There can be no assurance that the insurance coverage that we maintain will be sufficient to cover claims made against us in the future.
Title to the properties in which we have an interest may be impaired by title defects.
We generally obtain title opinions on significant properties that we drill or acquire. However, there is no assurance that we will not suffer a monetary loss from title defects or title failure. Additionally, undeveloped acreage has greater risk of title defects than developed acreage. Generally, under the terms of the operating agreements affecting our properties, any monetary loss is to be borne by all parties to any such agreement in proportion to their interests in such property. If there are any title defects or defects in assignment of leasehold rights in properties in which we hold an interest, we will suffer a financial loss.
Our financial results following the sale of our Williston Basin and El Halcón assets will not be comparable to our historical financial results and historical trends may not be indicative of our future results.
We divested substantially all of our proved reserves and production when we sold our Williston Basin and El Halcón assets in 2017. The dispositions of these assets, combined with our other recent acquisition and divestiture activities, have substantially transformed us into a pure-play, single-basin company focused on developing largely unproven acreage concentrated in the Delaware Basin in West Texas. Our historical financial information in this report includes the operations of our Williston Basin and El Halcón assets and does not reflect the operations of our Delaware Basin assets in all periods. As a result, our historical financial results will not be comparable to our future results and historical trends may not be indicative of results to be expected in future periods.
Our pending acquisition of the West Quito Draw Properties may not close as anticipated or may close with adjusted terms, and we may not realize the expected benefits of the acquisition.
Our pending acquisition of the West Quito Draw Properties, as described under "Business—Recent Developments—Pending acquisition of the West Quito Draw Properties," is expected to close in early April 2018, subject to customary closing conditions. If these conditions are not satisfied or waived,
44
we will not complete the acquisition. We cannot assure you that the acquisition of the West Quito Draw Properties will close on our expected timeframe, or at all, or close without material adjustments.
Even if we complete the acquisition of the West Quito Draw Properties, we may not realize the expected benefits. Acquisitions are subject to various risks and uncertainties, discussed in detail elsewhere herein, and the purchase agreement for the West Quito Draw Properties limits our recourse against the seller for various losses and liabilities arising or discovered after closing. See "Business—Recent Developments—Pending acquisition of the West Quito Draw Properties," for more information.
Hedging transactions may limit our potential gains and increase our potential losses.
In order to manage our exposure to price risks in the marketing of our oil, natural gas, and natural gas liquids production, we have entered into oil, natural gas, and natural gas liquids price hedging arrangements with respect to a portion of our anticipated production and we may enter into additional hedging transactions in the future. While intended to reduce the effects of volatile commodity prices, such transactions may limit our potential gains and increase our potential losses if commodity prices were to rise substantially over the price established by the hedge. In addition, such transactions may expose us to the risk of loss in certain circumstances, including instances in which:
- •
- our production is less than expected;
- •
- there is a widening of price differentials between delivery points for our production; or
- •
- the counterparties to our hedging agreements fail to perform under the contracts.
Our ability to use net operating loss carryforwards and realized built in losses to offset future taxable income for U.S. federal income tax purposes is subject to limitation.
In general, under Section 382 of the Internal Revenue Code of 1986, as amended, a corporation that undergoes an "ownership change" is subject to limitations on its ability to utilize its pre-change net operating losses (NOLs), and realized built in losses (RBILS), to offset future taxable income. In general, an ownership change occurs if the aggregate stock ownership of certain stockholders (generally 5% stockholders, applying certain look-through rules) increases by more than 50 percentage points over such stockholders' lowest percentage ownership during the testing period (generally three years).
We experienced an ownership change in September 2016 as a result of the consummation of our plan of reorganization under chapter 11 of the U.S. Bankruptcy Code and we may experience additional ownership changes in the future. Limitations imposed on our ability to use NOLs and RBILS to offset future taxable income may cause U.S. federal income taxes to be paid earlier than otherwise would be paid if such limitations were not in effect and could cause such NOLs and RBILS to expire unused, in each case reducing or eliminating the benefit of such NOLs and RBILS. Similar rules and limitations may apply for state income tax purposes.
U.S. federal income tax reform could adversely affect us.
On December 22, 2017, the president signed into law the Tax Cuts and Jobs Act (the 2017 Tax Act) which enacts a broad range of changes to the U.S. Internal Revenue Code. The 2017 Tax Act, among other things, includes changes to U.S. federal tax rates, imposes significant additional limitations on the deductibility of interest and net operating losses, allows for the expensing of certain capital expenditures, and limits the deductibility of certain types of executive compensation. We will continue to assess the impact of the new tax legislation on our net deferred tax assets and liabilities and will continue to examine the impact this tax legislation may have on our business.
45
We depend on computer and telecommunications systems and failures in our systems or cyber security attacks could significantly disrupt our business operations.
We have entered into agreements with third parties for hardware, software, telecommunications and other information technology services in connection with our business. In addition, we have developed proprietary software systems, management techniques and other information technologies incorporating software licensed from third parties. It is possible we could incur interruptions from cyber security attacks, computer viruses or malware. We believe that we have positive relations with our related vendors and maintain adequate anti-virus and malware software and controls; however, any interruptions to our arrangements with third parties to our computing and communications infrastructure or our information systems could significantly disrupt our business operations.
Our actual financial results may vary materially from the projections that we filed with the bankruptcy court in connection with the confirmation of our plan of reorganization.
In connection with the disclosure statement we filed with the bankruptcy court, and the hearing to consider confirmation of our plan of reorganization, we prepared projected financial information to demonstrate to the bankruptcy court the feasibility of the plan of reorganization and our ability to continue operations upon our emergence from bankruptcy. Those projections were prepared solely for the purpose of the bankruptcy proceedings and have not been, and will not be, updated on an ongoing basis and should not be relied upon by investors. At the time they were prepared, the projections reflected numerous assumptions concerning our anticipated future performance and with respect to prevailing and anticipated market and economic conditions that were and remain beyond our control and that may not materialize. Projections are inherently subject to substantial and numerous uncertainties and to a wide variety of significant business, economic and competitive risks and the assumptions underlying the projections and/or valuation estimates may prove to be wrong in material respects. Actual results will likely vary significantly from those contemplated by the projections. As a result, investors should not rely on these projections.
Our historical financial information may not be indicative of our future financial performance.
Effective upon our emergence from chapter 11 bankruptcy on September 9, 2016, we adopted fresh-start accounting, as a consequence of which our assets and liabilities were adjusted to fair values and we had no beginning or ending retained earnings or deficit balances on that date. Accordingly, our financial condition and results of operations following our emergence from chapter 11 bankruptcy will not be comparable to the financial condition and results of operations reflected in our historical financial statements. Further, as a result of the implementation of our plan of reorganization and the transactions contemplated thereby, our historical financial information may not be indicative of our future financial performance.
ITEM 1B. UNRESOLVED STAFF COMMENTS
None.
A description of our properties is included in Item 1. Business and is incorporated herein by reference.
We believe that we have satisfactory title to the properties owned and used in our business, subject to liens for taxes not yet payable, liens incident to minor encumbrances, liens for credit arrangements and easements and restrictions that do not materially detract from the value of these properties, our interests in these properties, or the use of these properties in our business. We believe that our properties are adequate and suitable for us to conduct business in the future.
46
A description of our legal proceedings is included in Item 8. Consolidated Financial Statements and Supplementary Data—Note 11, "Commitments and Contingencies," and is incorporated herein by reference.
From time to time, we are a party to litigation or other legal proceedings that we consider to be a part of the ordinary course of our business. We are not currently involved in any legal proceedings, nor are we a party to any pending or threatened claims, that could reasonably be expected to have a material adverse effect on our financial condition or results of operations.
ITEM 4. MINE SAFETY DISCLOSURES
Not applicable.
47
ITEM 5. MARKET FOR REGISTRANT'S COMMON EQUITY, RELATED STOCKHOLDER MATTERS AND ISSUER PURCHASES OF EQUITY SECURITIES
Our common stock trades on the New York Stock Exchange (NYSE) under the symbol HK. On September 9, 2016, upon emergence from chapter 11 bankruptcy, all outstanding shares of our Predecessor common stock were cancelled and we issued approximately 90.0 million shares of new common stock which began trading on the NYSE on September 12, 2016. The following table sets forth the quarterly high and low sales prices per share of our Successor common stock as reported on the NYSE from September 12, 2016 through December 31, 2017. Refer to Item 8. Consolidated Financial Statements and Supplementary Data—Note 2, "Reorganization," for further details.
| |
High | Low | |||||
|---|---|---|---|---|---|---|---|
2017 |
|||||||
First Quarter |
$ | 10.30 | $ | 6.42 | |||
Second Quarter |
8.38 | 3.69 | |||||
Third Quarter |
7.39 | 4.06 | |||||
Fourth Quarter |
7.87 | 5.78 | |||||
2016 |
|||||||
Period from September 12, 2016 through September 30, 2016 |
$ | 12.01 | $ | 7.58 | |||
Fourth Quarter |
11.29 | 8.01 | |||||
We intend to retain earnings for use in the operation and expansion of our business and therefore do not anticipate declaring cash dividends on our common stock in the foreseeable future. Any future determination to pay dividends on common stock will be at the discretion of the board of directors and will be dependent upon then existing conditions, including our prospects, and such other factors, as the board of directors deems relevant. We are also restricted from paying cash dividends on common stock under our Senior Credit Agreement and under the terms of the indenture governing our other long-term debt.
Approximately 548 registered stockholders of record as of February 23, 2018 held our common stock. In many instances, a stockholder can hold shares through a broker or other entity holding shares in street name for one or more customers who beneficially own the shares.
Changes in Securities, Use of Proceeds and Issuer Purchases of Equity Securities
The following table sets forth certain information with respect to the surrender of our common stock by employees in exchange for the payment of certain tax withholding obligations during the three months ended December 31, 2017.
| |
Total Number of Shares Purchased(1) |
Average Price Paid Per Share |
Total Number of Shares Purchased as Part of Publicly Announced Plans or Programs |
Maximum Number (or Approximate Dollar Value) of Shares that May Yet Be Purchased Under the Plans or Programs |
|||||||||
|---|---|---|---|---|---|---|---|---|---|---|---|---|---|
October 2017 |
— | $ | — | — | — | ||||||||
November 2017 |
— | — | — | — | |||||||||
December 2017 |
20,565 | 7.32 | — | — | |||||||||
- (1)
- All of the shares were surrendered by employees in exchange for the payment of tax withholding upon the vesting of restricted stock awards. The acquisition of the surrendered shares was not part of a publicly announced program to repurchase shares of our common stock.
48
Stock Performance Graph
The following graph and table compare the cumulative total return to our stockholders on our common stock beginning with the commencement of trading upon our emergence from chapter 11 bankruptcy on September 12, 2016 through December 31, 2017, relative to the cumulative total returns of the NYSE Composite Index and the S&P Oil & Gas Exploration & Production Index for the same period. The comparison assumes an investment of $100 (with reinvestment of all dividends at the average of the closing stock prices at the beginning and end of the quarter) was made in our Successor common stock on September 12, 2016, and in each of the indexes, and relative performance is tracked through December 31, 2017. The identity of the companies included in the S&P Oil & Gas Exploration & Production Index will be provided upon request.
COMPARISON OF 16 MONTH CUMULATIVE TOTAL RETURN*
Among Halcón Resources Corporation, the NYSE Composite Index,
and S&P Oil & Gas Exploration & Production
index
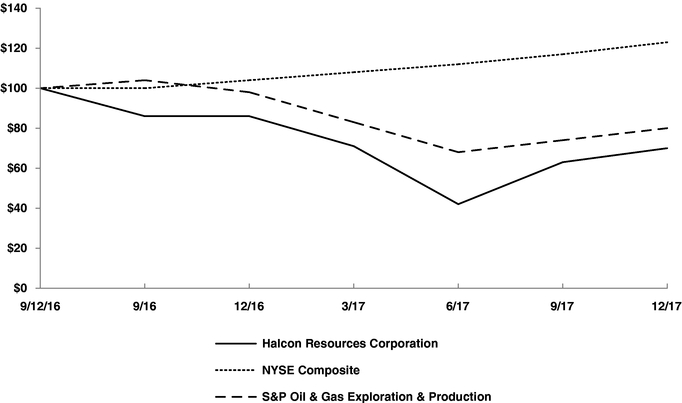
- *
- $100 invested on 9/12/16 in stock or 8/31/16 in index, including reinvestment of dividends. Fiscal year end is December 31.
Value of Initial $100 Investment
| |
September 12, 2016 |
September 30, 2016 |
December 31, 2016 |
March 31, 2017 |
June 30, 2017 |
September 30, 2017 |
December 31, 2017 |
|||||||||||||||
|---|---|---|---|---|---|---|---|---|---|---|---|---|---|---|---|---|---|---|---|---|---|---|
Halcón Resources Corporation |
$ | 100 | $ | 86 | $ | 86 | $ | 71 | $ | 42 | $ | 63 | $ | 70 | ||||||||
NYSE Composite |
100 | 100 | 104 | 108 | 112 | 117 | 123 | |||||||||||||||
S&P Oil & Gas Exploration & Production Index |
100 | 104 | 98 | 83 | 68 | 74 | 80 | |||||||||||||||
49
ITEM 6. SELECTED FINANCIAL DATA
Prior year financial statements are not comparable to our current year financial statements due to the adoption of fresh-start accounting. References to "Successor" or "Successor Company" relate to the financial position and results of operations of the reorganized Company subsequent to September 9, 2016. References to "Predecessor" or "Predecessor Company" relate to the financial position and results of operations of the Company prior to, and including, September 9, 2016.
The following table presents selected historical financial data derived from our consolidated financial statements. The following data is only a summary and should be read with our historical consolidated financial statements and related notes contained in this document. Refer to the footnotes in Item 8. Consolidated Financial Statements and Supplementary Data, for details regarding our recent reorganization and adoption of fresh-start accounting, as well as other transactions that could impact the comparability of the following data (in thousands, except per share data):
| |
Successor | |
Predecessor | ||||||||||||||||||
|---|---|---|---|---|---|---|---|---|---|---|---|---|---|---|---|---|---|---|---|---|---|
| |
|
Period from September 10, 2016 through December 31, 2016(7) |
|
Period from January 1, 2016 through September 9, 2016(8) |
|
|
|
||||||||||||||
| |
|
|
Years Ended December 31, | ||||||||||||||||||
| |
Year Ended December 31, 2017(6) |
|
|||||||||||||||||||
| |
|
2015(9) | 2014(10) | 2013(11) | |||||||||||||||||
| |
|
||||||||||||||||||||
Income Statement Data: |
|||||||||||||||||||||
Total operating revenues |
$ | 377,965 | $ | 153,362 | $ | 266,843 | $ | 550,278 | $ | 1,148,261 | $ | 999,506 | |||||||||
Income (loss) from operations |
715,423 | (415,799 | ) | (851,617 | ) | (2,744,506 | ) | (58,387 | ) | (1,290,947 | ) | ||||||||||
Net income (loss) |
535,686 | (479,193 | ) | 11,958 | (1,922,621 | ) | 315,956 | (1,222,622 | ) | ||||||||||||
Net income (loss) available to common stockholders |
487,679 | (479,984 | ) | (32,794 | ) | (2,006,958 | ) | 282,942 | (1,233,407 | ) | |||||||||||
Net income (loss) per share of common stock(1): |
|||||||||||||||||||||
Basic |
$ | 3.67 | $ | (5.26 | ) | $ | (0.27 | ) | $ | (18.66 | ) | $ | 3.40 | $ | (16.25 | ) | |||||
Diluted |
$ | 3.65 | $ | (5.26 | ) | $ | (0.27 | ) | $ | (18.66 | ) | $ | 2.93 | $ | (16.25 | ) | |||||
| |
Successor |
|
Predecessor | |||||||||||||||
|---|---|---|---|---|---|---|---|---|---|---|---|---|---|---|---|---|---|---|
| |
As of December 31, |
|
As of December 31, | |||||||||||||||
| |
|
|||||||||||||||||
| |
2017 | 2016 |
|
2015 | 2014 | 2013 | ||||||||||||
| |
|
|||||||||||||||||
Balance sheet data: |
||||||||||||||||||
Working capital (deficit) |
$ | 321,457 | $ | (46,904 | ) | $ | 261,345 | $ | (41,977 | ) | $ | (325,756 | ) | |||||
Total assets |
1,643,620 | 1,319,670 | 3,458,692 | 6,383,227 | 5,298,986 | |||||||||||||
Total long-term debt, net(2)(3) |
409,168 | 964,653 | 2,873,637 | 3,695,488 | 3,126,318 | |||||||||||||
Redeemable noncontrolling interest(4) |
— | — | 183,986 | 117,166 | — | |||||||||||||
Stockholders' equity(5) |
1,071,998 | 112,688 | 52,414 | 1,772,169 | 1,447,610 | |||||||||||||
- (1)
- No cash dividends on our common stock were declared or paid for any periods presented.
- (2)
- Excludes current portion of long-term debt for all periods presented.
- (3)
- On September 9, 2016, upon emergence from chapter 11 bankruptcy, approximately $2.0 billion of our senior
notes were cancelled. Refer to Item 8. Consolidated Financial Statements and Supplementary Data—Note 2, "Reorganization," for additional information.
- (4)
- On June 16, 2014, HK TMS, LLC (HK TMS), which was then a wholly owned subsidiary of ours, entered into a transaction with funds and accounts managed by Apollo Global Management, LLC (Apollo), by initially selling 150,000 preferred shares in HK TMS (Membership Interests). On September 30, 2016, Apollo acquired one hundred percent of the common shares of HK TMS and assumed all obligations relating to the Membership Interests. For additional information regarding these
50
transactions, see Item 8. Consolidated Financial Statements and Supplementary Data—Note 5, "Acquisitions and Divestitures," and Note 12, "Mezzanine Equity."
- (5)
- On September 9, 2016, upon emergence from chapter 11 bankruptcy, all existing shares of Predecessor common stock
were cancelled and the Successor Company issued approximately 90.0 million shares of new common stock in total to the Predecessor Company's existing common stockholders, Third Lien Noteholders,
Unsecured Noteholders, and the Convertible Noteholder. Refer to Item 8. Consolidated Financial Statements and Supplementary Data—Note 2, "Reorganization," for further
details.
- (6)
- For the year ended December 31, 2017, we incurred a $721.6 million gain on the sale of our oil and natural gas
properties and a $114.9 million loss on the extinguishment of debt. Refer to the footnotes included in Item 8. Consolidated Financial Statements and Supplementary Data, for additional
information regarding these events.
- (7)
- For the period from September 10, 2016 through December 31, 2016, we incurred a $420.9 million full cost
ceiling impairment on the carrying value of our oil and natural gas properties. Refer to Item 8. Consolidated Financial Statements and Supplementary Data—Note 6, "Oil and
Natural Gas Properties," for additional information.
- (8)
- For the period from January 1, 2016 through September 9, 2016, we incurred a $754.8 million full cost
ceiling impairment on the carrying value of our oil and natural gas properties, a $28.1 million impairment on other operating property and equipment, an $81.4 million gain on
extinguishment of debt, and a $913.7 million gain on reorganization items due to fresh-start accounting. Refer to the footnotes in Item 8. Consolidated Financial Statements and
Supplementary Data, for additional information regarding these events.
- (9)
- For the year ended December 31, 2015, we incurred a $2.6 billion full cost ceiling impairment on the carrying
value of our oil and natural gas properties and a $761.8 million gain on the extinguishment of debt. Refer to the footnotes in Item 8. Consolidated Financial Statements and Supplementary
Data, for additional information regarding these events.
- (10)
- For the year ended December 31, 2014, we incurred the following charges, a $239.7 million full cost ceiling
impairment on the carrying value of oil and natural gas properties and a $35.6 million impairment on other operating property and equipment.
- (11)
- For the year ended December 31, 2013, we incurred the following charges which contributed to our net loss for the year, a $1.1 billion full cost ceiling impairment on the carrying value of our oil and natural gas properties, a $228.9 million goodwill impairment, and a $67.5 million impairment of other operating property and equipment.
51
ITEM 7. MANAGEMENT'S DISCUSSION AND ANALYSIS OF FINANCIAL CONDITION AND RESULTS OF OPERATIONS
The following discussion is intended to assist in understanding our results of operations and our current financial condition. Our consolidated financial statements and the accompanying notes included elsewhere in this Annual Report on Form 10-K contain additional information that should be referred to when reviewing this material.
Prior year financial statements are not comparable to our current year financial statements due to the adoption of fresh-start accounting. References to "Successor" or "Successor Company" relate to the financial position and results of operations of the reorganized Company subsequent to September 9, 2016. References to "Predecessor" or "Predecessor Company" relate to the financial position and results of operations of the Company prior to, and including, September 9, 2016.
Statements in this discussion may be forward-looking. These forward-looking statements involve risks and uncertainties, including those discussed below, which could cause actual results to differ from those expressed.
Overview
We are an independent energy company focused on the acquisition, production, exploration and development of onshore liquids-rich oil and natural gas assets in the United States. As discussed below in more detail under "Recent Developments," we have recently acquired certain properties in the Delaware Basin and divested our assets located in the Williston Basin in North Dakota and in the El Halcón area of East Texas. As a result, our properties and drilling activities are currently focused in the Delaware Basin, where we have an extensive drilling inventory that we believe offers more attractive economics. The Williston Divestiture discussed under "Recent Developments," improved our liquidity and significantly reduced our debt, better enabling us to accelerate development of our Delaware Basin properties and execute our growth plans in the basin.
At December 31, 2017, our estimated total proved oil and natural gas reserves, as prepared by our independent reserve engineering firm, Netherland, Sewell & Associates, Inc. (Netherland, Sewell), using Securities and Exchange Commission (SEC) prices for crude oil and natural gas, which are based on the West Texas Intermediate crude oil spot price of $51.34 per Bbl and Henry Hub natural gas spot price of $2.976 per MMBtu, were approximately 51.1 MMBoe, consisting of 34.1 MMBbls of oil, 9.2 MMBbls of natural gas liquids, and 46.7 Bcf of natural gas. Approximately 31% of our proved reserves were classified as proved developed as of December 31, 2017. We maintain operational control of approximately 99% of our proved reserves. Substantially all of our proved reserves and production at December 31, 2017 are associated with our Delaware Basin properties.
Our total operating revenues for 2017 were approximately $378.0 million. Our total operating revenues for the period of September 10, 2016 through December 31, 2016 and the period of January 1, 2016 through September 9, 2016 were approximately $153.4 million and $266.8 million, respectively, or $420.2 million combined. Full year 2017 production averaged 27,397 Boe/d. During the period of September 10, 2016 through December 31, 2016 and the period of January 1, 2016 through September 9, 2016, production averaged 37,637 Boe/d and 36,787 Boe/d, respectively, or 37,049 Boe/d combined. The decrease in total operating revenues and average daily production year over year was driven by our divestitures in 2017. In 2017, we participated in the drilling of 124 gross (33.7 net) wells, none of which were dry holes.
Our financial results depend upon many factors, but are largely driven by the volume of our oil and natural gas production and the price that we receive for that production. Our production volumes will decline as reserves are produced unless we expend capital in successful development and exploration activities or acquire properties with existing production. The amount we realize for our
52
production depends predominantly upon commodity prices and our related commodity price hedging activities, which are affected by changes in market demand and supply, as impacted by overall economic activity, weather, pipeline capacity constraints, inventory storage levels, basis differentials and other factors. Accordingly, finding and developing oil and natural gas reserves at economical costs is critical to our long-term success.
In 2017, we incurred capital expenditures for drilling and completions of approximately $309.6 million. We expect to spend approximately $280 million to $320 million on drilling and completion capital expenditures during 2018. In addition, we expect to spend approximately $30 million to $40 million on infrastructure, seismic and other in 2018. Our 2018 drilling and completion budget currently contemplates running an average of three operated rigs in the Delaware Basin during the year, and is subject to change. After the pending acquisition of the West Quito Draw Properties closes, discussed below under "Recent Developments," our 2018 capital budget will be revised.
We expect to fund our budgeted 2018 capital expenditures with cash on hand, cash flows from operations, proceeds from debt and equity issuances and borrowings under our Senior Credit Agreement. We strive to maintain financial flexibility and may access capital markets as necessary to maintain adequate borrowing capacity under our Senior Credit Agreement, facilitate drilling on our large undeveloped acreage position and permit us to selectively expand our acreage position and infrastructure projects. In the event our cash flows are materially less than anticipated and other sources of capital we historically have utilized are not available on acceptable terms, we may reduce our capital spending, however significant or prolonged reductions in capital spending will adversely impact our production and may negatively affect our future cash flows.
Oil and natural gas prices are inherently volatile and declined dramatically during the latter half of 2014. In response to this, in 2015 and 2016 we significantly curtailed our capital spending, reduced operating costs, concluded discounted debt exchanges, and incurred substantial asset impairments, primarily as a result of the full cost ceiling test calculation. Despite these efforts, low commodity prices persisted and we decided to reorganize under chapter 11 on September 9, 2016, as discussed in greater detail below.
We utilize the full cost method of accounting for our oil and natural gas exploration and development activities. Under full cost accounting, we are required by SEC regulations to perform a ceiling test each quarter. The ceiling test calculation dictates that we use the unweighted arithmetic average price of crude oil and natural gas as of the first day of each month for the 12-month period ending at the balance sheet date. Using the crude oil price for February 2018 of $65.80 per Bbl, and holding it constant for one month to create a trailing 12-month period of average prices that is more reflective of recent price trends, our ceiling test limitation would not have generated an impairment at December 31, 2017 holding all other inputs and factors constant. Sustained lower commodity prices would have a material impact upon our full cost ceiling test calculation. In addition to commodity prices, our production rates, levels of proved reserves, future development costs, transfers of unevaluated properties to our full cost pool, capital spending and other factors will determine our actual ceiling test calculation and impairment analyses in future periods.
Recent Developments
Pending Acquisition of West Quito Draw Properties
On February 6, 2018, one of our wholly owned subsidiaries entered into a Purchase and Sale Agreement (the Shell PSA) with SWEPI LP (Shell), an affiliate of Shell Oil Company, pursuant to which we agreed to purchase an aggregate 10,524 net acres and related assets in the Southern Delaware Basin located in Ward County, Texas (the West Quito Draw Properties) for a total purchase price of $200.0 million. The effective date of the proposed acquisition is February 1, 2018, and we expect the closing to occur early April 2018.
53
The purchase price is subject to adjustments for (i) operating expenses, capital expenditures and revenues between the effective date and the closing date, (ii) title and environmental defects, and (iii) other purchase price adjustments customary in oil and gas purchase and sale agreements. Pursuant to the terms of the Shell PSA, we paid a deposit into escrow totaling $20.0 million, which amount will be applied to the purchase price if the transaction closes. The completion of the acquisition of the West Quito Draw Properties is subject to customary closing conditions. Either party may terminate the Shell PSA if certain closing conditions have not been satisfied, or if the transaction has not closed on or before April 20, 2018. If one or more of the closing conditions are not satisfied, or if the transaction is otherwise terminated, the acquisition may not be completed. Our escrow deposit with Shell is refundable only in specified circumstances if the transaction is not consummated.
Each party makes customary representations and warranties in the Shell PSA for transactions of this type. The Shell PSA also includes customary covenants relating to the operation of the West Quito Draw Properties prior to the closing date and other matters. The parties have agreed to indemnify one another for breaches of their respective representations and warranties, as well as the operation of the West Quito Draw Properties prior to (in the case of the Shell) and after (in the case of us) the closing date. Indemnities for breaches of representations and warranties, and any purchase price adjustments attributable to title or environmental defects, are subject to certain threshold limitations. Specifically, indemnification claims are subject to an individual claim threshold of $50,000, and Shell is required to indemnify us for claims totaling in excess of 2% of the purchase price, or $4.0 million. Our right to indemnification in certain circumstances is subject to a cap equal to 15% of the purchase price, or $30.0 million. The total amount of uncured title defect claims or unremedied environmental claims must be more than 1.5% of the purchase price, or $3.0 million, respectively, before we will be entitled to a downward adjustment to the purchase price consideration for either type of claim.
We intend to fund the cash consideration for the acquisition of the West Quito Draw Properties with the net proceeds from our recent issuance of Additional 2025 Notes and common stock, discussed below. There can be no assurance that we will acquire the West Quito Draw Properties on the terms or timing described herein or at all, or close without material adjustments. Even if we consummate the acquisition of the West Quito Draw Properties, we may not be able to achieve the benefits we expect from it. If we do not consummate the acquisition of the West Quito Draw Properties, we intend to use the net proceeds from the issuance of the Additional 2025 Notes and common stock for general corporate purposes, including to fund our 2018 drilling program.
Issuance of Additional 2025 Notes
On February 15, 2018, we issued an additional $200.0 million aggregate principal amount of our 6.75% senior notes due 2025 at a price to the initial purchasers of 103.0% of par (the Additional 2025 Notes). The net proceeds from the sale of the Additional 2025 Notes were approximately $203.0 million after deducting initial purchasers' premiums, commissions and estimated offering expenses and will be used to fund the cash consideration for the acquisition of the West Quito Draw Properties, if consummated, and for general corporate purposes, including to fund our 2018 drilling program. These notes were issued under the Indenture, dated as of February 16, 2017, among us, certain of our subsidiaries and U.S. Bank National Association, as trustee, which governs our 6.75% senior notes due 2025 that were issued on February 16, 2017 (the 2025 Notes). The Additional 2025 Notes are treated as a single class with, and have the same terms as, the 2025 Notes, except that the Additional 2025 Notes will initially be subject to transfer restrictions and have the benefit of certain registration rights and provisions for the payment of additional interest in the event of a breach with respect to such registration rights.
In connection with the Additional 2025 Notes issued, on February 15, 2018, we, our subsidiary guarantors and J.P. Morgan Securities, LLC, on behalf of itself and the initial purchasers, entered into a Registration Rights Agreement, pursuant to which we and our subsidiary guarantors agreed to,
54
among other things, use reasonable best efforts to file a registration statement under the Securities Act and complete an exchange offer for the Additional 2025 Notes within 180 days after closing. The Additional 2025 Notes were sold pursuant to the exemption from registration under the Securities Act and applicable state securities laws, including Rule 144A and Regulation S under the Securities Act.
Issuance of Common Stock
On February 9, 2018, we sold 9.2 million shares of common stock, par value $0.0001 per share, in a public offering at a price of $6.90 per share. The net proceeds to us from the offering were approximately $60.8 million, after deducting underwriters' discounts and estimated offering expenses.
Amended and Restated Senior Secured Revolving Credit Agreement
On September 7, 2017, we entered into the Senior Credit Agreement by and among us, as borrower, JPMorgan Chase Bank, N.A., as administrative agent, and certain other financial institutions party thereto, as lenders. The Senior Credit Agreement amends and restates in its entirety the original Senior Secured Revolving Credit Agreement entered into on September 9, 2016. Pursuant to the Senior Credit Agreement, the lenders party thereto have agreed to provide us with a $1.0 billion senior secured reserve-based revolving credit facility with a current borrowing base of $100.0 million. The maturity date of the Senior Credit Agreement is September 7, 2022. The borrowing base will be redetermined semi-annually, with the lenders and us each having the right to one interim unscheduled redetermination between any two consecutive semi-annual redeterminations. The next scheduled redetermination date is May 2018. The borrowing base takes into account the estimated value of our oil and natural gas properties, proved reserves, total indebtedness, and other relevant factors consistent with customary oil and natural gas lending criteria. Amounts outstanding under the Senior Credit Agreement bear interest at specified margins over the base rate of 1.25% to 2.25% for ABR-based loans or at specified margins over LIBOR of 2.25% to 3.25% for Eurodollar-based loans. These margins fluctuate based on our utilization of the facility.
On February 2, 2018, we entered into the Second Amendment (the Second Amendment) to the Senior Credit Agreement which among other things, for certain fiscal quarters in 2018, provided flexibility with respect to certain financial covenants as specified in the Senior Credit Agreement. The Second Amendment provides for (i) the use of annualized financial data in determining EBITDA (as defined in the Senior Credit Agreement) for the fiscal quarters ending June 30, 2018, September 30, 2018 and December 31, 2018, (ii) an increase in the ratio of our Consolidated Total Net Debt (as defined in the Senior Credit Agreement) to EBITDA of 4.50:1.00 for the fiscal quarter ending June 30, 2018, and a ratio of 4.00:1.00 for any fiscal quarter thereafter, (iii) a waiver of compliance with the covenant relating to the Total Net Indebtedness Leverage Ratio (as defined in the Senior Credit Agreement) for the fiscal quarter ending March 31, 2018, and (iv) a waiver of the automatic reduction to the borrowing base that would otherwise have resulted from our issuance of the Additional 2025 Notes. The Senior Credit Agreement also contains a financial covenant to maintain a Current Ratio (as defined in the Senior Credit Agreement) not to be less than 1.00:1.00.
Recent Acquisition of Additional Properties in Monument Draw (Ward and Winkler Counties, Texas)
On December 13, 2017, certain of our wholly owned subsidiaries acquired 4,093 net acres and related assets in the Delaware Basin in an area contiguous to the western and southern areas of our existing Monument Draw properties in Ward County, Texas (the Additional Monument Draw Properties) from a private company for a total purchase price of approximately $101.6 million. The effective date of the acquisition was September 1, 2017. We estimate that at the time of acquisition the Additional Monument Draw Properties include a 88% average working interest, with approximately 99% held by production.
55
Divestiture of Williston Basin Non-Operated Assets
On September 19, 2017, certain of our wholly owned subsidiaries entered into an agreement with a privately-owned company pursuant to which sold our non-operated properties and related assets located in the Williston Basin in North Dakota and Montana (the Non-Operated Williston Assets) for a total adjusted sales price of approximately $105.2 million, before certain post-closing adjustments as provided for in the sales agreement. The effective date of the transaction was April 1, 2017 and the transaction closed on November 9, 2017. Estimated proved reserves associated with the Non-Operated Williston Assets were approximately 7.4 MMBoe, or approximately 5% of our year-end 2016 proved reserves. The Non-Operated Williston Assets generated net production of approximately 2,500 Boe/d, or approximately 7% of our average daily production for the nine months ended September 30, 2017. Upon the closing of the sale of the Non-Operated Williston Assets, the borrowing base on our Senior Credit Agreement was reduced from $140.0 million to $100.0 million.
Divestiture of Williston Basin Operated Assets
On July 10, 2017, we and certain of our wholly owned subsidiaries entered into an agreement with Bruin Williston Holdings, LLC for the sale of all of our operated oil and natural gas leases, oil and natural gas wells and related assets located in the Williston Basin in North Dakota, as well as 100% of the membership interests in two of our subsidiaries (the Williston Assets) for a total cash sales price of approximately $1.4 billion, before certain closing adjustments as provided for in the sales agreement (the Williston Divestiture). The effective date of the Williston Divestiture was June 1, 2017, and we closed the transaction on September 7, 2017. Estimated proved reserves associated with the Williston Assets were approximately 104.9 MMBoe, or approximately 71% of our year-end 2016 proved reserves. The Williston Assets generated net production of approximately 26,180 Boe/d, or approximately 76% of our average daily production during the nine months ended September 30, 2017. We used the proceeds from the Williston Divestiture to repay borrowings outstanding under our Senior Credit Agreement, repurchase approximately $425.0 million aggregate principal amount (or one half) of our 6.75% senior notes due 2025 and redeem all of our outstanding 12% senior secured second lien notes, as well as for general corporate purposes.
We use the full cost method of accounting for our investment in oil and natural gas properties. Under this method of accounting, sales of oil and gas properties are accounted for as adjustments to capitalized costs with no gain or loss recognized, unless the adjustment significantly alters the relationship between capitalized costs and proved reserves. If the Williston Divestiture was accounted for as an adjustment of capitalized costs with no gain or loss recognized, the adjustment would have significantly altered the relationship between capitalized costs and proved reserves. Accordingly, we recognized a gain on the sale in connection with this transaction of $485.9 million during the year ended December 31, 2017. The carrying value of the properties sold was determined by allocating total capitalized costs within the full cost pool between properties sold and properties retained based on their relative fair values. The gain was recorded in "Gain (loss) on the sale of oil and natural gas properties," on the consolidated statements of operations.
Repurchase of 2025 Notes
On September 7, 2017, we commenced an offer to purchase for cash up to $425.0 million of the $850.0 million outstanding aggregate principal amount of our 2025 Notes at 103.0% of principal plus accrued and unpaid interest, up to, but not including, the date of purchase. Pursuant to the indenture governing the 2025 Notes, we were required to make an offer to all holders of the 2025 Notes to purchase for cash an aggregate principal amount up to $425.0 million of the notes as a consequence of the Williston Divestiture. The offer to purchase expired on October 6, 2017, with holders having tendered such notes representing in excess of $425.0 million of principal amount. Accordingly, on October 10, 2017, we completed the repurchase of approximately $425.0 million principal amount of
56
the 2025 Notes on a pro rata basis at 103.0% of par plus accrued and unpaid interest, up to, but not including, the redemption date of approximately $4.1 million.
We recognized a loss on the extinguishment of debt, representing a $12.8 million loss on the repurchase for the tender premium paid, an $8.3 million loss on the write-off of the discount, and a $7.8 million loss on the write-off of the debt issuance costs on the notes.
Redemption of 2022 Second Lien Notes
Using a portion of the net proceeds from the Williston Divestiture, on October 7, 2017 (the Redemption Date), we fully redeemed $112.8 million aggregate principal amount constituting all of our outstanding 12.0% senior secured second lien notes due 2022 (the 2022 Second Lien Notes). We redeemed the 2022 Second Lien Notes at a redemption price equal to the principal amount plus a make whole premium (as described in the indenture governing the 2022 Second Lien Notes), together with accrued and unpaid interest to, but not including, the Redemption Date of approximately $2.0 million. We recognized a loss on the extinguishment of debt, representing a $23.0 million loss on the redemption for the make whole premium paid and a $6.2 million loss on the write-off of the discount on the notes.
Both the redemption of the 2022 Second Lien Notes and the repurchase of the 2025 Notes, discussed above, were required under the indentures governing such notes.
Issuance of 2025 Notes and Repurchase of 2020 Second Lien Notes
On February 16, 2017, we issued $850.0 million aggregate principal amount of our 2025 Notes in a private placement exempt from registration under the Securities Act of 1933, as amended (Securities Act), including by Rule 144A and Regulation S, and applicable state securities laws. The 2025 Notes were issued at par and bear interest at a rate of 6.75% per annum, payable semi-annually on February 15 and August 15 of each year, beginning on August 15, 2017. Proceeds from the private placement were approximately $834.1 million after deducting initial purchasers' discounts and commissions and offering expenses. We used a portion of the net proceeds to fund the repurchase and redemption of our outstanding 8.625% senior secured second lien notes due 2020 (the 2020 Second Lien Notes), discussed further below, and for general corporate purposes.
On February 9, 2017, we commenced a cash tender offer for any and all of our 2020 Second Lien Notes and on the expiration thereof, being February 15, 2017, having received approximately $289.2 million or 41% of the outstanding aggregate principal amount of 2020 Second Lien Notes which were validly tendered (and not validly withdrawn), on February 16, 2017, we paid approximately $303.5 million for approximately $289.2 million principal amount of 2020 Second Lien Notes, a make-whole premium of $13.2 million plus accrued and unpaid interest to, but not including, the redemption date of approximately $1.1 million to repurchase such notes. For all of the 2020 Second Lien Notes that remained outstanding, on February 16, 2017, we issued a redemption notice to holders of the remaining 2020 Second Lien Notes. On February 21, 2017, we paid approximately $1.2 million for approximately $1.2 million of principal amount of 2020 Second Lien Notes, a make-whole premium of approximately $54,000 plus accrued and unpaid interest to, but not including the redemption date to redeem such notes pursuant to guaranteed delivery procedures. On March 20, 2017, we paid approximately $432.0 million for $409.6 million aggregate principal amount of 2020 Second Lien Notes outstanding, a make-whole premium of $17.7 million and unpaid interest to, but not including, the redemption date of approximately $4.8 million to redeem the remaining notes at a price of 104.313% of the principal amount.
We recognized a loss on the extinguishment of debt, representing a $30.9 million loss on the repurchase for the tender premium paid and a $26.0 million loss on the write-off of the discount on the notes.
57
Divestiture of East Texas Eagle Ford Assets
On January 24, 2017, certain of our subsidiaries entered into an agreement with a subsidiary of Hawkwood Energy, LLC (Hawkwood) for the sale of all of our oil and natural gas properties and related assets located in the Eagle Ford formation of East Texas (the El Halcón Assets) for a total adjusted sales price of $491.1 million (the El Halcón Divestiture). The effective date of the El Halcón Divestiture was January 1, 2017, and the transaction closed on March 9, 2017. We used the net proceeds from the sale to repay amounts outstanding under our Senior Credit Agreement and for general corporate purposes. The El Halcón Assets included approximately 80,500 net acres prospective for the Eagle Ford formation in East Texas. As of December 31, 2016, estimated proved reserves from the El Halcón Assets were approximately 35.1 MMBoe, or 24% of our estimated year-end 2016 proved reserves. The El Halcón Assets generated net production of approximately 7,600 Boe/d (80% oil) for the year ended December 31, 2016.
We use the full cost method of accounting for our investment in oil and natural gas properties. Under this method of accounting, sales of oil and gas properties are accounted for as adjustments of capitalized costs with no gain or loss recognized, unless the adjustment significantly alters the relationship between capitalized costs and proved reserves. If the El Halcón Divestiture was accounted for as an adjustment of capitalized costs with no gain or loss recognized, the adjustment would have significantly altered the relationship between capitalized costs and proved reserves. Accordingly, we recognized a gain on the sale in connection with this transaction of $235.7 million during the year ended December 31, 2017. The carrying value of the properties sold was determined by allocating total capitalized costs within the full cost pool between properties sold and properties retained based on their relative fair values. The gain was recorded in "Gain (loss) on sale of oil and natural gas properties," on the consolidated statements of operations.
Private Placement of Automatically Convertible Preferred Stock
On January 24, 2017, we entered into a stock purchase agreement with certain accredited investors to sell, in a private placement exempt from the registration requirements of the Securities Act pursuant to Section 4(a)(2), approximately 5,518 shares of 8% Automatically Convertible Preferred Stock, par value $0.0001 per share (the Preferred Stock), each share of which was convertible into 10,000 shares of common stock. Also on January 24, 2017, we received an executed written consent in lieu of a stockholders' meeting authorizing and approving the conversion of the Preferred Stock into common stock. On February 27, 2017, we issued the Preferred Stock at $72,500 per share. Gross proceeds were approximately $400.1 million, or $7.25 per share of common stock. We incurred approximately $11.9 million in expenses associated with this offering, including placement agent fees. We used the net proceeds from the sale of the Preferred Stock to partially fund the Pecos County Acquisition, which is discussed further below.
On March 16, 2017, we mailed a definitive information statement to stockholders of record notifying them that a majority of our stockholders approved the issuance of common stock, par value $0.0001 per share, and upon the automatic conversion of the Preferred Stock, we issued 55.2 million shares of common stock on April 6, 2017. No cash dividends were paid on the Preferred Stock since conversion occurred prior to June 1, 2017.
We determined that the conversion feature in the Preferred Stock represented a beneficial conversion feature of $48.0 million. This portion of the proceeds received from the issuance of the Preferred Stock was allocated to "Additional paid-in capital," creating a discount on the Preferred Stock. The $48.0 million discount was fully amortized during the year ended December 31, 2017 and is reflected in "Non-cash preferred dividend" in the consolidated statements of operations. The preferred dividend was charged against additional paid-in capital since no retained earnings were available.
58
In accordance with the stock purchase agreement, we agreed to file a registration statement to register the resale of the shares of common stock issued upon conversion of the preferred stock and to pay penalties in the event such registration was not effective by June 27, 2017. We filed such registration statement on March 3, 2017 and it was declared effective by the SEC on April 7, 2017.
Acquisition of Hackberry Draw Assets (Pecos and Reeves Counties, Texas)
On January 18, 2017, we entered into an agreement with Samson Exploration, LLC (Samson), pursuant to which we acquired a total of 20,901 net acres and related assets in the Hackberry Draw area of the Delaware Basin, located in Pecos and Reeves Counties, Texas (collectively, the Pecos County Assets), for a total purchase price of $699.2 million (the Pecos County Acquisition). The effective date of the Pecos County Acquisition was November 1, 2016, and we closed the transaction on February 28, 2017. Based on information provided by Samson, we estimate that net production from the Pecos County Assets at the acquisition date was approximately 2,200 Boe/d (72% oil, 15% NGLs, 13% natural gas). As of the acquisition date, we estimate that the Pecos County Assets included a 75% average working interest, with approximately 44% held by production. We funded the Pecos County Acquisition with net proceeds from the private placement of the Preferred Stock and borrowings under our Senior Credit Agreement.
Option Agreement to Acquire Monument Draw Assets (Ward and Winkler Counties, Texas)
On December 9, 2016, one of our wholly owned subsidiaries entered into an agreement with a private company, pursuant to which we acquired the rights to purchase up to 15,040 net acres in the Monument Draw area of the Delaware Basin, located in Ward and Winkler Counties, Texas (the Ward County Assets) prospective for the Wolfcamp and Bone Spring formations. The Ward County Assets are divided into two tracts (the Southern Tract and the Northern Tract) with separate options for each tract. Pursuant to the terms of the agreement (as amended), on June 15, 2017, we purchased the Southern Tract for approximately $87.4 million and on January 9, 2018, we purchased the Northern Tract for approximately $108.2 million. Each of the Southern Tract and Northern Tract are 100% operated and have an average working interest of 100%.
Reorganization
On July 27, 2016, we and certain of our subsidiaries (the Halcón Entities) filed voluntary petitions for relief under chapter 11 of the United States Bankruptcy Code in the U.S. Bankruptcy Court in the District of Delaware (the Bankruptcy Court) to pursue a prepackaged plan of reorganization in accordance with the terms of the Restructuring Support Agreement discussed below. Prior to filing the chapter 11 bankruptcy petitions, on June 9, 2016, the Halcón Entities entered into a restructuring support agreement (the Restructuring Support Agreement) with certain holders of our 13% senior secured third lien notes due 2022 (the Third Lien Noteholders), our 8.875% senior unsecured notes due 2021, 9.25% senior unsecured notes due 2022 and 9.75% senior unsecured notes due 2020 (collectively, the Unsecured Noteholders), the holder of our 8% senior unsecured convertible note due 2020 (the Convertible Noteholder), and certain holders of our 5.75% Series A Convertible Perpetual Preferred Stock (the Preferred Holders), to support a restructuring in accordance with the terms of a plan of reorganization as described therein (the Plan). On September 8, 2016, the Halcón Entities received confirmation of their joint prepackaged plan of reorganization from the Bankruptcy Court and subsequently emerged from chapter 11 bankruptcy on September 9, 2016 (the Effective Date). Refer to Item 8. Consolidated Financial Statements and Supplementary Data—Note 2, "Reorganization," for further details.
59
Fresh-start Accounting
Upon our emergence from chapter 11 bankruptcy, on September 9, 2016, we adopted fresh-start accounting in accordance with the provisions set forth in Accounting Standards Codification (ASC) 852, Reorganizations, as (i) the reorganization value of our assets immediately prior to the date of confirmation was less than the post-petition liabilities and allowed claims and (ii) the holders of our existing voting shares of the Predecessor entity received less than 50% of the voting shares of the emerging entity.
Adopting fresh-start accounting results in a new financial reporting entity with no beginning or ending retained earnings or deficit balances as of the fresh-start reporting date. Upon the adoption of fresh-start accounting, our assets and liabilities were recorded at their fair values as of the fresh-start reporting date. Our adoption of fresh-start accounting may materially affect our results of operations following the fresh-start reporting date, as we have a new basis in our assets and liabilities. As a result of the adoption of fresh-start reporting and the effects of the implementation of the Plan, our consolidated financial statements subsequent to September 9, 2016 are not comparable to our consolidated financial statements prior to September 9, 2016, as such, "black-line" financial statements are presented to distinguish between the Predecessor and Successor companies. Refer to Item 8. Consolidated Financial Statements and Supplementary Data—Note 3, "Fresh-start Accounting," for more details.
Capital Resources and Liquidity
Our near-term capital spending requirements are expected to be funded with cash on hand, cash flows from operations, proceeds from debt and equity issuances and borrowings under our Senior Credit Agreement, the terms of which are discussed above.
The Senior Credit Agreement contains certain financial covenants, including the maintenance of (i) a Total Net Indebtedness Leverage Ratio (as defined in the Senior Credit Agreement) not to exceed 4.00:1.00 and (ii) a Current Ratio (as defined in the Senior Credit Agreement) not to be less than 1.00:1.00. At December 31, 2017, we had no indebtedness outstanding, $1.6 million letters of credit outstanding and approximately $98.4 million of borrowing capacity available under our Senior Credit Agreement. At December 31, 2017, we were in compliance with the financial covenants under the Senior Credit Agreement.
We have recently, and in the past, obtained amendments to the covenants under our financing agreements under circumstances where we anticipated that it might be challenging for us to comply with our financial covenants for a particular period of time. Most recently, our strategic decision to transform into a pure-play, single basin company focused on the Delaware Basin in West Texas has resulted in us divesting a majority of our non-core producing properties for primarily undeveloped acreage. This, coupled with our current drilling plans, has impacted our ability to comply with our debt covenants by reducing our production and reserves on a current and, for purposes of covenant calculations, a pro forma historical basis, as drilling takes time to replace lost production. As such, on February 2, 2018, we entered into the Second Amendment to our Senior Credit Agreement. The Second Amendment, among other things, provides for (i) the use of annualized financial information in determining EBITDA (as defined in the Senior Credit Agreement) for the fiscal quarters ending June 30, 2018, September 30, 2018 and December 31, 2018, (ii) an increase in the ratio of Consolidated Total Net Debt (as defined in the Senior Credit Agreement) to EBITDA of 4.50:1.00 for the fiscal quarter ending June 30, 2018, and a ratio of 4.00:1.00 for any fiscal quarter thereafter, (iii) a waiver of compliance with the covenant relating to the Total Net Indebtedness Leverage Ratio (as defined in the Senior Credit Agreement) for the fiscal quarter ending March 31, 2018, and (iv) a waiver of the automatic reduction to the borrowing base that would otherwise result due to the issuance of the Additional 2025 Notes. In addition, under the Predecessor Company's financing facility, we received a
60
reduction in the minimum required interest coverage ratio of 2.00:1.00 on March 21, 2014 and again on February 25, 2015. The basis for these amendment and waiver requests was the potential for us to fall out of compliance as a result of our strategic decisions. Declining commodity prices also adversely impacted our ability to comply with these covenants in 2014 and 2015. Over the longer term, we expect that our strategy and our investments will result in increased production and reserves, lower lease operating costs and more abundant drilling opportunities. As a consequence, we constantly monitor our liquidity and capital resources, anticipate and identify potential covenant compliance issues and work with the lenders under our Senior Credit Agreement to address any such issues ahead of time.
As part of our plan to manage liquidity risks, we scaled back our capital expenditures budget, focused our drilling program on our highest return projects, continued to explore opportunities to divest non-core properties and completed our reorganization in 2016 (as described above). Upon emergence from reorganization under chapter 11 bankruptcy, approximately $2.0 billion of our debt obligations were cancelled, reducing our ongoing interest obligations by more than $200 million annually. In 2017, we completed the issuance of our 2025 Notes and repurchased the remaining 2020 Second Lien Notes, lowering our interest obligations approximately $3.0 million per year and extending the maturity date of our senior notes from 2020 to 2025. Additionally, we utilized a portion of the proceeds from the Williston Divestiture to redeem all of our outstanding 2022 Second Lien Notes and to repurchase approximately one half of our outstanding 2025 Notes, which lowered our future interest obligations by approximately $42.2 million per year, or $28.7 million per year after taking into account our issuance subsequent to year-end of our Additional 2025 Notes.
In the event that we are unable to access sufficient capital to fund our business and planned capital expenditures, we may be required to curtail our drilling, development, land acquisition and other activities, which could result in a decrease in our production of oil and natural gas, subject us to forfeitures of leasehold interests to the extent we are unable or unwilling to renew them, and force us to sell some of our assets on an untimely or unfavorable basis, each of which could adversely affect our results of operations and financial condition.
Our future capital resources and liquidity depend, in part, on our success in developing our leasehold interests, growing reserves and production and finding additional reserves. Cash is required to fund capital expenditures necessary to offset inherent declines in our production and proved reserves, which is typical in the capital-intensive oil and natural gas industry. We therefore continuously monitor our liquidity and the capital markets and evaluate our development plans in light of a variety of factors, including, but not limited to, our cash flows, capital resources, acquisition opportunities and drilling successes.
We strive to maintain financial flexibility while pursuing our drilling plans and evaluating potential acquisitions, and will therefore likely continue to access capital markets (if on acceptable terms) as necessary to, among other things, maintain adequate borrowing capacity under our Senior Credit Agreement, facilitate drilling on our large undeveloped acreage position and permit us to selectively expand our acreage position and infrastructure projects while sustaining sufficient operating cash levels. Our ability to complete future debt and equity offerings and maintain or increase our borrowing base is subject to a number of variables, including our level of oil and natural gas production, reserves and commodity prices, as well as various economic and market conditions that have historically affected the oil and natural gas industry. Even if we are otherwise successful in growing our reserves and production, if oil and natural gas prices decline for a sustained period of time, our ability to fund our capital expenditures, complete acquisitions, reduce debt, meet our financial obligations and become profitable may be materially impacted.
We are exposed to various risks including energy commodity price risk. When oil, natural gas, and natural gas liquids prices decline significantly, our ability to finance our capital budget and operations may be adversely impacted. While we use derivative instruments to provide partial protection against
61
declines in oil and natural gas prices, the total volumes we hedge varies from period to period based on our view of current and future market conditions. Our hedge policies and objectives may change significantly as our operational profile changes and/or commodities prices change. We do not enter into derivative contracts for speculative trading purposes.
Cash Flow
Historically, our primary sources of cash were from operating and financing activities. In 2017, cash generated by operating activities, as well as proceeds from the sale of the Williston Assets, the Non-Operated Williston Assets and the El Halcón Assets, were used to fund our acquisition initiatives, primarily in the Hackberry Draw and Monument Draw areas of the Delaware Basin and our drilling and completion program. See "Results of Operations" for a review of the impact of prices and volumes on sales.
Net increase (decrease) in cash is summarized as follows (in thousands):
| |
Successor |
|
Predecessor | ||||||||||||
|---|---|---|---|---|---|---|---|---|---|---|---|---|---|---|---|
| |
|
Period from September 10, 2016 through December 31, 2016 |
|
Period from January 1, 2016 through September 9, 2016 |
|
||||||||||
| |
Year Ended December 31, 2017 |
|
Year Ended December 31, 2015 |
||||||||||||
| |
|
||||||||||||||
| |
|
||||||||||||||
Cash flows provided by (used in) operating activities |
$ | 114,591 | $ | 103,136 | $ | 175,348 | $ | 466,999 | |||||||
Cash flows provided by (used in) investing activities |
598,592 | (63,042 | ) | (227,774 | ) | (667,132 | ) | ||||||||
Cash flows provided by (used in) financing activities |
(289,136 | ) | (54,013 | ) | 58,343 | 164,446 | |||||||||
| | | | | | | | | | | | | | | | |
Net increase (decrease) in cash and cash equivalents |
$ | 424,047 | $ | (13,919 | ) | $ | 5,917 | $ | (35,687 | ) | |||||
| | | | | | | | | | | | | | | | |
| | | | | | | | | | | | | | | | |
| | | | | | | | | | | | | | | | |
Operating Activities. Net cash provided by operating activities for the year ended December 31, 2017 was $114.6 million. Net cash provided by operating activities for the period of September 10, 2016 through December 31, 2016 and the period of January 1, 2016 through September 9, 2016 were $103.1 million and $175.3 million, respectively. Net cash provided by operating activities was $467.0 million for the years ended December 31, 2015. Key drivers of net operating cash flows are commodity prices, production volumes, operating costs, and in 2016 and 2015, realized settlements on our derivative contracts.
The $114.6 million of operating cash flows for the year ended December 31, 2017 were lower than the prior year primarily due to a decrease in realized settlements. Realized settlements on derivative contracts decreased $312.7 million over the prior year period. Our oil and natural gas revenues also decreased approximately $42.2 million over the prior year period due to a decrease in our average daily production. Average realized prices (excluding the effects of hedging arrangements) were $37.58 per Boe, $35.87 per Boe and $28.53 per Boe for the year ended December 31, 2017, for the period September 10, 2016 through December 31, 2016 and the period of January 1, 2016 through September 9, 2016, respectively.
For the period September 10, 2016 through December 31, 2016, cash flows were modestly impacted by changes in our working capital. For the period January 1, 2016 through September 9, 2016 our net operating cash flows were $175.3 million, which resulted primarily from realized settlements on our derivative contracts that were partially offset by transaction costs related to our chapter 11 bankruptcy and reorganization activities.
62
For the year ended December 31, 2015, the $467.0 million of net cash provided by operating activities primarily reflects the impact of realized settlements on our derivative contracts of $418.4 million, which largely mitigated the decrease in revenues due to lower commodity prices, as compared to the prior year period. Cash operating expenses also decreased over the prior year period.
Investing Activities. Net cash provided by investing activities for the year ended December 31, 2017 was approximately $598.6 million. Net cash used in investing activities for the period of September 10, 2016 through December 31, 2016 and the period of January 1, 2016 through September 9, 2016 were $63.0 million and $227.8 million, respectively. Net cash used in investing activities was $667.1 million for the year ended December 31, 2015.
In 2017, we incurred cash expenditures of $700.1 million to acquire the Pecos County Assets of which $674.6 million related to the oil and natural gas properties and $25.5 million related to the other operating property and equipment. In addition to the acquisition of the Pecos County Assets, we spent approximately $344.0 million on other acquisitions, primarily in the Delaware Basin to increase our position in the area. We spent $331.3 million on oil and natural gas capital expenditures, of which $309.6 million related to drilling and completion costs. In 2017, we participated in the drilling of 124 gross (33.7 net) wells, none of which were dry holes. These cash outflows for acquisitions and our drilling and completion activities were more than offset by cash inflows from our non-core asset sales. Approximately $1.39 billion of the proceeds from the Williston Divestiture were allocated to the oil and natural gas properties divested and $10.9 million of the proceeds were allocated to the other operating property and equipment divested. Proceeds from the sale of the El Halcón Assets were $494.3 million of which $484.1 million related to the oil and natural gas properties divested and $10.2 million related to the other operating property and equipment divested. In November 2017, proceeds from the sale of the Non-Operated Williston Assets totaled approximately $105.2 million.
During the period of September 10, 2016 through December 31, 2016, we spent $61.4 million on oil and natural gas capital expenditures, of which $54.4 million related to drilling and completion costs. During the period of January 1, 2016 through September 9, 2016, we spent $226.7 million on oil and natural gas capital expenditures, of which $129.5 million related to drilling and completion costs and the remainder was primarily associated with capitalized interest, and to a lesser extent, leasing and seismic data. In 2016 (for the combined Successor and Predecessor periods), we participated in the drilling of 90 gross (30.6 net) wells, none of which were dry holes.
In 2015, we used $659.2 million of cash on oil and natural gas capital expenditures, of which $508.4 million related to drilling and completion costs and the remainder was primarily associated with capitalized interest, leasing and seismic data. We participated in the drilling of 184 gross (49.0 net) wells, none of which were dry holes. We significantly decreased our capital spending for 2015, as compared to capital expenditure levels in prior years, in response to the significant decrease in crude oil prices over the latter of 2014 and throughout 2015, and our expectation that prices may not recover in the near term. Cash paid for drilling and completion costs during the year were attributable to both costs incurred before we slowed our drilling and completion program and costs related to wells spud or drilled during the period.
Financing Activities. Net cash flows used in financing activities for the year ended December 31, 2017 were $289.1 million. Net cash flows used in financing activities for the period of September 10, 2016 through December 31, 2016 were $54.0 million and net cash flows provided by financing activities for the period of January 1, 2016 through September 9, 2016 were $58.3 million. Net cash flows provided by financing activities was $164.4 million for the year ended December 31, 2015.
In 2017, we issued $850.0 million aggregate principal amount of our new 6.75% senior notes due 2025. Proceeds from the private placement were approximately $834.1 million after deducting initial purchasers' discounts and commissions and offering expenses. We utilized the majority of the net proceeds from the private placement to fund the repurchase and redemption of our 2020 Second Lien
63
Notes. The net cash to make these repurchases and redemptions was approximately $736.8 million and we recognized a loss on the extinguishment of debt, representing a $30.9 million loss on the repurchase for the tender premium paid and a $26.0 million loss on the write-off of the discount on the notes. During 2017, we also utilized a portion of the proceeds from the Williston Divestiture to repay borrowings outstanding under our Senior Credit Agreement, repurchase approximately $425.0 million principal amount of our 6.75% senior notes due 2025 and redeem all of our outstanding 2022 Second Lien Notes. The net cash used to make the repurchase of the 2025 Notes was approximately $437.8 million and we recognized a loss on the extinguishment of debt, representing a $12.8 million loss on the repurchase for the tender premium paid, an $8.3 million loss on the write-off of the discount on the notes, and a $7.8 million loss on the write-off of the debt issuances costs on the notes. The net cash used to make the redemption of the 2022 Second Lien Notes was approximately $137.8 million and we recognized a loss on the extinguishment of debt, representing a $23.0 million loss on the redemption for the make whole premium paid and a $6.2 million loss on the write-off of the discount on the notes. We also paid a consent fee of approximately $16.9 million to the holders of our 2025 Notes. Additionally, we issued 5,518 shares of the Preferred Stock at $72,500 per share. Gross proceeds from this issuance were approximately $400.1 million.
During the period of September 10, 2016 through December 31, 2016, we paid a consent fee of approximately $10.0 million to holders of our Second Lien Notes and made net repayments of $44.0 million on our Senior Credit Agreement. The primary drivers of cash provided by financing activities for the period of January 1, 2016 through September 9, 2016 were net borrowings on our Predecessor credit agreement, offset by cash payments totaling $97.5 million made to the Third Lien Noteholders, Unsecured Noteholders, Convertible Noteholder and Preferred Holders in accordance with the Plan.
During the first quarter of 2016, we repurchased approximately $24.5 million principal amount of our 9.75% senior notes due 2020, $51.8 million principal amount of our 8.875% senior notes due 2021, and $15.5 million principal amount of our 9.25% senior notes due 2022. The net cash used to make these repurchases was approximately $9.7 million and we recognized an $81.4 million net gain on the extinguishment of debt, as an $82.1 million gain on the repurchase was partially offset by the write-down of $0.7 million associated with related issuance costs and discounts and premiums for the respective senior notes. Upon settlement of the repurchases, we paid all accrued and unpaid interest since the respective interest payment dates of the senior notes repurchased.
During the fourth quarter of 2015, we repurchased approximately $6.2 million principal amount of our 9.75% senior notes due 2020, $28.0 million principal amount of our 8.875% senior notes due 2021, and $10.3 million principal amount of our 9.25% senior notes due 2022. The net cash used to make these repurchases was approximately $14.8 million and we recognized a $29.4 million net gain on the extinguishment of debt, as a $29.7 million gain on the repurchase was partially offset by the write-down of $0.3 million associated with related issuance costs and discounts and premiums for the respective unsecured notes. Upon settlement of the repurchases, we paid all accrued and unpaid interest since the respective interest payment dates of the notes repurchased.
On May 1, 2015, we completed the issuance of $700.0 million aggregate principal amount of our 2020 Second Lien Notes. The net proceeds from the offering were approximately $686.2 million after deducting commissions and offering expenses and were used to repay a majority of the then outstanding borrowings under our Predecessor credit agreement.
Cash flows provided by financing activities include net borrowings under our Predecessor credit agreement of $62.0 million for the year ended December 31, 2015, primarily used to fund drilling and completion activities and other general corporate purposes.
During the year ended December 31, 2015, cash flows from financing activities were modestly impacted by sales of our Predecessor common stock. For the year ended December 31, 2015, we sold
64
approximately 1.9 million shares for net proceeds of approximately $15.0 million, after deducting offering expenses.
Contractual Obligations
We have a significant degree of flexibility to adjust the level of our future capital expenditures as circumstances warrant. Our level of capital expenditures will vary in future periods depending on the success we experience in our acquisition, developmental and exploration activities, oil and natural gas price conditions, our access to capital and liquidity and other related economic factors. We currently have no material off-balance sheet arrangements or transactions with unconsolidated, limited-purpose entities. The following table summarizes our contractual obligations and commitments by payment periods as of December 31, 2017.
| |
Payments Due by Period | |||||||||||||||
|---|---|---|---|---|---|---|---|---|---|---|---|---|---|---|---|---|
Contractual Obligations
|
Total | 2018 | 2019 - 2020 | 2021 - 2022 | 2023 and Beyond |
|||||||||||
| |
(In thousands) |
|||||||||||||||
Senior revolving credit facility |
$ | — | $ | — | $ | — | $ | — | $ | — | ||||||
6.75% senior notes due 2025(1)(2) |
425,005 | — | — | — | 425,005 | |||||||||||
Interest expense on long-term debt(3) |
205,798 | 29,180 | 58,360 | 57,376 | 60,882 | |||||||||||
Operating leases |
11,817 | 3,339 | 4,801 | 2,332 | 1,345 | |||||||||||
Drilling rig commitments(4) |
5,746 | 5,746 | — | — | — | |||||||||||
Rig stacking commitments |
4,260 | 1,260 | 3,000 | — | — | |||||||||||
| | | | | | | | | | | | | | | | | |
Total contractual obligations |
$ | 652,626 | $ | 39,525 | $ | 66,161 | $ | 59,708 | $ | 487,232 | ||||||
| | | | | | | | | | | | | | | | | |
| | | | | | | | | | | | | | | | | |
| | | | | | | | | | | | | | | | | |
- (1)
- Excludes a $8.1 million unamortized discount and $7.7 million unamortized debt issuance costs as of
December 31, 2017.
- (2)
- On February 15, 2018, we issued an additional $200.0 million aggregate principal amount of our 6.75% senior notes
due 2025. This transaction is not included in the table above. See Item 8. Consolidated Financial Statements and Supplementary Data—Note 17, "Subsequent Events," for
further details on the issuance of the Additional 2025 Notes.
- (3)
- Future interest expense was calculated based on interest rates and amounts outstanding at December 31, 2017 less
required annual repayments.
- (4)
- Early termination of our drilling rig commitments would result in termination penalties approximating $4.5 million, which would be in lieu of paying the remaining active commitments of approximately $5.7 million.
We lease corporate office space in Houston, Texas and Denver, Colorado. Rent expense was approximately $3.9 million for the year ended December 31, 2017. Rent expense was approximately $1.4 million for the period of September 10, 2016 through December 31, 2016 and $5.9 million for the period January 1, 2016 through September 30, 2016. Rent expense was approximately $8.6 million for the year ended December 31, 2015. Future obligations associated with our operating leases are presented in the table above.
On June 20, 2017, we entered into an agreement with a private company for the right to purchase up to 7,680 net acres located in Ward and Winkler Counties, Texas prospective for the Wolfcamp and Bone Spring formations. We paid $5.0 million and drilled a commitment well to earn the option to acquire the acreage for $10,000 per acre by March 31, 2018. This option purchase agreement is not included in the table above.
65
We also have various long-term gathering, transportation and sales contracts with respect to production from the Delaware Basin. As of December 31, 2017, we had in place two long-term crude oil contracts and seven long-term natural gas contracts in this area, with sales prices based on posted market rates. Under the terms of these contracts we have committed a substantial portion of our production from this area for periods ranging from one to eight years from the date of first production.
The contractual obligations table does not include obligations to taxing authorities due to the uncertainty surrounding the ultimate settlement of amounts and timing of these obligations. In addition, amounts related to our asset retirement obligations are not included in the table above given the uncertainty regarding the actual timing of such expenditures. The total estimated amount of our asset retirement obligations at December 31, 2017 was $4.4 million.
Senior Revolving Credit Facility
On September 7, 2017, we entered into the Senior Credit Agreement by and among us, as borrower, JPMorgan Chase Bank, N.A., as administrative agent, and certain other financial institutions party thereto, as lenders. The Senior Credit Agreement amends and restates in its entirety the original Senior Secured Revolving Credit Agreement entered into on September 9, 2016. Pursuant to the Senior Credit Agreement, the lenders party thereto have agreed to provide us with a $1.0 billion senior secured reserve-based revolving credit facility with a current borrowing base of $100.0 million. The maturity date of the Senior Credit Agreement is September 7, 2022. The borrowing base will be redetermined semi-annually, with the lenders and us each having the right to one interim unscheduled redetermination between any two consecutive semi-annual redeterminations. The borrowing base takes into account the estimated value of our oil and natural gas properties, proved reserves, total indebtedness, and other relevant factors consistent with customary oil and natural gas lending criteria. Amounts outstanding under the Senior Credit Agreement bear interest at specified margins over the base rate of 1.25% to 2.25% for ABR-based loans or at specified margins over LIBOR of 2.25% to 3.25% for Eurodollar-based loans. These margins fluctuate based on the utilization of the facility. We may elect, at its option, to prepay any borrowings outstanding under the Senior Credit Agreement without premium or penalty (except with respect to any break funding payments which may be payable pursuant to the terms of the Senior Credit Agreement). Amounts outstanding under the Senior Credit Agreement are guaranteed by certain of our direct and indirect subsidiaries and secured by a security interest in substantially all of our assets and the assets of our subsidiaries.
The Senior Credit Agreement also contains certain financial covenants, including the maintenance of (i) a Total Net Indebtedness Leverage Ratio (as defined in the Senior Credit Agreement) not to exceed 4.00:1.00 and (ii) a Current Ratio (as defined in the Senior Credit Agreement) not to be less than 1.00:1.00. At December 31, 2017, we were in compliance with the financial covenants under the Senior Credit Agreement.
The Senior Credit Agreement also contains certain events of default, including non-payment; breaches of representations and warranties; non-compliance with covenants or other agreements; cross default to material indebtedness; judgments; change of control; and voluntary and involuntary bankruptcy.
At December 31, 2017, we had no indebtedness outstanding, approximately $1.6 million letters of credit outstanding and approximately $98.4 million of borrowing capacity available under the Senior Credit Agreement.
On February 2, 2018, we entered into the Second Amendment to Senior Credit Agreement (as amended, the Senior Credit Agreement) by and among us, as borrower, JPMorgan Chase Bank, N.A., as administrative agent, and certain other financial institutions party thereto, as lenders. For certain fiscal quarters in 2018, the Second Amendment, among other things, provided flexibility with respect to certain financial covenants as specified in the Senior Credit Agreement. The Second Amendment
66
provides for (i) the use of annualized financial information in determining EBITDA (as defined in the Senior Credit Agreement) for the fiscal quarters ending June 30, 2018, September 30, 2018 and December 31, 2018, (ii) an increase in the ratio of Consolidated Total Net Debt (as defined in the Senior Credit Agreement) to EBITDA of 4.50:1.00 for the fiscal quarter ending June 30, 2018, and a ratio of 4.00:1.00 for any fiscal quarter thereafter, (iii) a waiver of compliance with the covenant relating to the Total Net Indebtedness Leverage Ratio (as defined in the Senior Credit Agreement) for the fiscal quarter ending March 31, 2018, and (iv) a waiver of the automatic reduction to the borrowing base that would otherwise result due to the issuance of the Additional 2025 Notes.
6.75% Senior Notes
On February 16, 2017, we issued $850.0 million aggregate principal amount of our 2025 Notes in a private placement exempt from registration under Section 4(a)(2) of the Securities Act of 1933, as amended (Securities Act), Rule 144A and Regulation S, and applicable state securities laws. The 2025 Notes were issued at par and bear interest at a rate of 6.75% per annum, payable semi-annually on February 15 and August 15 of each year, beginning on August 15, 2017. The 2025 Notes will mature on February 15, 2025. Proceeds from the private placement were approximately $834.1 million after deducting initial purchasers' discounts and commissions and offering expenses. We used a portion of the net proceeds from the private placement to fund the repurchase and redemption of the outstanding 2020 Second Lien Notes and for general corporate purposes.
The 2025 Notes are governed by an Indenture, dated as of February 16, 2017 (as supplemented, the February 2017 Indenture) by and among us, the Guarantors and U.S. Bank National Association, as Trustee, which contains affirmative and negative covenants that, among other things, limit the ability of us and the Guarantors to incur indebtedness; purchase or redeem stock or subordinated indebtedness; make investments; create liens; enter into transactions with affiliates; sell assets; refinance certain indebtedness; merge with or into other companies or transfer substantially all of their assets; and, in certain circumstances, to pay dividends or make other distributions on stock. The February 2017 Indenture also contains customary events of default. Upon the occurrence of certain events of default, the Trustee or the holders of the 2025 Notes may declare all outstanding 2025 Notes to be due and payable immediately. The 2025 Notes are jointly and severally, fully and unconditionally guaranteed on a senior unsecured basis by our existing wholly-owned subsidiaries. We have no material independent assets or operations apart from the assets and operations of our subsidiaries.
In connection with the sale of the 2025 Notes, on February 16, 2017, we, the Guarantors and J.P. Morgan Securities LLC, on behalf of itself and as representative of the initial purchasers, entered into a Registration Rights Agreement (the 2017 Registration Rights Agreement) pursuant to which we agreed to, among other things, use reasonable best efforts to file a registration statement under the Securities Act and complete an exchange offer for the 2025 Notes within 365 days after closing. We filed the registration statement on November 1, 2017 and it was declared effective by the SEC on December 21, 2017. In addition, we completed the exchange offer for the 2025 Notes on February 1, 2018.
On July 25, 2017, we concluded a consent solicitation of the holders of the 2025 Notes (the Consent Solicitation) and obtained consents to amend the February 2017 Indenture from approximately 99% of the holders of the 2025 Notes. As supplemented, the February 2017 Indenture amends provisions in order to exempt, among other things, the Williston Divestiture from certain provisions therein triggered upon a sale of "all or substantially all of the assets" of ours. Consenting holders of the 2025 Notes received a consent fee of 2.0% of principal, or $16.9 million. We recorded the $16.9 million consent fees paid as a discount on the 2025 Notes.
On September 7, 2017, we commenced an offer to purchase for cash up to $425.0 million of the $850.0 million outstanding aggregate principal amount of our 2025 Notes at 103.0% of principal plus
67
accrued and unpaid interest. The consummation of the Williston Divestiture constituted a "Williston Sale" under the February 2017 Indenture, and we were required to make an offer to all holders of the 2025 Notes to purchase for cash an aggregate principal amount up to $425.0 million of the 2025 Notes. The offer to purchase expired on October 6, 2017, with notes representing in excess of $425.0 million of principal amount validly tendered. As a result, on October 10, 2017, we repurchased approximately $425.0 million principal amount of the 2025 Notes on a pro rata basis at 103.0% of par plus accrued and unpaid interest of approximately $4.1 million.
We recognized a loss on the extinguishment of debt, representing a $12.8 million loss on the redemption for the tender premium paid, a $8.3 million loss on the write-off of the discount, and a $7.8 million loss on the write-off of debt issuance costs on the notes. The loss was recorded in "Gain (loss) on extinguishment of debt" on the consolidated statements of operations.
The remaining unamortized discount on the 2025 Notes was $8.1 million at December 31, 2017.
On February 15, 2018, we issued an additional $200.0 million aggregate principal amount of our 2025 Notes at a price to the initial purchasers of 103.0% of par. The net proceeds from the sale of the Additional 2025 Notes were approximately $203.0 million after deducting initial purchasers' premiums, commissions and estimated offering expenses and will be used to fund the cash consideration for the acquisition of the West Quito Draw Properties, discussed further above in "Recent Developments" and for general corporate purposes, including to fund our 2018 drilling program. These notes were issued as "Additional Notes" under the Indenture, dated as of February 16, 2017, among us, certain of our subsidiaries and U.S. Bank National Association, as trustee, which governs our 6.75% senior notes due 2025 that were issued on February 16, 2017. See Item 8. Consolidated Financial Statements and Supplementary Data—Note 17, "Subsequent Events," for further details on the issuance of the Additional 2025 Notes.
Off-Balance Sheet Arrangements
At December 31, 2017, we did not have any material off-balance sheet arrangements.
Critical Accounting Policies and Estimates
The discussion and analysis of our financial condition and results of operations are based upon our consolidated financial statements, which have been prepared in accordance with accounting principles generally accepted in the United States. The preparation of our consolidated financial statements requires us to make estimates and assumptions that affect our reported results of operations and the amount of reported assets, liabilities and proved oil and natural gas reserves. Some accounting policies involve judgments and uncertainties to such an extent that there is reasonable likelihood that materially different amounts could have been reported under different conditions, or if different assumptions had been used. Actual results may differ from the estimates and assumptions used in the preparation of our consolidated financial statements. Described below are the most significant policies we apply in preparing our consolidated financial statements, some of which are subject to alternative treatments under accounting principles generally accepted in the United States. We also describe the most significant estimates and assumptions we make in applying these policies. We discussed the development, selection and disclosure of each of these with our audit committee. See Item 8. Consolidated Financial Statements and Supplementary Data—Note 1, "Summary of Significant Events and Accounting Policies," for a discussion of additional accounting policies and estimates made by management.
Fresh-start Accounting
Upon our emergence from chapter 11 bankruptcy, on September 9, 2016, we adopted fresh-start accounting in accordance with the provisions set forth in ASC 852, Reorganizations, as (i) the
68
Reorganization Value of our assets immediately prior to the date of confirmation was less than the post-petition liabilities and allowed claims and (ii) the holders of our existing voting shares of the Predecessor entity received less than 50% of the voting shares of the emerging entity. Adopting fresh-start accounting results in a new financial reporting entity with no beginning or ending retained earnings or deficit balances. Upon the adoption of fresh-start accounting, our assets and liabilities were recorded at their fair values as of the fresh-start reporting date.
Fresh-start accounting requires an entity to present its assets, liabilities, and equity as if it were a new entity upon emergence from bankruptcy. The new entity is referred to as "Successor" or "Successor Company." However, we will continue to present financial information for any periods before adoption of fresh-start accounting for the Predecessor Company. The Predecessor and Successor companies may lack comparability, as required in ASC Topic 205, Presentation of Financial Statements (ASC 205). ASC 205 states financial statements are required to be presented comparably from year to year, with any exceptions to comparability clearly disclosed. Therefore, "black-line" financial statements are presented to distinguish between the Predecessor and Successor Companies. Refer to Item 1. Condensed Consolidated Financial Statements (Unaudited)—Note 3, "Fresh-start Accounting," for further details.
Oil and Natural Gas Activities
Accounting for oil and natural gas activities is subject to unique rules. Two generally accepted methods of accounting for oil and natural gas activities are available—successful efforts and full cost. The most significant differences between these two methods are the treatment of unsuccessful exploration costs and the manner in which the carrying value of oil and natural gas properties are amortized and evaluated for impairment. The successful efforts method requires unsuccessful exploration costs to be expensed as they are incurred upon a determination that the well is uneconomical while the full cost method provides for the capitalization of these costs. Both methods generally provide for the periodic amortization of capitalized costs based on proved reserve quantities. Impairment of oil and natural gas properties under the successful efforts method is based on an evaluation of the carrying value of individual oil and natural gas properties against their estimated fair value, while impairment under the full cost method requires an evaluation of the carrying value of oil and natural gas properties included in a cost center against the net present value of future cash flows from the related proved reserves, using the unweighted arithmetic average of the first day of the month for each of the 12-month prices for oil and natural gas within the period, holding prices and costs constant and applying a 10% discount rate.
Full Cost Method
We use the full cost method of accounting for our oil and natural gas activities. Under this method, all costs incurred in the acquisition, exploration and development of oil and natural gas properties are capitalized into a cost center (the amortization base or full cost pool). Such amounts include the cost of drilling and equipping productive wells, dry hole costs, lease acquisition costs and delay rentals. All general and administrative costs unrelated to drilling activities are expensed as incurred. The capitalized costs of our evaluated oil and natural gas properties, plus an estimate of our future development and abandonment costs are amortized on a unit-of-production method based on our estimate of total proved reserves. Our financial position and results of operations could have been significantly different had we used the successful efforts method of accounting for our oil and natural gas activities.
Proved Oil and Natural Gas Reserves
Estimates of our proved reserves included in this report are prepared in accordance with accounting principles generally accepted in the United States and SEC guidelines. Our engineering
69
estimates of proved oil and natural gas reserves directly impact financial accounting estimates, including depletion, depreciation and accretion expense and the full cost ceiling test limitation. Proved oil and natural gas reserves are the estimated quantities of oil and natural gas reserves that geological and engineering data demonstrate with reasonable certainty to be recoverable in future years from known reservoirs under defined economic and operating conditions. The process of estimating quantities of proved reserves is very complex, requiring significant subjective decisions in the evaluation of all geological, engineering and economic data for each reservoir. The accuracy of a reserve estimate is a function of: (i) the quality and quantity of available data; (ii) the interpretation of that data; (iii) the accuracy of various mandated economic assumptions; and (iv) the judgment of the persons preparing the estimate. The data for a given reservoir may change substantially over time as a result of numerous factors, including additional development activity, evolving production history and continual reassessment of the viability of production under varying economic conditions. Changes in oil and natural gas prices, operating costs and expected performance from a given reservoir also will result in revisions to the amount of our estimated proved reserves.
Our estimated proved reserves for the years ended December 31, 2017, 2016 and 2015 were prepared by Netherland, Sewell, an independent oil and natural gas reservoir engineering consulting firm. For more information regarding reserve estimation, including historical reserve revisions, refer to Item 8. Consolidated Financial Statements and Supplementary Data—"Supplemental Oil and Gas Information (Unaudited)."
Depreciation, Depletion and Accretion
Our rate of recording depletion, depreciation and accretion expense (DD&A) is primarily dependent upon our estimate of proved reserves, which is utilized in our unit-of-production method calculation. If the estimates of proved reserves were to be reduced, the rate at which we record DD&A expense would increase, reducing net income. Such a reduction in reserves may result from calculated lower market prices, which may make it non-economic to drill for and produce higher cost reserves. At December 31, 2017, a five percent positive revision to proved reserves would decrease the DD&A rate by approximately $0.67 per Boe and a five percent negative revision to proved reserves would increase the DD&A rate by approximately $0.74 per Boe.
Full Cost Ceiling Test Limitation
Under the full cost method, we are subject to quarterly calculations of a ceiling or limitation on the amount of our oil and natural gas properties that can be capitalized on our balance sheet. If the net capitalized costs of our oil and natural gas properties exceed the cost center ceiling, we are subject to a ceiling test write down to the extent of such excess. If required, it would reduce earnings and impact stockholders' equity in the period of occurrence and result in lower amortization expense in future periods. The discounted present value of our proved reserves is a major component of the ceiling calculation and represents the component that requires the most subjective judgments. However, the associated prices of oil and natural gas reserves that are included in the discounted present value of the reserves do not require judgment. The ceiling calculation dictates that we use the unweighted arithmetic average price of oil and natural gas as of the first day of each month for the 12-month period ending at the balance sheet date. If average oil and natural gas prices decline, or if we have downward revisions to our estimated proved reserves, it is possible that write downs of our oil and natural gas properties could occur in the future.
If the unweighted arithmetic average price of oil and natural gas as of the first day of each month for the 12-month period ended December 31, 2017 had been 10% lower while all other factors remained constant, our ceiling amount related to our net book value of oil and natural gas properties would have been reduced by approximately $91.8 million and would have generated a full cost ceiling impairment.
70
Future Development Costs
Future development costs include costs incurred to obtain access to proved reserves such as drilling costs and the installation of production equipment. Future abandonment costs include costs to dismantle and relocate or dispose of our production facilities, gathering systems and related structures and restoration costs. We develop estimates of these costs for each of our properties based upon their geographic location, type of production structure, well depth, currently available procedures and ongoing consultations with construction and engineering consultants. Because these costs typically extend many years into the future, estimating these future costs is difficult and requires management to make judgments that are subject to future revisions based upon numerous factors, including changing technology and the political and regulatory environment. We review our assumptions and estimates of future development and future abandonment costs on an annual basis. At December 31, 2017, a five percent increase in future development and abandonment costs would increase the DD&A rate by approximately $0.40 per Boe and a five percent decrease in future development and abandonment costs would decrease the DD&A rate by $0.40 per Boe.
Accounting for Derivative Instruments and Hedging Activities
We account for our derivative activities under the provisions of ASC 815, Derivatives and Hedging (ASC 815). ASC 815 establishes accounting and reporting that every derivative instrument be recorded on the balance sheet as either an asset or liability measured at fair value. From time to time, when derivative contracts are available at terms (or prices) acceptable to us, we may hedge a portion of our forecasted oil, natural gas, and natural gas liquids production. Derivative contracts entered into by us have consisted of transactions in which we hedge the variability of cash flow related to a forecasted transaction. We elected to not designate any of our positions for hedge accounting. Accordingly, we record the net change in the mark-to-market valuation of these positions, as well as payments and receipts on settled contracts, in "Net gain (loss) on derivative contracts" on the consolidated statements of operations.
Income Taxes
Our provision for taxes includes both state and federal taxes. We account for income taxes using the asset and liability method wherein deferred tax assets and liabilities are recognized for the future tax consequences attributable to differences between financial statement carrying amounts of existing assets and liabilities and their respective tax basis. Deferred tax assets and liabilities are measured using enacted tax rates expected to apply to taxable income in the years in which temporary differences are expected to be recovered or settled. Deferred tax assets are reduced by a valuation allowance if it is more likely than not that some portion or all of the deferred tax assets will not be realized. We classify all deferred tax assets and liabilities, along with any related valuation allowance, as noncurrent on the consolidated balance sheets.
In assessing the need for a valuation allowance on our deferred tax assets, we consider possible sources of taxable income that may be available to realize the benefit of deferred tax assets, including projected future taxable income, the reversal of existing temporary differences, taxable income in carryback years and available tax planning strategies. We consider all available evidence (both positive and negative) in determining whether a valuation allowance is required. A significant item of objective negative evidence considered was the cumulative book loss over the three-year period ended December 31, 2017 driven primarily by the full cost ceiling impairments over that period which limits the ability to consider other subjective evidence such as the Company's anticipated future growth. Based upon the evaluation of the available evidence we recorded a decrease of $392.8 million to our valuation allowance resulting in a valuation allowance of $426.8 million being applied against our deferred tax assets as of December 31, 2017.
71
We follow ASC 740, Income Taxes (ASC 740). ASC 740 creates a single model to address accounting for the uncertainty in income tax positions and prescribes a minimum recognition threshold a tax position must meet before recognition in the financial statements. We apply significant judgment in evaluating our tax positions and estimating our provision for income taxes. During the ordinary course of business, there are many transactions and calculations for which the ultimate tax determination is uncertain. The actual outcome of these future tax consequences could differ significantly from these estimates, which could impact our financial position, results of operations and cash flows. The evaluation of a tax position in accordance with ASC 740 is a two-step process. The first step is a recognition process to determine whether it is more likely than not that a tax position will be sustained upon examination, including resolution of any related appeals or litigation processes, based on the technical merits of the position. In evaluating whether a tax position has met the more likely than not recognition threshold, it is presumed that the position will be examined by the appropriate taxing authority with full knowledge of all relevant information. The second step is a measurement process whereby a tax position that meets the more likely than not recognition threshold is calculated to determine the amount of benefit/expense to recognize in the financial statements. The tax position is measured at the largest amount of benefit/expense that is more likely than not of being realized upon ultimate settlement.
72
Comparison of Results of Operations
Year Ended December 31, 2017 Compared to Year Ended December 31, 2016
The table included below sets forth financial information for the periods presented. The period of September 10, 2016 through December 31, 2016 and the period of January 1, 2016 through September 9, 2016 are distinct reporting periods as a result of our application of fresh-start accounting upon our emergence from chapter 11 bankruptcy on September 9, 2016 and are not comparable to prior periods. Refer to the paragraphs following the table below for a discussion around our results of operations.
| |
Successor | |
Predecessor | |||||||||
|---|---|---|---|---|---|---|---|---|---|---|---|---|
In thousands (except per unit and per Boe amounts)
|
Year Ended December 31, 2017 |
Period from September 10, 2016 through December 31, 2016 |
|
Period from January 1, 2016 through September 9, 2016 |
||||||||
Net income (loss) |
$ | 535,686 | $ | (479,193 | ) | $ | 11,958 | |||||
Operating revenues: |
||||||||||||
Oil |
340,674 | 139,786 | 248,064 | |||||||||
Natural gas |
16,194 | 6,756 | 9,511 | |||||||||
Natural gas liquids |
18,969 | 6,018 | 7,929 | |||||||||
Other |
2,128 | 802 | 1,339 | |||||||||
Operating expenses: |
||||||||||||
Production: |
||||||||||||
Lease operating |
61,743 | 22,382 | 50,032 | |||||||||
Workover and other |
21,739 | 10,510 | 22,507 | |||||||||
Taxes other than income |
30,757 | 12,364 | 24,453 | |||||||||
Gathering and other |
40,783 | 14,677 | 29,279 | |||||||||
Restructuring |
7,535 | — | 5,168 | |||||||||
General and administrative: |
||||||||||||
General and administrative |
74,594 | 19,876 | 78,765 | |||||||||
Stock-based compensation |
36,757 | 21,519 | 4,876 | |||||||||
Depletion, depreciation and accretion: |
||||||||||||
Depletion—Full cost |
104,306 | 45,204 | 114,775 | |||||||||
Depreciation—Other |
4,595 | 1,108 | 4,366 | |||||||||
Accretion expense |
1,306 | 587 | 1,414 | |||||||||
Full cost ceiling impairment |
— | 420,934 | 754,769 | |||||||||
(Gain) loss on sale of oil and natural gas properties |
(721,573 | ) | — | — | ||||||||
Other operating property and equipment impairment |
— | — | 28,056 | |||||||||
Other income (expenses): |
||||||||||||
Net gain (loss) on derivative contracts |
1,291 | (27,740 | ) | (17,998 | ) | |||||||
Interest expense and other, net |
(71,097 | ) | (28,861 | ) | (122,249 | ) | ||||||
Reorganization items |
— | (2,049 | ) | 913,722 | ||||||||
Gain (loss) on extinguishment of debt |
(114,931 | ) | — | 81,434 | ||||||||
Income tax benefit (provision) |
5,000 | (4,744 | ) | 8,666 | ||||||||
Production: |
||||||||||||
Crude oil—MBbls |
7,511 | 3,250 | 7,118 | |||||||||
Natural gas—MMcf |
7,439 | 3,011 | 6,560 | |||||||||
Natural gas liquids—MBbls |
1,249 | 501 | 1,096 | |||||||||
Total MBoe(1) |
10,000 | 4,253 | 9,307 | |||||||||
Average daily production—Boe(1) |
27,397 | 37,637 | 36,787 | |||||||||
Average price per unit(2): |
||||||||||||
Crude oil price—Bbl |
$ | 45.36 | $ | 43.01 | $ | 34.85 | ||||||
Natural gas price—Mcf |
2.18 | 2.24 | 1.45 | |||||||||
Natural gas liquids price—Bbl |
15.19 | 12.01 | 7.23 | |||||||||
Total per Boe(1) |
37.58 | 35.87 | 28.53 | |||||||||
Average cost per Boe: |
||||||||||||
Production: |
||||||||||||
Lease operating |
$ | 6.17 | $ | 5.26 | $ | 5.38 | ||||||
Workover and other |
2.17 | 2.47 | 2.42 | |||||||||
Taxes other than income |
3.08 | 2.91 | 2.63 | |||||||||
Gathering and other |
4.08 | 3.45 | 3.15 | |||||||||
Restructuring |
0.75 | — | 0.56 | |||||||||
General and administrative: |
||||||||||||
General and administrative |
7.46 | 4.67 | 8.46 | |||||||||
Stock-based compensation |
3.68 | 5.06 | 0.52 | |||||||||
Depletion |
10.43 | 10.63 | 12.33 | |||||||||
- (1)
- Natural gas reserves are converted to oil reserves using a ratio of six Mcf to one Bbl of oil. This ratio does not assume price
equivalency and, given price differentials, the price for a barrel of oil equivalent for natural gas may differ significantly from the price for a barrel of
oil.
- (2)
- Amounts exclude the impact of cash paid/received on settled contracts as we did not elect to apply hedge accounting.
73
Oil, natural gas and natural gas liquids revenues were $375.8 million, $152.6 million and $265.5 million for the year ended December 31, 2017, the period of September 10, 2016 through December 31, 2016 and the period of January 1, 2016 through September 9, 2016, respectively. Our average daily oil and natural gas production decreased in 2017 when compared to the prior year due to our divestitures during 2017. This decrease was partially mitigated by the production associated with our assets located in the Hackberry Draw and Monument Draw areas of the Delaware Basin and our drilling activities since acquiring the assets. For the year ended December 31, 2017, production averaged 27,397 Boe/d. During the period of September 10, 2016 through December 31, 2016 and the period of January 1, 2016 through September 9, 2016, production averaged 37,637 Boe/d and 36,787 Boe/d, respectively. Average realized prices (excluding the effects of hedging arrangements) were $37.58 per Boe, $35.87 per Boe and $28.53 per Boe for the year ended December 31, 2017, the period of September 10, 2016 through December 31, 2016 and the period of January 1, 2016 through September 9, 2016, respectively. Oil and natural gas prices are inherently volatile and have decreased significantly since mid-year 2014 with modest increases in 2017.
Lease operating expenses were $61.7 million, $22.4 million and $50.0 million for the year ended December 31, 2017, the period of September 10, 2016 through December 31, 2016 and the period of January 1, 2016 through September 9, 2016, respectively. On a per Boe basis, lease operating expenses were $6.17 per Boe, $5.26 per Boe and $5.38 per Boe for the year ended December 31, 2017, the period of September 10, 2016 through December 31, 2016 and the period of January 1, 2016 through September 9, 2016, respectively. The increase in lease operating expense per Boe from 2016 levels is primarily due to reduction in our average daily production as we divested our Bakken/Three Forks assets and acquired assets in the Delaware Basin.
Workover and other expenses were $21.7 million, $10.5 million and $22.5 million for the year ended December 31, 2017, the period of September 10, 2016 through December 31, 2016 and the period of January 1, 2016 through September 9, 2016, respectively. On a per Boe basis, workover and other expenses were $2.17 per Boe, $2.47 per Boe and $2.42 per Boe for the year ended December 31, 2017, the period of September 10, 2016 through December 31, 2016 and the period of January 1, 2016 through September 9, 2016, respectively. The decreased costs per Boe in 2017 relate to our divestiture of the Williston Basin Assets. In the past, we primarily incurred workover expenses in our Bakken/Three Forks area, specifically costs spent to restore production on wells.
Taxes other than income were $30.8 million, $12.4 million and $24.5 million for the year ended December 31, 2017, the period of September 10, 2016 through December 31, 2016 and the period of January 1, 2016 through September 9, 2016, respectively. On a per Boe basis, taxes other than income were $3.08 per Boe, $2.91 per Boe and $2.63 per Boe for year ended December 31, 2017, the period of September 10, 2016 through December 31, 2016 and the period of January 1, 2016 through September 9, 2016, respectively. Most production taxes are based on realized prices at the wellhead. As revenues or volumes from oil and natural gas sales increase or decrease, production taxes on these sales also increase or decrease.
Gathering and other expenses were $40.8 million, $14.7 million and $29.3 million for the year ended December 31, 2017, the period of September 10, 2016 through December 31, 2016 and the period of January 1, 2016 through September 9, 2016, respectively. Gathering and other expenses include gathering fees paid on our oil and natural gas production as well as rig termination or stacking charges incurred. Approximately $26.3 million, $10.7 million and $19.8 million for the year ended December 31, 2017, the period of September 10, 2016 through December 31, 2016 and the period of January 1, 2016 through September 9, 2016, respectively, relate to gathering and other fees paid on our oil and natural gas production. Also included are $6.8 million, $3.7 million and $8.6 million of rig stacking or termination charges for the year ended December 31, 2017, the period of September 10, 2016 through December 31, 2016 and the period of January 1, 2016 through September 9, 2016, respectively.
74
Restructuring expense was $7.5 million for the year ended December 31, 2017. During 2017, we incurred severance costs and accelerated stock-based compensation expense related to the termination of certain employees in conjunction with our divestitures. Restructuring expense for the period of January 1, 2016 through September 9, 2016 was $5.2 million, which related to severance costs and accelerated stock-based compensation expense incurred due to reductions in our workforce, as we decreased our drilling and developmental activities in response to low commodity prices.
General and administrative expense was $74.6 million, $19.9 million and $78.8 million for the year ended December 31, 2017, the period of September 10, 2016 through September 30, 2016 and the period of January 1, 2016 through September 9, 2016, respectively. General and administrative expense in 2016 included fees associated with the effort to restructure our indebtedness, costs associated with key employee retention agreements and settlements of disputes with lease brokers and warrant holders. The decrease from 2016 is also a result of a reduction in our workforce and office lease expenses. On a per unit basis, general and administrative expenses were $7.46 per Boe, $4.67 per Boe and $8.46 per Boe for the year ended December 31, 2017, the period of September 10, 2016 through September 30, 2016 and the period of January 1, 2016 through September 9, 2016, respectively.
Stock-based compensation expense was $36.8 million, $21.5 million and $4.9 million, for the year ended December 31, 2017, the period of September 10, 2016 through December 31, 2016 and the period of January 1, 2016 through September 9, 2016, respectively. Stock-based compensation expense increased from the Predecessor period due to equity awards made since our emergence from reorganization under chapter 11.
Depletion for oil and natural gas properties is calculated using the unit of production method, which depletes the capitalized costs of evaluated properties plus future development costs based on the ratio of production for the current period to total reserve volumes of evaluated properties as of the beginning of the period. On a per unit basis, depletion expense was $10.43 per Boe, $10.63 per Boe and $12.33 per Boe, for the year ended December 31, 2017, the period of September 10, 2016 through December 31, 2016 and the period of January 1, 2016 through September 9, 2016, respectively. The decrease in depletion expense and the depletion rate per Boe from 2016 levels is attributable to decreases in the amortizable base due to our full cost ceiling test impairments recorded in 2016.
We utilize the full cost method of accounting to account for our oil and natural gas exploration and development activities. Under this method of accounting, we are required on a quarterly basis to determine whether the book value of our oil and natural gas properties (excluding unevaluated properties) is less than or equal to the "ceiling", based upon the expected after tax present value (discounted at 10%) of the future net cash flows from our proved reserves. Any excess of the net book value of our oil and natural gas properties over the ceiling must be recognized as a non-cash impairment expense. During 2016, the net book value of our oil and gas properties at March 31, June 30, and September 30, 2016 exceeded the respective ceiling amounts for each period. We recorded a full cost ceiling test impairment before income taxes of $420.9 million for the period of September 10, 2016 through September 30, 2016. The impairment at September 30, 2016 primarily reflects the pricing differences between the first-day-of-the-month average price for the preceding twelve months required by Regulation S-X, Rule 4-10 and ASC 932 used in calculating the ceiling test and the forward-looking prices required by ASC 852 to estimate the fair value of the Company's oil and natural gas properties on the fresh-start reporting date, September 9, 2016. We recorded full cost ceiling test impairments before income taxes totaling $754.8 million for the period January 1, 2016 through September 9, 2016. The ceiling test impairments were driven by decreases in the first-day-of-the-month average prices for crude oil used in the ceiling test calculations since December 31, 2015. Changes in commodity prices, production rates, levels of reserves, future development costs, transfers of unevaluated properties to our full cost pool, capital spending and other factors will determine our actual ceiling test calculation and impairment analyses in future periods.
75
Under the full cost method of accounting, sales of oil and gas properties are accounted for as adjustments of capitalized costs with no gain or loss recognized, unless the adjustment significantly alters the relationship between capitalized costs and proved reserves. If the Williston and El Halcón Divestitures were accounted for as adjustments of capitalized costs with no gain or loss recognized, the adjustments would have significantly altered the relationship between capitalized costs and proved reserves at the time of each of the transactions. Accordingly, we recognized a gain on the sale of the Williston Assets of $485.9 million and a gain on the sale of the El Halcón Assets of $235.7 million for the year ended December 31, 2017. The carrying value of the properties sold was determined by allocating total capitalized costs within the full cost pool between properties sold and properties retained based on their relative fair values.
We review our gas gathering systems and equipment and other operating assets for impairment in accordance with ASC 360. For the period of January 1, 2016 through September 9, 2016, we recorded a non-cash impairment charge of $28.1 million. The impairment relates to our gross investments of $32.8 million in gas gathering infrastructure that were not likely to be economically recoverable due to our shift in exploration, drilling and developmental plans to our most economic areas as a result of the low commodity price environment.
We enter into derivative commodity instruments to economically hedge our exposure to price fluctuations on our anticipated oil and natural gas production. Consistent with prior years, we have elected not to designate any positions as cash flow hedges for accounting purposes, and accordingly, we recorded the net change in the mark-to-market value of these derivative contracts in the consolidated statements of operations. At December 31, 2017, we had a $0.7 million derivative asset, all of which was classified as current, and we had a $27.0 million derivative liability, $19.2 million of which was classified as current. We recorded a net derivative gain of $1.3 million ($16.5 million net unrealized loss and $17.8 million net realized gain on settled contracts) for the year ended December 31, 2017, compared to a net derivative loss of $27.7 million ($112.4 million net unrealized loss and $84.7 million net realized gain on settled contracts) and $18.0 million ($263.7 million net unrealized loss and $245.7 million net realized gain on settled contracts) for the period of September 10, 2016 through December 31, 2016 and for the period of January 1, 2016 through September 9, 2016, respectively.
Interest expense and other was $71.1 million, $28.9 million and $122.2 million for the year ended December 31, 2017, the period of September 10, 2016 through December 31, 2016 and the period of January 1, 2016 through September 9, 2016, respectively. Capitalized interest for the period of January 1, 2016 through September 9, 2016 was $68.2 million. The Successor Company's accounting policy on the capitalization of interest establishes thresholds for the determination of a development project for the purpose of interest capitalization. The decrease in interest expense from our Predecessor period was primarily due to the discontinuance of interest expense on our senior notes that were cancelled as part of our chapter 11 bankruptcy proceedings.
Reorganization items represent (i) expenses or income incurred subsequent to July 27, 2016 (when we filed voluntary petitions for relief under chapter 11) as a direct result of the reorganization Plan,
76
(ii) gains or losses from liabilities settled, and (iii) fresh-start accounting adjustments. The following table summarizes the net reorganization items (in thousands):
| |
Successor |
|
Predecessor | ||||||
|---|---|---|---|---|---|---|---|---|---|
| |
Period from September 10, 2016 through December 31, 2016 |
|
Period from January 1, 2016 through September 9, 2016 |
||||||
| |
|
||||||||
| |
|
||||||||
| |
|
||||||||
Gain on settlement of Liabilities subject to compromise |
$ | — | $ | 1,368,908 | |||||
Fresh-start adjustments |
— | (392,232 | ) | ||||||
Reorganization professional fees and other |
(2,049 | ) | (30,287 | ) | |||||
Write-off debt discounts/premiums and debt issuance costs |
— | (32,667 | ) | ||||||
| | | | | | | | | | |
Gain (loss) on reorganization items |
$ | (2,049 | ) | $ | 913,722 | ||||
| | | | | | | | | | |
| | | | | | | | | | |
| | | | | | | | | | |
During the year ended December 31, 2017, we incurred a loss of approximately $115.0 million on the extinguishment of debt due to several transactions that redeemed a portion of our long-term debt. The table below denotes the notes redeemed, the reduction of the principal amount of long-term debt, the tender or make whole premium paid, the write-down of associated issuance costs and discount, and the net loss on extinguishment of debt that was recorded for each transaction:
Note Redemption
|
Principal Reduction |
Tender / Make Whole Premium |
Issuance Cost and Discount Writedown |
Net Loss | |||||||||
|---|---|---|---|---|---|---|---|---|---|---|---|---|---|
| |
(In millions) |
||||||||||||
2025 Notes |
$ | 425.0 | $ | 12.8 | $ | 16.1 | $ | 28.9 | |||||
2022 Second Lien Notes |
112.8 | 23.0 | 6.2 | 29.2 | |||||||||
2020 Second Lien Notes |
700.0 | 30.9 | 26.0 | 56.9 | |||||||||
| | | | | | | | | | | | | | |
|
$ | 1,237.8 | $ | 66.7 | $ | 48.3 | $ | 115.0 | |||||
| | | | | | | | | | | | | | |
| | | | | | | | | | | | | | |
| | | | | | | | | | | | | | |
During the first three months of 2016, we repurchased approximately $91.8 million principal amount of our then outstanding senior unsecured notes for cash at prevailing market prices at the time of the transactions. The net cash used to make these repurchases was approximately $9.7 million. Upon settlement of the repurchases, we paid all accrued and unpaid interest since the respective interest payment dates of the notes repurchased and we recorded a net gain on the extinguishment of debt of approximately $81.4 million, which included the write-down of $0.7 million associated with related issuance costs and discounts and premiums for the respective notes.
We recorded an income tax benefit of $5.0 million for the year ended December 31, 2017, resulting from the reversal of the $5.0 million alternative minimum tax liability recorded in 2016. We recorded an income tax provision of $4.7 million for the period of September 10, 2016 through December 31, 2016 and an income tax benefit of $8.7 million for the period January 1, 2016 through September 9, 2016 relating to our estimated 2016 alternative minimum tax liability and the reversal of the Predecessor estimated 2015 alternative minimum tax liability, respectively.
77
Year Ended December 31, 2016 Compared to Year Ended December 31, 2015
The table included below sets forth financial information for the periods presented. The period of September 10, 2016 through December 31, 2016 and the period of January 1, 2016 through September 9, 2016 are distinct reporting periods as a result of our application of fresh-start accounting upon our emergence from chapter 11 bankruptcy on September 9, 2016 and are not comparable to prior periods. Refer to the paragraphs following the table below for a discussion around our results of operations.
| |
Successor |
|
Predecessor | |||||||||
|---|---|---|---|---|---|---|---|---|---|---|---|---|
| |
Period from September 10, 2016 through December 31, 2016 |
|
Period from January 1, 2016 through September 9, 2016 |
|
||||||||
| |
|
Year Ended December 31, 2015 |
||||||||||
In thousands (except per unit and per Boe amounts)
|
|
|||||||||||
|
|
||||||||||||
Net income (loss) |
$ | (479,193 | ) | $ | 11,958 | $ | (1,922,621 | ) | ||||
Operating revenues: |
||||||||||||
Oil |
139,786 | 248,064 | 512,346 | |||||||||
Natural gas |
6,756 | 9,511 | 22,509 | |||||||||
Natural gas liquids |
6,018 | 7,929 | 13,624 | |||||||||
Other |
802 | 1,339 | 1,799 | |||||||||
Operating expenses: |
||||||||||||
Production: |
||||||||||||
Lease operating |
22,382 | 50,032 | 103,590 | |||||||||
Workover and other |
10,510 | 22,507 | 20,862 | |||||||||
Taxes other than income |
12,364 | 24,453 | 48,890 | |||||||||
Gathering and other |
14,677 | 29,279 | 40,281 | |||||||||
Restructuring |
— | 5,168 | 2,886 | |||||||||
General and administrative: |
||||||||||||
General and administrative |
19,876 | 78,765 | 73,237 | |||||||||
Stock-based compensation |
21,519 | 4,876 | 14,529 | |||||||||
Depletion, depreciation and accretion: |
||||||||||||
Depletion—Full cost |
45,204 | 114,775 | 354,344 | |||||||||
Depreciation—Other |
1,108 | 4,366 | 8,063 | |||||||||
Accretion expense |
587 | 1,414 | 1,797 | |||||||||
Full cost ceiling impairment |
420,934 | 754,769 | 2,626,305 | |||||||||
Other operating property and equipment impairment |
— | 28,056 | — | |||||||||
Other income (expenses): |
||||||||||||
Net gain (loss) on derivative contracts |
(27,740 | ) | (17,998 | ) | 310,264 | |||||||
Interest expense and other, net |
(28,861 | ) | (122,249 | ) | (232,878 | ) | ||||||
Reorganization items |
(2,049 | ) | 913,722 | — | ||||||||
Gain (loss) on extinguishment of debt |
— | 81,434 | 761,804 | |||||||||
Gain (loss) on extinguishment of Convertible Note and modification of February 2012 Warrants |
— | — | (8,219 | ) | ||||||||
Income tax benefit (provision) |
(4,744 | ) | 8,666 | (9,086 | ) | |||||||
Production: |
||||||||||||
Crude oil—MBbls |
3,250 | 7,118 | 12,019 | |||||||||
Natural gas—MMcf |
3,011 | 6,560 | 10,123 | |||||||||
Natural gas liquids—MBbls |
501 | 1,096 | 1,457 | |||||||||
Total MBoe(1) |
4,253 | 9,307 | 15,163 | |||||||||
Average daily production—Boe(1) |
37,637 | 36,787 | 41,542 | |||||||||
Average price per unit(2): |
||||||||||||
Crude oil price—Bbl |
$ | 43.01 | $ | 34.85 | $ | 42.63 | ||||||
Natural gas price—Mcf |
2.24 | 1.45 | 2.22 | |||||||||
Natural gas liquids price—Bbl |
12.01 | 7.23 | 9.35 | |||||||||
Total per Boe(1) |
35.87 | 28.53 | 36.17 | |||||||||
Average cost per Boe: |
||||||||||||
Production: |
||||||||||||
Lease operating |
$ | 5.26 | $ | 5.38 | $ | 6.83 | ||||||
Workover and other |
2.47 | 2.42 | 1.38 | |||||||||
Taxes other than income |
2.91 | 2.63 | 3.22 | |||||||||
Gathering and other |
3.45 | 3.15 | 2.66 | |||||||||
Restructuring |
— | 0.56 | 0.19 | |||||||||
General and administrative: |
||||||||||||
General and administrative |
4.67 | 8.46 | 4.83 | |||||||||
Stock-based compensation |
5.06 | 0.52 | 0.96 | |||||||||
Depletion |
10.63 | 12.33 | 23.37 | |||||||||
- (1)
- Natural gas reserves are converted to oil reserves using a ratio of six Mcf to one Bbl of oil. This ratio does not assume price
equivalency and, given price differentials, the price for a barrel of oil equivalent for natural gas may differ significantly from the price for a barrel of
oil.
- (2)
- Amounts exclude the impact of cash paid/received on settled contracts as we did not elect to apply hedge accounting.
78
Oil, natural gas and natural gas liquids revenues were $152.6 million, $265.5 million and $548.5 million for the period of September 10, 2016 through December 31, 2016, the period of January 1, 2016 through September 9, 2016 and the year ended December 31, 2015, respectively. The decrease in revenues year over year was driven by the sustained decline in the prices of crude oil and natural gas along with a decrease in our average daily production. Oil and natural gas prices are inherently volatile and have decreased significantly since mid-year 2014 and have remained relatively low throughout 2016. We curtailed our drilling and shut in some production in 2016 in response to the decline in commodity prices, which resulted in a decrease in our average daily production. During the period of September 10, 2016 through December 31, 2016 and the period of January 1, 2016 through September 9, 2016, production averaged 37,637 Boe/d and 36,787 Boe/d, respectively, compared to average daily production of 41,542 Boe/d during 2015.
Lease operating expenses on a per Boe basis were $5.26 per Boe, $5.38 per Boe and $6.83 per Boe for the period of September 10, 2016 through December 31, 2016, the period of January 1, 2016 through September 9, 2016 and the year ended December 31, 2015, respectively. The decrease in lease operating expense per Boe from 2015 levels is primarily due to price decreases from our vendors in light of the commodity price environment.
Workover and other expenses on a per Boe basis were $2.47 per Boe, $2.42 per Boe and $1.38 per Boe for the period of September 10, 2016 through December 31, 2016, the period of January 1, 2016 through September 9, 2016 and the year ended December 31, 2015, respectively. The increased costs per Boe in 2016 relate primarily to workovers in our Bakken/Three Forks area, specifically costs spent to restore production on wells.
Taxes other than income on a per Boe basis were $2.91 per Boe, $2.63 per Boe and $3.22 per Boe for the period of September 10, 2016 through December 31, 2016, the period of January 1, 2016 through September 9, 2016 and the year ended December 31, 2015, respectively. Most production taxes are based on realized prices at the wellhead. As revenues or volumes from oil and natural gas sales increase or decrease, production taxes on these sales also increase or decrease.
Gathering and other expenses on a per Boe basis were $3.45 per Boe, $3.15 per Boe and $2.66 per Boe for the period of September 10, 2016 through December 31, 2016, the period of January 1, 2016 through September 9, 2016 and the year ended December 31, 2015, respectively. Gathering and other expenses include gathering fees paid on our oil and natural gas production as well as rig termination or stacking charges incurred. Throughout 2016 (for the Successor and Predecessor periods combined), we stacked two rigs in response to the sustained decline in commodity prices, whereas in 2015, we stacked only one rig.
In 2016, we had reductions in our workforce due to the decrease in our drilling and developmental activities planned for the year. For the period of January 1, 2016 through September 9, 2016, we incurred $5.2 million in severance costs and accelerated stock-based compensation expense related to reductions in our workforce recorded in "Restructuring" on the consolidated statements of operations. For the year ended December 31, 2015, in conjunction with our divestitures of certain non-core properties, we incurred approximately $2.9 million in severance costs and accelerated stock-based compensation expense related to the termination of certain employees in these non-core areas.
General and administrative expense was $19.9 million, $78.8 million and $73.2 million, for the period of September 10, 2016 through December 31, 2016, the period of January 1, 2016 through September 9, 2016 and the year ended December 31, 2015, respectively. General and administrative expenses increased from 2015 levels due to costs incurred in connection with efforts to restructure our indebtedness.
Stock-based compensation expense was $21.5 million, $4.9 million and $14.5 million, for the period of September 10, 2016 through December 31, 2016, the period of January 1, 2016 through
79
September 9, 2016 and the year ended December 31, 2015, respectively. Stock-based compensation expense decreased in the Predecessor periods due to a reduction in our workforce and increased in the Successor period due to equity awards made in conjunction with our emergence from chapter 11 bankruptcy. A portion of these awards vested immediately on the day of the grant.
Depletion for oil and natural gas properties is calculated using the unit of production method, which depletes the capitalized costs of evaluated properties plus future development costs based on the ratio of production for the current period to total reserve volumes of evaluated properties as of the beginning of the period. On a per unit basis, depletion expense was $10.63 per Boe, $12.33 per Boe and $23.37 per Boe, for the period of September 10, 2016 through December 31, 2016, the period of January 1, 2016 through September 9, 2016 and the year ended December 31, 2015, respectively. The decrease in depletion expense and the depletion rate per Boe from 2015 levels is attributable to decreases in the amortizable base due to our full cost ceiling test impairments.
We utilize the full cost method of accounting to account for our oil and natural gas exploration and development activities. Under this method of accounting, we are required on a quarterly basis to determine whether the book value of our oil and natural gas properties (excluding unevaluated properties) is less than or equal to the "ceiling", based upon the expected after tax present value (discounted at 10%) of the future net cash flows from our proved reserves. Any excess of the net book value of our oil and natural gas properties over the ceiling must be recognized as a non-cash impairment expense. During 2016, the net book value of our oil and gas properties at March 31, June 30, and September 30, 2016 exceeded the respective ceiling amounts for each period. We recorded a full cost ceiling test impairment before income taxes of $420.9 million for the period of September 10, 2016 through September 30, 2016. The impairment at September 30, 2016 primarily reflects the pricing differences between the first-day-of-the-month average price for the preceding twelve months required by Regulation S-X, Rule 4-10 and ASC 932 used in calculating the ceiling test and the forward-looking prices required by ASC 852 to estimate the fair value of the Company's oil and natural gas properties on the fresh-start reporting date, September 9, 2016. We recorded full cost ceiling test impairments before income taxes totaling $754.8 million for the period January 1, 2016 through September 9, 2016. The ceiling test impairments were driven by decreases in the first-day-of-the-month average prices for crude oil used in the ceiling test calculations since December 31, 2015. We recorded full cost ceiling test impairments before income taxes totaling $2.6 billion for the year ended December 31, 2015. The ceiling test impairments in 2015 were driven by decreases in the first-day-of-the-month average prices for crude oil used in the ceiling test calculations since December 31, 2014. Changes in commodity prices, production rates, levels of reserves, future development costs, transfers of unevaluated properties to our full cost pool, capital spending and other factors will determine our actual ceiling test calculation and impairment analyses in future periods. See "Overview" for a discussion of potential future ceiling impairments in an environment of sustained lower commodity prices.
We review our gas gathering systems and equipment and other operating assets for impairment in accordance with ASC 360. For the period of January 1, 2016 through September 9, 2016, we recorded a non-cash impairment charge of $28.1 million. The impairment relates to our gross investments of $32.8 million in gas gathering infrastructure that will not likely be economically recoverable due to our shift in exploration, drilling and developmental plans to our most economic areas as a result of the low commodity price environment.
We enter into derivative commodity instruments to economically hedge our exposure to price fluctuations on our anticipated oil and natural gas production. Consistent with prior years, we have elected not to designate any positions as cash flow hedges for accounting purposes, and accordingly, we recorded the net change in the mark-to-market value of these derivative contracts in the consolidated statements of operations. At December 31, 2016, we had a $5.9 million derivative asset, $5.9 million of which was classified as current, and we had a $16.9 million derivative liability, $16.4 million of which
80
was classified as current. We recorded a net derivative loss of $27.7 million ($112.4 million net unrealized loss and $84.7 million net realized gain on settled contracts) and $18.0 million ($263.7 million net unrealized loss and $245.7 million net realized gain on settled contracts) for the period of September 10, 2016 through December 31, 2016 and for the period of January 1, 2016 through September 9, 2016, respectively, compared to a net derivative gain of $310.3 million ($129.2 million net unrealized loss offset by a $439.5 million net realized gain on settled contracts) for the year ended December 31, 2015.
Interest expense and other was $28.9 million, $122.2 million and $232.9 million for the period of September 10, 2016 through December 31, 2016, the period of January 1, 2016 through September 9, 2016 and the year ended December 31, 2015, respectively. Capitalized interest for the period of January 1, 2016 through September 9, 2016 and the year ended December 31, 2015 was $68.2 million and $113.0 million, respectively. The Successor Company's accounting policy on the capitalization of interest establishes thresholds for the determination of a development project for the purpose of interest capitalization. Gross interest expense was $28.6 million, $195.7 million and $337.6 million for the period of September 10, 2016 through December 31, 2016, the period of January 1, 2016 through September 9, 2016 and the year ended December 31, 2015, respectively. The decrease in gross interest expense from 2015 levels was primarily due to the discontinuance of interest expense on our senior notes that were cancelled as part of our chapter 11 bankruptcy proceedings.
Reorganization items represent (i) expenses or income incurred subsequent to July 27, 2016 (when we filed voluntary petitions for relief under chapter 11) as a direct result of the reorganization Plan, (ii) gains or losses from liabilities settled, and (iii) fresh-start accounting adjustments and are recorded in "Reorganization items" in the consolidated statements of operations. The following table summarizes the net reorganization items (in thousands):
| |
Successor |
|
Predecessor | ||||||
|---|---|---|---|---|---|---|---|---|---|
| |
Period from September 10, 2016 through December 31, 2016 |
|
Period from January 1, 2016 through September 9, 2016 |
||||||
| |
|
||||||||
| |
|
||||||||
| |
|
||||||||
Gain on settlement of Liabilities subject to compromise |
$ | — | $ | 1,368,908 | |||||
Fresh-start adjustments |
— | (392,232 | ) | ||||||
Reorganization professional fees and other |
(2,049 | ) | (30,287 | ) | |||||
Write-off debt discounts/premiums and debt issuance costs |
— | (32,667 | ) | ||||||
| | | | | | | | | | |
Gain (loss) on reorganization items |
$ | (2,049 | ) | $ | 913,722 | ||||
| | | | | | | | | | |
| | | | | | | | | | |
| | | | | | | | | | |
During the three months ended March 31, 2016, we repurchased approximately $91.8 million principal amount of our senior unsecured notes, consisting of $24.5 million principal amount of our 9.75% senior notes due 2020, $51.8 million principal amount of our 8.875% senior notes due 2021, and $15.5 million principal amount of our 9.25% senior notes due 2022 for cash at prevailing market prices at the time of the transactions. The net cash used to make these repurchases was approximately $9.7 million. Upon settlement of the repurchases, we paid all accrued and unpaid interest since the respective interest payment dates of the notes repurchased and we recorded a net gain on the extinguishment of debt of approximately $81.4 million, which included the write-down of $0.7 million associated with related issuance costs and discounts and premiums for the respective notes. During the year ended December 31, 2015, we entered into several transactions intended to reduce our long-term debt. The table below denotes the transaction description, the reduction of the principal amount of
81
long-term debt, the write-down of associated issuance costs and discounts and premiums, and the net gain on extinguishment of debt that was recorded for each transaction:
Transaction Description
|
Principal Reduction |
Common Stock Issuance |
Issuance Cost and Discount / Premium Write-down |
Net (Gain) | |||||||||
|---|---|---|---|---|---|---|---|---|---|---|---|---|---|
| |
(In millions) |
||||||||||||
Unsecured Notes Exchanged for Common Stock |
$ | (258.0 | ) | $ | 231.4 | $ | (3.8 | ) | $ | (22.8 | ) | ||
Unsecured Notes Exchanged for Secured Third Lien Notes |
(548.2 | ) | — | (13.1 | ) | (535.1 | ) | ||||||
Repurchases of Unsecured Notes |
(29.7 | ) | — | (0.3 | ) | (29.4 | ) | ||||||
Unsecured Notes Exchanged for Secured Second Lien Notes |
(176.7 | ) | — | (2.2 | ) | (174.5 | ) | ||||||
| | | | | | | | | | | | | | |
|
$ | (1,012.6 | ) | $ | 231.4 | $ | (19.4 | ) | $ | (761.8 | ) | ||
| | | | | | | | | | | | | | |
| | | | | | | | | | | | | | |
| | | | | | | | | | | | | | |
During the year ended December 31, 2015, we entered into an amendment to our Convertible Note and to the February 2012 Warrants, in which we recorded a net gain on the extinguishment of the Convertible Note of $5.9 million and a net loss on the modification of the February 2012 Warrants of $14.1 million.
We recorded an income tax provision of $4.7 million for the period of September 10, 2016 through December 31, 2016 and an income tax benefit of $8.7 million for the period January 1, 2016 through September 9, 2016 relating to our estimated 2016 alternative minimum tax liability and the reversal of the Predecessor estimated 2015 alternative minimum tax liability, respectively. We recorded an income tax provision of $9.1 million on a loss before income taxes of $1.9 billion for the year ended December 31, 2015, related to projected alternative minimum tax.
Recently Issued Accounting Pronouncements
We discuss recently adopted and issued accounting standards in Item 8. Consolidated Financial Statements and Supplementary Data—Note 1, "Summary of Significant Events and Accounting Policies."
ITEM 7A. QUANTITATIVE AND QUALITATIVE DISCLOSURES ABOUT MARKET RISK
Derivative Instruments and Hedging Activity
We are exposed to various risks including energy commodity price risk. When oil, natural gas, and natural gas liquids prices decline significantly our ability to finance our capital budget and operations may be adversely impacted. We expect energy prices to remain volatile and unpredictable, therefore we have designed a risk management policy which provides for the use of derivative instruments to provide partial protection against declines in oil and natural gas prices by reducing the risk of price volatility and the affect it could have on our operations. The types of derivative instruments that we typically utilize include costless collars and swaps. The total volumes which we hedge through the use of our derivative instruments varies from period to period, however, generally our objective is to hedge approximately 70% to 80% of our current and anticipated production for the next 18 to 24 months, when derivative contracts are available at terms (or prices) acceptable to us. Our hedge policies and objectives may change significantly as our operational profile changes and/or commodities prices change. We do not enter into derivative contracts for speculative trading purposes.
We are exposed to market risk on our open derivative contracts related to potential non-performance by our counterparties. It is our policy to enter into derivative contracts only with counterparties that are creditworthy institutions deemed by management as competent and competitive
82
market makers. We did not post collateral under any of these contracts as they are secured under our Senior Credit Agreement or are uncollateralized trades.
We account for our derivative activities under the provisions of ASC 815, Derivatives and Hedging, (ASC 815). ASC 815 establishes accounting and reporting that every derivative instrument be recorded on the balance sheet as either an asset or liability measured at fair value.
See Item 8. Consolidated Financial Statements and Supplementary Data—Note 9, "Derivative and Hedging Activities," for more details.
Fair Market Value of Financial Instruments
The estimated fair values for financial instruments under ASC 825, Financial Instruments, (ASC 825) are determined at discrete points in time based on relevant market information. These estimates involve uncertainties and cannot be determined with precision. The estimated fair value of cash, cash equivalents, accounts receivable and accounts payable approximates their carrying value due to their short-term nature. See Item 8. Consolidated Financial Statements and Supplementary Data—Note 8, "Fair Value Measurements," for additional information.
Interest Rate Sensitivity
Historically, we have been exposed to interest rate risk exposure primarily from fluctuations in short-term rates, which are LIBOR and ABR based. These fluctuations can cause reductions of earnings or cash flows due to increases in the interest rates that we have historically paid on these obligations. At December 31, 2017, the principal amount of our debt was approximately $425.0 million which bears interest at a weighted average fixed interest rate of 6.75% per year. At December 31, 2017, we did not have any amounts drawn under our Senior Credit Agreement. Therefore, we do not currently have any long-term debt that bears interest at floating and variable interest rates. If we incur future indebtedness which bears interest at variable rates, fluctuations in market interest rates could cause our annual interest costs to fluctuate.
83
ITEM 8. CONSOLIDATED FINANCIAL STATEMENTS AND SUPPLEMENTARY DATA
INDEX TO CONSOLIDATED FINANCIAL STATEMENTS
84
MANAGEMENT'S REPORT ON INTERNAL CONTROL OVER FINANCIAL REPORTING
Management of Halcón Resources Corporation (the Company), including the Company's Chief Executive Officer and Chief Financial Officer, is responsible for establishing and maintaining adequate internal control over financial reporting for the Company. The Company's internal control system was designed to provide reasonable assurance to the Company's Management and Board of Directors regarding the preparation and fair presentation of published financial statements. Because of its inherent limitations, internal control over financial reporting may not prevent or detect misstatements. Also, projections of any evaluation of effectiveness to future periods are subject to the risk that controls may become inadequate because of changes in conditions, or that the degree of compliance with the policies or procedures may deteriorate.
Management conducted an evaluation of the effectiveness of internal control over financial reporting based on the Internal Control—Integrated Framework issued by the Committee of Sponsoring Organizations of the Treadway Commission in 2013. Based on this evaluation, management concluded that Halcón Resources Corporation's internal control over financial reporting was effective as of December 31, 2017.
Deloitte & Touche LLP, the Company's independent registered public accounting firm, has issued an attestation report on the effectiveness of the Company's internal control over financial reporting as of December 31, 2017 which is included herein.
| |
|
|
|---|---|---|
| /s/ FLOYD C. WILSON Floyd C. Wilson Chairman of the Board, Chief Executive Officer and President |
/s/ MARK J. MIZE Mark J. Mize Executive Vice President, Chief Financial Officer and Treasurer |
Houston,
Texas
February 28, 2018
85
REPORT OF INDEPENDENT REGISTERED PUBLIC ACCOUNTING FIRM
To
the Stockholders and the Board of Directors of
Halcón Resources Corporation
Houston, Texas
Opinion on Internal Control over Financial Reporting
We have audited the internal control over financial reporting of Halcón Resources Corporation and subsidiaries (the "Company") as of December 31, 2017, based on criteria established in Internal Control—Integrated Framework (2013) issued by the Committee of Sponsoring Organizations of the Treadway Commission (COSO). In our opinion, the Company maintained, in all material respects, effective internal control over financial reporting as of December 31, 2017, based on criteria established in Internal Control—Integrated Framework (2013) issued by COSO.
We have also audited, in accordance with the standards of the Public Company Accounting Oversight Board (United States) (PCAOB), the consolidated financial statements as of and for the year ended December 31, 2017, of the Company and our report dated February 28, 2018, expressed an unqualified opinion on those financial statements.
Basis for Opinion
The Company's management is responsible for maintaining effective internal control over financial reporting and for its assessment of the effectiveness of internal control over financial reporting, included in the accompanying Management's Annual Report on Internal Control over Financial Reporting. Our responsibility is to express an opinion on the Company's internal control over financial reporting based on our audit. We are a public accounting firm registered with the PCAOB and are required to be independent with respect to the Company in accordance with the U.S. federal securities laws and the applicable rules and regulations of the Securities and Exchange Commission and the PCAOB.
We conducted our audit in accordance with the standards of the PCAOB. Those standards require that we plan and perform the audit to obtain reasonable assurance about whether effective internal control over financial reporting was maintained in all material respects. Our audit included obtaining an understanding of internal control over financial reporting, assessing the risk that a material weakness exists, testing and evaluating the design and operating effectiveness of internal control based on the assessed risk, and performing such other procedures as we considered necessary in the circumstances. We believe that our audit provides a reasonable basis for our opinion.
Definition and Limitations of Internal Control over Financial Reporting
A company's internal control over financial reporting is a process designed to provide reasonable assurance regarding the reliability of financial reporting and the preparation of financial statements for external purposes in accordance with generally accepted accounting principles. A company's internal control over financial reporting includes those policies and procedures that (1) pertain to the maintenance of records that, in reasonable detail, accurately and fairly reflect the transactions and dispositions of the assets of the company; (2) provide reasonable assurance that transactions are recorded as necessary to permit preparation of financial statements in accordance with generally accepted accounting principles, and that receipts and expenditures of the company are being made only in accordance with authorizations of management and directors of the company; and (3) provide reasonable assurance regarding prevention or timely detection of unauthorized acquisition, use, or disposition of the company's assets that could have a material effect on the financial statements. Because of its inherent limitations, internal control over financial reporting may not prevent or detect misstatements. Also, projections of any evaluation of effectiveness to future periods are subject to the risk that controls may become inadequate because of changes in conditions, or that the degree of compliance with the policies or procedures may deteriorate.
/s/ DELOITTE & TOUCHE LLP
Houston,
Texas
February 28, 2018
86
REPORT OF INDEPENDENT REGISTERED PUBLIC ACCOUNTING FIRM
To
the Board of Directors and Stockholders of
Halcón Resources Corporation
Houston, Texas
Opinion on the Financial Statements
We have audited the accompanying consolidated balance sheets of Halcón Resources Corporation and subsidiaries (the "Company") as of December 31, 2017 and 2016 (Successor Company balance sheet), the related consolidated statements of operations, stockholders' equity, and cash flows, for the year ended December 31, 2017 and for the period from September 10, 2016 to December 31, 2016 (Successor Company operations), the period of January 1, 2016 to September 9, 2016, and for the year ended December 31, 2015 (Predecessor Company operations), and the related notes (collectively referred to as the "financial statements"). In our opinion, the Successor Company financial statements present fairly, in all material respects, the financial position of the Successor Company as of December 31, 2017 and 2016, and the results of its operations and its cash flows for the year ended December 31, 2017 and for the period from September 10, 2016 to December 31, 2016, in conformity with accounting principles generally accepted in the United States of America. Further, in our opinion, the Predecessor Company financial statements referred to above present fairly, in all material respects, its operations and its cash flows for the period from January 1, 2016 to September 9, 2016 and for the year ended December 31, 2015 in conformity with accounting principles generally accepted in the United States of America.
We have also audited, in accordance with the standards of the Public Company Accounting Oversight Board (United States) (PCAOB), the Company's internal control over financial reporting as of December 31, 2017, based on criteria established in Internal Control—Integrated Framework (2013) issued by the Committee of Sponsoring Organizations of the Treadway Commission and our report dated February 28, 2018, expressed an unqualified opinion on the Company's internal control over financial reporting.
As discussed in Note 3 to the financial statements, on September 8, 2016, the Bankruptcy Court entered an order confirming the plan of reorganization which became effective after the close of business on September 9, 2016. Accordingly, the accompanying financial statements have been prepared in conformity with FASB Accounting Standard Codification 852, Reorganizations, for the Successor Company as a new entity with assets, liabilities, and a capital structure having carrying values not comparable with prior periods as described in Note 3 to the consolidated financial statements.
Basis for Opinion
These financial statements are the responsibility of the Company's management. Our responsibility is to express an opinion on the Company's financial statements based on our audits. We are a public accounting firm registered with the PCAOB and are required to be independent with respect to the Company in accordance with the U.S. federal securities laws and the applicable rules and regulations of the Securities and Exchange Commission and the PCAOB. We conducted our audits in accordance with the standards of the PCAOB. Those standards require that we plan and perform the audit to obtain reasonable assurance about whether the financial statements are free of material misstatement, whether due to error or fraud. Our audits included performing procedures to assess the risks of material misstatement of the financial statements, whether due to error or fraud, and performing procedures that respond to those risks. Such procedures included examining, on a test basis, evidence regarding the amounts and disclosures in the financial statements. Our audits also included evaluating the accounting principles used and significant estimates made by management, as well as evaluating the overall presentation of the financial statements. We believe that our audits provide a reasonable basis for our opinion.
/s/ DELOITTE & TOUCHE LLP
Houston,
Texas
February 28, 2018
We have served as the Company's auditor since 2012.
87
HALCÓN RESOURCES CORPORATION
CONSOLIDATED STATEMENTS OF OPERATIONS
(In thousands, except per share amounts)
| |
Successor |
|
Predecessor | ||||||||||||
|---|---|---|---|---|---|---|---|---|---|---|---|---|---|---|---|
| |
|
||||||||||||||
| |
|
Period from September 10, 2016 through December 31, 2016 |
|
Period from January 1, 2016 through September 9, 2016 |
|
||||||||||
| |
Year Ended December 31, 2017 |
|
Year Ended December 31, 2015 |
||||||||||||
| |
|
||||||||||||||
| |
|
||||||||||||||
Operating revenues: |
|||||||||||||||
Oil, natural gas and natural gas liquids sales: |
|||||||||||||||
Oil |
$ | 340,674 | $ | 139,786 | $ | 248,064 | $ | 512,346 | |||||||
Natural gas |
16,194 | 6,756 | 9,511 | 22,509 | |||||||||||
Natural gas liquids |
18,969 | 6,018 | 7,929 | 13,624 | |||||||||||
| | | | | | | | | | | | | | | | |
Total oil, natural gas and natural gas liquids sales |
375,837 | 152,560 | 265,504 | 548,479 | |||||||||||
Other |
2,128 | 802 | 1,339 | 1,799 | |||||||||||
| | | | | | | | | | | | | | | | |
Total operating revenues |
377,965 | 153,362 | 266,843 | 550,278 | |||||||||||
| | | | | | | | | | | | | | | | |
Operating expenses: |
|||||||||||||||
Production: |
|||||||||||||||
Lease operating |
61,743 | 22,382 | 50,032 | 103,590 | |||||||||||
Workover and other |
21,739 | 10,510 | 22,507 | 20,862 | |||||||||||
Taxes other than income |
30,757 | 12,364 | 24,453 | 48,890 | |||||||||||
Gathering and other |
40,783 | 14,677 | 29,279 | 40,281 | |||||||||||
Restructuring |
7,535 | — | 5,168 | 2,886 | |||||||||||
General and administrative |
111,351 | 41,395 | 83,641 | 87,766 | |||||||||||
Depletion, depreciation and accretion |
110,207 | 46,899 | 120,555 | 364,204 | |||||||||||
Full cost ceiling impairment |
— | 420,934 | 754,769 | 2,626,305 | |||||||||||
(Gain) loss on sale of oil and natural gas properties |
(721,573 | ) | — | — | — | ||||||||||
Other operating property and equipment impairment |
— | — | 28,056 | — | |||||||||||
| | | | | | | | | | | | | | | | |
Total operating expenses |
(337,458 | ) | 569,161 | 1,118,460 | 3,294,784 | ||||||||||
| | | | | | | | | | | | | | | | |
Income (loss) from operations |
715,423 | (415,799 | ) | (851,617 | ) | (2,744,506 | ) | ||||||||
Other income (expenses): |
|||||||||||||||
Net gain (loss) on derivative contracts |
1,291 | (27,740 | ) | (17,998 | ) | 310,264 | |||||||||
Interest expense and other, net |
(71,097 | ) | (28,861 | ) | (122,249 | ) | (232,878 | ) | |||||||
Reorganization items |
— | (2,049 | ) | 913,722 | — | ||||||||||
Gain (loss) on extinguishment of debt |
(114,931 | ) | — | 81,434 | 761,804 | ||||||||||
Gain (loss) on extinguishment of Convertible Note and modification of February 2012 Warrants |
— | — | — | (8,219 | ) | ||||||||||
| | | | | | | | | | | | | | | | |
Total other income (expenses) |
(184,737 | ) | (58,650 | ) | 854,909 | 830,971 | |||||||||
| | | | | | | | | | | | | | | | |
Income (loss) before income taxes |
530,686 | (474,449 | ) | 3,292 | (1,913,535 | ) | |||||||||
Income tax benefit (provision) |
5,000 | (4,744 | ) | 8,666 | (9,086 | ) | |||||||||
| | | | | | | | | | | | | | | | |
Net income (loss) |
535,686 | (479,193 | ) | 11,958 | (1,922,621 | ) | |||||||||
Non-cash preferred dividend |
(48,007 | ) | — | — | — | ||||||||||
Series A preferred dividends |
— | — | (8,847 | ) | (17,517 | ) | |||||||||
Preferred dividends and accretion on redeemable noncontrolling interest |
— | (791 | ) | (35,905 | ) | (66,820 | ) | ||||||||
| | | | | | | | | | | | | | | | |
Net income (loss) available to common stockholders |
$ | 487,679 | $ | (479,984 | ) | $ | (32,794 | ) | $ | (2,006,958 | ) | ||||
| | | | | | | | | | | | | | | | |
| | | | | | | | | | | | | | | | |
| | | | | | | | | | | | | | | | |
Net income (loss) per share of common stock: |
|||||||||||||||
Basic |
$ | 3.67 | $ | (5.26 | ) | $ | (0.27 | ) | $ | (18.66 | ) | ||||
| | | | | | | | | | | | | | | | |
| | | | | | | | | | | | | | | | |
| | | | | | | | | | | | | | | | |
Diluted |
$ | 3.65 | $ | (5.26 | ) | $ | (0.27 | ) | $ | (18.66 | ) | ||||
| | | | | | | | | | | | | | | | |
| | | | | | | | | | | | | | | | |
| | | | | | | | | | | | | | | | |
Weighted average common shares outstanding: |
|||||||||||||||
Basic |
132,763 | 91,228 | 120,513 | 107,531 | |||||||||||
| | | | | | | | | | | | | | | | |
| | | | | | | | | | | | | | | | |
| | | | | | | | | | | | | | | | |
Diluted |
133,576 | 91,228 | 120,513 | 107,531 | |||||||||||
| | | | | | | | | | | | | | | | |
| | | | | | | | | | | | | | | | |
| | | | | | | | | | | | | | | | |
The accompanying notes are an integral part of these consolidated financial statements.
88
HALCÓN RESOURCES CORPORATION
CONSOLIDATED BALANCE SHEETS
(In thousands, except share and per share amounts)
| |
Successor | ||||||
|---|---|---|---|---|---|---|---|
| |
December 31, 2017 |
December 31, 2016 |
|||||
Current assets: |
|||||||
Cash and cash equivalents |
$ | 424,071 | $ | 24 | |||
Accounts receivable |
36,416 | 147,762 | |||||
Receivables from derivative contracts |
677 | 5,923 | |||||
Prepaids and other |
10,628 | 6,940 | |||||
| | | | | | | | |
Total current assets |
471,792 | 160,649 | |||||
| | | | | | | | |
Oil and natural gas properties (full cost method): |
|||||||
Evaluated |
877,316 | 1,269,034 | |||||
Unevaluated |
765,786 | 316,439 | |||||
| | | | | | | | |
Gross oil and natural gas properties |
1,643,102 | 1,585,473 | |||||
Less—accumulated depletion |
(570,155 | ) | (465,849 | ) | |||
| | | | | | | | |
Net oil and natural gas properties |
1,072,947 | 1,119,624 | |||||
| | | | | | | | |
Other operating property and equipment: |
|||||||
Other operating property and equipment |
101,282 | 38,617 | |||||
Less—accumulated depreciation |
(4,092 | ) | (1,107 | ) | |||
| | | | | | | | |
Net other operating property and equipment |
97,190 | 37,510 | |||||
| | | | | | | | |
Other noncurrent assets: |
|||||||
Funds in escrow and other |
1,691 | 1,887 | |||||
| | | | | | | | |
Total assets |
$ | 1,643,620 | $ | 1,319,670 | |||
| | | | | | | | |
| | | | | | | | |
| | | | | | | | |
Current liabilities: |
|||||||
Accounts payable and accrued liabilities |
$ | 131,087 | $ | 186,184 | |||
Liabilities from derivative contracts |
19,248 | 16,434 | |||||
Other |
— | 4,935 | |||||
| | | | | | | | |
Total current liabilities |
150,335 | 207,553 | |||||
| | | | | | | | |
Long-term debt, net |
409,168 | 964,653 | |||||
Other noncurrent liabilities: |
|||||||
Liabilities from derivative contracts |
7,751 | 486 | |||||
Asset retirement obligations |
4,368 | 31,985 | |||||
Other |
— | 2,305 | |||||
Commitments and contingencies (Note 11) |
|||||||
Stockholders' equity: |
|||||||
Common stock: 1,000,000,000 shares of $0.0001 par value authorized; 149,379,491 and 92,991,183 shares issued and outstanding as of December 31, 2017 and 2016, respectively |
15 | 9 | |||||
Additional paid-in capital |
1,016,281 | 592,663 | |||||
Retained earnings (accumulated deficit) |
55,702 | (479,984 | ) | ||||
| | | | | | | | |
Total stockholders' equity |
1,071,998 | 112,688 | |||||
| | | | | | | | |
Total liabilities and stockholders' equity |
$ | 1,643,620 | $ | 1,319,670 | |||
| | | | | | | | |
| | | | | | | | |
| | | | | | | | |
The accompanying notes are an integral part of these consolidated financial statements.
89
HALCÓN RESOURCES CORPORATION
CONSOLIDATED STATEMENTS OF STOCKHOLDERS' EQUITY
(In thousands)
| |
Preferred Stock | Common Stock | |
Retained Earnings (Accumulated Deficit) |
|
|||||||||||||||||
|---|---|---|---|---|---|---|---|---|---|---|---|---|---|---|---|---|---|---|---|---|---|---|
| |
Additional Paid-In Capital |
Stockholders' Equity |
||||||||||||||||||||
| |
Shares | Amount | Shares | Amount | ||||||||||||||||||
Balances at December 31, 2014 (Predecessor) |
345 | $ | — | 85,562 | $ | 8 | $ | 2,995,436 | $ | (1,223,275 | ) | $ | 1,772,169 | |||||||||
Net income (loss) |
— | — | — | — | — | (1,922,621 | ) | (1,922,621 | ) | |||||||||||||
Dividends on Series A preferred stock |
— | — | 1,354 | 1 | 9,801 | (17,979 | ) | (8,177 | ) | |||||||||||||
Conversion of Series A preferred stock |
(100 | ) | — | 3,258 | — | — | — | — | ||||||||||||||
Preferred dividends on redeemable noncontrolling interest |
— | — | — | — | — | (12,614 | ) | (12,614 | ) | |||||||||||||
Accretion of redeemable noncontrolling interest |
— | — | — | — | — | (53,561 | ) | (53,561 | ) | |||||||||||||
Change in fair value of redeemable noncontrolling interest |
— | — | — | — | — | (645 | ) | (645 | ) | |||||||||||||
Common stock issuance |
— | — | 1,888 | — | 15,356 | — | 15,356 | |||||||||||||||
Common stock issuance on conversion of senior notes |
— | — | 28,955 | 3 | 231,380 | — | 231,383 | |||||||||||||||
Modification of February 2012 Warrants |
— | — | — | — | 14,129 | — | 14,129 | |||||||||||||||
Offering costs |
— | — | — | — | (1,871 | ) | — | (1,871 | ) | |||||||||||||
Long-term incentive plan grants |
— | — | 2,048 | — | — | — | — | |||||||||||||||
Long-term incentive plan forfeitures |
— | — | (388 | ) | — | — | — | — | ||||||||||||||
Reduction in shares to cover individuals' tax withholding |
— | — | (153 | ) | — | (947 | ) | — | (947 | ) | ||||||||||||
Stock-based compensation |
— | — | — | — | 19,813 | — | 19,813 | |||||||||||||||
| | | | | | | | | | | | | | | | | | | | | | | |
Balances at December 31, 2015 (Predecessor) |
245 | — | 122,524 | 12 | 3,283,097 | (3,230,695 | ) | 52,414 | ||||||||||||||
Net income (loss) |
— | — | — | — | — | 11,958 | 11,958 | |||||||||||||||
Conversion of Series A preferred stock |
(23 | ) | — | 724 | — | — | — | — | ||||||||||||||
Preferred dividends on redeemable noncontrolling interest |
— | — | — | — | — | (9,329 | ) | (9,329 | ) | |||||||||||||
Accretion of redeemable noncontrolling interest |
— | — | — | — | — | (26,576 | ) | (26,576 | ) | |||||||||||||
Fair value of equity issued to Predecessor common stockholders |
— | — | — | — | (22,176 | ) | — | (22,176 | ) | |||||||||||||
Cash payment to Preferred Holders |
— | — | — | — | (11,100 | ) | — | (11,100 | ) | |||||||||||||
Reverse stock split rounding |
— | — | 5 | — | — | — | — | |||||||||||||||
Offering costs |
— | — | — | — | (10 | ) | — | (10 | ) | |||||||||||||
Long-term incentive plan forfeitures |
— | — | (517 | ) | — | — | — | — | ||||||||||||||
Reduction in shares to cover individuals' tax withholding |
— | — | (498 | ) | — | (176 | ) | — | (176 | ) | ||||||||||||
Stock-based compensation |
— | — | — | — | 4,995 | — | 4,995 | |||||||||||||||
| | | | | | | | | | | | | | | | | | | | | | | |
Balances at September 9, 2016 (Predecessor) |
222 | $ | — | 122,238 | $ | 12 | $ | 3,254,630 | $ | (3,254,642 | ) | $ | — | |||||||||
| | | | | | | | | | | | | | | | | | | | | | | |
| | | | | | | | | | | | | | | | | | | | | | | |
| | | | | | | | | | | | | | | | | | | | | | | |
Cancellation of Predecessor equity |
(222 | ) | $ | — | (122,238 | ) | $ | (12 | ) | $ | (3,254,630 | ) | $ | 3,254,642 | $ | — | ||||||
| | | | | | | | | | | | | | | | | | | | | | | |
Balances at September 9, 2016 (Predecessor) |
— | $ | — | — | $ | — | $ | — | $ | — | $ | — | ||||||||||
| | | | | | | | | | | | | | | | | | | | | | | |
| | | | | | | | | | | | | | | | | | | | | | | |
| | | | | | | | | | | | | | | | | | | | | | | |
| | | | | | | | | | | | | | | | | | | | | | | |
Issuance of Successor common stock and warrants |
— | $ | — | 90,000 | $ | 9 | $ | 571,114 | $ | — | $ | 571,123 | ||||||||||
Balances at September 9, 2016 (Successor) |
— | $ | — | 90,000 | $ | 9 | $ | 571,114 | $ | — | $ | 571,123 | ||||||||||
Net income (loss) |
— | — | — | — | — | (479,193 | ) | (479,193 | ) | |||||||||||||
Preferred dividends on redeemable noncontrolling interest |
— | — | — | — | — | (791 | ) | (791 | ) | |||||||||||||
Long-term incentive plan grants |
— | — | 2,991 | — | — | — | — | |||||||||||||||
Stock-based compensation |
— | — | — | — | 21,549 | — | 21,549 | |||||||||||||||
| | | | | | | | | | | | | | | | | | | | | | | |
Balances at December 31, 2016 (Successor) |
— | — | 92,991 | 9 | 592,663 | (479,984 | ) | 112,688 | ||||||||||||||
Net income (loss) |
— | — | — | — | — | 535,686 | 535,686 | |||||||||||||||
Sale of preferred stock |
6 | — | — | — | 352,048 | — | 352,048 | |||||||||||||||
Preferred beneficial conversion feature |
— | — | — | — | 48,007 | — | 48,007 | |||||||||||||||
Conversion of preferred stock |
(6 | ) | — | 55,180 | 6 | (6 | ) | — | — | |||||||||||||
Offering costs |
— | — | — | — | (11,919 | ) | — | (11,919 | ) | |||||||||||||
Long-term incentive plan grants |
— | — | 2,022 | — | — | — | — | |||||||||||||||
Long-term incentive plan forfeitures |
— | — | (498 | ) | — | — | — | — | ||||||||||||||
Reduction in shares to cover individuals' tax withholding |
— | — | (316 | ) | — | (1,995 | ) | — | (1,995 | ) | ||||||||||||
Stock-based compensation |
— | — | — | — | 37,483 | — | 37,483 | |||||||||||||||
| | | | | | | | | | | | | | | | | | | | | | | |
Balances at December 31, 2017 (Successor) |
— | $ | — | 149,379 | $ | 15 | $ | 1,016,281 | $ | 55,702 | $ | 1,071,998 | ||||||||||
| | | | | | | | | | | | | | | | | | | | | | | |
| | | | | | | | | | | | | | | | | | | | | | | |
| | | | | | | | | | | | | | | | | | | | | | | |
The accompanying notes are an integral part of these consolidated financial statements.
90
HALCÓN RESOURCES CORPORATION
CONSOLIDATED STATEMENTS OF CASH FLOWS
(In thousands)
| |
Successor | |
Predecessor | ||||||||||||
|---|---|---|---|---|---|---|---|---|---|---|---|---|---|---|---|
| |
Year Ended December 31, 2017 |
Period from September 10, 2016 through December 31, 2016 |
|
Period from January 1, 2016 through September 9, 2016 |
Year Ended December 31, 2015 |
||||||||||
Cash flows from operating activities: |
|||||||||||||||
Net income (loss) |
$ | 535,686 | $ | (479,193 | ) | $ | 11,958 | $ | (1,922,621 | ) | |||||
Adjustments to reconcile net income (loss) to net cash provided by (used in) operating activities: |
|||||||||||||||
Depletion, depreciation and accretion |
110,207 | 46,899 | 120,555 | 364,204 | |||||||||||
Full cost ceiling impairment |
— | 420,934 | 754,769 | 2,626,305 | |||||||||||
(Gain) loss on sale of oil and natural gas properties |
(721,573 | ) | — | — | — | ||||||||||
Other operating property and equipment impairment |
— | — | 28,056 | — | |||||||||||
Stock-based compensation, net |
36,757 | 21,519 | 4,876 | 14,529 | |||||||||||
Unrealized loss (gain) on derivative contracts |
16,468 | 112,449 | 263,732 | 129,282 | |||||||||||
Amortization and write-off of deferred loan costs |
1,795 | — | 6,371 | 7,357 | |||||||||||
Amortization of discount and premium |
2,597 | 2,506 | 1,515 | 2,509 | |||||||||||
Reorganization items |
(739 | ) | (15,963 | ) | (929,084 | ) | — | ||||||||
Loss (gain) on extinguishment of debt |
114,931 | — | (81,434 | ) | (761,804 | ) | |||||||||
Loss (gain) on extinguishment of Convertible Note and modification of February 2012 Warrants |
— | — | — | 8,219 | |||||||||||
Accrued settlements on derivative contracts |
24 | (18,498 | ) | — | (47,011 | ) | |||||||||
Other expense (income) |
(3,355 | ) | 79 | (4,233 | ) | 8,934 | |||||||||
Change in assets and liabilities: |
|||||||||||||||
Accounts receivable |
103,166 | (20,459 | ) | 47,920 | 86,411 | ||||||||||
Prepaids and other |
(3,688 | ) | 857 | (4,329 | ) | 3,714 | |||||||||
Accounts payable and accrued liabilities |
(77,685 | ) | 32,006 | (45,324 | ) | (53,029 | ) | ||||||||
| | | | | | | | | | | | | | | | |
Net cash provided by (used in) operating activities |
114,591 | 103,136 | 175,348 | 466,999 | |||||||||||
| | | | | | | | | | | | | | | | |
Cash flows from investing activities: |
|||||||||||||||
Oil and natural gas capital expenditures |
(331,257 | ) | (61,389 | ) | (226,741 | ) | (659,188 | ) | |||||||
Proceeds received from sales of oil and natural gas assets |
2,003,894 | 888 | (407 | ) | 1,222 | ||||||||||
Acquisition of oil and natural gas properties |
(1,018,546 | ) | (70 | ) | 124 | (231 | ) | ||||||||
Acquisition of other operating property and equipment |
(25,538 | ) | — | — | — | ||||||||||
Other operating property and equipment capital expenditures |
(53,214 | ) | (750 | ) | (950 | ) | (10,838 | ) | |||||||
Proceeds received from sale of other operating property and equipment |
21,798 | — | 138 | 1,711 | |||||||||||
Funds held in escrow and other |
1,455 | (1,721 | ) | 62 | 192 | ||||||||||
| | | | | | | | | | | | | | | | |
Net cash provided by (used in) investing activities |
598,592 | (63,042 | ) | (227,774 | ) | (667,132 | ) | ||||||||
| | | | | | | | | | | | | | | | |
Cash flows from financing activities: |
|||||||||||||||
Proceeds from borrowings |
1,349,000 | 115,000 | 886,000 | 1,834,000 | |||||||||||
Repayments of borrowings |
(1,922,826 | ) | (159,000 | ) | (727,648 | ) | (1,643,804 | ) | |||||||
Cash payments to Noteholders and Preferred Holders |
(83,653 | ) | (10,013 | ) | (97,521 | ) | — | ||||||||
Debt issuance costs |
(17,799 | ) | — | (1,977 | ) | (29,568 | ) | ||||||||
Preferred stock issued |
400,055 | — | — | — | |||||||||||
Series A preferred dividends |
— | — | — | (8,177 | ) | ||||||||||
Common stock issued |
— | — | — | 15,356 | |||||||||||
Offering costs and other |
(13,913 | ) | — | (511 | ) | (3,361 | ) | ||||||||
| | | | | | | | | | | | | | | | |
Net cash provided by (used in) financing activities |
(289,136 | ) | (54,013 | ) | 58,343 | 164,446 | |||||||||
| | | | | | | | | | | | | | | | |
Net increase (decrease) in cash and cash equivalents |
424,047 | (13,919 | ) | 5,917 | (35,687 | ) | |||||||||
Cash and cash equivalents at beginning of period |
24 | 13,943 | 8,026 | 43,713 | |||||||||||
| | | | | | | | | | | | | | | | |
Cash and cash equivalents at end of period |
$ | 424,071 | $ | 24 | $ | 13,943 | $ | 8,026 | |||||||
| | | | | | | | | | | | | | | | |
| | | | | | | | | | | | | | | | |
| | | | | | | | | | | | | | | | |
Supplemental cash flow information: |
|||||||||||||||
Cash paid for interest, net of capitalized interest |
$ | 90,835 | $ | 3,605 | $ | 139,930 | $ | 204,178 | |||||||
Cash paid (refunded) for income taxes |
1,250 | 5,000 | — | (3,078 | ) | ||||||||||
Cash paid for reorganization items |
739 | 18,012 | 15,362 | — | |||||||||||
Disclosure of non-cash investing and financing activities: |
|||||||||||||||
Accrued capitalized interest |
$ | — | $ | — | $ | (23,966 | ) | $ | (1,417 | ) | |||||
Asset retirement obligations |
(29,313 | ) | 513 | 939 | 6,742 | ||||||||||
Accretion of non-cash preferred dividend |
48,007 | — | — | — | |||||||||||
Series A preferred dividends paid in common stock |
— | — | — | 9,802 | |||||||||||
Preferred dividends on redeemable noncontrolling interest paid-in-kind |
— | 791 | 9,329 | 12,614 | |||||||||||
Accretion of redeemable noncontrolling interest |
— | — | 26,576 | 53,561 | |||||||||||
Change in fair value of redeemable noncontrolling interest |
— | — | — | 645 | |||||||||||
Common stock issued on conversion of senior notes |
— | — | — | 231,383 | |||||||||||
Third Lien Notes issued on conversion of senior notes |
— | — | — | 1,017,970 | |||||||||||
2022 Second Lien Notes issued on conversion of senior notes |
— | — | — | 112,826 | |||||||||||
Accrued debt issuance costs |
90 | — | 1,176 | (1,176 | ) | ||||||||||
The accompanying notes are an integral part of these consolidated financial statements.
91
HALCÓN RESOURCES CORPORATION
NOTES TO THE CONSOLIDATED FINANCIAL STATEMENTS
1. SUMMARY OF SIGNIFICANT EVENTS AND ACCOUNTING POLICIES
Basis of Presentation and Principles of Consolidation
Halcón Resources Corporation (Halcón or the Company) is an independent energy company focused on the acquisition, production, exploration and development of onshore liquids-rich oil and natural gas assets in the United States. The consolidated financial statements include the accounts of all majority-owned, controlled subsidiaries. The Company operates in one segment which focuses on oil and natural gas acquisition, production, exploration and development. Allocation of capital is made across the Company's entire portfolio without regard to operating area. All intercompany accounts and transactions have been eliminated. The Company has evaluated events or transactions through the date of issuance of this report in conjunction with the preparation of these consolidated financial statements.
Emergence from Voluntary Reorganization under Chapter 11
On July 27, 2016 (the Petition Date), the Company and certain of its subsidiaries (the Halcón Entities) filed voluntary petitions for relief under chapter 11 of the United States Bankruptcy Code in the U.S. Bankruptcy Court in the District of Delaware (the Bankruptcy Court) to pursue a joint prepackaged plan of reorganization (the Plan). On September 8, 2016, the Bankruptcy Court entered an order confirming the Plan and on September 9, 2016, the Plan became effective (the Effective Date) and the Halcón Entities emerged from chapter 11 bankruptcy. The Company's subsidiary, HK TMS, LLC which was divested on September 30, 2016, was not part of the chapter 11 bankruptcy filings. See Note 2, "Reorganization," for further details on the Company's chapter 11 bankruptcy and the Plan and Note 5, "Acquisitions and Divestitures," for further details on the divestiture of HK TMS, LLC.
Upon emergence from chapter 11 bankruptcy, the Company adopted fresh-start accounting in accordance with provisions of the Financial Accounting Standards Board's (FASB) Accounting Standards Codification (ASC) 852, Reorganizations (ASC 852) which resulted in the Company becoming a new entity for financial reporting purposes on the Effective Date. Upon the adoption of fresh-start accounting, the Company's assets and liabilities were recorded at their fair values as of the fresh-start reporting date. As a result of the adoption of fresh-start accounting, the Company's consolidated financial statements subsequent to September 9, 2016 are not comparable to its consolidated financial statements prior to, and including, September 9, 2016. See Note 3, "Fresh-start Accounting," for further details on the impact of fresh-start accounting on the Company's consolidated financial statements.
References to "Successor" or "Successor Company" relate to the financial position and results of operations of the reorganized Company subsequent to September 9, 2016. References to "Predecessor" or "Predecessor Company" relate to the financial position and results of operations of the Company prior to, and including, September 9, 2016.
Use of Estimates
The preparation of the Company's consolidated financial statements in conformity with accounting principles generally accepted in the United States requires the Company's management to make estimates and assumptions that affect the reported amounts of assets and liabilities and disclosure of contingent assets and liabilities, if any, at the date of the consolidated financial statements and the reported amounts of revenues and expenses during the respective reporting periods. Estimates and assumptions that, in the opinion of management of the Company, are significant include oil and natural gas revenue accruals, capital and operating expense accruals, oil and natural gas reserves, depletion
92
HALCÓN RESOURCES CORPORATION
NOTES TO THE CONSOLIDATED FINANCIAL STATEMENTS (Continued)
1. SUMMARY OF SIGNIFICANT EVENTS AND ACCOUNTING POLICIES (Continued)
relating to oil and natural gas properties, asset retirement obligations, fair value estimates, including estimates of Reorganization Value, Enterprise Value and the fair value of assets and liabilities recorded as a result of the adoption of fresh-start accounting, plus the estimated fair values of assets acquired and liabilities assumed in connection with the Pecos County Acquisition and the fair value of assets sold in connection with the Williston Divestiture and the El Halcón Divestiture (see Note 5, "Acquisitions and Divestitures," for information on the Pecos County Acquisition, the Williston Divestiture and the El Halcón Divestiture), including the gains on sales recorded, and income taxes. The Company bases its estimates and judgments on historical experience and on various other assumptions and information that are believed to be reasonable under the circumstances. Estimates and assumptions about future events and their effects cannot be perceived with certainty and, accordingly, these estimates may change as new events occur, as more experience is acquired, as additional information is obtained and as the Company's operating environment changes. Actual results may differ from the estimates and assumptions used in the preparation of the Company's consolidated financial statements.
Cash and Cash Equivalents
The Company considers all highly liquid short-term investments with a maturity of three months or less at the time of purchase to be cash equivalents. These investments are carried at cost, which approximates fair value.
Accounts Receivable and Allowance for Doubtful Accounts
The Company's accounts receivable are primarily receivables from joint interest owners and oil and natural gas purchasers. Accounts receivable are recorded at the amount due, less an allowance for doubtful accounts, when applicable. The Company establishes provisions for losses on accounts receivable if it determines that collection of all or part of the outstanding balance is doubtful. The Company regularly reviews collectability and establishes or adjusts the allowance for doubtful accounts as necessary using the specific identification method. As of December 31, 2017 and 2016, allowances for doubtful accounts were approximately $0.7 million and $1.2 million, respectively.
Oil and Natural Gas Properties
The Company uses the full cost method of accounting for its investment in oil and natural gas properties as prescribed by the United States Securities and Exchange Commission (SEC). Accordingly, all costs incurred in the acquisition, exploration and development of proved and unproved oil and natural gas properties, including the costs of abandoned properties, dry holes, geophysical costs, and annual lease rentals are capitalized. All general and administrative corporate costs unrelated to drilling activities are expensed as incurred. Sales or other dispositions of oil and natural gas properties are accounted for as adjustments to capitalized costs, with no gain or loss recorded unless the ratio of cost to proved reserves would significantly change. Depletion of evaluated oil and natural gas properties is computed on the units of production method based on proved reserves. The net capitalized costs of evaluated oil and natural gas properties are subject to a full cost ceiling limitation in which the costs are not allowed to exceed their related estimated future net revenues discounted at 10%, net of tax considerations.
93
HALCÓN RESOURCES CORPORATION
NOTES TO THE CONSOLIDATED FINANCIAL STATEMENTS (Continued)
1. SUMMARY OF SIGNIFICANT EVENTS AND ACCOUNTING POLICIES (Continued)
Costs associated with unevaluated properties are excluded from the full cost pool until the Company has made a determination as to the existence of proved reserves. The Company reviews its unevaluated properties at the end of each quarter to determine whether the costs incurred should be transferred to the full cost pool and thereby subject to amortization. Investments in unevaluated oil and natural gas properties and exploration and development projects for which depletion expense is not currently recognized, and for which exploration or development activities are in progress, qualify for interest capitalization. The Company determines capitalized interest, when applicable, by multiplying the Company's weighted-average borrowing cost on debt by the average amount of qualifying costs incurred that were excluded from the full cost pool; however, the amount of capitalized interest cannot exceed the amount of gross interest expense incurred in any given period. The Successor Company's accounting policy on the capitalization of interest establishes thresholds for the determination of a development project for the purpose of interest capitalization.
Other Operating Property and Equipment
Other operating property and equipment were recorded at fair value as a result of fresh-start accounting on September 9, 2016 and additions since that date are recorded at cost. Depreciation is calculated using the straight-line method over the following estimated useful lives: gas gathering systems, thirty years, water disposal and recycling facilities, twenty years; compressed natural gas facility, ten years; automobiles and computers, three years; computer software, fixtures, furniture and equipment, five years or the lesser of lease term; trailers, seven years; heavy equipment, eight to ten years; buildings, twenty years and leasehold improvements, lease term. Upon disposition, the cost and accumulated depreciation are removed and any gains or losses are reflected in current operations. Maintenance and repair costs are charged to operating expense as incurred. Material expenditures which increase the life or productive capacity of an asset are capitalized and depreciated over the estimated remaining useful life of the asset.
Refer to Note 3, "Fresh-start Accounting," for a discussion of the valuation approach used to record other operating property and equipment at fair value as of September 9, 2016. Refer to Note 5, "Acquisitions and Divestitures," for a discussion of other operating property and equipment acquired and divested during the year.
The Company reviews its other operating property and equipment for impairment in accordance with ASC 360, Property, Plant, and Equipment (ASC 360). ASC 360 requires the Company to evaluate other operating property and equipment for impairment as events occur or circumstances change that would more likely than not reduce the fair value below the carrying amount. If the carrying amount is not recoverable from its undiscounted cash flows, then the Company would recognize an impairment loss for the difference between the carrying amount and the current fair value. Further, the Company evaluates the remaining useful lives of its gas gathering systems and equipment and other operating assets at each reporting period to determine whether events and circumstances warrant a revision to the remaining depreciation periods. For the period from January 1, 2016 through September 9, 2016, the Company recorded a non-cash impairment charge of $28.1 million related to $32.8 million gross investments in gas gathering infrastructure that were deemed non-economical due to a shift in exploration, drilling and developmental plans in a low commodity price environment. This impairment was recorded in "Other operating property and equipment impairment" in the Company's consolidated statements of operations and in "Other operating property and equipment" in the Company's consolidated balance sheets.
94
HALCÓN RESOURCES CORPORATION
NOTES TO THE CONSOLIDATED FINANCIAL STATEMENTS (Continued)
1. SUMMARY OF SIGNIFICANT EVENTS AND ACCOUNTING POLICIES (Continued)
In accordance with ASC 820, Fair Value Measurements and Disclosures (ASC 820), a financial instrument's level within the fair value hierarchy is based on the lowest level of input that is significant to the fair value measurement. The estimate of the fair value of the Company's gas gathering systems was based on an income approach that estimated future cash flows associated with those assets over the remaining asset lives. This estimation includes the use of unobservable inputs, such as estimated future production, gathering and compression revenues and operating expenses. The use of these unobservable inputs results in the fair value estimate of the Company's gas gathering systems being classified as Level 3.
Revenue Recognition
Revenues from the sale of crude oil, natural gas, and natural gas liquids are recognized when the product is delivered at a fixed or determinable price, title has transferred, and collectability is reasonably assured and evidenced by a contract. The Company follows the entitlement method of accounting for crude oil and natural gas sales, recognizing as revenues only its net interest share of all production sold. Any amount attributable to the sale of production in excess of or less than the Company's net interest is recorded as a balancing asset or liability. At December 31, 2017 and 2016, the Company's imbalances were immaterial.
Concentrations of Credit Risk
The Company operates a substantial portion of its oil and natural gas properties. As the operator of a property, the Company makes full payments for costs associated with the property and seeks reimbursement from the other working interest owners in the property for their share of those costs. The Company's joint interest partners consist primarily of independent oil and natural gas producers. If the oil and natural gas exploration and production industry in general was adversely affected, the ability of the Company's joint interest partners to reimburse the Company could be adversely affected.
The purchasers of the Company's oil and natural gas production consist primarily of independent marketers, major oil and natural gas companies and gas pipeline companies. Historically, the Company has not experienced any significant losses from uncollectible accounts. In 2017 and 2016, two individual purchasers of the Company's production, Crestwood Midstream Partners, formerly Arrow Field Services LLC (Crestwood), and Suncor Energy Marketing Inc. (Suncor), each accounted for more than 10% of total sales, collectively representing 58% of the Company's total sales for each year. In 2015, three individual purchasers of the Company's production, Crestwood, Sunoco Inc. and Suncor, each accounted for more than 10% of total sales, collectively representing 57% of the Company's total sales for the year.
Risk Management Activities
The Company follows ASC 815, Derivatives and Hedging (ASC 815). From time to time, when derivative contracts are available at terms (or prices) acceptable to the Company, it may hedge a portion of its forecasted oil, natural gas, and natural gas liquids production. Derivative contracts entered into by the Company have consisted of transactions in which the Company hedges the variability of cash flow related to a forecasted transaction. The Company recognized all derivative instruments as either assets or liabilities in the consolidated balance sheets at fair value. The Company has elected to not designate any of its positions for hedge accounting. Accordingly, the Company
95
HALCÓN RESOURCES CORPORATION
NOTES TO THE CONSOLIDATED FINANCIAL STATEMENTS (Continued)
1. SUMMARY OF SIGNIFICANT EVENTS AND ACCOUNTING POLICIES (Continued)
records the net change in the mark-to-market valuation of these positions, as well as payments and receipts on settled contracts, in "Net gain (loss) on derivative contracts" on the consolidated statements of operations.
Income Taxes
The Company accounts for income taxes using the asset and liability method wherein deferred tax assets and liabilities are recognized for the future tax consequences attributable to differences between financial statement carrying amounts of existing assets and liabilities and their respective tax basis. Deferred tax assets and liabilities are measured using enacted tax rates expected to apply to taxable income in the years in which temporary differences are expected to be recovered or settled. Deferred tax assets are reduced by a valuation allowance if, based on the weight of available evidence, it is more likely than not that some portion or all of the deferred tax assets will not be realized. The Company classifies all deferred tax assets and liabilities, along with any related valuation allowance, as noncurrent on the consolidated balance sheets.
The Company follows ASC 740, Income Taxes (ASC 740). ASC 740 creates a single model to address accounting for the uncertainty in income tax positions and prescribes a minimum recognition threshold a tax position must meet before recognition in the consolidated financial statements.
The evaluation of a tax position in accordance with ASC 740 is a two-step process. The first step is a recognition process to determine whether it is more likely than not that a tax position will be sustained upon examination, including resolution of any related appeals or litigation processes, based on the technical merits of the position. In evaluating whether a tax position has met the more likely than not recognition threshold, it is presumed that the position will be examined by the appropriate taxing authority with full knowledge of all relevant information. The second step is a measurement process whereby a tax position that meets the more likely than not recognition threshold is calculated to determine the amount of benefit/expense to recognize in the consolidated financial statements. The tax position is measured at the largest amount of benefit/expense that is more likely than not of being realized upon ultimate settlement.
The Company has no liability for unrecognized tax benefits as of December 31, 2017 and 2016. Accordingly, there is no amount of unrecognized tax benefits that, if recognized, would affect the effective tax rate and there is no amount of interest or penalties currently recognized in the consolidated statements of operations or consolidated balance sheets as of December 31, 2017, 2016 and 2015. In addition, the Company does not believe that there are any positions for which it is reasonably possible that the total amount of unrecognized tax benefits will significantly increase or decrease within the next twelve months.
The Company includes interest and penalties relating to uncertain tax positions within "Interest expense and other, net" on the Company's consolidated statements of operations. Refer to Note 14, "Income Taxes," for more details.
Generally, the Company's tax years 2014 through 2017 are either currently under audit or remain open and subject to examination by federal tax authorities or the tax authorities in Louisiana, Mississippi, North Dakota, Oklahoma, Texas, Pennsylvania, Ohio and certain other state taxing jurisdictions where the Company has, or previously had, principal operations. In certain of these jurisdictions, the Company operates through more than one legal entity, each of which may have
96
HALCÓN RESOURCES CORPORATION
NOTES TO THE CONSOLIDATED FINANCIAL STATEMENTS (Continued)
1. SUMMARY OF SIGNIFICANT EVENTS AND ACCOUNTING POLICIES (Continued)
different open years subject to examination. Additionally, it is important to note that years are open for examination until the statute of limitations in each respective jurisdiction expires.
Tax audits may be ongoing at any point in time. Tax liabilities are recorded based on estimates of additional taxes which may be due upon the conclusion of these audits. Estimates of these tax liabilities are made based upon prior experience and are updated for changes in facts and circumstances. However, due to the uncertain and complex application of tax regulations, it is possible that the ultimate resolution of audits may result in liabilities which could be materially different from these estimates.
Asset Retirement Obligations
ASC 410, Asset Retirement and Environmental Obligations (ASC 410) requires that the fair value of an asset retirement cost, and corresponding liability, should be recorded as part of the cost of the related long-lived asset and subsequently allocated to expense using a systematic and rational method. The Company records asset retirement obligations to reflect the Company's legal obligations related to future plugging and abandonment of its oil and natural gas wells and other operating property and equipment. The Company estimates the expected cash flows associated with the obligation and discounts the amounts using a credit-adjusted, risk-free interest rate. At least annually, the Company reassesses the obligation to determine whether a change in the estimated obligation is necessary. The Company evaluates whether there are indicators that suggest the estimated cash flows underlying the obligation have materially changed. Should these indicators suggest the estimated obligation may have materially changed on an interim basis (quarterly), the Company will accordingly update its assessment. Additional retirement obligations increase the liability associated with new oil and natural gas wells and other operating property and equipment as these obligations are incurred.
401(k) Plan
The Company sponsors a 401(k) tax deferred savings plan, whereby the Company matches a portion of employees' contributions in cash. Participation in the plan is voluntary and all employees of the Company who are 18 years of age are eligible to participate. The Company provided matching contributions of $2.2 million for the year ended December 31, 2017. The Company provided matching contributions of $0.8 million and $2.0 million for the period September 10, 2016 through December 31, 2016 and the period January 1, 2016 through September 9, 2016, respectively. The Company provided matching contributions of $3.8 million in 2015. The Company matches employee contributions dollar-for-dollar on the first 10% of an employee's pre-tax earnings, subject to individual IRS limitations.
Related Party Transaction
On November 16, 2017, a subsidiary of the Company entered into a gas purchase and processing agreement with Salt Creek Midstream, LLC (Salt Creek) pursuant to which the Company will dedicate for a term of 15 years, all production from its acreage in Ward County, Texas (that is not otherwise previously dedicated) and certain sections in Winkler County, Texas to a natural gas gathering pipeline and processing facilities to be constructed by Salt Creek. The facilities are expected to be completed and placed in service in April 2018. The agreement with Salt Creek was the culmination of a lengthy process during which the Company investigated the most efficient method of gathering, processing and
97
HALCÓN RESOURCES CORPORATION
NOTES TO THE CONSOLIDATED FINANCIAL STATEMENTS (Continued)
1. SUMMARY OF SIGNIFICANT EVENTS AND ACCOUNTING POLICIES (Continued)
marketing its future natural gas production in these areas. During the course of its investigation, the Company considered the construction of Company owned gas gathering and processing facilities, Company owned high pressure pipeline to a third-party processing plant and solicited and received proposals from numerous third parties for long-term gathering and processing options. The Company received proposals from eight midstream companies, determined that third party options were more attractive from a variety of business perspectives, and that among the proposals it received, Salt Creek's was superior. The Salt Creek facilities are not yet operational, and no production has been delivered and no payments have been made or received by the Company pursuant to the gas purchase and processing agreement to date.
Certain funds under the control of Ares Management LLC (Ares) are the majority owners and controlling parties of Salt Creek. Ares also controls other funds which own in excess of ten percent (10%) of the stock of the Company. No Ares fund that is a stockholder of the Company has an interest in Salt Creek but one of the Company's directors, who is employed by Ares, and is a director of the Company, also serves on the board of directors of Salt Creek. Due to these relationships, prior to entering into the gas purchase and processing agreement, the process by which the Company determined the Salt Creek proposal to be superior to other alternatives, as well as the terms of the agreement, were evaluated and approved in advance by the Audit Committee of the Company and the disinterested members of the Company's board of directors, in a vote that excluded the Company director who is employed by Ares in accordance with applicable Company policies, including its Code of Conduct and Corporate Governance Guidelines (copies of which are available through the Company's website at www.halconresources.com), and the Company's procedures for the review and approval of transactions with related parties.
Recently Issued Accounting Pronouncements
In January 2017, the FASB issued Accounting Standards Update (ASU) No. 2017-01, Business Combinations (Topic 805): Clarifying the Definition of a Business (ASU 2017-01). For public business entities, ASU 2017-01 is effective for fiscal years and interim periods within those fiscal years, beginning after December 15, 2017. The amendments in this ASU should be applied prospectively on or after the effective date. The ASU was issued to clarify the definition of a business with the objective of adding guidance to assist entities with evaluating whether transactions should be accounted for as acquisitions of assets or businesses. The Company is in the process of assessing the effects of the application of the new guidance.
In August 2016, the FASB issued ASU No. 2016-15, Statement of Cash Flows (Topic 230) (ASU 2016-15). For public business entities, ASU 2016-15 is effective for fiscal years, and interim periods within those fiscal years, beginning after December 15, 2017 and early adoption is permitted. The areas for simplification in this ASU involve addressing eight specific classification issues in the statement of cash flows. An entity should apply the amendments in this ASU using a retrospective transition method. The Company is in the process of assessing the effects of the application of the new guidance.
In February 2016, the FASB issued ASU 2016-02, Leases (Topic 842) (ASU 2016-02). For public business entities, ASU 2016-02 is effective for fiscal years, and interim periods within those fiscal years, beginning after December 15, 2018 and early adoption is permitted. The FASB issued ASU 2016-02 to increase transparency and comparability among organizations by recognizing lease assets and lease liabilities on the balance sheet and disclosing key information about leasing arrangements. An entity
98
HALCÓN RESOURCES CORPORATION
NOTES TO THE CONSOLIDATED FINANCIAL STATEMENTS (Continued)
1. SUMMARY OF SIGNIFICANT EVENTS AND ACCOUNTING POLICIES (Continued)
should apply the amendments in this ASU on a modified retrospective basis. The transition will require application of the new guidance at the beginning of the earliest comparative period presented in the financial statements. The Company is process of assessing the effects of the application of the new guidance and the financial statement and disclosure impacts. The Company will adopt ASU 2016-02 no later than January 1, 2019.
In May 2014, the FASB issued ASU 2014-09, Revenue from Contracts with Customers (ASU 2014-09). ASU 2014-09 states that an entity should recognize revenue to depict the transfer of promised goods or services to customers in an amount that reflects the consideration to which the entity expects to be entitled in exchange for those goods or services. The standard provides five steps an entity should apply in determining its revenue recognition. In March 2016, ASU 2014-09 was updated with ASU No. 2016-08, Revenue from Contracts with Customers (Topic 606): Principal versus Agent Considerations (Reporting Revenue Gross versus Net) (ASU 2016-08), which provides further clarification on the principal versus agent evaluation. ASU 2014-09 is required to be adopted using either the full retrospective approach, with all prior periods presented adjusted, or the modified retrospective approach, with a cumulative adjustment to retained earnings on the opening balance sheet and is effective for annual reporting periods, and interim periods within that reporting period, after December 15, 2017. Early adoption is not permitted. The Company has completed an initial review of its contracts and is developing accounting policies and procedures to address the provisions of ASU 2014-09. Additional disclosures will be required to describe the nature, amount, timing and uncertainty of revenue and cash flows from contracts with customers. While the Company does not currently expect net income or cash flows from operations to be materially impacted, the Company expects changes in the recognition of revenues and expenses in certain natural gas gathering and processing contracts resulting in offsetting changes to "Oil, natural gas and natural gas liquids sales" and "Gathering and other expense" on the consolidated statements of operations. The Company will adopt ASU 2014-09 effective January 1, 2018 using the modified retrospective approach.
2. REORGANIZATION
On June 9, 2016, the Halcón Entities entered into a restructuring support agreement (the Restructuring Support Agreement) with certain holders of the Company's 13% senior secured third lien notes due 2022 (the Third Lien Noteholders), the Company's 8.875% senior unsecured notes due 2021, 9.25% senior unsecured notes due 2022 and 9.75% senior unsecured notes due 2020 (collectively, the Unsecured Noteholders), the holder of the Company's 8% senior unsecured convertible note due 2020 (the Convertible Noteholder), and certain holders of the Company's 5.75% Series A Convertible Perpetual Preferred Stock. On July 27, 2016, the Halcón Entities filed voluntary petitions for relief under chapter 11 of the United States Bankruptcy Code in the U.S. Bankruptcy Court in the District of Delaware to effect an accelerated prepackaged bankruptcy restructuring as contemplated in the Restructuring Support Agreement. On September 8, 2016, the Bankruptcy Court entered an order confirming the Company's plan of reorganization and on September 9, 2016, the Halcón Entities emerged from chapter 11 bankruptcy.
Upon emergence, pursuant to the terms of the Plan, the following significant transactions occurred:
- •
- the Predecessor Company's financing facility was refinanced and replaced with a debtor-in-possession senior-secured, super-priority revolving credit facility, which was
99
HALCÓN RESOURCES CORPORATION
NOTES TO THE CONSOLIDATED FINANCIAL STATEMENTS (Continued)
2. REORGANIZATION (Continued)
- •
- the Predecessor Company's Second Lien Notes (consisting of $700.0 million in aggregate principal amount outstanding of 8.625% senior
secured notes due 2020 and $112.8 million in aggregate principal amount outstanding of 12% senior secured notes due 2022) were unimpaired and reinstated;
- •
- the Predecessor Company's Third Lien Notes were cancelled and the Third Lien Noteholders received their pro rata share of 76.5% of the common
stock of reorganized Halcón, together with a cash payment of $33.8 million, and accrued and unpaid interest on their notes through May 15, 2016, which interest was paid
prior to the chapter 11 bankruptcy filing, in full and final satisfaction of their claims;
- •
- the Predecessor Company's Unsecured Notes were cancelled and the Unsecured Noteholders received their pro rata share of 15.5% of the common
stock of reorganized Halcón, together with a cash payment of $37.6 million and warrants to purchase 4% of the common stock of reorganized Halcón (with a four year
term and an exercise price of $14.04 per share), and accrued and unpaid interest on their notes through May 15, 2016, which interest was paid prior to the chapter 11 bankruptcy filing,
in full and final satisfaction of their claims;
- •
- the Predecessor Company's Convertible Note was cancelled and the Convertible Noteholder received 4% of the common stock of reorganized
Halcón, together with a cash payment of $15.0 million and warrants to purchase 1% of the common stock of reorganized Halcón (with a four year term and an exercise
price of $14.04 per share), in full and final satisfaction of their claims;
- •
- the general unsecured claims were unimpaired and paid in full in the ordinary course;
- •
- all outstanding shares of the Predecessor Company's Series A Preferred Stock were cancelled and the Preferred Holders received their pro
rata share of $11.1 million in cash, in full and final satisfaction of their interests; and
- •
- all of the Predecessor Company's outstanding shares of common stock were cancelled and the common stockholders received their pro rata share of 4% of the common stock of reorganized Halcón, in full and final satisfaction of their interests.
subsequently converted into the Senior Credit Agreement (refer to Note 7, "Long-term Debt" for credit agreement definitions and further details regarding the Senior Credit Agreement);
Each of the foregoing percentages of equity in the reorganized Company were as of September 9, 2016 and subject to dilution from the exercise of the new warrants described above, a management incentive plan and other future issuances of equity securities.
See Note 7, "Long-term Debt," and Note 13, "Stockholders' Equity," for further information regarding the Company's Successor and Predecessor debt and equity instruments.
3. FRESH-START ACCOUNTING
Upon the Company's emergence from chapter 11 bankruptcy, the Company qualified for and adopted fresh-start accounting in accordance with the provisions set forth in ASC 852 as (i) the Reorganization Value of the Company's assets immediately prior to the date of confirmation was less than the post-petition liabilities and allowed claims, and (ii) the holders of the existing voting shares of
100
HALCÓN RESOURCES CORPORATION
NOTES TO THE CONSOLIDATED FINANCIAL STATEMENTS (Continued)
3. FRESH-START ACCOUNTING (Continued)
the Predecessor entity received less than 50% of the voting shares of the emerging entity. Refer to Note 2, "Reorganization," for the terms of the Plan. Fresh-start accounting requires the Company to present its assets, liabilities, and equity as if it were a new entity upon emergence from bankruptcy. The new entity is referred to as "Successor" or "Successor Company." However, the Company will continue to present financial information for any periods before adoption of fresh-start accounting for the Predecessor Company. The Predecessor and Successor Companies may lack comparability, as required in ASC Topic 205, Presentation of Financial Statements (ASC 205). ASC 205 states financial statements are required to be presented comparably from year to year, with any exceptions to comparability clearly disclosed. Therefore, "black-line" financial statements are presented to distinguish between the Predecessor and Successor Companies.
Adopting fresh-start accounting results in a new financial reporting entity with no beginning retained earnings or deficit as of the fresh-start reporting date. Upon the application of fresh-start accounting, the Company allocated the Reorganization Value (the fair value of the Successor Company's total assets) to its individual assets based on their estimated fair values. The Reorganization Value is intended to represent the approximate amount a willing buyer would value the Company's assets immediately after the reorganization.
Reorganization Value is derived from an estimate of Enterprise Value, or the fair value of the Company's long-term debt, stockholders' equity and working capital. The estimated Enterprise Value at the Effective Date is below the midpoint of the Court approved range of $1.6 billion to $1.8 billion, primarily reflecting the decline in forward commodity prices during the period between the Company's analysis performed in advance of the July 2016 chapter 11 bankruptcy filing and the Effective Date. The Enterprise Value was derived from an independent valuation using an asset based methodology of proved reserves, undeveloped acreage, and other financial information, considerations and projections, applying a combination of the income, cost and market approaches as of the fresh-start reporting date of September 9, 2016.
The Company's principal assets are its oil and natural gas properties. For purposes of estimating the fair value of the Company's proved, probable and possible reserves, an income approach was used which estimated fair value based on the anticipated cash flows associated with the Company's reserves, risked by reserve category and discounted using a weighted average cost of capital rate of 10.5% for proved reserves and 12.5% for probable and possible reserves. The proved reserve locations were limited to wells expected to be drilled in the Company's five year development plan. Weighted average commodity prices utilized in the determination of the fair value of oil and natural gas properties were $72.30 per barrel of oil, $3.50 per MMBtu of natural gas and $12.00 per barrel of oil equivalent of natural gas liquids, after adjustment for transportation fees and regional price differentials. Base pricing was derived from an average of forward strip prices and analysts' estimated prices.
In estimating the fair value of the Company's unproved acreage that was not included in the valuation of probable and possible reserves, a market approach was used in which a review of recent transactions involving properties in the same geographical location indicated the fair value of the Company's unproved acreage from a market participant perspective.
See further discussion below in the "Fresh-start accounting adjustments" for the specific assumptions used in the valuation of the Company's various other assets.
101
HALCÓN RESOURCES CORPORATION
NOTES TO THE CONSOLIDATED FINANCIAL STATEMENTS (Continued)
3. FRESH-START ACCOUNTING (Continued)
Although the Company believes the assumptions and estimates used to develop Enterprise Value and Reorganization Value are reasonable and appropriate, different assumptions and estimates could materially impact the analysis and resulting conclusions. The assumptions used in estimating these values are inherently uncertain and require judgment.
The following table reconciles the Company's Enterprise Value to the estimated fair value of the Successor's common stock as of September 9, 2016 (in thousands):
| |
September 9, 2016 | |||
|---|---|---|---|---|
Enterprise Value |
$ | 1,618,888 | ||
Plus: Cash |
13,943 | |||
Less: Fair value of debt |
(1,016,160 | ) | ||
Less: Fair value of redeemable noncontrolling interest |
(41,070 | ) | ||
Less: Fair value of other long-term liabilities |
(4,478 | ) | ||
Less: Fair value of warrants |
(16,691 | ) | ||
| | | | | |
Fair Value of Successor common stock |
$ | 554,432 | ||
| | | | | |
| | | | | |
| | | | | |
The following table reconciles the Company's Enterprise Value to its Reorganization Value as of September 9, 2016 (in thousands):
| |
September 9, 2016 | |||
|---|---|---|---|---|
Enterprise Value |
$ | 1,618,888 | ||
Plus: Cash |
13,943 | |||
Plus: Current liabilities |
178,639 | |||
Plus: Noncurrent asset retirement obligation |
32,156 | |||
| | | | | |
Reorganization Value of Successor assets |
$ | 1,843,626 | ||
| | | | | |
| | | | | |
| | | | | |
Condensed Consolidated Balance Sheet
The following illustrates the effects on the Company's consolidated balance sheet due to the reorganization and fresh-start accounting adjustments. The explanatory notes following the table below provide further details on the adjustments, including the Company's assumptions and methods used to
102
HALCÓN RESOURCES CORPORATION
NOTES TO THE CONSOLIDATED FINANCIAL STATEMENTS (Continued)
3. FRESH-START ACCOUNTING (Continued)
determine fair value for its assets and liabilities. Amounts included in the table below are rounded to thousands.
| |
As of September 9, 2016 | ||||||||||||
|---|---|---|---|---|---|---|---|---|---|---|---|---|---|
| |
Predecessor Company |
Reorganization Adjustments |
Fresh-Start Adjustments |
Successor Company |
|||||||||
Current assets: |
|||||||||||||
Cash and cash equivalents |
$ | 111,464 | $ | (97,521 | )(1) | $ | — | $ | 13,943 | ||||
Accounts receivable |
116,859 | — | — | 116,859 | |||||||||
Receivables from derivative contracts |
97,648 | — | — | 97,648 | |||||||||
Restricted cash |
17,164 | — | — | 17,164 | |||||||||
Prepaids and other |
8,961 | — | (1,332 | )(7) | 7,629 | ||||||||
| | | | | | | | | | | | | | |
Total current assets |
352,096 | (97,521 | ) | (1,332 | ) | 253,243 | |||||||
| | | | | | | | | | | | | | |
Oil and natural gas properties (full cost method): |
|||||||||||||
Evaluated |
7,712,003 | — | (6,497,874 | )(8) | 1,214,129 | ||||||||
Unevaluated |
1,193,259 | — | (861,144 | )(8) | 332,115 | ||||||||
| | | | | | | | | | | | | | |
Gross oil and natural gas properties |
8,905,262 | — | (7,359,018 | ) | 1,546,244 | ||||||||
Less—accumulated depletion |
(6,803,231 | ) | — | 6,803,231 | (8) | — | |||||||
| | | | | | | | | | | | | | |
Net oil and natural gas properties |
2,102,031 | — | (555,787 | ) | 1,546,244 | ||||||||
| | | | | | | | | | | | | | |
Other operating property and equipment: |
|||||||||||||
Other operating property and equipment |
100,079 | — | (62,008 | )(9) | 38,071 | ||||||||
Less—accumulated depreciation |
(24,154 | ) | — | 24,154 | (9) | — | |||||||
| | | | | | | | | | | | | | |
Net other operating property and equipment |
75,925 | — | (37,854 | ) | 38,071 | ||||||||
| | | | | | | | | | | | | | |
Other noncurrent assets: |
|||||||||||||
Receivables from derivative contracts |
4,431 | — | — | 4,431 | |||||||||
Funds in escrow and other |
1,610 | — | 27 | (10) | 1,637 | ||||||||
| | | | | | | | | | | | | | |
Total assets |
$ | 2,536,093 | $ | (97,521 | ) | $ | (594,946 | ) | $ | 1,843,626 | |||
| | | | | | | | | | | | | | |
| | | | | | | | | | | | | | |
| | | | | | | | | | | | | | |
Current liabilities: |
|||||||||||||
Accounts payable and accrued liabilities |
$ | 160,000 | $ | 13,688 | (2) | $ | — | $ | 173,688 | ||||
Liabilities from derivative contracts |
102 | — | — | 102 | |||||||||
Other |
414 | — | 4,435 | (11)(12) | 4,849 | ||||||||
| | | | | | | | | | | | | | |
Total current liabilities |
160,516 | 13,688 | 4,435 | 178,639 | |||||||||
| | | | | | | | | | | | | | |
Long-term debt, net |
1,031,114 | — | (14,954 | )(13) | 1,016,160 | ||||||||
Liabilities subject to compromise |
2,007,703 | (2,007,703 | )(3) | — | — | ||||||||
Other noncurrent liabilities: |
|||||||||||||
Liabilities from derivative contracts |
525 | — | — | 525 | |||||||||
Asset retirement obligations |
48,955 | — | (16,799 | )(12) | 32,156 | ||||||||
Other |
528 | — | 3,425 | (11)(14) | 3,953 | ||||||||
Commitments and contingencies |
|||||||||||||
Mezzanine equity: |
|||||||||||||
Redeemable noncontrolling interest |
219,891 | — | (178,821 | )(14) | 41,070 | ||||||||
Stockholders' equity: |
|||||||||||||
Preferred stock (Predecessor) |
— | —(4) | — | — | |||||||||
Common Stock (Predecessor) |
12 | (12 | )(4) | — | — | ||||||||
Common Stock (Successor) |
— | 9 | (5) | — | 9 | ||||||||
Additional paid-in capital (Predecessor) |
3,287,906 | (3,287,906 | )(4) | — | — | ||||||||
Additional paid-in capital (Successor) |
— | 571,114 | (5) | — | 571,114 | ||||||||
Retained earnings (accumulated deficit) |
(4,221,057 | ) | 4,613,289 | (6) | (392,232 | )(15) | — | ||||||
| | | | | | | | | | | | | | |
Total stockholders' equity |
(933,139 | ) | 1,896,494 | (392,232 | ) | 571,123 | |||||||
| | | | | | | | | | | | | | |
Total liabilities and stockholders' equity |
$ | 2,536,093 | $ | (97,521 | ) | $ | (594,946 | ) | $ | 1,843,626 | |||
| | | | | | | | | | | | | | |
| | | | | | | | | | | | | | |
| | | | | | | | | | | | | | |
103
HALCÓN RESOURCES CORPORATION
NOTES TO THE CONSOLIDATED FINANCIAL STATEMENTS (Continued)
3. FRESH-START ACCOUNTING (Continued)
Reorganization adjustments
- 1)
- The table below details cash payments as of September 9, 2016, pursuant to the terms of the Plan described in Note 2, "Reorganization," (in thousands):
Payment to Third Lien Noteholders |
$ | 33,826 | ||
Payment to Unsecured Noteholders |
37,595 | |||
Payment to Convertible Noteholder |
15,000 | |||
Payment to Preferred Holders |
11,100 | |||
| | | | | |
Total Uses |
$ | 97,521 | ||
| | | | | |
| | | | | |
| | | | | |
- 2)
- In
connection with the chapter 11 bankruptcy, the Company modified and rejected certain office lease arrangements and paid approximately $3.4 million
for these modifications and rejections subsequent to the emergence from chapter 11 bankruptcy. This amount also reflects $10.3 million paid to the Company's restructuring advisors
subsequent to the emergence from chapter 11 bankruptcy.
- 3)
- Liabilities subject to compromise were as follows (in thousands):
13.0% senior secured third lien notes due 2022 |
$ | 1,017,970 | ||
9.25% senior notes due 2022 |
37,194 | |||
8.875% senior notes due 2021 |
297,193 | |||
9.75% senior notes due 2020 |
315,535 | |||
8.0% convertible note due 2020 |
289,669 | |||
Accrued interest |
46,715 | |||
Office lease modification and rejection fees |
3,427 | |||
| | | | | |
Liabilities subject to compromise |
2,007,703 | |||
Fair value of equity and warrants issued to Third Lien Noteholders, Unsecured Noteholders and Convertible Noteholder |
(548,947 | ) | ||
Cash payments to Third Lien Noteholders, Unsecured Noteholders and Convertible Noteholder |
(86,421 | ) | ||
Office lease modification and rejection fees |
(3,427 | ) | ||
| | | | | |
Gain on settlement of Liabilities subject to compromise |
$ | 1,368,908 | ||
| | | | | |
| | | | | |
| | | | | |
- 4)
- Reflects the cancellation of Predecessor equity, as follows (in thousands):
Predecessor Company stock |
$ | 3,287,918 | ||
Fair value of equity issued to Predecessor common stockholders |
(22,176 | ) | ||
Cash payment to Preferred Holders |
(11,100 | ) | ||
| | | | | |
Cancellation of Predecessor Company equity |
$ | 3,254,642 | ||
| | | | | |
| | | | | |
| | | | | |
- 5)
- Reflects the issuance of Successor equity. In accordance with the Plan, the Successor Company issued 3.6 million shares of common stock to the Predecessor Company's existing common stockholders, 68.8 million shares of common stock to the Third Lien Noteholders, 14.0 million shares of common stock to the Unsecured Noteholders, and 3.6 million shares of common stock to
104
HALCÓN RESOURCES CORPORATION
NOTES TO THE CONSOLIDATED FINANCIAL STATEMENTS (Continued)
3. FRESH-START ACCOUNTING (Continued)
the Convertible Noteholder. This amount is subject to dilution by warrants issued to the Unsecured Noteholders and the Convertible Noteholder totaling 4.7 million shares with an exercise price of $14.04 per share and a term of four years. The fair value of the warrants was estimated at $3.52 per share using a Black-Scholes-Merton valuation model.
- 6)
- The table below reflects the cumulative effect of the reorganization adjustments discussed above (in thousands):
Gain on settlement of Liabilities subject to compromise |
$ | 1,368,908 | ||
Accrued reorganization items |
(10,261 | ) | ||
Cancellation of Predecessor Company equity |
3,254,642 | |||
| | | | | |
Net impact to retained earnings (accumulated deficit) |
$ | 4,613,289 | ||
| | | | | |
| | | | | |
| | | | | |
Fresh-start accounting adjustments
- 7)
- Reflects
the reclassification of tubulars and well equipment to "Oil and natural gas properties."
- 8)
- In estimating the fair value of its oil and natural gas properties, the Company used a combination of the income and market approaches. For purposes of estimating the fair value of the Company's proved, probable and possible reserves, an income approach was used which estimated fair value based on the anticipated cash flows associated with the Company's reserves, risked by reserve category and discounted using a weighted average cost of capital rate of 10.5% for proved reserves and 12.5% for probable and possible reserves. The proved reserve locations were limited to wells expected to be drilled in the Company's five year development plan. Weighted average commodity prices utilized in the determination of the fair value of oil and natural gas properties were $72.30 per barrel of oil, $3.50 per MMBtu of natural gas and $12.00 per barrel of natural gas liquids, after adjustment for transportation fees and regional price differentials. Base pricing was derived from an average of forward strip prices and analysts' estimated prices.
In estimating the fair value of the Company's unproved acreage that was not included in the valuation of probable and possible reserves, a market approach was used in which a review of recent transactions involving properties in the same geographical location indicated the fair value of the Company's unproved acreage from a market participant perspective.
- 9)
- In estimating the fair value of its other operating property and equipment, the Company used a combination of the income, cost, and market approaches.
For purposes of estimating the fair value of its gas gathering assets, an income approach was used that estimated future cash flows associated with the assets over the remaining useful lives. The valuation included such inputs as estimated future production, gathering and compression revenues, and operating expenses that were discounted at a weighted average cost of capital rate of 9.5%.
For purposes of estimating the fair value of its other operating assets, the Company used a combination of the market and cost approaches. A market approach was relied upon to value land and computer equipment, and in this valuation approach, recent transactions of similar assets were utilized to determine the value from a market participant perspective. For the remaining other operating assets, a cost approach was used. The estimation of fair value under the cost approach
105
HALCÓN RESOURCES CORPORATION
NOTES TO THE CONSOLIDATED FINANCIAL STATEMENTS (Continued)
3. FRESH-START ACCOUNTING (Continued)
was based on current replacement costs of the assets, less depreciation based on the estimated economic useful lives of the assets and age of the assets.
- 10)
- Reflects
the adjustment of the Company's equity method investment in SBE Partners, L.P. to fair value based on an income approach, which calculated the
discounted cash flows of the Company's share of the partnership's interest in oil and gas proved reserves. The anticipated cash flows of the reserve were risked by reserve category and discounted at
10.5%. Weighted average commodity prices utilized in the determination of the fair value of oil and natural gas properties were $72.30 per barrel of oil, $3.50 per MMBtu of natural gas and $12.00 per
barrel of oil equivalent of natural gas liquids, after adjustment for transportation fees and regional price differentials. Base pricing was derived from an average of forward strip prices and
analysts' estimated prices.
- 11)
- Records
an intangible liability of approximately $8.3 million, $4.5 million of which was recorded as current, to adjust the Company's active rig
contract to fair value at September 9, 2016. The intangible liability will be amortized over the remaining life of the contract.
- 12)
- Reflects
the adjustment of asset retirement obligations to fair value using estimated plugging and abandonment costs as of September 9, 2016, adjusted for
inflation and then discounted at the appropriate credit-adjusted risk free rate ranging from 5.5% to 6.6% depending on the life of the well. The fair value of asset retirement obligations was
estimated at $32.5 million, approximately $0.3 million of which was recorded as current. Refer to Note 10, "Asset Retirement
Obligations," for further details of the Company's asset retirement obligations.
- 13)
- Reflects
the adjustment of the 2020 Second Lien Notes and the 2022 Second Lien Notes to fair value. The fair value estimate was based on quoted market prices from
trades of such debt on September 9, 2016. Refer to Note 7, "Long-term Debt," for definitions of and further information regarding the 2020
Second Lien Notes and 2022 Second Lien Notes.
- 14)
- Reflects
the adjustment of the Company's redeemable noncontrolling interest and related embedded derivative of HK TMS, LLC to fair value. The fair value of
the redeemable noncontrolling interest was estimated at $41.1 million and the embedded derivative was estimated at zero. For purposes of estimating the fair values, an income approach was used
that estimated fair value based on the anticipated cash flows associated with HK TMS, LLC's proved reserves, risked by reserve category and discounted using a weighted average cost of capital
rate of 12.5%. The value of the redeemable noncontrolling interest was further reduced by a probability factor of the potential assignment of the common shares of HK TMS, LLC to Apollo Global
Management, which occurred subsequent to the fresh-start date. Refer to Note 5, "Acquisitions and Divestitures," for further information
regarding the divestiture of HK TMS, LLC on September 30, 2016.
- 15)
- Reflects the cumulative effect of the fresh-start accounting adjustments discussed above.
Reorganization Items
Reorganization items represent (i) expenses or income incurred subsequent to the Petition Date as a direct result of the Plan, (ii) gains or losses from liabilities settled, and (iii) fresh-start accounting
106
HALCÓN RESOURCES CORPORATION
NOTES TO THE CONSOLIDATED FINANCIAL STATEMENTS (Continued)
3. FRESH-START ACCOUNTING (Continued)
adjustments and are recorded in "Reorganization items" in the Company's consolidated statements of operations. The following table summarizes the net reorganization items (in thousands):
| |
Successor |
|
Predecessor | ||||||
|---|---|---|---|---|---|---|---|---|---|
| |
Period from September 10, 2016 through December 31, 2016 |
|
Period from January 1, 2016 through September 9, 2016 |
||||||
| |
|
||||||||
| |
|
||||||||
| |
|
||||||||
Gain on settlement of Liabilities subject to compromise |
$ | — | $ | 1,368,908 | |||||
Fresh start adjustments |
— | (392,232 | ) | ||||||
Reorganization professional fees and other |
(2,049 | ) | (30,287 | ) | |||||
Write-off debt discounts/premiums and debt issuance costs |
— | (32,667 | ) | ||||||
| | | | | | | | | | |
Gain (loss) on reorganization items |
$ | (2,049 | ) | $ | 913,722 | ||||
| | | | | | | | | | |
| | | | | | | | | | |
| | | | | | | | | | |
4. RESTRUCTURING
In 2017 and 2016, the Company had reductions in its workforce in conjunction with its divestiture activities in 2017 and the decrease in drilling and developmental activities planned for 2016. Consequently, for the year ended December 31, 2017 and the period January 1, 2016 through September 9, 2016, the Company incurred approximately $7.5 million and $5.2 million, respectively, in severance costs and accelerated stock-based compensation expense related to the termination of certain employees. These costs were recorded in "Restructuring" on the consolidated statements of operations.
5. ACQUISITIONS AND DIVESTITURES
Acquisitions
Recent Acquisition of Additional Properties in Monument Draw (Ward and Winkler Counties, Texas)
On December 13, 2017, the Company acquired undeveloped acreage and related assets in the Delaware Basin, in an area contiguous to the western and southern areas of the Company's existing Monument Draw properties in Ward County, Texas from a private company, for a total cash purchase price of $101.6 million, subject to customary post-closing adjustments. The effective date of the acquisition was September 1, 2017.
Hackberry Draw Assets (Pecos and Reeves Counties, Texas)
On January 18, 2017, Halcón Energy Properties, Inc., a wholly owned subsidiary of the Company, entered into a Purchase and Sale Agreement with Samson Exploration, LLC (Samson), pursuant to which it agreed to acquire acreage and related assets in the Hackberry Draw area of the Delaware Basin, located in Pecos and Reeves Counties, Texas (collectively, the Pecos County Assets), for a total adjusted purchase price of $699.2 million (the Pecos County Acquisition). The Pecos County Acquisition closed on February 28, 2017. The transaction had an effective date of November 1, 2016. The Company funded the Pecos County Acquisition with the net proceeds from the private placement of new 8% automatically convertible preferred stock and borrowings under its Senior Credit Agreement. Refer to Note 13, "Stockholders' Equity," for further discussion of the Company's issuance of the preferred stock.
107
HALCÓN RESOURCES CORPORATION
NOTES TO THE CONSOLIDATED FINANCIAL STATEMENTS (Continued)
5. ACQUISITIONS AND DIVESTITURES (Continued)
The Pecos County Acquisition was accounted for as a business combination in accordance with ASC 805, Business Combinations (ASC 805) which, among other things, requires assets acquired and liabilities assumed to be measured at their acquisition date fair values. The estimated fair value of the properties acquired approximates the fair value of consideration and as a result no goodwill was recognized.
The following table summarizes the consideration paid to acquire the Pecos County Assets, as well as the estimated values of assets acquired and liabilities assumed as of the acquisition date (in thousands):
Cash consideration paid to Samson at closing(1) |
$ | 703,865 | ||
Less: Post-effective closing date adjustments(2) |
(4,677 | ) | ||
| | | | | |
Final consideration transferred |
$ | 699,188 | ||
| | | | | |
| | | | | |
| | | | | |
Plus: Estimated Fair Value of Liabilities Assumed: |
||||
Current liabilities |
$ | 839 | ||
Asset retirement obligations |
2,116 | |||
| | | | | |
Amount attributable to liabilites assumed |
2,955 | |||
| | | | | |
Total purchase price plus liabilities assumed |
$ | 702,143 | ||
| | | | | |
| | | | | |
| | | | | |
Estimated Fair Value of Assets Acquired: |
||||
Evaluated oil and natural gas properties(3)(4) |
$ | 188,275 | ||
Unevaluated oil and natural gas properties(3)(4) |
487,489 | |||
Gas gathering and other operating assets(5) |
26,379 | |||
| | | | | |
Amount attributable to assets acquired |
$ | 702,143 | ||
| | | | | |
| | | | | |
| | | | | |
- (1)
- Represents amount of cash consideration, adjusted for customary closing items, for the purchase of the Pecos County Assets
funded by the issuance of approximately $400.1 million of new 8% automatically convertible preferred stock and borrowings under the Senior Credit
Agreement.
- (2)
- In accordance with the purchase agreement, the effective date of the acquisition was November 1, 2016 and therefore
revenues, expenses and related capital expenditures from November 1, 2016 through February 28, 2017, the closing date of the Pecos County Acquisition, have been reflected as adjustments
to the purchase price consideration.
- (3)
- In estimating the fair value of the Pecos County Assets' oil and natural gas properties, the Company used an income approach. For purposes of estimating the fair value of the proved, probable and possible reserves, an income approach was used which estimated fair value based on the anticipated cash flows associated with the Pecos County Assets' estimated reserves risked by reserve category and discounted using a weighted average cost of capital rate of 10.0% for proved reserves and 12.0% for probable and possible reserves. The proved reserve locations were limited to wells expected to be drilled in the Company's five-year development plan. This estimation includes the use of unobservable inputs, such as estimated future production, oil and natural gas revenues and expenses. The use of these unobservable inputs results in the fair value estimate of the Pecos County Assets being classified as Level 3.
108
HALCÓN RESOURCES CORPORATION
NOTES TO THE CONSOLIDATED FINANCIAL STATEMENTS (Continued)
5. ACQUISITIONS AND DIVESTITURES (Continued)
- (4)
- Weighted average commodity prices utilized in the determination of the fair value of oil and natural gas properties were $76.10
per barrel of oil, $4.14 per Mcf of natural gas and $29.48 per barrel of oil equivalent of natural gas liquids, after adjustment for transportation fees and regional price differentials. Base pricing
was derived from an average of forward strip prices and research analysts' estimated prices.
- (5)
- In estimating the fair value of the Pecos County Assets' other operating property and equipment, the Company used a combination of the cost and market approaches. A market approach was relied upon to value the land, heavy equipment and vehicles, and in this valuation approach, recent transactions of similar assets were utilized to determine the value from a market participant perspective. For the remaining other operating assets, a cost approach was used. The estimation of fair value under the cost approach was based on current replacement costs of the assets, less depreciation based on the estimated economic useful lives of the assets and age of the assets.
The following unaudited pro forma combined results of operations are provided for the year ended December 31, 2017, the period of September 10, 2016 through December 31, 2016 and the period of January 1, 2016 through September 9, 2016 as though the Pecos County Acquisition had been completed as of the beginning of the comparable prior annual reporting period, or January 1, 2016. The pro forma combined results of operations for the year ended December 31, 2017, the period of September 10, 2016 through September 30, 2016 and the period of January 1, 2016 through September 9, 2016 have been prepared by adjusting the historical results of the Company to include the historical results of the Pecos County Assets. These supplemental pro forma results of operations are provided for illustrative purposes only and do not purport to be indicative of the actual results that would have been achieved by the combined Company for the periods presented or that may be achieved by the combined Company in the future. The pro forma results of operations do not include any cost savings or other synergies that resulted, or may result, from the Pecos County Acquisition or any estimated costs that will be incurred to integrate the Pecos County Assets. Future results may vary significantly from the results reflected in this unaudited pro forma financial information because of future events and transactions, as well as other factors. Amounts included in the table below are rounded to thousands.
| |
Successor |
|
Predecessor | |||||||||
|---|---|---|---|---|---|---|---|---|---|---|---|---|
| |
|
|||||||||||
| |
|
Period from September 10, 2016 through December 31, 2016 |
|
Period from January 1, 2016 through September 9, 2016 |
||||||||
| |
Year Ended December 31, 2017 |
|
||||||||||
| |
|
|||||||||||
| |
|
|||||||||||
| |
(Unaudited) |
(Unaudited) |
|
(Unaudited) |
||||||||
Revenue |
$ | 385,867 | $ | 166,499 | $ | 288,902 | ||||||
Net income (loss) |
542,724 | (475,580 | ) | 16,513 | ||||||||
Net income (loss) available to common stockholders |
494,717 | (476,371 | ) | (28,239 | ) | |||||||
Pro forma net income (loss) per share of common stock: |
||||||||||||
Basic |
$ | 3.73 | $ | (5.22 | ) | $ | (0.23 | ) | ||||
Diluted |
$ | 3.70 | $ | (5.22 | ) | $ | (0.23 | ) | ||||
109
HALCÓN RESOURCES CORPORATION
NOTES TO THE CONSOLIDATED FINANCIAL STATEMENTS (Continued)
5. ACQUISITIONS AND DIVESTITURES (Continued)
The Company's historical financial information was adjusted to give effect to the pro forma events that are directly attributable to the Pecos County Assets and are factually supportable. The unaudited pro forma consolidated results include the historical revenues and expenses of assets acquired and liabilities assumed, with the following adjustments:
- •
- Adjustment to recognize incremental depletion expense under the full cost method of accounting based on the fair value of the oil and natural
gas properties and incremental accretion expense based on the asset retirement costs of the oil and natural gas properties at acquisition;
- •
- Adjustment to recognize incremental depreciation expense of the other operating property and equipment and incremental accretion expense based
on the asset retirement costs of the other operating property and equipment at acquisition; and
- •
- Eliminate transaction costs and non-recurring charges directly related to the transactions that were included in the historical results of operations for the Company in the amount of approximately $1.0 million. Transaction costs directly related to the transaction that do not have a continuing impact on the combined Company's operating results have been excluded from the pro forma earnings.
For the year ended December 31, 2017, the Company recognized $46.2 million of oil, natural gas and natural gas liquids and other revenue related to the Pecos County Assets and $5.9 million of net field operating income (oil, natural gas and natural gas liquids and other revenues less lease operating expense, workover expense, production taxes, gathering and other expense, and depletion, depreciation and accretion expense) related to the Pecos County Assets. Additionally, non-recurring transaction costs of approximately $1.0 million related to the Pecos County Acquisition for the year ended December 31, 2017 are included in the consolidated statements of operations in "General and administrative" expenses; these non-recurring transaction costs have been excluded from the pro forma results for all periods presented in the above table.
Monument Draw Assets (Ward and Winkler Counties, Texas)
On December 9, 2016, the Company entered into an agreement with a private company, pursuant to which the Company acquired the rights to purchase acreage in the Monument Draw area of the Delaware Basin, located in Ward and Winkler Counties, Texas (the Ward County Assets) prospective for the Wolfcamp and Bone Spring formations for an initial purchase price of $11,000 per acre. The Ward County Assets are divided into two tracts (the Southern Tract and the Northern Tract) with separate options for each tract. The agreement was subsequently amended on June 14, 2017 to increase the purchase price of the Southern Tract and the Northern Tract acreage, from $11,000 per acre to $13,000 per acre, for rights to additional depths in the acreage under option. Pursuant to the terms of the agreement, on June 15, 2017, the Company purchased the Southern Tract acreage for approximately $87.4 million and on January 9, 2018, the Company purchased the Northern Tract acreage for approximately $108.2 million.
110
HALCÓN RESOURCES CORPORATION
NOTES TO THE CONSOLIDATED FINANCIAL STATEMENTS (Continued)
5. ACQUISITIONS AND DIVESTITURES (Continued)
Divestitures
Williston Basin Non-Operated Assets
On September 19, 2017, certain wholly owned subsidiaries of the Company entered into an agreement with a privately-owned company pursuant to which the Company sold its non-operated properties and related assets located in the Williston Basin in North Dakota and Montana (the Non-Operated Williston Assets) for a total adjusted sales price of approximately $105.2 million, before certain post-closing adjustments as provided for in the sales agreement. The effective date of the transaction was April 1, 2017 and the transaction closed on November 9, 2017. Proceeds from the sale were recorded as a reduction to the carrying value of the Company's full cost pool with no gain or loss recorded.
Williston Basin Operated Assets
On July 10, 2017, the Company and certain of its subsidiaries entered into an agreement with Bruin Williston Holdings, LLC for the sale of all of the Company's operated oil and natural gas leases, oil and natural gas wells and related assets located in the Williston Basin in North Dakota, as well as 100% of the membership interests in two of its subsidiaries (the Williston Assets) for a total adjusted sales price of approximately $1.4 billion, before certain post-closing adjustments as provided for in the sales agreement (the Williston Divestiture). The effective date of the sale was June 1, 2017 and the transaction closed on September 7, 2017. The Company used the net proceeds from the sale to repay borrowings outstanding under its Senior Credit Agreement, repurchase approximately $425 million principal amount of the then outstanding $850 million principal amount of its 6.75% senior notes, redeem all of its outstanding 12% senior secured second lien notes and for general corporate purposes.
The net proceeds from the sale were allocated between the Company's oil and natural gas properties, other operating property and equipment and liabilities transferred on a fair value basis. Approximately $1.39 billion was allocated to the Company's oil and natural gas properties and approximately $10.9 million was allocated to other operating property and equipment.
As discussed further in Note 6, "Oil and Natural Gas Properties," the Company uses the full cost method of accounting for its investment in oil and natural gas properties. Under this method of accounting, sales of oil and gas properties are accounted for as adjustments to capitalized costs with no gain or loss recognized, unless the adjustment significantly alters the relationship between capitalized costs and proved reserves. If the Williston Divestiture was accounted for as an adjustment of capitalized costs with no gain or loss recognized, the adjustment would have significantly altered the relationship between capitalized costs and proved reserves. Accordingly, the Company recognized a gain on the sale of the Williston Assets of $485.9 million during the year ended December 31, 2017. The carrying value of the properties sold was determined by allocating total capitalized costs within the full cost pool between properties sold and properties retained based on their relative fair values. The gain was recorded in "Gain (loss) on the sale of oil and natural gas properties," on the Company's consolidated statements of operations.
111
HALCÓN RESOURCES CORPORATION
NOTES TO THE CONSOLIDATED FINANCIAL STATEMENTS (Continued)
5. ACQUISITIONS AND DIVESTITURES (Continued)
East Texas Eagle Ford Assets
On January 24, 2017, certain of the Company's subsidiaries entered into an agreement with a subsidiary of Hawkwood Energy, LLC (Hawkwood) for the sale of all of the Company's oil and natural gas properties and related assets located in the Eagle Ford formation of East Texas (the El Halcón Assets) for a total adjusted sales price of $491.1 million (the El Halcón Divestiture). The effective date of the sale was January 1, 2017 and the transaction closed on March 9, 2017. The Company used the net proceeds from the sale to repay borrowings outstanding under its Senior Credit Agreement and for general corporate purposes.
The net proceeds from the sale were allocated between the Company's oil and natural gas properties, other operating property and equipment and liabilities transferred on a fair value basis. Approximately $484.1 million was allocated to the Company's oil and natural gas properties and $10.2 million was allocated to other operating property and equipment.
Under the full cost method of accounting, sales of oil and gas properties are accounted for as adjustments of capitalized costs with no gain or loss recognized, unless the adjustment significantly alters the relationship between capitalized costs and proved reserves. If the El Halcón Divestiture was accounted for as an adjustment of capitalized costs with no gain or loss recognized, the adjustment would have significantly altered the relationship between capitalized costs and proved reserves. Accordingly, the Company recognized a gain on the sale in connection with this transaction of $235.7 million during the year ended December 31, 2017. The carrying value of the properties sold was determined by allocating total capitalized costs within the full cost pool between properties sold and properties retained based on their relative fair values. The gain was recorded in "Gain (loss) on sale of oil and natural gas properties," on the Company's consolidated statements of operations.
HK TMS, LLC
On September 30, 2016, certain wholly-owned subsidiaries of the Successor Company executed an Assignment and Assumption Agreement with an affiliate of Apollo Global Management (Apollo) pursuant to which Apollo acquired one hundred percent (100%) of the common shares (the Membership Interests) of HK TMS, LLC (HK TMS), which transaction is referred to as the HK TMS Divestiture. HK TMS was previously a wholly-owned subsidiary and held all of the Successor Company's oil and natural gas properties in the Tuscaloosa Marine Shale (TMS). In exchange for the assignment of the Membership Interests, Apollo assumed all obligations relating to the Membership Interests, which were previously classified as "Mezzanine Equity" on the consolidated balance sheets of HK TMS, from and after such date. Refer to Note 12, "Mezzanine Equity" for further details of the accounting considerations for HK TMS.
112
HALCÓN RESOURCES CORPORATION
NOTES TO THE CONSOLIDATED FINANCIAL STATEMENTS (Continued)
6. OIL AND NATURAL GAS PROPERTIES
Oil and natural gas properties as of December 31, 2017 and 2016 consisted of the following (in thousands):
| |
Successor | ||||||
|---|---|---|---|---|---|---|---|
| |
December 31, 2017 |
December 31, 2016 |
|||||
Subject to depletion |
$ | 877,316 | $ | 1,269,034 | |||
| | | | | | | | |
Not subject to depletion: |
|||||||
Exploration and extension wells in progress |
5,298 | 5,159 | |||||
Other capital costs: |
|||||||
Incurred in 2017 |
760,488 | — | |||||
Incurred in 2016(1) |
— | 311,280 | |||||
Incurred in 2015 |
— | — | |||||
Incurred in 2014 and prior |
— | — | |||||
| | | | | | | | |
Total not subject to depletion |
765,786 | 316,439 | |||||
| | | | | | | | |
Gross oil and natural gas properties |
1,643,102 | 1,585,473 | |||||
Less accumulated depletion |
(570,155 | ) | (465,849 | ) | |||
| | | | | | | | |
Net oil and natural gas properties |
$ | 1,072,947 | $ | 1,119,624 | |||
| | | | | | | | |
| | | | | | | | |
| | | | | | | | |
- (1)
- In 2016, with the application of fresh-start accounting, the Company's unevaluated properties were recorded at fair value as of the fresh-start reporting date.
The Company uses the full cost method of accounting for its investment in oil and natural gas properties. Under this method of accounting, all costs of acquisition, exploration and development of oil and natural gas reserves (including such costs as leasehold acquisition costs, geological expenditures, dry hole costs, tangible and intangible development costs and direct internal costs) are capitalized as the cost of oil and natural gas properties when incurred. To the extent capitalized costs of evaluated oil and natural gas properties, net of accumulated depletion, exceed the discounted future net revenues of proved oil and natural gas reserves, net of deferred taxes, such excess capitalized costs are charged to expense.
With the adoption of fresh-start accounting, the Company recorded its oil and natural gas properties at fair value as of September 9, 2016. The Company's evaluated and unevaluated properties were assigned values of $1.2 billion and $332.1 million, respectively. Refer to Note 3, "Fresh-start Accounting," for a discussion of the valuation approaches used.
Additionally, the Company assesses all properties classified as unevaluated property on a quarterly basis for possible impairment or reduction in value. The Company assesses properties on an individual basis or as a group, if properties are individually insignificant. The assessment includes consideration of the following factors, among others: intent to drill; remaining lease term; geological and geophysical evaluations; drilling results and activity; the assignment of proved reserves; and the economic viability of development if proved reserves are assigned. During any period in which these factors indicate impairment, the cumulative drilling costs incurred to date for such property and all or a portion of the associated leasehold costs are transferred to the full cost pool and are then subject to depletion and the full cost ceiling test limitation. In March 2016, the Predecessor Company transferred the remaining
113
HALCÓN RESOURCES CORPORATION
NOTES TO THE CONSOLIDATED FINANCIAL STATEMENTS (Continued)
6. OIL AND NATURAL GAS PROPERTIES (Continued)
unevaluated Utica and TMS properties of approximately $330.4 million and $74.8 million, respectively, to the full cost pool. For the quarter ended March 31, 2016, management concluded that it was no longer probable that capital would be available or approved to continue exploratory drilling activities in the Predecessor Company's Utica or TMS acreage positions in advance of the related lease expirations due to the Predecessor Company's evaluation of strategic alternatives to reduce its debt and preserve liquidity in light of continued low commodity prices, together with a reduction of the Predecessor Company's exploration department and the Predecessor Company's intent to expend capital only on its most economical and proven areas.
Investments in unevaluated oil and natural gas properties and exploration and development projects for which depletion expense is not currently recognized, and for which exploration or development activities are in progress, qualify for interest capitalization. The Predecessor Company determined capitalized interest by multiplying the Predecessor Company's weighted-average borrowing cost on debt by the average amount of qualifying costs incurred that were excluded from the full cost pool; however, the amount of capitalized interest cannot exceed the amount of gross interest expense incurred in any given period. The capitalized interest amounts were recorded as additions to unevaluated oil and natural gas properties on the consolidated balance sheets. As the costs excluded were transferred to the full cost pool, the associated capitalized interest was also transferred to the full cost pool. For the period from January 1, 2016 through September 9, 2016, the Predecessor Company capitalized interest costs of $68.2 million. The Successor Company's policy on the capitalization of interest establishes thresholds for the determination of a development project for the purpose of interest capitalization.
The ceiling test value of the Company's reserves was calculated based on the following prices:
| |
West Texas Intermediate (per barrel)(1) |
Henry Hub (per MMBtu)(1) |
|||||
|---|---|---|---|---|---|---|---|
December 31, 2017 |
$ | 51.34 | $ | 2.976 | |||
December 31, 2016 |
42.75 | 2.481 | |||||
December 31, 2015 |
50.28 | 2.587 | |||||
- (1)
- Unweighted average of the first day of the 12-months ended spot price, adjusted by lease or field for quality, transportation fees and market differentials.
The Company's net book value of oil and natural gas properties at March 31, June 30, September 30, and December 31, 2017 did not exceed the ceiling amount. The Company's net book value of oil and natural gas properties at March 31, June 30 and September 30, 2016 exceeded the ceiling amount. The Company recorded full cost ceiling test impairments before income taxes of $420.9 million ($268.1 million after taxes, before valuation allowance) for the period of September 10, 2016 through September 30, 2016 and $754.8 million ($478.2 million after taxes, before valuation allowance) for the six months ended June 30, 2016. The impairment at September 30, 2016 reflects the differences between the first day of the month average prices for the preceding twelve months required by Regulation S-X, Rule 4-10 and ASC 932 in calculating the ceiling test and the forward-looking prices required by ASC 852 to estimate the fair value of the Company's oil and natural gas properties on the fresh-start reporting date of September 9, 2016. The ceiling test impairments at March 31, 2016 and June 30, 2016, were driven by decreases in the first-day-of-the-month 12-month average prices for
114
HALCÓN RESOURCES CORPORATION
NOTES TO THE CONSOLIDATED FINANCIAL STATEMENTS (Continued)
6. OIL AND NATURAL GAS PROPERTIES (Continued)
crude oil used in the ceiling test calculations since December 31, 2015. The impairment at March 31, 2016 also reflects the transfer of the remaining unevaluated Utica and TMS properties, as discussed above.
The Predecessor Company's net book value of oil and natural gas properties at March 31, June 30, September 30 and December 31, 2015 exceeded the ceiling amount. The Predecessor Company recorded a full cost ceiling test impairment before income taxes of $2.6 billion ($1.7 billion after taxes, before valuation allowance) for the year ended December 31, 2015. The impairment for the year ended December 31, 2015 was driven by decreases in the first-day-of-the-month average prices for crude oil used in the ceiling test calculations from $94.99 per barrel at December 31, 2014 to $50.28 per barrel at December 31, 2015.
The Company recorded the full cost ceiling test impairments in "Full cost ceiling impairment" in the Company's consolidated statements of operations and in "Accumulated depletion" in the Company's consolidated balance sheets.
Changes in commodity prices, production rates, levels of reserves, future development costs, transfers of unevaluated properties to the full cost pool, capital spending, and other factors will determine the Company's actual ceiling test calculation and impairment analyses in future periods.
7. LONG-TERM DEBT
Long-term debt as of December 31, 2017 and 2016 consisted of the following (in thousands):
| |
Successor | ||||||
|---|---|---|---|---|---|---|---|
| |
December 31, 2017 |
December 31, 2016 |
|||||
Senior revolving credit facility |
$ | — | $ | 186,000 | |||
8.625% senior secured second lien notes due 2020(1) |
— | 672,613 | |||||
12.0% senior secured second lien notes due 2022(2) |
— | 106,040 | |||||
6.75% senior notes due 2025(3) |
409,168 | — | |||||
| | | | | | | | |
|
$ | 409,168 | $ | 964,653 | |||
| | | | | | | | |
| | | | | | | | |
| | | | | | | | |
- (1)
- On February 16, 2017, the Company repurchased approximately 41% of the outstanding aggregate principal amount of its
8.625% senior secured second lien notes due 2020 with proceeds from the issuance of new 6.75% senior notes due 2025. The remaining aggregate principal amount was redeemed on March 20, 2017.
Amount was net of a $27.4 million unamortized discount at December 31, 2016. Refer to "8.625% Senior Secured Second Lien Notes" below for further
details.
- (2)
- The Company redeemed the outstanding aggregate principal amount of its 12.0% senior secured second lien notes due 2022 on
October 7, 2017. Amount is net of a $6.8 million unamortized discount at December 31, 2016. Refer to "12.0% Senior Secured Second Lien Notes" below for further
details.
- (3)
- On February 16, 2017, the Company issued $850.0 million aggregate principal amount of new 6.75% senior notes due 2025. On October 10, 2017, the Company repurchased approximately $425.0 million principal amount of the 2025 Notes at 103.0% of par plus accrued and unpaid interest. Amount is net of $8.1 million unamortized discount and $7.7 million unamortized debt issuance costs at December 31, 2017. Refer to "6.75% Senior Notes" below for further details.
115
HALCÓN RESOURCES CORPORATION
NOTES TO THE CONSOLIDATED FINANCIAL STATEMENTS (Continued)
7. LONG-TERM DEBT (Continued)
Senior Revolving Credit Facility
On September 7, 2017, the Company entered into an Amended and Restated Senior Secured Revolving Credit Agreement (the Senior Credit Agreement) by and among the Company, as borrower, JPMorgan Chase Bank, N.A., as administrative agent, and certain other financial institutions party thereto, as lenders. The Senior Credit Agreement amends and restates in its entirety the original Senior Secured Revolving Credit Agreement entered into on September 9, 2016. Pursuant to the Senior Credit Agreement, the lenders party thereto have agreed to provide the Company with a $1.0 billion senior secured reserve-based revolving credit facility with a current borrowing base of $100.0 million. The maturity date of the Senior Credit Agreement is September 7, 2022. The borrowing base will be redetermined semi-annually, with the lenders and the Company each having the right to one interim unscheduled redetermination between any two consecutive semi-annual redeterminations. The borrowing base takes into account the estimated value of the Company's oil and natural gas properties, proved reserves, total indebtedness, and other relevant factors consistent with customary oil and natural gas lending criteria. Amounts outstanding under the Senior Credit Agreement bear interest at specified margins over the base rate of 1.25% to 2.25% for ABR-based loans or at specified margins over LIBOR of 2.25% to 3.25% for Eurodollar-based loans. These margins fluctuate based on the Company's utilization of the facility. The Company may elect, at its option, to prepay any borrowings outstanding under the Senior Credit Agreement without premium or penalty (except with respect to any break funding payments which may be payable pursuant to the terms of the Senior Credit Agreement). Amounts outstanding under the Senior Credit Agreement are guaranteed by certain of the Company's direct and indirect subsidiaries and secured by a security interest in substantially all of the assets of the Company and its subsidiaries.
The Senior Credit Agreement also contains certain financial covenants, including the maintenance of (i) a Total Net Indebtedness Leverage Ratio (as defined in the Senior Credit Agreement) not to exceed 4.00:1.00 and (ii) a Current Ratio (as defined in the Senior Credit Agreement) not to be less than 1.00:1.00. At December 31, 2017, the Company was in compliance with the financial covenants under the Senior Credit Agreement.
The Senior Credit Agreement also contains certain events of default, including non-payment; breaches of representations and warranties; non-compliance with covenants or other agreements; cross-default to material indebtedness; judgments; change of control; and voluntary and involuntary bankruptcy.
At December 31, 2017, under the effective borrowing base of $100.0 million, the Company had no indebtedness outstanding, approximately $1.6 million letters of credit outstanding and approximately $98.4 million of borrowing capacity available under the Senior Credit Agreement.
On February 2, 2018, the Company entered into the Second Amendment (the Second Amendment) to the Senior Credit Agreement by and among the Company, as borrower, JPMorgan Chase Bank, N.A., as administrative agent, and certain other financial institutions party thereto, as lenders. The Second Amendment, among other things, provides for (i) the use of annualized financial data in determining EBITDA (as defined in the Senior Credit Agreement) for the fiscal quarters ending June 30, 2018, September 30, 2018 and December 31, 2018, (ii) an increase in the ratio of Consolidated Total Net Debt (as defined in the Senior Credit Agreement) to EBITDA of 4.50:1.00 for the fiscal quarter ending June 30, 2018, and a ratio of 4.00:1.00 for any fiscal quarter thereafter, (iii) a waiver of compliance with the covenant relating to the Total Net Indebtedness Leverage Ratio (as
116
HALCÓN RESOURCES CORPORATION
NOTES TO THE CONSOLIDATED FINANCIAL STATEMENTS (Continued)
7. LONG-TERM DEBT (Continued)
defined in the Senior Credit Agreement) for the fiscal quarter ending March 31, 2018, and (iv) a waiver of the automatic reduction to the borrowing base that would otherwise result due to the issuance of the Additional 2025 Notes (defined below). See Note 17, "Subsequent Events," for further details on the Second Amendment.
8.625% Senior Secured Second Lien Notes
On May 1, 2015, the Company issued $700.0 million aggregate principal amount of its 8.625% senior secured second lien notes due 2020 (the 2020 Second Lien Notes) in a private offering. The 2020 Second Lien Notes were issued at par. The net proceeds from the sale of the 2020 Second Lien Notes were approximately $686.2 million (after deducting offering fees and expenses). The 2020 Second Lien Notes bore interest at a rate of 8.625% per annum, payable semi-annually on February 1 and August 1 of each year. In accordance with the Plan, the 2020 Second Lien Notes were unimpaired and reinstated upon the Company's emergence from chapter 11 bankruptcy.
On February 16, 2017, the Company paid approximately $303.5 million for approximately $289.2 million principal amount of 2020 Second Lien Notes, a make-whole premium of $13.2 million plus accrued and unpaid interest of approximately $1.1 million to repurchase such notes pursuant to a tender offer and issued a redemption notice to redeem the remaining 2020 Second Lien Notes. On February 21, 2017, the Company paid approximately $1.2 million for approximately $1.2 million of principal amount of 2020 Second Lien Notes, a make-whole premium of approximately $54,000 plus accrued and unpaid interest to repurchase such notes pursuant to guaranteed delivery procedures of the tender offer. On March 20, 2017, the Company paid approximately $432.0 million for $409.6 million aggregate principal amount of 2020 Second Lien Notes, a make-whole premium of $17.7 million and unpaid interest of approximately $4.8 million to redeem the remaining notes at a price of 104.313% of the principal amount thereof, plus accrued and unpaid interest to, but not including, the redemption date. The repurchase and redemption of the 2020 Second Lien Notes was funded with proceeds from the issuance of $850.0 million in new 6.75% senior notes due 2025, discussed further below.
The Company recognized a loss on the extinguishment of debt, representing a $30.9 million loss on the repurchase for the tender premium paid and a $26.0 million loss on the write-off of the discount on the notes. The loss was recorded in "Gain (loss) on extinguishment of debt" on the consolidated statements of operations.
12.0% Senior Secured Second Lien Notes
On December 21, 2015, the Company completed the issuance in a private placement of approximately $112.8 million aggregate principal amount of new 12.0% senior secured second lien notes due 2022 (the 2022 Second Lien Notes) in exchange for approximately $289.6 million principal amount of its then outstanding senior unsecured notes, consisting of $116.6 million principal amount of 9.75% senior notes due 2020, $137.7 million principal amount of 8.875% senior notes due 2021 and $35.3 million principal amount of 9.25% senior notes due 2022. At closing, the Predecessor Company paid all accrued and unpaid interest since the respective interest payment dates of the unsecured notes surrendered in the exchange. The 2022 Second Lien Notes bore interest at a rate of 12.0% per annum, payable semi-annually on February 15 and August 15 of each year. In accordance with the terms of the Plan, the 2022 Second Lien Notes were unimpaired and reinstated upon the Company's emergence from chapter 11 bankruptcy.
117
HALCÓN RESOURCES CORPORATION
NOTES TO THE CONSOLIDATED FINANCIAL STATEMENTS (Continued)
7. LONG-TERM DEBT (Continued)
On September 7, 2017, the Company issued an irrevocable notice to redeem the outstanding aggregate principal amount of its 2022 Second Lien Notes on October 7, 2017 (the Redemption Date). In accordance with the terms of the indenture governing the 2022 Second Lien Notes, all of the outstanding 2022 Second Lien Notes were redeemed at a redemption price equal to the principal amount of $112.8 million plus a make whole premium of approximately $23.0 million and accrued and unpaid interest of approximately $2.0 million. On September 7, 2017, utilizing $137.8 million of the proceeds from the Williston Divestiture, the Company deposited with U.S. Bank National Association an amount of funds sufficient to fund the redemption, delivered instructions to apply the deposited funds toward the redemption, and received a written acknowledgment from U.S. Bank National Association of the satisfaction and discharge of the indenture governing the 2022 Second Lien Notes and the obligations of the Company and the subsidiary guarantors under the 2022 Second Lien Notes and related guarantees. The payment of the redemption price and accrued interest to a holder of 2022 Second Lien Notes became due and payable on the Redemption Date upon presentation and surrender by the holder of such notes.
The Company recognized a loss on the extinguishment of debt, representing a $23.0 million loss on the redemption for the make whole premium paid and a $6.2 million loss on the write-off of the discount on the notes. The loss was recorded in "Gain (loss) on extinguishment of debt" on the consolidated statements of operations.
6.75% Senior Notes
On February 16, 2017, the Company issued $850.0 million aggregate principal amount of new 6.75% senior notes due 2025 (the 2025 Notes) in a private placement exempt from registration under Section 4(a)(2) of the Securities Act of 1933, as amended (Securities Act), Rule 144A and Regulation S, and applicable state securities laws. The 2025 Notes were issued at par and bear interest at a rate of 6.75% per annum, payable semi-annually on February 15 and August 15 of each year. The 2025 Notes will mature on February 15, 2025. Proceeds from the private placement were approximately $834.1 million after deducting initial purchasers' discounts and commissions and offering expenses. The Company used a portion of the net proceeds from the private placement to fund the repurchase and redemption of the outstanding 2020 Second Lien Notes, as discussed above, and for general corporate purposes.
The 2025 Notes are governed by an Indenture, dated as of February 16, 2017 (as supplemented, the February 2017 Indenture) by and among the Company, the Guarantors and U.S. Bank National Association, as Trustee, which contains affirmative and negative covenants that, among other things, limit the ability of the Company and the Guarantors to incur indebtedness; purchase or redeem stock or subordinated indebtedness; make investments; create liens; enter into transactions with affiliates; sell assets; refinance certain indebtedness; merge with or into other companies or transfer substantially all of their assets; and, in certain circumstances, to pay dividends or make other distributions on stock. The February 2017 Indenture also contains customary events of default. Upon the occurrence of certain events of default, the Trustee or the holders of the 2025 Notes may declare all outstanding 2025 Notes to be due and payable immediately. The 2025 Notes are jointly and severally, fully and unconditionally guaranteed on a senior unsecured basis by the Company's existing wholly-owned subsidiaries. Halcón, the issuer of the 2025 Notes, has no material independent assets or operations apart from the assets and operations of its subsidiaries.
118
HALCÓN RESOURCES CORPORATION
NOTES TO THE CONSOLIDATED FINANCIAL STATEMENTS (Continued)
7. LONG-TERM DEBT (Continued)
In connection with the sale of the 2025 Notes, on February 16, 2017, the Company, the Guarantors and J.P. Morgan Securities LLC, on behalf of itself and as representative of the initial purchasers, entered into a Registration Rights Agreement (the 2017 Registration Rights Agreement) pursuant to which the Company agreed to, among other things, use reasonable best efforts to file a registration statement under the Securities Act and complete an exchange offer for the 2025 Notes within 365 days after closing. The Company filed the registration statement on November 1, 2017 and it was declared effective by the SEC on December 21, 2017. In addition, the Company completed the exchange offer for the 2025 Notes on February 1, 2018.
At any time prior to February 15, 2020, the Company may redeem the 2025 Notes, in whole or in part, at a redemption price equal to 100% of their principal amount plus a make-whole premium, together with accrued and unpaid interest, if any, to the redemption date. The 2025 Notes will be redeemable, in whole or in part, on or after February 15, 2020 at redemption prices equal to the principal amount multiplied by the percentage set forth below, plus accrued and unpaid interest (if any) on the 2025 Notes redeemed during the twelve month period indicated beginning on February 15 of the years indicated below:
Year
|
Percentage | |||
|---|---|---|---|---|
2020 |
105.063 | |||
2021 |
103.375 | |||
2022 |
101.688 | |||
2023 and thereafter |
100.000 | |||
Additionally, the Company may redeem up to 35% of the 2025 Notes prior to February 15, 2020 for a redemption price of 106.75% of the principal amount thereof, plus accrued and unpaid interest, utilizing net cash proceeds from certain equity offerings. In addition, upon a change of control of the Company, holders of the 2025 Notes will have the right to require the Company to repurchase all or any part of their 2025 Notes for cash at a price equal to 101% of the aggregate principal amount of the 2025 Notes repurchased, plus any accrued and unpaid interest.
On July 25, 2017, the Company concluded a consent solicitation of the holders of the 2025 Notes (the Consent Solicitation) and obtained consents to amend the February 2017 Indenture from approximately 99% of the holders of the 2025 Notes. As supplemented, the February 2017 Indenture amends provisions in order to exempt, among other things, the Williston Divestiture from certain provisions therein triggered upon a sale of "all or substantially all of the assets" of the Company. Consenting holders of the 2025 Notes received a consent fee of 2.0% of principal, or $16.9 million. The Company recorded the $16.9 million consent fees paid as a discount on the 2025 Notes.
On September 7, 2017, the Company commenced an offer to purchase for cash up to $425.0 million of the $850.0 million outstanding aggregate principal amount of its 2025 Notes at 103.0% of principal plus accrued and unpaid interest. The consummation of the Williston Divestiture constituted a "Williston Sale" under the February 2017 Indenture, and the Company was required to make an offer to all holders of the 2025 Notes to purchase for cash an aggregate principal amount up to $425.0 million of the 2025 Notes. The offer to purchase expired on October 6, 2017, with notes representing in excess of $425.0 million of principal amount validly tendered. As a result, on October 10, 2017, the Company repurchased approximately $425.0 million principal amount of the 2025 Notes on a pro rata basis at 103.0% of par plus accrued and unpaid interest of approximately $4.1 million.
119
HALCÓN RESOURCES CORPORATION
NOTES TO THE CONSOLIDATED FINANCIAL STATEMENTS (Continued)
7. LONG-TERM DEBT (Continued)
The Company recognized a loss on the extinguishment of debt of approximately $28.9 million, representing a $12.8 million loss on the repurchase for the tender premium paid, an $8.3 million loss on the write-off of the discount, and a $7.8 million loss on the write-off of the debt issuance costs on the notes repurchased. The loss was recorded in "Gain (loss) on extinguishment of debt" on the consolidated statements of operations.
The remaining unamortized discount was $8.1 million at December 31, 2017.
On February 15, 2018, the Company issued an additional $200.0 million aggregate principal amount of its 2025 Notes at a price to the initial purchasers of 103.0% of par (the Additional 2025 Notes). The net proceeds from the sale of the Additional 2025 Notes were approximately $203.0 million after deducting initial purchasers' premiums, commissions and estimated offering expenses and will be used to fund the cash consideration for the acquisition of the West Quito Draw Properties, discussed further in Note 17, "Subsequent Events," and for general corporate purposes, including to fund the Company's 2018 drilling program. These notes were issued under the February 2017 Indenture. See Note 17, "Subsequent Events," for further details on the issuance of the Additional 2025 Notes.
Debt Maturities
Aggregate maturities required on long-term debt at December 31, 2017 due in future years are as follows (in thousands, excluding discounts and debt issuance costs):
2018 |
$ | — | ||
2019 |
— | |||
2020 |
— | |||
2021 |
— | |||
2022 |
— | |||
Thereafter(1) |
425,005 | |||
| | | | | |
Total |
$ | 425,005 | ||
| | | | | |
| | | | | |
| | | | | |
- (1)
- On February 15, 2018, the Company issued an additional $200.0 million aggregate principal amount of its 6.75% senior unsecured notes due 2025, which is not included in the table above. See Note 17, "Subsequent Events," for more details.
Debt Issuance Costs
The Company capitalizes certain direct costs associated with the issuance of debt and amortizes such costs over the lives of the respective debt. During the year ended December 31, 2017, the Company capitalized approximately $17.6 million of debt issuance costs related to the Senior Credit Agreement and the 2025 Notes. For the year ended December 31, 2017, the Company expensed $8.0 million of debt issuance costs in conjunction with debt repurchases and decreases in the borrowing base under the Senior Credit Agreement. As part of the Company's reorganization, all debt issuance costs related to the Company's Predecessor debt were extinguished. At December 31, 2017, the Company had $8.3 million of debt issuance costs remaining that are being amortized over the lives of the respective debt. The debt issuance costs for the Company's Senior Credit Agreement are presented in "Funds in escrow and other" and the debt issuance costs for the Company's senior unsecured debt are presented in "Long-term debt, net" on the consolidated balance sheets.
120
HALCÓN RESOURCES CORPORATION
NOTES TO THE CONSOLIDATED FINANCIAL STATEMENTS (Continued)
8. FAIR VALUE MEASUREMENTS
Pursuant to ASC 820, the Company's determination of fair value incorporates not only the credit standing of the counterparties involved in transactions with the Company resulting in receivables on the Company's consolidated balance sheets, but also the impact of the Company's nonperformance risk on its own liabilities. ASC 820 defines fair value as the price that would be received to sell an asset or paid to transfer a liability in an orderly transaction between market participants at the measurement date (exit price). ASC 820 establishes a fair value hierarchy that prioritizes the inputs to valuation techniques used to measure fair value. The hierarchy assigns the highest priority to unadjusted quoted prices in active markets for identical assets or liabilities (Level 1) and the lowest priority to unobservable inputs (Level 3). Level 2 measurements are inputs that are observable for assets or liabilities, either directly or indirectly, other than quoted prices included within Level 1. The Company utilizes market data or assumptions that market participants would use in pricing the asset or liability, including assumptions about risk and the risks inherent in the inputs to the valuation technique. These inputs can be readily observable, market corroborated, or generally unobservable. The Company classifies fair value balances based on the observability of those inputs.
As required by ASC 820, a financial instrument's level within the fair value hierarchy is based on the lowest level of input that is significant to the fair value measurement. The Company's assessment of the significance of a particular input to the fair value measurement requires judgment, and may affect the valuation of fair value assets and liabilities and their placement within the fair value hierarchy levels. There were no transfers between fair value hierarchy levels for any period presented. The following tables set forth by level within the fair value hierarchy the Company's financial assets and liabilities that were accounted for at fair value as of December 31, 2017 and 2016 (in thousands):
| |
Successor | ||||||||||||
|---|---|---|---|---|---|---|---|---|---|---|---|---|---|
| |
December 31, 2017 | ||||||||||||
| |
Level 1 | Level 2 | Level 3 | Total | |||||||||
Assets |
|||||||||||||
Receivables from derivative contracts |
$ | — | $ | 677 | $ | — | $ | 677 | |||||
| | | | | | | | | | | | | | |
| | | | | | | | | | | | | | |
| | | | | | | | | | | | | | |
Liabilities |
|||||||||||||
Liabilities from derivative contracts |
$ | — | $ | 26,999 | $ | — | $ | 26,999 | |||||
| | | | | | | | | | | | | | |
| | | | | | | | | | | | | | |
| | | | | | | | | | | | | | |
| |
Successor | ||||||||||||
|---|---|---|---|---|---|---|---|---|---|---|---|---|---|
| |
December 31, 2016 | ||||||||||||
| |
Level 1 | Level 2 | Level 3 | Total | |||||||||
Assets |
|||||||||||||
Receivables from derivative contracts |
$ | — | $ | 5,923 | $ | — | $ | 5,923 | |||||
| | | | | | | | | | | | | | |
| | | | | | | | | | | | | | |
| | | | | | | | | | | | | | |
Liabilities |
|||||||||||||
Liabilities from derivative contracts |
$ | — | $ | 16,920 | $ | — | $ | 16,920 | |||||
| | | | | | | | | | | | | | |
| | | | | | | | | | | | | | |
| | | | | | | | | | | | | | |
Derivative contracts listed above as Level 2 include collars and basis swaps that are carried at fair value. The Company records the net change in the fair value of these positions in "Net gain (loss) on derivative contracts" in the Company's consolidated statements of operations. The Company is able to value the assets and liabilities based on observable market data for similar instruments, which resulted in the Company reporting its derivatives as Level 2. This observable data includes the forward curves
121
HALCÓN RESOURCES CORPORATION
NOTES TO THE CONSOLIDATED FINANCIAL STATEMENTS (Continued)
8. FAIR VALUE MEASUREMENTS (Continued)
for commodity prices based on quoted markets prices and implied volatility factors related to changes in the forward curves. See Note 9, "Derivative and Hedging Activities," for additional discussion of derivatives.
The Company's derivative contracts are with major financial institutions with investment grade credit ratings which are believed to have minimal credit risk. As such, the Company is exposed to credit risk to the extent of nonperformance by the counterparties in the derivative contracts; however, the Company does not anticipate such nonperformance.
The following disclosure of the estimated fair value of financial instruments is made in accordance with the requirements of ASC 825, Financial Instruments. The estimated fair value amounts have been determined at discrete points in time based on relevant market information. These estimates involve uncertainties and cannot be determined with precision. The estimated fair value of cash, accounts receivable and accounts payable approximates their carrying value due to their short-term nature. The estimated fair value of the Company's Senior Credit Agreement approximates carrying value because the interest rates approximate current market rates. The following table presents the estimated fair values of the Company's fixed interest rate, long-term debt instruments as of December 31, 2017 and 2016 (excluding discounts and debt issuance costs) (in thousands):
| |
Successor | ||||||||||||
|---|---|---|---|---|---|---|---|---|---|---|---|---|---|
| |
December 31, 2017 | December 31, 2016 | |||||||||||
Debt
|
Principal Amount |
Estimated Fair Value |
Principal Amount |
Estimated Fair Value |
|||||||||
8.625% senior secured second lien notes |
$ | — | $ | — | $ | 700,000 | $ | 733,250 | |||||
12.0% senior secured second lien notes |
— | — | 112,826 | 123,827 | |||||||||
6.75% senior notes |
425,005 | 443,790 | — | — | |||||||||
| | | | | | | | | | | | | | |
|
$ | 425,005 | $ | 443,790 | $ | 812,826 | $ | 857,077 | |||||
| | | | | | | | | | | | | | |
| | | | | | | | | | | | | | |
| | | | | | | | | | | | | | |
The fair value of the Company's fixed interest debt instruments was calculated using Level 2 criteria at December 31, 2017 and 2016. The fair value of the Company's senior notes is based on quoted market prices from trades of such debt.
On February 28, 2017, the Company closed the Pecos County Acquisition and recorded the assets acquired and liabilities assumed at their acquisition date fair values. See Note 5, "Acquisitions and Divestitures," for a discussion of the fair value approaches used by the Company and the classification of the estimates within the fair value hierarchy.
On September 9, 2016, the Company emerged from chapter 11 bankruptcy and adopted fresh-start accounting, which resulted in the Company becoming a new entity for financial reporting purposes. Upon the adoption of fresh-start accounting, the Company's assets and liabilities were recorded at their fair values as of the fresh-start reporting date, September 9, 2016. See Note 3, "Fresh-start Accounting," for a detailed discussion of the fair value approaches used by the Company.
For the period from January 1, 2016 through September 9, 2016, the Predecessor Company recorded a non-cash impairment charge of $28.1 million related to its gas gathering infrastructure. See Note 1, "Financial Statement Presentation," for a discussion of the valuation approach used and the classification of the estimate within the fair value hierarchy.
122
HALCÓN RESOURCES CORPORATION
NOTES TO THE CONSOLIDATED FINANCIAL STATEMENTS (Continued)
8. FAIR VALUE MEASUREMENTS (Continued)
The Company follows the provisions of ASC 820, for nonfinancial assets and liabilities measured at fair value on a non-recurring basis. These provisions apply to the Company's initial recognition of asset retirement obligations for which fair value is used. The asset retirement obligation estimates are derived from historical costs and management's expectation of future cost environments; and therefore, the Company has designated these liabilities as Level 3. See Note 10, "Asset Retirement Obligations," for a reconciliation of the beginning and ending balances of the liability for the Company's asset retirement obligations.
9. DERIVATIVE AND HEDGING ACTIVITIES
The Company is exposed to certain risks relating to its ongoing business operations, such as commodity price risk and interest rate risk. Derivative contracts are utilized to hedge the Company's exposure to price fluctuations and reduce the variability in the Company's cash flows associated with anticipated sales of future oil and natural gas production. When derivative contracts are available at terms (or prices) acceptable to the Company, it generally hedges a substantial, but varying, portion of anticipated oil and natural gas production for future periods. Derivatives are carried at fair value on the consolidated balance sheets as assets or liabilities, with the changes in the fair value included in the consolidated statements of operations for the period in which the change occurs. The Company's hedge policies and objectives may change significantly as its operational profile changes and/or commodities prices change. The Company does not enter into derivative contracts for speculative trading purposes.
It is the Company's policy to enter into derivative contracts only with counterparties that are creditworthy financial institutions deemed by management as competent and competitive market makers. The Company did not post collateral under any of its derivative contracts as they are secured under the Company's Senior Credit Agreement or are uncollateralized trades.
The Company's crude oil and natural gas derivative positions at any point in time may consist of swaps, basis swaps, costless put/call "collars" and deferred put options. Swaps are designed so that the Company receives or makes payments based on a differential between fixed and variable prices for crude oil and natural gas. Basis swaps effectively lock in a price differential between regional prices (i.e. Midland) and the relevant price index at which the oil production is sold (i.e. Cushing). A costless collar consists of a sold call, which establishes a maximum price the Company will receive for the volumes under contract and a purchased put that establishes a minimum price. A sold put option limits the exposure of the counterparty's risk should the price fall below the strike price. Sold put options limit the effectiveness of purchased put options at the low end of the put/call collars to market prices in excess of the strike price of the put option sold. The Company has elected to not designate any of its derivative contracts for hedge accounting. Accordingly, the Company records the net change in the mark-to-market valuation of these derivative contracts, as well as all payments and receipts on settled derivative contracts, in "Net gain (loss) on derivative contracts" on the consolidated statements of operations.
At December 31, 2017, the Company had 34 open commodity derivative contracts summarized in the following tables: three natural gas collar arrangements, 12 crude oil basis swaps and 19 crude oil collar arrangements.
At December 31, 2016, the Company had 22 open commodity derivative contracts summarized in the following tables: two natural gas collar arrangements and 20 crude oil collar arrangements.
123
HALCÓN RESOURCES CORPORATION
NOTES TO THE CONSOLIDATED FINANCIAL STATEMENTS (Continued)
9. DERIVATIVE AND HEDGING ACTIVITIES (Continued)
All derivative contracts are recorded at fair market value in accordance with ASC 815 and ASC 820 and included in the consolidated balance sheets as assets or liabilities. The following table summarizes the location and fair value amounts of all derivative contracts in the consolidated balance sheets as of December 31, 2017 and 2016 (in thousands):
| |
|
Asset derivative contracts | |
Liability derivative contracts |
|||||||||||||
|---|---|---|---|---|---|---|---|---|---|---|---|---|---|---|---|---|---|
| |
|
Successor | |
Successor | |||||||||||||
Derivatives not designated as hedging contracts under ASC 815 |
Balance sheet location |
December 31, 2017 |
December 31, 2016 |
Balance sheet location |
December 31, 2017 |
December 31, 2016 |
|||||||||||
Commodity contracts |
Current assets—receivables from derivative contracts | $ | 677 | $ | 5,923 | Current liabilities—liabilities from derivative contracts | $ | (19,248 | ) | $ | (16,434 | ) | |||||
Commodity contracts |
Other noncurrent assets—receivables from derivative contracts | — | — | Other noncurrent liabilities—liabilities from derivative contracts | (7,751 | ) | (486 | ) | |||||||||
| | | | | | | | | | | | | | | | | | |
Total derivatives not designated as hedging contracts under ASC 815 |
$ | 677 | $ | 5,923 | $ | (26,999 | ) | $ | (16,920 | ) | |||||||
| | | | | | | | | | | | | | | | | | |
| | | | | | | | | | | | | | | | | | |
| | | | | | | | | | | | | | | | | | |
The following table summarizes the location and amounts of the Company's realized and unrealized gains and losses on derivative contracts in the Company's consolidated statements of operations (in thousands):
| |
|
Amount of gain or (loss) recognized in income on derivative contracts for the |
|||||||||||||||
|---|---|---|---|---|---|---|---|---|---|---|---|---|---|---|---|---|---|
| |
|
Successor |
|
Predecessor | |||||||||||||
| |
|
|
Period from September 10, 2016 through December 31, 2016 |
|
Period from January 1, 2016 through September 9, 2016 |
|
|||||||||||
| |
|
Year Ended December 31, 2017 |
|
Year Ended December 31, 2015 |
|||||||||||||
Derivatives not designated as hedging contracts under ASC 815 |
Location of gain or (loss) recognized in income on derivative contracts |
|
|||||||||||||||
|
|
|||||||||||||||||
|
|
|||||||||||||||||
Commodity contracts: |
|||||||||||||||||
Unrealized gain (loss) on |
Other income (expenses)— | ||||||||||||||||
commodity contracts |
net gain (loss) on derivative contracts | $ | (16,468 | ) | $ | (112,449 | ) | $ | (263,732 | ) | $ | (129,282 | ) | ||||
Realized gain (loss) on |
Other income (expenses)— | ||||||||||||||||
commodity contracts |
net gain (loss) on derivative contracts | 17,759 | 84,709 | 245,734 | 439,546 | ||||||||||||
| | | | | | | | | | | | | | | | | | |
Total net gain (loss) on derivative contracts |
$ | 1,291 | $ | (27,740 | ) | $ | (17,998 | ) | $ | 310,264 | |||||||
| | | | | | | | | | | | | | | | | | |
| | | | | | | | | | | | | | | | | | |
| | | | | | | | | | | | | | | | | | |
124
HALCÓN RESOURCES CORPORATION
NOTES TO THE CONSOLIDATED FINANCIAL STATEMENTS (Continued)
9. DERIVATIVE AND HEDGING ACTIVITIES (Continued)
At December 31, 2017 and 2016, the Company had the following open crude oil and natural gas derivative contracts:
| |
|
|
Successor | ||||||||||||||||||||
|---|---|---|---|---|---|---|---|---|---|---|---|---|---|---|---|---|---|---|---|---|---|---|---|
| |
|
|
December 31, 2017 | ||||||||||||||||||||
| |
|
|
|
Floors | Ceilings | Basis Differential | |||||||||||||||||
Period
|
Instrument | Commodity | Volume in Mmbtu's/ Bbl's |
Price / Price Range |
Weighted Average Price |
Price / Price Range |
Weighted Average Price |
Price / Price Range |
Weighted Average Price |
||||||||||||||
January 2018 - December 2018 |
Basis Swap | Crude Oil | 2,555,000 | $— | $ | — | $— | $ | — | $(1.05) - $(1.50) | $ | (1.29 | ) | ||||||||||
January 2018 - December 2018 |
Collars | Crude Oil | 2,920,000 | 45.00 - 53.00 | 49.29 | 50.00 - 60.00 | 56.82 | ||||||||||||||||
January 2018 - December 2018 |
Collars | Natural Gas | 2,737,500 | 3.00 - 3.03 | 3.01 | 3.22 - 3.38 | 3.30 | ||||||||||||||||
April 2018 - December 2018 |
Basis Swap | Crude Oil | 275,000 | (1.15) | (1.15 | ) | |||||||||||||||||
April 2018 - December 2018 |
Collars | Crude Oil | 275,000 | 46.75 | 46.75 | 51.75 | 51.75 | ||||||||||||||||
July 2018 - December 2018 |
Basis Swap | Crude Oil | 1,012,000 | (0.98) - (1.18) | (1.12 | ) | |||||||||||||||||
July 2018 - December 2018 |
Collars | Crude Oil | 184,000 | 48.50 | 48.50 | 53.50 | 53.50 | ||||||||||||||||
October 2018 - December 2018 |
Collars | Crude Oil | 92,000 | 50.65 | 50.65 | 55.65 | 55.65 | ||||||||||||||||
January 2019 - March 2019 |
Collars | Crude Oil | 90,000 | 46.75 | 46.75 | 51.75 | 51.75 | ||||||||||||||||
January 2019 - December 2019 |
Basis Swap | Crude Oil | 4,380,000 | (0.50) - (1.33) | (1.02 | ) | |||||||||||||||||
January 2019 - December 2019 |
Collars | Crude Oil | 1,825,000 | 50.00 - 51.00 | 50.24 | 55.00 - 57.30 | 55.70 | ||||||||||||||||
| |
|
|
Successor | |||||||||||||||
|---|---|---|---|---|---|---|---|---|---|---|---|---|---|---|---|---|---|---|
| |
|
|
December 31, 2016 | |||||||||||||||
| |
|
|
|
Floors | Ceilings | |||||||||||||
Period
|
Instrument | Commodity | Volume in Mmbtu's/ Bbl's |
Price / Price Range |
Weighted Average Price |
Price / Price Range |
Weighted Average Price |
|||||||||||
January 2017 - December 2017 |
Collars | Natural Gas | 3,650,000 | $3.15 - $3.26 | $ | 3.20 | $3.50 - $3.76 | $ | 3.63 | |||||||||
January 2017 - December 2017 |
Collars | Crude Oil | 6,843,750 | 47.00 - 60.00 | 51.39 | 52.00 - 76.84 | 58.75 | |||||||||||
January 2018 - December 2018 |
Collars | Crude Oil | 730,000 | 53.00 | 53.00 | 58.00 | 58.00 | |||||||||||
The Company presents the fair value of its derivative contracts at the gross amounts in the consolidated balance sheets. The following table shows the potential effects of master netting arrangements on the fair value of the Company's derivative contracts at December 31, 2017 and 2016 (in thousands):
| |
Derivative Assets | Derivative Liabilities | |||||||||||
|---|---|---|---|---|---|---|---|---|---|---|---|---|---|
| |
Successor | Successor | |||||||||||
Offsetting of Derivative Assets and Liabilities
|
December 31, 2017 |
December 31, 2016 |
December 31, 2017 |
December 31, 2016 |
|||||||||
Gross amounts presented in the consolidated balance sheet |
$ | 677 | $ | 5,923 | $ | (26,999 | ) | $ | (16,920 | ) | |||
Amounts not offset in the consolidated balance sheet |
(231 | ) | (5,283 | ) | 231 | 5,075 | |||||||
| | | | | | | | | | | | | | |
Net amount |
$ | 446 | $ | 640 | $ | (26,768 | ) | $ | (11,845 | ) | |||
| | | | | | | | | | | | | | |
| | | | | | | | | | | | | | |
| | | | | | | | | | | | | | |
125
HALCÓN RESOURCES CORPORATION
NOTES TO THE CONSOLIDATED FINANCIAL STATEMENTS (Continued)
9. DERIVATIVE AND HEDGING ACTIVITIES (Continued)
The Company enters into an International Swap Dealers Association Master Agreement (ISDA) with each counterparty prior to a derivative contract with such counterparty. The ISDA is a standard contract that governs all derivative contracts entered into between the Company and the respective counterparty. The ISDA allows for offsetting of amounts payable or receivable between the Company and the counterparty, at the election of both parties, for transactions that occur on the same date and in the same currency.
10. ASSET RETIREMENT OBLIGATIONS
The Company records an asset retirement obligation (ARO) on oil and natural gas properties when it can reasonably estimate the fair value of an obligation to perform site reclamation, dismantle facilities or plug and abandon costs. For other operating property and equipment, the Company records an ARO when the system is placed in service and it can reasonably estimate the fair value of an obligation to perform site reclamation and other necessary work when it is required. The Company records the ARO liability on the consolidated balance sheets and capitalizes a portion of the cost in "Oil and natural gas properties" or "Other operating property and equipment" during the period in which the obligation is incurred. The Company records the accretion of its ARO liabilities in "Depletion, depreciation and accretion" expense in the consolidated statements of operations. The additional capitalized costs are depreciated on a unit-of-production basis or straight-line basis.
126
HALCÓN RESOURCES CORPORATION
NOTES TO THE CONSOLIDATED FINANCIAL STATEMENTS (Continued)
10. ASSET RETIREMENT OBLIGATIONS (Continued)
The Company recorded the following activity related to its ARO liability (inclusive of the current portion) (in thousands):
Liability for asset retirement obligation as of December 31, 2015 (Predecessor) |
$ | 47,016 | ||
Liabilities settled and divested |
(180 | ) | ||
Additions |
1,044 | |||
Acquisitions |
75 | |||
Accretion expense |
1,414 | |||
| | | | | |
Liability for asset retirement obligations as of September 9, 2016 (Predecessor) |
$ | 49,369 | ||
| | | | | |
| | | | | |
| | | | | |
| | | | | |
Fair value fresh-start adjustment |
$ | (16,883 | ) | |
Liability for asset retirement obligations as of September 9, 2016 (Successor) |
$ | 32,486 | ||
Liabilities settled and divested(1) |
(1,211 | ) | ||
Additions |
513 | |||
Accretion expense |
587 | |||
| | | | | |
Liability for asset retirement obligations as of December 31, 2016 (Successor) |
$ | 32,375 | ||
Liabilities settled and divested(1) |
(33,796 | ) | ||
Additions |
592 | |||
Acquisitions(1) |
3,109 | |||
Accretion expense |
1,306 | |||
Revisions in estimated cash flows |
782 | |||
| | | | | |
Liability for asset retirement obligations as of December 31, 2017 (Successor) |
$ | 4,368 | ||
| | | | | |
| | | | | |
| | | | | |
- (1)
- See Note 5, "Acquisitions and Divestitures," for additional information on the Company's acquisition and divestiture activities.
11. COMMITMENTS AND CONTINGENCIES
Commitments
The Company leases corporate office space in Houston, Texas and Denver, Colorado. In addition, the Company has lease commitments for certain equipment under long-term operating lease agreements. The office and equipment operating lease agreements expire on various dates through 2024. Rent expense was approximately $3.9 million, $1.4 million, $5.9 million and $8.6 million for the year ended December 31, 2017, the period of September 10, 2016 through December 31, 2016, the period of January 1, 2016 through September 9, 2016 and for the year ended December 31, 2015.
127
HALCÓN RESOURCES CORPORATION
NOTES TO THE CONSOLIDATED FINANCIAL STATEMENTS (Continued)
11. COMMITMENTS AND CONTINGENCIES (Continued)
Approximate future minimum lease payments for subsequent annual periods for all non-cancelable operating leases as of December 31, 2017 are as follows (in thousands):
2018 |
$ | 3,339 | ||
2019 |
2,990 | |||
2020 |
1,811 | |||
2021 |
1,497 | |||
2022 |
835 | |||
Thereafter |
1,345 | |||
| | | | | |
Total |
$ | 11,817 | ||
| | | | | |
| | | | | |
| | | | | |
As of December 31, 2017, the Company has the following active drilling rig commitments (in thousands):
2018 |
$ | 5,746 | ||
2019 |
— | |||
2020 |
— | |||
2021 |
— | |||
2022 |
— | |||
Thereafter |
— | |||
| | | | | |
Total |
$ | 5,746 | ||
| | | | | |
| | | | | |
| | | | | |
As of December 31, 2017, termination of the Company's active drilling rig commitments would require early termination penalties of $4.5 million, which would be in lieu of paying the remaining active drilling rig commitments of $5.7 million.
In past years, with the sustained decline in crude oil prices, the Company stacked certain drilling rigs and amended other previous drilling rig contracts. In the future, the Company expects to incur stacking charges/early termination fees on certain drilling rig commitments as follows (in thousands):
2018 |
$ | 1,260 | ||
2019 |
— | |||
2020 |
3,000 | |||
2021 |
— | |||
2022 |
— | |||
Thereafter |
— | |||
| | | | | |
Total |
$ | 4,260 | ||
| | | | | |
| | | | | |
| | | | | |
On June 20, 2017, the Company entered into an agreement with a private company for the right to purchase acreage located in Ward and Winkler Counties, Texas prospective for the Wolfcamp and Bone Spring formations. The Company paid $5.0 million and drilled a commitment well to earn the option to acquire the acreage for $76.8 million, if the option is exercised, by March 31, 2018. This option purchase agreement is not included in the tables above.
The Company has entered into various long-term gathering, transportation and sales contracts with respect to production from the Delaware Basin in West Texas. As of December 31, 2017, the Company
128
HALCÓN RESOURCES CORPORATION
NOTES TO THE CONSOLIDATED FINANCIAL STATEMENTS (Continued)
11. COMMITMENTS AND CONTINGENCIES (Continued)
had in place two long-term crude oil contracts and seven long-term natural gas contracts in this area and the sales prices under these contracts are based on posted market rates. Under the terms of these contracts, the Company has committed a substantial portion of its production from this area for periods ranging from one to eight years from the date of first production. The sales prices under these contracts are based on posted market rates.
Contingencies
From time to time, the Company may be a plaintiff or defendant in a pending or threatened legal proceeding arising in the normal course of its business. While the outcome and impact of currently pending legal proceedings cannot be determined, the Company's management and legal counsel believe that the resolution of these proceedings through settlement or adverse judgment will not have a material effect on the Company's consolidated operating results, financial position or cash flows.
12. MEZZANINE EQUITY
On June 16, 2014, funds and accounts managed by affiliates of Apollo contributed $150 million in cash to HK TMS, a Delaware limited liability company, which was then wholly owned by the Company and held all of the Company's acreage in the TMS formation, located in Mississippi and Louisiana, in exchange for the issuance by HK TMS of 150,000 preferred shares. At the closing, the Predecessor Company also contributed $50 million in cash to HK TMS. Holders of the HK TMS preferred shares were to receive quarterly cash dividends of 8% cumulative perpetual per annum, subject to HK TMS' option to pay such dividends "in-kind" through the issuance of additional preferred shares. The preferred shares were expected to be automatically redeemed and cancelled when the holders received cash dividends and distributions on the preferred shares equating to the greater of a 12% annual rate of return plus principal and 1.25 times their investment plus applicable fees (the Redemption Price), subject to adjustment under certain circumstances. On September 30, 2016, certain wholly-owned subsidiaries of the Successor Company executed an Assignment and Assumption Agreement with an affiliate of Apollo pursuant to which 100% of the Membership Interests in HK TMS were assigned to Apollo. In exchange for the assignment, Apollo assumed all obligations relating to such Membership Interests. See Note 5, "Acquisitions and Divestitures," for further information regarding the HK TMS Divestiture.
The preferred shares were classified as "Redeemable noncontrolling interest" and included in "Mezzanine equity" between total liabilities and stockholders' equity on the consolidated balance sheets pursuant to ASC 480-10-S99-3A. The preferred shares were considered probable of becoming redeemable and therefore were accreted up to the estimated required redemption value. The accretion was presented as a deemed dividend and recorded in "Redeemable noncontrolling interest" on the consolidated balance sheets and within "Preferred dividends and accretion on redeemable noncontrolling interest" on the consolidated statements of operations. In accordance with ASC 480-10-S99-3A, an adjustment to the carrying amount presented in mezzanine equity was recognized as charges against retained earnings and reduced income available to common stockholders in the calculation of earnings per share.
In March 2015, Apollo delivered a withdrawal notice to HK TMS indicating their election not to acquire additional preferred shares, referred to as the Tranche Rights, in HK TMS (the Withdrawal Notice). Upon issuance of the Withdrawal Notice, HK TMS incurred a fee escalating from $2.50 per share to $20.00 per share for the next eight full fiscal quarters for any preferred shares then
129
HALCÓN RESOURCES CORPORATION
NOTES TO THE CONSOLIDATED FINANCIAL STATEMENTS (Continued)
12. MEZZANINE EQUITY (Continued)
outstanding, which began in the quarter ended June 30, 2015 (the Withdrawal Exit Fee). The Withdrawal Exit Fee would have been payable upon redemption of the preferred shares and was recorded at fair value within "Other noncurrent liabilities" on the consolidated balance sheets at December 31, 2015.
The following table sets forth a reconciliation of the changes in fair value of embedded derivative (in thousands):
| |
Embedded derivative |
|||
|---|---|---|---|---|
Balances at December 31, 2015 (Predecessor) |
$ | 6,100 | ||
Change in fair value |
(5,734 | ) | ||
| | | | | |
Balance at September 9, 2016 (Predecessor) |
$ | 366 | ||
| | | | | |
| | | | | |
| | | | | |
| | | | | |
Fair value fresh-start adjustment |
(366 | ) | ||
Balance at September 9, 2016 (Successor) |
$ | — | ||
| | | | | |
| | | | | |
| | | | | |
The Company recorded the following activity related to the preferred shares in "Mezzanine equity" on the consolidated balance sheets for the year ended December 31, 2016 (in thousands, except share amounts):
| |
Redeemable noncontrolling interest |
||||||
|---|---|---|---|---|---|---|---|
| |
Shares | Amount | |||||
Balances at December 31, 2015 (Predecessor) |
165,639 | $ | 183,986 | ||||
Dividends paid in-kind |
9,329 | 9,329 | |||||
Accretion of redeemable noncontrolling interest |
— | 26,576 | |||||
| | | | | | | | |
Balances at September 9, 2016 (Predecessor) |
174,968 | $ | 219,891 | ||||
| | | | | | | | |
| | | | | | | | |
| | | | | | | | |
| | | | | | | | |
Fair value fresh-start adjustment |
— | $ | (178,821 | ) | |||
Balances at September 9, 2016 (Successor) |
174,968 | $ | 41,070 | ||||
Dividends paid in-kind |
791 | 791 | |||||
HK TMS Divestiture(1) |
(175,759 | ) | (41,861 | ) | |||
| | | | | | | | |
Balance at December 31, 2016 (Successor) |
— | $ | — | ||||
| | | | | | | | |
| | | | | | | | |
| | | | | | | | |
- (1)
- See Note 5, "Acquisitions and Divestitures," for additional information on the HK TMS Divestiture.
For the period of September 10, 2016 through September 30, 2016 and January 1, 2016 through September 9, 2016, HK TMS issued 791 and 9,329 additional preferred shares to Apollo for dividends paid-in-kind, respectively. For the year ended December 31, 2015, HK TMS issued 12,614 additional preferred shares to Apollo for dividends paid in-kind. These dividends were presented within "Preferred dividends and accretion on redeemable noncontrolling interest" on the consolidated statements of operations. Upon the election of in-kind dividends, HK TMS was required to pay a fee of $5.00 per preferred share then outstanding (PIK exit fee). Such fees would have been due upon redemption of
130
HALCÓN RESOURCES CORPORATION
NOTES TO THE CONSOLIDATED FINANCIAL STATEMENTS (Continued)
12. MEZZANINE EQUITY (Continued)
the preferred shares. For the year ended December 31, 2015, HK TMS incurred PIK exit fees totaling $3.1 million, which was recorded at fair value within "Other noncurrent liabilities" on the consolidated balance sheets.
HK TMS was not included in the chapter 11 bankruptcy filings or the Restructuring Support Agreement discussed in Note 2, "Reorganization."
13. STOCKHOLDERS' EQUITY
Preferred Stock and Non-Cash Preferred Stock Dividend
On January 24, 2017 (the Commitment Date), the Company entered into a stock purchase agreement with certain accredited investors to sell, in a private placement exempt from registration requirements of the Securities Act pursuant to Section 4(a)(2), approximately 5,518 shares of 8% Automatically Convertible Preferred Stock, par value $0.0001 per share (the Preferred Stock), each share of which was convertible into 10,000 shares of common stock. Also on January 24, 2017, the Company received an executed written consent in lieu of a stockholders' meeting authorizing and approving the conversion of the Preferred Stock into common stock. On February 27, 2017, the Company filed with the Delaware Secretary of State a Certificate of Designation, Preferences, Rights and Limitations of the Preferred Stock (the Certificate of Designation), which created the series of preferred stock issued by the Company on that same date. The Company issued the Preferred Stock at $72,500 per share. Gross proceeds were approximately $400.1 million, or $7.25 per share of common stock. The Company incurred approximately $11.9 million in expenses associated with this offering, including placement agent fees. On March 16, 2017, the Company mailed a definitive information statement to its stockholders notifying them that a majority of its stockholders had consented to the issuance of common stock, par value $0.0001 per share, upon the conversion of the Preferred Stock. The Preferred Stock automatically converted into 55.2 million shares of common stock on April 6, 2017 in accordance with the terms of the Certificate of Designation. No cash dividends were paid on the Preferred Stock since, pursuant to the terms of the Certificate of Designation of the Preferred Stock, conversion occurred prior to June 1, 2017.
The Company agreed to file a registration statement to register the resale of shares of common stock issuable upon conversion of the Preferred Stock and to pay penalties in the event such registration was not effective by June 27, 2017. The Company filed such registration statement on March 3, 2017 and it was declared effective by the SEC on April 7, 2017.
In accordance with ASC Topic 470, Debt (ASC 470), the Company determined that the conversion feature in the Preferred Stock represented a beneficial conversion feature. The fair value of the Company's common stock of $8.12 per share on the Commitment Date was greater than the conversion price of $7.25 per share of common stock, representing a beneficial conversion feature of $0.87 per share of common stock, or approximately $48.0 million in aggregate. Under ASC 470, $48.0 million (the intrinsic value of the beneficial conversion feature) of the proceeds received from the issuance of the Preferred Stock was allocated to "Additional paid-in capital," creating a discount on the Preferred Stock (the Discount). The Discount is required to be amortized on a non-cash basis over the approximate 65-month period between the issuance date and the required redemption date of July 28, 2022, or fully amortized upon an accelerated date of redemption or conversion, and recorded as a preferred dividend. As a result, approximately $0.8 million of the Discount was amortized and a non-cash preferred dividend was recorded in the three months ended March 31, 2017 and due to the
131
HALCÓN RESOURCES CORPORATION
NOTES TO THE CONSOLIDATED FINANCIAL STATEMENTS (Continued)
13. STOCKHOLDERS' EQUITY (Continued)
conversion date occurring on April 6, 2017, the remaining $47.2 million of the amortization of the Discount was accelerated to the conversion date and fully amortized in the three months ended June 30, 2017. The Discount amortization is reflected in "Non-cash preferred dividend" in the consolidated statements of operations. The preferred dividend was charged against additional paid-in capital since no retained earnings were available.
Common Stock
On September 9, 2016, upon emergence from chapter 11 bankruptcy, all existing shares of Predecessor common stock were cancelled and the Successor Company issued approximately 90.0 million shares of common stock in total to the Predecessor Company's existing common stockholders, Third Lien Noteholders, Unsecured Noteholders, and the Convertible Noteholder. Refer to Note 2, "Reorganization," for further details.
Also on September 9, 2016, the Successor Company filed an amended and restated certificate of incorporation with the Delaware Secretary of State to provide for (i) the total number of shares of all classes of capital stock that the Successor Company has the authority to issue is 1,001,000,000 of which 1,000,000,000 shares are common stock, par value $0.0001 per share and 1,000,000 shares are preferred stock, par value $0.0001 per share, (ii) a classified board structure, (iii) the right of removal of directors with or without cause by stockholders, and (iv) a restriction on the Successor Company from issuing any non-voting equity securities in violation of Section 1123(a)(6) of chapter 11 of title 11 of the United States Code.
On February 9, 2018, the Company sold 9.2 million shares of common stock, par value $0.0001 per share, in a public offering at a price of $6.90 per share. The net proceeds to the Company from the offering were approximately $60.8 million, after deducting the underwriters' discounts and estimated offering expenses. See Note 17 "Subsequent Events," for a further discussion of the issuance of common stock.
Warrants
On September 9, 2016, upon the emergence from chapter 11 bankruptcy, all existing February 2012 warrants were cancelled and the Successor Company issued 3.8 million new warrants to the Unsecured Noteholders and 0.9 million new warrants to the Convertible Noteholder. The warrants in aggregate can be exercised to purchase 4.7 million shares of the Successor Company's common stock at an exercise price of $14.04 per share. The Company allocated approximately $16.7 million of the Enterprise Value to the warrants which is reflected in "Additional paid-in capital" on the consolidated balance sheets. The holders are entitled to exercise the warrants in whole or in part at any time prior to expiration on September 9, 2020. See Note 2, "Reorganization," for further details.
Incentive Plans
Immediately prior to emergence from chapter 11 bankruptcy, the Predecessor Incentive Plan was cancelled and all stock-based compensation awards granted thereunder were either vested or cancelled and Predecessor Company's Board adopted the 2016 Long-Term Incentive Plan (the 2016 Incentive Plan). An aggregate of 10.0 million shares of the Successor Company's common stock were available for grant pursuant to awards under the 2016 Incentive Plan in the form of nonqualified stock options, incentive stock options, restricted stock awards, restricted stock units, stock appreciation rights, performance units, performance bonuses, stock awards and other incentive awards. On April 6, 2017,
132
HALCÓN RESOURCES CORPORATION
NOTES TO THE CONSOLIDATED FINANCIAL STATEMENTS (Continued)
13. STOCKHOLDERS' EQUITY (Continued)
Amendment No. 1 to the 2016 Incentive Plan to increase, by 9.0 million shares, the maximum number of shares of common stock that may be issued thereunder, i.e., a maximum of 19.0 million shares, became effective, which was 20 calendar days following the date the Company mailed a definitive information statement to all stockholders of record notifying them of approval of the amendment by written consent of holders of a majority of the Company's outstanding stock. As of December 31, 2017 and 2016, a maximum of 7.7 million and 1.7 million shares, respectively of the Successor Company's common stock remained reserved for issuance under the 2016 Incentive Plan.
The Company accounts for stock-based payment accruals under authoritative guidance on stock compensation. The guidance requires all stock-based payments to employees and directors, including grants of stock options, and restricted stock, to be recognized in the financial statements based on their fair values. For awards granted under the 2016 Incentive Plan subsequent to emerging from chapter 11 bankruptcy and in conjunction with the early adoption of ASU 2016-09, the Successor Company has elected to not apply a forfeiture estimate and will recognize a credit in compensation expense to the extent awards are forfeited.
For the year ended December 31, 2017, the Company recognized $36.8 million of stock-based compensation expense. For the period from September 10, 2016 through December 31, 2016 and the period from January 1, 2016 through September 9, 2016 the Company recognized $21.5 million and $4.9 million, respectively, of stock-based compensation expense. For the year ended December 31, 2015, the Company recognized $14.5 million of stock-based compensation expense. Stock-based compensation expense is recorded as a component of "General and administrative" on the consolidated statements of operations.
Stock Options
From time to time, the Company grants stock options under its incentive plans covering shares of common stock to employees of the Company. Stock options, when exercised, are settled through the payment of the exercise price in exchange for new shares of stock underlying the option. These awards typically vest over a three year period at a rate of one-third on the annual anniversary date of the grant and expire ten years from the grant date.
Immediately prior to emergence from chapter 11 bankruptcy, all outstanding stock options under the Predecessor Incentive Plan were cancelled. Refer to Note 2, "Reorganization," for further details.
The weighted average grant date fair value of options granted during the year ended December 31, 2017 was $7.8 million. At December 31, 2017, the Company had $13.0 million of unrecognized compensation expense related to non-vested stock options to be recognized over a weighted-average vesting period of 1.2 years.
The weighted average grant date fair value of options granted during the period from September 10, 2016 through December 31, 2016 was $32.3 million. No options were granted during the period January 1, 2016 through September 9, 2016. At December 31, 2016, the Company had $26.5 million of unrecognized compensation expense related to non-vested stock options to be recognized over a weighted-average period of 1.7 years.
The weighted average grant date fair value of options granted in 2015 was $4.9 million.
133
HALCÓN RESOURCES CORPORATION
NOTES TO THE CONSOLIDATED FINANCIAL STATEMENTS (Continued)
13. STOCKHOLDERS' EQUITY (Continued)
The following table sets forth the stock option transactions for the year ended December 31, 2017, the period from September 10, 2016 through December 31, 2016, the period from January 1, 2016 through September 9, 2016 and the year ended December 31, 2015:
| |
Number | Weighted Average Exercise Price Per Share |
Aggregate Intrinsic Value(1) (In thousands) |
Weighted Average Remaining Contractual Life (Years) |
|||||||||
|---|---|---|---|---|---|---|---|---|---|---|---|---|---|
Outstanding at December 31, 2014 (Predecessor) |
3,784,732 | $ | 25.25 | $ | 724 | 8.7 | |||||||
Granted |
1,922,467 | 5.36 | |||||||||||
Exercised |
— | — | |||||||||||
Forfeited |
(847,066 | ) | 22.97 | ||||||||||
| | | | | | | | | | | | | | |
Outstanding at December 31, 2015 (Predecessor) |
4,860,133 | $ | 17.80 | $ | — | 8.4 | |||||||
Granted |
— | — | |||||||||||
Exercised |
— | — | |||||||||||
Forfeited |
(695,302 | ) | 21.17 | ||||||||||
Cancelled(2) |
(4,164,831 | ) | 17.23 | ||||||||||
| | | | | | | | | | | | | | |
Outstanding at September 9, 2016 (Predecessor) |
— | $ | — | $ | — | — | |||||||
| | | | | | | | | | | | | | |
| | | | | | | | | | | | | | |
| | | | | | | | | | | | | | |
| | | | | | | | | | | | | | |
Outstanding at September 9, 2016 (Successor) |
— | $ | — | $ | — | — | |||||||
Granted |
5,319,400 | 9.22 | |||||||||||
Exercised |
— | — | |||||||||||
Forfeited |
— | — | |||||||||||
| | | | | | | | | | | | | | |
Outstanding at December 31, 2016 (Successor) |
5,319,400 | $ | 9.22 | $ | 631 | 9.7 | |||||||
Granted |
1,790,605 | 7.72 | |||||||||||
Exercised |
— | — | |||||||||||
Forfeited |
(374,102 | ) | 8.82 | ||||||||||
| | | | | | | | | | | | | | |
Outstanding at December 31, 2017 (Successor) |
6,735,903 | $ | 8.84 | $ | 29 | 8.9 | |||||||
| | | | | | | | | | | | | | |
| | | | | | | | | | | | | | |
| | | | | | | | | | | | | | |
- (1)
- The intrinsic value of stock options was calculated as the amount by which the closing market price on December 31,
2017, 2016 and 2015 of the underlying stock exceeded the exercise price of the option. No stock options were exercised during the year ended December 31, 2017, 2016 or
2015.
- (2)
- Immediately prior to emergence from chapter 11 bankruptcy, all outstanding options under the Predecessor Incentive Plan were cancelled.
134
HALCÓN RESOURCES CORPORATION
NOTES TO THE CONSOLIDATED FINANCIAL STATEMENTS (Continued)
13. STOCKHOLDERS' EQUITY (Continued)
Options outstanding at December 31, 2017 consisted of the following:
| Outstanding | Exercisable(1) | |||||||||||||||||||||
|---|---|---|---|---|---|---|---|---|---|---|---|---|---|---|---|---|---|---|---|---|---|---|
Range of Grant Prices Per Share |
Number | Weighted Average Exercise Price per Share |
Weighted Average Remaining Contractual Live (Years) |
Number | Weighted Average Exercise Price per Share |
Aggregate Intrinsic Value |
Weighted Average Remaining Contractual Live (Years) |
|||||||||||||||
| $6.55 - $7.75 | 1,722,671 | $ | 7.72 | 9.3 | — | $ | — | $ | — | — | ||||||||||||
| $8.93 - $9.24 | 5,013,232 | 9.23 | 8.7 | — | — | — | — | |||||||||||||||
- (1)
- At December 31, 2017, none of the Company's options were exercisable due to service performance conditions or option exercise prices below the current market value of the underlying stock.
The assumptions used in calculating the Black-Scholes-Merton valuation model fair value of the Company's stock options for the year ended December 31, 2017, the period from September 10, 2016 through December 31, 2016 and the year ended December 31, 2015 are set forth in the following table:
| |
Successor |
|
Predecessor | |||||||||
|---|---|---|---|---|---|---|---|---|---|---|---|---|
| |
|
|||||||||||
| |
|
Period from September 10, 2016 through December 31, 2016 |
|
|
||||||||
| |
Year Ended December 31, 2017 |
|
Year Ended December 31, 2015 |
|||||||||
| |
|
|||||||||||
| |
|
|||||||||||
Weighted average value per option granted during the period |
$ | 4.36 | $ | 6.07 | $ | 2.56 | ||||||
Assumptions: |
||||||||||||
Stock price volatility(1) |
60.18 | % | 56.29 | % | 56.45 | % | ||||||
Risk free rate of return |
1.94 | % | 1.34 | % | 1.66 | % | ||||||
Expected term |
6 years | 6 years | 5 years | |||||||||
- (1)
- Due to the Company's limited historical data, expected volatility was estimated using volatilities of similar entities whose share or option prices and assumptions were publicly available.
Restricted Stock
From time to time, the Company grants shares of restricted stock to employees and non-employee directors of the Company. Employee shares typically vest over a three year period at a rate of one-third on the annual anniversary date of the grant, and the non-employee directors' shares vest six months from the date of grant. Certain shares granted under the 2016 Incentive Plan, specifically related to the Company's emergence from chapter 11 bankruptcy vested on or before September 30, 2017.
Immediately prior to emergence from chapter 11 bankruptcy, all outstanding unvested restricted stock awards granted under the Predecessor Incentive Plan were vested. Refer to Note 2, "Reorganization," for further details.
The weighted average grant date fair value of shares granted during the year ended December 31, 2017 was $14.3 million. At December 31, 2017, the Company had $3.2 million of unrecognized compensation expense related to non-vested restricted stock awards to be recognized over a weighted-average vesting period of 1.4 years.
135
HALCÓN RESOURCES CORPORATION
NOTES TO THE CONSOLIDATED FINANCIAL STATEMENTS (Continued)
13. STOCKHOLDERS' EQUITY (Continued)
The weighted average grant date fair value of shares granted during the period from September 10, 2016 through December 31, 2016 was $27.3 million. No restricted shares were granted from the period January 1, 2016 through September 9, 2016. At December 31, 2016, the Company had $11.5 million of unrecognized compensation expense related to non-vested restricted stock awards to be recognized over a weighted-average period of 0.9 years.
The weighted average grant date fair value of the shares granted in 2015 was $8.5 million.
The following table sets forth the restricted stock transactions for the year ended December 31, 2017, the period from September 10, 2016 through December 31, 2016, the period from January 1, 2016 through September 9, 2016 and the year ended December 31, 2015:
| |
Number of Shares |
Weighted Average Grant Date Fair Value Per Share |
Aggregate Intrinsic Value(1) (In thousands) |
|||||||
|---|---|---|---|---|---|---|---|---|---|---|
Unvested outstanding shares at December 31, 2014 (Predecessor) |
2,068,911 | $ | 15.55 | $ | 18,413 | |||||
Granted |
2,047,785 | 4.15 | ||||||||
Vested |
(858,708 | ) | 16.24 | |||||||
Forfeited |
(387,583 | ) | 12.86 | |||||||
| | | | | | | | | | | |
Unvested outstanding shares at December 31, 2015 (Predecessor) |
2,870,405 | $ | 7.55 | $ | 3,617 | |||||
Granted |
— | — | ||||||||
Vested |
(436,256 | ) | 18.50 | |||||||
Accelerated vesting(2) |
(1,917,072 | ) | 5.39 | |||||||
Forfeited |
(517,077 | ) | 6.31 | |||||||
| | | | | | | | | | | |
Unvested outstanding shares at September 9, 2016 (Predecessor) |
— | $ | — | $ | — | |||||
| | | | | | | | | | | |
| | | | | | | | | | | |
| | | | | | | | | | | |
| | | | | | | | | | | |
Unvested shares outstanding at September 9, 2016 (Successor) |
— | $ | — | $ | — | |||||
Granted |
2,991,202 | 9.14 | ||||||||
Vested |
(1,253,125 | ) | 9.24 | |||||||
Forfeited |
— | — | ||||||||
| | | | | | | | | | | |
Unvested outstanding shares at December 31, 2016 (Successor) |
1,738,077 | $ | 9.06 | $ | 16,234 | |||||
Granted |
2,022,432 | 7.07 | ||||||||
Vested |
(2,516,647 | ) | 8.39 | |||||||
Forfeited |
(498,355 | ) | 7.41 | |||||||
| | | | | | | | | | | |
Unvested shares outstanding at December 31, 2017 (Successor) |
745,507 | $ | 7.05 | $ | 5,643 | |||||
| | | | | | | | | | | |
| | | | | | | | | | | |
| | | | | | | | | | | |
- (1)
- The intrinsic value of restricted stock was calculated as the closing market price on December 31, 2017, 2016 and 2015 of the underlying stock multiplied by the number of restricted shares. The total fair
136
HALCÓN RESOURCES CORPORATION
NOTES TO THE CONSOLIDATED FINANCIAL STATEMENTS (Continued)
13. STOCKHOLDERS' EQUITY (Continued)
value of shares vested was $16.1 million, $11.6 million, $0.9 million, and $5.2 million for the year ended December 31, 2017, the period from September 10, 2016 through December 31, 2016, the period from January 1, 2016 through September 9, 2016 and the year ended December 31, 2015, respectively.
- (2)
- Immediately prior to emergence from chapter 11 bankruptcy, all outstanding unvested restricted stock under the Predecessor Incentive Plan were vested.
14. INCOME TAXES
Income tax benefit (provision) for the indicated periods is comprised of the following (in thousands):
| |
Successor |
|
Predecessor | ||||||||||||
|---|---|---|---|---|---|---|---|---|---|---|---|---|---|---|---|
| |
|
Period from September 10, 2016 through December 31, 2016 |
|
Period from January 1, 2016 through September 9, 2016 |
|
||||||||||
| |
Year Ended December 31, 2017 |
|
Year Ended December 31, 2015 |
||||||||||||
| |
|
||||||||||||||
| |
|
||||||||||||||
Current: |
|||||||||||||||
Federal |
$ | 5,000 | $ | (5,000 | ) | $ | 8,666 | $ | (8,580 | ) | |||||
State |
— | 256 | — | (506 | ) | ||||||||||
| | | | | | | | | | | | | | | | |
|
5,000 | (4,744 | ) | 8,666 | (9,086 | ) | |||||||||
| | | | | | | | | | | | | | | | |
Deferred: |
|||||||||||||||
Federal |
— | 52,223 | (22,491 | ) | (39,331 | ) | |||||||||
State |
— | (52,223 | ) | 22,491 | 39,331 | ||||||||||
| | | | | | | | | | | | | | | | |
|
— | — | — | — | |||||||||||
| | | | | | | | | | | | | | | | |
Total income tax benefit (provision) |
$ | 5,000 | $ | (4,744 | ) | $ | 8,666 | $ | (9,086 | ) | |||||
| | | | | | | | | | | | | | | | |
| | | | | | | | | | | | | | | | |
| | | | | | | | | | | | | | | | |
137
HALCÓN RESOURCES CORPORATION
NOTES TO THE CONSOLIDATED FINANCIAL STATEMENTS (Continued)
14. INCOME TAXES (Continued)
The actual income tax benefit (provision) differs from the expected income tax benefit (provision) as computed by applying the United States Federal corporate income tax rate of 35% for each period as follows (in thousands):
| |
Successor |
|
Predecessor | ||||||||||||
|---|---|---|---|---|---|---|---|---|---|---|---|---|---|---|---|
| |
|
Period from September 10, 2016 through December 31, 2016 |
|
Period from January 1, 2016 through September 9, 2016 |
|
||||||||||
| |
Year Ended December 31, 2017 |
|
Year Ended December 31, 2015 |
||||||||||||
| |
|
||||||||||||||
| |
|
||||||||||||||
Expected tax benefit (provision) |
$ | (185,740 | ) | $ | 166,057 | $ | (1,152 | ) | $ | 669,737 | |||||
State income tax expense, net of federal benefit |
(2,587 | ) | 6,243 | (43 | ) | 41,003 | |||||||||
Stock-based compensation |
— | — | (14,803 | ) | — | ||||||||||
Net operating loss limitation under IRC Section 382 |
— | (161,704 | ) | — | — | ||||||||||
TMS Divestiture |
— | (157,767 | ) | — | — | ||||||||||
Adjustments attributable to reorganization |
— | — | 275,460 | — | |||||||||||
Change in state rate |
(10,121 | ) | — | — | — | ||||||||||
Debt related costs |
— | — | (4,089 | ) | (7,102 | ) | |||||||||
Cancellation of indebtedness income |
— | — | 103,268 | (89,081 | ) | ||||||||||
Increase (reduction) in deferred tax asset |
95,907 | — | 14,645 | (6,369 | ) | ||||||||||
Change in valuation allowance and related items |
392,846 | 202,592 | (263,211 | ) | (598,429 | ) | |||||||||
IRC section 108 attribute reduction |
— | (56,483 | ) | (101,342 | ) | (13,744 | ) | ||||||||
Tax Cuts and Jobs Act of 2017 |
(280,874 | ) | — | — | — | ||||||||||
Other |
(4,431 | ) | (3,682 | ) | (67 | ) | (5,101 | ) | |||||||
| | | | | | | | | | | | | | | | |
Total income tax benefit (provision) |
$ | 5,000 | $ | (4,744 | ) | $ | 8,666 | $ | (9,086 | ) | |||||
| | | | | | | | | | | | | | | | |
| | | | | | | | | | | | | | | | |
| | | | | | | | | | | | | | | | |
138
HALCÓN RESOURCES CORPORATION
NOTES TO THE CONSOLIDATED FINANCIAL STATEMENTS (Continued)
14. INCOME TAXES (Continued)
The components of net deferred income tax assets (liabilities) recognized are as follows (in thousands):
| |
Successor | ||||||
|---|---|---|---|---|---|---|---|
| |
December 31, 2017 |
December 31, 2016 |
|||||
Deferred noncurrent income tax assets: |
|||||||
Net operating loss carry-forwards |
$ | 205,570 | $ | 155,393 | |||
Built in loss adjustment Section 382 |
90,897 | — | |||||
Stock-based compensation expense |
5,501 | 3,430 | |||||
Asset retirement obligations |
963 | 11,233 | |||||
Book-tax differences in property basis |
125,309 | 647,574 | |||||
Unrealized hedging transactions |
5,901 | 3,937 | |||||
Other |
— | 330 | |||||
| | | | | | | | |
Gross deferred noncurrent income tax assets |
434,141 | 821,897 | |||||
Valuation allowance |
(426,765 | ) | (821,897 | ) | |||
| | | | | | | | |
Deferred noncurrent income tax assets |
$ | 7,376 | $ | — | |||
| | | | | | | | |
| | | | | | | | |
| | | | | | | | |
Deferred noncurrent income tax liabilities: |
|||||||
Basis difference in debt |
$ | (6,366 | ) | $ | — | ||
Other |
(1,010 | ) | — | ||||
| | | | | | | | |
Deferred noncurrent income tax liabilities |
$ | (7,376 | ) | $ | — | ||
| | | | | | | | |
| | | | | | | | |
| | | | | | | | |
Net noncurrent deferred income tax assets (liabilities) |
$ | — | $ | — | |||
| | | | | | | | |
| | | | | | | | |
| | | | | | | | |
On December 22, 2017, the Tax Cuts and Job Act of 2017 (the Act) was signed into law making significant changes to the Internal Revenue Code of 1986, as amended (the IRC). Changes include, but are not limited to, a corporate tax rate decrease from 35% to 21% effective for tax years beginning after December 31, 2017, imposes significant additional limitations on the deductibility of interest and net operating losses, allows for the expensing of certain capital expenditures, and limits the deductibility of certain types of executive compensation. The Company has calculated its best estimate of the impact of the Act in its year-end income statement provision in accordance with its understanding of the Act and guidance available as of the date of this filing and as a result have recorded a $280.9 million income tax provision primarily related to the decrease in the corporate tax rate offset by a corresponding decrease in the Company's valuation allowance for no net overall impact to the Company's income tax provision for the year ended December 31, 2017.
On December 22, 2017, Staff Accounting Bulletin No. 118 (SAB 118) was issued to address the application of U.S. GAAP in situations when a registrant does not have the necessary information available, prepared or analyzed (including computations) in reasonable detail to complete the accounting for certain income tax effects of the Act. In accordance with SAB 118, the Company has determined that the $280.9 million income tax provision and corresponding decrease in the Company's valuation allowance was a provisional amount and a reasonable estimate at December 31, 2017. Any subsequent adjustments to these amounts will be recorded to current tax benefit (provision) in the quarter of 2018 when the analysis is complete.
139
HALCÓN RESOURCES CORPORATION
NOTES TO THE CONSOLIDATED FINANCIAL STATEMENTS (Continued)
14. INCOME TAXES (Continued)
At December 31, 2015, the Company early adopted ASU 2015-07 on a prospective basis and accordingly, presents all deferred tax assets and liabilities as noncurrent on the consolidated balance sheets.
The Company emerged from chapter 11 bankruptcy on September 9, 2016. Under the Plan, a substantial portion of the Company's pre-petition debt securities were extinguished. Absent an exception, a debtor recognizes cancellation of indebtedness income (CODI) upon discharge of its outstanding indebtedness for an amount of consideration that is less than its adjusted issue price. The IRC provides that a debtor in a bankruptcy case may exclude CODI from taxable income but must reduce certain of its tax attributes by the amount of any CODI realized as a result of the consummation of a plan of reorganization. The amount of CODI realized by a taxpayer is the adjusted issue price of any indebtedness discharged less the sum of (i) the amount of cash paid, (ii) the issue price of any new indebtedness issued and (iii) the fair market value of any other consideration, including equity, issued. As a result of the market value of equity upon emergence from chapter 11 bankruptcy proceedings, U.S. CODI was approximately $844.7 million, which reduced the value of the Company's U.S. net operating losses (NOLs) and other assets on January 1, 2017. The Company also had various state NOL carryforwards that were subject to reduction as a result of the CODI being excluded from taxable income.
IRC Section 382 provides an annual limitation with respect to the ability of a corporation to utilize its tax attributes, as well as certain built-in-losses, against future U.S. taxable income in the event of a change in ownership. The Company's emergence from chapter 11 bankruptcy proceedings is considered a change in ownership for purposes of IRC Section 382. The limitation under the IRC is based on the value of the corporation as of the emergence date. The ownership changes and resulting annual limitation resulted in the expiration of approximately $750 million of net operating losses generated prior to the emergence date. The expiration of these tax attributes was fully offset by a corresponding decrease in the Company's U.S. valuation allowance, which results in no net tax provision.
The amount of consolidated U.S. NOLs available as of December 31, 2017 after attribute reduction on January 1, 2017 and Section 382 limitation is estimated to be approximately $976.8 million. These NOLs will expire in the years 2019 through 2036.
The Company assesses the recoverability of its deferred tax assets each period by considering whether it is more likely than not that all or a portion of the deferred tax assets will not be realized. The Company considers all available evidence (both positive and negative) in determining whether a valuation allowance is required. The Company evaluated possible sources of taxable income that may be available to realize the benefit of deferred tax assets, including projected future taxable income, the reversal of existing temporary differences, taxable income in carryback years and available tax planning strategies in making this assessment. A significant item of objective negative evidence considered was the cumulative book loss over the three-year period ended December 31, 2017 driven primarily by the full cost ceiling impairments over that period which limits the ability to consider other subjective evidence such as the Company's anticipated future growth. As a result of the Company's analysis, it was concluded that as of December 31, 2017 a valuation allowance should continue to be applied against the Company's net deferred tax asset. The Company recorded a valuation allowance as of December 31, 2017 of $426.8 million, a decrease of $392.8 million from December 31, 2016. The Company will continue to monitor facts and circumstances in the reassessment of the likelihood that operating loss carryforwards, credits and other deferred tax assets will be utilized.
140
HALCÓN RESOURCES CORPORATION
NOTES TO THE CONSOLIDATED FINANCIAL STATEMENTS (Continued)
14. INCOME TAXES (Continued)
ASC 740, Income Taxes (ASC 740) prescribes a recognition threshold and a measurement attribute for the financial statement recognition and measurement of income tax positions taken or expected to be taken in an income tax return. For those benefits to be recognized, an income tax position must be more-likely-than-not to be sustained upon examination by taxing authorities. The Company has no unrecognized tax benefits for the year ended December 31, 2017, the period of September 10, 2016 through December 31, 2016, the period of January 1, 2016 through September 9, 2016 and the year ended December 31, 2015.
Generally, the Company's income tax years 2014 through 2017 remain open for federal purposes and are subject to examination by Federal tax authorities. The Company's income tax returns are also subject to audit by the tax authorities in Louisiana, Mississippi, North Dakota, Oklahoma, Texas, Pennsylvania, Ohio and certain other state taxing jurisdictions where the Company has, or previously had, operations. In certain jurisdictions the Company operates through more than one legal entity, each of which may have different open years subject to examination. The open years for state purposes can vary from the normal three year statue expiration period for federal purposes.
The Company recognizes interest and penalties accrued to unrecognized benefits in "Interest expense and other, net" in its consolidated statements of operations. For the year ended December 31, 2017, the period of September 10, 2016 through December 31, 2016, the period of January 1, 2016 through September 9, 2016 and the year ended December 31, 2015 the Company recognized no interest and penalties.
During the first quarter of 2014, the Internal Revenue Service commenced an audit of GeoResources' tax returns for the years ending December 31, 2010 through August 1, 2012. The audit closed during April 2015 resulting in a favorable adjustment to the Company of $0.1 million.
15. EARNINGS PER SHARE
On September 9, 2016, upon emergence from chapter 11 bankruptcy, the Predecessor Company's equity was cancelled and new equity was issued. Refer to Note 2, "Reorganization," for further details.
141
HALCÓN RESOURCES CORPORATION
NOTES TO THE CONSOLIDATED FINANCIAL STATEMENTS (Continued)
15. EARNINGS PER SHARE (Continued)
The following represents the calculation of earnings (loss) per share (in thousands, except per share amounts):
| |
Successor | |
Predecessor | ||||||||||||
|---|---|---|---|---|---|---|---|---|---|---|---|---|---|---|---|
| |
Year Ended December 31, 2017 |
Period from September 10, 2016 through December 31, 2016 |
|
Period from January 1, 2016 through September 9, 2016 |
Year Ended December 31, 2015 |
||||||||||
Basic: |
|||||||||||||||
Net income (loss) available to common stockholders |
$ | 487,679 | $ | (479,984 | ) | $ | (32,794 | ) | $ | (2,006,958 | ) | ||||
| | | | | | | | | | | | | | | | |
| | | | | | | | | | | | | | | | |
| | | | | | | | | | | | | | | | |
Weighted average basic number of common shares outstanding |
132,763 | 91,228 | 120,513 | 107,531 | |||||||||||
| | | | | | | | | | | | | | | | |
Basic net income (loss) per common share |
$ | 3.67 | $ | (5.26 | ) | $ | (0.27 | ) | $ | (18.66 | ) | ||||
| | | | | | | | | | | | | | | | |
| | | | | | | | | | | | | | | | |
| | | | | | | | | | | | | | | | |
Diluted: |
|||||||||||||||
Net income (loss) available to common stockholders |
$ | 487,679 | $ | (479,984 | ) | $ | (32,794 | ) | $ | (2,006,958 | ) | ||||
| | | | | | | | | | | | | | | | |
| | | | | | | | | | | | | | | | |
| | | | | | | | | | | | | | | | |
Weighted average basic number of common shares outstanding |
132,763 | 91,228 | 120,513 | 107,531 | |||||||||||
Common stock equivalent shares representing shares issuable upon: |
|||||||||||||||
Exercise of stock options |
Anti-dilutive | Anti-dilutive | Anti-dilutive | Anti-dilutive | |||||||||||
Exercise of February 2012 Warrants |
— | — | Anti-dilutive | Anti-dilutive | |||||||||||
Exercise of warrants |
Anti-dilutive | Anti-dilutive | — | — | |||||||||||
Vesting of restricted shares |
813 | Anti-dilutive | Anti-dilutive | Anti-dilutive | |||||||||||
Vesting of performance units |
— | — | — | — | |||||||||||
Conversion of preferred stock |
Anti-dilutive | — | — | — | |||||||||||
Conversion of Convertible Note |
— | — | Anti-dilutive | Anti-dilutive | |||||||||||
Conversion of Series A Preferred Stock |
— | — | Anti-dilutive | Anti-dilutive | |||||||||||
| | | | | | | | | | | | | | | | |
Weighted average diluted number of common shares outstanding |
133,576 | 91,228 | 120,513 | 107,531 | |||||||||||
| | | | | | | | | | | | | | | | |
Diluted net income (loss) per common share |
$ | 3.65 | $ | (5.26 | ) | $ | (0.27 | ) | $ | (18.66 | ) | ||||
| | | | | | | | | | | | | | | | |
| | | | | | | | | | | | | | | | |
| | | | | | | | | | | | | | | | |
Common stock equivalents, including stock options, restricted shares, warrants, and preferred stock totaling 17.1 million shares for the year ended December 31, 2017 were not included in the computation of diluted earnings per share of common stock because the effect would have been anti-dilutive.
142
HALCÓN RESOURCES CORPORATION
NOTES TO THE CONSOLIDATED FINANCIAL STATEMENTS (Continued)
15. EARNINGS PER SHARE (Continued)
On February 9, 2018, the Company sold 9.2 million shares of common stock, par value $0.0001 per share, in a public offering at a price of $6.90 per share. Refer to Note 17, "Subsequent Events," for further details.
Common stock equivalents, including stock options, restricted shares and warrants totaling 11.2 million shares for the period from September 10, 2016 through December 31, 2016 were not included in the computation of diluted earnings per share of common stock because the effect would have been anti-dilutive. Common stock equivalents, including stock options, restricted shares, warrants, convertible debt and preferred stock totaling 43.6 million shares for the period from January 1, 2016 through September 9, 2016 were not included in the computation of diluted earnings per share of common stock because the effect would have been anti-dilutive.
Common stock equivalents, including stock options, restricted shares, warrants, convertible debt and preferred stock totaling 47.1 million shares were not included in the computation of diluted earnings per share of common stock because the effect would have been anti-dilutive for the year ended December 31, 2015 due to the net loss.
143
HALCÓN RESOURCES CORPORATION
NOTES TO THE CONSOLIDATED FINANCIAL STATEMENTS (Continued)
16. ADDITIONAL FINANCIAL STATEMENT INFORMATION
Certain balance sheet amounts are comprised of the following (in thousands):
| |
Successor | ||||||
|---|---|---|---|---|---|---|---|
| |
December 31, 2017 | December 31, 2016 | |||||
Accounts receivable: |
|||||||
Oil, natural gas and natural gas liquids revenues |
$ | 24,110 | $ | 86,433 | |||
Joint interest accounts |
2,249 | 39,828 | |||||
Accrued settlements on derivative contracts |
64 | 18,599 | |||||
Affiliated partnership |
— | 268 | |||||
Other |
9,993 | 2,634 | |||||
| | | | | | | | |
|
$ | 36,416 | $ | 147,762 | |||
| | | | | | | | |
| | | | | | | | |
| | | | | | | | |
Prepaids and other: |
|||||||
Prepaids |
$ | 4,324 | $ | 6,704 | |||
Income tax receivable |
6,250 | — | |||||
Other |
54 | 236 | |||||
| | | | | | | | |
|
$ | 10,628 | $ | 6,940 | |||
| | | | | | | | |
| | | | | | | | |
| | | | | | | | |
Funds in escrow and other: |
|||||||
Funds in escrow |
$ | 563 | $ | 561 | |||
Other |
1,128 | 1,326 | |||||
| | | | | | | | |
|
$ | 1,691 | $ | 1,887 | |||
| | | | | | | | |
| | | | | | | | |
| | | | | | | | |
Accounts payable and accrued liabilities: |
|||||||
Trade payables |
$ | 35,688 | $ | 24,364 | |||
Accrued oil and natural gas capital costs |
50,743 | 32,967 | |||||
Revenues and royalties payable |
20,256 | 79,147 | |||||
Accrued interest expense |
10,985 | 31,146 | |||||
Accrued employee compensation |
9,805 | 3,428 | |||||
Accrued lease operating expenses |
2,024 | 14,077 | |||||
Deferred premium on derivative contracts |
1,142 | — | |||||
Affiliated partnership |
— | 323 | |||||
Other |
444 | 732 | |||||
| | | | | | | | |
|
$ | 131,087 | $ | 186,184 | |||
| | | | | | | | |
| | | | | | | | |
| | | | | | | | |
17. SUBSEQUENT EVENTS
Pending Acquisition of West Quito Draw Properties
On February 6, 2018, a wholly owned subsidiary of the Company, entered into a Purchase and Sale Agreement (the Shell PSA) with SWEPI LP (Shell), an affiliate of Shell Oil Company, pursuant to which the Company agreed to purchase acreage and related assets in the Southern Delaware Basin located in Ward County, Texas (the West Quito Draw Properties) for a total purchase price of $200.0 million. The effective date of the proposed acquisition is February 1, 2018, and the Company expects to close the transaction in early April 2018.
144
HALCÓN RESOURCES CORPORATION
NOTES TO THE CONSOLIDATED FINANCIAL STATEMENTS (Continued)
17. SUBSEQUENT EVENTS (Continued)
The purchase price is subject to adjustments for (i) operating expenses, capital expenditures and revenues between the effective date and the closing date, (ii) title and environmental defects, and (iii) other purchase price adjustments customary in oil and gas purchase and sale agreements. Pursuant to the terms of the Shell PSA, the Company paid a deposit into escrow totaling $20.0 million, which amount will be applied to the purchase price if the transaction closes.
The completion of the acquisition of the West Quito Draw Properties is subject to customary closing conditions. Either party may terminate the Shell PSA if certain closing conditions have not been satisfied, or if the transaction has not closed on or before April 20, 2018. If one or more of the closing conditions are not satisfied, or if the transaction is otherwise terminated, the acquisition may not be completed. The Company's escrow deposit with Shell is refundable only in specified circumstances if the transaction is not consummated.
Shell and the Company each make customary representations and warranties in the Shell PSA for transactions of this type. The Shell PSA also includes customary covenants relating to the operation of the West Quito Draw Properties prior to the closing date and other matters. The parties have agreed to indemnify one another for breaches of their respective representations and warranties, as well as the operation of the West Quito Draw Properties prior to (in the case of the Shell) and after (in the case of the Company) the closing date. Indemnities for breaches of representations and warranties, and any purchase price adjustments attributable to title or environmental defects, are subject to certain threshold limitations. Specifically, indemnification claims are subject to an individual claim threshold of $50,000, and Shell is required to indemnify the Company for claims totaling in excess of 2% of the purchase price, or $4.0 million. The Company's right to indemnification in certain circumstances is subject to a cap equal to 15% of the purchase price, or $30.0 million. The total amount of uncured title defect claims or unremedied environmental claims must be more than 1.5% of the purchase price, or $3.0 million, respectively, before the Company will be entitled to a downward adjustment to the purchase price consideration for either type of claim.
The Company intends to fund the cash consideration for the acquisition of the West Quito Draw Properties with the net proceeds from the issuance of the Additional 2025 Notes and common stock, both of which are discussed below. There can be no assurance that the Company will acquire the West Quito Draw Properties on the terms or timing described herein or at all. Even if the Company consummates the acquisition of the West Quito Draw Properties, the Company may not be able to achieve the expected benefits.
Issuance of Additional 2025 Notes
On February 15, 2018, the Company issued an additional $200.0 million aggregate principal amount of its 2025 Notes at a price to the initial purchasers of 103.0% of par (the Additional 2025 Notes). The net proceeds from the sale of the Additional 2025 Notes were approximately $203.0 million after deducting initial purchasers' premiums, commissions and estimated offering expenses and will be used to fund the cash consideration for the acquisition of the West Quito Draw Properties, if consummated, and for general corporate purposes, including to fund the Company's 2018 drilling program. These notes were issued under the February 2017 Indenture.
The Additional 2025 Notes will be treated as a single class with, and have the same terms as, the 2025 Notes, except that the Additional 2025 Notes will initially be subject to transfer restrictions and
145
HALCÓN RESOURCES CORPORATION
NOTES TO THE CONSOLIDATED FINANCIAL STATEMENTS (Continued)
17. SUBSEQUENT EVENTS (Continued)
have the benefit of certain registration rights and provisions for the payment of additional interest in the event of a breach with respect to such registration rights.
In connection with the Additional 2025 Notes issued, on February 15, 2018, the Company and J.P. Morgan Securities, LLC, on behalf of itself and initial purchasers, entered into a Registration Rights Agreement, pursuant to which the Company agreed to, among other things, use reasonable best efforts to file a registration statement under the Securities Act and complete an exchange offer for the Additional 2025 Notes within 180 days after closing.
The Additional 2025 Notes were issued in a private placement exempt from the registration under the Securities Act pursuant to Rule 144A and Regulation S under the Securities Act and applicable state securities laws.
Issuance of Common Stock
On February 9, 2018, the Company sold 9.2 million shares of common stock, par value $0.0001 per share, in a public offering at a price of $6.90 per share. The net proceeds to the Company from the offering were approximately $60.8 million, after deducting the underwriters' discounts and estimated offering expenses. The Company intends to use the net proceeds, together with the net proceeds from the issuance of the Additional 2025 Notes, to fund the cash consideration for the acquisition of the West Quito Draw Properties, if consummated, and for general corporate purposes, including to fund the Company's 2018 drilling program.
Second Amendment to Senior Credit Agreement
On February 2, 2018, the Company entered into the Second Amendment to the Company's Senior Credit Agreement by and among the Company, as borrower, JPMorgan Chase Bank, N.A., as administrative agent, and certain other financial institutions party thereto, as lenders. The Second Amendment, among other things, provides for (i) the use of annualized financial data in determining EBITDA (as defined in the Senior Credit Agreement) for the fiscal quarters ending June 30, 2018, September 30, 2018 and December 31, 2018, (ii) an increase in the ratio of Consolidated Total Net Debt (as defined in the Senior Credit Agreement) to EBITDA of 4.50:1.00 for the fiscal quarter ending June 30, 2018, and a ratio of 4.00:1.00 for any fiscal quarter thereafter, (iii) a waiver of compliance with the covenant relating to the Total Net Indebtedness Leverage Ratio (as defined in the Senior Credit Agreement) for the fiscal quarter ending March 31, 2018, and (iv) a waiver of the automatic reduction to the borrowing base that would otherwise result due to the issuance of the Additional 2025 Notes.
Northern Tract of Monument Draw Assets (Ward and Winkler Counties, Texas)
On January 9, 2018, the Company exercised its option to purchase the Northern Tract of the Ward County Assets, for a cash purchase price of approximately $108.2 million. The acreage is located in the Monument Draw area of the Delaware Basin adjacent to the Company's existing Ward County Assets.
146
SUPPLEMENTAL OIL AND GAS INFORMATION (UNAUDITED)
Oil and Natural Gas Reserves
Users of this information should be aware that the process of estimating quantities of "proved" and "proved developed" oil and natural gas reserves is very complex, requiring significant subjective decisions in the evaluation of all available geological, engineering and economic data for each reservoir. The data for a given reservoir may also change substantially over time as a result of numerous factors including, but not limited to, additional development activity, evolving production history and continual reassessment of the viability of production under varying economic conditions. As a result, revisions to existing reserve estimates may occur from time to time. Although every reasonable effort is made to ensure reserve estimates reported represent the most accurate assessments possible, the subjective decisions and variances in available data for various reservoirs make these estimates generally less precise than other estimates included in the financial statement disclosures.
Proved reserves represent estimated quantities of natural gas, crude oil and condensate and natural gas liquids that geological and engineering data demonstrate, with reasonable certainty, to be recoverable in future years from known reservoirs under economic and operating conditions in effect when the estimates were made. Proved developed reserves are proved reserves expected to be recovered through wells and equipment in place and under operating methods used when the estimates were made.
The proved reserves estimates reported herein for the years ended December 31, 2017, 2016 and 2015 have been independently evaluated by Netherland, Sewell, a worldwide leader of petroleum property analysis for industry and financial organizations and government agencies. Netherland, Sewell was founded in 1961 and performs consulting petroleum engineering services under Texas Board of Professional Engineers Registration No. F-2699. Within Netherland, Sewell, the technical persons primarily responsible for preparing the estimates set forth in the Netherland, Sewell reserves reports incorporated herein are Mr. Neil H. Little, Mr. J. Carter Henson, Jr. and Mr. Mike K. Norton. Mr. Little, a Licensed Professional Engineer in the State of Texas (No. 117966), has been practicing consulting petroleum engineering at Netherland, Sewell since 2011 and has over nine years of prior industry experience. He graduated from Rice University in 2002 with a Bachelor of Science Degree in Chemical Engineering and from University of Houston in 2007 with a Master of Business Administration Degree. Mr. Henson, a Licensed Professional Engineer in the State of Texas (No. 73964), has been practicing consulting petroleum engineering at Netherland, Sewell since 1989 and has over eight years of prior industry experience. He graduated from Rice University in 1981 with a Bachelor of Science Degree in Mechanical Engineering. Mr. Norton, a Licensed Professional Geoscientist in the State of Texas (No. 441), has been a practicing petroleum geoscience consultant at Netherland, Sewell since 1989 and has over ten years of prior industry experience. He graduated from Texas A&M University in 1978 with a Bachelor of Science Degree in Geology. Netherland, Sewell has reported to the Company, that the technical principals meet or exceed the education, training, and experience requirements set forth in the Standards Pertaining to the Estimating and Auditing of Oil and Gas Reserves Information promulgated by the Society of Petroleum Engineers; they are proficient in judiciously applying industry standard practices to engineering and geoscience evaluations as well as applying SEC and other industry reserves definitions and guidelines.
The Company's board of directors has established an independent reserves committee composed of three outside directors, all of whom have experience in energy company reserve evaluations. The Company's independent engineering firm reports jointly to the reserves committee and to the Senior Vice President of Corporate Reserves. The reserves committee is charged with ensuring the integrity of the process of selection and engagement of the independent engineering firm and in making a recommendation to the board of directors as to whether to approve the report prepared by the independent engineering firm. Ms. Tina Obut, the Company's Senior Vice President of Corporate Reserves is primarily responsible for overseeing the preparation of the annual reserve report by Netherland, Sewell. She graduated from Marietta College with a Bachelor of Science degree in
147
Petroleum Engineering, received a Master of Science degree in Petroleum and Natural Gas Engineering from Penn State University and a Master of Business Administration degree from the University of Houston.
The reserves information in this Annual Report on Form 10-K represents only estimates. Reserve engineering is a subjective process of estimating underground accumulations of oil and natural gas that cannot be measured in an exact manner. The accuracy of any reserve estimate is a function of the quality of available data and of engineering and geological interpretation and judgment. As a result, estimates of different engineers may vary. In addition, results of drilling, testing and production subsequent to the date of an estimate may lead to revising the original estimate. Accordingly, initial reserve estimates are often different from the quantities of oil and natural gas that are ultimately recovered. The meaningfulness of such estimates depends primarily on the accuracy of the assumptions upon which they were based. Except to the extent the Company acquires additional properties containing proved reserves or conducts successful exploration and development activities or both, the Company's proved reserves will decline as reserves are produced.
The following tables illustrate the Company's estimated net proved reserves, including changes, and proved developed and proved undeveloped reserves for the periods indicated. The oil and natural gas liquids prices as of December 31, 2017, 2016 and 2015 are based on the respective 12-month unweighted average of the first of the month prices of the West Texas Intermediate spot price which equates to $51.34 per barrel, $42.75 per barrel and $50.28 per barrel, respectively. The natural gas prices as of December 31, 2017, 2016 and 2015 are based on the respective 12-month unweighted average of the first of the month prices of the Henry Hub spot price which equates to $2.976 per MMBtu, $2.481 per MMBtu and $2.587 per MMBtu, respectively. All prices are adjusted by lease or field for energy content, transportation fees, and market differentials. All prices are held constant in accordance with SEC guidelines. All proved reserves are located in the United States.
| |
Total Proved Reserves | ||||||||||||
|---|---|---|---|---|---|---|---|---|---|---|---|---|---|
| |
Oil (MBbls) | Natural Gas (MMcf) |
Natural Gas Liquids (MBbls) |
Equivalent (MBoe) |
|||||||||
Proved reserves, December 31, 2014 (Predecessor) |
155,574 | 103,662 | 16,286 | 189,137 | |||||||||
Extensions and discoveries |
10,117 | 6,838 | 1,215 | 12,472 | |||||||||
Purchase of minerals in place |
36 | 17 | 4 | 43 | |||||||||
Production |
(12,019 | ) | (10,123 | ) | (1,457 | ) | (15,163 | ) | |||||
Sale of minerals in place |
(5 | ) | (2 | ) | (1 | ) | (6 | ) | |||||
Revision of previous estimates |
(33,010 | ) | (21,950 | ) | (3,010 | ) | (39,679 | ) | |||||
| | | | | | | | | | | | | | |
Proved reserves, December 31, 2015 (Predecessor) |
120,693 | 78,442 | 13,037 | 146,804 | |||||||||
| | | | | | | | | | | | | | |
Extensions and discoveries |
15,279 | 7,532 | 1,722 | 18,256 | |||||||||
Purchase of minerals in place |
1,114 | 654 | 113 | 1,336 | |||||||||
Production |
(10,368 | ) | (9,571 | ) | (1,597 | ) | (13,560 | ) | |||||
Sale of minerals in place |
(1,319 | ) | (258 | ) | (7 | ) | (1,369 | ) | |||||
Revision of previous estimates |
(5,799 | ) | 3,439 | 2,373 | (2,853 | ) | |||||||
| | | | | | | | | | | | | | |
Proved reserves, December 31, 2016 (Successor) |
119,600 | 80,238 | 15,641 | 148,614 | |||||||||
| | | | | | | | | | | | | | |
Extensions and discoveries |
19,105 | 18,423 | 3,483 | 25,659 | |||||||||
Purchase of minerals in place |
20,934 | 15,635 | 3,220 | 26,760 | |||||||||
Production |
(7,511 | ) | (7,439 | ) | (1,249 | ) | (10,000 | ) | |||||
Sale of minerals in place |
(126,427 | ) | (92,465 | ) | (18,490 | ) | (160,328 | ) | |||||
Revision of previous estimates |
8,432 | 32,346 | 6,591 | 20,414 | |||||||||
| | | | | | | | | | | | | | |
Proved reserves, December 31, 2017 (Successor) |
34,133 | 46,738 | 9,196 | 51,119 | |||||||||
| | | | | | | | | | | | | | |
| | | | | | | | | | | | | | |
| | | | | | | | | | | | | | |
148
| |
Equivalent (MBoe) | |||||||||
|---|---|---|---|---|---|---|---|---|---|---|
| |
Proved Developed Reserves |
Proved Undeveloped Reserves |
Total Proved Reserves |
|||||||
Proved reserves, December 31, 2014 (Predecessor) |
77,427 | 111,710 | 189,137 | |||||||
Extensions and discoveries |
6,559 | 5,913 | 12,472 | |||||||
Purchase of minerals in place |
43 | — | 43 | |||||||
Production |
(15,163 | ) | — | (15,163 | ) | |||||
Sale of minerals in place |
(6 | ) | — | (6 | ) | |||||
Transfers |
14,594 | (14,594 | ) | — | ||||||
Revision of previous estimates |
(1,569 | ) | (38,110 | ) | (39,679 | ) | ||||
| | | | | | | | | | | |
Proved reserves, December 31, 2015 (Predecessor) |
81,885 | 64,919 | 146,804 | |||||||
| | | | | | | | | | | |
Extensions and discoveries |
3,925 | 14,331 | 18,256 | |||||||
Purchase of minerals in place |
810 | 526 | 1,336 | |||||||
Production |
(13,560 | ) | — | (13,560 | ) | |||||
Sale of minerals in place |
(1,123 | ) | (246 | ) | (1,369 | ) | ||||
Transfers |
7,510 | (7,510 | ) | — | ||||||
Revision of previous estimates |
6,461 | (9,314 | ) | (2,853 | ) | |||||
| | | | | | | | | | | |
Proved reserves, December 31, 2016 (Successor) |
85,908 | 62,706 | 148,614 | |||||||
| | | | | | | | | | | |
Extensions and discoveries |
8,269 | 17,390 | 25,659 | |||||||
Purchase of minerals in place |
9,123 | 17,637 | 26,760 | |||||||
Production |
(10,000 | ) | — | (10,000 | ) | |||||
Sale of minerals in place |
(100,537 | ) | (59,791 | ) | (160,328 | ) | ||||
Transfers |
7,432 | (7,432 | ) | — | ||||||
Revision of previous estimates |
15,823 | 4,591 | 20,414 | |||||||
| | | | | | | | | | | |
Proved reserves, December 31, 2017 (Successor) |
16,018 | 35,101 | 51,119 | |||||||
| | | | | | | | | | | |
| | | | | | | | | | | |
| | | | | | | | | | | |
| |
Proved Developed Reserves | ||||||||||||
|---|---|---|---|---|---|---|---|---|---|---|---|---|---|
| |
Oil (MBbls) | Natural Gas (MMcf) |
Natural Gas Liquids (MBbls) |
Equivalent (MBoe) |
|||||||||
December 31, 2017 (Successor) |
10,150 | 16,303 | 3,151 | 16,018 | |||||||||
December 31, 2016 (Successor) |
67,983 | 51,525 | 9,337 | 85,908 | |||||||||
December 31, 2015 (Predecessor) |
66,123 | 49,201 | 7,561 | 81,885 | |||||||||
| |
Proved Undeveloped Reserves | ||||||||||||
|---|---|---|---|---|---|---|---|---|---|---|---|---|---|
| |
Oil (MBbls) | Natural Gas (MMcf) |
Natural Gas Liquids (MBbls) |
Equivalent (MBoe) |
|||||||||
December 31, 2017 (Successor) |
23,983 | 30,435 | 6,045 | 35,101 | |||||||||
December 31, 2016 (Successor) |
51,617 | 28,713 | 6,304 | 62,706 | |||||||||
December 31, 2015 (Predecessor) |
54,570 | 29,241 | 5,476 | 64,919 | |||||||||
The Company's proved reserves have been estimated using deterministic methods. At December 31, 2017, total proved reserves were approximately 51.1 MMBoe, a 97.5 MMBoe net decrease over the previous year's estimate of 148.6 MMBoe. The net decrease in total proved reserves was the result of divestitures totaling 160.3 MMBoe and production of 10.0 MMBoe, partially offset by acquisitions totaling 26.8 MMBoe, additions and extensions of 25.7 MMBoe and net positive revisions of 20.4 MMBoe. In 2017, we divested of all of our assets in the Bakken/Three Forks formations in North Dakota, and the Eagle Ford formation in East Texas, and other non-core assets, which in its entirety comprised all of our proved reserves at December 31, 2016. Substantially all of our proved reserves at December 31, 2017 are associated with our Delaware Basin properties.
149
At December 31, 2017, our estimated proved undeveloped (PUD) reserves were approximately 35.1 MMBoe, a 27.6 MMBoe net decrease over the previous year's estimate of 62.7 MMBoe. The net decrease in PUD reserves was the result of divestitures of 59.8 MMBoe and development of 7.4 MMBoe, partially offset by acquisitions of 17.6 MMBoe, additions and extensions of 17.4 MMBoe and net positive revisions of 4.6 MMBoe. Of the 17.4 MMBoe of extensions and discoveries in proved undeveloped reserves, approximately 10.0 MMBoe are associated with drilling infills and 5.9 MMBoe are associated with drilling extensions in the Delaware Basin. We did not separately track infill drilling activities as a subset of additions to extensions and discoveries for the properties we disposed of during 2017. Net positive revisions of 4.6 MMBoe in proved undeveloped reserves include net negative revisions of 3.0 MMBoe offset by 7.6 MMBoe of positive revisions due to the effect of higher prices.
At December 31, 2017, our proved developed reserves were approximately 16.0 MMBoe, a 69.9 MMBoe net decrease over the previous year's estimate of 85.9 MMBoe. The net decrease in proved developed reserves was the result of divestitures of 100.5 MMBoe and production of 10.0 MMBoe, partially offset by additions and extensions of 8.3 MMBoe, acquisitions of 9.1 MMBoe, development of 7.4 MMBoe (transferred from PUD), and net positive revisions of 15.8 MMBoe. Of the 8.3 MMBoe of extensions and discoveries in proved developed reserves, approximately 3.1 MMBoe are associated with infill drilling activity and 2.5 MMBoe are associated with drilling extensions in the Delaware Basin. We did not separately track infill drilling activities as a subset of additions to extensions and discoveries for the properties we disposed of during 2017. Net positive revisions of 15.8 MMBoe in proved developed reserves include 12.5 MMBoe in net positive performance revisions and 3.3 MMBoe in positive revisions due to increase in prices.
During 2016, net positive revisions of 6.5 MMBoe in proved developed reserves include 9.7 MMBoe in net positive performance revisions offset by 3.2 MMBoe in negative revisions due to lower prices. Net negative revisions of 9.3 MMBoe in proved undeveloped reserves include 22.4 MMBoe associated with PUD locations that were removed because they no longer met the SEC five year development requirement, 2.2 MMBoe of negative revisions due to the effect of lower prices, offset by 15.3 MMBoe in net positive revisions in undeveloped reserves related to improved performance.
During 2015, net negative revisions in proved developed reserves of 1.6 MMBoe include 6.9 MMBoe in net positive performance revisions offset by 8.5 MMBoe in negative revisions due to lower prices. Net negative revisions in proved undeveloped reserves of 38.1 MMBoe include 36.6 MMBoe associated with PUD locations that were removed because they no longer met the SEC five year development requirement, 8.3 MMBoe in negative revisions due to lower prices, offset by 6.8 MMBoe in net positive revisions to undeveloped reserves related to improved performance.
As of December 31, 2017 all of the Company's PUD reserves are planned to be developed within five years from the date they were initially recorded. During 2017, approximately $143.3 million in capital expenditures went toward the development of proved undeveloped reserves, which includes drilling, completion and other facility costs associated with developing proved undeveloped wells.
For wells classified as proved developed producing where sufficient production history existed, reserves were based on individual well performance evaluation and production decline curve extrapolation techniques. For undeveloped locations and wells that lacked sufficient production history, reserves were based on analogy to producing wells within the same area exhibiting similar geologic and reservoir characteristics, combined with volumetric methods. The volumetric estimates were based on geologic maps and rock and fluid properties derived from well logs, core data, pressure measurements, and fluid samples. Well spacing was determined from drainage patterns derived from a combination of performance-based recoveries and volumetric estimates for each area or field. PUD locations were limited to areas of uniformly high quality reservoir properties, between existing commercial producers.
150
Reliable technologies were used to determine areas where PUD locations are more than one offset location away from a producing well. These technologies include seismic data, wire line openhole log data, core data, log cross-sections, performance data, and statistical analysis. In such areas, these data demonstrated consistent, continuous reservoir characteristics in addition to significant quantities of economic EURs from individual producing wells. The Company's management team has been a leader in data gathering and evaluation in these areas and was instrumental in developing consortiums that allow various operators to exchange data. The Company relied only on production flow tests and historical production data, along with the reliable geologic data mentioned above to estimate proved reserves. No other alternative methods or technologies were used to estimate proved reserves. Out of total proved undeveloped reserves of 35.1 MMBoe at December 31, 2017, 7.9 MMBoe were associated with 9 gross PUD locations that were more than one offset location from a producing well.
Capitalized Costs Relating to Oil and Natural Gas Producing Activities
The following table illustrates the total amount of capitalized costs relating to oil and natural gas producing activities and the total amount of related accumulated depletion, depreciation and accretion (in thousands):
| |
Successor |
|
Predecessor | |||||||||
|---|---|---|---|---|---|---|---|---|---|---|---|---|
| |
December 31, 2017 |
December 31, 2016 |
|
December 31, 2015 |
||||||||
| |
|
|||||||||||
| |
|
|||||||||||
Evaluated oil and natural gas properties(1) |
$ | 877,316 | $ | 1,269,034 | $ | 7,060,721 | ||||||
Unevaluated oil and natural gas properties |
765,786 | 316,439 | 1,641,356 | |||||||||
| | | | | | | | | | | | | |
|
1,643,102 | 1,585,473 | 8,702,077 | |||||||||
Accumulated depletion(1) |
(570,155 | ) | (465,849 | ) | (5,933,688 | ) | ||||||
| | | | | | | | | | | | | |
|
$ | 1,072,947 | $ | 1,119,624 | $ | 2,768,389 | ||||||
| | | | | | | | | | | | | |
| | | | | | | | | | | | | |
| | | | | | | | | | | | | |
- (1)
- Amounts do not include costs for the Company's gas gathering systems and related support equipment.
Costs Incurred in Oil and Natural Gas Property Acquisition, Exploration and Development Activities
Costs incurred in property acquisition, exploration and development activities were as follows:
| |
Successor |
|
Predecessor | ||||||||||||
|---|---|---|---|---|---|---|---|---|---|---|---|---|---|---|---|
| |
|
Period from September 10, 2016 through December 31, 2016 |
|
Period from January 1, 2016 through September 9, 2016 |
|
||||||||||
| |
|
|
|
||||||||||||
| |
Year Ended December 31, 2017 |
|
Year Ended December 31, 2015 |
||||||||||||
| |
|
||||||||||||||
| |
|
||||||||||||||
Property acquisition costs, proved(1) |
$ | 219,308 | $ | — | $ | (127 | ) | $ | (582 | ) | |||||
Property acquisition costs, unproved |
794,239 | 5,070 | 3 | 268 | |||||||||||
Exploration and extension well costs |
183,798 | 13,865 | 67,216 | 194,683 | |||||||||||
Development costs |
143,323 | 45,765 | 135,939 | 285,194 | |||||||||||
| | | | | | | | | | | | | | | | |
Total costs |
$ | 1,340,668 | $ | 64,700 | $ | 203,031 | $ | 479,563 | |||||||
| | | | | | | | | | | | | | | | |
| | | | | | | | | | | | | | | | |
| | | | | | | | | | | | | | | | |
- (1)
- Proved property acquisition costs in 2016 and 2015 primarily reflect the impact of purchase price adjustments.
Standardized Measure of Discounted Future Net Cash Flows Relating to Proved Oil and Natural Gas Reserves
The following Standardized Measure of Discounted Future Net Cash Flows (Standardized Measure) has been developed utilizing ASC 932, Extractive Activities—Oil and Gas (ASC 932)
151
procedures and based on oil and natural gas reserve and production volumes estimated by the Company's engineering staff. It can be used for some comparisons, but should not be the only method used to evaluate the Company or its performance. Further, the information in the following table may not represent realistic assessments of future cash flows, nor should the Standardized Measure be viewed as representative of the current value of the Company.
The Company believes that the following factors should be taken into account when reviewing the following information:
- •
- future costs and selling prices will probably differ from those required to be used in these calculations;
- •
- due to future market conditions and governmental regulations, actual rates of production in future years may vary significantly from the rate
of production assumed in the calculations;
- •
- a 10% discount rate may not be reasonable as a measure of the relative risk inherent in realizing future net oil and natural gas revenues; and
- •
- future net revenues may be subject to different rates of income taxation.
At December 31, 2017, 2016 and 2015, as specified by the SEC, the prices for oil and natural gas used in this calculation were the unweighted 12-month average of the first day of the month prices, except for volumes subject to fixed price contracts. Estimates of future income taxes are computed using current statutory income tax rates including consideration for estimated future statutory depletion and tax credits. The resulting net cash flows are reduced to present value amounts by applying a 10% discount factor.
The Standardized Measure is as follows:
| |
Years Ended December 31, | |||||||||
|---|---|---|---|---|---|---|---|---|---|---|
| |
2017 | 2016 | 2015 | |||||||
| |
(In thousands) |
|||||||||
Future cash inflows |
$ | 2,033,110 | $ | 4,726,490 | $ | 5,406,179 | ||||
Future production costs |
(769,894 | ) | (2,290,079 | ) | (2,414,629 | ) | ||||
Future development costs |
(421,748 | ) | (771,070 | ) | (813,814 | ) | ||||
Future income tax expense |
(12,463 | ) | — | — | ||||||
| | | | | | | | | | | |
Future net cash flows before 10% discount |
829,005 | 1,665,341 | 2,177,736 | |||||||
10% annual discount for estimated timing of cash flows |
(492,972 | ) | (861,824 | ) | (1,067,171 | ) | ||||
| | | | | | | | | | | |
Standardized measure of discounted future net cash flows |
$ | 336,033 | $ | 803,517 | $ | 1,110,565 | ||||
| | | | | | | | | | | |
| | | | | | | | | | | |
| | | | | | | | | | | |
152
Changes in Standardized Measure of Discounted Future Net Cash Flows Relating to Proved Oil and Natural Gas Reserves
The following is a summary of the changes in the Standardized Measure for the Company's proved oil and natural gas reserves during each of the years in the three year period ended December 31, 2017:
| |
Years Ended December 31, | |||||||||
|---|---|---|---|---|---|---|---|---|---|---|
| |
2017 | 2016 | 2015 | |||||||
| |
(In thousands) |
|||||||||
Beginning of year |
$ | 803,517 | $ | 1,110,565 | $ | 3,256,370 | ||||
Sale of oil and natural gas produced, net of production costs |
(220,815 | ) | (275,816 | ) | (375,137 | ) | ||||
Purchase of minerals in place |
222,658 | 9,626 | 946 | |||||||
Sales of minerals in place |
(1,368,383 | ) | (18,816 | ) | (96 | ) | ||||
Extensions and discoveries |
200,807 | 67,433 | 94,679 | |||||||
Changes in income taxes, net |
(952 | ) | — | 170,546 | ||||||
Changes in prices and costs |
330,130 | (302,064 | ) | (2,452,581 | ) | |||||
Previously estimated development costs incurred |
58,605 | 66,087 | 295,258 | |||||||
Net changes in future development costs |
— | 46,981 | 456,726 | |||||||
Revisions of previous quantities |
206,425 | 20,192 | (718,932 | ) | ||||||
Accretion of discount |
62,379 | 111,056 | 342,692 | |||||||
Changes in production rates and other |
41,662 | (31,727 | ) | 40,094 | ||||||
| | | | | | | | | | | |
End of year |
$ | 336,033 | $ | 803,517 | $ | 1,110,565 | ||||
| | | | | | | | | | | |
| | | | | | | | | | | |
| | | | | | | | | | | |
153
SELECTED QUARTERLY FINANCIAL DATA (UNAUDITED)
Prior year financial statements are not comparable to our current year financial statements due to the adoption of fresh-start accounting. References to "Successor" or "Successor Company" relate to the financial position and results of operations of the reorganized company subsequent to September 9, 2016. References to "Predecessor" or "Predecessor Company" relate to the financial position and results of operations of the reorganized company prior to, and including, September 9, 2016.
The following table presents selected quarterly financial data derived from the Company's unaudited consolidated interim financial statements. The following data is only a summary and should be read with the Company's historical consolidated financial statements and related notes contained in this document (in thousands, except per share amounts).
| |
Successor | ||||||||||||
|---|---|---|---|---|---|---|---|---|---|---|---|---|---|
| |
Quarters Ended | ||||||||||||
| |
March 31 | June 30 | September 30 | December 31 | |||||||||
2017 |
|||||||||||||
Total operating revenues |
$ | 135,598 | $ | 120,137 | $ | 96,953 | $ | 25,277 | |||||
Income (loss) from operations |
256,695 | 15,656 | 473,199 | (30,127 | ) | ||||||||
Net income (loss) |
189,352 | 20,177 | 419,287 | (93,130 | ) | ||||||||
Net income (loss) available to common stockholders(1) |
188,551 | (27,029 | ) | 419,287 | (93,130 | ) | |||||||
Net income (loss) per share of common stock: |
|||||||||||||
Basic |
$ | 2.07 | $ | (0.19 | ) | $ | 2.85 | $ | (0.63 | ) | |||
Diluted |
$ | 1.69 | $ | (0.19 | ) | $ | 2.82 | $ | (0.63 | ) | |||
| |
Predecessor |
|
Successor | |||||||||||||||
|---|---|---|---|---|---|---|---|---|---|---|---|---|---|---|---|---|---|---|
| |
|
|
Period from July 1, 2016 through September 9, 2016 |
|
Period from September 10, 2016 through September 30, 2016 |
|
||||||||||||
| |
Quarter Ended March 31 |
Quarter Ended June 30 |
|
Quarter Ended December 31 |
||||||||||||||
| |
|
|||||||||||||||||
| |
|
|||||||||||||||||
2016 |
||||||||||||||||||
Total operating revenues |
$ | 81,349 | $ | 106,147 | $ | 79,347 | $ | 23,107 | $ | 130,255 | ||||||||
Income (loss) from operations |
(592,384 | ) | (261,458 | ) | 2,225 | (433,725 | ) | 17,926 | ||||||||||
Net income (loss) |
(539,999 | ) | (374,303 | ) | 926,260 | (450,692 | ) | (28,501 | ) | |||||||||
Net income (loss) available to common stockholders(2) |
(566,862 | ) | (382,353 | ) | 916,421 | (451,483 | ) | (28,501 | ) | |||||||||
Net income (loss) per share of common stock: |
||||||||||||||||||
Basic |
$ | (4.72 | ) | $ | (3.17 | ) | $ | 7.58 | $ | (4.96 | ) | $ | (0.31 | ) | ||||
Diluted |
$ | (4.72 | ) | $ | (3.17 | ) | $ | 6.06 | $ | (4.96 | ) | $ | (0.31 | ) | ||||
- (1)
- The volatility in "Net income (loss) available to common stockholders" is substantially due to a) the gains on the sales
of oil and natural gas properties and b) the losses on extinguishment of debt. See footnotes for additional information.
- (2)
- The volatility in "Net income (loss) available to common stockholders" is substantially due to a) the Company's reorganization and associated fresh-start accounting, b) the Company's full cost ceiling impairments, c) the gains on the extinguishment of debt and d) the Company's realized and unrealized gains and losses on its derivative contracts. See footnotes for additional information.
154
ITEM 9. CHANGES IN AND DISAGREEMENTS WITH ACCOUNTANTS ON ACCOUNTING AND FINANCIAL DISCLOSURE
None.
ITEM 9A. CONTROLS AND PROCEDURES
Management's Evaluation of Disclosure Controls and Procedures
In accordance with Rules 13a-15(f) and 15d-15(f), of the Exchange Act, we carried out an evaluation, under the supervision and with the participation of management, including our Chief Executive Officer and our Chief Financial Officer, of the effectiveness of our disclosure controls and procedures based on the Internal Control—Integrated Framework issued by the Committee of Sponsoring Organizations of the Treadway Commission in 2013 as of the end of the period covered by this report. Based on that evaluation, our Chief Executive Officer and Chief Financial Officer concluded that our disclosure controls and procedures were effective as of December 31, 2017 to provide reasonable assurance that information required to be disclosed in our reports filed or submitted under the Exchange Act is recorded, processed, summarized and reported within the time periods specified in the SEC's rules and forms. Our disclosure controls and procedures include controls and procedures designed to ensure that information required to be disclosed in reports filed or submitted under the Exchange Act is accumulated and communicated to our management, including our Chief Executive Officer and Chief Financial Officer, as appropriate, to allow timely decisions regarding required disclosure.
Management's Report on Internal Control over Financial Reporting
Management has assessed, and our independent registered public accounting firm, Deloitte & Touche LLP, has audited, our internal control over financial reporting as of December 31, 2017. The unqualified reports of management and Deloitte & Touche LLP thereon are included in Item 8. Consolidated Financial Statements and Supplementary Data of this Annual Report on Form 10-K and are incorporated by reference herein.
Changes in Internal Control over Financial Reporting
There has been no change in our internal control over financial reporting, as defined in Rules 13a-15(f) and 15d-15(f) of the Exchange Act, during the three months ended December 31, 2017 that has materially affected, or is reasonably likely to materially affect, our internal control over financial reporting.
None.
155
ITEM 10. DIRECTORS, EXECUTIVE OFFICERS AND CORPORATE GOVERNANCE
Pursuant to General Instruction 6 to Form 10-K, we incorporate by reference into this Item the information to be disclosed in our definitive proxy statement for our 2018 Annual Meeting of Stockholders.
The Company's Code of Conduct and Code of Ethics for the Chief Executive Officer and Senior Financial Officers can be found on the Company's website located at www.halconresources.com. Any stockholder may request a printed copy of such materials by submitting a written request to the Company's Corporate Secretary. If the Company amends the Code of Ethics or grants a waiver, including an implicit waiver, from the Code of Ethics, the Company will disclose the information on its website. The waiver information will remain on the website for at least twelve months after the initial disclosure of such waiver.
ITEM 11. EXECUTIVE COMPENSATION
Pursuant to General Instruction 6 to Form 10-K, we incorporate by reference into this Item the information to be disclosed in our definitive proxy statement for our 2018 Annual Meeting of Stockholders.
ITEM 12. SECURITY OWNERSHIP OF CERTAIN BENEFICIAL OWNERS AND MANAGEMENT AND RELATED STOCKHOLDER MATTERS
Equity Compensation Plan Information
The following table sets forth certain information as of December 31, 2017 with respect to compensation plans (including individual compensation arrangements) under which our equity securities are authorized for issuance.
Plan Category
|
Number of Securities to be Issued Upon Exercise of Outstanding Optionsand Rights(a) |
Weighted-Average Exercise Price of Outstanding Options and Rights |
Number of Securities Remaining Available for Future Issuance Under Equity Compensation Plans (Excluding Securities Reflected in Column(a)) |
|||||||
|---|---|---|---|---|---|---|---|---|---|---|
Equity compensation plans approved by security holders(1) |
7,481,410 | (2) | $ | 8.84 | 7,748,818 | |||||
Equity compensation plans not approved by security holders |
— | — | — | |||||||
| | | | | | | | | | | |
|
7,481,410 | (2) | $ | 8.84 | 7,748,818 | |||||
| | | | | | | | | | | |
| | | | | | | | | | | |
| | | | | | | | | | | |
- (1)
- Represents information for the 2016 Long-Term Incentive Plan.
- (2)
- Includes 745,507 shares of restricted stock not yet vested.
Pursuant to General Instruction 6 to Form 10-K, we incorporate by reference into this Item the information to be disclosed in our definitive proxy statement for our 2018 Annual Meeting of Stockholders.
156
ITEM 13. CERTAIN RELATIONSHIPS AND RELATED TRANSACTIONS, AND DIRECTOR INDEPENDENCE
Pursuant to General Instruction 6 to Form 10-K, we incorporate by reference into this Item the information to be disclosed in our definitive proxy statement for our 2018 Annual Meeting of Stockholders.
ITEM 14. PRINCIPAL ACCOUNTANT FEES AND SERVICES
Pursuant to General Instruction 6 to Form 10-K, we incorporate by reference into this Item the information to be disclosed in our definitive proxy statement for our 2018 Annual Meeting of Stockholders.
157
ITEM 15. EXHIBITS AND FINANCIAL STATEMENT SCHEDULES
- (1)
- Consolidated Financial Statements:
The consolidated financial statements of the Company and its subsidiaries and reports of independent registered public accounting firms listed in Section 8 of this Annual Report on Form 10-K are filed as a part of this Annual Report on Form 10-K.
- (2)
- Consolidated Financial Statements Schedules:
All schedules are omitted because they are inapplicable or because the required information is contained in the financial statements or included in the notes thereto.
- (3)
- Exhibits:
158
159
160
161
- *
- Attached hereto.
- †
- Indicates management contract or compensatory plan or arrangement.
The registrant has not filed with this report copies of the instruments defining rights of all holders of long-term debt of the registrant and its consolidated subsidiaries based upon the exception set forth in Item 601(b)(4)(iii)(A) of Regulation S-K. Copies of such instruments will be furnished to the SEC upon request.
None.
162
Pursuant to the requirements of the Securities Exchange Act of 1934, the registrant has duly caused this report to be signed on its behalf by the undersigned thereunto duly authorized.
| |
|
|
||
|---|---|---|---|---|
| HALCÓN RESOURCES CORPORATION | ||||
Date: February 28, 2018 |
By: |
/s/ FLOYD C. WILSON Floyd C. Wilson Chairman of the Board, Chief Executive Officer and President |
||
Pursuant to the requirements of the Securities Exchange Act of 1934, this report has been signed below by the following persons on behalf of the registrant and in the capacities and on the dates indicated.
Signature
|
Title
|
Date
|
||
|---|---|---|---|---|
| /s/ FLOYD C. WILSON Floyd C. Wilson |
Chairman of the Board, Chief Executive Officer and President | February 28, 2018 | ||
/s/ MARK J. MIZE Mark J. Mize |
Executive Vice President, Chief Financial Officer and Treasurer |
February 28, 2018 |
||
/s/ WILLIAM J. CAMPBELL William J. Campbell |
Director |
February 28, 2018 |
||
/s/ JAMES W. CHRISTMAS James W. Christmas |
Lead Director |
February 28, 2018 |
||
/s/ MICHAEL L. CLARK Michael L. Clark |
Director |
February 28, 2018 |
||
/s/ THOMAS R. FULLER Thomas R. Fuller |
Director |
February 28, 2018 |
||
/s/ DARRYL L. SCHALL Darryl L. Schall |
Director |
February 28, 2018 |
163
Signature
|
Title
|
Date
|
||
|---|---|---|---|---|
| /s/ RONALD D. SCOTT Ronald D. Scott |
Director | February 28, 2018 | ||
/s/ ERIC G. TAKAHA Eric G. Takaha |
Director |
February 28, 2018 |
||
/s/ NATHAN W. WALTON Nathan W. Walton |
Director |
February 28, 2018 |
164