Attached files
| file | filename |
|---|---|
| 8-K - 8-K - AXIALL CORP/DE/ | a12-6563_18k.htm |
Exhibit 99.1
|
|
Georgia Gulf Investor Presentation March 2012 |
|
|
This presentation contains "forward-looking statements" as defined in, and subject to the safe harbor provisions of, the federal securities laws. These forward looking statements relate to, among other things, our expectations of future results. Forward-looking statements are based on management’s assumptions regarding, among other things, general economic and industry-specific business conditions and the execution of our business strategy, and actual results may be materially different. Risks and uncertainties inherent in these assumptions include, but are not limited to, future prices and demand for our products, industry capacity levels for our products, raw materials and energy costs and availability, feedstock availability and prices, changes in governmental and environmental regulations, the adoption of new laws or regulations that may make it more difficult or expensive to operate our businesses or manufacture our products, our ability to generate sufficient cash flows from our business, future economic conditions in the specific industries to which our products are sold, global economic conditions, the effectiveness of certain previously disclosed and recently implemented changes to our internal control over financial reporting, our ability to successfully integrate and execute our business plans for acquisitions and other factors discussed in the Securities and Exchange Commission filings of Georgia Gulf Corporation from time to time, including our Annual Report on Form 10-K for the year ended December 31, 2011. This presentation also contains information regarding securities analyst consensus and other financial professionals’ estimates of certain financial items for Georgia Gulf derived from published reports of the Institutional Brokers Estimate System (“I/B/E/S”) and FactSet Research Systems (“FactSet”). These estimates are projections made by securities analysts and other financial professionals who cover Georgia Gulf. Any opinions, forecasts, estimates, projections or predictions regarding Georgia Gulf's performance made by such third parties (and, therefore, such estimates) are theirs alone and do not represent the opinions, forecasts, estimates, projections or predictions of Georgia Gulf or its management. By providing these estimates Georgia Gulf does not imply its adoption of, endorsement of or concurrence with such information, conclusions or recommendations. Georgia Gulf assumes no liability for the accuracy of such estimates and undertakes no liability to update or revise such estimates based on new information or otherwise. Non-GAAP Financial Measures For additional information about the non-GAAP financial measures included in this presentation, see Appendix A. 2 Forward Looking Statements Disclaimer |
|
|
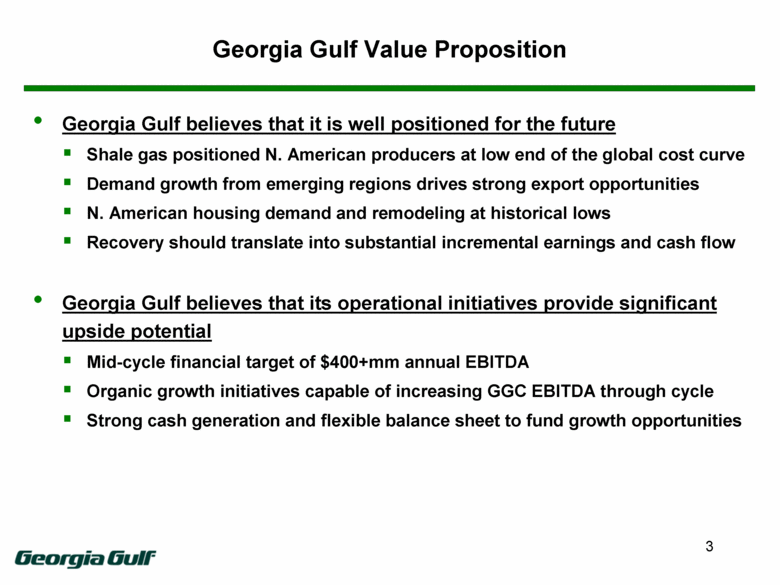
Georgia Gulf Value Proposition Georgia Gulf believes that it is well positioned for the future Shale gas positioned N. American producers at low end of the global cost curve Demand growth from emerging regions drives strong export opportunities N. American housing demand and remodeling at historical lows Recovery should translate into substantial incremental earnings and cash flow Georgia Gulf believes that its operational initiatives provide significant upside potential Mid-cycle financial target of $400+mm annual EBITDA Organic growth initiatives capable of increasing GGC EBITDA through cycle Strong cash generation and flexible balance sheet to fund growth opportunities 3 |
|
|
Georgia Gulf Overview |
|
|
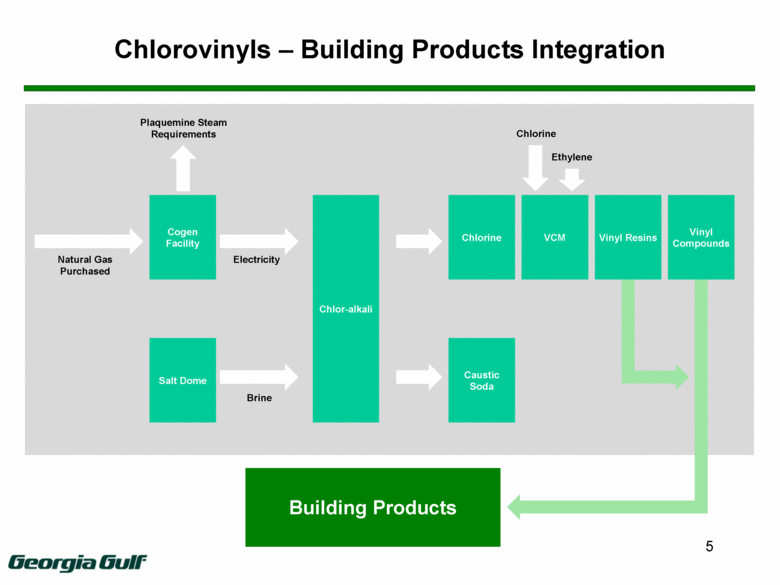
Chlorovinyls – Building Products Integration Building Products Chlor-alkali Cogen Facility Salt Dome Chlorine Caustic Soda VCM Vinyl Resins Vinyl Compounds Electricity Brine Chlorine Ethylene Plaquemine Steam Requirements Natural Gas Purchased 5 |
|
|
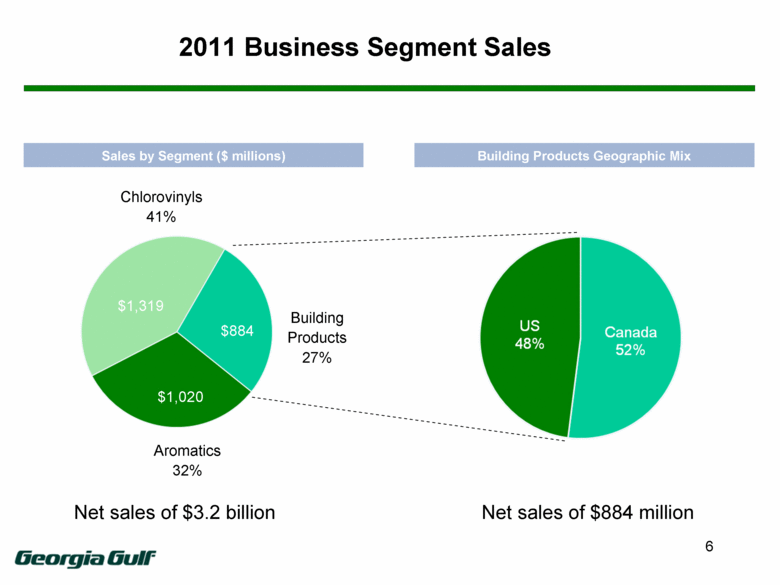
2011 Business Segment Sales $1,319 $884 $1,020 Building Products 27% Aromatics 32% Chlorovinyls 41% Net sales of $3.2 billion Net sales of $884 million Building Products Geographic Mix Sales by Segment ($ millions) 6 |
|
|
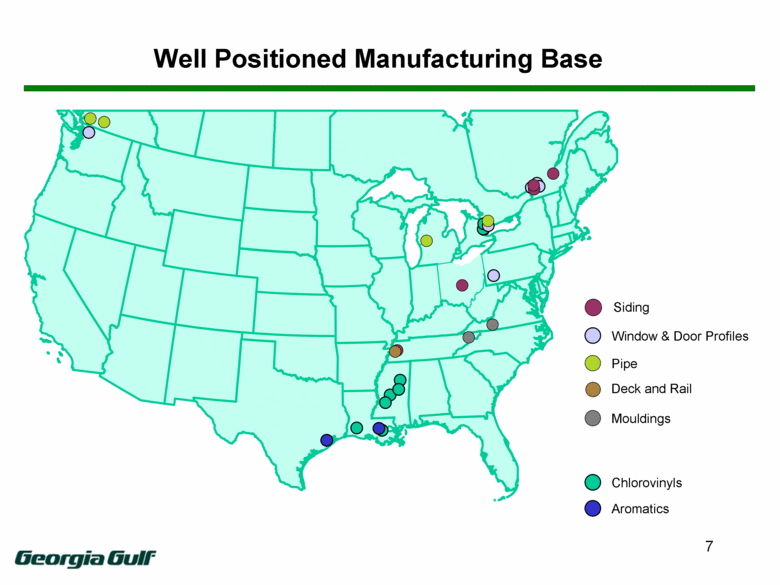
Well Positioned Manufacturing Base Window & Door Profiles Mouldings Siding Pipe Deck and Rail Chlorovinyls Aromatics 7 |
|
|
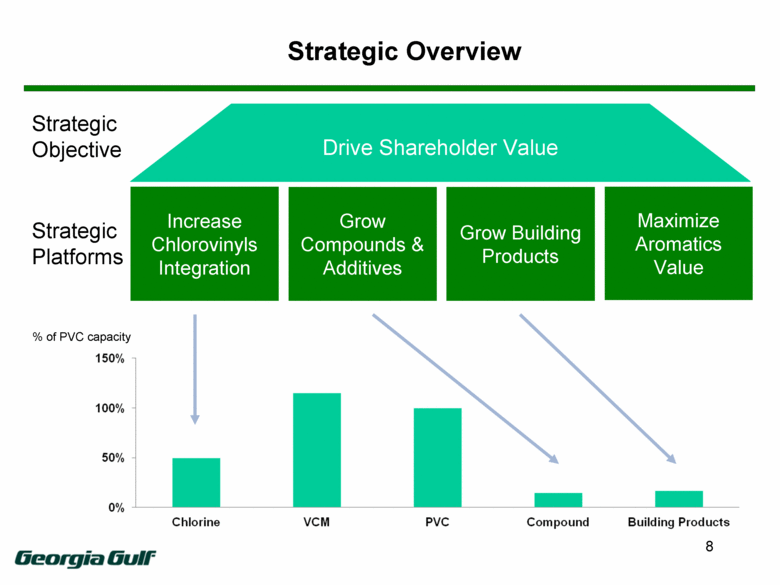
Strategic Overview Strategic Objective Strategic Platforms Grow Compounds & Additives Increase Chlorovinyls Integration Grow Building Products Maximize Aromatics Value Drive Shareholder Value % of PVC capacity 8 150% 100% 50% 0% Chlorine VCM PVC Compound Building Products |
|
|
Georgia Gulf Believes That Evolving Industry Dynamics Indicate Substantially Higher Earnings Potential |
|
|
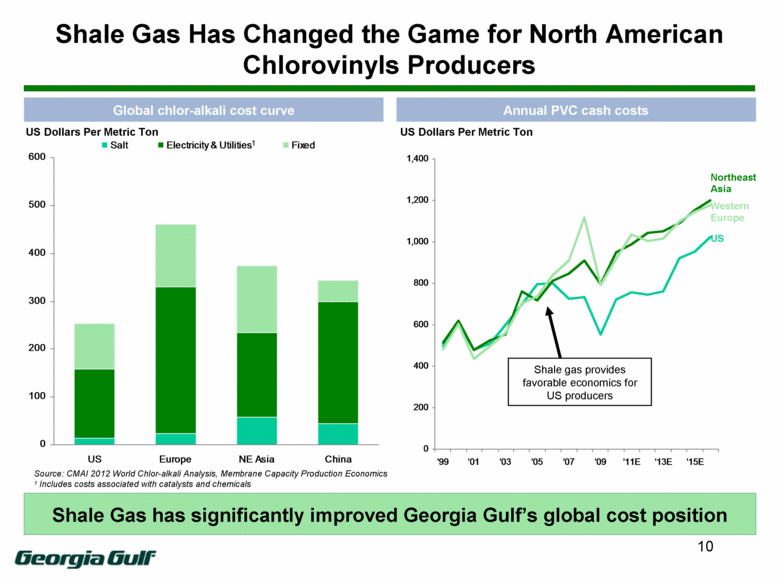
Shale Gas Has Changed the Game for North American Chlorovinyls Producers 10 Source: CMAI 2012 World Chlor-alkali Analysis, Membrane Capacity Production Economics 1 Includes costs associated with catalysts and chemicals Shale Gas has significantly improved Georgia Gulf’s global cost position Global chlor-alkali cost curve Annual PVC cash costs Shale gas provides favorable economics for US producers US Western Europe Northeast Asia US Dollars Per Metric Ton US Dollars Per Metric Ton 1 0 100 200 300 400 500 600 US Europe NE Asia China Salt Electricity & Utilities Fixed 0 200 400 600 800 1,000 1,200 1,400 '99 '01 '03 '05 '07 '09 '11E '13E '15E |
|
|
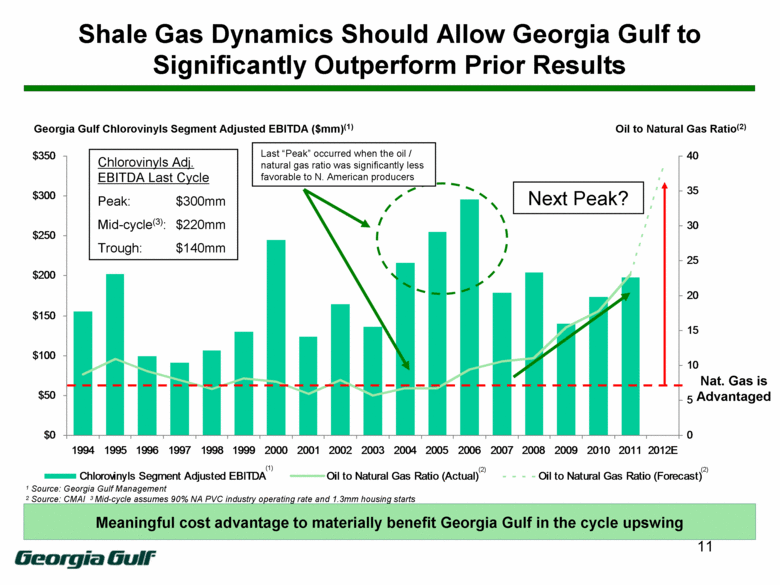
Shale Gas Dynamics Should Allow Georgia Gulf to Significantly Outperform Prior Results 11 1 Source: Georgia Gulf Management 2 Source: CMAI 3 Mid-cycle assumes 90% NA PVC industry operating rate and 1.3mm housing starts Meaningful cost advantage to materially benefit Georgia Gulf in the cycle upswing Georgia Gulf Chlorovinyls Segment Adjusted EBITDA ($mm)(1) Chlorovinyls Adj. EBITDA Last Cycle Peak: $300mm Mid-cycle(3): $220mm Trough: $140mm Oil to Natural Gas Ratio(2) Nat. Gas is Advantaged Last “Peak” occurred when the oil / natural gas ratio was significantly less favorable to N. American producers Next Peak? (1) (2) (2) $0 $50 $100 $150 $200 $250 $300 $350 1994 1995 1996 1997 1998 1999 2000 2001 2002 2003 2004 2005 2006 2007 2008 2009 2010 2011 2012E 0 5 10 15 20 25 30 35 40 Chlorovinyls Segment Adjusted EBITDA Oil to Natural Gas Ratio (Actual) Oil to Natural Gas Ratio (Forecast) |
|
|
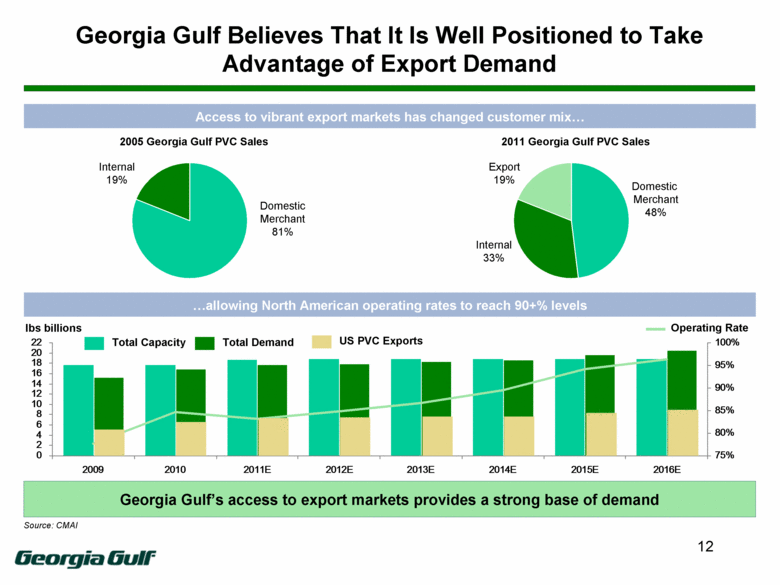
Georgia Gulf Believes That It Is Well Positioned to Take Advantage of Export Demand 12 Georgia Gulf’s access to export markets provides a strong base of demand Access to vibrant export markets has changed customer mix... 2005 Georgia Gulf PVC Sales Source: CMAI Internal 19% Domestic Merchant 81% ...allowing North American operating rates to reach 90+% levels Total Capacity Total Demand US PVC Exports Operating Rate lbs billions 2011 Georgia Gulf PVC Sales Internal 33% Domestic Merchant 48% Export 19% 0 2 4 6 8 10 12 14 16 18 20 22 2009 2010 2011E 2012E 2013E 2014E 2015E 2016E 75% 80% 85% 90% 95% 100% |
|
|
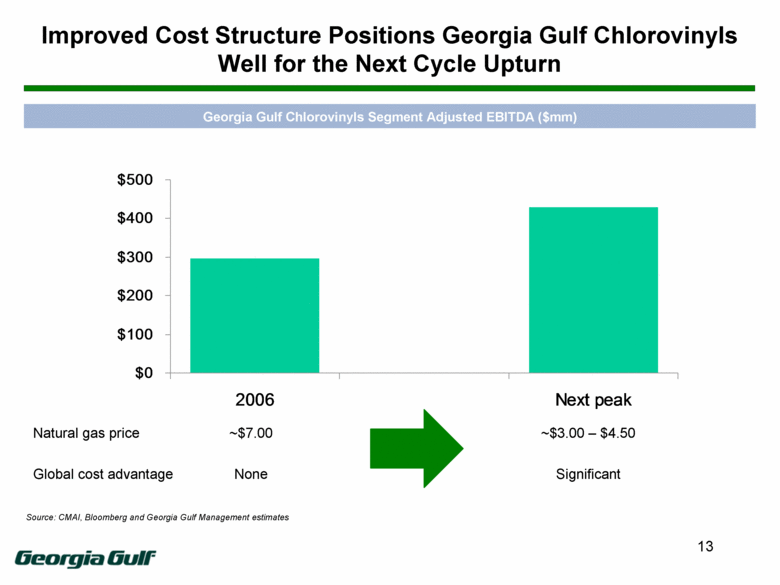
Improved Cost Structure Positions Georgia Gulf Chlorovinyls Well for the Next Cycle Upturn 13 Georgia Gulf Chlorovinyls Segment Adjusted EBITDA ($mm) Source: CMAI, Bloomberg and Georgia Gulf Management estimates Natural gas price Global cost advantage ~$7.00 ~$3.00 – $4.50 None Significant $0 $100 $200 $300 $400 $500 2006 Next peak |
|
|
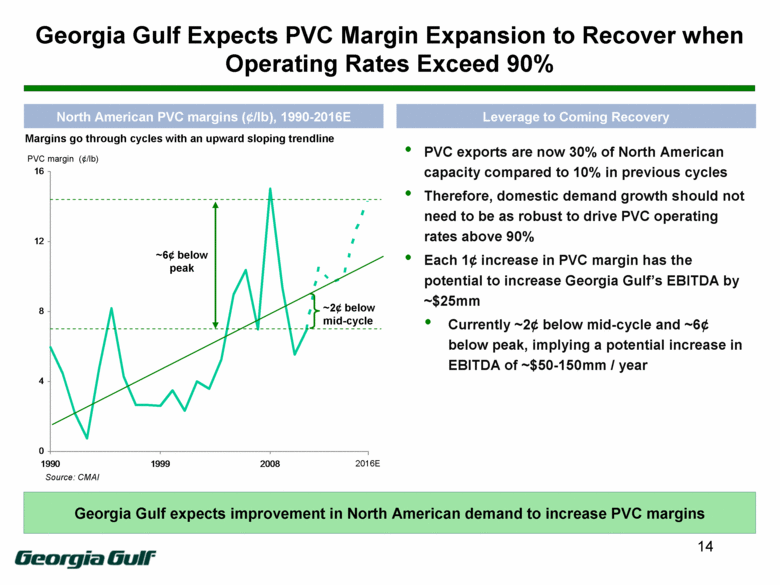
Georgia Gulf Expects PVC Margin Expansion to Recover when Operating Rates Exceed 90% 14 Source: CMAI Georgia Gulf expects improvement in North American demand to increase PVC margins North American PVC margins (¢/lb), 1990-2016E Leverage to Coming Recovery Margins go through cycles with an upward sloping trendline PVC margin (¢/lb) PVC exports are now 30% of North American capacity compared to 10% in previous cycles Therefore, domestic demand growth should not need to be as robust to drive PVC operating rates above 90% Each 1¢ increase in PVC margin has the potential to increase Georgia Gulf’s EBITDA by ~$25mm Currently ~2¢ below mid-cycle and ~6¢ below peak, implying a potential increase in EBITDA of ~$50-150mm / year ~2¢ below mid-cycle ~6¢ below peak 2016E 0 4 8 12 16 1990 1999 2008 |
|
|
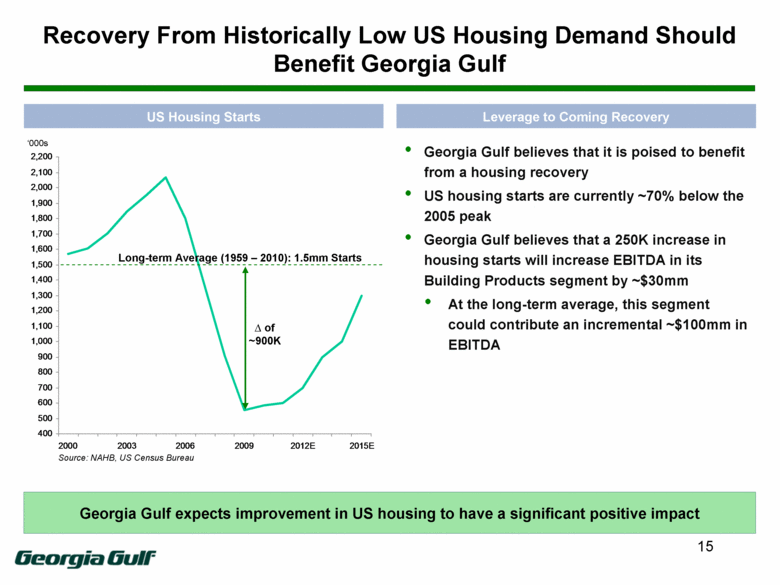
Recovery From Historically Low US Housing Demand Should Benefit Georgia Gulf 15 Source: NAHB, US Census Bureau Georgia Gulf expects improvement in US housing to have a significant positive impact US Housing Starts Leverage to Coming Recovery ‘000s Georgia Gulf believes that it is poised to benefit from a housing recovery US housing starts are currently ~70% below the 2005 peak Georgia Gulf believes that a 250K increase in housing starts will increase EBITDA in its Building Products segment by ~$30mm At the long-term average, this segment could contribute an incremental ~$100mm in EBITDA Long-term Average (1959 – 2010): 1.5mm Starts of ~900K 400 500 600 700 800 900 1,000 1,100 1,200 1,300 1,400 1,500 1,600 1,700 1,800 1,900 2,000 2,100 2,200 2000 2003 2006 2009 2012E 2015E |
|
|
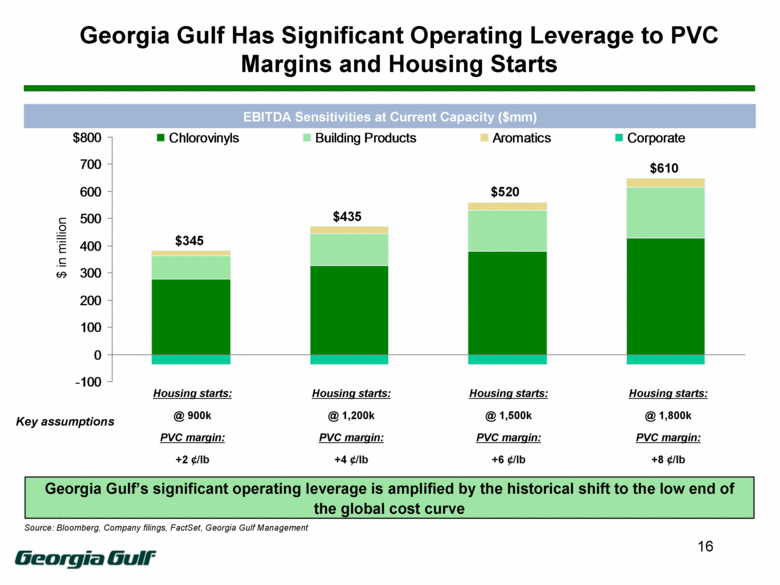
Georgia Gulf Has Significant Operating Leverage to PVC Margins and Housing Starts Georgia Gulf’s significant operating leverage is amplified by the historical shift to the low end of the global cost curve Source: Bloomberg, Company filings, FactSet, Georgia Gulf Management Housing starts: @ 900k PVC margin: +2 ¢/lb $345 $435 $520 $610 Key assumptions Housing starts: @ 1,200k PVC margin: +4 ¢/lb Housing starts: @ 1,500k PVC margin: +6 ¢/lb Housing starts: @ 1,800k PVC margin: +8 ¢/lb $ in million EBITDA Sensitivities at Current Capacity ($mm) 16 -100 0 100 200 300 400 500 600 700 $800 Chlorovinyls Building Products Aromatics Corporate |
|
|
Georgia Gulf Believes That It Is Well Positioned to Execute on Its Growth Strategy |
|
|
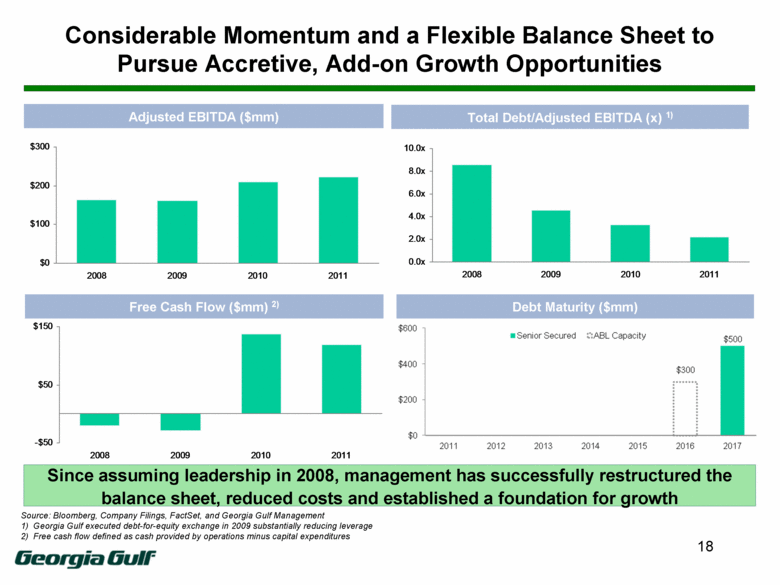
Considerable Momentum and a Flexible Balance Sheet to Pursue Accretive, Add-on Growth Opportunities 18 Source: Bloomberg, Company Filings, FactSet, and Georgia Gulf Management 1) Georgia Gulf executed debt-for-equity exchange in 2009 substantially reducing leverage 2) Free cash flow defined as cash provided by operations minus capital expenditures Since assuming leadership in 2008, management has successfully restructured the balance sheet, reduced costs and established a foundation for growth Adjusted EBITDA ($mm) Total Debt/Adjusted EBITDA (x) 1) Free Cash Flow ($mm) 2) Debt Maturity ($mm) -$50 $50 $150 2008 2009 2010 2011 0.0x 2.0x 4.0x 6.0x 8.0x 10.0x 2008 2009 2010 2011 $0 $100 $200 $300 2008 2009 2010 2011 Senior Secured ABL Capacity $600 $400 $200 $0 $300 $500 2011 2012 2013 2014 2015 2016 2017 |
|
|
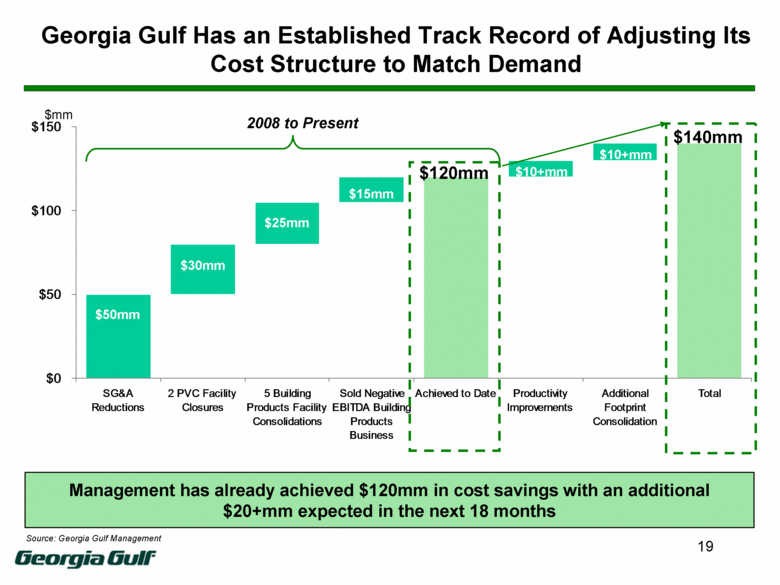
Georgia Gulf Has an Established Track Record of Adjusting Its Cost Structure to Match Demand $50mm $30mm $15mm Management has already achieved $120mm in cost savings with an additional $20+mm expected in the next 18 months $25mm $120mm $10+mm $140mm Source: Georgia Gulf Management 2008 to Present $10+mm $mm 19 $0 $50 $100 $150 SG&A Reductions 2 PVC Facility Closures 5 Building Products Facility Consolidations Sold Negative EBITDA Building Products Business Achieved to Date Productivity Improvements Additional Footprint Consolidation Total |
|
|
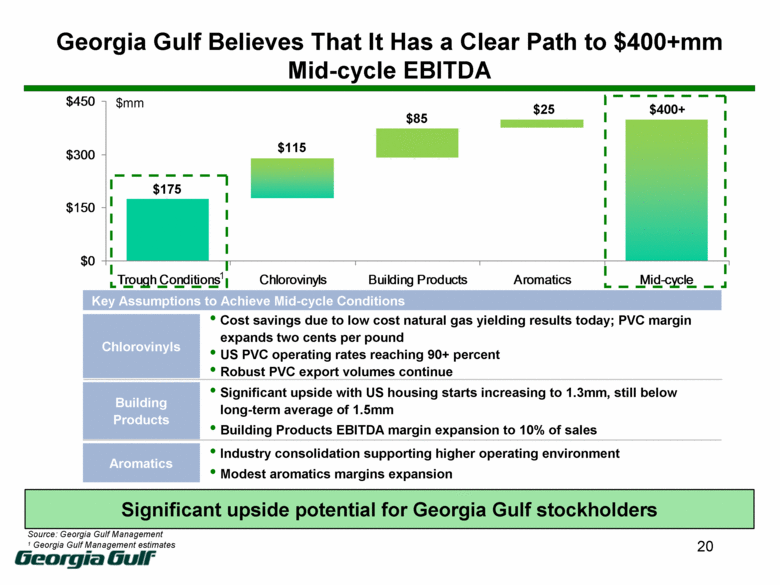
Georgia Gulf Believes That It Has a Clear Path to $400+mm Mid-cycle EBITDA Cost savings due to low cost natural gas yielding results today; PVC margin expands two cents per pound US PVC operating rates reaching 90+ percent Robust PVC export volumes continue $175 Chlorovinyls Building Products Significant upside with US housing starts increasing to 1.3mm, still below long-term average of 1.5mm Building Products EBITDA margin expansion to 10% of sales Key Assumptions to Achieve Mid-cycle Conditions Source: Georgia Gulf Management 1 Georgia Gulf Management estimates Aromatics Industry consolidation supporting higher operating environment Modest aromatics margins expansion $115 $85 $25 Significant upside potential for Georgia Gulf stockholders $400+ 20 1 $mm $0 $150 $300 $450 Trough Conditions Chlorovinyls Building Products Aromatics Mid-cycle |
|
|
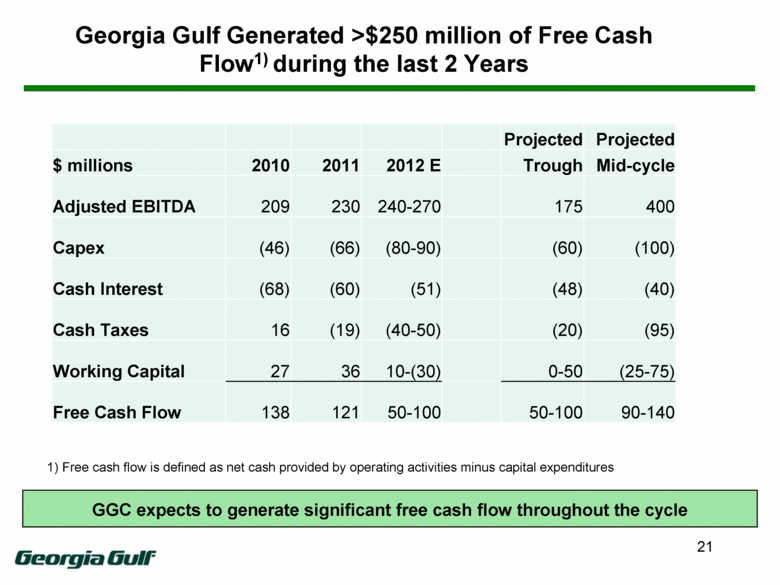
Georgia Gulf Generated >$250 million of Free Cash Flow1) during the last 2 Years 21 Projected Projected $ millions 2010 2011 2012 E Trough Mid-cycle Adjusted EBITDA 209 230 240-270 175 400 Capex (46) (66) (80-90) (60) (100) Cash Interest (68) (60) (51) (48) (40) Cash Taxes 16 (19) (40-50) (20) (95) Working Capital 27 36 10-(30) 0-50 (25-75) Free Cash Flow 138 121 50-100 50-100 90-140 GGC expects to generate significant free cash flow throughout the cycle 1) Free cash flow is defined as net cash provided by operating activities minus capital expenditures |
|
|
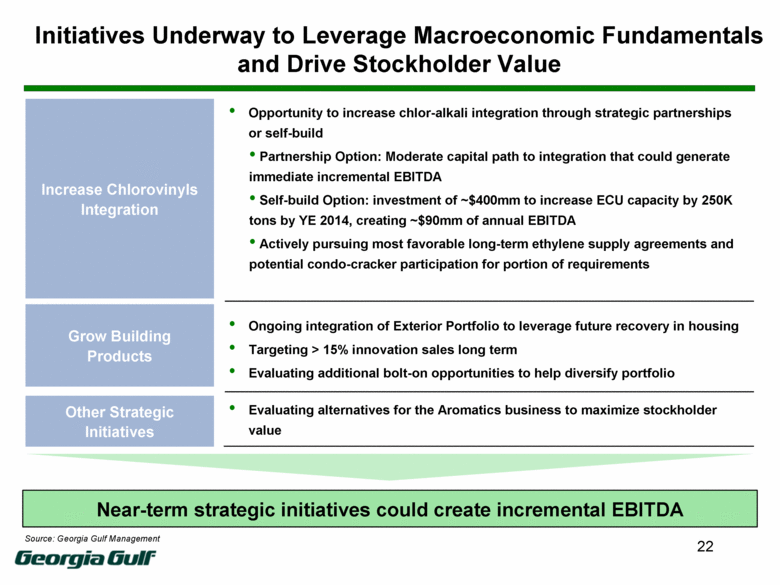
Initiatives Underway to Leverage Macroeconomic Fundamentals and Drive Stockholder Value Increase Chlorovinyls Integration Grow Building Products Other Strategic Initiatives Opportunity to increase chlor-alkali integration through strategic partnerships or self-build Partnership Option: Moderate capital path to integration that could generate immediate incremental EBITDA Self-build Option: investment of ~$400mm to increase ECU capacity by 250K tons by YE 2014, creating ~$90mm of annual EBITDA Actively pursuing most favorable long-term ethylene supply agreements and potential condo-cracker participation for portion of requirements Ongoing integration of Exterior Portfolio to leverage future recovery in housing Targeting > 15% innovation sales long term Evaluating additional bolt-on opportunities to help diversify portfolio Evaluating alternatives for the Aromatics business to maximize stockholder value Near-term strategic initiatives could create incremental EBITDA Source: Georgia Gulf Management 22 |
|
|
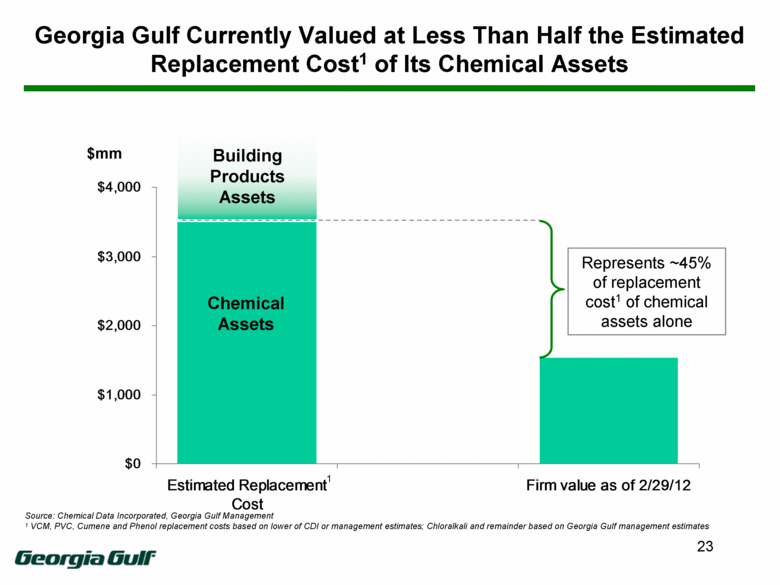
Georgia Gulf Currently Valued at Less Than Half the Estimated Replacement Cost1 of Its Chemical Assets Building Products Assets Source: Chemical Data Incorporated, Georgia Gulf Management 1 VCM, PVC, Cumene and Phenol replacement costs based on lower of CDI or management estimates; Chloralkali and remainder based on Georgia Gulf management estimates Represents ~45% of replacement cost1 of chemical assets alone 23 1 Chemical Assets $mm $0 $1,000 $2,000 $3,000 $4,000 Estimated Replacement Cost Firm value as of 2/29/12 |
|
|
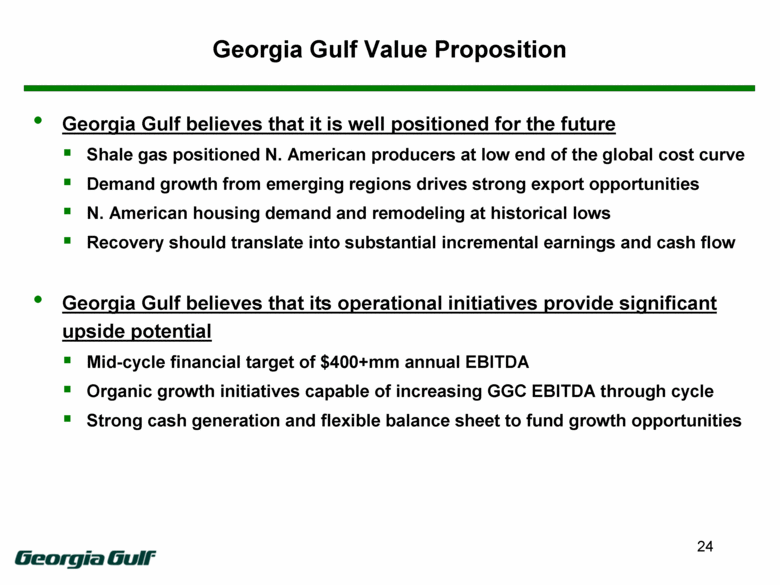
Georgia Gulf Value Proposition Georgia Gulf believes that it is well positioned for the future Shale gas positioned N. American producers at low end of the global cost curve Demand growth from emerging regions drives strong export opportunities N. American housing demand and remodeling at historical lows Recovery should translate into substantial incremental earnings and cash flow Georgia Gulf believes that its operational initiatives provide significant upside potential Mid-cycle financial target of $400+mm annual EBITDA Organic growth initiatives capable of increasing GGC EBITDA through cycle Strong cash generation and flexible balance sheet to fund growth opportunities 24 |
|
|
Appendix 25 |
|
|
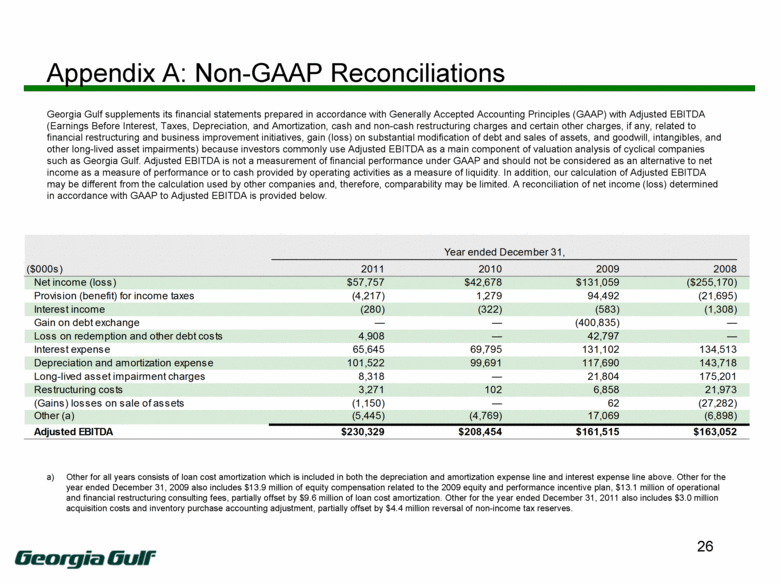
Appendix A: Non-GAAP Reconciliations 26 Georgia Gulf supplements its financial statements prepared in accordance with Generally Accepted Accounting Principles (GAAP) with Adjusted EBITDA (Earnings Before Interest, Taxes, Depreciation, and Amortization, cash and non-cash restructuring charges and certain other charges, if any, related to financial restructuring and business improvement initiatives, gain (loss) on substantial modification of debt and sales of assets, and goodwill, intangibles, and other long-lived asset impairments) because investors commonly use Adjusted EBITDA as a main component of valuation analysis of cyclical companies such as Georgia Gulf. Adjusted EBITDA is not a measurement of financial performance under GAAP and should not be considered as an alternative to net income as a measure of performance or to cash provided by operating activities as a measure of liquidity. In addition, our calculation of Adjusted EBITDA may be different from the calculation used by other companies and, therefore, comparability may be limited. A reconciliation of net income (loss) determined in accordance with GAAP to Adjusted EBITDA is provided below. Other for all years consists of loan cost amortization which is included in both the depreciation and amortization expense line and interest expense line above. Other for the year ended December 31, 2009 also includes $13.9 million of equity compensation related to the 2009 equity and performance incentive plan, $13.1 million of operational and financial restructuring consulting fees, partially offset by $9.6 million of loan cost amortization. Other for the year ended December 31, 2011 also includes $3.0 million acquisition costs and inventory purchase accounting adjustment, partially offset by $4.4 million reversal of non-income tax reserves. ($000s) 2011 2010 2009 2008 Net income (loss) $57,757 $42,678 $131,059 ($255,170) Provision (benefit) for income taxes (4,217) 1,279 94,492 (21,695) Interest income (280) (322) (583) (1,308) Gain on debt exchange — — (400,835) — Loss on redemption and other debt costs 4,908 — 42,797 — Interest expense 65,645 69,795 131,102 134,513 Depreciation and amortization expense 101,522 99,691 117,690 143,718 Long-lived asset impairment charges 8,318 — 21,804 175,201 Restructuring costs 3,271 102 6,858 21,973 (Gains) losses on sale of assets (1,150) — 62 (27,282) Other (a) (5,445) (4,769) 17,069 (6,898) Adjusted EBITDA $230,329 $208,454 $161,515 $163,052 Year ended December 31, |
|
|
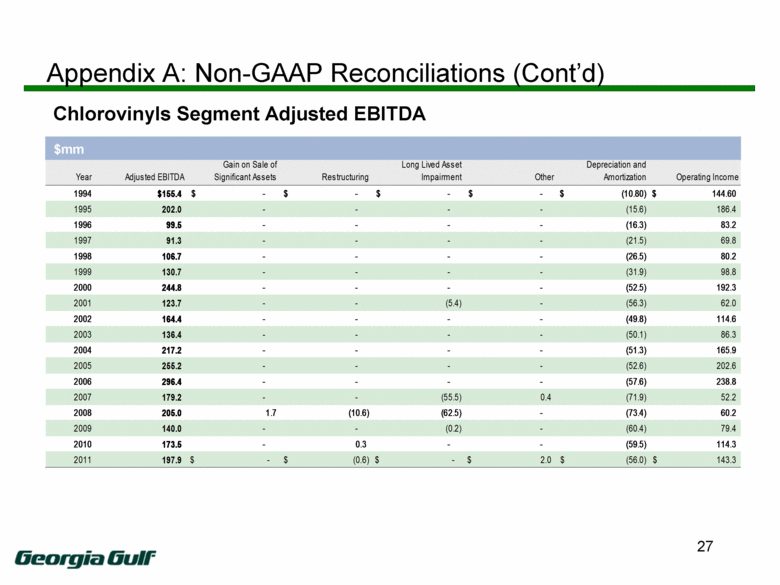
Appendix A: Non-GAAP Reconciliations (Cont’d) 27 Chlorovinyls Segment Adjusted EBITDA $mm Year Adjusted EBITDA Gain on Sale of Significant Assets Restructuring Long Lived Asset Impairment Other Depreciation and Amortization Operating Income 1994 $155.4 - $ - $ - $ - $ (10.80) $ 144.60 $ 1995 202.0 - - - - (15.6) 186.4 1996 99.5 - - - - (16.3) 83.2 1997 91.3 - - - - (21.5) 69.8 1998 106.7 - - - - (26.5) 80.2 1999 130.7 - - - - (31.9) 98.8 2000 244.8 - - - - (52.5) 192.3 2001 123.7 - - (5.4) - (56.3) 62.0 2002 164.4 - - - - (49.8) 114.6 2003 136.4 - - - - (50.1) 86.3 2004 217.2 - - - - (51.3) 165.9 2005 255.2 - - - - (52.6) 202.6 2006 296.4 - - - - (57.6) 238.8 2007 179.2 - - (55.5) 0.4 (71.9) 52.2 2008 205.0 1.7 (10.6) (62.5) - (73.4) 60.2 2009 140.0 - - (0.2) - (60.4) 79.4 2010 173.5 - 0.3 - - (59.5) 114.3 2011 197.9 - $ (0.6) $ - $ 2.0 $ (56.0) $ 143.3 $ |
|
|
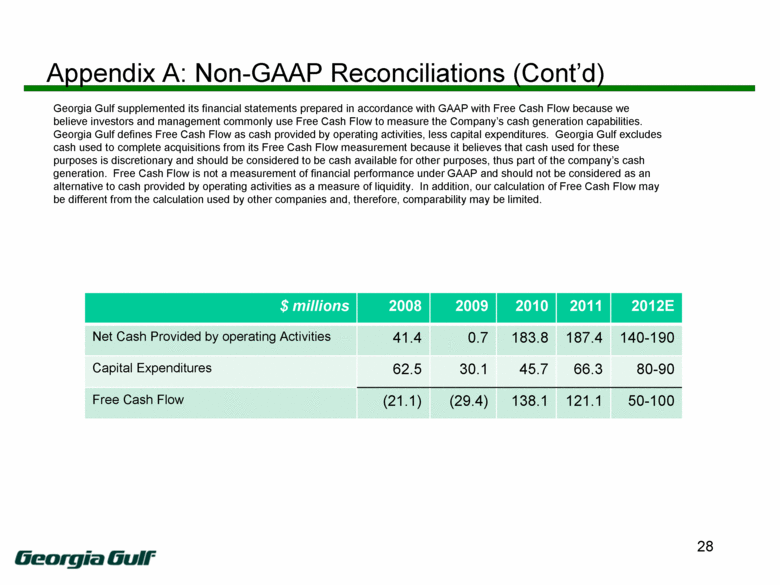
Appendix A: Non-GAAP Reconciliations (Cont’d) 28 Georgia Gulf supplemented its financial statements prepared in accordance with GAAP with Free Cash Flow because we believe investors and management commonly use Free Cash Flow to measure the Company’s cash generation capabilities. Georgia Gulf defines Free Cash Flow as cash provided by operating activities, less capital expenditures. Georgia Gulf excludes cash used to complete acquisitions from its Free Cash Flow measurement because it believes that cash used for these purposes is discretionary and should be considered to be cash available for other purposes, thus part of the company’s cash generation. Free Cash Flow is not a measurement of financial performance under GAAP and should not be considered as an alternative to cash provided by operating activities as a measure of liquidity. In addition, our calculation of Free Cash Flow may be different from the calculation used by other companies and, therefore, comparability may be limited. $ millions 2008 2009 2010 2011 2012E Net Cash Provided by operating Activities 41.4 0.7 183.8 187.4 140-190 Capital Expenditures 62.5 30.1 45.7 66.3 80-90 Free Cash Flow (21.1) (29.4) 138.1 121.1 50-100 |

