Attached files
| file | filename |
|---|---|
| EX-10.36 - EXHIBIT 10.36 - East Dubuque Nitrogen Partners, L.P. | d268582dex1036.htm |
| EX-23.1 - EXHIBIT 23.1 - East Dubuque Nitrogen Partners, L.P. | d268582dex231.htm |
| EX-21.1 - EXHIBIT 21.1 - East Dubuque Nitrogen Partners, L.P. | d268582dex211.htm |
| EX-32.2 - EXHIBIT 32.2 - East Dubuque Nitrogen Partners, L.P. | d268582dex322.htm |
| EX-31.1 - EXHIBIT 31.1 - East Dubuque Nitrogen Partners, L.P. | d268582dex311.htm |
| EX-32.1 - EXHIBIT 32.1 - East Dubuque Nitrogen Partners, L.P. | d268582dex321.htm |
| EX-31.2 - EXHIBIT 31.2 - East Dubuque Nitrogen Partners, L.P. | d268582dex312.htm |
Table of Contents
UNITED STATES
SECURITIES AND EXCHANGE COMMISSION
Washington, D.C. 20549
Form 10-K
(Mark One)
| x | ANNUAL REPORT PURSUANT TO SECTION 13 OR 15(d) OF THE SECURITIES EXCHANGE ACT OF 1934 |
For the Fiscal Year Ended September 30, 2011
OR
| ¨ | TRANSITION REPORT PURSUANT TO SECTION 13 OR 15(d) OF THE SECURITIES EXCHANGE ACT OF 1934 |
For the Transition Period from to
Commission File No. 001-35334
RENTECH NITROGEN PARTNERS, L.P.
(Exact name of registrant as specified in its charter)
| Delaware | 45-2714747 | |
| (State or other jurisdiction of incorporation or organization) |
(I.R.S. Employer Identification No.) | |
| 10877 Wilshire Boulevard, Suite 600 Los Angeles, California |
90024 | |
| (Address of principal executive offices) | (Zip Code) | |
Registrant’s telephone number, including area code: (310) 571-9800
Securities registered pursuant to Section 12(b) of the Act:
| Title of Each Class |
Name of Each Exchange on Which Registered | |
| Common Units Representing Limited Partner Interests | New York Stock Exchange |
Securities registered pursuant to Section 12(g) of the Act: None
Indicate by check mark if the registrant is a well-known seasoned issuer, as defined in Rule 405 of the Securities Act. Yes ¨. No x.
Indicate by check mark if the registrant is not required to file reports pursuant to Section 13 or Section 15(d) of the Act. Yes ¨. No x.
Indicate by check mark whether the registrant (1) has filed all reports required to be filed by Section 13 or 15(d) of the Securities Exchange Act of 1934 during the preceding 12 months (or for such shorter period that the registrant was required to file such reports), and (2) has been subject to such filing requirements for the past 90 days. Yes ¨ No x
Indicate by check mark whether the registrant has submitted electronically and posted on its corporate Web site, if any, every Interactive Data File required to be submitted and posted pursuant to Rule 405 of Regulation S-T (§232.405 of this chapter) during the preceding 12 months (or for such shorter period that the registrant was required to submit and post such files). Yes ¨ No ¨
Indicate by check mark if disclosure of delinquent filers pursuant to Item 405 of Regulation S-K (§229.405 of this chapter) is not contained herein, and will not be contained, to the best of registrant’s knowledge, in definitive proxy or information statements incorporated by reference in Part III of this Form 10-K or any amendment to this Form 10-K. x
Indicate by check mark whether the registrant is a large accelerated filer, an accelerated filer, a non-accelerated filer, or a smaller reporting company. See the definitions of “large accelerated filer,” “accelerated filer” and “smaller reporting company” in Rule 12b-2 of the Exchange Act. (Check one):
| Large accelerated filer ¨ | Accelerated filer ¨ | Non-accelerated filer x | Smaller reporting company ¨ | |||
| (Do not check if a smaller reporting company) |
Indicate by check mark whether the registrant is a shell company (as defined in Rule 12b-2 of the Exchange Act). Yes ¨ No x
As of March 31, 2011, the last business day of the registrant’s most recently completed second fiscal quarter, the registrant’s common units were not publicly traded. The registrant’s common units began trading on the New York Stock Exchange on November 4, 2011.
As of December 14, 2011, the registrant had 38,250,000 common units outstanding.
DOCUMENTS INCORPORATED BY REFERENCE: None
Table of Contents
2
Table of Contents
FORWARD-LOOKING STATEMENTS
Certain statements and information included in this Annual Report on Form 10-K, or this report, and other reports or materials that we have filed or will file with the Securities and Exchange Commission, or the SEC, (as well as information included in oral statements or other written statements made or to be made by us or our management), contain or may contain “forward-looking statements.” Statements that are predictive in nature, that depend upon or refer to future events or conditions or that include the words “will,” “believe,” “expect,” “anticipate,” “intend,” “estimate” and other expressions that are predictions of or indicate future events and trends and that do not relate to historical matters identify forward-looking statements. Our forward-looking statements include statements about our business strategy, our industry, our future profitability, our expected capital expenditures (including for maintenance or expansion projects and environmental expenditures) and the impact of such expenditures on our performance, and our operating costs. These statements involve known and unknown risks, uncertainties and other factors, that may cause our actual results and performance to be materially different from any future results or performance expressed or implied by these forward-looking statements. Factors that could affect our results include the risk factors detailed in Part I—Item 1A “Risk Factors” and from time to time in our periodic reports and registration statements filed with the SEC. You should not place undue reliance on our forward-looking statements. Although forward-looking statements reflect our good faith beliefs, forward-looking statements involve known and unknown risks, uncertainties and other factors, which may cause our actual results, performance or achievements to differ materially from anticipated future results, performance or achievements expressed or implied by such forward-looking statements. We undertake no obligation to publicly update or revise any forward-looking statement, whether as a result of new information, future events, changed circumstances or otherwise, unless required by law.
References in this report to “the Partnership,” “we,” “our,” “us” and like terms refer to Rentech Nitrogen Partners, L.P. and our subsidiary, unless the context otherwise requires or where otherwise indicated. References in this report to “Rentech” refer to Rentech, Inc. and its consolidated subsidiaries other than us, unless the context otherwise requires or where otherwise indicated. References to “RDC” refer to Rentech Development Corporation, which is a wholly owned subsidiary of Rentech, references to “RNHI” refer to Rentech Nitrogen Holdings, Inc., which is a wholly owned subsidiary of RDC, and references to “Rentech Nitrogen GP” and “our general partner” refer to Rentech Nitrogen GP, LLC, which is our general partner and a wholly owned subsidiary of RNHI. References to “our operating company” refer to Rentech Nitrogen, LLC, which was formerly known as Rentech Energy Midwest Corporation, or REMC. References to any of our fiscal years mean the fiscal year ending September 30 of that calendar year.
3
Table of Contents
Overview
We are a Delaware limited partnership formed in July 2011 by Rentech, a publicly traded provider of clean energy solutions and nitrogen fertilizer, to own, operate and grow our nitrogen fertilizer business. Our nitrogen fertilizer facility, which is located in East Dubuque, Illinois, has been in operation since 1965, with infrequent unplanned shutdowns. We produce primarily anhydrous ammonia, or ammonia, and urea ammonium nitrate solution, or UAN, at our facility, using natural gas as our primary feedstock. Substantially all of our products are nitrogen-based.
Our facility is located in the center of the Mid Corn Belt, the largest market in the United States for direct application of nitrogen fertilizer products. The Mid Corn Belt includes the States of Illinois, Indiana, Iowa, Missouri, Nebraska and Ohio. We consider our market to be comprised of the States of Illinois, Iowa and Wisconsin.
Our core market consists of the area located within an estimated 200-mile radius of our facility. In most instances, our customers purchase our nitrogen products at our facility and then arrange and pay to transport them to their final destinations by truck. To the extent our products are picked up at our facility, we do not incur shipping costs, in contrast to nitrogen fertilizer producers located outside of our core market that must incur transportation and storage costs to transport their products to, and sell their products in, our core market. In addition, we do not maintain a fleet of trucks and, unlike some of our major competitors, we do not maintain a fleet of rail cars because our customers generally are located close to our facility and prefer to be responsible for transportation. Having no need to maintain a fleet of trucks or rail cars lowers our fixed costs. The combination of our proximity to our customers and our storage capacity at our facility also allows for better timing of the pick-up and application of our products, as nitrogen fertilizer product shipments from more distant locations have a greater risk of missing the short periods of favorable weather conditions during which the application of nitrogen fertilizer may occur.
Our facility can produce up to 830 tons of ammonia per day, with the capacity to upgrade up to 450 tons of ammonia to produce up to 1,100 tons of UAN per day. During the fiscal years ended September 30, 2011 and 2010, we produced approximately 273,000 tons and 267,000 tons, respectively, of ammonia, and approximately 312,000 tons and 287,000 tons, respectively, of UAN. For the fiscal years ended September 30, 2011 and 2010, ammonia and UAN combined accounted for approximately 91% and 89%, respectively, of our total gross profit. Our facility has the flexibility to vary our product mix significantly, which permits us to upgrade our ammonia production into varying amounts of UAN, nitric acid and liquid and granular urea each season, depending on market demand, pricing and storage availability.
Our Initial Public Offering
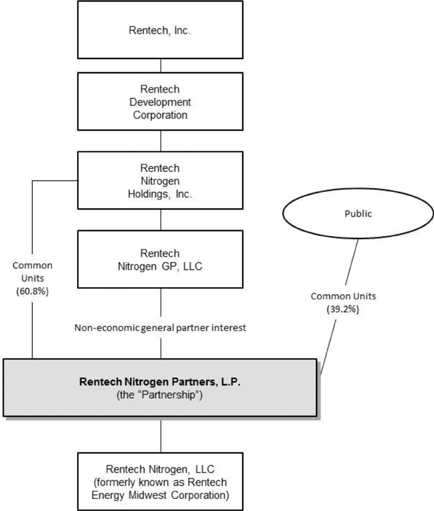
On November 9, 2011, we completed our initial public offering of 15,000,000 common units representing limited partner interests at a public offering price of $20.00 per common unit. The public currently owns 39.2% of our outstanding common units and RNHI owns the remaining 60.8% of our common units. Rentech Nitrogen GP owns 100% of the non-economic general partner interest in us. At the closing of our initial public offering, RNHI contributed its member interests in REMC to us, and REMC converted into a limited liability company named Rentech Nitrogen, LLC, organized under the laws of the State of Delaware.
4
Table of Contents
Organizational Structure
The following diagram depicts our organizational structure as of November 30, 2011 (all percentage ownership interests are 100% unless otherwise noted):
Business
Our Facility
Our facility is located on approximately 210 acres in the northwest corner of Illinois on a 140-foot bluff above Mile Marker 573 on the Upper Mississippi River. Our facility produces ammonia, UAN, liquid and granular urea, nitric acid and food-grade carbon dioxide, or CO2, using natural gas as our primary feedstock. Our facility operates continuously, except for planned shutdowns for maintenance and efficiency improvements and unplanned shutdowns, which are infrequent. Our facility can optimize its product mix according to changes in demand and pricing for its various products. Some of these products, such as UAN, are final products sold to customers, and others, including ammonia, are both final products and feedstocks for other final products, such as nitric acid, liquid urea, granular urea and CO2.
The following table sets forth our facility’s current rated production capacity for the listed products in tons per day and tons per year, and our product storage capacity.
5
Table of Contents
| Product |
Production Capacity |
Product Storage Capacity | ||||
| Tons /Day | Tons /Year | |||||
| Ammonia |
830 | 302,950 | 40,000 tons (2 tanks); 15,000 tons(1) | |||
| UAN |
1,100 | 401,500 | 80,000 tons (2 tanks) | |||
| Urea (liquid / granular) |
400 140 | 146,000 / 51,100 | 12,000 granular ton warehouse | |||
| Nitric acid |
380 | 138,700 | Limited capacity is not a factor | |||
|
CO2(2) |
650 | 237,250 | 1,900 tons | |||
| (1) | Represents 15,000 tons of space at the terminal of Agrium U.S.A., Inc., or Agrium, in Niota, Illinois where we have the right to store ammonia pursuant to our distribution agreement with Agrium. Our right to store ammonia at this terminal expires on June 30, 2016, but automatically renews for successive one year periods, unless we deliver a termination notice to Agrium with respect to such storage rights at least three months prior to an automatic renewal. Notwithstanding the foregoing, our right to use the storage space immediately terminates if the distribution agreement terminates in accordance with its terms. See “—Marketing and Distribution.” |
| (2) | We would expect to reduce our facility’s CO2 production capacity to 350 tons per day and 127,750 tons per year by May 2012 if we complete our ammonia capacity expansion project. See “—Expansion Projects.” |
The following table sets forth the amount of products produced by, and shipped from, our facility for the fiscal years ended September 30, 2011, 2010 and 2009:
| Fiscal Year Ended September 30, |
||||||||||||
| 2011 | 2010 | 2009 | ||||||||||
| (in thousands of tons) | ||||||||||||
| Products Produced |
||||||||||||
| Ammonia |
273 | 267 | 267 | |||||||||
| UAN |
312 | 287 | 274 | |||||||||
| Urea (liquid / granular) |
155 | 145 | 162 | |||||||||
| Nitric acid |
126 | 111 | 104 | |||||||||
|
CO2 |
109 | 107 | 95 | |||||||||
| Products Shipped |
||||||||||||
| Ammonia |
125 | 153 | 126 | |||||||||
| UAN |
315 | 294 | 267 | |||||||||
| Urea (liquid / granular) |
29 | 32 | 36 | |||||||||
| Nitric acid |
15 | 11 | 9 | |||||||||
|
CO2 |
110 | 107 | 95 | |||||||||
Expansion Projects
Since commencing operations in 1965, our facility has undergone various expansion projects that have increased production and product upgrade capabilities. The expansion project we completed in 1998 entailed the construction of a second nitric acid plant at our facility. This project added approximately 150 tons per day of nitric acid capacity to our facility, which, in turn, increased our facility’s UAN capacity from approximately 660 tons per day to approximately 1,100 tons per day.
We are pursuing some, and we intend to continue to evaluate additional, opportunities to increase our profitability by expanding our production capabilities and product offerings, including with the following expansion projects:
| • | Urea Expansion and Diesel Exhaust Fluid Build-Out. We have commenced a project to increase our urea production capacity by approximately 13%, or 50 tons per day. The additional urea could be marketed as liquid urea or upgraded into UAN, both of which sell at a premium to ammonia per nutrient ton. As a part of this project, we have commenced the installation of mixing, storage and load-out equipment that would enable us to produce and sell diesel exhaust fluid, or DEF, from the urea produced at our facility. DEF is a urea-based chemical reactant that is intended to reduce nitrogen oxide emissions in the exhaust systems of certain diesel engines of trucks and off-road farm and construction equipment. As an industrial product, DEF would diversify our product mix and our potential customer base. We believe that there is an expanding market for DEF, with the potential for long-term off-take contracts on favorable terms. We intend to arrange for a third party to sell and distribute our DEF products to customers. We expect the urea expansion and DEF build-out project to cost approximately $5.8 million to complete. We believe the expansion project could be completed by the end of calendar year 2012. We intend to use a portion of the net proceeds from our initial public offering to fund this expansion project. |
6
Table of Contents
| • | Ammonia Capacity Expansion. We have commenced construction of a project that is designed to increase ammonia production at our facility by approximately 70,000 tons annually, for sale or upgrade to additional products, and to increase our ammonia storage capacity by approximately 20,000 tons. We have completed a feasibility study and Front End Engineering and Design, or FEED, obtained the construction permit and commenced construction of certain long lead-time items in order to put the project on a schedule that fits with planned downtime for our 2013 turnaround. Based on the engineering work completed to date including FEED, our preliminary estimate is that this project could be completed in 24 to 30 months without adding significant downtime to that already planned for the 2013 turnaround, and we expect that this project could cost approximately $100 million to complete. We will require additional debt and/or equity financing to complete this project. We currently intend to finance substantially all of the cost of this project with debt financing that we are seeking to obtain. However, there is no guarantee that we will be able to obtain debt financing on acceptable terms or at all. Rentech may provide the initial debt financing for this project in order to enable us to keep the project on schedule as we seek additional debt financing to complete the project. |
Products
Our product sales are heavily weighted toward sales of ammonia and UAN, which together made up 80% or more of our total revenues for the three fiscal years ended September 30, 2011, 2010 and 2009. A majority of our products are sold through our distribution agreement with Agrium as described below under “—Marketing and Distribution,” with the exception of CO2, which we sell directly to customers in the food and beverage market at negotiated contract prices. Although ammonia and UAN may be used interchangeably in some cases, each has its own characteristics, and customer product preferences vary according to the crop planted, soil and weather conditions, regional farming practices, relative prices and the cost and availability of appropriate storage, transportation, handling and application equipment, each of which vary among these two products. During each of the fiscal years ended September 30, 2011, 2010 and 2009, we sold more than 90% of our nitrogen products to customers for agricultural uses, with the remaining portion being sold to customers for industrial uses.
Ammonia. We produce ammonia, the simplest form of nitrogen fertilizer and the feedstock for the production of other nitrogen fertilizers. Our ammonia processing unit has a current rated capacity of 830 tons per day. Our ammonia product storage consists of two 20,000 ton tanks at our facility and 15,000 tons of leased storage in Niota, Illinois. Ammonia is used in the production of all other products produced by our facility, except CO2.
UAN. UAN is a liquid fertilizer that has a slight ammonia odor, and, unlike ammonia, it does not need to be refrigerated or pressurized when transported or stored. Our facility has two UAN storage tanks with a combined capacity of 80,000 tons.
Urea. Our urea solution is sold in its liquid state, processed into granular urea through our urea granulation plant to create dry granular urea (46% nitrogen concentration) or upgraded into UAN. We assess market demand for each of these three end products and allocate our produced urea solution as appropriate. We sell liquid urea primarily to industrial customers in the power, ethanol and diesel emissions markets. Although we believe there is high demand for our granular urea in agricultural markets, we sell granular urea primarily to customers in specialty urea markets where the spherical and consistent size of the granules resulting from our “curtain granulation” technology generally command a premium price. Our facility has a 12,000 ton capacity bulk warehouse that may be used for dry bulk granular urea storage.
Nitric Acid. We produce nitric acid through two separate nitric acid plants at our facility. Nitric acid is either sold to third parties or used within our facility for the production of ammonium nitrate solution, as an intermediate from which UAN is produced. We believe that our facility currently has sufficient storage capacity available for efficient product loading.
Carbon Dioxide. CO2 is a gaseous product that is co-manufactured with ammonia, with approximately 1.1 tons of CO2 produced per ton of ammonia produced. Our facility utilizes CO2 in its urea production and has developed a market for CO2 through conversion to a purified food grade liquid CO2. Our facility has storage capacity for approximately 1,900 tons of CO2. We have multiple CO2 sales agreements that allow for regular shipment of CO2 throughout the year, and our current storage capacity is sufficient to support our CO2 delivery commitments.
7
Table of Contents
Marketing and Distribution
In 2006, we entered into a distribution agreement with Agrium under which a majority of our products, including ammonia and UAN, are sold. Pursuant to the distribution agreement, Agrium is obligated to use its commercially reasonable efforts to promote the sale of, and to solicit and secure orders from its customers for, nitrogen fertilizer products comprising ammonia, liquid and granular urea, UAN, nitric acid and other nitrogen-based products manufactured at our facility. Under the distribution agreement, Agrium bears the credit risk on products sold through Agrium pursuant to the agreement. The distribution agreement has a term that ends in April 2016, but automatically renews for subsequent one-year periods (unless either party delivers a termination notice to the other party at least three months prior to an automatic renewal).
During the three fiscal years ended September 30, 2011, 2010 and 2009, we sold 80% or more of the nitrogen fertilizer products produced at our facility through Agrium pursuant to the distribution agreement, and sold the remaining amounts directly to customers. Our management pre-approves price, quantity and other terms for each sale through Agrium, and we pay Agrium only a commission for its services. Our rights under the distribution agreement include the right to store specified amounts of our ammonia for a monthly fee at Agrium’s ammonia terminal in Niota, Illinois, which serves as another location where our ammonia is sold. Our right to store ammonia at Agrium’s terminal expires on June 30, 2016, but automatically renews for successive one year periods, unless we deliver a termination notice to Agrium with respect to such storage rights at least three months prior to an automatic renewal. Notwithstanding the foregoing, our right to use the storage space immediately terminates if the distribution agreement terminates in accordance with its terms. Outside of the distribution agreement, we also sell our CO2 directly to customers on a contract-by-contract basis.
Under the distribution agreement, we pay commissions to Agrium not to exceed $5 million during each contract year on applicable gross sales during the first 10 years of the agreement. The commission rate was 2% during the first year of the agreement and increased by 1% on each anniversary date of the agreement up to the current rate of 5%, which is the maximum allowable rate under the distribution agreement during the first 10 years of the agreement. For the fiscal years ended September 30, 2011, 2010 and 2009, the effective commission rate associated with sales under the distribution agreement was 4.3%, 4.2% and 2.3%, respectively.
Transportation
In most instances, our customers purchase our nitrogen products freight on board, or FOB, at our facility, and then arrange and pay to transport them to their final destinations by truck according to customary practice in our market. Similarly, under the distribution agreement, neither we nor Agrium is responsible for transportation, and customers that purchase our products through Agrium purchase such products FOB at our facility. When products are purchased FOB at our facility, the customer is responsible for all costs for and bears all risks associated with the transportation of products from our facility.
In certain limited cases, we transport our products by barge or rail, and are responsible for the associated transportation costs. We own a barge dock on the Mississippi River, and we deliver some of our products to customers by barge. We also ship some of our products by barge to our leased storage facility in Niota, Illinois, another location from which our customers may pick up our products by truck. We also own a rail spur that connects to the Burlington Northern Santa Fe Railway, and the Canadian National Railway Company or its predecessors have provided rail service to our facility since 1966.
We believe that having the option to transport our nitrogen products by barge or rail provides us with the flexibility to sell our products to locations that cannot readily be reached by truck. However, transportation by truck generally is not subject to many of the risks and costs associated with transportation by barge or rail. Barge transportation from the Gulf Coast frequently is constrained by unpredictable conditions and limited equipment and storage infrastructure on the Mississippi River. Lock closures on the Upper Mississippi River can be caused by a variety of conditions, including inclement weather or surface conditions, and can unexpectedly delay barge transportation. In addition, in the United States, there are only two towing companies that transport ammonia by barge and only 32 active barges available for ammonia transport, which we believe is only sufficient to transport the current level of produced ammonia. Ammonia storage sites and terminals served by barge on the Mississippi River are controlled primarily by CF Industries Holdings, Inc., or CF Industries, Koch Industries, Inc., or Koch, and Agrium. Because ownership of storage sites and terminals is limited to these competitors, other competitors who rely on barge transportation could encounter storage limitations associated with the seasonal Mississippi River closure that occurs annually from mid-November to early March. Railroads also charge premium prices to ship certain toxic inhalation hazard, or TIH, chemicals, including ammonia, due in part to additional liability insurance costs incurred by the railroads. We believe that railroads are taking other actions, such as requiring indemnification from their customers for liabilities relating to TIH chemicals, to shift the risks they face from shipping TIH chemicals to their customers, which may make transportation of ammonia by rail more costly or less feasible.
8
Table of Contents
Customers
We sell a majority of our nitrogen products to customers located in our core market. We sold over 90% of our nitrogen products to customers for agricultural uses during each of the fiscal years ended September 30, 2011, 2010 and 2009. Given the nature of our business, and consistent with industry practice, we do not have long-term minimum purchase contracts with any of our customers.
In the aggregate, our top five ammonia customers represented approximately 46%, 52% and 49%, respectively, of our ammonia sales for the fiscal years ended September 30, 2011, 2010 and 2009, and our top five UAN customers represented approximately 50% of our UAN sales for each of these fiscal years. In addition, Twin State, Inc., or Twin State, accounted for approximately 6%, 10% and 11%, respectively, of our total product sales for the fiscal years ended September 30, 2011, 2010 and 2009. Growmark, Inc., or Growmark, accounted for approximately 7%, 8% and 11%, respectively, of our total product sales for the fiscal years ended September 30, 2011, 2010 and 2009. For the fiscal years ended September 30, 2011, 2010 and 2009, approximately 3%, 7% and 0%, respectively, of our total product sales were to Agrium as a direct customer (rather than a distributor) and approximately 15%, 11% and 5%, respectively, of our total product sales were to Crop Production Services, Inc., or CPS, a controlled affiliate of Agrium.
Seasonality and Volatility
The fertilizer business is seasonal, based upon the planting, growing and harvesting cycles. Inventories must be accumulated to allow for customer shipments during the spring and fall fertilizer application seasons, which requires significant storage capacity. The accumulation of inventory to be available for seasonal sales requires us to maintain significant working capital. This seasonality generally results in higher fertilizer prices during peak periods, with prices normally reaching their highest point in the spring, decreasing in the summer, and increasing again in the fall. Fertilizer products are sold both on the spot market for immediate delivery and under product prepayment contracts for future delivery at fixed prices. The terms of the product prepayment contracts, including the percentage of the purchase price paid as a down payment, can vary from season to season. Variations in the proportion of product sold through forward sales and variations in the terms of the product prepayment contracts can increase the seasonal volatility of our cash flows and cause changes in the patterns of seasonal volatility from year-to-year. The cash from product prepayment contracts is included in our operating cash flow in the quarter in which the cash is received, while revenue related to product prepayment contracts is recognized when products are picked-up or delivered and the customer takes title. As a result, the cash received from product prepayment contracts increases our operating cash flow in the quarter in which the cash is received, but may effectively reduce our operating cash flow in a subsequent quarter if the cash was received in a quarter prior to the one in which the revenue is recorded. See Part II—Item 7 “Management’s Discussion and Analysis of Financial Condition and Results of Operations—Quantitative and Qualitative Disclosure About Market Risk.”
Another seasonal factor affecting our industry is the effect of weather-related conditions on ability to transport products by barge on the Upper Mississippi River. During portions of the winter, the Upper Mississippi River cannot be used for transport due to lock closures, which could preclude the transportation of nitrogen products by barge during this period and may increase transportation costs. However, only approximately 4.4% and 3.7% of the ammonia and UAN tonnage, respectively, that we sold during the three-year period ended September 30, 2011 was transported from our facility by barge.
The following table shows total tons of our products shipped for each quarter during the last three fiscal years:
| For the Fiscal Years Ended September 30, | ||||||||||||
| 2011 | 2010 | 2009 | ||||||||||
| (in thousands of tons) | ||||||||||||
| Ammonia |
||||||||||||
| Quarter ended December 31 |
44 | 45 | 44 | |||||||||
| Quarter ended March 31 |
20 | 22 | 5 | |||||||||
| Quarter ended June 30 |
43 | 51 | 67 | |||||||||
| Quarter ended September 30 |
18 | 35 | 10 | |||||||||
| UAN |
||||||||||||
| Quarter ended December 31 |
79 | 57 | 42 | |||||||||
| Quarter ended March 31 |
30 | 25 | 28 | |||||||||
| Quarter ended June 30 |
129 | 112 | 93 | |||||||||
| Quarter ended September 30 |
77 | 100 | 104 | |||||||||
| Other Nitrogen Products |
||||||||||||
| Quarter ended December 31 |
10 | 7 | 11 | |||||||||
| Quarter ended March 31 |
12 | 14 | 11 | |||||||||
9
Table of Contents
| For the Fiscal Years Ended September 30, | ||||||||||||
| 2011 | 2010 | 2009 | ||||||||||
| (in thousands of tons) | ||||||||||||
| Quarter ended June 30 |
15 | 12 | 15 | |||||||||
| Quarter ended September 30 |
7 | 10 | 8 | |||||||||
|
CO2 |
||||||||||||
| Quarter ended December 31 |
34 | 15 | 18 | |||||||||
| Quarter ended March 31 |
27 | 24 | 22 | |||||||||
| Quarter ended June 30 |
26 | 32 | 28 | |||||||||
| Quarter ended September 30 |
23 | 36 | 27 | |||||||||
|
|
|
|
|
|
|
|||||||
| Total Tons Shipped |
594 | 597 | 533 | |||||||||
|
|
|
|
|
|
|
|||||||
We typically ship the highest volume of tons during the spring planting season, which occurs during the quarter ending June 30, and the next highest volume of tons after the fall harvest during the quarter ending December 31. However, as reflected in the table above, the seasonal patterns may change substantially from year-to-year due to various circumstances, including timing of or changes in the weather. These seasonal increases and decreases in demand also can cause fluctuations in sales prices. In more mild winter seasons with warmer weather, early planting may shift significant ammonia sales into the quarter ending March 31.
Raw Materials
The principal raw material used to produce nitrogen fertilizer products is natural gas. We historically have purchased natural gas in the spot market, through the use of forward purchase contracts, or a combination of both. We use forward purchase contracts to lock in pricing for a portion of our facility’s natural gas requirements. These forward purchase contracts are generally either fixed-price or index-priced, short term in nature and for a fixed supply quantity. Our policy is to purchase natural gas under fixed-price forward contracts to produce the products that have been sold under product prepayment contracts for later delivery, effectively fixing a substantial portion of the gross margin on pre-sold product. We are able to purchase natural gas at competitive prices due to our connection to the Northern Natural Gas interstate pipeline system which is within one mile of our facility. The pipeline is connected to Nicor Inc.’s distribution system at the Chicago Citygate receipt point from which natural gas is transported to our facility. Though we do not purchase natural gas for the purpose of resale, we occasionally sell natural gas when contracted quantities received exceed production requirements and storage capacities. The location of our receipt point has allowed us to obtain relatively favorable natural gas prices for our excess natural gas using the Chicago Citygate price point created by the stable residential demand for the commodity in the city of Chicago, Illinois. During the fiscal year ended September 30, 2011, the average price of natural gas on this index exceeded that of the Inside FERC Northern Natural Gas Ventura and Demarcation Indices, which are used to determine the prices for the natural gas we purchase. Natural gas purchased and used in production was approximately 10.3 billion cubic feet, 9.9 billion cubic feet, 10.1 billion cubic feet in the fiscal years ended September 30, 2011, 2010 and 2009, respectively.
Changes in the levels of natural gas prices and market prices of nitrogen-based products can materially affect our financial position and results of operations. Natural gas prices in the United States have experienced significant fluctuations over the last few years, increasing substantially in 2008 and subsequently declining to lower levels in 2009, 2010, and 2011. The price changes have been driven by several factors, including changes in the demand for natural gas from industrial users, which is affected, in part, by the general conditions of the United States economy, and other factors. Several recent discoveries of large natural gas deposits in North America, combined with advances in technology for natural gas production also have caused large increases in the estimates of available natural gas reserves and production in the United States, contributing to significant reductions in the market price of natural gas. One major factor in the recent decrease in natural gas prices has been the use of technologies, including hydraulic fracturing and horizontal drilling, that have substantially increased the amount of natural gas produced in the United States. Hydraulic fracturing is the process of fracturing the underground formation with water, sand and chemicals under high pressure to recover natural gas from coalbeds and shale gas formations that otherwise may have been inaccessible. Horizontal drilling involves drilling a well from the surface to a subsurface location and then proceeding horizontally, which typically exposes significantly more reservoir rock to the well bore and thus results in greater potential natural gas recovery than traditional vertical drilling. Seasonal fluctuations in natural gas prices exist within each year resulting from various supply and demand factors, including, but not limited to, the severity of winter weather and its effect on consumer and industrial demand for heating, the severity of summer weather and its effect on industrial demand by utilities for electrical generation, and hurricane activity in the Gulf of Mexico.
10
Table of Contents
Competition
We compete with a number of domestic and foreign producers of nitrogen fertilizer products, many of which are larger than we are and have significantly greater financial and other resources than we do. We believe that customers for nitrogen fertilizer products make purchasing decisions principally on the delivered price and availability of the product at the critical application times. Our facility’s proximity to our customers provides us with a competitive advantage over producers located further away from our customers. The nitrogen fertilizer facilities closest to our facility are located in Fort Dodge, Iowa, Creston, Iowa and Port Neal, Iowa, approximately 190 miles, 275 miles and 300 miles, respectively, from our facility, and in Lima, Ohio, approximately 350 miles to the east of our facility. Our physical location in the center of the Mid Corn Belt provides us with a strategic placement and transportation cost advantage, compared to other producers who must ship their products over greater distances to our market area. The combination of our proximity to our customers and our storage capacity at our facility also allows our customers to better time the pick-up and application of our products, as deliveries from more distant locations have a greater risk of missing the short periods of favorable weather conditions during which the application of nitrogen fertilizer and planting may occur.
We plan to continue to operate our facility with natural gas as our primary feedstock. Competitors may have access to cheaper natural gas or other feedstocks that could provide them with a cost advantage. Depending on its magnitude, the amount of this cost advantage could offset the savings we may experience on transportation and storage costs as a result of our location. For the fiscal years ended September 30, 2011, 2010 and 2009, our average prices for natural gas were $4.76 per one million British thermal units, or MMBtu, $4.95 per MMBtu and $5.67 per MMBtu, respectively.
Environmental Matters
Our business is subject to extensive and frequently changing federal, state and local, environmental, health and safety regulations governing the emission and release of hazardous substances into the environment, the treatment and discharge of waste water and the storage, handling, use and transportation of our nitrogen fertilizer products. These laws include the Clean Air Act, or the CAA, the federal Water Pollution Control Act, or the Clean Water Act, the Resource Conservation and Recovery Act, the Comprehensive Environmental Response, Compensation and Liability Act, or CERCLA, the Toxic Substances Control Act, and various other federal, state and local laws and regulations. These laws, their underlying regulatory requirements and the enforcement thereof impact us by imposing:
| • | restrictions on operations or the need to install enhanced or additional controls; |
| • | the need to obtain and comply with permits and authorizations; |
| • | liability for the investigation and remediation of contaminated soil and groundwater at current and former facilities (if any) and off-site waste disposal locations; and |
| • | specifications for the products we market, primarily ammonia and UAN. |
Our operations require numerous permits and authorizations. Failure to comply with these permits or environmental laws generally could result in substantial fines, penalties or other sanctions, court orders to install pollution-control equipment, permit revocations and facility shutdowns. In addition, environmental, health and safety laws may impose joint and several liability, without regard to fault, for cleanup costs on potentially responsible parties who have released or disposed of hazardous substances into the environment. We may experience delays in obtaining or be unable to obtain required permits, which may delay or interrupt our operations and limit our growth and revenue. Private parties, including the owners of properties adjacent to other facilities where our wastes are taken for disposal, also may have the right to pursue legal actions to enforce compliance as well as to seek damages for non-compliance with environmental laws and regulations or for personal injury or property or natural resource damages. In addition, the risk of accidental spills or releases could expose us to significant liabilities that could have a material adverse effect on our business, financial condition or results of operations. During the fiscal years ended September 30, 2011 and 2010, we made $5.6 million and $1.3 million, respectively, of environmental, health and safety-related capital expenditures.
The laws and regulations to which we are subject are complex, change frequently and have tended to become more stringent over time. The ultimate impact on our business of complying with existing laws and regulations is not always clearly known or determinable due in part to the fact that our operations may change over time and certain implementing regulations for laws, such as the CAA, have not yet been finalized, are under governmental or judicial review or are being revised. These laws and regulations could result in increased capital, operating and compliance costs.
11
Table of Contents
Our facility has experienced some level of regulatory scrutiny in the past, and we may be subject to further regulatory inspections, future requests for investigation or assertions of liability relating to environmental issues. In the future, we could incur material liabilities or costs related to environmental matters, and these environmental liabilities or costs (including fines or other sanctions) could have a material adverse effect on our results of operations, financial condition and ability to make cash distributions.
The principal environmental regulations and risks associated with our business are outlined below. We believe that we are in material compliance with all of these environmental regulations.
The Federal Clean Air Act. The CAA and its implementing regulations, as well as the corresponding state laws and regulations that regulate emissions of pollutants into the air, affect us through the CAA’s permitting requirements and emission control requirements relating to specific air pollutants, as well as the requirement to maintain a risk management program to help prevent accidental releases of certain substances. Some or all of the standards promulgated pursuant to the CAA, or any future promulgations of standards, may require the installation of controls or changes to our facility in order to comply. If new controls or changes to operations are needed, the costs could be significant. In addition, failure to comply with the requirements of the CAA and its implementing regulations could result in fines, penalties or other sanctions.
The regulation of air emissions under the CAA requires that we obtain various construction and operating permits, including a Title V air permit issued by the Illinois Environmental Protection Agency, or IEPA, and incur capital expenditures for the installation of certain air pollution control devices at our operations. Various regulations specific to our operations have been implemented, such as National Emission Standard for Hazardous Air Pollutants, New Source Performance Standards and New Source Review. We have incurred, and expect to continue to incur, substantial capital expenditures to maintain compliance with these and other air emission regulations that have been promulgated or may be promulgated or revised in the future, including in connection with the following projects that are designed to comply with our emission limits and requirements of our Title V CAA permit:
| • | Clark Lean Burn Project. We retrofitted three of our 5,500 horsepower Clark compressor engines, which compress the synthesis gas at our facility, with improved combustion control systems and combustion chambers designed to reduce the generation of nitrogen oxides and other pollutants at the source. We completed this project in October 2011. |
| • | Nitric Acid Plant Selective Catalytic Reduction Converter Project. We installed a selective catalytic reduction, or SCR, converter on one of our nitric acid plants as part of a negotiated agreement with the federal Environmental Protection Agency, or the EPA, to resolve alleged violations of the Clear Air Act relating to this plant. The post-installation nitrogen oxide emissions limit represents an 80% decrease from the pre-installation nitrogen oxide emissions limit. Assuming an 80% reduction in nitrogen oxide emissions and the amount of nitric acid produced at the relevant nitric acid plant in 2010, the SCR converter would reduce nitrogen oxide emissions by approximately 88 tons per year. We completed this project in October 2011. |
| • | N2O Catalytic Converter Project. In June 2011, we installed the first tertiary N2O catalytic converter in the United States on one of our nitric acid plants. This converter is designed to convert approximately 90% of the N2O generated in our production of nitric acid into nitrogen and oxygen at that one plant. Assuming this conversion rate and the amount of nitric acid produced at the relevant nitric acid plant in 2010, we expect the converter to reduce N2O emissions at our facility by over 550 tons per year. This converter also will monitor and record its effect on reducing N2O emissions and we expect to be awarded corresponding emission reduction credits for any such reduction. If we do not need the credits, we believe that we could list the credits on an active registry, such as the Climate Registry maintained by the Climate Action Reserve, and sell the credits for a profit. |
Release Reporting. The release of hazardous substances or extremely hazardous substances into the environment is subject to release reporting requirements under federal and state environmental laws, including the Emergency Planning and Community Right-to-Know Act. We occasionally experience minor releases of hazardous or extremely hazardous substances from our equipment. We report such releases to the EPA, the IEPA and other relevant state and local agencies as required by applicable laws and regulations. If we fail to properly report a release, or if the release violates the law or our permits, it could cause us to become the subject of a governmental enforcement action or third-party claims. Government enforcement or third-party claims relating to releases of hazardous or extremely hazardous substances could result in significant expenditures and liability.
Clean Water Act. The Clean Water Act and analogous state laws impose restrictions and strict controls with respect to the discharge of pollutants, including spills and leaks of oil and other substances, into waters of the United States. The discharge of pollutants into regulated waters is prohibited, except in accordance with the terms of a permit issued by the EPA or an analogous state agency. The Clean Water Act and regulations implemented thereunder also prohibit the discharge of dredge and fill material into regulated waters, including wetlands, unless authorized by an appropriately issued permit. In addition, the Clean Water Act and analogous state laws require individual permits or coverage under general permits for discharges of storm water runoff from certain types of facilities. Spill prevention, control and countermeasure requirements of federal laws require appropriate containment berms
12
Table of Contents
and similar structures to help prevent the contamination of navigable waters by a petroleum hydrocarbon tank spill, rupture or leak. Federal and state regulatory agencies can impose administrative, civil and criminal penalties for non-compliance with discharge permits or other requirements of the Clean Water Act and analogous state laws and regulations.
GHG Emissions. Currently, various legislative and regulatory measures to address greenhouse gas, or GHG, emissions (including CO2, methane and nitrous oxides) are in various phases of discussion or implementation. At the federal legislative level, Congress has previously considered legislation requiring a mandatory reduction of GHG emissions. Although Congressional passage of such legislation does not appear likely at this time, it could be adopted at a future date. It is also possible that Congress may pass alternative climate change bills that do not mandate a nationwide cap-and-trade program and instead focus on promoting renewable energy and energy efficiency.
In the absence of congressional legislation curbing GHG emissions, the EPA is moving ahead administratively under its CAA authority. In October 2009, the EPA finalized a rule requiring certain large emitters of GHGs to inventory and report their GHG emissions to the EPA. In accordance with the rule, we monitor our GHG emissions from our facility and began reporting the emissions to the EPA annually beginning in September 2011. On December 7, 2009, the EPA finalized its “endangerment finding” that GHG emissions, including CO2, pose a threat to human health and welfare. The finding allows the EPA to regulate GHG emissions as air pollutants under the CAA. In May 2010, the EPA finalized the “Greenhouse Gas Tailoring Rule,” which establishes new GHG emissions thresholds that determine when stationary sources, such as our facility, must obtain permits under the Prevention of Significant Deterioration, or PSD, and Title V programs of the CAA. The permitting requirements of the PSD program apply only to newly constructed or modified major sources. Obtaining a PSD permit requires a source to install best available control technology, or BACT, for those regulated pollutants that are emitted in certain quantities. Phase I of the Greenhouse Gas Tailoring Rule, which became effective on January 2, 2011, requires projects already triggering PSD permitting that are also increasing GHG emissions by more than 75,000 tons per year to comply with BACT rules for their GHG emissions. Phase II of the Greenhouse Gas Tailoring Rule, which became effective on July 1, 2011, requires preconstruction permits using BACT for new projects that emit 100,000 tons of GHG emissions per year or existing facilities that make major modifications increasing GHG emissions by more than 75,000 tons per year. The ongoing ammonia capacity expansion project at our facility did not trigger the need to install BACT because actual construction commenced prior to July 1, 2011 and is not considered a major modification with respect to criteria pollutants. However, a future major modification to our facility may require us to install BACT and potentially require us to obtain other CAA permits for our GHG emissions at our facility. The EPA’s endangerment finding, the Greenhouse Gas Tailoring Rule and certain other GHG emission rules have been challenged and will likely be subject to extensive litigation. In addition, a number of Congressional bills to overturn the endangerment finding and bar the EPA from regulating GHG emissions, or at least to defer such action by the EPA under the CAA, have been proposed, although President Obama has announced his intention to veto any such bills if passed.
In addition to federal regulations, a number of states have adopted regional GHG initiatives to reduce CO2 and other GHG emissions. In 2007, a group of Midwest states formed the Midwestern Greenhouse Gas Reduction Accord, which calls for the development of a cap-and-trade system to control GHG emissions and for the inventory of such emissions. However, the individual states that have signed on to the accord must adopt laws or regulations implementing the trading scheme before it becomes effective, and the timing and specific requirements of any such laws or regulations in Illinois are uncertain at this time.
The implementation of additional EPA regulations and/or the passage of federal or state climate change legislation will likely result in increased costs to (i) operate and maintain our facilities, (ii) install new emission controls on our facilities and (iii) administer and manage any GHG emissions program. Increased costs associated with compliance with any future legislation or regulation of GHG emissions, if it occurs, may have a material adverse effect on our results of operations, financial condition and ability to make cash distributions. In addition, climate change legislation and regulations may result in increased costs not only for our business but also for agricultural producers that utilize our fertilizer products, thereby potentially decreasing demand for our nitrogen fertilizer products. Decreased demand for our fertilizer products may have a material adverse effect on our results of operations, financial condition and ability to make cash distributions.
Environmental Remediation. Under CERCLA and related state laws, certain persons may be liable for the release or threatened release of hazardous substances. These persons can include the current owner or operator of property where a release or threatened release occurred, any persons who owned or operated the property when the release occurred, and any persons who disposed of, or arranged for the transportation or disposal of, hazardous substances at a contaminated property. Liability under CERCLA is strict, retroactive and, under certain circumstances, joint and several, so that any responsible party may be held liable for the entire cost of investigating and remediating the release of hazardous substances. As is the case with all companies engaged in similar industries, depending on the underlying facts and circumstances we face potential exposure from future claims and lawsuits involving environmental matters, including soil and water contamination, personal injury or property damage allegedly caused by hazardous substances that we manufactured, handled, used, stored, transported, spilled, disposed of or released. We cannot assure you that we
13
Table of Contents
will not become involved in future proceedings related to our release of hazardous or extremely hazardous substances or that, if we were held responsible for damages in any existing or future proceedings, such costs would be covered by insurance or would not be material.
Environmental Insurance. We have a premises pollution liability insurance policy with an aggregate limit of $25.0 million per pollution condition, subject to a self-insured retention of $250,000. The insurance policy was renewed for a three-year term in September 2011 and will expire on October 1, 2014. Our policy covers claims, remediation costs and associated legal defense expenses for pollution conditions at or migrating from our facility and the transportation risks associated with moving waste from our facility to any location for unloading or depositing waste, but does not cover business interruptions. Our policy contains terms, exclusions, conditions and limitations that could apply to a particular pollution condition claim, and we cannot guarantee that a claim will be adequately insured for all potential damages.
Safety, Health and Security Matters
We are subject to a number of federal and state laws and regulations related to safety, including the federal Occupational Safety and Health Act, or OSHA, and comparable state statutes, the purpose of which are to protect the health and safety of workers. We also are subject to OSHA Process Safety Management regulations, which are designed to prevent or minimize the consequences of catastrophic releases of toxic, reactive, flammable or explosive chemicals. These regulations apply to any process that involves a chemical at or above the specified thresholds or any process that involves flammable liquid or gas, pressurized tanks, caverns and wells in excess of 10,000 pounds at various locations. We have an internal safety, health and security program designed to monitor and enforce compliance with worker safety requirements, and we routinely review and consider improvements in our programs. We also are subject to EPA Chemical Accident Prevention Provisions, known as the Risk Management Plan requirements, which are designed to prevent the accidental release of toxic, reactive, flammable or explosive materials, and the United States Coast Guard’s Maritime Security Standards for Facilities, which are designed to regulate the security of high-risk maritime facilities. We believe that we are in material compliance with all applicable laws and regulations related to worker health and safety. Notwithstanding these preventative measures, we cannot guarantee that serious accidents will not occur in the future.
Employees
As of September 30, 2011, we had 55 non-unionized and salaried employees, and 90 unionized employees. We have a collective bargaining agreement, which was renewed for a six year term in October 2006. We have not experienced a work stoppage at our facility since 1991.
Financial Information
We operate in only one business segment. Additionally, all of our properties are located in the United States and all of the related revenues are derived from purchasers located in the United States. Our financial information is included in Part II—Item 8 “Financial Statements and Supplementary Data.”
Properties
We operate our facility on an approximately 210 acre site in East Dubuque, Illinois adjacent to the Mississippi River. We own the land, buildings, several special purpose structures, equipment, storage tanks and specialized truck, rail and river barge loading facilities, and hold easements for the roadways, wells, the rail track and the barge dock. We also have the right to store 15,000 tons of ammonia at Agrium’s terminal in Niota, Illinois. See “—Marketing and Distribution.”
Available Information
Our annual report on Form 10-K, quarterly reports on Form 10-Q, current reports on Form 8-K and amendments to those reports are available free of charge as soon as reasonably practical after they are filed or furnished to the SEC, at the “Investor Relations” portion of our website, www.rentechnitrogen.com. Materials we file with the SEC may be read and copied at the SEC’s Public Reference Room at 100 F Street, NE, Washington, D.C. 20549. Information on the operation of the Public Reference Room may be obtained by calling the SEC at 1-800-SEC-0330. The SEC also maintains an Internet website at www.sec.gov that contains reports, and other information regarding us that we file electronically with the SEC. The information contained on our website does not constitute part of this report.
14
Table of Contents
Set forth below are certain risk factors related to our business. Actual results could differ materially from those anticipated as a result of these and various other factors, including those set forth in our other periodic and current reports filed with the SEC, from time to time. If any of the following risks and uncertainties develops into an actual event, our business, financial condition, cash flow or results of operations could be materially adversely affected. In that case, we might not be able to pay distributions on our common units, the trading price of our common units could decline and you could lose all or part of your investment. Although many of our business risks are comparable to those faced by a corporation engaged in a similar business, limited partner interests are inherently different from the capital stock of a corporation and involve additional risks described below.
Risks Related to Our Business
We may not have sufficient cash available for distribution to pay any quarterly distributions on our common units.
We may not have sufficient cash available for distribution each quarter to enable us to pay any distributions to our common unitholders. Furthermore, our partnership agreement does not require us to pay distributions on a quarterly basis or otherwise. The amount of cash we will be able to distribute on our common units principally depends on the amount of cash we generate from our operations, which is directly dependent upon the operating margins we generate, which have been volatile historically, and cash collections under product prepayment contracts for our products. Our operating margins are significantly affected by the price and availability of natural gas, market-driven product prices we are able to charge our customers and our production costs, as well as seasonality, weather conditions, governmental regulation, unplanned maintenance or shutdowns at our facility and global and domestic demand for nitrogen fertilizer products, among other factors. In addition:
| • | Our partnership agreement does not provide for any minimum quarterly distribution and our quarterly distributions, if any, will be subject to significant fluctuations directly related to the cash we generate after payment of our expenses due to the nature of our business. |
| • | The amount of distributions we make, if any, and the decision to make any distribution at all is determined by the board of directors of our general partner, whose interests may differ from those of our common unitholders. Our general partner has limited fiduciary and contractual duties, which may permit it to favor its own interests or the interests of Rentech to the detriment of our common unitholders. |
| • | Our new revolving credit facility limits, and any credit facility or other debt instruments we enter into in the future may limit, the distributions that we can make. Our new revolving credit facility contains, and any future credit facility or debt instruments we enter into may contain, financial tests and covenants that we must satisfy. Any failure to comply with these tests and covenants could result in the applicable lenders prohibiting distributions by us. |
| • | The amount of cash available to pay any quarterly distribution to our unitholders depends primarily on our cash flow, and not solely on our profitability, which is affected by non-cash items that may be large relative to our reported net income. As a result, we may make distributions during periods when we record losses and may not make distributions during periods when we record net income. |
| • | The actual amount of cash available for distribution will depend on numerous factors, some of which are beyond our control, including the availability and price of natural gas, ammonia and UAN prices, our operating costs, global and domestic demand for nitrogen fertilizer products, fluctuations in our capital expenditures and working capital needs, our product pre-sale and cash collection cycle and the amount of fees and expenses we incur. |
| • | Under Section 17-607 of the Delaware Revised Uniform Limited Partnership Act, or Delaware Act, we are prohibited from making a distribution to our limited partners if the distribution would cause our liabilities to exceed the fair value of our assets. |
The amount of our quarterly cash distributions, if any, will vary significantly both quarterly and annually and will be directly dependent on the performance of our business. Unlike most publicly traded limited partnerships, we do not have a minimum quarterly distribution or employ structures intended to consistently maintain or increase distributions over time.
Investors who are looking for an investment that will pay regular and predictable quarterly distributions should not invest in our common units. We expect our business performance will be more seasonal and volatile, and our cash flow will be less stable, than the business performance and cash flow of most publicly traded limited partnerships. As a result, our quarterly cash distributions will be
15
Table of Contents
volatile and are expected to vary quarterly and annually. Unlike most publicly traded limited partnerships, we do not have a minimum quarterly distribution or employ structures intended to consistently maintain or increase distributions over time. The amount of our quarterly cash distributions will be directly dependent on the performance of our business, which has been volatile historically as a result of volatile nitrogen fertilizer and natural gas prices, unplanned outages, seasonal and global fluctuations in demand for nitrogen fertilizer products and the timing of our product pre-sale and cash collections. Because our quarterly distributions will be subject to significant fluctuations directly related to the cash we generate after payment of our fixed and variable expenses, future quarterly distributions paid to our unitholders will vary significantly from quarter to quarter and may be zero. Given the seasonal nature of our business, we expect that our unitholders will have direct exposure to fluctuations in the margins we realize on sales of nitrogen fertilizers and other products that we produce. In addition, we frequently make product sales pursuant to product prepayment contracts, whereby we receive cash in respect of product to be picked up by or delivered to a customer at a later date, but do not record revenue in respect of such sales until product is picked up or delivered. The cash received from product prepayments increases our operating cash flow in the quarter in which the cash is received, but may effectively reduce our operating cash flow in a subsequent quarter if the cash was received in a quarter prior to the one in which the revenue is recorded.
We may modify or revoke our cash distribution policy at any time at our discretion. Our partnership agreement does not require us to make any distributions at all.
Our current cash distribution policy is to distribute all of the cash available for distribution we generate each quarter to unitholders of record on a pro rata basis. However, we may change such policy at any time at our discretion and could elect not to make distributions for one or more quarters. Our partnership agreement does not require us to make any distributions at all. Accordingly, investors are cautioned not to place undue reliance on the permanence of such a policy in making an investment decision. Any modification or revocation of our cash distribution policy could substantially reduce or eliminate the amounts of distributions to our unitholders.
Our operations may become unprofitable and may require substantial working capital financing.
During each of the five fiscal years ended September 30, 2011, 2010, 2009, 2008 and 2007, we generated positive income from operations and positive cash flow from operations. However, during the fiscal year ended September 30, 2006, we operated at a net loss despite the fact that we generated positive cash flow from operations. In prior fiscal years, we sustained losses and negative cash flow from operations. Our profits and cash flow are subject to changes in the prices for our products and our main input, natural gas, which are commodities, and, as such, the prices can be volatile in response to numerous factors outside of our control. Our profits depend on maintaining high rates of production of our products, and interruptions in operations at our facility could materially adversely affect our profitability. If we are not able to operate our facility at a profit or if we are not able to retain cash or access a sufficient amount of additional financing for working capital, our business, financial condition, cash flow, results of operations and ability to pay cash distributions could be materially adversely affected, which could adversely affect the trading price of our common units.
The nitrogen fertilizer business is, and nitrogen fertilizer prices are, seasonal, cyclical and highly volatile and have experienced substantial and sudden downturns in the past. Currently, nitrogen fertilizer demand is at a relative high point and could decrease significantly in the future. Cycles in demand and pricing could potentially expose us to significant fluctuations in our operating and financial results, and expose you to substantial volatility in our quarterly distributions and material reductions in the trading price of our common units.
We are exposed to fluctuations in nitrogen fertilizer demand and prices in the agricultural industry. These fluctuations historically have had, and could in the future have, significant effects on prices across all nitrogen fertilizer products and, in turn, our financial condition, cash flow and results of operations, which could result in significant volatility or material reductions in the price of our common units or an inability to make cash distributions on our common units.
Nitrogen fertilizer products are commodities, the prices of which can be highly volatile. The price of nitrogen fertilizer products depends on a number of factors, including general economic conditions, cyclical trends in end-user markets, supply and demand imbalances, the prices of natural gas and other raw materials, and weather conditions, all of which have a greater relevance because of the seasonal nature of fertilizer application. If seasonal demand exceeds the projections on which we base production, our customers may acquire nitrogen fertilizer products from our competitors, and our profitability will be negatively impacted. If seasonal demand is less than we expect, we will be left with excess inventory that will have to be stored or liquidated, the costs of which could adversely affect our operating margins and our ability to pay cash distributions.
16
Table of Contents
Demand for nitrogen fertilizer products is dependent on demand for crop nutrients by the global agricultural industry. Nitrogen fertilizer products are currently in high demand, driven by a growing world population, changes in dietary habits and an expanded production of corn. Supply is affected by available capacity and operating rates of nitrogen producers, raw material costs, government policies and global trade. A significant or prolonged decrease in nitrogen fertilizer prices would have a material adverse effect on our business, cash flow and ability to make distributions.
Any decline in United States agricultural production or crop prices or limitations on the use of nitrogen fertilizer for agricultural purposes could have a material adverse effect on the market for nitrogen fertilizer, and on our results of operations, financial condition and ability to make cash distributions.
Conditions in the United States agricultural industry significantly impact our operating results. This is particularly the case in the production of corn, which is a major driver of the demand for nitrogen fertilizer products in the United States. The United States agricultural industry in general, and the production and prices of corn in particular, can be affected by a number of factors, including weather patterns and soil conditions, current and projected grain inventories and prices, domestic and international supply of and demand for United States agricultural products and United States and foreign policies regarding trade in agricultural products. Prices for these agricultural products can decrease suddenly and significantly. For example, in June 2011, an unexpectedly large corn crop estimate resulted in an approximately 20% decrease in corn prices from their peak levels earlier in the month, the largest monthly decrease since June 2009.
State and federal governmental regulations and policies, including farm and biofuel subsidies and commodity support programs, as well as the prices of fertilizer products, may also directly or indirectly influence the number of acres planted, the mix of crops planted and the use of fertilizers for particular agricultural applications. Developments in crop technology, such as nitrogen fixation, the conversion of atmospheric nitrogen into compounds that plants can assimilate, could also reduce the use of chemical fertilizers and adversely affect the demand for nitrogen fertilizer. In addition, from time to time various state legislatures have considered limitations on the use and application of chemical fertilizers due to concerns about the impact of these products on the environment. The adoption or enforcement of such regulations could adversely affect the demand for and prices of nitrogen fertilizers, which could adversely affect our results of operations, cash flows and ability to make cash distributions to our unitholders.
A major factor underlying the current high level of demand for our nitrogen-based fertilizer products is the expanding production of ethanol. A decrease in ethanol production, an increase in ethanol imports or a shift away from corn as a principal raw material used to produce ethanol could have a material adverse effect on our results of operations, financial condition and ability to make cash distributions.
A major factor underlying the current level of demand for corn and the use of nitrogen fertilizer products is the current production level of ethanol in the United States. Ethanol production in the United States is dependent in part upon a myriad of federal and state incentives. Such incentive programs may not be renewed, or if renewed, they may be renewed on terms significantly less favorable to ethanol producers than current incentive programs. Studies showing that expanded ethanol production may increase the level of GHGs in the environment, or other factors, may reduce political support for ethanol production. For example, on June 16, 2011, the United States Senate voted to eliminate the Volumetric Ethanol Excise Tax Credit, or VEETC, which provides for a 45 cents per gallon tax credit to blenders and refiners for gasoline that has been blended with ethanol. Even if the VEETC is not ultimately repealed, it is scheduled to expire on December 31, 2011, and we cannot guarantee that it will be renewed or that any other ethanol-related subsidy will be implemented in its place. Furthermore, the current trend in ethanol production research is to develop an efficient method of producing ethanol from cellulose-based biomass. If the VEETC is eliminated or an efficient method of producing ethanol from cellulose-based biomass is developed and commercially deployed at scale, the demand for corn may decrease significantly. Any reduction in the demand for corn and, in turn, for nitrogen fertilizer products could have a material adverse effect on our results of operations, financial condition and ability to make cash distributions to our unitholders.
Nitrogen fertilizer products are global commodities. Any decrease in the price of nitrogen fertilizer products from foreign countries could harm us.
Fertilizers are global commodities, with little or no product differentiation, and customers make their purchasing decisions principally on the basis of delivered price and availability of the product. In recent years, the price of nitrogen fertilizer in the United States has been substantially driven by pricing in the global fertilizer market and favorable prices for natural gas in the United States as compared to those in foreign countries. If foreign natural gas prices become lower than natural gas prices in the United States, competition from foreign businesses will likely increase and this could have a material adverse effect on our results of operations, financial condition and ability to make cash distributions to our unitholders.
17
Table of Contents
We face intense competition from other nitrogen fertilizer producers.
We have a number of competitors in the United States and in other countries, including state-owned and government-subsidized entities. Our principal competitors include domestic and foreign fertilizer producers, major grain companies and independent distributors and brokers, including Koch, CF Industries, Agrium, Gavilon, LLC, CHS Inc., Transammonia, Inc. and Helm Fertilizer Corp. Some competitors have greater total resources, or better name recognition, and are less dependent on earnings from fertilizer sales, which make them less vulnerable to industry downturns and better positioned to pursue new expansion and development opportunities. For example, certain of our competitors have announced that they currently have expansions planned or underway to increase production capacity of their nitrogen fertilizer products. Furthermore, there are a few dormant nitrogen production facilities located outside of the States of Illinois, Indiana and Iowa that are scheduled to resume operations in the near future. We may face additional competition due to the expansion of facilities that are currently operating and the reopening of currently dormant facilities. In addition, competitors utilizing different corporate structures may be better able to withstand lower cash flow than we can as a limited partnership. Our competitive position could suffer to the extent we are not able to adapt our product mix to meet the needs of our customers or expand our own resources either through investments in new or existing operations or through acquisitions, joint ventures or partnerships. An inability to compete successfully could result in the loss of customers, which could adversely affect our sales and profitability, and our ability to make cash distributions to our unitholders. In addition, as a result of increased pricing pressures caused by competition, we may in the future experience reductions in our profit margins on sales, or may be unable to pass future input price increases on to our customers, which would reduce our cash flows and the cash available for distribution to our unitholders.
Our business is seasonal, which may result in our carrying significant amounts of inventory and seasonal variations in working capital. Our inability to predict future seasonal nitrogen fertilizer demand accurately may result in excess inventory or product shortages.
Our business is highly seasonal. Historically, most of the annual deliveries of our products have occurred during the quarters ending June 30 and December 31 of each year due to the condensed nature of the spring planting season and the fall harvest. Farmers in our market tend to apply nitrogen fertilizer during two short application periods, one in the spring and the other in the fall. Since interim period operating results reflect the seasonal nature of our business, they are not indicative of results expected for the full fiscal year. In addition, results for comparable quarters can vary significantly from one year to the next due primarily to weather-related shifts in planting schedules and purchase patterns of our customers. We expect to incur substantial expenditures for fixed costs throughout the year and substantial expenditures for inventory in advance of the spring planting season and fall harvest season. Seasonality also relates to the limited windows of opportunity that nitrogen fertilizer customers have to complete required tasks at each stage of crop cultivation. Should events such as adverse weather or production or transportation interruptions occur during these seasonal windows, we would face the possibility of reduced revenue without the opportunity to recover until the following season. In addition, an adverse weather pattern affecting our core market could have a material adverse effect on the demand for our products and our revenues, and we may not have sufficient geographic diversity in our customer base to mitigate such effects. Because of the seasonality of agriculture, we also expect to face the risk of significant inventory carrying costs should our customers’ activities be curtailed during their normal seasons. The seasonality can negatively impact accounts receivable collections and increase bad debts. In addition, variations in the proportion of product sold through forward sales and variances in the terms and timing of product prepayment contracts can affect working capital requirements and increase the seasonal and year-to-year volatility of our cash flow and cash available for distribution to our unitholders.
If seasonal demand exceeds our projections, we will not have enough product and our customers may acquire products from our competitors, which would negatively impact our profitability. If seasonal demand is less than we expect, we will be left with excess inventory and higher working capital and liquidity requirements.
The degree of seasonality of our business can change significantly from year to year due to conditions in the agricultural industry and other factors. As a consequence of our seasonality, we expect that our distributions will be volatile and will vary quarterly and annually.
Any operational disruption at our facility as a result of equipment failure, an accident, adverse weather, a natural disaster or another interruption could result in a reduction of sales volumes and could cause us to incur substantial expenditures. A prolonged disruption could materially affect the cash flow we expect from our facility, or lead to a default under our new revolving credit facility.
18
Table of Contents
The equipment at our facility could fail and could be difficult to replace. Our facility may be subject to significant interruption if it were to experience a major accident or equipment failure or if it were damaged by severe weather or natural disaster. Significant shutdowns at our facility could significantly reduce the amount of product available for sale, which could reduce or eliminate profits and cash flow from our operations. Repairs to our facility in such circumstances could be expensive, and could be so extensive that our facility could not economically be placed back into service. It has become increasingly difficult to obtain replacement parts for equipment and the unavailability of replacement parts could impede our ability to make repairs to our facility when needed. We currently maintain property insurance, including business interruption insurance, but we may not have sufficient coverage, or may be unable in the future to obtain sufficient coverage at reasonable costs. A prolonged disruption at our facility could materially affect the cash flow we expect from our facility, or lead to a default under our new revolving credit facility. In addition, operations at our facility are subject to hazards inherent in chemical processing. Some of those hazards may cause personal injury and loss of life, severe damage to or destruction of property and equipment and environmental damage, and may result in suspension of operations and the imposition of civil or criminal penalties. As a result, operational disruptions at our facility could materially adversely impact our business, financial condition, results of operations and cash flow.
The market for natural gas has been volatile. Natural gas prices are currently at a relative low point. If prices for natural gas increase significantly, we may not be able to economically operate our facility.
The operation of our facility with natural gas as the primary feedstock exposes us to market risk due to increases in natural gas prices, particularly if the price of natural gas in the United States were to become higher than the price of natural gas outside the United States. During 2008, natural gas prices spiked to near-record high prices. This was due to various supply and demand factors, including the increasing overall demand for natural gas from industrial users, which is affected, in part, by the general conditions of the United States and global economies, and other factors. The profitability of operating our facility is significantly dependent on the cost of natural gas, and our facility has operated in the past, and may operate in the future, at a net loss. Since we expect to purchase a substantial portion of our natural gas for use in our facility on the spot market we remain susceptible to fluctuations in the price of natural gas. We also expect to use short-term, fixed supply, fixed price forward purchase contracts to lock in pricing for a portion of our natural gas requirements. Our ability to enter into forward purchase contracts is dependent upon our creditworthiness and, in the event of a deterioration in our credit, counterparties could refuse to enter into forward purchase contracts on acceptable terms. If we are unable to enter into forward purchase contracts for the supply of natural gas, we would need to purchase natural gas on the spot market, which would impair our ability to hedge our exposure to risk from fluctuations in natural gas prices. Moreover, forward purchase contracts may not protect us from increases in natural gas prices. A hypothetical increase of $0.10 per MMBtu of natural gas would increase our cost to produce one ton of ammonia by approximately $3.50. Higher than anticipated costs for the catalyst and other materials used at our facility could also adversely affect operating results. These increased costs could materially and adversely affect our results of operations, financial condition and ability to make cash distributions.
An increase in natural gas prices could impact our relative competitive position when compared to other foreign and domestic nitrogen fertilizer producers.
We rely on natural gas as our primary feedstock, and the cost of natural gas is a large component of the total production cost for our nitrogen fertilizer. The dramatic increase in nitrogen fertilizer prices in recent years was not the direct result of an increase in natural gas prices, but rather the result of increased demand for nitrogen-based fertilizers due to historically low stocks of global grains and a surge in the prices of corn and wheat, the primary crops in the Mid Corn Belt region. This increase in demand for nitrogen fertilizers has created an environment in which nitrogen fertilizer prices have diverged from their traditional correlation with natural gas prices. An increase in natural gas prices would impact our operations by making us less competitive with competitors who do not use natural gas as their primary feedstock, and would therefore have a material adverse impact on the trading price of our common units. In addition, if natural gas prices in the United States were to increase to a level where foreign nitrogen fertilizer producers were able to improve their competitive position on a price-basis, this would negatively affect our competitive position in the Mid Corn Belt region and thus have a material adverse effect on our results of operations, financial condition, cash flows, and ability to make cash distributions.
Due to our lack of asset diversification, adverse developments in the nitrogen fertilizer industry could adversely affect our results of operations and our ability to make distributions to our unitholders.
We rely exclusively on the revenues generated from our facility. An adverse development in the market for nitrogen fertilizer products in our region generally or at our facility in particular would have a significantly greater impact on our operations and cash available for distribution to our unitholders than it would on other companies that are more diversified geographically or that have a more diverse asset and product base. The largest publicly traded companies with which we compete sell a more diverse range of fertilizer products to broader markets.
19
Table of Contents
Any interruption in the supply of natural gas to our facility through Nicor Inc. could have a material adverse effect on our results of operations, financial condition and our ability to make cash distributions.
Our operations depend on the availability of natural gas. We have an agreement with Nicor Inc. pursuant to which we access natural gas from the Northern Natural Gas Pipeline. Our access to satisfactory supplies of natural gas through Nicor Inc. could be disrupted due to a number of causes, including volume limitations under the agreement, pipeline malfunctions, service interruptions, mechanical failures or other reasons. The agreement extends for five consecutive periods of 12 months each, with the first period having commenced on November 1, 2010 and the last period ending October 31, 2015. For each period, Nicor Inc. may establish a bidding period during which we may match the best bid received by Nicor Inc. for the natural gas capacity provided under the agreement. We could be out-bid for any of the remaining periods under the agreement. In addition, upon expiration of the last period, we may be unable to renew the agreement on satisfactory terms, or at all. Any disruption in the supply of natural gas to our facility could restrict our ability to continue to make our products. In the event we needed to obtain natural gas from another source, we would need to build a new connection from that source to our facility and negotiate related easement rights, which would be costly, disruptive and/or unfeasible. As a result, any interruption in the supply of natural gas through Nicor Inc. could have a material adverse effect on our results of operations, financial condition and ability to make cash distributions.
Our facility faces operating hazards and interruptions, including unplanned maintenance or shutdowns. We could face potentially significant costs to the extent these hazards or interruptions cause a material decline in production and are not fully covered by our existing insurance coverage. Insurance companies that currently insure companies in our industry may cease to do so, may change the coverage provided or may substantially increase premiums in the future.
Our operations, located at a single location, are subject to significant operating hazards and interruptions. Any significant curtailing of production at our facility or individual units within our facility could result in materially lower levels of revenues and cash flow for the duration of any shutdown and materially adversely impact our ability to make cash distributions to our unitholders. Operations at our facility could be curtailed or partially or completely shut down, temporarily or permanently, as the result of a number of circumstances, most of which are not within our control, such as:
| • | unplanned maintenance or catastrophic events such as a major accident or fire, damage by severe weather, flooding or other natural disaster; |
| • | labor difficulties that result in a work stoppage or slowdown; |
| • | environmental proceedings or other litigation that compel the cessation of all or a portion of the operations at our facility; |
| • | increasingly stringent environmental and emission regulations; |
| • | a disruption in the supply of natural gas or electricity to our facility; and |
| • | a governmental ban or other limitation on the use of nitrogen fertilizer products, either generally or specifically those manufactured at our facility. |
The magnitude of the effect on us of any unplanned shutdown will depend on the length of the shutdown and the extent of the operations affected by the shutdown.
Our facility also requires a planned maintenance turnaround every two years, which generally lasts between 18 and 25 days. Upon completion of a facility turnaround, we may face delays and difficulties restarting production at our facility. For example, in October 2009, our ammonia facility underwent a 15-day maintenance turnaround and a subsequent 15-day unplanned shutdown due to equipment failures. The duration of our turnarounds or other shutdowns, and the impact they have on our operations, could materially adversely affect our cash flow and ability to make cash distributions in the quarter or quarters in which the turnarounds occur.
A major accident, fire, explosion, flood, severe weather event, terrorist attack or other event also could damage our facility or the environment and the surrounding community or result in injuries or loss of life. Scheduled and unplanned maintenance could reduce our cash flow and ability to make cash distributions to our unitholders during or for the period of time that any portion of our facility is not operating. Any unplanned future shutdowns could have a material adverse effect on our ability to make cash distributions to our unitholders.
20
Table of Contents
If we experience significant property damage, business interruption, environmental claims, fines, penalties or other liabilities, our business could be materially adversely affected to the extent the damages or claims exceed the amount of valid and collectible insurance available to us. We are currently insured under Rentech’s casualty, environmental, property and business interruption insurance policies. The property and business interruption insurance policies currently in place have a $300.0 million limit with respect to all occurrences at our and Rentech’s facilities within a 72-hour period, with a $1.0 million deductible for physical damage and a 30 day waiting period before losses resulting from business interruptions are recoverable. The policies also contain exclusions and conditions that could have a materially adverse impact on our ability to receive indemnification thereunder, as well as customary sub-limits for particular types of losses. For example, the current property policy contains a specific sub-limit of approximately $160 million for losses resulting from business interruptions and $5.0 million for damage caused by covered flooding. We are fully exposed to all losses in excess of the applicable limits and sub-limits and for losses due to business interruptions of fewer than 30 days.
Market factors, including but not limited to catastrophic perils that impact our industry, significant changes in the investment returns of insurance companies, insurance company solvency trends and industry loss ratios and loss trends, can negatively impact the future cost and availability of insurance. There can be no assurance that we will be able to buy and maintain insurance with adequate limits, reasonable pricing terms and conditions or collect from insurance claims that we make.
There is no assurance that the transportation costs of our competitors will not decline. Any significant decline in our competitors’ transportation costs could have a material adverse effect on our results of operations, financial condition and our ability to make cash distributions.
Many of our competitors incur greater costs than we and our customers do in transporting their products over longer distances via rail, ships, barges and pipelines. There can be no assurance that our competitors’ transportation costs will not decline or that additional pipelines will not be built in the future, lowering the price at which our competitors can sell their products, which could have a material adverse effect on our results of operations, financial condition and ability to make cash distributions.
Our results of operations are highly dependent upon and fluctuate based upon business and economic conditions and governmental policies affecting the agricultural industry. These factors are outside of our control and may significantly affect our profitability.
Our results of operations are highly dependent upon business and economic conditions and governmental policies affecting the agricultural industry, which we cannot control. The agricultural products business can be affected by a number of factors. The most important of these factors, for United States markets, are:
| • | weather patterns and field conditions (particularly during periods of traditionally high nitrogen fertilizer consumption); |
| • | quantities of nitrogen fertilizers imported to and exported from North America; |
| • | current and projected grain inventories and prices, which are heavily influenced by United States exports and world-wide grain markets; and |
| • | United States governmental policies, including farm and biofuel policies, which may directly or indirectly influence the number of acres planted, the level of grain inventories, the mix of crops planted or crop prices. |
International market conditions, which are also outside of our control, may also significantly influence our operating results. The international market for nitrogen fertilizers is influenced by such factors as the relative value of the United States dollar and its impact upon the cost of importing nitrogen fertilizers, foreign agricultural policies, the existence of, or changes in, import or foreign currency exchange barriers in certain foreign markets, changes in the hard currency demands of certain countries and other regulatory policies of foreign governments, as well as the laws and policies of the United States affecting foreign trade and investment.
Ammonia can be very volatile and extremely hazardous. Any liability for accidents involving ammonia that cause severe damage to property or injury to the environment and human health could have a material adverse effect on our results of operations, financial condition and ability to make cash distributions. In addition, the costs of transporting ammonia could increase significantly in the future.
21
Table of Contents
We produce, process, store, handle, distribute and transport ammonia, which can be very volatile and extremely hazardous. Major accidents or releases involving ammonia could cause severe damage or injury to property, the environment and human health, as well as a possible disruption of supplies and markets. Such an event could result in civil lawsuits, fines, penalties and regulatory enforcement proceedings, all of which could lead to significant liabilities. Any damage to persons, equipment or property or other disruption of our ability to produce or distribute our products could result in a significant decrease in operating revenues and significant additional cost to replace or repair and insure our assets, which could have a material adverse effect on our results of operations, financial condition and ability to make cash distributions. We periodically experience minor releases of ammonia related to leaks from our equipment or error in operation and use of equipment at our facility. Similar events may occur in the future.
In some cases, we transport ammonia by railcar. We may incur significant losses or costs relating to the transportation of our products on railcars. Due to the dangerous and potentially toxic nature of the cargo, in particular ammonia, on board railcars, a railcar accident may result in fires, explosions and pollution. These circumstances may result in sudden, severe damage or injury to property, the environment and human health. In the event of pollution, we may be held responsible even if we are not at fault and even if we complied with the laws and regulations in effect at the time of the accident. Litigation arising from accidents involving ammonia may result in our being named as a defendant in lawsuits asserting claims for large amounts of damages, which could have a material adverse effect on our results of operations, financial condition and ability to make cash distributions. Given the risks inherent in transporting ammonia, the costs of transporting ammonia could increase significantly in the future. A number of initiatives are underway in the railroad and chemical industries that may result in changes to railcar design in order to minimize railway accidents involving hazardous materials. If any such design changes are implemented, or if accidents involving hazardous freight increase the insurance and other costs of railcars, our transportation costs could increase significantly. In addition, we believe that railroads are taking other actions, such as requiring indemnification from their customers for liabilities relating to TIH chemicals, to shift the risks they face from shipping TIH chemicals to their customers, which may make transportation of ammonia by rail more costly or less feasible.
We are subject to risks and uncertainties related to transportation and equipment that are beyond our control and that may have a material adverse effect on our results of operations, financial condition and ability to make distributions.
Although our customers generally pick up our products at our facility, we occasionally rely on barge and railroad companies to ship products to our customers. The availability of these transportation services and related equipment is subject to various hazards, including extreme weather conditions, work stoppages, delays, spills, derailments and other accidents and other operating hazards. For example, barge transport can be impacted by lock closures on the Upper Mississippi River resulting from inclement weather or surface conditions, including fog, rain, snow, wind, ice, strong currents, floods, droughts and other unplanned natural phenomena, lock malfunction, tow conditions and other conditions. In addition, we believe that railroads are taking other actions, such as requiring indemnification from their customers for liabilities relating to TIH chemicals, to shift the risks they face from shipping TIH chemicals to their customers, which may make transportation of ammonia by rail more costly. These transportation services and equipment are also subject to environmental, safety and other regulatory oversight. Due to concerns related to terrorism or accidents, local, state and federal governments could implement new regulations affecting the transportation of our products. In addition, new regulations could be implemented affecting the equipment used to ship our products. Any delay in our ability to ship our products as a result of transportation companies’ failure to operate properly, the implementation of new and more stringent regulatory requirements affecting transportation operations or equipment, or significant increases in the cost of these services or equipment could have a material adverse effect on our results of operations, financial condition and ability to make cash distributions.
Our business is subject to extensive and frequently changing environmental laws and regulations. We expect that the cost of compliance with these laws and regulations will increase over time, and we could become subject to material environmental liabilities.
Our business is subject to extensive and frequently changing federal, state and local environmental, health and safety regulations governing the emission and release of hazardous substances into the environment, the treatment and discharge of waste water and the storage, handling, use and transportation of our nitrogen fertilizer products. These laws include the CAA, the federal Clean Water Act, the Resource Conservation and Recovery Act, the CERCLA, the Toxic Substances Control Act, and various other federal, state and local laws and regulations. Violations of these laws and regulations could result in substantial penalties, injunctive orders compelling installation of additional controls, civil and criminal sanctions, permit revocations or facility shutdowns. In addition, new environmental laws and regulations, new interpretations of existing laws and regulations, increased governmental enforcement of laws and regulations or other developments could require us to make additional expenditures. Many of these laws and regulations are becoming increasingly stringent, and we expect the cost of compliance with these requirements to increase over time. The ultimate
22
Table of Contents
impact on our business of complying with existing laws and regulations is not always clearly known or determinable due in part to the fact that our operations may change over time and certain implementing regulations for laws, such as the CAA, have not yet been finalized, are under governmental or judicial review or are being revised. These expenditures or costs for environmental compliance could have a material adverse effect on our results of operations, financial condition and ability to make cash distributions.
Our operations require numerous permits and authorizations. Failure to comply with these permits or environmental laws generally could result in substantial fines, penalties or other sanctions, court orders to install pollution-control equipment, permit revocations and facility shutdowns. We may experience delays in obtaining or be unable to obtain required permits, which may delay or interrupt our operations and limit our growth and revenue.
Our business also is subject to accidental spills, discharges or other releases of hazardous substances into the environment. Past or future spills related to our facility or transportation of products or hazardous substances from our facility may give rise to liability (including strict liability, or liability without fault, and potential cleanup responsibility) to governmental entities or private parties under federal, state or local environmental laws, as well as under common law. For example, we could be held strictly liable under CERCLA, for past or future spills without regard to fault or whether our actions were in compliance with the law at the time of the spills. Pursuant to CERCLA and similar state statutes, we could be held liable for contamination associated with our facility, facilities we formerly owned or operated (if any) and facilities to which we transported or arranged for the transportation of wastes or byproducts containing hazardous substances for treatment, storage or disposal. The potential penalties and cleanup costs for past or future releases or spills, liability to third parties for damage to their property or exposure to hazardous substances, or the need to address newly discovered information or conditions that may require response actions could be significant and could have a material adverse effect on our results of operations, financial condition and ability to make cash distributions.
We may incur future costs relating to the off-site disposal of hazardous wastes. Companies that dispose of, or arrange for the transportation or disposal of, hazardous substances at off-site locations may be held jointly and severally liable for the costs of investigation and remediation of contamination at those off-site locations, regardless of fault. We could become involved in litigation or other proceedings involving off-site waste disposal and the damages or costs in any such proceedings could be material.
We may be unable to obtain or renew permits necessary for our operations, which could inhibit our ability to do business.
We hold numerous environmental and other governmental permits and approvals authorizing operations at our facility. Expansion of our operations is also predicated upon securing the necessary environmental or other permits or approvals. A decision by a government agency to deny or delay issuing a new or renewed material permit or approval, or to revoke or substantially modify an existing permit or approval, could have a material adverse effect on our ability to continue operations and on our business, financial condition, results of operations and ability to make cash distributions.
Environmental laws and regulations on fertilizer end-use and application and numeric nutrient water quality criteria could have a material adverse impact on fertilizer demand in the future.
Future environmental laws and regulations on the end-use and application of fertilizers could cause changes in demand for our products. In addition, future environmental laws and regulations, or new interpretations of existing laws or regulations, could limit our ability to market and sell our products to end users. From time to time, various state legislatures have proposed bans or other limitations on fertilizer products. In addition, a number of states have adopted or proposed numeric nutrient water quality criteria that could result in decreased demand for our fertilizer products in those states. Similarly, a new final EPA rule establishing numeric nutrient criteria for certain Florida water bodies may require farmers to implement best management practices, including the reduction of fertilizer use, to reduce the impact of fertilizer on water quality. Any such laws, regulations or interpretations could have a material adverse effect on our results of operations, financial condition and ability to make cash distributions.
Climate change laws and regulations could have a material adverse effect on our results of operations, financial condition and ability to make cash distributions.
Currently, various legislative and regulatory measures to address GHG emissions (including CO2, methane and nitrous oxides) are in various phases of discussion or implementation. At the federal legislative level, Congress has previously considered legislation requiring a mandatory reduction of GHG emissions. Although Congressional passage of such legislation does not appear likely at this time, it could be adopted at a future date. It is also possible that Congress may pass alternative climate change bills that do not mandate a nationwide cap-and-trade program and instead focus on promoting renewable energy and energy efficiency.
23
Table of Contents
In the absence of congressional legislation curbing GHG emissions, the EPA is moving ahead administratively under its CAA authority. In October 2009, the EPA finalized a rule requiring certain large emitters of GHGs to inventory and report their GHG emissions to the EPA. In accordance with the rule, we monitor our GHG emissions from our facility and began reporting the emissions to the EPA annually beginning in September 2011. On December 7, 2009, the EPA finalized its “endangerment finding” that GHG emissions, including CO2, pose a threat to human health and welfare. The finding allows the EPA to regulate GHG emissions as air pollutants under the CAA. In May 2010, the EPA finalized the “Greenhouse Gas Tailoring Rule,” which establishes new GHG emissions thresholds that determine when stationary sources, such as our facility, must obtain permits under the PSD, and Title V programs of the CAA. The permitting requirements of the PSD program apply only to newly constructed or modified major sources. Obtaining a PSD permit requires a source to install the BACT, for those regulated pollutants that are emitted in certain quantities. Phase I of the Greenhouse Gas Tailoring Rule, which became effective on January 2, 2011, requires projects already triggering PSD permitting that are also increasing GHG emissions by more than 75,000 tons per year to comply with BACT rules for their GHG emissions. Phase II of the Greenhouse Gas Tailoring Rule, which became effective on July 1, 2011, requires preconstruction permits using BACT for new projects that emit 100,000 tons of GHG emissions per year or existing facilities that make major modifications increasing GHG emissions by more than 75,000 tons per year. The ongoing ammonia capacity expansion project at our facility did not trigger the need to install BACT because actual construction was commenced prior to July 1, 2011 and is not considered a major modification with respect to criteria pollutants. However, a future major modification to our facility may require us to install BACT and potentially require us to obtain other CAA permits for our GHG emissions at our facility. The EPA’s endangerment finding, the Greenhouse Gas Tailoring Rule and certain other GHG emission rules have been challenged and will likely be subject to extensive litigation. In addition, a number of Congressional bills to overturn the endangerment finding and bar the EPA from regulating GHG emissions, or at least to defer such action by the EPA under the CAA, have been proposed, although President Obama has announced his intention to veto any such bills if passed.
In addition to federal regulations, a number of states have adopted regional GHG initiatives to reduce CO2 and other GHG emissions. In 2007, a group of Midwest states formed the Midwestern Greenhouse Gas Reduction Accord, which calls for the development of a cap-and-trade system to control GHG emissions and for the inventory of such emissions. However, the individual states that have signed on to the accord must adopt laws or regulations implementing the trading scheme before it becomes effective, and the timing and specific requirements of any such laws or regulations in Illinois are uncertain at this time.
The implementation of additional EPA regulations and/or the passage of federal or state climate change legislation will likely increase the costs we incur to (i) operate and maintain our facilities, (ii) install new emission controls on our facilities and (iii) administer and manage any GHG emissions program. Increased costs associated with compliance with any future legislation or regulation of GHG emissions, if it occurs, may have a material adverse effect on our results of operations, financial condition and ability to make cash distributions. In addition, climate change legislation and regulations may result in increased costs not only for our business but also for agricultural producers that utilize our fertilizer products, thereby potentially decreasing demand for our nitrogen fertilizer products. Decreased demand for our fertilizer products may have a material adverse effect on our results of operations, financial condition and ability to make cash distributions.
Agrium is a distributor and customer of a significant portion of our nitrogen fertilizer products, and we have the right to store products at Agrium’s terminal in Niota, Illinois. Any loss of Agrium as our distributor or customer, loss of our storage rights or decline in sales of products through or to Agrium could materially adversely affect our results of operations, financial condition and ability to make cash distributions.
We use Agrium as a distributor of a significant portion of our nitrogen fertilizer products pursuant to a distribution agreement between Agrium and us. For the last three fiscal years, between 80% and 85% of our total product sales were made through Agrium. Under the distribution agreement, if we are unable to reach an agreement with Agrium for the purchase and sale of our products, Agrium is under no obligation to make such purchase and sale. Agrium sells products that compete with ours, and may be incentivized to prioritize the sale of its products over ours. In the event of any decline in sales of our products through Agrium as distributor, we may not be able to find buyers for our products.
The distribution agreement has a term that ends in April 2016, but automatically renews for subsequent one-year periods (unless either party delivers a termination notice to the other party at least three months prior to an automatic renewal). The distribution agreement may be terminated prior to its stated term for specified causes. Under the distribution agreement, Agrium bears the credit risk on products sold through Agrium pursuant to the agreement. Agrium also is largely responsible for marketing our products to customers and the associated expense. As a result, if our distribution agreement with Agrium terminates for any reason, Agrium would no longer bear the credit risk on the sale of any of our products and we would become responsible for all of the marketing costs for our products.
24
Table of Contents
Under the distribution agreement, we have the right to store up to 15,000 tons of ammonia at Agrium’s terminal in Niota, Illinois, and we sell a portion of our ammonia at that terminal. Our right to store ammonia at the terminal expires on June 30, 2016, but automatically renews for successive one year periods, unless we deliver a termination notice to Agrium with respect to such storage rights at least three months prior to an automatic renewal. Our right to use the storage space immediately terminates if the distribution agreement terminates in accordance with its terms. Ammonia storage sites and terminals served by barge on the Mississippi River are controlled primarily by CF Industries, Koch and Agrium, each of which is one of our competitors. If we lose the right to store ammonia at the Niota, Illinois terminal, we may not be able to find suitable replacement storage on acceptable terms, or at all, and we may be forced to reduce production. We also may lose sales to customers that purchase products at the terminal.
In addition to distributing our products, Agrium is also one of our significant customers. For the fiscal years ended September 30, 2011, 2010 and 2009, approximately 3%, 7% and 0%, respectively, of our total product sales were to Agrium as a direct customer (rather than a distributor) and approximately 15%, 11% and 5%, respectively, of our total product sales were to CPS, a controlled affiliate of Agrium. Agrium or CPS could elect to reduce or cease purchasing our products for a number of reasons, especially if our relationship with Agrium as a distributor were to end. If our sales to Agrium as a direct customer or CPS decline, we may not be able to find other customers to purchase the excess supply of our products.
Sales of our products through or to Agrium could decline or the distribution agreement or our rights to storage could terminate as a result of a number of causes which are outside of our control. Any loss of Agrium as our distributor or customer, loss of our storage rights or decline in sales of products through Agrium could materially adversely affect our results of operations, financial condition and ability to make cash distributions.
New regulations concerning the transportation of hazardous chemicals, risks of terrorism and the security of chemical manufacturing facilities could result in higher operating costs.
The costs of complying with regulations relating to the transportation of hazardous chemicals and security associated with our facility may have a material adverse effect on our results of operations, financial condition and ability to make cash distributions to our unitholders. Targets such as chemical manufacturing facilities may be at greater risk of future terrorist attacks than other targets in the United States. The chemical industry has responded to the issues that arose in response to the terrorist attacks on September 11, 2001 by starting new initiatives relating to the security of chemical industry facilities and the transportation of hazardous chemicals in the United States. Future terrorist attacks could lead to even stronger, more costly initiatives. Simultaneously, local, state and federal governments have begun a regulatory process that could lead to new regulations impacting the security of chemical facility locations and the transportation of hazardous chemicals. Our business could be materially adversely affected by the cost of complying with new regulations.
We are largely dependent on our customers to transport purchased goods from our facility because we do not maintain a fleet of trucks or rail cars.
We do not maintain a fleet of trucks and, unlike some of our major competitors, we do not maintain a fleet of rail cars because our customers generally are located close to our facility and have been willing and able to transport purchased goods from our facility. In most instances, our customers purchase our nitrogen products FOB delivered basis at our facility and then arrange and pay to transport them to their final destinations by truck according to customary practice in our market. However, in the future, our customers’ transportation needs and preferences may change and our customers may no longer be willing or able to transport purchased goods from our facility. In the event that our competitors are able to transport their products more efficiently or cost effectively than our customers, those customers may reduce or cease purchases of our products. If this were to occur, we could be forced to make a substantial investment in a fleet of trucks and/or rail cars to meet our customers’ delivery needs, and this would be expensive and time consuming. We may not be able to obtain transportation capabilities on a timely basis or at all, and our inability to provide transportation for products could have a material adverse effect on our business, cash flow and ability to make distributions.
Due to our dependence on significant customers, the loss of one or more of our significant customers could adversely affect our results of operations and our ability to make distributions to our unitholders.
Our business depends on significant customers, and the loss of one or several significant customers may have a material adverse effect on our results of operations, financial condition and ability to make cash distributions to our unitholders. In the aggregate, our top five ammonia customers represented approximately 46%, 52% and 49%, respectively, of our ammonia sales for the fiscal years ended September 30, 2011, 2010 and 2009, and our top five UAN customers represented approximately 50% of our UAN sales for
25
Table of Contents
each of these fiscal years. In addition, Twin State accounted for approximately 6%, 10% and 11%, respectively, of our total product sales for the fiscal years ended September 30, 2011, 2010 and 2009. Growmark, accounted for approximately 7%, 8% and 11%, respectively, of our total product sales for the fiscal years ended September 30, 2011, 2010 and 2009. For the fiscal years ended September 30, 2011, 2010 and 2009, approximately 3%, 7% and 0%, respectively, of our total product sales were to Agrium as a direct customer (rather than a distributor) and approximately 15%, 11% and 5%, respectively, of our total product sales were to CPS, a controlled affiliate of Agrium. Given the nature of our business, and consistent with industry practice, we do not have long-term minimum purchase contracts with any of our customers. If our sales to any of our significant customers were to decline, we may not be able to find other customers to purchase the excess supply of our products. The loss of one or several of our significant customers, or a significant reduction in purchase volume by any of them, could have a material adverse effect on our results of operations, financial condition and ability to make cash distributions.
We are subject to strict laws and regulations regarding employee and process safety, and failure to comply with these laws and regulations could have a material adverse effect on our results of operations, financial condition and ability to make cash distributions.
We are subject to a number of federal and state laws and regulations related to safety, including OSHA and comparable state statutes, the purpose of which are to protect the health and safety of workers. In addition, OSHA requires that we maintain information about hazardous materials used or produced in our operations and that we provide this information to employees, state and local governmental authorities, and local residents. Failure to comply with OSHA requirements and other related state regulations, including general industry standards, record keeping requirements and monitoring and control of occupational exposure to regulated substances, could have a material adverse effect on our results of operations, financial condition and ability to make cash distributions if we are subjected to significant penalties, fines or compliance costs.
Our acquisition strategy involves significant risks.
One of our business strategies is to pursue acquisitions. However, acquisitions involve numerous risks and uncertainties, including intense competition for suitable acquisition targets, the potential unavailability of financial resources necessary to consummate acquisitions, difficulties in identifying suitable acquisition targets or in completing any transactions identified on sufficiently favorable terms; and the need to obtain regulatory or other governmental approvals that may be necessary to complete acquisitions. In addition, any future acquisitions may entail significant transaction costs, tax consequences and risks associated with entry into new markets and lines of business.
In addition to the risks involved in identifying and completing acquisitions described above, even when acquisitions are completed, integration of acquired entities can involve significant difficulties, such as:
| • | unforeseen difficulties in the acquired operations and disruption of the ongoing operations of our business; |
| • | failure to achieve cost savings or other financial or operating objectives with respect to an acquisition; |
| • | strain on the operational and managerial controls and procedures of our business, and the need to modify systems or to add management resources; |
| • | difficulties in the integration and retention of customers or personnel and the integration and effective deployment of operations or technologies; |
| • | assumption of unknown material liabilities or regulatory non-compliance issues; |
| • | amortization of acquired assets, which would reduce future reported earnings; |
| • | possible adverse short-term effects on our cash flows or operating results; and |
| • | diversion of management’s attention from the ongoing operations of our business. |
In addition, in connection with any potential acquisition, we will need to consider whether the business we intend to acquire could affect our tax treatment as a partnership for United States federal income tax purposes. See “—Tax Risks—Our tax treatment depends on our status as a partnership for United States federal income tax purposes, as well as our not being subject to a material
26
Table of Contents
amount of entity-level taxation by individual states. If the Internal Revenue Service were to treat us as a corporation for United States federal income tax purposes or if we were to become subject to additional amounts of entity-level taxation for state tax purposes, then our cash available for distribution to our unitholders would be substantially reduced.”
Failure to manage acquisition growth risks could have a material adverse effect on our results of operations, financial condition and ability to make cash distributions. There can be no assurance that we will be able to consummate any acquisitions, successfully integrate acquired entities, or generate positive cash flow at any acquired company.
There are significant risks associated with expansion projects that may prevent completion of those projects on budget, on schedule or at all.
We have commenced expansion projects at our facility. Expansion projects of the scope and scale we are undertaking or may undertake in the future entail significant risks, including:
| • | unforeseen engineering or environmental problems; |
| • | work stoppages; |
| • | weather interference; |
| • | unanticipated cost increases; |
| • | unavailability of necessary equipment; and |
| • | unavailability of financing on acceptable terms. |
Construction, equipment or staffing problems or difficulties in obtaining any of the requisite licenses, permits and authorizations from regulatory authorities could increase the total cost, delay or prevent the construction or completion of an expansion project.
In addition, we cannot assure you that we will have adequate sources of funding to undertake or complete major expansion projects, such as our ammonia capacity expansion project. Even with our $25 million revolving credit facility, we do not have sufficient borrowing capacity under that facility to finance the entire project and that facility is designed to provide for seasonal working capital needs only, not construction financing. As a result, we will need to obtain additional debt and/or equity financing to complete this project. There is no guarantee that we will be able to obtain other debt or equity financing on acceptable terms or at all.
As a result of these factors, we cannot assure you that our expansion projects will commence operations on schedule or at all or that the costs for the expansion projects will not exceed budgeted amounts. Failure to complete an expansion project on budget, on schedule or at all may adversely impact our ability to grow our business.
Expansion of our production capacity may reduce the overall demand for our existing products, and our new products may not achieve market acceptance.
To the extent we proceed with our expansion projects, we expect to increase our capacity to produce ammonia and urea and to install the equipment necessary to enable us to produce and sell DEF. Increased production of our existing products may reduce the overall demand for those products as a result of market saturation. We may be required to sell these products at lower prices, or may not be able to sell all of the products we produce. In addition, there can be no assurance that our new products will be well-received or that we will achieve revenues or profitability levels we expect. If we cannot sell our products or are forced to reduce the prices at which we sell them, this would have a material adverse effect on our results of operations, financial condition and the ability to make cash distributions to our unitholders.
We depend on key personnel for the success of our business.
We depend on the services of the executive officers of our general partner. The loss of the services of any member of our executive officer team could have an adverse effect on our business and reduce our ability to make cash distributions to our unitholders. We may not be able to locate or employ on acceptable terms qualified replacements for senior management or other key employees if our existing senior management’s or key employees’ services become unavailable.
27
Table of Contents
Certain members of our executive management team on whom we rely to manage important aspects of our business face conflicts regarding the allocation of their time.
We rely on the executive officers and employees of our general partner to manage our operations and activities. Certain of these executive officers and employees of our general partner perform services for Rentech in addition to us. These shared executive officers and employees include our chief executive officer, chief financial officer, president and general counsel. Because the shared officers and employees allocate time among us and Rentech, they may face conflicts regarding the allocation of their time, which may adversely affect our business, results of operations and financial condition.
A shortage of skilled labor, together with rising labor costs, could adversely affect our results of operations and cash available for distribution to our unitholders.
Efficient production of nitrogen fertilizer using modern techniques and equipment requires skilled employees. To the extent that the services of skilled labor becomes unavailable to us for any reason, including the retirement of experienced employees from our aging work force, we would be required to hire other personnel. We face hiring competition from our competitors, our customers and other companies operating in our industry, and we may not be able to locate or employ qualified replacements on acceptable terms or at all. If our current skilled employees retire and we are unable to locate or hire qualified replacements, or if the cost to locate and hire qualified replacements for retired employees increases materially, our results of operations and cash available for distribution to our unitholders could be adversely affected.
Our new revolving credit facility contains significant limitations on our business operations, including our ability to make distributions and other payments.
We have entered into a new revolving credit facility, which provides for revolving borrowing capacity of approximately $25.0 million. It permits us to incur significant indebtedness in the future, subject to the satisfaction of its conditions to borrowing. Our ability to make cash distributions to our unitholders and our ability to borrow under our new revolving credit facility to fund distributions (if we elected to do so) are subject to covenant restrictions under the agreements governing our new revolving credit facility. If we were unable to comply with any such covenant restrictions in any quarter, our ability to make cash distributions to our unitholders would be curtailed.
In addition, we are subject to covenants contained in our new revolving credit facility and may be subject to any agreement governing other future indebtedness. These covenants restrict our ability to, among other things, incur, assume or permit to exist additional indebtedness, guarantees and other contingent obligations, incur liens, make negative pledges, pay dividends or make other distributions, make payments to our subsidiaries, make certain loans and investments, consolidate, merge or sell all or substantially all of our assets, enter into sale-leaseback transactions and enter into transactions with our affiliates. Any failure to comply with these covenants could result in a default under our new revolving credit facility. Upon a default, unless waived, the lenders under our new revolving credit facility would have all remedies available to a secured lender, and could elect to terminate their commitments, cease making further loans, cause their loans to become due and payable in full, institute foreclosure proceedings against our assets, and force us into bankruptcy or liquidation.
We are a holding company and depend upon our subsidiary for our cash flow.
We are a holding company. All of our operations are conducted and all of our assets are owned by our operating company, which is our wholly owned subsidiary, and we intend to continue to conduct our operations at the operating company and any of our future subsidiaries. Consequently, our cash flow and our ability to meet our obligations or to make cash distributions depend upon the cash flow of our operating company and any of our future subsidiaries and the payment of funds by our operating company and any of our future subsidiaries to us in the form of dividends or otherwise. The ability of our operating company and any of our future subsidiaries to make any payments to us depend on their earnings, the terms of their indebtedness, including the terms of any credit facilities and legal restrictions. In particular, our new revolving credit facility imposes, and future credit facilities entered into by our operating company or any of our future subsidiaries may impose, significant limitations on the ability of our subsidiaries to make distributions to us and consequently our ability to make distributions to our unitholders.
28
Table of Contents
We have limited experience operating as a stand-alone company.
Because we did not operate as a stand-alone company until the closing of our initial public offering on November 9, 2011, it is difficult for you to evaluate our business and results of operations to date and to assess our future prospects and viability. Our facility commenced operations in 1965. Since 1987 and until the closing of our initial public offering, we operated as part of a larger company. The financial information reflecting our business contained in this report, including our historical financial information included herein, do not necessarily reflect what our operating performance would have been had we been a stand-alone company during the periods presented.
We will be exposed to risks relating to evaluations of controls required by Section 404 of the Sarbanes-Oxley Act.
We are in the process of evaluating our internal controls systems to allow management to report on, and our independent auditors to audit, our internal control over financial reporting. We will be performing the system and process evaluation and testing (and any necessary remediation) required to comply with the management certification and auditor attestation requirements of Section 404 of the Sarbanes-Oxley Act, and under current rules will be required to comply with Section 404 by no later than the time we file our annual report for the fiscal year ending September 30, 2012. Furthermore, upon completion of this process, we may identify control deficiencies of varying degrees of severity under applicable SEC and Public Company Accounting Oversight Board, or PCAOB, rules and regulations that remain unremediated. Although we produce our financial statements in accordance with generally accepted accounting principles in the United States, or GAAP, our internal accounting controls may not currently meet all standards applicable to companies with publicly traded securities. As a publicly traded limited partnership, we will be required to report, among other things, control deficiencies that constitute a “material weakness” or changes in internal controls that, or that are reasonably likely to, materially affect internal control over financial reporting. A “material weakness” is a deficiency, or a combination of deficiencies, in internal control over financial reporting, such that there is a reasonable possibility that a material misstatement of the annual or interim financial statements will not be prevented or detected on a timely basis.
If we fail to implement the requirements of Section 404 in a timely manner, we might be subject to sanctions or investigation by regulatory authorities such as the SEC. If we do not implement improvements to our disclosure controls and procedures or to our internal controls in a timely manner, our independent registered public accounting firm may not be able to report on the effectiveness of our internal control over financial reporting pursuant to an audit of our internal control over financial reporting. This may subject us to adverse regulatory consequences or a loss of investor confidence in the reliability of our financial statements. We could also suffer a loss of confidence in the reliability of our financial statements if our independent registered public accounting firm reports a material weakness or significant deficiency in our internal control, if we do not develop and maintain effective controls and procedures or if we are otherwise unable to deliver timely and reliable financial information. Any loss of confidence in the reliability of our financial statements or other negative reaction to our failure to develop timely or adequate disclosure controls and procedures or internal controls could result in a decline in the price of our common units. In addition, if we fail to remedy any material weakness, our financial statements may be inaccurate, we may face restricted access to the capital markets and the price of our common units may be materially adversely affected.
Our relationship with Rentech and its business, results of operations, financial condition and prospects subjects us to potential risks that are beyond our control.
Due to our relationship with Rentech, adverse developments or announcements concerning Rentech, its business, results of operations, financial condition or prospects could materially adversely affect our financial condition, even if we have not suffered any similar development. In addition, the credit and business risk profiles of Rentech may be factors considered in credit evaluations of us. Another factor that may be considered is the financial condition of Rentech, including the degree of its financial leverage and its dependence on cash flow from us to further its business strategy and continue its operations. Rentech is in the business of developing energy projects expected to produce certified synthetic fuels and electric power from carbon-containing materials such as biomass, waste and fossil resources. Rentech owns technologies that enable the production of such fuels and power when integrated with certain other technologies that it licenses or purchases. Rentech has a history of operating losses and has never operated at a profit. If Rentech does not achieve significant amounts of revenues and operate at a profit on an ongoing basis in the future, Rentech may be unable to continue its operations at its current level. Ultimately, Rentech’s ability to remain in business will depend upon earning a profit from commercialization of its technologies. Rentech has not been able to achieve sustained commercial use of these technologies as of this time. The credit and risk profile of Rentech could adversely affect our credit ratings and risk profile, which could increase our borrowing costs or hinder our ability to raise capital. Furthermore, financial constraints at Rentech may cause Rentech to make business decisions, including decisions to liquidate the common units that it holds in us or its interest in our general partner, which may adversely affect our business and the market price of our common units.
29
Table of Contents
Risks Related to an Investment in Us
We intend to distribute all of the cash available for distribution we generate each quarter, which could limit our ability to grow and make acquisitions.
Our policy is to distribute all of the cash available for distribution we generate each quarter to our unitholders. Our first distribution will take place following the first calendar quarter of 2012 and will equal cash available for distribution with respect to the period beginning on the closing date of our initial public offering and ending on March 31, 2012. Cash available for distribution for each quarter will be determined by the board of directors of our general partner following the end of such quarter. As a result, our general partner will rely primarily upon external financing sources, including commercial bank borrowings and the issuance of debt and equity securities by us, to fund our expansion capital expenditures, and accordingly, to the extent we are unable to finance growth externally, our cash distribution policy will significantly impair our ability to grow.
In addition, because we intend to distribute all of the cash available for distribution that we generate each quarter, our growth may not be as fast as that of businesses that reinvest their cash available for distribution to expand ongoing operations. To the extent we issue additional units in connection with any acquisitions or expansion capital expenditures, the payment of distributions on those additional units will decrease the amount we distribute on each outstanding unit. There are no limitations in our partnership agreement on our ability to issue additional units, including units ranking senior to the common units. The incurrence of additional commercial borrowings or other debt to finance our growth strategy would result in increased interest expense, which, in turn, would reduce the cash available for distribution that we have to distribute to our unitholders.
The board of directors and officers of our general partner have fiduciary duties to Rentech, and the interests of Rentech may differ significantly from, or conflict with, the interests of our public common unitholders.
Our general partner is responsible for managing us. Although our general partner has fiduciary duties to manage us in a manner that is in, or not opposed to, our best interests, the fiduciary duties are specifically limited by the express terms of our partnership agreement, and the directors and officers of our general partner also have fiduciary duties to manage our general partner in a manner beneficial to Rentech and its shareholders. The interests of Rentech and its shareholders may differ from, or conflict with, the interests of our common unitholders. In resolving these conflicts, our general partner may favor its own interests or the interests of holders of Rentech’s common stock over our interests and those of our common unitholders.
The potential conflicts of interest include, among others, the following:
| • | Neither our partnership agreement nor any other agreement requires the owners of our general partner to pursue a business strategy that favors us. The affiliates of our general partner have fiduciary duties to make decisions in their own best interests and in the best interest of holders of Rentech’s common stock, which may be contrary to our interests. In addition, our general partner is allowed to take into account the interests of parties other than us or our unitholders in resolving conflicts of interest, which has the effect of limiting its fiduciary duty to our unitholders. |
| • | Our general partner has limited its liability and reduced its fiduciary duties under our partnership agreement and has also restricted the remedies available to our unitholders for actions that, without the limitations, might constitute breaches of fiduciary duty. As a result of purchasing common units, unitholders consent to some actions and conflicts of interest that might otherwise constitute a breach of fiduciary or other duties under applicable state law. |
| • | The board of directors of our general partner will determine the amount and timing of asset purchases and sales, capital expenditures, borrowings, repayment of indebtedness and issuances of additional partner interests, each of which can affect the amount of cash that is available for distribution to our common unitholders. |
| • | Our partnership agreement does not restrict our general partner from causing us to pay it or its affiliates for any services rendered to us or entering into additional contractual arrangements with any of these entities on our behalf. There is no limitation on the amounts our general partner can cause us to pay it or its affiliates. |
| • | Our general partner may exercise its rights to call and purchase all of our common units if at any time it and its affiliates own more than 80% of our common units. |
| • | Our general partner controls the enforcement of obligations owed to us by it and its affiliates. In addition, our general partner determines whether to retain separate counsel or others to perform services for us. |
30
Table of Contents
| • | Our general partner determines which costs incurred by it and its affiliates are reimbursable by us. |
| • | Certain of the executive officers of our general partner, and the majority of the directors of our general partner, also serve as directors and/or executive officers of Rentech. The executive officers who work for both Rentech and our general partner, including our chief executive officer, chief financial officer, president and general counsel, divide their time between our business and the business of Rentech. These executive officers will face conflicts of interest from time to time in making decisions which may benefit either us or Rentech. |
Our partnership agreement limits the liability and reduces the fiduciary duties of our general partner and restricts the remedies available to us and our common unitholders for actions taken by our general partner that might otherwise constitute breaches of fiduciary duty.
Our partnership agreement limits the liability and reduces the fiduciary duties of our general partner, while also restricting the remedies available to our common unitholders for actions that, without these limitations and reductions, might constitute breaches of fiduciary duty. Delaware partnership law permits such contractual reductions of fiduciary duty. By purchasing common units, common unitholders consent to some actions that might otherwise constitute a breach of fiduciary or other duties applicable under state law. Our partnership agreement contains provisions that reduce the standards to which our general partner would otherwise be held by state fiduciary duty law. For example:
| • | Our partnership agreement provides that our general partner will not have any liability to us or our unitholders for decisions made in its capacity as general partner so long as it acted in good faith, meaning it subjectively believed that the decisions were in, or not opposed to, our best interests. |
| • | Our partnership agreement provides that the doctrine of corporate opportunity, or any analogous doctrine, shall not apply to our general partner. The owners of our general partner are permitted to engage in separate businesses which directly compete with us and are not required to share or communicate or offer any potential business opportunities to us even if the opportunity is one that we might reasonably have pursued. The partnership agreement provides that the owners of our general partner will not be liable to us or any unitholder for breach of any duty or obligation by reason of the fact that such person pursued or acquired for itself any business opportunity. |
| • | Our partnership agreement provides that our general partner and the officers and directors of our general partner will not be liable for monetary damages to us for any acts or omissions unless there has been a final and non-appealable judgment entered by a court of competent jurisdiction determining that our general partner or those persons acted in bad faith or engaged in fraud or willful misconduct or, in the case of a criminal matter, acted with knowledge that such person’s conduct was criminal. |
| • | Our partnership agreement generally provides that affiliate transactions and resolutions of conflicts of interest not approved by the conflicts committee of the board of directors of our general partner and not involving a vote of unitholders must be on terms no less favorable to us than those generally provided to or available from unrelated third parties or be “fair and reasonable.” In determining whether a transaction or resolution is “fair and reasonable,” our general partner may consider the totality of the relationship between the parties involved, including other transactions that may be particularly advantageous or beneficial to us. |
| • | Our partnership agreement provides that in resolving conflicts of interest, it will be conclusively deemed that in making its decision, the conflicts committee acted in good faith. |
By purchasing a common unit, a unitholder will become bound by the provisions of our partnership agreement, including the provisions described above.
Our partnership agreement permits our general partner to make a number of decisions in its individual capacity or in its sole discretion and, as such, our general partner has no duty or obligation to give any consideration to any interest of, or factors affecting, us, our affiliates or our common unitholders in making these decisions.
31
Table of Contents
Our partnership agreement contains provisions that permit our general partner to make a number of decisions in its individual capacity, as opposed to its capacity as our general partner, or in its sole discretion. This entitles our general partner to consider only the interests and factors that it desires, and it has no duty or obligation to give any consideration to any interest of, or factors affecting, us, our affiliates or our common unitholders. Decisions made by our general partner in its individual capacity or in its sole discretion will be made by RNHI as the sole member of our general partner, and not by the board of directors of our general partner. Examples include the exercise of the general partner’s call right, its voting rights with respect to any common units it may own, its registration rights and its determination whether or not to consent to any merger or consolidation or amendment to our partnership agreement. In effect, the standards to which our general partner would otherwise be held by state fiduciary duty law are reduced. By purchasing a common unit, a unitholder will become bound by the provisions of our partnership agreement, including the provisions described above.
RNHI has the power to appoint and remove our general partner’s directors.
RNHI has the power to appoint and remove all of the members of the board of directors of our general partner. Our general partner has control over all decisions related to our operations. Our public unitholders do not have an ability to influence any operating decisions and will not be able to prevent us from entering into any transactions. Furthermore, the goals and objectives of Rentech, as the indirect owner of our general partner, may not be consistent with those of our public unitholders.
Common units are subject to our general partner’s call right.
If at any time our general partner and its affiliates own more than 80% of our common units, our general partner will have the right, which it may assign to any of its affiliates or to us, but not the obligation, to purchase all, but not less than all, of the common units held by public unitholders at a price not less than their then-current market price, as calculated pursuant to the terms of our partnership agreement. As a result, you may be required to sell your common units at an undesirable time or price and may not receive any return on your investment. You may also incur a tax liability upon a sale of your common units. Our general partner is not obligated to obtain a fairness opinion regarding the value of the common units to be repurchased by it upon exercise of the call right. There is no restriction in our partnership agreement that prevents our general partner from issuing additional common units and then exercising its call right. Our general partner may use its own discretion, free of fiduciary duty restrictions, in determining whether to exercise this right.
Our unitholders have limited voting rights and are not entitled to elect our general partner or our general partner’s directors.
Unlike the holders of common stock in a corporation, our unitholders have only limited voting rights on matters affecting our business and, therefore, limited ability to influence management’s decisions regarding our business. Unitholders will have no right to elect our general partner or our general partner’s board of directors on an annual or other continuing basis. The board of directors of our general partner, including the independent directors, will be chosen entirely by Rentech as the indirect owner of the general partner and not by our common unitholders. Unlike publicly traded corporations, we will not hold annual meetings of our unitholders to elect directors or conduct other matters routinely conducted at annual meetings of shareholders. Furthermore, even if our unitholders are dissatisfied with the performance of our general partner, they will have no practical ability to remove our general partner. As a result of these limitations, the price at which the common units will trade could be diminished.
Our public unitholders will not have sufficient voting power to remove our general partner without Rentech’s consent.
Rentech indirectly owns approximately 60.8% of our common units. Our general partner may be removed by a vote of the holders of at least 662/3% of our outstanding common units, including any common units held by our general partner and its affiliates (including Rentech), voting together as a single class. As a result, holders of common units purchased in our initial public offering are not able to remove the general partner, under any circumstances, unless Rentech sells some of the common units that it owns or we sell additional units to the public.
Our partnership agreement restricts the voting rights of unitholders owning 20% or more of our common units (other than our general partner and its affiliates and permitted transferees).
Our partnership agreement restricts unitholders’ voting rights by providing that any units held by a person that owns 20% or more of any class of units then outstanding, other than our general partner, its affiliates, their transferees and persons who acquired such units with the prior approval of the board of directors of our general partner, may not vote on any matter. Our partnership agreement also contains provisions limiting the ability of common unitholders to call meetings or to acquire information about our operations, as well as other provisions limiting the ability of our common unitholders to influence the manner or direction of management.
32
Table of Contents
Cost reimbursements due to our general partner and its affiliates will reduce cash available for distribution to you.
Prior to making any distribution on our outstanding units, we will reimburse our general partner for all expenses it incurs on our behalf including, without limitation, our pro rata portion of management compensation and overhead charged by Rentech in accordance with our services agreement. The services agreement does not contain any cap on the amount we may be required to pay pursuant to this agreement. The payment of these amounts, including allocated overhead, to our general partner and its affiliates could adversely affect our ability to make distributions to you.
Limited partners may not have limited liability if a court finds that unitholder action constitutes control of our business.
A general partner of a partnership generally has unlimited liability for the obligations of the Partnership, except for those contractual obligations of the Partnership that are expressly made without recourse to the general partner. Our Partnership is organized under Delaware law and our operating company conducts business in Illinois. Limited partners could be liable for our obligations as if such limited partners were general partners if a court or government agency determined that:
| • | we were conducting business in a state but had not complied with that particular state’s partnership statute; or |
| • | limited partners’ right to act with other unitholders to remove or replace our general partner, to approve some amendments to our partnership agreement or to take other actions under our partnership agreement constituted “control” of our business. |
Unitholders may have liability to repay distributions.
In the event that: (i) we make distributions to our unitholders when our nonrecourse liabilities exceed the sum of (a) the fair market value of our assets not subject to recourse liability and (b) the excess of the fair market value of our assets subject to recourse liability over such liability, or a distribution causes such a result, and (ii) a unitholder knows at the time of the distribution of such circumstances, such unitholder will be liable for a period of three years from the time of the impermissible distribution to repay the distribution under Section 17-607 of the Delaware Act.
Likewise, upon the winding up of the Partnership, in the event that (a) we do not distribute assets in the following order: (i) to creditors in satisfaction of their liabilities; (ii) to partners and former partners in satisfaction of liabilities for distributions owed under our partnership agreement; (iii) to partners for the return of their contribution; and (iv) to the partners in the proportions in which the partners share in distributions, and (b) a unitholder knows at the time of such circumstances, then such unitholder will be liable for a period of three years from the impermissible distribution to repay the distribution under Section 17-807 of the Delaware Act.
A purchaser of common units who becomes a limited partner is liable for the obligations of the transferring limited partner to make contributions to the Partnership that are known by the purchaser at the time it became a limited partner, and for unknown obligations if the liabilities could be determined from our partnership agreement.
Our unitholders who fail to furnish certain information requested by our general partner or who our general partner, upon receipt of such information, determines are not eligible citizens may not be entitled to receive distributions in kind upon our liquidation and their common units will be subject to redemption.
Our general partner may require each limited partner to furnish information about his nationality, citizenship or related status. If a limited partner fails to furnish information about his nationality, citizenship or other related status within a reasonable period after a request for the information or our general partner determines after receipt of the information that the limited partner is not an eligible citizen, the limited partner may be treated as an ineligible holder. An ineligible holder does not have the right to direct the voting of his common units and may not receive distributions in kind upon our liquidation. Furthermore, we have the right to redeem all of the common units of any holder that is an ineligible holder. The redemption price will be paid in cash or by delivery of a promissory note, as determined by our general partner.
Common units held by persons who are non-taxpaying assignees will be subject to the possibility of redemption.
To avoid any adverse effect on the maximum applicable rates chargeable to customers by us under certain laws or regulations that may be applicable to our future business or operations, or in order to reverse an adverse determination that has occurred regarding such maximum rate, our partnership agreement gives our general partner the power to amend the agreement. If our general partner
33
Table of Contents
determines that our not being treated as an association taxable as a corporation or otherwise taxable as an entity for U.S. federal income tax purposes, coupled with the tax status (or lack of proof thereof) of one or more of our limited partners, has, or is reasonably likely to have, a material adverse effect on the maximum applicable rates chargeable to customers by us, then our general partner may adopt such amendments to our partnership agreement as it determines are necessary or advisable to obtain proof of the U.S. federal income tax status of our limited partners (and their owners, to the extent relevant) and permit us to redeem the common units held by any person whose tax status has or is reasonably likely to have a material adverse effect on the maximum applicable rates or who fails to comply with the procedures instituted by our general partner to obtain proof of the U.S. federal income tax status.
Our general partner’s interest in us and the control of our general partner may be transferred to a third party without unitholder consent.
Our general partner may transfer its general partner interest in us to a third party in a merger or in a sale of all or substantially all of its assets without the consent of the unitholders. Furthermore, there is no restriction in our partnership agreement on the ability of RNHI to transfer its equity interest in our general partner to a third party. The new equity owner of our general partner would then be in a position to replace the board of directors and the officers of our general partner with its own choices and to influence the decisions taken by the board of directors and officers of our general partner.
Increases in interest rates could adversely impact our unit price and our ability to issue additional equity to make acquisitions, incur debt or for other purposes.
We cannot predict how interest rates will react to changing market conditions. Interest rates on our new revolving credit facility and future credit facilities and debt securities could be higher than current levels, causing our financing costs to increase accordingly. Additionally, as with other yield-oriented securities, we expect that our unit price will be impacted by the level of our quarterly cash distributions and implied distribution yield. The distribution yield is often used by investors to compare and rank related yield-oriented securities for investment decision-making purposes. Therefore, changes in interest rates may affect the yield requirements of investors who invest in our common units, and a rising interest rate environment could have a material adverse impact on our unit price and our ability to issue additional equity to make acquisitions or to incur debt as well as increasing our interest costs.
We may issue additional common units and other equity interests without your approval, which would dilute your existing ownership interests.
Under our partnership agreement, we are authorized to issue an unlimited number of additional interests without a vote of the unitholders. The issuance by us of additional common units or other equity interests of equal or senior rank will have the following effects:
| • | the proportionate ownership interest of unitholders immediately prior to the issuance will decrease; |
| • | the amount of cash distributions on each unit will decrease; |
| • | the ratio of our taxable income to distributions may increase; |
| • | the relative voting strength of each previously outstanding unit will be diminished; and |
| • | the market price of the common units may decline. |
In addition, our partnership agreement does not prohibit the issuance by our subsidiaries of equity interests, which may effectively rank senior to the common units.
The level of indebtedness we could incur in the future could adversely affect our ability to raise additional capital to fund our operations, limit our ability to react to changes in the economy or our industry and prevent us from meeting our obligations.
We have entered into a new revolving credit facility to provide for revolving borrowing capacity of $25.0 million. In addition, we currently intend to finance substantially all of the cost of our ammonia capacity expansion project with debt financing that we will seek to obtain. The level of indebtedness we could incur in the future could have important consequences, including:
34
Table of Contents
| • | increasing our vulnerability to general economic and industry conditions; |
| • | requiring all or a substantial portion of our cash flow from operations to be dedicated to the payment of principal and interest on our indebtedness, therefore restricting or reducing our ability to use our cash flow to make distributions or to fund our operations, capital expenditures and future business opportunities; |
| • | limiting our ability to obtain additional financing for working capital, capital expenditures, debt service requirements, acquisitions and general corporate or other purposes; |
| • | incurring higher interest expense in the event of increases in our new revolving credit facility’s variable interest rates; |
| • | limiting our ability to adjust to changing market conditions and placing us at a competitive disadvantage compared to our competitors who have greater capital resources; |
| • | limiting our ability to make investments, dispose of assets, pay cash distributions or repurchase common units; and |
| • | subjecting us to financial and other restrictive covenants in our indebtedness, which may restrict our activities, and the failure to comply with which could result in an event of default. |
Our ability to make scheduled debt payments, to refinance our obligations with respect to our indebtedness and to fund capital and non-capital expenditures necessary to maintain the condition of our operating assets and properties, as well as to provide capacity for the growth of our business, depends on our financial and operating performance, which, in turn, is subject to prevailing economic conditions and financial, business, competitive, legal and other factors.
If our cash flow and capital resources are insufficient to fund our debt service obligations, we may be forced to reduce distributions, reduce or delay capital expenditures, acquisitions, investments or other business activities, sell assets, seek additional capital or restructure or refinance our indebtedness. These alternative measures may not be successful and may not permit us to meet our scheduled debt service obligations. Failure to pay our indebtedness on time would constitute an event of default under the agreements governing our indebtedness, which would give rise to our lenders’ ability to accelerate the obligations and seek other remedies against us.
Tax Risks
Our tax treatment depends on our status as a partnership for United States federal income tax purposes, as well as our not being subject to a material amount of entity-level taxation by individual states. If the Internal Revenue Service were to treat us as a corporation for United States federal income tax purposes or if we were to become subject to additional amounts of entity-level taxation for state tax purposes, then our cash available for distribution to our unitholders would be substantially reduced.
The anticipated after-tax economic benefit of an investment in our common units depends largely on our being treated as a partnership for United States federal income tax purposes. We have not requested, and do not plan to request, a ruling from the Internal Revenue Service, or the IRS, on that or any other tax matter affecting us.
Despite the fact that we are a limited partnership under Delaware law, it is possible in certain circumstances for a partnership such as ours to be treated as a corporation for United States federal income tax purposes. A change in our current business or a change in current law could cause us to be treated as a corporation for federal income tax purposes or otherwise subject us to taxation as an entity.
If we were treated as a corporation for United States federal income tax purposes, we would pay United States federal income tax on all of our taxable income at the corporate tax rate, which is currently a maximum of 35%, and would likely pay additional state and local income tax at varying rates. Distributions to our unitholders would generally be taxed again as corporate distributions, and no income, gains, losses, deductions or credits would flow through to our unitholders. Because a tax would be imposed upon us as a corporation, our cash available for distribution to our unitholders would be substantially reduced. Therefore, treatment of us as a corporation for United States federal income tax purposes would result in a material reduction in the anticipated cash flow and after-tax return to our unitholders, likely causing a substantial reduction in the value of our common units.
35
Table of Contents
Changes in current state law may subject us to additional entity-level taxation by individual states. Several states are evaluating ways to subject partnerships to entity-level taxation through the imposition of state income, franchise or other forms of taxation. Imposition of such a tax by any state in which we do business will reduce our cash available for distribution to our unitholders.
The tax treatment of publicly traded limited partnerships or an investment in our common units could be subject to potential legislative, judicial or administrative changes and differing interpretations, possibly on a retroactive basis.
The present United States federal income tax treatment of publicly traded limited partnerships, including us, or an investment in our common units may be modified by administrative, legislative or judicial interpretation at any time. Current law may change to cause us to be treated as a corporation for United States federal income tax purposes or otherwise subject us to entity-level taxation. For example, members of Congress have considered substantive changes to the existing United States federal income tax laws that affect publicly traded limited partnerships. Any modification to the United States federal income tax laws and interpretations thereof may or may not be applied retroactively. We are unable to predict whether any of these changes or other proposals will ultimately be enacted. Any such changes could cause a substantial reduction in the value of our common units.
If the IRS contests any of the United States federal income tax positions we take, the market for our common units may be materially and adversely impacted, and the cost of any IRS contest will reduce our cash available for distribution to our unitholders.
We have not requested, and do not plan to request, a ruling from the IRS with respect to our treatment as a partnership for United States federal income tax purposes or any other matter affecting us. The IRS may adopt positions that differ from the positions we take, and the IRS’s positions may ultimately be sustained. It may be necessary to resort to administrative or court proceedings to sustain some or all of the positions we take. A court may not agree with some or all of the positions we take. Any contest with the IRS may materially and adversely impact the market for our common units and the price at which they trade. In addition, our costs of any contest with the IRS will be borne indirectly by our unitholders because the costs will reduce our cash available for distribution.
Unitholders’ share of our income will be taxable for United States federal income tax purposes even if they do not receive any cash distributions from us.
Because our unitholders will be treated as partners to whom we will allocate taxable income that could be different in amount than the cash we distribute, a unitholder’s allocable share of our taxable income will be taxable to him, which may require the payment of United States federal income taxes and, in some cases, state and local income taxes on his share of our taxable income, even if he receives no cash distributions from us. Unitholders may not receive cash distributions from us equal to their share of our taxable income or even equal to the actual tax liability that results from that income.
Tax gain or loss on the disposition of our common units could be more or less than expected.
If our unitholders sell common units, they will recognize a gain or loss for United States federal income tax purposes equal to the difference between the amount realized and their tax basis in those common units. Because distributions in excess of their allocable share of our net taxable income decrease their tax basis in their common units, the amount, if any, of such prior excess distributions with respect to the common units our unitholders sell will, in effect, become taxable income to our unitholders if they sell such common units at a price greater than their tax basis in those common units, even if the price they receive is less than their original cost. Furthermore, a substantial portion of the amount realized on any sale of a unitholder’s common units, whether or not representing gain, may be taxed as ordinary income due to potential recapture items, including depreciation recapture. In addition, because the amount realized includes a unitholder’s share of our nonrecourse liabilities, if our unitholders sell common units, they may incur a tax liability in excess of the amount of cash the unitholders receive from the sale.
Tax-exempt entities and non-U.S. persons face unique tax issues from owning our common units that may result in adverse tax consequences to them.
Investment in our common units by tax-exempt entities, such as employee benefit plans and individual retirement accounts (known as IRAs), and non-U.S. persons, raises issues unique to them. For example, virtually all of our income allocated to organizations that are exempt from United States federal income tax, including IRAs and other retirement plans, will be unrelated business taxable income and will be taxable to them. Distributions to non-U.S. persons will be reduced by withholding taxes, generally at the highest applicable effective tax rate, and non-U.S. persons will be required to file United States federal and state income tax returns and pay United States federal and state tax on their share of our taxable income. Unitholders that are tax-exempt entities or non-U.S. persons should consult their tax advisors before investing in our common units.
36
Table of Contents
We will treat each purchaser of our common units as having the same tax benefits without regard to the actual common units purchased. The IRS may challenge this treatment, which could adversely affect the value of our common units.
Due to our inability to match transferors and transferees of common units and for other reasons, we will adopt depreciation and amortization positions that may not conform to all aspects of existing Treasury Regulations promulgated under the Internal Revenue Code, referred to as “Treasury Regulations.” A successful IRS challenge to those positions could adversely affect the amount of tax benefits available to our unitholders. It also could affect the timing of these tax benefits or the amount of gain from a unitholder’s sale of common units and could cause a substantial reduction in the value of our common units or result in audit adjustments to our unitholders’ tax returns.
We will prorate our items of income, gain, loss and deduction, for United States federal income tax purposes, between transferors and transferees of our common units each month based upon the ownership of our common units on the first day of each month, instead of on the basis of the date a particular common unit is transferred. The IRS may challenge this treatment, which could change the allocation of items of income, gain, loss and deduction among our unitholders.
We will prorate our items of income, gain, loss and deduction between transferors and transferees of our common units each month based upon the ownership of our common units on the first day of each month, instead of on the basis of the date a particular common unit is transferred. The use of this proration method may not be permitted under existing Treasury Regulations. If the IRS were to challenge our proration method or new Treasury Regulations were issued requiring a change, we may be required to change the allocation of items of income, gain, loss and deduction among our unitholders.
A unitholder whose common units are loaned to a “short seller” to effect a short sale of common units may be considered as having disposed of those common units. If so, the unitholder would no longer be treated for United States federal income tax purposes as a partner with respect to those common units during the period of the loan and may recognize gain or loss from the disposition.
Because a unitholder whose common units are loaned to a “short seller” to effect a short sale of common units may be considered as having disposed of the loaned common units, he may no longer be treated for United States federal income tax purposes as a partner with respect to those common units during the period of the loan to the short seller and the unitholder may recognize gain or loss from such disposition. Moreover, during the period of the loan to the short seller, any of our income, gain, loss or deduction with respect to those common units may not be reportable by the unitholder and any cash distributions received by the common unitholder as to those common units could be fully taxable as ordinary income.
The sale or exchange of 50% or more of our capital and profits interests during any 12-month period will result in the termination of the Partnership for United States federal income tax purposes.
We will be considered to have technically terminated the Partnership for United States federal income tax purposes if there is a sale or exchange of 50% or more of the total interests in our capital and profits within a 12-month period. For purposes of determining whether the 50% threshold has been met, multiple sales of the same common unit will be counted only once. While we would continue our existence as a Delaware limited partnership, our technical termination would, among other things, result in the closing of our taxable year for all unitholders, which would result in us filing two tax returns (and our unitholders could receive two Schedules K-1 if relief was not available, as described below) for one fiscal year and could result in a significant deferral of depreciation deductions allowable in computing our taxable income. In the case of a unitholder reporting on a taxable year other than a fiscal year ending December 31, the closing of our taxable year may also result in more than 12 months of our taxable income or loss being includable in his taxable income for the year of termination. A technical termination currently would not affect our classification as a partnership for United States federal income tax purposes, but instead, we would be treated as a new partnership for such tax purposes. If treated as a new partnership, we must make new tax elections and could be subject to penalties if we are unable to determine that a technical termination occurred. The IRS has recently announced a publicly traded limited partnership relief procedure whereby a publicly traded limited partnership that has technically terminated may request special relief that, if granted, would, among other things, permit the Partnership to provide only a single Schedule K-1 to unitholders for the tax year notwithstanding two partnership tax years.
37
Table of Contents
Unitholders will likely be subject to state and local taxes and return filing requirements in jurisdictions where they do not live as a result of investing in our common units.
In addition to United States federal income taxes, unitholders will likely be subject to other taxes, including state and local taxes, unincorporated business taxes and estate, inheritance or intangible taxes that are imposed by the various jurisdictions in which we do business or control property now or in the future, even if they do not live in any of those jurisdictions. Unitholders will likely be required to file state and local income tax returns and pay state and local income taxes in some or all of these various jurisdictions. Further, unitholders may be subject to penalties for failure to comply with those requirements. We currently own assets and conduct business in the State of Illinois, and the State of Illinois currently imposes a personal income tax on individuals. The State of Illinois also imposes an income tax on corporations and other entities. As we make acquisitions or expand our business, we may own or control assets or conduct business in additional states that impose a personal income tax. It is the responsibility of each unitholder to file all United States federal, state, local and non-U.S. tax returns.
ITEM 1B. UNRESOLVED STAFF COMMENTS
Not Applicable.
The information required to be disclosed in this Item 2 is incorporated herein by reference to Part I—Item 1 “Business.”
We are party to litigation from time to time in the normal course of business. We maintain insurance to cover certain actions and believe that resolution of our current litigation will not have a material adverse effect on us.
In October 2009, the EPA Region 5 issued a Notice and Finding of Violation pursuant to the CAA related to the number 1 nitric acid plant at our facility. The notice alleges violations of the CAA’s New Source Performance Standard for nitric acid plants, Prevention of Significant Deterioration requirements and Title V Permit Program requirements. The notice appears to be part of the EPA’s Clean Air Act National Enforcement Priority for New Source Review/Prevention of Significant Deterioration related to acid plants, which seeks to reduce emissions from acid plants through proceedings that result in the installation of new pollution control technology. Without admitting liability, we have negotiated a consent decree (the “Consent Decree”) with the EPA to resolve the alleged violations, and the Consent Decree has been lodged with the court. The Consent Decree requires us to pay a civil penalty of $108,000, install and operate certain pollution control equipment on one of our nitric acid plants, and to perform certain additional actions and periodically report to the EPA. We have commenced implementation of the Consent Decree requirements, including the installation and operation of the pollution control equipment, in anticipation of the court entering the Consent Decree.
ITEM 4. (REMOVED AND RESERVED)
38
Table of Contents
| ITEM 5. | MARKET FOR REGISTRANT’S COMMON UNITS, RELATED UNITHOLDER MATTERS AND ISSUER PURCHASES OF COMMON UNITS |
Our common units began trading on the New York Stock Exchange under the symbol “RNF” on November 4, 2011. On November 30, 2011, the closing price for our common units was $19.00 per unit. The approximate number of unitholders of record as of November 30, 2011 was two. Based upon the securities position listings maintained for our common units by registered clearing agencies, we estimate the number of beneficial owners is not less than 5,800.
Our policy is to distribute all of the cash available for distribution which we generate each quarter to our unitholders. Our first distribution will take place following the first calendar quarter of 2012 and will equal cash available for distribution with respect to the period beginning on the closing date of our initial public offering and ending on March 31, 2012. Cash available for distribution for each quarter will be determined by the board of directors of our general partner following the end of each quarter. We expect that cash available for distribution for each quarter will generally equal the cash we generate during the quarter, less cash needed for maintenance capital expenditures, debt service and other contractual obligations, and reserves for future operating or capital needs that the board of directors of our general partner deems necessary or appropriate. We do not intend to maintain excess distribution coverage for the purpose of maintaining stability or growth in our quarterly distribution or otherwise to reserve cash for distributions, nor do we intend to incur debt to pay quarterly distributions. Any distributions made to our unitholders will be done on a pro rata basis.
Our new revolving credit facility provides that dividends and distributions from us and our operating company are permitted so long as (1) no default or event of default exists or will result therefrom and (2) our operating company delivers a certificate to the administrative agent under the new revolving credit facility certifying compliance with the terms of the new revolving credit facility, including its financial covenants, as of the date of such dividend or distribution.
We may change our distribution policy at any time and from time to time. Our partnership agreement does not require us to pay cash distributions on a quarterly or other basis.
We intend to pay our distributions on or about the 15th day of each February, May, August and November to holders of record on or about the 1st day of each such month.
Equity Compensation Plan Information
See Part III—Item 12 “Security Ownership of Certain Beneficial Owners and Management and Related Unitholder Matters” for information regarding securities authorized for issuance under equity compensation plans.
Recent Sales of Unregistered Securities
On July 8, 2011, in connection with our formation, we issued (i) to our general partner the general partner interest in us and (ii) to RDC the limited partner interest in us for $980 in an offering exempt from registration under Section 4(2) of the Securities Act. On September 21, 2011, RDC contributed its limited partner interest in us to RNHI. On November 9, 2011, in connection with our initial public offering, RNHI contributed its member interests in our operating company to us and, in exchange, we issued to RNHI 23,250,000 common units representing limited partner interests.
Use of Proceeds from Registered Securities
On November 9, 2011, we completed our initial public offering of common units pursuant to a Registration Statement on Form S-1, as amended (Reg. No. 333-176065), that was declared effective on November 3, 2011. Under the registration statement, we sold an aggregate of 15,000,000 common units to the public at a price of $20.00 per common unit. As a result of our initial public offering, we raised a total of $300 million in gross proceeds, and approximately $275.0 million in net proceeds after deducting underwriting discounts and commissions of $21.0 million and offering expenses of approximately $4.0 million. Our initial public offering was made through an underwriting agreement led by Morgan Stanley & Co. LLC and Credit Suisse Securities (USA) LLC.
39
Table of Contents
Upon closing of our initial public offering, we paid total distributions to Rentech of approximately $137.0 million from proceeds of our initial public offering and cash on hand, and we had approximately $50.0 million of cash following such distributions. Transactions in connection with closing of our initial public offering are detailed below. We:
| • | used approximately $150.8 million of the net proceeds of our initial public offering to make a capital contribution to our operating company for the repayment in full and termination of our operating company’s term loan and the payment of related fees and expenses; |
| • | used approximately $34.7 million of the net proceeds of our initial public offering to make a distribution to RNHI to reimburse it for expenditures made by our operating company during the two-year period preceding our initial public offering for the expansion and improvement of its facility, including expenditures for preliminary work relating to its expansion projects; for federal income tax purposes, when REMC converted to a limited liability company, RNHI was treated as having been the party that made such expenditures with respect to our operating company’s facility; |
| • | will use approximately $1.1 million of the net proceeds of our initial public offering for the payment of expenditures related to the replacement of our operating company’s steam methane reformer tubes; |
| • | will use approximately $5.5 million of the net proceeds of our initial public offering for the payment of expenditures related to our operating company’s urea expansion and DEF build-out project; |
| • | will use approximately $0.6 million of the net proceeds of our initial public offering for the payment of expenditures related to FEED for our operating company’s ammonia capacity expansion project; |
| • | will use approximately $40.0 million of the net proceeds of our initial public offering for general working capital purposes; and |
| • | used the balance of the net proceeds of our initial public offering, less unpaid transaction expenses, to make a distribution to RNHI in the amount of approximately $43.5 million. |
Purchases of Equity Securities by the Issuer
We did not repurchase any of our common units during the fourth quarter of fiscal 2011, and we do not have any announced or existing plans to repurchase any of our common units.
40
Table of Contents
ITEM 6. SELECTED FINANCIAL DATA
Set forth below is selected summary financial data for REMC as of the dates and for the periods indicated.
The selected financial information presented below under the caption “Statements of Operations Data” for the fiscal years ended September 30, 2011, 2010 and 2009 and the selected financial information presented below under the caption “Balance Sheet Data” as of September 30, 2011 and 2010 have been derived from REMC’s audited financial statements included elsewhere in this report. The selected financial information presented below under the caption “Statements of Operations Data” for the fiscal year ended September 30, 2008 and the selected financial information presented below under the caption “Balance Sheet Data” as of September 30, 2009 and 2008 have been derived from REMC’s audited financial statements that are not included in this report. The selected financial information presented below under the caption “Statements of Operations Data” for the fiscal year ended September 30, 2007 and the selected financial information presented below under the caption “Balance Sheet Data” as of September 30, 2007 have been derived from REMC’s unaudited condensed financial statements that are not included in this report.
The data below should be read in conjunction with Part II—Item 7 “Management’s Discussion and Analysis of Financial Condition and Results of Operations” and Part II—Item 8 “Financial Statements and Supplementary Data.”
| Fiscal Years Ended September 30, | ||||||||||||||||||||
| 2011 | 2010 | 2009 | 2008 | 2007 | ||||||||||||||||
| (in thousands, except per share data) | ||||||||||||||||||||
| STATEMENTS OF OPERATIONS DATA |
||||||||||||||||||||
| Revenues |
$ | 179,857 | $ | 131,396 | $ | 186,449 | $ | 216,615 | $ | 134,419 | ||||||||||
| Cost of sales |
$ | 103,286 | $ | 106,020 | $ | 125,888 | $ | 160,633 | $ | 118,510 | ||||||||||
| Gross profit |
$ | 76,571 | $ | 25,376 | $ | 60,561 | $ | 55,982 | $ | 15,909 | ||||||||||
| Operating income |
$ | 69,854 | $ | 20,389 | $ | 55,313 | $ | 51,752 | $ | 10,219 | ||||||||||
| Other income (expenses), net |
$ | (27,513 | ) | $ | (12,036 | ) | $ | (8,578 | ) | $ | (1,779 | ) | $ | 753 | ||||||
| Income before income taxes |
$ | 42,341 | $ | 8,353 | $ | 46,735 | $ | 49,973 | $ | 10,972 | ||||||||||
| Income tax expense |
$ | 17,415 | $ | 3,344 | $ | 18,576 | $ | 19,875 | $ | 4,367 | ||||||||||
| Net income |
$ | 24,926 | $ | 5,009 | $ | 28,159 | $ | 30,098 | $ | 6,605 | ||||||||||
| FINANCIAL AND OTHER DATA |
||||||||||||||||||||
| Cash flows provided by operating activities |
$ | 83,668 | $ | 20,144 | $ | 23,867 | $ | 61,962 | $ | 31,185 | ||||||||||
| Cash flows used in investing activities |
$ | (17,386 | ) | $ | (11,583 | ) | $ | (12,259 | ) | $ | (8,260 | ) | $ | (8,464 | ) | |||||
| Cash flows used in financing activities |
$ | (49,844 | ) | $ | (10,288 | ) | $ | (31,215 | ) | $ | (24,814 | ) | $ | (943 | ) | |||||
| KEY OPERATING DATA |
||||||||||||||||||||
| Products sold (tons): |
||||||||||||||||||||
| Ammonia |
125 | 153 | 126 | 173 | 145 | |||||||||||||||
| UAN |
315 | 294 | 267 | 313 | 275 | |||||||||||||||
| Products pricing (dollars per ton): |
||||||||||||||||||||
| Ammonia |
$ | 588 | $ | 377 | $ | 726 | $ | 539 | $ | 351 | ||||||||||
| UAN |
$ | 269 | $ | 180 | $ | 267 | $ | 308 | $ | 209 | ||||||||||
| Production (tons): |
||||||||||||||||||||
| Ammonia |
273 | 267 | 267 | 299 | 270 | |||||||||||||||
| UAN |
312 | 287 | 274 | 311 | 269 | |||||||||||||||
| On-stream factors: |
||||||||||||||||||||
| Ammonia |
96.4 | % | 91.8 | % | 98.1 | % | 99.5 | % | 94.2 | % | ||||||||||
| UAN |
96.4 | % | 92.9 | % | 96.7 | % | 98.4 | % | 94.8 | % | ||||||||||
| BALANCE SHEET DATA |
||||||||||||||||||||
| Cash and cash equivalents |
$ | 51,372 | $ | 34,934 | $ | 36,661 | $ | 56,268 | $ | 27,380 | ||||||||||
| Working capital |
$ | (32,270 | ) | $ | 22,565 | $ | (2,860 | ) | $ | 31,251 | $ | 25,974 | ||||||||
| Construction in progress |
$ | 20,318 | $ | 2,474 | $ | 6,882 | $ | 3,490 | $ | 772 | ||||||||||
| Total assets |
$ | 152,408 | $ | 108,837 | $ | 115,769 | $ | 159,552 | $ | 108,266 | ||||||||||
| Total long-term liabilities |
$ | 114,981 | $ | 54,549 | $ | 7,642 | $ | 59,045 | $ | 8,062 | ||||||||||
| Total stockholder’s equity |
$ | (76,133 | ) | $ | 20,334 | $ | 42,433 | $ | 26,118 | $ | 70,284 | |||||||||
41
Table of Contents
| ITEM 7. | MANAGEMENT’S DISCUSSION AND ANALYSIS OF FINANCIAL CONDITION AND RESULTS OF OPERATIONS |
You should read the following discussion and analysis of our financial condition, results of operations and cash flows in conjunction with the financial statements and related notes included elsewhere in this report. This discussion and analysis contains forward-looking statements that involve risks, uncertainties and assumptions. Our actual results may differ materially from those anticipated in these forward-looking statements as a result of a number of factors, including, but not limited to, those set forth under Part I—Item 1A “Risk Factors,” “Forward-Looking Statements” and elsewhere in this report.
OVERVIEW
We are a Delaware limited partnership formed in July 2011 by Rentech, a publicly traded provider of clean energy solutions and nitrogen fertilizer, to own, operate and grow our nitrogen fertilizer business. Our nitrogen fertilizer facility, which is located in East Dubuque, Illinois, has been in operation since 1965 with infrequent unplanned shutdowns. We produce primarily ammonia and UAN at our facility, using natural gas as our primary feedstock. Substantially all of our products are nitrogen-based.
Our facility is located in the center of the Mid Corn Belt, the largest market in the United States for direct application of nitrogen fertilizer products. The Mid Corn Belt includes the States of Illinois, Indiana, Iowa, Missouri, Nebraska and Ohio. The States of Illinois and Iowa have been the top two corn producing states in the United States for the last 20 years according to the National Corn Growers Association. We consider our market to be comprised of the States of Illinois, Iowa and Wisconsin.
Our core market consists of the area located within an estimated 200-mile radius of our facility. In most instances, our customers purchase our nitrogen products at our facility and then arrange and pay to transport them to their final destinations by truck. To the extent our products are picked up at our facility, we do not incur any shipping costs, in contrast to nitrogen fertilizer producers located outside of our core market that must incur transportation and storage costs to transport their products to, and sell their products in, our market. In addition, we do not maintain a fleet of trucks and, unlike some of our major competitors, we do not maintain a fleet of rail cars because our customers generally are located close to our facility and prefer to be responsible for transportation. Having no need to maintain a fleet of trucks or rail cars lowers our fixed costs. The combination of our proximity to our customers and our storage capacity at our facility also allows for better timing of the pick-up and application of our products, as nitrogen fertilizer product shipments from more distant locations have a greater risk of missing the short periods of favorable weather conditions during which the application of nitrogen fertilizer may occur.
For further information concerning our potential financing needs and related risks, see Part I—Item 1 “Business,” and Part I— Item 1A “Risk Factors”.
Factors Affecting Comparability of Financial Information
Our historical results of operations for the periods presented may not be comparable with our results of operations in the future for the reasons discussed below.
Corporate Allocations
REMC has been consolidated with Rentech’s operations since it was acquired by Rentech in 2006. The financial statements of REMC included elsewhere in this report reflect REMC on a stand-alone or “carve-out” basis. In the financial statements, corporate overhead costs incurred by Rentech on behalf of REMC were allocated to REMC and are reflected in operating expenses. These costs include the following:
| • | compensation of human resources, legal, information systems, accounting and finance, investor relations and other Rentech personnel, which were allocated to REMC based on the estimated amount of time spent by the Rentech personnel on work for REMC; |
| • | stock-based compensation of REMC personnel, all of which was allocated to REMC; |
| • | third-party hosting costs for accounting and financial reporting software, which were allocated to REMC based on the estimated proportion of such costs that related to REMC transactions; |
| • | audit and tax services expenses, which were allocated to REMC based on an estimate of the time spent by third-party providers on REMC audit and tax matters; |
42
Table of Contents
| • | income taxes, which were allocated to REMC on a hypothetical separate tax return basis; |
| • | capital costs of accounting and financial reporting software, which were allocated to REMC based on an estimate of the time the software was used by REMC personnel; and |
| • | amortization of the original issue discount and the loss on the early extinguishment of debt relating to REMC’s former credit agreement, all of which was allocated to REMC. |
For the fiscal years ended September 30, 2011, 2010 and 2009, the total operating expenses incurred by Rentech and allocated to REMC were approximately $2.0 million, $1.4 million and $1.6 million, respectively. See Note 2 to the financial statements.
REMC and Rentech entered into a management services agreement on April 26, 2006 and amended that agreement on July 29, 2011. As compensation for Rentech’s management services, REMC paid Rentech the actual corporate overhead costs incurred by Rentech on behalf of REMC, including, without limitation, compensation expenses for Rentech personnel providing services to REMC, stock-based and incentive bonus compensation expenses of REMC personnel, legal, audit, accounting and tax services expenses, income tax expenses and software expenses. The management services agreement terminated in accordance with its terms at the closing of our initial public offering and, upon its termination, REMC was required to pay Rentech any corporate overhead costs owed by REMC under the agreement. The amount of these corporate overhead costs was approximately $19.4 million, which primarily represent estimated income taxes attributable to REMC.
On November 9, 2011, the closing date of our initial public offering, we, our general partner and Rentech entered into a services agreement, pursuant to which we and our general partner will obtain certain management and other services from Rentech. Our financial statements following our initial public offering will reflect the impact of the reimbursements we are required to make to Rentech under the services agreement instead of those used for purposes of preparing REMC’s stand-alone financial statements described above. Under the services agreement, we, our general partner and our operating subsidiary are obligated to reimburse Rentech for (i) all costs, if any, incurred by Rentech or its affiliates in connection with the employment of its employees who are seconded to us and who provide us services under the agreement on a full-time basis, but excluding share-based compensation; (ii) a prorated share of costs incurred by Rentech or its affiliates in connection with the employment of its employees, excluding seconded personnel, who provide us services under the agreement on a part-time basis, but excluding share-based compensation, and such prorated share shall be determined by Rentech on a commercially reasonable basis, based on the estimated percent of total working time that such personnel are engaged in performing services for us; (iii) a prorated share of certain administrative costs, in accordance with the agreement, including office costs, services by outside vendors, other general and administrative costs; and (iv) any taxes (other than income taxes, gross receipt taxes and similar taxes) incurred by Rentech or its affiliates for the services provided under the agreement.
Publicly Traded Limited Partnership Expenses
We expect that our general and administrative expense will increase due to the costs of operating as a publicly traded limited partnership, including costs associated with SEC reporting requirements, annual and quarterly reports to unitholders, tax return and Schedule K-1 preparation and distribution, work performed by our independent auditors, investor relations activities and registrar and transfer agent services. We estimate that this incremental general and administrative expense will be approximately $3.6 million per year, excluding the costs associated with our initial public offering. Our financial statements following our initial public offering will reflect the impact of this expense, which will affect the comparability of our post-offering results with our financial statements from periods prior to the completion of our initial public offering.
Expansion Projects
As discussed in Part I—Item 1A “Business—Expansion Projects,” we have commenced or are evaluating potential projects to expand the production capabilities at our facility. To the extent that we proceed with and complete one or more of these expansion projects, we expect to incur significant costs and expenses for the construction and development of such projects. If we finance some or all of these costs and expenses with the proceeds from the incurrence of indebtedness, then our interest expense could increase significantly. We also would expect our depreciation expense to increase from additional assets placed into service from any expansion project. As a result, our results of operations for periods prior to, during and after the construction of any expansion project may not be comparable.
Key Industry Factors
Supply and Demand
43
Table of Contents
Our earnings and cash flow from operations are significantly affected by nitrogen fertilizer product prices. The price at which we ultimately sell our nitrogen fertilizer products depends on numerous factors, including the global supply and demand for nitrogen fertilizer products which, in turn, depends on, among other factors, world grain demand and prices, inventory and production levels, changes in world population, the cost and availability of natural gas in various regions of the world, the cost and availability of fertilizer transportation infrastructure, weather conditions, the availability of imports and the extent of government intervention in agriculture markets. Nitrogen fertilizer prices are also affected by local factors, including weather and soil conditions, local market conditions and the operating levels of competing facilities. An expansion or upgrade of our competitors’ facilities, international political and economic developments and other factors are likely to continue to play an important role in nitrogen fertilizer industry economics. These factors can impact, among other things, the level of inventories in the market, resulting in price volatility and a reduction in product margins. In addition, demand for fertilizers is affected by the aggregate crop planting decisions and fertilizer application rate decisions of individual farmers. Individual farmers make planting decisions based largely on the prospective profitability of a harvest, while the specific varieties and amounts of fertilizer they apply depend on factors including crop prices, their current liquidity, soil conditions, weather patterns and the types of crops planted. Moreover, the industry typically experiences seasonal fluctuations in demand for nitrogen fertilizer products.
Natural Gas Prices
Natural gas is the primary feedstock for the production of nitrogen fertilizers, accounting for approximately 80% to 85% of the cash production costs for ammonia. Over the last five years, United States natural gas reserves have increased significantly due to, among other factors, advances in extracting shale gas, which have reduced and stabilized natural gas prices, providing North America with a cost advantage over Europe. As a result, our competitive position and that of other North American nitrogen fertilizer producers have been positively impacted.
We historically have purchased natural gas in the spot market, through the use of forward purchase contracts, or a combination of both. We historically have used forward purchase contracts to lock in pricing for a portion of our facility’s natural gas requirements. These forward purchase contracts are generally either fixed-price or index-priced, short-term in nature and for a fixed supply quantity. We are able to purchase natural gas at competitive prices due to our connection to Nicor Inc.’s distribution system and its proximity to the Northern Natural Gas interstate pipeline system. Over the past several years, natural gas prices have experienced significant fluctuations, which has had an impact on our cost of producing nitrogen fertilizer. During the fiscal years ended September 30, 2011, 2010 and 2009, we spent approximately $49.7 million, $50.5 million and $57.5 million, respectively, on natural gas, which equaled an average cost per MMBtu of approximately $4.76, $4.95 and $5.67, respectively.
Transportation Costs
Costs for transporting nitrogen fertilizer can be significant relative to its selling price. For example, ammonia is costly to transport because it is a toxic gas at ambient temperatures and therefore must be transported under refrigeration in specialized equipment. The United States imported an average of over 50% of its annual fertilizer needs between 1999 and 2009 according to the USDA. Therefore, nitrogen fertilizer prices in North America are influenced by the cost to transport product from exporting countries, granting an advantage to local producers who ship over shorter distances.
The price of our nitrogen fertilizer products is impacted by our transportation cost advantage over out-of-region competitors serving our core market. In most instances, our customers purchase our nitrogen products at our facility and then arrange and pay to transport them to their final destinations by truck. To the extent our products are picked up at our facility, we do not incur any shipping costs, in contrast to nitrogen fertilizer producers outside of our core market that must incur transportation and storage costs to transport their products to, and sell their products in, our market. Accordingly, we may offer nitrogen fertilizers at market prices that factor in the storage and transportation costs of out-of-region producers without having incurred such costs. In addition, we do not maintain a fleet of trucks and, unlike some of our major competitors, we do not maintain a fleet of rail cars, which lowers our fixed costs.
Key Operational Factors
Product Prepayment Contracts
We enter into product prepayment contracts committing our customers to purchase our nitrogen fertilizer products at a later date. These customers pay a portion of the contract price for our products shortly after entering into such contracts and the remaining balance of the contract price prior to picking up or delivery of the products. We recognize revenue when products are picked-up or delivered and the customer takes title. The cash received from product prepayments increases our operating cash flow in the quarter in which the cash is received, but may effectively reduce our operating cash flow in a subsequent quarter if the cash was received in a
44
Table of Contents
quarter prior to the one in which the revenue is recorded. Our policy is to purchase under fixed-price forward contracts approximately enough natural gas to manufacture the products that have been sold under product prepayment contracts for later delivery, effectively fixing most of the gross margin on pre-sold product. Our earnings and operating cash flow in future periods may be affected by the degree to which we continue this practice or seek to maximize our gross margins by more opportunistically timing product sales and natural gas purchases.
Facility Reliability
Consistent, safe and reliable operations at our facility are critical to our financial performance and results of operations. Unplanned shutdowns of our facility may result in lost margin opportunity, increased maintenance expense and a temporary increase in working capital investment and related inventory position. The financial impact of planned shutdowns, including facility turnarounds, is mitigated through a diligent planning process that takes into account the existing margin environment, the availability of resources to perform the needed maintenance, feedstock logistics and other factors. We generally undergo a facility turnaround every two years, which typically lasts 18 to 25 days and costs approximately $3.0 to $5.0 million per turnaround. These costs are expensed as incurred. Our facility underwent a turnaround in October 2009 at a cost of approximately $4.0 million and in September and October of 2011 at a cost of approximately $4.5 million through September 30, 2011. In many cases, we also perform significant maintenance capital projects at our facility during a turnaround to minimize disruption to our operations. These capital projects are undertaken during turnarounds to minimize disruption to our operations, but are capitalized as property, plant and equipment rather than expensed as turnaround costs. Our maintenance capital expenditures for such projects were $9.9 million and $12.7 million for the fiscal years ended September 30, 2010 and 2009, respectively. As part of the fiscal year 2011 turnaround, we completed a significant maintenance capital project to replace our existing steam methane reformer tubes, which have been operational since 1980, and made other capital improvements to our facility. This relatively large maintenance project is expected to increase our aggregate maintenance capital expenditures for the period October 1, 2010 through September 30, 2012 to a total of approximately $34.8 million in the aggregate. As of September 30, 2011, approximately $24.5 million of the aggregate expected amount has been incurred, with the remaining $10.3 million of capital expenditures for the steam methane reformer tubes and other purposes expected to be incurred during the fiscal year ending September 30, 2012. Following this maintenance project, we expect that annual maintenance capital expenditures will revert back to their customary levels. See “—Liquidity and Capital Resources—Capital Expenditures.”
Factors Affecting Results of Operations
Revenues
We generate revenue primarily from sales of nitrogen fertilizer products manufactured at our facility and used primarily in corn production. Our facility is designed to produce ammonia, UAN, liquid and granular urea, nitric acid and CO2 using natural gas as a feedstock. Revenues are seasonal based on the planting, growing and harvesting cycles of customers utilizing nitrogen fertilizer.
Cost of Sales
Our cost of sales primarily consists of product shipments and turnaround expenses. Product shipments, the most significant element of cost of sales, primarily consists of natural gas, labor costs and depreciation. Turnaround expenses represent the cost of shutting down our facility for planned maintenance, which is done approximately every two years.
Operating Expenses
Operating expenses primarily consist of selling, general and administrative expense and depreciation expense. Selling, general and administrative expense mainly consists of direct and allocated legal expenses; payroll expenses relating to treasury, accounting, marketing and human resources; and expenses for maintaining our corporate offices.
CRITICAL ACCOUNTING POLICIES
The preparation of financial statements in conformity with GAAP requires management to make estimates and assumptions that affect the reported amounts of assets and liabilities, the disclosure of contingent assets and liabilities at the dates of the financial statements and the reported amounts of revenues and expenses during the reporting periods. Actual results may differ based on the accuracy of the information utilized and subsequent events. Our accounting policies are described in the notes to our audited financial statements included elsewhere in this report. Our critical accounting policies, estimates and assumptions could materially affect the amounts recorded in our financial statements. The most significant estimates and assumptions relate to revenue recognition, inventories and the valuation of long-lived assets.
45
Table of Contents
Revenue Recognition. We recognize revenue when the following elements are substantially satisfied: there are no uncertainties regarding customer acceptance; there is persuasive evidence that an agreement exists documenting the specific terms of the transaction; the sales price is fixed or determinable; and collectibility is reasonably assured. Management assesses the business environment, the customer’s financial condition, historical collection experience, accounts receivable aging and customer disputes to determine whether collectibility is reasonably assured. If collectibility is not considered reasonably assured at the time of sale, we do not recognize revenue until collection occurs.
We recognize revenues from product sales when the customer takes ownership from our facility in East Dubuque, Illinois or our leased storage facility in Niota, Illinois and assumes risk of loss, collection of the related receivable is probable, persuasive evidence of a sale arrangement exists and the sales price is fixed or determinable.
Certain product sales occur under product prepayment contracts which require payment in advance of delivery. We record a liability for deferred revenue in the amount of, and upon receipt of, cash in advance of shipment. We recognize revenue related to the product prepayment contracts and relieve the liability for deferred revenue when customers take ownership of products. A significant portion of the revenue recognized during any period may be related to product prepayment contracts, for which cash may have been collected during an earlier period, with the result being that a significant portion of revenue recognized during a period may not generate cash receipts during that period.
Natural gas, though not purchased for the purpose of resale, is occasionally sold under certain circumstances. Natural gas is sold when contracted quantities received are in excess of production requirements and storage capacities, in which case the sales price is recorded in revenues and the related cost is recorded in cost of sales. Natural gas is also sold with a simultaneous natural gas purchase in order to receive a benefit that reduces raw material cost, in which case the net of the sales price and the related cost of sales are recorded within cost of sales.
Inventories. Our inventory is stated at the lower of cost or estimated net realizable value. The cost of inventories is determined using the first-in first-out method. We perform an analysis of our inventory balances at least quarterly to determine if the carrying amount of inventories exceeds their net realizable value. The analysis of estimated net realizable value is based on customer orders, market trends and historical pricing. If the carrying amount exceeds the estimated net realizable value, the carrying amount is reduced to the estimated net realizable value. We allocate fixed production overhead costs to inventory based on the normal capacity of our production facilities.
Valuation of Long-Lived Assets. We assess the realizable value of long-lived assets for potential impairment whenever events or changes in circumstances indicate that the carrying value may not be recoverable. In assessing the recoverability of our assets, we make assumptions regarding estimated future cash flows and other factors to determine the fair value of the respective assets. As applicable, we make assumptions regarding the useful lives of the assets. If these estimates or their related assumptions change in the future, we may be required to record impairment charges for these assets.
Business Segments
We operate in one business segment.
46
Table of Contents
COMPARISON OF THE RESULTS OF OPERATIONS FOR THE FISCAL YEARS ENDED SEPTEMBER 30, 2011 AND 2010
Revenues
| For the Fiscal Years
Ended September 30, |
||||||||
| 2011 | 2010 | |||||||
| (in thousands) | ||||||||
| Revenues: |
||||||||
| Product shipments |
$ | 179,400 | $ | 129,392 | ||||
| Sales of excess inventory of natural gas |
457 | 2,004 | ||||||
|
|
|
|
|
|||||
| Total revenues |
$ | 179,857 | $ | 131,396 | ||||
|
|
|
|
|
|||||
| For the Fiscal
Year Ended September 30, 2011 |
For the Fiscal
Year Ended September 30, 2010 |
|||||||||||||||
| Tons | Revenue | Tons | Revenue | |||||||||||||
| (in thousands) | (in thousands) | |||||||||||||||
| Product Shipments: |
||||||||||||||||
| Ammonia |
125 | $ | 73,346 | 153 | $ | 57,909 | ||||||||||
| UAN |
315 | 84,646 | 294 | 52,912 | ||||||||||||
| Urea (liquid and granular) |
29 | 13,708 | 32 | 12,663 | ||||||||||||
|
CO2 |
110 | 2,825 | 107 | 2,779 | ||||||||||||
| Nitric Acid |
15 | 4,875 | 11 | 3,129 | ||||||||||||
|
|
|
|
|
|
|
|
|
|||||||||
| Total |
594 | $ | 179,400 | 597 | $ | 129,392 | ||||||||||
|
|
|
|
|
|
|
|
|
|||||||||
We generate revenue primarily from sales of nitrogen fertilizer products manufactured at our facility and used primarily in corn production. Our facility is designed to produce ammonia, UAN, liquid and granular urea, nitric acid and CO2 using natural gas as a feedstock. Revenues are seasonal based on the planting, growing, and harvesting cycles of customers utilizing nitrogen fertilizer.
Revenues were approximately $179.9 million for the fiscal year ended September 30, 2011 compared to approximately $131.4 million for the fiscal year ended September 30, 2010. This increase was primarily the result of higher prices paid for our products during fiscal year ended September 30, 2011, resulting from stronger demand for nitrogen fertilizer products during the period. Ammonia sales volumes decreased and UAN sales volumes increased during the fiscal year ended September 30, 2011 as we upgraded more ammonia into UAN to realize higher gross profit margins.
The average sales prices per ton in the current fiscal year as compared with the prior fiscal year increased by 55% and 49% for ammonia and UAN, respectively. These increases were due to higher demand caused by a combination of low levels of corn and fertilizer inventories and expectations of higher corn acreage in 2011. These two products comprised approximately 88% and 86%, respectively, of our product sales for each of the fiscal years ended September 30, 2011 and 2010.
Cost of Sales
| For the Fiscal Years
Ended September 30, |
||||||||
| 2011 | 2010 | |||||||
| (in thousands) | ||||||||
| Cost of sales: |
||||||||
| Product shipments |
$ | 98,250 | $ | 99,749 | ||||
| Turnaround expenses |
4,490 | 3,955 | ||||||
| Sales of excess inventory of natural gas |
546 | 2,259 | ||||||
| Simultaneous sale and purchase of natural gas |
— | 57 | ||||||
|
|
|
|
|
|||||
| Total cost of sales |
$ | 103,286 | $ | 106,020 | ||||
|
|
|
|
|
|||||
Cost of sales was approximately $103.3 million for the fiscal year ended September 30, 2011 compared to approximately $106.0 million for the fiscal year ended September 30, 2010. Cost of sales from product shipments was approximately $98.3 million for the fiscal year ended September 30, 2011, compared to approximately $99.7 million for the fiscal year ended September 30, 2010. The decrease in cost of sales on product shipments for the fiscal year ended September 30, 2011 compared to the fiscal year ended September 30, 2010 was primarily due to lower natural gas prices during the fiscal year ended September 30, 2011 and unplanned repairs and maintenance costs during the first quarter of fiscal 2010.
47
Table of Contents
Natural gas costs comprised approximately 50% of cost of sales on product shipments for the fiscal year ended September 30, 2011 compared to 54% of cost of sales on product shipments for the fiscal year ended September 30, 2010. Labor costs comprised approximately 12% of cost of sales on product shipments for each of the fiscal years ended September 30, 2011 and 2010. Depreciation expense included in cost of sales was $9.6 million and $10.1 million for the fiscal years ended September 30, 2011 and 2010, respectively, and comprised approximately 10% of cost of sales on product shipments for each of the fiscal years ended September 2011 and 2010.
Turnaround expenses represent the cost of planned maintenance during turnarounds, which occur approximately every two years. A facility turnaround occurred in September and October 2011 and October 2009. As a result, during the fiscal years ended September 30, 2011 and 2010, we incurred turnaround expenses of approximately $4.5 million and $4.0 million, respectively. In October 2011, we expensed additional costs relating to the turnaround.
Natural gas, though not purchased for the purpose of resale, is occasionally sold under certain circumstances, such as when contracted quantities received exceed our production requirements or our storage capacity. In these situations, which we refer to as sales of excess inventory of natural gas, the sales proceeds are recorded as revenue and the related cost is recorded as a cost of sales.
When the opportunity presents itself, we may also sell, to a third party at one location, natural gas that we have purchased or are required to purchase under fixed-price contracts and simultaneously purchase, at a different location and at a lower price, the same quantity of natural gas in order to capture an immediate benefit from the price differential between the two delivery points. We refer to these situations as a simultaneous sale and purchase of natural gas. The sale of gas in conjunction with a simultaneous purchase may be at a price lower (or higher) than the purchase price previously committed under a forward purchase contract, which may result in a loss (or profit) compared to the price required in the forward purchase contract. The natural gas is immediately repurchased at a lower price resulting in a lower cost of sales when inventory is sold. All or a portion of a loss relative to the forward purchase contract may be offset (or a profit increased) by a gain on the simultaneous sale and purchase transaction. None of these transactions occurred during the fiscal year ended September 30, 2011, and only a minor amount occurred during the fiscal year ended September 30, 2010.
Gross Profit
| For the Fiscal Years ended September 30, | ||||||||
| 2011 | 2010 | |||||||
| (in thousands) | ||||||||
| Gross profit (loss): |
||||||||
| Product shipments |
$ | 81,150 | $ | 29,643 | ||||
| Turnaround expenses |
(4,490 | ) | (3,955 | ) | ||||
| Sales of excess inventory of natural gas |
(89 | ) | (255 | ) | ||||
| Simultaneous sale and purchase of natural gas |
— | (57 | ) | |||||
|
|
|
|
|
|||||
| Total gross profit |
$ | 76,571 | $ | 25,376 | ||||
|
|
|
|
|
|||||
Gross profit was approximately $76.5 million for the fiscal year ended September 30, 2011 compared to approximately $25.4 million for the fiscal year ended September 30, 2010. Gross profit margin on product shipments was 45% for the fiscal year ended September 30, 2011 as compared to 23% for the fiscal year ended September 30, 2010. This increase was primarily due to higher sales prices and lower natural gas prices during the fiscal year ended September 30, 2011 and unplanned repairs and maintenance costs during the first quarter of fiscal 2010.
Operating Expenses
| For the Fiscal Years Ended September 30, |
||||||||
| 2011 | 2010 | |||||||
| (in thousands) | ||||||||
| Operating expenses: |
||||||||
| Selling, general and administrative |
$ | 5,786 | $ | 4,497 | ||||
| Depreciation |
409 | 439 | ||||||
| Loss on impairment |
— | 95 | ||||||
| (Gain) loss on disposal of property, plant and equipment |
522 | (44 | ) | |||||
|
|
|
|
|
|||||
| Total operating expenses |
$ | 6,717 | $ | 4,987 | ||||
|
|
|
|
|
|||||
48
Table of Contents
Operating expenses were approximately $6.7 million for the fiscal year ended September 30, 2011 compared to approximately $5.0 million for the fiscal year ended September 30, 2010. These expenses were primarily comprised of selling, general and administrative expense, depreciation expense and loss on disposal of property, plant and equipment.
Selling, General and Administrative Expenses. Selling, general and administrative expenses were approximately $5.8 million for the fiscal year ended September 30, 2011 compared to approximately $4.5 million for the fiscal year ended September 30, 2010. This increase was primarily due to additional audit and tax fees, administrative agent fees under our then-existing credit agreement and sales-based incentive bonuses.
Depreciation. Depreciation expense was approximately $0.4 million for the fiscal years ended September 30, 2011 and 2010. A portion of depreciation expense is associated with assets supporting general and administrative functions and is recorded in operating expense. The majority of depreciation expense, as a manufacturing cost, is distributed between cost of sales and finished goods inventory, based on product volumes.
Loss on Disposal of Property, Plant and Equipment. Loss on disposal or property, plant and equipment was approximately $0.5 million for the fiscal year ended September 30, 2011 compared to a gain of approximately $44,000 for the fiscal year ended September 30, 2010. This increase was primarily due to the removal of a selective catalyst recovery unit for approximately $886,000 in the fiscal year ended September 30, 2011 which was partially offset by various miscellaneous sales and exchanges of nonmonetary assets totaling approximately $364,000 in the fiscal year ended September 30, 2011.
Operating Income
| For the Fiscal Years Ended September 30, |
||||||||
| 2011 | 2010 | |||||||
| (in thousands) | ||||||||
| Operating income (loss): |
||||||||
| Product shipments |
$ | 74,433 | $ | 24,656 | ||||
| Turnaround expenses |
(4,490 | ) | (3,955 | ) | ||||
| Sales of excess inventory of natural gas |
(89 | ) | (255 | ) | ||||
| Simultaneous sale and purchase of natural gas |
— | (57 | ) | |||||
|
|
|
|
|
|||||
| Total operating income |
$ | 69,854 | $ | 20,389 | ||||
|
|
|
|
|
|||||
Operating income was approximately $69.9 million for the fiscal year ended September 30, 2011 compared to approximately $20.4 million for the fiscal year ended September 30, 2010. Operating income from product shipments was approximately $74.4 million for the fiscal year ended September 30, 2011 compared to approximately $24.7 million for the fiscal year ended September 30, 2010. The increase in income from operations for product shipments was primarily due to higher sales prices and lower natural gas prices during the fiscal year ended September 30, 2011 and unplanned repairs and maintenance costs during the first quarter of fiscal 2010, partially offset by additional audit and tax fees, administrative agent fees under a former credit agreement REMC entered into during the fiscal year ended September 30, 2010, or our 2010 credit agreement, and sales-based incentive bonuses incurred during fiscal year ended September 30, 2011.
Other Income (Expense), Net
| For the Fiscal Years Ended September 30, |
||||||||
| 2011 | 2010 | |||||||
| (in thousands) | ||||||||
| Other income (expense), net: |
||||||||
| Interest income |
$ | 51 | $ | 57 | ||||
| Interest expense |
(13,752 | ) | (9,859 | ) | ||||
| Loss on debt extinguishment |
(13,816 | ) | (2,268 | ) | ||||
| Other income (expense), net |
4 | 34 | ||||||
|
|
|
|
|
|||||
| Total other expense, net |
$ | (27,513 | ) | $ | (12,036 | ) | ||
|
|
|
|
|
|||||
Net other expense was approximately $27.5 million for the fiscal year ended September 30, 2011 compared to approximately $12.0 million for the fiscal year ended September 30, 2010. During the fiscal year ended September 30, 2011, we had a loss on debt extinguishment of $4.6 million relating to a November 2010 amendment to our 2010 credit agreement. In June 2011, we had a loss on debt extinguishment of $9.2 million relating to a former credit agreement REMC entered into during the fiscal year ended September 30, 2011, or our 2011 credit agreement. Also, interest expense increased primarily due to higher outstanding principal balances under our 2010 credit agreement and our 2011 credit agreement.
49
Table of Contents
COMPARISON OF THE RESULTS OF OPERATIONS FOR THE FISCAL YEARS ENDED SEPTEMBER 30, 2010 AND 2009
Revenues
| For the Fiscal Years
Ended September 30, |
||||||||
| 2010 | 2009 | |||||||
| (in thousands) | ||||||||
| Revenues: |
||||||||
| Product shipments |
$ | 129,392 | $ | 184,071 | ||||
| Sales of excess inventory of natural gas |
2,004 | 2,378 | ||||||
|
|
|
|
|
|||||
| Total revenues |
$ | 131,396 | $ | 186,449 | ||||
|
|
|
|
|
|||||
| For the Fiscal
Year Ended September 30, 2010 |
For the Fiscal
Year Ended September 30, 2009 |
|||||||||||||||
| Tons | Revenue | Tons | Revenue | |||||||||||||
| (in thousands) | (in thousands) | |||||||||||||||
| Product Shipments: |
||||||||||||||||
| Ammonia |
153 | $ | 57,909 | 126 | $ | 91,413 | ||||||||||
| UAN |
294 | 52,912 | 267 | 71,185 | ||||||||||||
| Urea (liquid and granular) |
32 | 12,663 | 36 | 15,876 | ||||||||||||
|
CO2 |
107 | 2,779 | 95 | 2,571 | ||||||||||||
| Nitric Acid |
11 | 3,129 | 9 | 3,026 | ||||||||||||
|
|
|
|
|
|
|
|
|
|||||||||
| Total |
597 | $ | 129,392 | 533 | $ | 184,071 | ||||||||||
|
|
|
|
|
|
|
|
|
|||||||||
Revenues were approximately $131.4 million for the fiscal year ended September 30, 2010 compared to approximately $186.4 million for the fiscal year ended September 30, 2009. The decrease was primarily due to decreased sales prices for all of our products which was partially offset by an increase in our UAN sales volume. Sales volume increased for UAN due to a higher availability of the product in the fiscal year ended September 30, 2010, as compared to the previous year. This was due to a combination of higher carryover inventory into the year and lower production in the fiscal year ended September 30, 2009 compared to the fiscal year ended September 30, 2010. The lower production in the fiscal year ended September 30, 2009 can be attributed in part to an unplanned shutdown due to a power outage in January 2009, following which ammonia production was reduced to two-thirds of capacity for 67 days to avoid inventory containment issues. This was partially offset by a 15-day turnaround in October 2009 and subsequent 15-day unplanned shutdown due to equipment failures, which reduced production in the fiscal year ended September 30, 2010.
The average sales price per ton decreased by 48% for ammonia and by 32% for UAN in the fiscal year ended September 30, 2010 compared to the respective average sales prices per ton of ammonia and UAN in the fiscal year ended September 30, 2009. These decreases occurred because the prices for a majority of the shipments in the fiscal year ended September 30, 2009 had been determined in product prepayment contracts that were signed when fertilizer prices were at peak levels in 2008. Management believes that the significant decline in prices for nitrogen fertilizer that occurred from the end of 2008 through 2009 was due to, among other things, a substantial drop in corn prices and the price of natural gas, a key input, and weak economic conditions. Sales of ammonia and UAN comprised approximately 86% and 88%, respectively, of our product sales for the fiscal years ended September 30, 2010 and 2009.
Cost of Sales
| For the Fiscal Years Ended September 30, |
||||||||
| 2010 | 2009 | |||||||
| (in thousands) | ||||||||
| Cost of sales: |
||||||||
| Product shipments |
$ | 99,749 | $ | 98,968 | ||||
| Turnaround expenses |
3,955 | 149 | ||||||
| Sales of excess inventory of natural gas |
2,259 | 3,996 | ||||||
| Simultaneous sale and purchase of natural gas |
57 | 22,775 | ||||||
|
|
|
|
|
|||||
| Total cost of sales |
$ | 106,020 | $ | 125,888 | ||||
|
|
|
|
|
|||||
50
Table of Contents
Cost of sales was approximately $106.0 million for the fiscal year ended September 30, 2010 compared to approximately $125.9 million for the fiscal year ended September 30, 2009. Cost of sales from product shipments was approximately $99.7 million for the fiscal year ended September 30, 2010, compared to approximately $99.0 million for the fiscal year ended September 30, 2009.
Natural gas and labor costs comprised approximately 54% and 12%, respectively, of cost of sales on product shipments for the fiscal year ended September 30, 2010 compared to 64% and 13%, respectively, for the fiscal year ended September 30, 2009. Depreciation expense included in cost of sales was $10.1 million and $8.3 million for the fiscal years ended September 30, 2010 and 2009, respectively, and comprised approximately 10% of cost of sales on product shipments for the fiscal year ended September 2010 compared to 8% of cost of sales on product shipments for the fiscal year ended September 30 2009.
Turnaround expenses represent the cost of planned maintenance during turnarounds, which occur approximately every two years. A facility turnaround occurred in October 2009 and some preliminary turnaround activities occurred in September 2009, which did not require the facility to be shut down. As a result, during the fiscal years ended September 30, 2010 and 2009, we incurred turnaround expenses of approximately $4.0 million and $149,000, respectively.
During fiscal year 2009, we were able to take advantage of simultaneous sale and purchase opportunities, resulting in immediate benefits of $188,000. In fiscal year 2009, the natural gas sold as part of the simultaneous sale and purchase transactions had been purchased under forward purchase contracts that required us to pay prices higher than the prices received in conjunction with the simultaneous sale and purchase transactions, resulting in losses on sales of this natural gas of $22.8 million. The natural gas was immediately repurchased at a lower price which resulted in the benefit of $188,000 from the simultaneous sale and purchase transactions. The losses were recorded as cost of sales at the time of the simultaneous purchase and sale transactions, net of the immediate benefits from the simultaneous sale and purchase of $188,000. The recording of the losses is effectively accelerating the timing of recognizing the cost of the high-priced natural gas purchased under the original forward purchase contracts. In the absence of the simultaneous sale and purchase transactions, the higher priced natural gas under contract would have been inventoried into finished product and later expensed when the related finished product was sold. For fiscal year 2009, the $22.8 million loss recorded at the time of the simultaneous sale and purchase transactions was followed by a $22.8 million reduction in cost of sales as product produced from the lower priced natural gas was sold. During fiscal year 2010, simultaneous sale and purchases of natural gas were immaterial. See “—Comparison of the Results of Operations for the Fiscal Years Ended September 30, 2011 and 2010—Cost of Sales” for a discussion of our sales of excess inventory of natural gas and simultaneous sale and purchase of natural gas.
Gross Profit
| For the Fiscal Years Ended September 30, | ||||||||
| 2010 | 2009 | |||||||
| (in thousands) | ||||||||
| Gross profit (loss): |
||||||||
| Product shipments |
$ | 29,643 | $ | 85,103 | ||||
| Turnaround expenses |
(3,955 | ) | (149 | ) | ||||
| Sales of excess inventory of natural gas |
(255 | ) | (1,618 | ) | ||||
| Simultaneous sale and purchase of natural gas |
(57 | ) | (22,775 | ) | ||||
|
|
|
|
|
|||||
| Total gross profit |
$ | 25,376 | $ | 60,561 | ||||
|
|
|
|
|
|||||
Gross profit was approximately $25.4 million for the fiscal year ended September 30, 2010 compared to approximately $60.6 million for the fiscal year ended September 30, 2009. Our gross profit margin on product shipments was 23% for the fiscal year ended September 30, 2010 compared to 46% for the fiscal year ended September 30, 2009. This decrease was primarily due to lower sales prices, partially offset by increased sales volume of UAN and lower natural gas prices in the fiscal year ended September 30, 2010 compared to the fiscal year ended September 30, 2009.
Operating Expenses
| For the Fiscal Years Ended September 30, |
||||||||
| 2010 | 2009 | |||||||
| (in thousands) | ||||||||
| Operating expenses: |
||||||||
| Selling, general and administrative |
$ | 4,497 | $ | 4,758 | ||||
| Depreciation |
439 | 403 | ||||||
| Loss on impairment |
95 | — | ||||||
| (Gain) loss on disposal of property, plant and equipment |
(44 | ) | 87 | |||||
|
|
|
|
|
|||||
| Total operating expenses |
$ | 4,987 | $ | 5,248 | ||||
|
|
|
|
|
|||||
51
Table of Contents
Operating expenses were approximately $5.0 million for the fiscal year ended September 30, 2010 compared to approximately $5.2 million for the fiscal year ended September 30, 2009. These expenses were primarily comprised of selling, general and administrative expense and depreciation expense.
Selling, General and Administrative Expense. Selling, general and administrative expenses were approximately $4.5 million for the fiscal year ended September 30, 2010 compared to approximately $4.8 million for the fiscal year ended September 30, 2009. This decrease was primarily due to lower audit and tax fees allocated to us by Rentech and reductions in consulting and legal expenses, partially offset by fees paid to the administrative agent, legal expenses and title insurer expenses incurred in connection with the modification of our credit agreement in July 2010.
Depreciation. Depreciation expense was approximately $0.4 million for each of the fiscal years ended September 30, 2010 and 2009. A portion of depreciation expense is associated with assets supporting general and administrative functions and is recorded in operating expense. As a manufacturing cost, the majority of depreciation expense is distributed between cost of sales and finished goods inventory, based on product volumes.
Operating Income
| For the Fiscal Years Ended September 30, |
||||||||
| 2010 | 2009 | |||||||
| (in thousands) | ||||||||
| Operating income (loss): |
||||||||
| Product shipments |
$ | 24,656 | $ | 79,855 | ||||
| Turnaround expenses |
(3,955 | ) | (149 | ) | ||||
| Sales of excess inventory of natural gas |
(255 | ) | (1,618 | ) | ||||
| Simultaneous sale and purchase of natural gas |
(57 | ) | (22,775 | ) | ||||
|
|
|
|
|
|||||
| Total operating income |
$ | 20,389 | $ | 55,313 | ||||
|
|
|
|
|
|||||
Operating income was approximately $20.4 million for the fiscal year ended September 30, 2010 compared to approximately $55.3 million for the fiscal year ended September 30, 2009. Operating income from product shipments was approximately $24.7 million for the fiscal year ended September 30, 2010 compared to approximately $79.9 million for the fiscal year ended September 30, 2009. This decrease was primarily due to lower sales prices, partially offset by increased sales volume of UAN and lower natural gas prices in the fiscal year ended September 30, 2010 compared to the fiscal year ended September 30, 2009.
Other Income (Expense), Net
| For the Fiscal Years Ended September 30, |
||||||||
| 2010 | 2009 | |||||||
| (in thousands) | ||||||||
| Other income (expense), net: |
||||||||
| Interest income |
$ | 57 | $ | 190 | ||||
| Interest expense |
(9,859 | ) | (8,481 | ) | ||||
| Loss on debt extinguishment |
(2,268 | ) | — | |||||
| Other income (expense), net |
34 | (287 | ) | |||||
|
|
|
|
|
|||||
| Total other expense, net |
$ | (12,036 | ) | $ | (8,578 | ) | ||
|
|
|
|
|
|||||
Net other expense was approximately $12.0 million for the fiscal year ended September 30, 2010 compared to approximately $8.6 million for the fiscal year ended September 30, 2009. This increase was primarily due to higher interest expense resulting from additional borrowings and a loss on extinguishment of debt in January 2010.
52
Table of Contents
LIQUIDITY AND CAPITAL RESOURCES
Our principal source of liquidity has historically been cash from operations. We expect to fund our operating needs, including maintenance capital expenditures, and distributions to partners, from operating cash flow, cash on hand following our initial public offering, and our new revolving credit facility. We expect to fund certain expansion capital expenditures from cash on hand following our initial public offering. We believe that our current and expected sources of liquidity will be adequate to fund these operating needs and capital expenditures for the next 12 months. However, we will require external financing for construction of the ammonia capacity expansion project, any other expansion projects and any acquisitions. External financing sources for expansion projects and acquisitions could include equity or debt, including loans from Rentech.
Sources of Liquidity
Our Initial Public Offering
On November 9, 2011, we completed our initial public offering of 15,000,000 common units representing limited partner interests at a public offering of $20.00 per common unit. The common units sold to the public in our initial public offering represent approximately 39.2% of our common units outstanding as of the closing of our initial public offering. RNHI owns the remaining 60.8% of our common units. At the closing of our initial public offering, RNHI contributed its member interests in REMC to us, and REMC converted into a limited liability company named Rentech Nitrogen, LLC, organized under the laws of the State of Delaware. We used cash on hand and proceeds from our initial public offering to pay distributions to Rentech and RNHI totaling approximately $137.0 million, repaid debt, paid expenses of our initial public offering, and retained approximately $50.0 million of cash. Specifically, we (i) used approximately $150.8 million of the net proceeds of our initial public offering to make a capital contribution to our operating company for the repayment in full and termination of our 2011 credit agreement and the payment of related fees and expenses; (ii) used approximately $34.7 million of the net proceeds of our initial public offering to make a distribution to RNHI to reimburse it for expenditures made by our operating company during the two-year period preceding our initial public offering for the expansion and improvement of our facility, including expenditures for preliminary work relating to our operating company’s expansion projects; (iii) will use approximately $1.1 million of the net proceeds of our initial public offering for the payment of expenditures related to the replacement of our operating company’s steam methane reformer tubes; (iv) will use approximately $5.5 million of the net proceeds of our initial public offering for the payment of expenditures related to our operating company’s urea expansion and DEF build-out project; (v) will use approximately $0.6 million of the net proceeds of our initial public offering for the payment of expenditures related to FEED for our operating company’s ammonia capacity expansion project; (vi) will use approximately $40.0 million of the net proceeds of our initial public offering for general working capital purposes; and (vii) used the balance of the net proceeds of our initial public offering, less unpaid transaction expenses, to make a distribution to RNHI in the amount of approximately $43.5 million. Also, our operating company (i) paid approximately $19.4 million to Rentech and, following such payment, the management services agreement between our operating company and Rentech terminated in accordance with its terms; and (ii) distributed to RNHI approximately $39.3 million which equaled all of our operating company’s cash prior to receipt of the net proceeds of our initial public offering.
Distributions
We intend to distribute all of the cash available for distribution we generate each quarter to our unitholders, which could materially impact our liquidity and limit our ability to grow and make acquisitions. Cash available for distribution for each quarter will be determined by the board of directors of our general partner following the end of such quarter. As a result of our quarterly distributions, our liquidity will be significantly impacted, and we expect to finance substantially all of our growth externally, either with commercial bank borrowings or by debt issuances or additional issuances of equity. However, our partnership agreement does not require us to pay cash distributions on a quarterly or other basis, and we may change our distribution policy at any time and from time to time.
New Revolving Credit Facility
On November 10, 2011, our operating company entered into a new credit agreement, or the new credit agreement, among itself, us, as guarantor, General Electric Capital Corporation, as administrative agent and lender, and certain other lenders that may become parties thereto, pursuant to which our operating company obtained a revolving credit facility, or the new revolving credit facility. We expect that the new revolving credit facility will be used to fund our operating company’s seasonal working capital needs, letters of credit and for general partnership purposes. There are currently no outstanding advances under our new revolving credit facility, which provides for borrowing availability of $25.0 million.
53
Table of Contents
The new revolving credit facility consists of a $25.0 million senior secured revolving credit facility, with a two year maturity. The new revolving credit facility includes a letter of credit sublimit of up to $2.5 million. All obligations of our operating company under the new revolving credit facility are unconditionally guaranteed by us. All obligations under the new revolving credit facility and the guarantees of those obligations are secured by substantially all of our operating company’s assets, as well as substantially all our assets (including our equity interest in our operating company).
Borrowings under the new revolving credit facility bear interest at a rate equal to an applicable margin plus, at our operating company’s option, either (a) in the case of base rate borrowings, a rate equal to the highest of (1) the prime rate, (2) the federal funds rate plus 0.5% and (3) LIBOR for an interest period of three months plus 1.00% or (b) in the case of LIBOR borrowings, the offered rate per annum for deposits of dollars for the applicable interest period. The applicable margin for borrowings under the new revolving credit facility is 3.25% with respect to base rate borrowings and 4.25% with respect to LIBOR borrowings. Additionally, our operating company is required to pay a fee to the lenders under the new revolving credit facility on the undrawn portion available under the revolving loan facility at a rate of 0.50%. Our operating company also is required to pay customary letter of credit fees on issued letters of credit. In the event our operating company reduces or terminates the new revolving credit facility prior to its first anniversary, our operating company is required to pay a prepayment premium of 2.0% of the principal amount reduced or terminated, subject to certain exceptions.
Any amounts outstanding under the new revolving credit facility will be required to be reduced to zero (other than outstanding letters of credit) for two periods of ten consecutive business days during each year with each period not less than four months apart.
Our new revolving credit facility also contains customary affirmative and negative covenants and events of default relating to us and our operating company and our respective subsidiaries. The covenants and events of default include, among other things, limitations on the incurrence of indebtedness and liens, the making of investments, the sale of assets and the making of restricted payments. The new revolving credit facility also contains specific provisions limiting RNHI from engaging in certain business activities and owning certain property, and events of default relating to a change in control in the event Rentech ceases to appoint the majority of the board of directors of both RNHI and our general partner. Dividends and distributions from us and our operating company are permitted so long as (1) no default or event of default exists or will result therefrom and (2) our operating company delivers a certificate to the administrative agent under our new revolving credit facility certifying compliance with the terms of the new revolving credit facility, including its financial covenants, as of the date of such dividend or distribution.
In addition, the new revolving credit facility requires our operating company to comply with certain financial covenants including (1) minimum EBITDA (as defined in the new credit agreement) for the last four consecutive fiscal quarters of not less than $30.0 million as of the end of each fiscal quarter and (2) maintenance of a minimum Fixed Charge Coverage Ratio (as defined in the new credit agreement) of not less than 1.0x as of the end of each fiscal quarter for the 12 month period then ending.
Capital Expenditures
We divide our capital expenditures into two categories: maintenance and expansion capital expenditures. Maintenance capital expenditures are capital expenditures (including expenditures for the addition or improvement to, or the replacement of, our capital assets or for the acquisition of existing, or the construction or development of new capital assets) made to maintain, including over the long term, our operating capacity or operating income, or to comply with environmental, health, safety or other regulations. Maintenance capital expenditures that are required to comply with regulations may also improve the output, efficiency or reliability of our facility. Expansion capital expenditures are capital expenditures incurred for acquisitions or capital improvements that we expect will increase our operating capacity or operating income over the long term.
Our maintenance capital expenditures totaled approximately $24.5 million and $9.9 million, respectively, in the fiscal years ended September 30, 2011 and 2010, and are expected to be approximately $10.3 million and $7.8 million, respectively, for the fiscal years ending September 30, 2012 and 2013. Our expansion capital expenditures are expected to be approximately $5.9 million for the fiscal year ending September 30, 2012 for expenditures related to our urea expansion and DEF build-out project and FEED for our ammonia capacity expansion project. We expect our urea expansion project and DEF build-out could be completed by the end of calendar year 2012. FEED for our ammonia capacity expansion project was completed in November 2011. We expect our urea expansion project and DEF build-out to collectively cost approximately $5.8 million to complete, and we intend to use a portion of the net proceeds from our initial public offering, currently held as cash, to fund this project. We expect that the ammonia expansion project could cost approximately $100.0 million to complete, with approximately half of that amount expected to be spent during the fiscal year ending September 30, 2012. Under our new revolving credit facility, we do not have sufficient borrowing capacity to finance the entire cost of the ammonia capacity expansion project and the new revolving credit facility is designed to provide for seasonal working capital needs, not construction financing. As a result, we will need to obtain additional debt and/or equity financing to complete that project. There is no guarantee that we will obtain other debt or equity financing on a timely basis or acceptable terms or at all. Rentech may provide the initial debt financing for this project in order to enable us to keep the project on schedule as we seek additional debt financing to complete the project.
54
Table of Contents
Our estimated capital expenditures are subject to change due to unanticipated increases in the cost, scope and completion time for our capital projects. For example, we may experience increases in labor or equipment costs necessary to comply with government regulations or to complete projects that sustain or improve the profitability of our facility. Our future capital expenditures will be determined by the board of directors of our general partner.
CASH FLOWS
Operating Activities
Revenues were approximately $179.9 million for the fiscal year ended September 30, 2011 compared to approximately $131.4 million for the fiscal year ended September 30, 2010. This increase was primarily the result of higher prices paid for our products during fiscal year ended September 30, 2011, resulting from stronger demand for nitrogen fertilizer products during the period. Deferred revenue increased $19.6 million during the fiscal year ended September 30, 2011, versus a decrease of $3.7 million during the fiscal year ended September 30, 2010. This increase in deferred revenue was due to higher prepaid sales prices in fiscal year 2011 than in fiscal year 2010, and also a higher quantity of ammonia and UAN product presold in fiscal year 2011. The increase in revenues and deferred revenue from fiscal year 2011 to fiscal year 2010 are the primary reasons net cash flow from operating activities increased from $20.1 million in fiscal year 2010 to $83.7 million in fiscal year 2011. Net cash provided by operating activities decreased by $3.7 million from fiscal year 2009, to $20.1 million for fiscal year 2010, primarily due to lower fertilizer sales prices, partially offset by lower natural gas prices. Our profits, operating cash flows and cash available for distribution are subject to changes in the prices of our products and our primary feedstock, natural gas. Our products and feedstocks which are commodities, and, as such, their prices can be volatile in response to numerous factors outside of our control. In addition, the timing of product prepayment contracts and associated cash receipts are factors largely outside of our control that affect our profits, operating cash flows and cash available for distribution.
Net cash provided by operating activities for the fiscal year ended September 30, 2011 was approximately $83.7 million. We had net income of $24.9 million for the fiscal year ended September 30, 2011. During this period, we entered into the second amendment to our 2010 credit agreement and repaid a portion of the principal outstanding under our 2010 credit agreement. This transaction resulted in a loss on the extinguishment of debt of $4.6 million. We also entered into our 2011 credit agreement during this period and paid off the outstanding principal balance under our 2010 credit agreement. This transaction resulted in a loss on debt extinguishment of $9.2 million. These two transactions resulted in a total loss on debt extinguishment of $13.8 million. During the fiscal year ended September 30, 2011, we used $8.3 million of proceeds from our 2011 credit agreement to pay the prepayment penalty fee resulting from the prepayment of term loans under our 2010 credit agreement. During the fiscal year ended September 30, 2011, accounts receivable decreased by $5.0 million, due to having a high volume of summer sales in fiscal year ended September 30, 2010 which increased the September 30, 2010 balance. Accounts payable and accrued liabilities increased by $0.4 million and $4.6 million, respectively, during the fiscal year ended September 30, 2011 due to significant vendor invoices and accruals for turnaround activities in September 2011, as well as for significant capital expenditures during the turnaround. Inventories increased $9.2 million during the fiscal year ended September 30, 2011 due to having more summer sales contracts in fiscal year 2010, whereas in fiscal year 2011, it followed the normal seasonal trend of having more fall sales contracts, requiring high inventory levels at September 30, 2011 to fulfill those contracts. Deferred revenue increased $19.6 million during the fiscal year ended September 30, 2011. The increase was due to higher prepaid sales prices in the fiscal year ended September 30, 2011 than in the fiscal year ended September 30, 2010, and also a higher quantity of ammonia and UAN product presold in the fiscal year ended September 30, 2011.
Net cash provided by operating activities for the fiscal year ended September 30, 2010 was $20.1 million. We had net income of $5.0 million for fiscal year 2010. During the fiscal year ended September 30, 2010, we entered into our 2010 credit agreement, the proceeds from which were used to repay in full the term loan under the credit agreement we entered into in fiscal year 2008, or our 2008 credit agreement. This transaction resulted in a loss on the extinguishment of debt of $2.3 million. During the fiscal year ended September 30, 2010, accounts receivable increased by $0.9 million due to high summer sales volume, mainly resulting from some large shipments by barge. During the fiscal year ended September 30, 2009, we recorded a property insurance claim receivable for insured property losses related to a weather-related shutdown of our facility in January 2009. During the fiscal year ended September 30, 2010, we collected the outstanding balance of $1.8 million. Inventories decreased during the fiscal year ended September 30, 2010 by $4.7 million due to a combination of inventory levels having been high leading into the fiscal year from a seasonal build-up of inventory prior to the fall ammonia application season and reduction of inventories from higher than normal sales volumes during the summer of 2010, mainly due to some large shipments by barge. This was partially offset by higher costs of natural gas associated with product held in inventory. Deposits on natural gas purchase contracts increased by $1.6 million during the fiscal year ended September 30, 2010 due to timing of purchases and vendor selection, which impact payment terms. Deferred revenue resulting from product pre-sales decreased $3.7 million during the fiscal year ended September 30, 2010 due to timing of cash receipts on fall product prepayment contracts.
55
Table of Contents
Net cash provided by operating activities for the fiscal year ended September 30, 2009 was approximately $23.9 million. During the fiscal year ended September 30, 2009, we had net income of $28.2 million. Accounts receivable decreased by $3.8 million during the fiscal year ended September 30, 2009 due to reduced UAN sales and collection of old receivable balances. We recorded a property insurance claim receivable for insured property losses related to a weather-related shutdown of our facility in January 2009. Inventories decreased during the fiscal year ended September 30, 2009 by $5.3 million due to significant reductions in natural gas prices, partially offset by higher inventory levels at the end of the year. Deposits on natural gas contracts decreased by $17.6 million due to an unusually large amount of deposits required as of September 30, 2008 and a significant drop in natural gas prices after executing the commitments, causing the natural gas suppliers to require deposits to reduce their credit risk. Deferred revenue decreased by $44.6 million during the fiscal year ended September 30, 2009 due to both lower product prepayment prices and a lower volume of tons presold.
Investing Activities
Net cash used in investing activities was approximately $17.4 million, $11.6 million and $12.3 million, respectively, for the fiscal years ended September 30, 2011, 2010 and 2009. The increase in net additions of $5.8 million for the fiscal year ended September 30, 2011 compared to the fiscal year ended September 30, 2010 was primarily due to capital projects worked on during the turnaround which was started in September of 2011. The decrease in net additions of $0.6 million for the fiscal year ended September 30, 2010 compared to the fiscal year ended September 30, 2009 was primarily due to large capital projects for the ammonia plant at our facility, which were started and completed in the fiscal year ended September 30, 2009.
Financing Activities
Net cash used in financing activities was approximately $49.8 million, $10.3 million and $31.2 million, respectively, for the fiscal years ended September 30, 2011, 2010 and 2009. During the fiscal year ended September 30, 2011, concurrently with entering into the second amendment to our 2010 credit agreement, we and Rentech entered into a second incremental loan assumption agreement to borrow an additional $52.0 million, with an original issue discount of $1.0 million. We also entered into our 2011 credit agreement pursuant to which we borrowed $150.0 million, $85.4 million of which was used to pay off the outstanding principal balance under our 2010 credit agreement. Additionally, for the fiscal year ended September 30, 2011, in addition to $8.7 million of scheduled principal payments, we prepaid $20.0 million of outstanding principal in connection with the second amendment to our 2010 credit agreement, from cash on hand that we had reserved for such purpose, and $5.0 million as a mandatory prepayment in connection with the $5.0 million dividend paid by us to Rentech. During the fiscal year ended September 30, 2010, we replaced our 2008 credit agreement, which had an outstanding balance of $37.1 million and issuance costs of $0.9 million, with the net proceeds from our 2010 credit agreement, which had an initial principal amount of $62.5 million. Our 2010 credit agreement was amended on July 21, 2010 resulting in the increase of the principal balance to $67.5 million. Our 2010 credit agreement had an aggregate original issue discount amount of $3.1 million. For the fiscal year ended September 30, 2009, we made $15.9 million of payments pursuant to our 2008 credit agreement.
CONTRACTUAL OBLIGATIONS
The following table lists our significant contractual obligations and their future payments at September 30, 2011:
| Contractual Obligations |
Total | Less than 1 Year |
1-3 Years | 3-5 Years | More than 5 Years |
|||||||||||||||
| (in thousands) | ||||||||||||||||||||
| Term loan debt (1) |
$ | 146,250 | $ | 38,448 | $ | 35,776 | $ | 72,026 | $ | — | ||||||||||
| Interest payments on debt |
40,912 | 12,421 | 17,418 | 11,073 | — | |||||||||||||||
| Natural gas (2) |
14,370 | 14,370 | — | — | — | |||||||||||||||
| Purchase obligations (3) |
9,309 | 9,309 | — | — | — | |||||||||||||||
| Asbestos removal (4) |
268 | — | — | — | 268 | |||||||||||||||
| Operating leases |
279 | 231 | 40 | 8 | — | |||||||||||||||
| Gas and electric fixed charges (5) |
2,532 | 913 | 1,090 | 529 | — | |||||||||||||||
|
|
|
|
|
|
|
|
|
|
|
|||||||||||
| Total |
$ | 213,920 | $ | 75,692 | $ | 54,324 | $ | 83,636 | $ | 268 | ||||||||||
|
|
|
|
|
|
|
|
|
|
|
|||||||||||
56
Table of Contents
| (1) | The amounts presented represent contractual obligations under our 2011 credit agreement. Borrowings under our 2011 credit agreement bore interest at a variable rate based upon either Adjusted LIBOR (as defined in the 2011 credit agreement) or the lender’s Alternative Base Rate (as defined in the 2011 credit agreement), plus in each case an applicable margin. On November 9, 2011, we used approximately $150.8 million of the proceeds of our initial public offering to repay in full our 2011 credit agreement, including accrued interest and a prepayment penalty fee. On November 10, 2011, our operating company entered into the new revolving credit facility and paid associated financing costs of approximately $0.4 million. Borrowings under our new revolving credit facility will bear interest at a variable rate based upon either Adjusted LIBOR or the lender’s Alternative Base Rate, plus in each case an applicable margin. There is currently no outstanding advance under the new revolving credit facility. |
| (2) | As of September 30, 2011, the natural gas purchase contracts included delivery dates through March 31, 2012. Subsequent to September 30, 2011, we entered into additional fixed quantity natural gas supply contracts at fixed and indexed prices for various delivery dates through May 31, 2012. The total MMBtus associated with these additional contracts are approximately 2.1 million and the total amount of the purchase commitments are approximately $7.7 million, resulting in a weighted average rate per MMBtu of approximately $3.61. We are required to make additional prepayments under these purchase contracts in the event that market prices fall below the purchase prices in the contracts. |
| (3) | The amount presented represents certain open purchase orders with our vendors. Not all of our open purchase orders are purchase obligations, since some of the orders are not enforceable or legally binding on us until the goods are received or the services are provided. |
| (4) | We have a legal obligation to handle and dispose of asbestos at our facility in a special manner when undergoing major or minor renovations or when buildings at this location are demolished, even though the timing and method of settlement are conditional on future events that may or may not be in our control. As a result, we have developed an estimate for a conditional obligation for this disposal. In addition, we, through our normal repair and maintenance program, may encounter situations in which we are required to remove asbestos in order to complete other work. We applied the expected present value technique to calculate the fair value of the asset retirement obligation for the property and, accordingly, the asset and related obligation for the property have been recorded. Since we own the property and currently have no plans to dispose of the property, the obligation is considered long-term and, therefore, considered to be incurred more than five years after September 30, 2011. |
| (5) | As part of the gas transportation and electric supply contracts, we must pay monthly fixed charges over the term of the contracts. |
OFF-BALANCE SHEET ARRANGEMENTS
We did not have any material off-balance sheet arrangements as of September 30, 2011.
RECENT ACCOUNTING PRONOUNCEMENTS FROM FINANCIAL STATEMENT DISCLOSURES
In June 2009, the FASB issued a standard which provides guidance about the information that a reporting entity provides in its financial reports about a transfer of financial assets; the effects of a transfer on its financial position, financial performance and cash flows; and a transferor’s continuing involvement in transferred financial assets. This standard is effective for fiscal years beginning after November 15, 2009. It is effective for our fiscal years beginning on or after October 1, 2010. We did not transfer financial assets during the fiscal year ended September 30, 2011; therefore, the adoption of this standard did not have a material impact on our financial position, results of operations or disclosures.
In May 2011, the FASB issued guidance which clarifies previous guidance related to fair value measurement. This guidance is effective during interim and annual periods beginning after December 15, 2011. It is effective for our interim period beginning on January 1, 2012. Early application is not permitted. The adoption of this guidance is not expected to have a material impact on our financial position, results of operations or disclosures.
In June 2011, the FASB issued guidance on comprehensive income. Under the guidance, an entity has the option to present the total of comprehensive income, the components of net income, and the components of other comprehensive income either in a single continuous statement of comprehensive income or in two separate but consecutive statements. This standard is effective for fiscal years beginning after December 15, 2011. It is effective for our fiscal year beginning on October 1, 2012. Early adoption is permitted. There are no elements of comprehensive income included in our financial statements; therefore the adoption of this standard did not have a material impact on our financial position, results of operations or disclosures.
57
Table of Contents
| ITEM 7A. | QUANTITATIVE AND QUALITATIVE DISCLOSURES ABOUT MARKET RISK |
Interest Rate Risk. We were exposed to interest rate risk related to our borrowings under our 2011 credit agreement. Borrowings under our 2011 credit agreement bore interest at a variable rate based upon either Adjusted LIBOR (as defined in the 2011 credit agreement), or the lender’s Alternative Base Rate (as defined in the 2011 credit agreement), plus, in each case, an applicable margin. At September 30, 2011, three month LIBOR was approximately 0.374%, which was below the minimum of 1.5% in our 2011 credit agreement. As of September 30, 2011, we had outstanding borrowings under our 2011 credit agreement of $146.3 million. Based upon the outstanding balances of our variable-interest rate debt at September 30, 2011, and assuming interest rates are above the applicable minimum, and increase or decrease by 100 basis points, the potential annual increase or decrease in annual interest expense would be approximately $1.5 million. Under its current policies, we do not use interest rate derivative instruments to manage exposure to interest rate changes.
Commodity Price Risk. We are exposed to significant market risk due to potential changes in prices for fertilizer products and natural gas. Natural gas is the primary raw material used in the production of various nitrogen products manufactured at our facility. Currently, we purchase natural gas for use in our facility on the spot market, and through short-term, fixed supply, fixed price forward and index price purchase contracts. Natural gas prices have fluctuated during the last several years, increasing in 2008 and subsequently declining to the current lower levels. A hypothetical increase of $0.10 per MMBtu of natural gas would increase the cost to produce one ton of ammonia by approximately $3.50.
In the normal course of business, we currently produce nitrogen-based fertilizer products throughout the year to supply the needs of our customers during the high-delivery-volume spring and fall seasons. Fertilizer product inventory is subject to market risk due to fluctuations in the relevant commodity prices. We believe that market prices of nitrogen products are affected by changes in grain prices and demand, natural gas prices and other factors.
We enter into product prepayment contracts committing our customers to purchase our nitrogen fertilizer products at a later date. By using fixed-price forward contracts, we purchase approximately enough natural gas to manufacture the products that have been sold under product prepayment contracts for later delivery. We believe that entering into such fixed-price forward and pre-sale contracts effectively allows us to fix most of the gross margin on pre-sold product and mitigate risk of increasing market prices of natural gas or decreasing market prices of nitrogen products. However, this practice also subjects us to the risk of decreasing natural gas prices and increasing nitrogen fertilizer commodity prices after we have entered into the relevant fix-priced forward and product prepayment contracts. In addition, we occasionally make forward purchases of natural gas that are not directly linked to specific product prepayment contracts. To the extent we make such purchases, we also are exposed to fluctuations in natural gas prices.
58
Table of Contents
ITEM 8. FINANCIAL STATEMENTS AND SUPPLEMENTARY DATA
RENTECH NITROGEN PARTNERS, L.P.
INDEX TO FINANCIAL STATEMENTS
| Page | ||||
| Financial Statements of Rentech Energy Midwest Corporation: |
||||
| 60 | ||||
| 61 | ||||
| 62 | ||||
| 63 | ||||
| 64 | ||||
| Notes to Financial Statements |
66 | |||
| Financial Statements of Rentech Nitrogen Partners, L.P.: |
||||
| 78 | ||||
| 79 | ||||
| 80 | ||||
| 81 | ||||
| Notes to Financial Statements |
82 | |||
59
Table of Contents
Report of Independent Registered Public Accounting Firm
To the Board of Directors of Rentech Nitrogen GP, LLC and Unitholders of Rentech Nitrogen Partners, L.P.
In our opinion, the accompanying balance sheets and the related statements of operations, of stockholder’s equity and of cash flows present fairly, in all material respects, the financial position of Rentech Energy Midwest Corporation at September 30, 2011 and 2010, and the results of its operations and its cash flows for each of the three years in the period ended September 30, 2011 in conformity with accounting principles generally accepted in the United States of America. These financial statements are the responsibility of the Company’s management. Our responsibility is to express an opinion on these financial statements based on our audits. We conducted our audits of these statements in accordance with the standards of the Public Company Accounting Oversight Board (United States). Those standards require that we plan and perform the audit to obtain reasonable assurance about whether the financial statements are free of material misstatement. An audit includes examining, on a test basis, evidence supporting the amounts and disclosures in the financial statements, assessing the accounting principles used and significant estimates made by management, and evaluating the overall financial statement presentation. We believe that our audits provide a reasonable basis for our opinion.
As discussed in Note 2 of the financial statements, Rentech Energy Midwest Corporation has entered in to significant transactions with Rentech, Inc., its parent company, a related party.
/s/PricewaterhouseCoopers LLP
Los Angeles, California
December 14, 2011
60
Table of Contents
RENTECH ENERGY MIDWEST CORPORATION
(Amounts in thousands, except per share data)
| As of September 30, | ||||||||
| 2011 | 2010 | |||||||
| ASSETS |
||||||||
| Current assets |
||||||||
| Cash |
$ | 51,372 | $ | 34,934 | ||||
| Accounts receivable, net of allowance for doubtful accounts of $0 at September 30, 2011 and 2010 |
4,617 | 9,578 | ||||||
| Inventories |
16,512 | 6,966 | ||||||
| Deposits on gas contracts |
1,399 | 2,353 | ||||||
| Prepaid expenses and other current assets |
3,072 | 958 | ||||||
| Debt issuance costs |
2,316 | 1,548 | ||||||
| Other receivables, net |
553 | 91 | ||||||
| Deferred income taxes |
1,449 | 91 | ||||||
|
|
|
|
|
|||||
| Total current assets |
81,290 | 56,519 | ||||||
| Property, plant and equipment, net |
44,950 | 48,783 | ||||||
| Construction in progress |
20,318 | 2,474 | ||||||
| Other assets |
||||||||
| Debt issuance costs |
5,309 | 1,061 | ||||||
| Other assets |
541 | — | ||||||
|
|
|
|
|
|||||
| Total other assets |
5,850 | 1,061 | ||||||
|
|
|
|
|
|||||
| Total assets |
$ | 152,408 | $ | 108,837 | ||||
|
|
|
|
|
|||||
| LIABILITIES AND STOCKHOLDER’S EQUITY |
||||||||
| Current liabilities |
||||||||
| Accounts payable |
$ | 7,413 | $ | 2,426 | ||||
| Accrued payroll and benefits |
2,009 | 1,284 | ||||||
| Accrued liabilities |
11,495 | 2,913 | ||||||
| Deferred revenue |
34,081 | 14,473 | ||||||
| Due to parent company |
20,073 | — | ||||||
| Accrued interest |
41 | 23 | ||||||
| Term loan |
38,448 | 12,835 | ||||||
|
|
|
|
|
|||||
| Total current liabilities |
113,560 | 33,954 | ||||||
|
|
|
|
|
|||||
| Long-term liabilities |
||||||||
| Term loan, net of current portion |
107,802 | 48,040 | ||||||
| Deferred income taxes |
6,911 | 6,272 | ||||||
| Other |
268 | 237 | ||||||
|
|
|
|
|
|||||
| Total long-term liabilities |
114,981 | 54,549 | ||||||
|
|
|
|
|
|||||
| Total liabilities |
228,541 | 88,503 | ||||||
|
|
|
|
|
|||||
| Commitments and contingencies (Note 6) |
||||||||
| Stockholders’ equity |
||||||||
| Preferred stock — $100 par value; 120,000 shares authorized; no shares issued and outstanding at September 30, 2011 and 2010 |
— | — | ||||||
| Series A preferred stock — $100 par value; 30,000 shares authorized; no shares issued and outstanding at September 30, 2011 and 2010 |
— | — | ||||||
| Common stock — no par value; 1,000 shares authorized; 985 shares issued and outstanding at September 30, 2011 and 2010 |
— | — | ||||||
| Additional paid-in capital |
70,773 | 70,773 | ||||||
| Receivable from parent company |
— | (114,158 | ) | |||||
| Retained earnings |
(146,906 | ) | 63,719 | |||||
|
|
|
|
|
|||||
| Total stockholder’s equity |
(76,133 | ) | 20,334 | |||||
|
|
|
|
|
|||||
| Total liabilities and stockholder’s equity |
$ | 152,408 | $ | 108,837 | ||||
|
|
|
|
|
|||||
See Accompanying Notes to Financial Statements.
61
Table of Contents
RENTECH ENERGY MIDWEST CORPORATION
(Amounts in thousands, except per share data)
| For the Fiscal Years Ended September 30, | ||||||||||||
| 2011 | 2010 | 2009 | ||||||||||
| Revenues |
$ | 179,857 | $ | 131,396 | $ | 186,449 | ||||||
| Cost of sales |
103,286 | 106,020 | 125,888 | |||||||||
|
|
|
|
|
|
|
|||||||
| Gross profit |
76,571 | 25,376 | 60,561 | |||||||||
|
|
|
|
|
|
|
|||||||
| Operating expenses |
||||||||||||
| Selling, general and administrative expense |
5,786 | 4,497 | 4,758 | |||||||||
| Depreciation |
409 | 439 | 403 | |||||||||
| Loss on impairment |
— | 95 | — | |||||||||
| (Gain) loss on disposal of property, plant and equipment |
522 | (44 | ) | 87 | ||||||||
|
|
|
|
|
|
|
|||||||
| Total operating expenses |
6,717 | 4,987 | 5,248 | |||||||||
|
|
|
|
|
|
|
|||||||
| Operating income |
69,854 | 20,389 | 55,313 | |||||||||
|
|
|
|
|
|
|
|||||||
| Other income (expense), net |
||||||||||||
| Interest income |
51 | 57 | 190 | |||||||||
| Interest expense |
(13,752 | ) | (9,859 | ) | (8,481 | ) | ||||||
| Loss on debt extinguishment |
(13,816 | ) | (2,268 | ) | — | |||||||
| Other income (expense), net |
4 | 34 | (287 | ) | ||||||||
|
|
|
|
|
|
|
|||||||
| Total other expense, net |
(27,513 | ) | (12,036 | ) | (8,578 | ) | ||||||
|
|
|
|
|
|
|
|||||||
| Income before income taxes |
42,341 | 8,353 | 46,735 | |||||||||
| Income tax expense |
17,415 | 3,344 | 18,576 | |||||||||
|
|
|
|
|
|
|
|||||||
| Net income |
$ | 24,926 | $ | 5,009 | $ | 28,159 | ||||||
|
|
|
|
|
|
|
|||||||
See Accompanying Notes to Financial Statements.
62
Table of Contents
RENTECH ENERGY MIDWEST CORPORATION
Statements of Stockholder’s Equity
(Amounts in thousands)
| Additional | Total | |||||||||||||||||||||||
| Common Stock | Paid-in | Receivable from | Retained | Stockholder’s | ||||||||||||||||||||
| Shares | Amount | Capital | Parent Company | Earnings | Equity | |||||||||||||||||||
| Balance, September 30, 2008 |
985 | $ | — | $ | 70,773 | $ | (75,206 | ) | $ | 30,551 | $ | 26,118 | ||||||||||||
| Net advances to parent company |
— | — | — | (11,844 | ) | — | (11,844 | ) | ||||||||||||||||
| Net income |
— | — | — | — | 28,159 | 28,159 | ||||||||||||||||||
|
|
|
|
|
|
|
|
|
|
|
|
|
|||||||||||||
| Balance, September 30, 2009 |
985 | $ | — | $ | 70,773 | $ | (87,050 | ) | $ | 58,710 | $ | 42,433 | ||||||||||||
| Net advances to parent company |
— | — | — | (27,108 | ) | — | (27,108 | ) | ||||||||||||||||
| Net income |
— | — | — | — | 5,009 | 5,009 | ||||||||||||||||||
|
|
|
|
|
|
|
|
|
|
|
|
|
|||||||||||||
| Balance, September 30, 2010 |
985 | $ | — | $ | 70,773 | $ | (114,158 | ) | $ | 63,719 | $ | 20,334 | ||||||||||||
| Dividends paid |
— | — | — | 112,740 | (235,551 | ) | (122,811 | ) | ||||||||||||||||
| Net advances from parent company |
— | — | — | 1,418 | — | 1,418 | ||||||||||||||||||
| Net income |
— | — | — | — | 24,926 | 24,926 | ||||||||||||||||||
|
|
|
|
|
|
|
|
|
|
|
|
|
|||||||||||||
| Balance, September 30, 2011 |
985 | $ | — | $ | 70,773 | $ | — | $ | (146,906 | ) | $ | (76,133 | ) | |||||||||||
|
|
|
|
|
|
|
|
|
|
|
|
|
|||||||||||||
See Accompanying Notes to Financial Statements.
63
Table of Contents
RENTECH ENERGY MIDWEST CORPORATION
(Amounts in thousands)
| For the Fiscal Years Ended September 30, | ||||||||||||
| 2011 | 2010 | 2009 | ||||||||||
| Cash flows from operating activities |
||||||||||||
| Net income |
$ | 24,926 | $ | 5,009 | $ | 28,159 | ||||||
| Adjustments to reconcile net loss to net cash provided by operating activities |
||||||||||||
| Depreciation |
10,021 | 10,544 | 8,683 | |||||||||
| Utilization of spare parts |
1,698 | 1,521 | 1,676 | |||||||||
| Non-cash interest expense |
1,632 | 2,907 | 2,938 | |||||||||
| Loss on debt extinguishment |
13,816 | 2,268 | — | |||||||||
| Premiums on early payment of debt |
— | — | 452 | |||||||||
| Deferred income taxes |
(718 | ) | (2,846 | ) | 243 | |||||||
| Payment of call premium fee |
(8,261 | ) | — | — | ||||||||
| Other |
376 | 78 | 87 | |||||||||
| Changes in operating assets and liabilities: |
||||||||||||
| Accounts receivable |
4,962 | (861 | ) | 3,811 | ||||||||
| Property insurance claim receivable |
— | 1,795 | (1,795 | ) | ||||||||
| Other receivables |
(137 | ) | (82 | ) | 17 | |||||||
| Inventories |
(9,218 | ) | 4,655 | 5,278 | ||||||||
| Deposits on gas contracts |
955 | (1,629 | ) | 17,644 | ||||||||
| Prepaid expenses and other assets |
(1,118 | ) | 1,853 | 1,588 | ||||||||
| Accounts payable |
402 | 87 | (516 | ) | ||||||||
| Deferred revenue |
19,608 | (3,730 | ) | (44,605 | ) | |||||||
| Due to parent company |
20,073 | — | — | |||||||||
| Accrued interest |
18 | (414 | ) | (138 | ) | |||||||
| Accrued liabilities, accrued payroll and other |
4,633 | (1,011 | ) | 345 | ||||||||
|
|
|
|
|
|
|
|||||||
| Net cash provided by operating activities |
83,668 | 20,144 | 23,867 | |||||||||
|
|
|
|
|
|
|
|||||||
| Cash flows from investing activities |
||||||||||||
| Purchase of property, plant, equipment and construction in progress |
(17,411 | ) | (11,597 | ) | (12,259 | ) | ||||||
| Proceeds from disposal of property, plant and equipment |
25 | 14 | — | |||||||||
|
|
|
|
|
|
|
|||||||
| Net cash used in investing activities |
(17,386 | ) | (11,583 | ) | (12,259 | ) | ||||||
|
|
|
|
|
|
|
|||||||
| Cash flows from financing activities |
||||||||||||
| Proceeds from term loan, net of original issue discount |
200,960 | 64,425 | — | |||||||||
| Retirement of term loan, including costs |
(85,383 | ) | (38,040 | ) | — | |||||||
| Payment of debt issuance costs |
(8,747 | ) | (4,060 | ) | (498 | ) | ||||||
| Payments on premiums of early payments of debt |
— | — | (452 | ) | ||||||||
| Payments on term loan |
(33,658 | ) | (4,209 | ) | (15,888 | ) | ||||||
| Payments on notes payable for financed insurance premiums |
(1,623 | ) | (1,296 | ) | (575 | ) | ||||||
| Payment of dividends |
(122,811 | ) | — | — | ||||||||
| Net receipts from (advances to) parent company |
1,418 | (27,108 | ) | (13,802 | ) | |||||||
|
|
|
|
|
|
|
|||||||
| Net cash used in financing activities |
(49,844 | ) | (10,288 | ) | (31,215 | ) | ||||||
|
|
|
|
|
|
|
|||||||
| Increase (decrease) in cash |
16,438 | (1,727 | ) | (19,607 | ) | |||||||
| Cash and cash equivalents, beginning of year |
34,934 | 36,661 | 56,268 | |||||||||
|
|
|
|
|
|
|
|||||||
| Cash and cash equivalents, end of year |
$ | 51,372 | $ | 34,934 | $ | 36,661 | ||||||
|
|
|
|
|
|
|
See Accompanying Notes to Financial Statements.
64
Table of Contents
RENTECH ENERGY MIDWEST CORPORATION
Statements of Cash Flows—Continued
(Amounts in thousands)
For the fiscal years ended September 30, 2011, 2010 and 2009, the Company made certain cash payments as follows:
| For the Fiscal Years Ended September 30, | ||||||||||||
| 2011 | 2010 | 2009 | ||||||||||
| Cash payments of interest |
$ | 12,102 | $ | 7,366 | $ | 5,681 | ||||||
Excluded from the statements of cash flows were the effects of certain non-cash financing and investing activities as follows:
| For the Fiscal Years Ended September 30, | ||||||||||||
| 2011 | 2010 | 2009 | ||||||||||
| Purchase of insurance policies financed with notes payable |
$ | 1,537 | $ | 1,547 | $ | 1,150 | ||||||
| Receivable from parent company reclassified as dividend |
112,740 | — | — | |||||||||
| Receivable for sales of property, plant and equipment |
325 | — | — | |||||||||
| Consideration received for warrants – non-cash contribution from Rentech |
— | — | 1,577 | |||||||||
| Purchase of insurance policies financed by Rentech |
— | — | 381 | |||||||||
| Record asset retirement obligation asset and liability |
— | — | 210 | |||||||||
| Purchase of property, plant, equipment and construction in progress in accounts payable and accrued liabilities |
9,605 | 261 | 2,008 | |||||||||
See Accompanying Notes to Financial Statements
65
Table of Contents
Note 1 — Description of Business
Description of Business
Rentech Energy Midwest Corporation (“REMC”, “we”, or “the Company”) owns and operates a nitrogen fertilizer manufacturing plant that uses natural gas as its feedstock. REMC’s plant, located in East Dubuque, Illinois (the “Plant”), manufactures and sells within the corn-belt region of the United States natural gas-based nitrogen fertilizer and industrial products including ammonia, urea ammonium nitrate, urea granule and urea solution, nitric acid, and liquid carbon dioxide.
In fiscal years 2009, 2010 and 2011, REMC was a wholly-owned subsidiary of Rentech, Inc. (“Rentech”). On November 9, 2011, Rentech Nitrogen Partners, L.P. (the “Partnership”) completed its initial public offering (the “Offering”) of 15,000,000 common units representing limited partner interests at a public offering price of $20.00 per common unit. The common units sold to the public in the Offering represent approximately 39.2% of the Partnership common units outstanding as of the closing of the Offering. Rentech Nitrogen Holdings, Inc. (“RNHI”), Rentech’s indirect wholly-owned subsidiary, owns the remaining 60.8% of the Partnership common units and Rentech Nitrogen GP, LLC (the “General Partner”), RNHI’s wholly-owned subsidiary, owns 100% of the non-economic general partner interest in us. The Partnership’s assets consist of all of the equity interests of REMC, which owns the Plant. At the Offering, REMC was converted into a limited liability company, Rentech Nitrogen, LLC. For additional information refer to Note 11—Subsequent Events. Included in prepaid expenses and other assets at September 30, 2011 is $2.0 million of legal, accounting and other costs related to the Offering which will be offset against the proceeds from the Offering in the Partnership’s financial statements for the fiscal year ended September 30, 2012.
Note 2 — Summary of Certain Significant Accounting Policies
Presentation
REMC has been consolidated with Rentech’s operations since it was acquired by Rentech in 2006. During that time REMC has benefitted from certain corporate services provided by Rentech. These financial statements reflect REMC on a stand-alone or “carve-out” basis and certain corporate overhead costs were allocated to REMC and certain transactions between the Company and Rentech were re-categorized as if REMC were a standalone entity. Management believes that the method used to allocate the corporate overhead costs is reasonable and reflects management’s estimate of what the expenses would have been on a stand-alone basis for REMC.
Intercompany loans and advances from REMC to Rentech are recorded in a contra-equity account Receivable from Parent Company. No interest has been recorded on this receivable. Amortization of the discount on REMC’s term loan, which was recorded by Rentech, was pushed down to REMC. An estimate of the cost of time spent on REMC’s matters by the Rentech human resource, legal, information systems, accounting and finance, and investor relations departments has been reflected in REMC’s statements of operations. A percentage of third party costs relating to the information technology operating system was pushed down to REMC. Actual audit and tax services expenses for REMC were pushed down to REMC. The percentage of the expense for an employee at Rentech who was responsible for overseeing the operations at REMC was also pushed down to REMC. Rentech over the years granted Restricted Stock Units and stock options to employees of REMC. The related stock based compensation for such grants was recorded by Rentech. These costs have also been recorded by REMC in these financial statements. Total operating expenses pushed down to REMC were $2,026,000, $1,414,000 and $1,648,000 for the fiscal years ended September 30, 2011, 2010 and 2009, respectively. The entries relating to income taxes have been determined on a separate return basis.
Certain fiscal year ended September 30, 2010 amounts have been reclassified to conform to the fiscal year ended September 30, 2011 presentation.
Revisions
The Company has revised its December 31, 2010 and 2009 statement of cash flows to correct errors related to noncash activities for capital expenditures which were included as operating and investing activities in these years. The errors decreased net cash provided by operating activities and net cash used in investing activities by $1.7 million for the fiscal year ended September 30, 2010. The errors increased net cash provided by operating activities and net cash used in investing activities by $0.4 million for the fiscal year ended September 30, 2009. The impact of these errors on the previously issued six-month ended March 31, 2011 and nine-month ended June 30, 2011, increased net cash provided by operating activities and net cash used in investing activities by $0.7 million and $3.5 million, respectively. The Company has evaluated this error and determined that the impact to the previously issued financial statements was not material.
66
Table of Contents
Subsequent Events
The Company has evaluated events, if any, which occurred subsequent to September 30, 2011 through the date these financial statements were issued, to ensure that such events have been properly reflected in these statements.
Use of Estimates
The preparation of financial statements in conformity with accounting principles generally accepted in the United States of America requires management to make estimates and assumptions that affect the reported amounts of assets and liabilities, the disclosure of contingent assets and liabilities at the date of the financial statements, and the reported amounts of revenues and expenses during the reporting period. Actual results could differ from those estimates.
Fair Value of Financial Instruments
The following methods and assumptions were used to estimate the fair value of each class of financial instruments for which it is practicable to estimate that value. Fair values of receivables, other current assets, accounts payable, accrued liabilities and other current liabilities were assumed to approximate carrying values for these financial instruments since they are short term in nature and their carrying amounts approximate fair value or they are receivable or payable on demand. The carrying amount of debt outstanding also approximates fair value as of September 30, 2011 and 2010 because interest rates on these instruments approximate the interest rate on debt with similar terms available to the Company.
Revenue Recognition
Revenues from our nitrogen products are recognized when customers take ownership upon shipment from the Plant or its leased facility and assumes risk of loss, collection of the related receivable is probable, persuasive evidence of a sale arrangement exists and the sales price is fixed or determinable. Management assesses the business environment, the customer’s financial condition, historical collection experience, accounts receivable aging and customer disputes to determine whether collectability is reasonably assured. If collectability is not considered reasonably assured at the time of sale, the Company does not recognize revenue until collection occurs.
Natural gas, though not purchased for the purpose of resale, is occasionally sold. Natural gas is sold when contracted quantities received are in excess of production and storage capacities, in which case the sales price is recorded in revenues and the related cost is recorded in cost of sales. Natural gas is also sold with a simultaneous gas purchase in order to receive a benefit that reduces raw material cost, in which case the net of the sales price and the related cost of sales are recorded within cost of sales.
On April 26, 2006, Rentech’s subsidiary, Rentech Development Corporation, entered into a Distribution Agreement (the “Distribution Agreement”) with Royster-Clark Resources, LLC, who subsequently assigned the agreement to Agrium U.S.A., Inc. (“Agrium”). The Distribution Agreement is for a 10 year period, subject to renewal options. Pursuant to the Distribution Agreement, Agrium is obligated to use commercially reasonable efforts to promote the sale of, and solicit and secure orders from its customers for nitrogen fertilizer products manufactured at the Plant, and to purchase from REMC nitrogen fertilizer products manufactured at the facility for prices to be negotiated in good faith from time to time. Under the Distribution Agreement, Agrium is appointed as the exclusive distributor for the sale, purchase and resale of nitrogen products manufactured at the Plant. Sale terms are negotiated and approved by REMC. Agrium bears the credit risk on products sold through Agrium pursuant to the Distribution Agreement. If an agreement is not reached on the terms and conditions of any proposed Agrium sale transaction, REMC has the right to sell to third parties provided the sale is on the same timetable and volumes and at a price not lower than the one proposed by Agrium. For the fiscal years ended September 30, 2011, 2010 and 2009, the Distribution Agreement accounted for 83%, 80%, and 85%, respectively, of net revenues from continuing operations. Receivables from Agrium accounted for 77% and 86% of the total accounts receivable balance of the Company as of September 30, 2011 and 2010, respectively. REMC employs personnel who negotiate sales with other customers and these transactions are not subject to the terms of the Distribution Agreement.
Under the Distribution Agreement, REMC pays commissions to Agrium not to exceed $5 million during each contract year on applicable gross sales during the first 10 years of the agreement. The commission rate was 2% during the first year of the agreement and increased by 1% on each anniversary date of the agreement up to the current maximum rate of 5%. For the fiscal years ended September 30, 2011, 2010 and 2009, the effective commission rate associated with sales under the Distribution Agreement were 4.3%, 4.2% and 2.3%, respectively.
REMC derives substantially all of its revenues and cash flows from the production and sale of nitrogen fertilizers, and it sells a majority of its nitrogen products to customers located in its core market. REMC sold over 90% of its nitrogen products to customers for agricultural uses during each of the fiscal years ended September 30, 2011, 2010 and 2009. Given the nature of its business, and consistent with industry practice, REMC does not have long-term minimum purchase contracts with any of its customers.
67
Table of Contents
Deferred Revenue
The Company records a liability for deferred revenue to the extent that payment has been received under product prepayment contracts, which create obligations for delivery of product within a specified period of time in the future. The terms of these product prepayment contracts require payment in advance of delivery. The Company recognizes revenue related to the product prepayment contracts and relieves the liability for deferred revenue when products are shipped. A significant portion of the revenue recognized during any period may be related to product prepayment contracts, for which cash was collected during an earlier period, with the result that a significant portion of revenue recognized during a period may not generate cash receipts during that period. As of September 30, 2011 and 2010, deferred revenue was $34,081,000 and $14,473,000, respectively.
Cost of Sales
Cost of sales are comprised of manufacturing costs related to the Company’s nitrogen fertilizer and industrial products. Cost of sales expenses include direct materials such as natural gas, direct labor, indirect labor, employee fringe benefits, depreciation on plant machinery and other costs, including shipping and handling charges incurred to transport products sold.
The Company enters into short-term contracts to purchase physical supplies of natural gas in fixed quantities at both fixed and indexed prices. We anticipate that we will physically receive the contract quantities and use them in the production of fertilizer and industrial products. We believe it probable that the counterparties will fulfill their contractual obligations when executing these contracts. Natural gas purchases, including the cost of transportation to the Plant, are recorded at the point of delivery into the pipeline system.
Accounting for Derivative Instruments
We elect the normal purchase normal sale exemption for our derivative instruments. As such, we do not recognize the unrealized gains or losses in our financial statements.
Cash
The Company has various checking and savings accounts with major financial institutions. At times balances with these financial institutions may be in excess of federally insured limits.
Accounts Receivable
Trade receivables are initially recorded at fair value based on the sale of goods to customers and are stated net of allowances.
Allowance for Doubtful Accounts
The allowance for doubtful accounts reflects the Company’s best estimate of probable losses inherent in the accounts receivable balance. The Company determines the allowance based on known troubled accounts, historical experience, and other currently available evidence. The Company reviews its allowance for doubtful accounts quarterly. Past due balances over 90 days and over a specified amount are reviewed individually for collectibility. Account balances are charged off against the allowance after all means of collection have been exhausted and the potential for recovery is considered remote.
Inventories
Inventories consist of raw materials and finished goods. The primary raw material in the production of nitrogen products is natural gas. Raw materials also include certain chemicals used in the manufacturing process. Finished goods include the nitrogen products stored at the Plant that are ready for shipment along with any inventory that may be stored at a remote facility. The Company allocates fixed production overhead costs to inventory based on the normal capacity of its production facilities and unallocated overhead costs are recognized as expense in the period incurred. At September 30, 2011 and 2010, inventories on the balance sheets included depreciation of $836,000 and $513,000, respectively.
Inventories are stated at the lower of cost or estimated net realizable value. The cost of inventories is determined using the first-in first-out method. The estimated net realizable value is based on customer orders, market trends and historical pricing. The Company performs on at least a quarterly basis an analysis of its inventory balances to determine if the carrying amount of inventories exceeds their net realizable value. If the carrying amount exceeds the estimated net realizable value, the carrying amount is reduced to the estimated net realizable value.
Deposits on Gas Contracts
The Company enters into forward contracts with fixed delivery prices to purchase portions of the natural gas required to produce fertilizer for the Company’s nitrogen fertilizer business. Some of the forward contracts require the Company to pay a deposit for the natural gas at the time of contract signing, and all of the contracts require deposits in the event that the market price for natural gas falls after the date of the contract to a price below the fixed price in the contracts.
68
Table of Contents
Property, Plant and Equipment
Property, plant and equipment is stated at cost less accumulated depreciation. Depreciation expense is calculated using the straight-line method over the estimated useful lives of the assets, as follows:
| Type of Asset |
Estimated Useful Life | |
| Building and building improvements |
30-40 years | |
| Land improvements |
15-20 years | |
| Machinery and equipment |
7-10 years | |
| Furniture, fixtures and office equipment |
7-10 years | |
| Computer equipment and software |
3-5 years | |
| Vehicles |
3-5 years | |
| Spare parts |
Useful life of the spare parts or the related equipment | |
| Ammonia catalyst |
3-10 years | |
| Platinum catalyst |
Based on units of production |
Significant renewals and betterments are capitalized. Costs of maintenance and repairs are expensed as incurred. Approximately every two years, REMC incurs turnaround expenses which represent the cost of shutting down the Plant for planned maintenance. Such costs are expensed as incurred. When property, plant and equipment is retired or otherwise disposed of, the asset and accumulated depreciation are removed from the accounts and the resulting gain or loss is reflected in operating expenses.
Spare parts are maintained by REMC to reduce the length of possible interruptions in plant operations from an infrastructure breakdown at the Plant. The spare parts may be held for use for many years before the spare parts are used. As a result, they are capitalized as a fixed asset at cost and are depreciated on a straight-line basis over the useful life of the related equipment until the spare parts are installed. When spare parts are utilized, the net book values of the assets are charged to earnings as a cost of sale. Periodically, the spare parts are evaluated for obsolescence and impairment and if the value of the spare parts is impaired, it is charged against earnings.
Long-lived assets and construction in progress are reviewed whenever events or changes in circumstances indicate that the carrying amount may not be recoverable. If the expected future cash flow from the use of the asset and its eventual disposition is less than the carrying amount of the asset, an impairment loss is recognized and measured using the asset’s fair value.
The Company capitalizes certain direct development costs associated with internal-use software, including external direct costs of material and services, and payroll costs for employees devoting time to software implementation projects. Costs incurred during the preliminary project stage, as well as maintenance and training costs, are expensed as incurred.
Grants that compensate the Company for the cost of property, plant and equipment are recorded as a reduction to the cost of the related asset and are recognized over the useful life of the asset by reducing depreciation expense.
Construction in Progress
We also capitalize costs for improvements to the existing machinery and equipment at our facility and certain costs associated with our information technology initiatives. We do not depreciate construction in progress costs until the underlying assets are placed into service.
Income Taxes
REMC is not a separate tax-paying entity. REMC is included in Rentech’s consolidated federal and certain state income tax groups for income tax reporting purposes and is responsible for its separate company income taxes calculated upon its taxable income at a current estimate of the annual effective tax rate. On a separate return basis, the Company has income taxes payable owed to Rentech.
The Company accounts for income taxes in accordance with applicable accounting guidance. Such accounting guidance requires deferred tax assets and liabilities to be recognized for temporary differences between the tax basis and financial reporting basis of assets and liabilities, computed at the expected tax rates for the periods in which the assets or liabilities will be realized, as well as for the expected tax benefit of net operating loss and tax credit carryforwards.
69
Table of Contents
The realization of deferred income tax assets is dependent on the generation of taxable income in appropriate jurisdictions during the periods in which those temporary differences are deductible. Management considers the scheduled reversal of deferred income tax liabilities, projected future taxable income, and tax planning strategies in determining the amount of the valuation allowance. Based on the level of historical taxable income and projections for future taxable income over the periods in which the deferred income tax assets are deductible, management determines if it is more likely than not that the Company will realize the benefits of these deductible differences. As of September 30, 2011, the most significant factor considered in determining the realizability of these deferred tax assets was our profitability over the past three years. Management believes that at this point in time, it is more likely than not that the deferred tax assets will be realized.
Accounting guidance prescribes a recognition threshold and measurement attribute for the financial statement recognition and measurement of a tax position taken or expected to be taken in a tax return. The guidance requires that the Company recognize in its financial statements, only those tax positions that are “more-likely-than-not” of being sustained, based on the technical merits of the position. The Company has performed a comprehensive review of its material tax positions in accordance with accounting guidance and has determined that no uncertain tax positions exist.
In accordance with its accounting policy, the Company recognizes accrued interest and penalties related to unrecognized tax benefits as a component of tax expense. Since the Company has no uncertain tax positions, no interest or penalties have been accrued related to uncertain tax positions in the balance sheet or statement of operations. The Company is subject to examination for federal and Illinois income taxes for the tax years ended September 30, 2007 through September 30, 2009.
While management believes the Company has adequately provided for all tax positions, amounts asserted by taxing authorities could materially differ from our accrued positions as a result of uncertain and complex application of tax regulations. Additionally, the recognition and measurement of certain tax benefits includes estimates and judgment by management and inherently includes subjectivity. Accordingly, additional provisions on federal and state tax-related matters could be recorded in the future as revised estimates are made or the underlying matters are settled or otherwise resolved.
Recent Accounting Pronouncements
In June 2009, the Financial Accounting Standards Board (the “FASB”) issued a standard providing guidance about the information that a reporting entity provides in its financial reports about a transfer of financial assets; the effects of a transfer on its financial position, financial performance, and cash flows; and a transferor’s continuing involvement in transferred financial assets. This standard is effective for fiscal years beginning after November 15, 2009. It is effective for the Company’s fiscal year beginning on October 1, 2010. The Company did not transfer financial assets during the fiscal year ended September 30, 2011; therefore the adoption of this standard did not have any impact on the Company’s financial position, results of operations or disclosures for the fiscal year ended September 30, 2011.
In May 2011, the FASB issued guidance clarifying previous guidance related to fair value measurement. This guidance is effective during interim and annual periods beginning after December 15, 2011. It is effective for the Company’s interim period beginning on January 1, 2012. Early application is not permitted. The adoption of this guidance is not expected to have a material impact on the Company’s financial position, results of operations or disclosures.
In June 2011, the FASB issued guidance on comprehensive income. Under the guidance, an entity has the option to present the total of comprehensive income, the components of net income, and the components of other comprehensive income either in a single continuous statement of comprehensive income or in two separate but consecutive statements. This standard is effective for fiscal years beginning after December 15, 2011. It is effective for the Company’s fiscal year beginning on October 1, 2012. Early adoption is permitted. There are no elements of comprehensive income included in the Company’s financial statements; therefore the adoption of this standard did not have a material impact on the Company’s financial position, results of operations or disclosures.
70
Table of Contents
Note 3 — Inventories
Inventories consisted of the following:
| As of September 30, | ||||||||
| 2011 | 2010 | |||||||
| (in thousands) | ||||||||
| Finished goods |
$ | 16,020 | $ | 6,338 | ||||
| Raw materials |
492 | 628 | ||||||
|
|
|
|
|
|||||
| Total inventory |
$ | 16,512 | $ | 6,966 | ||||
|
|
|
|
|
|||||
Note 4 — Property, Plant and Equipment
Property, plant and equipment consisted of the following:
| As of September 30, | ||||||||
| 2011 | 2010 | |||||||
| (in thousands) | ||||||||
| Land and land improvements |
$ | 1,281 | $ | 1,210 | ||||
| Buildings and building improvements |
5,140 | 5,352 | ||||||
| Machinery and equipment |
77,822 | 73,967 | ||||||
| Furniture, fixtures and office equipment |
57 | 57 | ||||||
| Computer equipment and computer software |
1,998 | 1,964 | ||||||
| Vehicles |
125 | 125 | ||||||
| Conditional asset (asbestos removal) |
210 | 210 | ||||||
|
|
|
|
|
|||||
| 86,633 | 82,885 | |||||||
| Less accumulated depreciation |
(41,683 | ) | (34,102 | ) | ||||
|
|
|
|
|
|||||
| Total depreciable property, plant and equipment, net |
$ | 44,950 | $ | 48,783 | ||||
|
|
|
|
|
|||||
The Company has a legal obligation to handle and dispose of asbestos at its Plant in a special manner when undergoing major or minor renovations or when buildings at this location are demolished, even though the timing and method of settlement are conditional on future events that may or may not be in its control. As a result, the Company has developed an estimate for a conditional obligation for this disposal. In addition, the Company, through its normal repair and maintenance program, may encounter situations in which it is required to remove asbestos in order to complete other work. The Company applied the expected present value technique to calculate the fair value of the asset retirement obligation for the property and, accordingly, the asset and related obligation for the property have been recorded. In accordance with the applicable guidance, the liability is increased over time and such increase is recorded as accretion expense. The liability at September 30, 2011 and 2010 was $268,000 and $237,000, respectively. The accretion expense for the fiscal years ended September 30, 2011, 2010 and 2009 was $31,000, $27,000 and $0, respectively.
Note 5 — Debt
The Company, through Rentech, enters into non-collateralized short-term notes payable to finance insurance premiums. During the fiscal year ended September 30, 2010, the Company entered into non-collateralized short-term notes payable to finance insurance premiums totaling $1,547,000. The notes payable bore interest between 2.55% and 3.28% with monthly payments of principal and interest and a scheduled maturity date in March 2011. The balance due as of September 30, 2010 was $821,000 which was included in accrued liabilities. During the fiscal year ended September 30, 2011, the Company entered into non-collateralized short-term notes payable to finance insurance premiums totaling $1,537,000. The notes payable bear interest between 2.55% and 3.04% with monthly payments of principal and interest and a scheduled maturity date in March 2012. The balance due as of September 30, 2011 was $734,000 which was included in accrued liabilities.
On June 13, 2008, Rentech and REMC executed an amended and restated credit agreement (the “2008 Credit Agreement”) by and among REMC as the borrower, Rentech as a guarantor, Credit Suisse, Cayman Islands Branch (“Credit Suisse”), as administrative agent and collateral agent and the lenders party thereto for the principal amount of $53,000,000.
Term loans outstanding under the 2008 Credit Agreement bore interest at the election of REMC of either: (a)(i) the greater of LIBOR or 3%, plus (a)(ii) 10.0%; or (b)(i) the greater of 4%, the prime rate, as determined by Credit Suisse, or 0.5% in excess of the federal funds effective rate, plus (b)(ii) 9.0%. Interest payments were made on a quarterly basis, as required by the terms of the agreement.
On January 14, 2009, REMC entered into the First Amendment to Amended and Restated Credit Agreement and Waiver (the “2009 First Amendment and Waiver”). In addition to an increase in interest rates and certain fees to the lenders and its advisors, as further consideration for the 2009 First Amendment and Waiver, Rentech sold to Credit Suisse Management LLC, SOLA LTD and Solus Core Opportunities Master Fund Ltd., for an aggregate issue price of approximately $50,000, warrants to purchase 4,993,379
71
Table of Contents
shares of Rentech’s common stock, or 3% of Rentech’s outstanding shares at the time of issuance. The exercise price of $0.92 per share for each warrant was a 20% premium above the weighted average price for Rentech’s stock over the 10 trading days preceding the January 14, 2009 closing date of the 2009 First Amendment and Waiver. Seventy-five percent of the warrants were immediately exercisable and expire 5 years from the grant date. The remaining 25% of the warrants were set to expire on the maturity date of the term loan. This portion of the warrants vested and became exercisable July 1, 2009.
On January 29, 2010, Rentech and REMC replaced the 2008 Credit Agreement with a senior collateralized credit agreement (the “2010 Credit Agreement”) with Credit Suisse, as administrative agent and collateral agent, and the lenders party thereto. Under the 2010 Credit Agreement, REMC borrowed $62.5 million in the form of new collateralized term loans (the “2010 Initial Term Loans”), the proceeds of which were used to repay the term loan outstanding under the 2008 Credit Agreement (the principal amount of which at the time of prepayment was $37 million), to make an intercompany loan to Rentech in the amount of $18 million and to pay related fees and expenses. The 2010 Initial Term Loans were issued with original issue discount of 3%. The payoff of the term loan under the 2008 Credit Agreement was considered an early extinguishment of debt. As a result, for the fiscal year ended September 30, 2010, loss on debt extinguishment of $2.3 million was recorded in the consolidated statements of operations.
On July 21, 2010, REMC and Rentech entered into an amendment to credit agreement, waiver and collateral agent consent to the 2010 Credit Agreement (the “First Amendment”). The First Amendment included an early prepayment by REMC of $15 million of principal of the 2010 Initial Term Loans outstanding, and a simultaneous borrowing of an additional $20 million (the “First Incremental Loan”), with proceeds of approximately $18.5 million transferred to Rentech in the form of an intercompany loan. The First Incremental Loan was issued with original issue discount of 6%. The other terms of the First Incremental Loan, including without limitation, the maturity date, interest rate and collateral security, are the same as the Initial Term Loans.
On November 24, 2010, Rentech and REMC entered into a Second Amendment to Credit Agreement, Waiver and Collateral Agent Consent (the “Second Amendment”) to the 2010 Credit Agreement with certain subsidiaries of Rentech, certain lenders party thereto and Credit Suisse, as administrative agent and collateral agent.
The Second Amendment included an early prepayment by REMC of $20 million of principal of the 2010 Initial Term Loans outstanding, and a simultaneous borrowing of an additional $52.0 million (the “Second Incremental Loan”), with proceeds of approximately $50.85 million distributed to Rentech in the form of a dividend from REMC. The Second Incremental Loan was issued with an original issue discount of 2%. In addition, the Second Amendment, among other things permitted a special distribution of up to $5 million by REMC to Rentech upon the satisfaction of certain conditions, and on March 11, 2011 REMC made the $5 million dividend to Rentech. Simultaneously with this distribution, REMC made a mandatory early prepayment of the term loan of $5 million.
All outstanding term loans under the 2010 Credit Agreement incurred interest, at the election of REMC, at either (a)(i) the greater of LIBOR or 2.5%, plus (ii) 10.0% or (b)(i) the greatest of (w) the prime rate, as determined by Credit Suisse, (x) 0.5% in excess of the federal funds effective rate, (y) LIBOR plus 1.0% or (z) 3.5% plus (ii) 9.0%. Interest payments were made on a quarterly basis and were subject to annual amortization, payable quarterly, of 7.5% of the outstanding principal amount in calendar years 2010 and 2011.
On June 10, 2011, Rentech and REMC entered into a five-year $150.0 million collateralized term loan facility pursuant to a credit agreement (the “2011 Credit Agreement”) among REMC, Rentech, certain subsidiaries of Rentech, certain lenders party thereto and Credit Suisse. The Company paid upfront fees to the lenders under the 2011 Credit Agreement equal to 2.0% of the aggregate principal amount of the term loans. The term loans incurred interest, upon the Company’s election, at either (a)(i) the greater of LIBOR and 1.5%, plus (ii) 8.5% or (b)(i) the greatest of (w) the prime rate, as determined by Credit Suisse, (x) 0.5% in excess of the federal funds effective rate, (y) LIBOR plus 1.0% and (z) 2.5% plus (ii) 7.5%. Interest payments were generally required to be made on a quarterly basis. The term loans were subject to amortization, payable quarterly, of 2.5% of the original principal amount until March 31, 2016. The remaining unpaid principal balance was payable on June 10, 2016, the maturity date. The term loans could be prepaid voluntarily at any time. In the first year, voluntary prepayments of the term loans could be made subject to a prepayment fee of 2.0% of the amount prepaid, and if prepaid in the second year, 1.0% of the amount prepaid. Voluntary prepayments made after the second anniversary of the closing date of the loan could be prepaid without any prepayment fee. REMC used a portion of the net proceeds of the 2011 Credit Agreement to repay amounts outstanding under the 2010 Credit Agreement in full, and to pay related fees and expenses.
The 2011 Credit Agreement required that a certain percentage of excess cash flow from REMC, as defined in the 2011 Credit Agreement, be applied to repay outstanding principal. The percentage of REMC’s excess cash flow required to be applied as a prepayment depended on REMC’s leverage ratio as of the relevant calculation date and the aggregate outstanding principal amount of loans under the 2011 Credit Agreement on such date.
72
Table of Contents
The obligations under the 2011 Credit Agreement were collateralized by substantially all of the Company’s assets, the assets of Rentech and the assets of most of Rentech’s subsidiaries, including a pledge of the equity interests in many of the Rentech’s subsidiaries. In addition, REMC granted the lenders a mortgage on its real property to collateralize its obligations under the 2011 Credit Agreement and related loan documents. The obligations under the 2011 Credit Agreement were also guaranteed by Rentech and certain of its subsidiaries. The 2011 Credit Agreement contained restrictions on the amount of cash that could be transferred from REMC to Rentech or its non-REMC subsidiaries. The 2011 Credit Agreement included restrictive covenants that limit, among other things, Rentech and certain of its subsidiaries’ ability to dispose of assets, pay cash dividends and repurchase stock.
The Second Amendment was accounted for as an extinguishment of debt, taking into consideration the change in future cash flows after this amendment and amendments in the preceding 12 months. As a result, for the fiscal year ended September 30, 2011, a loss on extinguishment of debt, related to the Second Amendment, of $4.6 million was recorded in the statements of operations. The 2011 Credit Agreement was also accounted for as an extinguishment of debt. As a result, for the fiscal year ended September 30, 2011, a loss on extinguishment of debt, related to the entry into the 2011 Credit Agreement and repayment of the 2010 Credit Agreement, of $9.2 million was recorded in the statements of operations, resulting in a total loss on debt extinguishment, related to the Second Amendment and the 2011 Credit Agreement, of $13.8 million.
As of September 30, 2011, the Company was in compliance with all covenants under the 2011 Credit Agreement.
Long-term debt consists of the following:
| As of September 30, | ||||||||
| 2011 | 2010 | |||||||
| (in thousands) | ||||||||
| Face value of term loan under the credit agreements |
$ | 146,250 | $ | 63,291 | ||||
| Less unamortized discount |
— | (2,416 | ) | |||||
|
|
|
|
|
|||||
| Book value of term loan under the credit agreements |
146,250 | 60,875 | ||||||
| Less current portion |
(38,448 | ) | (12,835 | ) | ||||
|
|
|
|
|
|||||
| Term loan, long term portion |
$ | 107,802 | $ | 48,040 | ||||
|
|
|
|
|
|||||
Future maturities of term loans under the 2011 Credit Agreement are as follows (in thousands):
| For the Years Ending September 30, |
||||
| 2012 |
$ | 38,448 | ||
| 2013 |
25,105 | |||
| 2014 |
10,671 | |||
| 2015 |
10,671 | |||
| 2016 |
61,355 | |||
| Thereafter |
— | |||
|
|
|
|||
| $ | 146,250 | |||
|
|
|
|||
On November 9, 2011, the 2011 Credit Agreement was repaid in full in connection with the Offering. For additional information refer to Note 11—Subsequent Events.
Note 6 — Commitments and Contingencies
Natural Gas Forward Purchase Contracts
The Company’s policy and practice are to enter into fixed-price forward purchase contracts for natural gas in conjunction with contracted product sales in order to substantially fix gross margin on those product sales contracts. The Company may enter into a limited amount of additional fixed-price forward purchase contracts for natural gas in order to minimize monthly and seasonal gas price volatility. Occasionally the Company enters into index-price contracts. The Company has entered into multiple natural gas forward purchase contracts for various delivery dates through March 31, 2012. Commitments for natural gas purchases consist of the following:
73
Table of Contents
| As of September 30, | ||||||||
| 2011 | 2010 | |||||||
| (in thousands) | ||||||||
| MMBtus under fixed-price contracts |
3,182 | 3,465 | ||||||
| MMBtus under index-price contracts |
— | 403 | ||||||
|
|
|
|
|
|||||
| Total MMBtus under contracts |
3,182 | 3,868 | ||||||
|
|
|
|
|
|||||
| Commitments to purchase natural gas |
$ | 14,370 | $ | 15,294 | ||||
| Weighted average rate per MMBtu based on the fixed rates and the indexes applicable to each contract |
$ | 4.52 | $ | 3.95 | ||||
Subsequent to September 30, 2011, the Company entered into additional fixed quantity natural gas supply contracts at fixed and indexed prices for various delivery dates through May 31, 2012. The total MMBtus associated with these additional contracts are approximately 2,140,000 and the total amount of the purchase commitments are approximately $7,723,000, resulting in a weighted average rate per MMBtu of approximately $3.61. The Company is required to make additional prepayments under these purchase contracts in the event that market prices fall below the purchase prices in the contracts. These payments are recorded as deposits on gas contracts in the accompanying balance sheets.
Operating Leases
The Company has various operating leases of real and personal property which expire through October 2014. Total lease expense for the fiscal years ended September 30, 2011, 2010, and 2009 was $844,000, $1,205,000 and $935,000, respectively.
Future minimum lease payments as of September 30, 2011 are as follows (in thousands):
| For the Fiscal Years Ending September 30, |
|
|||
| 2012 |
$ | 231 | ||
| 2013 |
20 | |||
| 2014 |
20 | |||
| 2015 |
8 | |||
| 2016 |
— | |||
| Thereafter |
— | |||
|
|
|
|||
| $ | 279 | |||
|
|
|
|||
Litigation
The Company is party to litigation from time to time in the normal course of business. While the outcome of the Company’s current matters cannot be predicted with certainty, the Company maintains insurance to cover certain actions and believes that resolution of its current litigation will not have a material adverse effect on the Company.
In October 2009, the EPA Region 5 issued a Notice and Finding of Violation pursuant to the CAA related to the number 1 nitric acid plant at the East Dubuque Plant. The notice alleges violations of the CAA’s New Source Performance Standard for nitric acid plants, Prevention of Significant Deterioration requirements and Title V Permit Program requirements. The notice appears to be part of the EPA’s Clean Air Act National Enforcement Priority for New Source Review/Prevention of Significant Deterioration related to acid plants, which seeks to reduce emissions from acid plants through proceedings that result in the installation of new pollution control technology. Without admitting liability, we have negotiated a consent decree (the “Consent Decree”) with the EPA to resolve the alleged violations, and the Consent Decree has been lodged with the court. The Consent Decree requires us to pay a civil penalty of $108,000, install and operate certain pollution control equipment on one of our nitric acid plants, and to perform certain additional actions and periodically report to the EPA. We have commenced implementation of the Consent Decree requirements, including the installation and operation of the pollution control equipment, in anticipation of the court entering the Consent Decree.
Note 7 — Accounting for Stock Based Compensation
The accounting guidance requires all share-based payments, including grants of stock options, to be recognized in the statement of operations, based on their fair values. Most grants have graded vesting provisions where an equal number of shares vest on each anniversary of the grant date. Rentech allocates the total compensation cost on a straight-line attribution method over the requisite service period. All grants vest upon the fulfillment of service conditions and have no performance or market-based vesting conditions. Stock based compensation expense that REMC records is included in selling, general and administrative expense.
74
Table of Contents
During fiscal 2011, 2010 and 2009, charges associated with all equity-based grants issued to REMC employees were recorded as follows:
| For the Fiscal Years Ended September 30, | ||||||||||||
| 2011 | 2010 | 2009 | ||||||||||
| (in thousands) | ||||||||||||
| Stock based compensation expense |
$ | 173 | $ | 121 | $ | 114 | ||||||
|
|
|
|
|
|
|
|||||||
Note 8 — Defined Contribution Plan
Salaried employees participate in Rentech’s 401(k) plan while union employees participate in the Company’s 401(k) plan. Salaried employees who are at least 18 years of age and have 60 days of service are eligible to participate in Rentech’s plan. Rentech is currently matching 75% of the first 6% of the participant’s salary deferrals. Participants are fully vested in both matching and any discretionary contributions made to the plan by Rentech. Union employees who are at least 18 years of age and have been employed by REMC for 120 days are eligible to participate in the Company’s plan. Union employees hired before October 20, 1999 receive a Company contribution of 4% of compensation and a Company match of 50% of the first 2% of the participant’s salary deferrals. Union employees hired after October 19, 1999 receive a company matching contribution of 75% of the first 6% of the participant’s salary deferrals. Participants are fully vested in both matching and any discretionary contributions made to the plan by REMC. The Company contributed $450,000, $442,000 and $434,000 to the plans for the fiscal years ended September 30, 2011, 2010 and 2009, respectively
Note 9 — Income Taxes
The provision (benefit) for income taxes for the fiscal years ended September 30, 2011, 2010 and 2009 was as follows:
| For the Fiscal Years Ended September 30, | ||||||||||||
| 2011 | 2010 | 2009 | ||||||||||
| (in thousands) | ||||||||||||
| Current: |
||||||||||||
| Federal |
$ | 15,540 | $ | 5,454 | $ | 16,152 | ||||||
| State |
2,593 | 736 | 2,181 | |||||||||
|
|
|
|
|
|
|
|||||||
| Total Current |
18,133 | 6,190 | 18,333 | |||||||||
|
|
|
|
|
|
|
|||||||
| Deferred: |
||||||||||||
| Federal |
$ | (764 | ) | $ | (2,507 | ) | $ | 214 | ||||
| State |
46 | (339 | ) | 29 | ||||||||
|
|
|
|
|
|
|
|||||||
| Total Deferred |
(718 | ) | (2,846 | ) | 243 | |||||||
|
|
|
|
|
|
|
|||||||
| 17,415 | 3,344 | 18,576 | ||||||||||
|
|
|
|
|
|
|
|||||||
A reconciliation of the income taxes at the federal statutory rate to the effective tax rate was as follows:
| For the Fiscal Years Ended September 30, | ||||||||||||
| 2011 | 2010 | 2009 | ||||||||||
| (in thousands) | ||||||||||||
| Federal income tax benefit calculated at the federal statutory rate |
$ | 14,754 | $ | 2,924 | $ | 16,358 | ||||||
| State income tax benefit net of federal benefit |
2,466 | 397 | 2,210 | |||||||||
| Permanent. True ups, other |
22 | 23 | 8 | |||||||||
| Change in state tax rate |
173 | — | — | |||||||||
| Income tax expense |
$ | 17,415 | $ | 3,344 | $ | 18,576 | ||||||
75
Table of Contents
The components of the net deferred tax liability and net deferred tax asset as of September 30, 2011, 2010 and 2009 are as follows:
| As of September 30, | ||||||||
| 2011 | 2010 | |||||||
| (in thousands) | ||||||||
| Current deferred tax assets/(liabilities): |
||||||||
| Accruals for financial statement purposes not allowed for income taxes |
$ | 1,780 | $ | 1,351 | ||||
| Basis difference in prepaid expenses |
(281 | ) | (268 | ) | ||||
| Inventory |
(50 | ) | (992 | ) | ||||
|
|
|
|
|
|||||
| Current deferred tax asset (liability), net |
1,449 | 91 | ||||||
| Long-term deferred tax assets/(liabilities): |
||||||||
| Basis difference relating to intangibles |
$ | — | $ | 38 | ||||
| Basis difference in property, plant and equipment |
(6,911 | ) | (6,335 | ) | ||||
| Other |
— | 25 | ||||||
|
|
|
|
|
|||||
| Long-term deferred tax asset/(liability), net |
$ | (6,911 | ) | $ | (6,272 | ) | ||
|
|
|
|
|
|||||
| Net deferred tax liabilities |
$ | (5,462 | ) | $ | (6,181 | ) | ||
|
|
|
|
|
|||||
Note 10 — Selected Quarterly Financial Data (Unaudited)
Selected unaudited condensed financial information for the fiscal years ended September 30, 2011 and 2010 is presented in the tables below (in thousands).
| First Quarter |
Second Quarter |
Third Quarter |
Fourth Quarter |
|||||||||||||
| For the 2011 Fiscal Year |
||||||||||||||||
| Revenues |
$ | 42,962 | $ | 23,943 | $ | 74,385 | $ | 38,567 | ||||||||
| Gross profit |
$ | 16,127 | $ | 10,201 | $ | 37,427 | $ | 12,816 | ||||||||
| Operating income |
$ | 14,584 | $ | 9,012 | $ | 35,882 | $ | 10,376 | ||||||||
| Income before income taxes |
$ | 7,096 | $ | 6,003 | $ | 23,377 | $ | 5,865 | ||||||||
| Net income |
$ | 4,277 | $ | 3,533 | $ | 13,757 | $ | 3,359 | ||||||||
| First Quarter |
Second Quarter |
Third Quarter |
Fourth Quarter |
|||||||||||||
| For the 2010 Fiscal Year |
||||||||||||||||
| Revenues |
$ | 27,023 | $ | 19,182 | $ | 50,111 | $ | 35,080 | ||||||||
| Gross profit (loss) |
$ | (1,162 | ) | $ | 3,011 | $ | 15,375 | $ | 8,152 | |||||||
| Operating income (loss) |
$ | (2,307 | ) | $ | 2,020 | $ | 14,267 | $ | 6,409 | |||||||
| Income (loss) before income taxes |
$ | (4,330 | ) | $ | (2,614 | ) | $ | 11,576 | $ | 3,721 | ||||||
| Net income (loss) |
$ | (2,610 | ) | $ | (1,576 | ) | $ | 6,977 | $ | 2,218 | ||||||
Note 11 — Subsequent Events
On November 2, 2011, the board of directors of the General Partner adopted the Rentech Nitrogen Partners, L.P. 2011 Long-Term Incentive Plan (the “2011 LTIP”). The General Partner’s officers, employees, consultants and non-employee directors, as well as other key employees of Rentech, the indirect parent of the General Partner, and certain of the Partnership’s other affiliates who make significant contributions to its business, are eligible to receive awards under the 2011 LTIP, thereby linking the recipients’ compensation directly to the Partnership’s performance. The 2011 LTIP provides for the grant of unit awards, restricted units, phantom units, unit options, unit appreciation rights, distribution equivalent rights, profits interest units and other unit-based awards. Subject to adjustment in the event of certain transactions or changes in capitalization, 3,825,000 common units may be delivered pursuant to awards under the 2011 LTIP.
On November 9, 2011, the Partnership completed the Offering of 15,000,000 common units representing limited partner interests at a public offering price of $20.00 per common unit. The common units sold to the public in the Offering represent approximately 39.2% of the Partnership common units outstanding as of the closing of the Offering. RNHI owns the remaining 60.8% of the Partnership common units and the General Partner owns 100% of the non-economic general partner interest in us. The Partnership’s assets consist of all of the equity interests of the Company, which owns the Plant. At the closing of the Offering, the Company was converted into a limited liability company under Delaware law and changed its name to Rentech Nitrogen, LLC. The Partnership used cash on hand and proceeds from the Offering to pay distributions to Rentech and RNHI totaling approximately $137.0 million, repaid debt, paid expenses of the Offering, and retained approximately $50.0 million of cash. Specifically, the Partnership (i) used approximately $150.8 million of the net proceeds of the Offering to make a capital contribution to the Company for the repayment in full and termination of the 2011 Credit Agreement and the payment of related fees and expenses; (ii) used approximately $34.7 million of the net proceeds of the Offering to make a distribution to RNHI to reimburse it for expenditures made by the Company during the two-year period preceding the Offering for the expansion and improvement of the Plant, including
76
Table of Contents
expenditures for preliminary work relating to the Company’s expansion projects; (iii) will use approximately $1.1 million of the net proceeds of the Offering for the payment of expenditures related to the replacement of the Company’s steam methane reformer tubes; (iv) will use approximately $5.5 million of the net proceeds of the Offering for the payment of expenditures related to the Company’s urea expansion and diesel exhaust fluid build-out project; (v) will use approximately $0.6 million of the net proceeds of the Offering for the payment of expenditures related to FEED for the Company’s ammonia capacity expansion project; (vi) will use approximately $40.0 million of the net proceeds of the Offering for general working capital purposes; and (vii) used the balance of the net proceeds of the Offering, less unpaid transaction expenses, to make a distribution to RNHI in the amount of approximately $43.5 million. Also, the Company (i) paid approximately $19.4 million to Rentech and, following such payment, the management services agreement between the Company and Rentech terminated in accordance with its terms; and (ii) distributed to RNHI approximately $39.3 million which equaled all of the Company’s cash prior to receipt of the net proceeds of the Offering.
On November 10, 2011, the Company entered into a new $25.0 million senior secured revolving credit facility, with a two year maturity (the “Revolving Credit Facility”) and paid associated financing costs of approximately $0.4 million. The Revolving Credit Facility includes a letter of credit sublimit of up to $2.5 million for issuance of letters of credit. The borrowings under the Revolving Credit Facility bear interest at a rate equal to an applicable margin plus, at the Company’s option, either (a) in the case of base rate borrowings, a rate equal to the highest of (1) the prime rate, (2) the federal funds rate plus 0.5% and (3) LIBOR for an interest period of three months plus 1.00% or (b) in the case of LIBOR borrowings, the offered rate per annum for deposits of dollars for the applicable interest period. The applicable margin for borrowings under the Revolving Credit Facility is 3.25% with respect to base rate borrowings and 4.25% with respect to LIBOR borrowings. Additionally, the Company is required to pay a fee to the lenders under the Revolving Credit Facility on the unused amount at a rate of 0.5%. The Company also is required to pay customary letter of credit fees on issued letters of credit. In the event the Company reduces or terminates the Revolving Credit Facility prior to its first anniversary, it is required to pay a prepayment premium of 2.0% of the principal amount reduced or terminated, subject to certain exceptions. There is currently no outstanding advances under the Revolving Credit Facility.
77
Table of Contents
Report of Independent Registered Public Accounting Firm
To the Board of Directors of Rentech Nitrogen GP, LLC and Unitholders of Rentech Nitrogen Partners, L.P.
In our opinion, the accompanying balance sheet and the related statements of Partners’ equity and of cash flows present fairly, in all material respects, the financial position of Rentech Nitrogen Partners, L.P. at September 30, 2011, and its cash flows for the period from July 8, 2011 (date of inception) to September 30, 2011, in conformity with accounting principles generally accepted in the United States of America. These financial statements are the responsibility of the Partnership’s management. Our responsibility is to express an opinion on these financial statements based on our audits. We conducted our audits of these statements in accordance with the standards of the Public Company Accounting Oversight Board (United States). Those standards require that we plan and perform the audit to obtain reasonable assurance about whether the financial statements are free of material misstatement. An audit includes examining, on a test basis, evidence supporting the amounts and disclosures in the financial statements, assessing the accounting principles used and significant estimates made by management, and evaluating the overall financial statement presentation. We believe that our audits provide a reasonable basis for our opinion.
/s/PricewaterhouseCoopers LLP
Los Angeles, California
December 14, 2011
78
Table of Contents
RENTECH NITROGEN PARTNERS, L.P.
As of September 30, 2011
| ASSETS |
||||
| Current assets |
||||
| Cash |
$ | 980 | ||
|
|
|
|||
| Total current assets |
980 | |||
| Total assets |
$ | 980 | ||
|
|
|
|||
| LIABILITIES AND PARTNERS’ EQUITY |
||||
| Current liabilities |
||||
| Total current liabilities |
$ | — | ||
|
|
|
|||
| Long-term liabilities |
||||
| Total long-term liabilities |
— | |||
|
|
|
|||
| Total liabilities |
— | |||
|
|
|
|||
| Partners’ equity |
||||
| Equity held by limited partner |
980 | |||
|
|
|
|||
| Total partners’ equity |
980 | |||
|
|
|
|||
| Total liabilities and partners’ equity |
$ | 980 | ||
|
|
|
|||
See Accompanying Notes to Financial Statements.
79
Table of Contents
RENTECH NITROGEN PARTNERS, L.P.
For the Period from July 8, 2011 (date of inception) to September 30, 2011
| Equity Held by Limited Partner |
||||
| Balance, July 8, 2011 |
$ | — | ||
| Contribution |
980 | |||
| Net income |
— | |||
|
|
|
|||
| Balance, September 30, 2011 |
$ | 980 | ||
|
|
|
|||
See Accompanying Notes to Financial Statements.
80
Table of Contents
RENTECH NITROGEN PARTNERS, L.P.
For the Period from July 8, 2011 (date of inception) to September 30, 2011
| Cash flows from operating activities |
||||
| Net income |
$ | — | ||
| Net cash provided by operating activities |
— | |||
|
|
|
|||
| Cash flows from investing activities |
||||
| Net cash used in investing activities |
— | |||
|
|
|
|||
| Cash flows from financing activities |
||||
| Equity contribution |
980 | |||
| Net cash provided by financing activities |
980 | |||
|
|
|
|||
| Increase in cash |
980 | |||
| Cash and cash equivalents, beginning of year |
— | |||
|
|
|
|||
| Cash and cash equivalents, end of year |
$ | 980 | ||
|
|
|
|||
See Accompanying Notes to Financial Statements.
81
Table of Contents
Note 1 — Description of Business
Description of Business
Rentech Nitrogen Partners, L.P. (“we” or “the Partnership”) was formed as a Delaware limited partnership in July 2011 in anticipation of its initial public offering (the “Offering”). Rentech Nitrogen Holdings, Inc. (“RNHI”) is our limited partner and Rentech Nitrogen GP, LLC (the “General Partner”) is our general partner and a wholly owned subsidiary of RNHI. The Partnership’s activities to date are limited to organization and corporate governance activities. We have no business operations.
Note 2 — Subsequent Events
On November 2, 2011, the board of directors of the General Partner adopted the Rentech Nitrogen Partners, L.P. 2011 Long-Term Incentive Plan (the “2011 LTIP”). The General Partner’s officers, employees, consultants and non-employee directors, as well as other key employees of Rentech, Inc. (“Rentech”), the indirect parent of the General Partner, and certain of the Partnership’s other affiliates who make significant contributions to its business, are eligible to receive awards under the 2011 LTIP, thereby linking the recipients’ compensation directly to the Partnership’s performance. The 2011 LTIP provides for the grant of unit awards, restricted units, phantom units, unit options, unit appreciation rights, distribution equivalent rights, profits interest units and other unit-based awards. Subject to adjustment in the event of certain transactions or changes in capitalization, 3,825,000 common units may be delivered pursuant to awards under the 2011 LTIP.
On November 9, 2011, the Partnership completed the Offering of 15,000,000 common units representing limited partner interests at a public offering price of $20.00 per common unit. The common units sold to the public in the Offering represent approximately 39.2% of the Partnership common units outstanding as of the closing of the Offering. RNHI owns the remaining 60.8% of the Partnership common units and the General Partner owns 100% of the non-economic general partner interest in us. The Partnership’s assets consist of all of the equity interests of Rentech Energy Midwest Corporation (“REMC”), which owns the Plant. At the closing of the Offering, REMC was converted into a limited liability company under Delaware law and changed its name to Rentech Nitrogen, LLC (“RNLLC”). The Partnership used cash on hand and proceeds from the Offering to pay distributions to Rentech and RNHI totaling approximately $137.0 million, repaid debt, paid expenses of the Offering, and retained approximately $50.0 million of cash. Specifically, the Partnership (i) used approximately $150.8 million of the net proceeds of the Offering to make a capital contribution to REMC for the repayment in full and termination of the Partnership’s 2011 credit agreement and the payment of related fees and expenses; (ii) used approximately $34.7 million of the net proceeds of the Offering to make a distribution to RNHI to reimburse it for expenditures made by REMC during the two-year period preceding the Offering for the expansion and improvement of the Plant, including expenditures for preliminary work relating to REMC’s expansion projects; (iii) will use approximately $1.1 million of the net proceeds of the Offering for the payment of expenditures related to the replacement of REMC’s steam methane reformer tubes; (iv) will use approximately $5.5 million of the net proceeds of the Offering for the payment of expenditures related to REMC’s urea expansion and diesel exhaust fluid build-out project; (v) will use approximately $0.6 million of the net proceeds of the Offering for the payment of expenditures related to FEED for REMC’s ammonia capacity expansion project; (vi) will use approximately $40.0 million of the net proceeds of the Offering for general working capital purposes; and (vii) used the balance of the net proceeds of the Offering, less unpaid transaction expenses, to make a distribution to RNHI in the amount of approximately $43.5 million. Also, REMC (i) paid approximately $19.4 million to Rentech and, following such payment, the management services agreement between REMC and Rentech terminated in accordance with its terms; and (ii) distributed to RNHI approximately $39.3 million which equaled all of the REMC’s cash prior to receipt of the net proceeds of the Offering.
On November 10, 2011, the Partnership entered into a new $25.0 million senior secured revolving credit facility, with a two year maturity (the “Revolving Credit Facility”) and paid associated financing costs of approximately $0.4 million. The Revolving Credit Facility includes a letter of credit sublimit of up to $2.5 million for issuance of letters of credit. The borrowings under the Revolving Credit Facility bear interest at a rate equal to an applicable margin plus, at the Partnership’s option, either (a) in the case of base rate borrowings, a rate equal to the highest of (1) the prime rate, (2) the federal funds rate plus 0.5% and (3) LIBOR for an interest period of three months plus 1.00% or (b) in the case of LIBOR borrowings, the offered rate per annum for deposits of dollars for the applicable interest period. The applicable margin for borrowings under the Revolving Credit Facility is 3.25% with respect to base rate borrowings and 4.25% with respect to LIBOR borrowings. Additionally, the Partnership is required to pay a fee to the lenders under the Revolving Credit Facility on the unused amount at a rate of 0.5%. The Partnership also is required to pay customary letter of credit fees on issued letters of credit. In the event the Partnership reduces or terminates the Revolving Credit Facility prior to its first anniversary, it is required to pay a prepayment premium of 2.0% of the principal amount reduced or terminated, subject to certain exceptions. There is currently no outstanding advances under the Revolving Credit Facility.
82
Table of Contents
ITEM 9. CHANGES IN AND DISAGREEMENTS WITH ACCOUNTANTS ON ACCOUNTING AND FINANCIAL DISCLOSURE
None.
ITEM 9A. CONTROLS AND PROCEDURES
Evaluation of Disclosure Controls and Procedures. We have established and currently maintain disclosure controls and procedures designed to ensure that information required to be disclosed us in our reports filed or submitted under the Securities Exchange Act of 1934, as amended, or the Exchange Act, is recorded, processed, summarized and reported within the time periods specified by the SEC’s rules and forms. Disclosure controls and procedures include, without limitation, controls and procedures designed to ensure that information required to be disclosed by us in the reports that we file or submit under the Exchange Act is accumulated and communicated to our management, including our general partners’ principal executive officer and principal financial officer, as appropriate to allow timely decisions regarding required disclosure.
As of the end of the period covered by this report, we carried out an evaluation, under the supervision and with the participation of our management, including our general partner’s Chief Executive Officer and the Chief Financial Officer, of the effectiveness of the design and operation of our disclosure controls and procedures. Based on that evaluation, our general partner’s Chief Executive Officer and Chief Financial Officer have concluded that our disclosure controls and procedures were effective as of September 30, 2011.
Management’s Annual Report on Internal Control Over Financial Reporting. This report does not include a report of management’s assessment regarding internal control over financial reporting or an attestation report of our registered public accounting firm due to a transition period established by rules of the SEC for newly public companies.
Changes in Internal Control over Financial Reporting. There were no changes in our internal control over financial reporting during the quarter ended September 30, 2011 that materially affected, or are reasonably likely to materially affect, our internal control over financial reporting.
There was no information required to be disclosed in a report on Form 8-K during the fourth quarter of 2011 that has not previously been reported.
83
Table of Contents
ITEM 10. DIRECTORS, EXECUTIVE OFFICERS AND CORPORATE GOVERNANCE
Management of Rentech Nitrogen Partners, L.P.
Our general partner, Rentech Nitrogen GP, LLC, manages our operations and activities subject to the terms and conditions specified in our partnership agreement. Our general partner is owned by RNHI, an indirect wholly owned subsidiary of Rentech. The operations of our general partner in its capacity as general partner are managed by its board of directors. Actions by our general partner that are made in its individual capacity or in its sole discretion will be made by RNHI as the sole member of our general partner and not by the board of directors of our general partner. Our general partner is not elected by our unitholders. The officers of our general partner manage the day-to-day affairs of our business.
Whenever our general partner makes a determination or takes or declines to take an action in its individual, rather than representative, capacity, it is entitled to make such determination or to take or decline to take such other action free of any fiduciary duty or obligation whatsoever to us, any limited partner or assignee, and it is not required to act in good faith or pursuant to any other standard imposed by our partnership agreement or under Delaware law or any other law. Examples include the exercise of its call right or its registration rights, its voting rights with respect to the units it owns and its determination whether or not to consent to any merger or consolidation of the Partnership. Actions by our general partner that are made in its individual capacity or in its sole discretion are made by RNHI, the sole member of our general partner, not by its board of directors.
Limited partners are entitled to elect the directors of our general partner or directly or indirectly participate in our management or operation. Our partnership agreement contains various provisions which replace default fiduciary duties with contractual governance standards. Our general partner is liable, as a general partner, for all of our debts (to the extent not paid from our assets), except for indebtedness or other obligations that are made expressly non-recourse to it. Our general partner therefore may cause us to incur indebtedness or other obligations that are non-recourse to it. Our new revolving credit facility is non-recourse to our general partner.
As a publicly traded limited partnership, we qualify for, and are relying on, certain exemptions from the New York Stock Exchange’s corporate governance requirements, including:
• the requirement that a majority of the board of directors of our general partner consist of independent directors; and
• the requirement that the board of directors of our general partner have a nominating/corporate governance committee and a compensation committee that are composed entirely of independent directors.
As a result of these exemptions, our general partner’s board of directors is not comprised of a majority of independent directors and our general partner’s board of directors does not currently intend to establish a nominating/corporate governance committee or a compensation committee. Accordingly, unitholders do not have the same protections afforded to equityholders of companies that are subject to all of the corporate governance requirements of the New York Stock Exchange.
The board of directors of our general partner currently consists of six directors. In accordance with the rules of the New York Stock Exchange, the board of directors of our general partner has at least one independent director prior to the listing of our common units on the New York Stock Exchange, and plans to have at least two independent directors within three months of that listing and three independent directors within 12 months of that listing. As the third independent director is added, we expect that one of our non-independent directors will resign as a member of the board of directors of our general partner.
The board of directors of our general partner has one standing committee, which is its audit committee. The members of the audit committee currently consist of Michael S. Burke and Keith B. Forman, and Mr. Burke is the chairman of the audit committee. The board of directors of our general partner has determined that Mr. Forman is an independent director who meets the independence requirements established by the New York Stock Exchange and the Exchange Act, and that, based upon their education and experience, both Mr. Burke and Mr. Forman have the requisite qualifications to qualify under the rules of the SEC, and designated them as audit committee financial experts. After two additional independent directors are added to the board of directors and audit committee of our general partner, we expect that Mr. Burke will resign as a member of the audit committee, but will remain a member of the board. The audit committee’s primary functions include reviewing our external financial reporting, recommending engagement of our independent auditors and reviewing procedures for internal auditing and the adequacy of our internal accounting controls.
84
Table of Contents
The board of directors of our general partner may from time to time establish a conflicts committee, which would not be a standing committee, consisting entirely of independent directors. Pursuant to our partnership agreement, the board may, but is not required to, seek the approval of the conflicts committee whenever a conflict arises between our general partner or its affiliates, on the one hand, and us or any public unitholder, on the other. The conflicts committee may then determine whether the resolution of the conflict of interest is in the best interests of the Partnership. The members of the conflicts committee may not be officers or employees of our general partner or directors, officers or employees of its affiliates, and must meet the independence standard established by the New York Stock Exchange and the Exchange Act to serve on an audit committee of a board of directors. Any matters approved by the conflicts committee will be conclusively deemed to be fair and reasonable to us, approved by all of our partners and not a breach by the general partner of any duties it may owe us or our unitholders.
Meetings and Other Information
Since our initial public offering, the board of directors of our general partner has had one regularly scheduled meeting and our audit committee has had one meeting. None of the directors attended fewer than 100% of the aggregate number of meetings of the board of directors and committees of the board on which the director served.
Our committee charters and governance guidelines, as well as our Code of Business Conduct Ethics that applies to our directors, officers and employees, Disclosure Policy and our Whistleblower Policy are available on our website at http://www.rentechnitrogen.com. We intend to disclose any amendment to or waiver of our Code of Business Conduct or Ethics either on our website or by filing a Current Report on Form 8-K. Our website address referenced above is not intended to be an active hyperlink, and the contents of our website shall not be deemed to be incorporated herein.
Section 16(a) of the Exchange Act requires the executive officers and directors of our general partner, and persons who own more than ten percent of a registered class of our equity securities, or, collectively, the Insiders, to file initial reports of ownership and reports of changes in ownership with the SEC. Insiders are required by SEC regulations to furnish us with copies of all Section 16(a) forms they file. To our knowledge, based solely on our review of the copies of such reports furnished to us or written representations from certain Insiders that they were not required to file a Form 5 to report previously unreported ownership or changes in ownership. We believe that, during our fiscal year ending September 30, 2011, the Insiders complied with all such filing requirements.
Report of the Audit Committee
The audit committee of our general partner oversees our financial reporting process on behalf of the board of directors. Management has the primary responsibility for the financial statements and the reporting process. In fulfilling its oversight responsibilities, the audit committee reviewed and discussed with management the audited financial statements contained in this report.
Our independent registered public accounting firm, PricewaterhouseCoopers LLP, is responsible for expressing an opinion on the conformity of the audited financial statements with accounting principles generally accepted in the United States of America. The audit committee reviewed with PricewaterhouseCoopers LLP their judgment as to the quality, not just the acceptability, of our accounting principles and such other matters as are required to be discussed with the audit committee under generally accepted auditing standards.
The audit committee discussed with PricewaterhouseCoopers LLP the matters required to be discussed by SAS 61 (Codification of Statement on Auditing Standards, AU § 380), as may be modified or supplemented. The committee received written disclosures and the letter from PricewaterhouseCoopers LLP required by PCAOB Rule 3526 Communication with Audit Committees Concerning Independence , as may be modified or supplemented, and has discussed with PricewaterhouseCoopers LLP its independence from management and the Partnership.
Based on the reviews and discussions referred to above, the audit committee recommended to the board of directors that the audited financial statements be included in this report for filing with the SEC.
Michael S. Burke, Chairman
Keith B. Forman
85
Table of Contents
Executive Officers and Directors
The following table sets forth the names, positions and ages (as of November 30, 2011) of the executive officers and directors of our general partner.
D. Hunt Ramsbottom, Dan J. Cohrs, John H. Diesch and Colin M. Morris are also officers of Rentech and provide their services to our general partner and us pursuant to the services agreement we entered into among us, Rentech and our general partner. These officers divide their working time between the management of Rentech and us.
| Name |
Age | Position With Our General Partner | ||
| D. Hunt Ramsbottom | 54 | Chief Executive Officer and Director | ||
| Dan J. Cohrs | 58 | Chief Financial Officer | ||
| John H. Diesch | 54 | President and Director | ||
| John A. Ambrose | 58 | Chief Operating Officer | ||
| Wilfred R. Bahl, Jr. | 60 | Senior Vice President of Finance and Administration | ||
| Marc E. Wallis | 51 | Senior Vice President of Sales and Marketing | ||
| Colin M. Morris | 39 | Senior Vice President, General Counsel and Secretary | ||
| Halbert S. Washburn | 51 | Director | ||
| Michael F. Ray | 58 | Director | ||
| Michael S. Burke | 48 | Director | ||
| Keith B. Forman | 53 | Director | ||
D. Hunt Ramsbottom D. Hunt Ramsbottom was appointed Chief Executive Officer and as a member of the board of directors of our general partner in July 2011. Since September 2005, Mr. Ramsbottom has served as President and a director of Rentech and, since December 2005, he has served as Chief Executive Officer of Rentech. Mr. Ramsbottom had been serving as a consultant to Rentech since August 2005 under the terms of a Management Consulting Agreement Rentech entered into with Management Resource Center, Inc. Mr. Ramsbottom has over 25 years of experience building and managing growth companies. Prior to accepting his position at Rentech, Mr. Ramsbottom held various key management positions including: from 2004 to 2005, as Principal and Managing Director of Circle Funding Group, LLC, a buyout firm; from 1997 to 2004, as Chief Executive Officer and Chairman of M2 Automotive, Inc., an automotive repair venture; and from 1989 to 1997, as Chief Executive Officer of Thompson PBE, a supplier of paints and related supplies, which was acquired by FinishMaster, Inc. in 1997. On April 17, 2005, M2 Automotive, Inc. completed an assignment for the benefit of its creditors pursuant to a state law insolvency proceeding. The board of directors of our general partner has determined that Mr. Ramsbottom brings to the board knowledge of our business, a historical understanding of our operations gained through his service as President and Chief Executive Officer of Rentech and experience with companies as Chief Executive Officer and Principal and Managing Director, and therefore he should serve on the board of directors of our general partner.
Dan J. Cohrs. Dan J. Cohrs was appointed Chief Financial Officer of our general partner in July 2011. Since October 2008, Mr. Cohrs has served as Executive Vice President and Chief Financial Officer of Rentech. Mr. Cohrs was also Treasurer of Rentech from October 2008 until November 2009 and was re-appointed Treasurer in October 2010. Mr. Cohrs has more than 25 years of experience in corporate finance, strategy and planning, and mergers and acquisitions. From April 2008 through September 2008, Mr. Cohrs served as Chief Development and Financial Officer of Agency 3.0, LLC, a private digital advertising and consulting agency in Los Angeles, California and he was a Partner and a Board Member of Agency 3.0, LLC until September 2009. From August 2007 through September 2008, he served as Chief Development & Financial Officer of Skycrest Ventures, LLC, a private investment and consulting firm in Los Angeles that was related to Agency 3.0, LLC. From June 2006 to May 2007, Mr. Cohrs served as a consultant for finance and corporate development, as well as Interim Chief Financial Officer for several months during that period of time, for Amp’d Mobile, a private mobile media entertainment company in Los Angeles. From 2003 to 2007, Mr. Cohrs worked as an independent consultant and advised companies regarding financings, investor presentations and business plans. From November 2005 to March 2006, Mr. Cohrs served as a Visiting Senior Lecturer at Cornell University’s Johnson School of Management in the area of corporate governance. From May 1998 to June 2003, Mr. Cohrs served as Executive Vice President and Chief Financial Officer of Global Crossing Ltd. Prior to being employed at Global Crossing Ltd., Mr. Cohrs held senior positions in finance and strategy at Marriot Corporation, Northwest Airlines, Inc. and GTE Corp., a predecessor of Verizon Communications, Inc.
86
Table of Contents
On June 1, 2007, Amp’d Mobile, Inc. filed a petition for bankruptcy under chapter 11 of title 11 of the United States Code, 11 U.S.C. § 101, et seq., or the Bankruptcy Code, with the United States Bankruptcy Court for the District of Delaware. On January 28, 2002, Global Crossing Ltd., and certain of its direct and indirect subsidiaries, filed a petition for bankruptcy under chapter 11 of title 11 of the Bankruptcy Code with the United States Bankruptcy Court for the Southern District of New York. On April 11, 2005, the SEC, Global Crossing Ltd., Mr. Cohrs (at the relevant time, the Chief Financial Officer of Global Crossing Ltd.) and other members of Global Crossing Ltd.’s senior management reached a settlement related to an SEC investigation regarding alleged violations of the reporting provisions of Section 13(a) of the Securities Exchange Act of 1934 (and the regulations thereunder). The parties to the agreement (other than the SEC) agreed not to cause any violations of such reporting provisions in the future, and in connection with a parallel civil action, Mr. Cohrs agreed to pay a $100,000 civil penalty. In the SEC order, none of the allegations related to fraud, no party admitted liability and no other violations of securities laws were alleged. Also in connection with Global Crossing, Ltd., on July 16, 2004, Mr. Cohrs and the Secretary of the United States Department of Labor entered into a settlement agreement, the relevant restrictions of which expired on July 16, 2009, pursuant to which Mr. Cohrs agreed, among other things, that he would give notice to the Secretary, and if the Secretary objected, then he would not serve in a fiduciary capacity with respect to any plan covered by the Employee Retirement Income Security Act, or ERISA.
John H. Diesch. John H. Diesch was appointed President and a member of the board of directors of our general partner in July 2011. Since January 2008, Mr. Diesch has served as Senior Vice President of Operations of Rentech and is responsible for plant operations at our facility, Rentech’s Product Demonstration Unit in Commerce City, Colorado and the operation of future synthetic fuels plants, including Rentech’s proposed facility near Natchez, Mississippi. From April 2006 to January 2008, Mr. Diesch served as President of REMC and Vice President of Operations for Rentech. From April 1999 to April 2006, Mr. Diesch served as Managing Director of Royster-Clark Nitrogen, Inc., and previously served as Vice President and General Manager of nitrogen production and distribution for IMC AgriBusiness Inc., an agricultural fertilizer manufacturer. In 1991, he joined Vigoro Industries Inc., a manufacturer and distributor of potash, nitrogen fertilizers and related products, as North Bend, Ohio Plant Manager after serving as Plant Manager, Production Manager and Process Engineer with Arcadian Corporation, a nitrogen manufacturer, Columbia Nitrogen Corp., a manufacturer of fertilizer products, and Monsanto Company, a multinational agricultural biotechnology corporation. Mr. Diesch is a former member of the board of directors of the Gasification Technologies Council and previously served as director of the Fertilizer Institute and with the Dubuque Area Chamber of Commerce, and was recently management Chairman of the Board for the Dubuque Area Labor Management Council. The board of directors of our general partner has determined that Mr. Diesch brings to the board knowledge of our business and our industry and valuable insight into the operation of our facility, and therefore he should serve on the board of directors of our general partner.
John A. Ambrose. John A. Ambrose was appointed Chief Operating Officer of our general partner in July 2011. Since December 2007, Mr. Ambrose has served as the President of REMC after joining REMC in April 2007 as Operations Director. Mr. Ambrose has 36 years of chemical manufacturing experience in specialty and commodity chemical manufacturing, including international responsibilities. From 2003 to 2007, he served as Plant Manager at Ferro Corporation, a global producer of technology-based performance materials for manufacturers. Mr. Ambrose began his career with PPG Industries, Inc., a global supplier of paints, coatings, optical products, specialty materials, chemicals, glass and fiber glass, where he advanced through several manufacturing positions over the course of 28 years, initially in chlor-alkali, then holding positions such as environmental compliance/remediation manager and manufacturing manager within the Optical Monomers business unit. As director of manufacturing from 1996 to 2003, he managed and expanded multiple worldwide plants for the company’s precipitated silica business unit. He serves on the board of directors of The Fertilizer Institute and the Chemistry Industry Council of Illinois.
Wilfred R. Bahl, Jr. Wilfred R. Bahl, Jr. was appointed Senior Vice President of Finance and Administration of our general partner in July 2011. Since April 2006, Mr. Bahl has served as the Vice President and Chief Financial Officer of REMC. He has 38 years of finance experience, with 31 of those years at our facility. From 1999 to 2006, Mr. Bahl was the Director of Finance and Energy for Royster-Clark Nitrogen, Inc. From 1998 to 1999, he served as Vice President of Business Development and, from 1995 to 1998, he served as the Vice President of Finance and Administration of IMC Nitrogen Co. From 1991 to 1995, he served as Vice President of Finance for Phoenix Chemical Co. In 1987, he served as Treasurer and was appointed to the board of directors of Phoenix Chemical Co and was appointed to the executive committee of the board of directors in 1989. From 1980 to 1987, Mr. Bahl served as the Administrative and Accounting Manager of N-Ren Corporation and later as its Controller. Prior to joining N-Ren Corporation, he held various accounting positions with Flexsteel Industries, Inc., a furniture manufacturer, and Eska Company, a manufacturer of snow blower and outboard motors.
Marc E. Wallis. Marc E. Wallis was appointed Senior Vice President of Sales and Marketing of our general partner in July 2011. Mr. Wallis has served as Vice President, Sales and Marketing of REMC since 2006 and has a long history working with our facility. From 2000 to 2006, he held the position of National Accounts Sales Manager of our company. From 1995 to 2000, Mr. Wallis held the positions of Director of Sales and Purchasing at IMC Agribusiness Inc., the prior owner of our facility. From 1987 to 1995, Mr. Wallis held the position of Director of Purchasing at the Vigoro Corporation, a manufacturer and distributor of potash, nitrogen fertilizers and related products.
87
Table of Contents
Colin M. Morris. Colin M. Morris was appointed Senior Vice President, General Counsel and Secretary of our general partner and Rentech in October 2011. From July 2011 to October 2011, Mr. Morris served as the Vice President, General Counsel and Secretary of our general partner and from June 2006 to October 2011, Mr. Morris served as the Vice President, General Counsel and Secretary of Rentech. Mr. Morris practiced corporate and securities law at the Los Angeles office of Latham & Watkins LLP from June 2004 to May 2006. From September 2000 to May 2004, Mr. Morris practiced corporate and securities law in the Silicon Valley office of Wilson, Sonsini, Goodrich and Rosati. Prior to that, Mr. Morris practiced corporate and securities law in the Silicon Valley office of Pillsbury Winthrop Shaw Pittman LLP.
Halbert S. Washburn. Halbert S. Washburn was appointed as a member of the board of directors of our general partner in July 2011. Since December 2005, Mr. Washburn has served as a member of the board of directors of Rentech, and since June 2011 has served as its Chairman. Mr. Washburn has over 25 years of experience in the energy industry. Since August 2006, Mr. Washburn has been the Chief Executive Officer of BreitBurn GP, LLC, the general partner of BreitBurn Energy Partners LP. Since August 2006, he was the Co-Chief Executive Officer and served on the board of directors of BreitBurn GP, LLC. He has served as the Co-President and a director of BreitBurn Energy Corporation since 1988. He also has served as a Co-Chief Executive Officer and a director for BreitBurn Energy Holdings, LLC and as Co-Chief Executive Officer and a director of BEH (GP), LLC. Mr. Washburn previously served as Chairman on the Executive Committee of the board of directors of the California Independent Petroleum Association. He also served as Chairman of the Stanford University Petroleum Investments Committee and as Secretary and Chairman of the Wildcat Committee. The board of directors of our general partner has determined that Mr. Washburn brings to the board knowledge of our business and extensive experience with master limited partnerships, including his service as an executive officer and director of several BreitBurn entities, and therefore he should serve on the board of directors of our general partner.
Michael F. Ray. Michael F. Ray was appointed as a member of the board of directors of our general partner in July 2011. Since May 2005, Mr. Ray has served as a member of the board of directors of Rentech. Mr. Ray founded and, since 2001, has served as President of ThioSolv, LLC. ThioSolv, LLC is in the business of developing and licensing technology to the refining and chemical sector. Also, since May 2005, Mr. Ray has served as General Partner of GBTX Leasing, LLC, a company that owns and leases rail cars for the movement of liquid chemicals and salts. Since 2008, Mr. Ray has served as a member of the board of directors and the Technology Committee, for Cyanco Corporation, a producer of sodium cyanide in the Western United States, and a subsidiary of Oaktree Capital Management which holds a controlling interest in the company. From 1995 to 2001, Mr. Ray served as Vice President of Business Development for the Catalyst and Chemicals Division of The Coastal Corporation, a company that principally gathered, processed, stored and distributed natural gas. Mr. Ray served as President (from 1990 to 1995), Vice President of Corporate Development and Administration (from 1986 to 1990) and Vice President of Carbon Dioxide Marketing (from 1985 to 1986) of Coastal Chem, Inc., a manufacturer of dry ice and solid carbon dioxide. Mr. Ray served as Regional Operations Manager (from 1981 to 1985) and Plant Manager (from 1980 to 1981) of Liquid Carbonic Corporation, a seller of carbon dioxide products. Mr. Ray previously served as a member of the board of directors of Coastal Chem, Inc., Cheyenne LEADS and Wyoming Heritage Society. Mr. Ray also served on the Nitrogen Fertilizer Industry Ad Hoc Committee, the University of Wyoming EPSCOR Steering Committee and Wyoming Governor’s committee for evaluating state employee compensation. The board of directors of our general partner has determined that Mr. Ray brings to the board valuable knowledge of and experience in the chemical and nitrogen fertilizer industries and directorial and governance experience as a director of Coastal Chem, Inc., and therefore he should serve on the board of directors of our general partner.
Michael S. Burke. Michael S. Burke was appointed as a member of the board of directors of our general partner in July 2011. Since March 2007, Mr. Burke has served as a member of the board of directors of Rentech. Mr. Burke is currently the Executive Vice President, Chief Financial Officer of AECOM Technology Corporation, a global provider of professional technical and management support services to government and commercial clients. Mr. Burke has also been appointed as the President of AECOM Technology Corporation, effective October 1, 2011. Mr. Burke joined AECOM as Senior Vice President, Corporate Strategy in October 2005. From 1990 to 2005, Mr. Burke was with the accounting firm, KPMG LLP where he served in various senior leadership positions, most recently as a Western Area Managing Partner from 2002 to 2005 and was a member of KPMG’s Board of Directors from 2000 through 2005. While on the board of directors of KPMG, Mr. Burke served as the Chairman of the Board Process and Governance Committee and a member of the Audit and Finance Committee. Mr. Burke also serves on various charitable and community boards. The board of directors of our general partner has determined that Mr. Burke brings to the board extensive accounting, financial and business experience, including experience with a public company, and therefore he should serve on the board of directors of our general partner.
88
Table of Contents
Keith B. Forman. Keith B. Mr. Forman was appointed as a member of the board of directors of our general partner at the closing of our initial public offering. Since April 2007, Mr. Forman has been a director of Capital Product Partners L.P., a publicly traded shipping limited partnership specializing in the seaborne transportation of oil, refined oil products and chemicals. Mr. Forman currently serves as the Chairman of its conflicts committee and is a member of its audit committee. From November 2007 until March 2010, Mr. Forman served as Partner and Chief Financial Officer of Crestwood Midstream Partners LP, a private investment partnership focused on making equity investments in the midstream energy market. The other partners of Crestwood Mainstream Partners LP included the Blackstone Group L.P., Kayne Anderson Energy Funds and GSO Capital Partners LP. From February 2005 to 2007, Mr. Forman was a member of the board of directors of Kayne Anderson Energy Development, a closed-end investment fund focused on making debt and equity investments in energy companies, and was a member of its audit committee. Mr. Forman was also a member of the board of directors of Energy Solutions International Ltd., a privately held supplier of oil and gas pipeline software management systems, from April 2004 to January 2009. From January 2004 to July 2005, Mr. Forman was Senior Vice President, Finance for El Paso Corporation, a provider of natural gas services. From January 1992 to December 2003, he served as Chief Financial Officer of GulfTerra Energy Partners L.P., a publicly traded master limited partnership, and was responsible for the financing activities of the partnership, including in commercial and investment banking relationships. The board of directors of our general partner has determined that Mr. Forman brings to the board accounting, financial and directorial experience, including extensive experience with master limited partnerships, and therefore he should serve on the board of directors of our general partner.
The directors of our general partner hold office until the earliest of their death, resignation or removal.
ITEM 11. EXECUTIVE COMPENSATION
Compensation Discussion and Analysis
Executive Summary
This Compensation Discussion and Analysis provides an overview and analysis of the executive compensation program for our named executive officers identified below, or our NEOs. Our executive compensation program is designed to align executive pay with individual performance on both short and long-term bases, link executive pay to specific, measurable financial, technological and development achievements intended to create value for securityholders and utilize compensation as a tool to attract and retain the high-caliber executives that are critical to our long-term success.
The following table sets forth the key elements of our NEOs’ compensation, along with the primary objectives associated with each element of compensation.
| Compensation Element |
Primary Objective | |
| Base salary |
To recognize performance of job responsibilities, provide stable income and attract and retain experienced individuals with superior talent. | |
| Annual incentive compensation |
To promote short-term performance objectives and reward individual contributions to the achievement of those objectives. | |
| Long-term equity incentive awards |
To emphasize long-term performance objectives, align the interests of our NEOs with shareholder interests, encourage the maximization of shareholder value and retain key executives. | |
| Severance and change in control benefits |
To encourage the continued attention and dedication of our NEOs and provide reasonable individual security to enable our NEOs to focus on our best interests, particularly when considering strategic alternatives. | |
| Retirement savings (401(k) plan) |
To provide an opportunity for tax-efficient savings and matching contributions by us. | |
| Other elements of compensation and perquisites |
To attract and retain talented executives in a cost-efficient manner by providing benefits with high perceived values at relatively low cost. | |
89
Table of Contents
To serve the foregoing objectives, our overall compensation program is generally designed to be flexible rather than purely formulaic. In alignment with the objectives set forth above, the Compensation Committee of the Board of Directors of Rentech, or Rentech’s Compensation Committee, has generally determined the overall compensation of our NEOs and its allocation among the elements described above, relying on the analyses and advice provided by Rentech’s compensation consultant as well as input from our management team.
Our compensation decisions for the named executive officers in fiscal year 2011 are discussed in detail below. This discussion is intended to be read in conjunction with the executive compensation tables and related disclosures that follow this Compensation Discussion and Analysis.
Named Executive Officers
Rentech Nitrogen GP, LLC, our general partner, manages our operations and activities on our behalf through its officers and directors and is solely responsible for providing the employees and other personnel necessary to conduct our operations. Although all of the employees that conduct our business are employed by our general partner and its affiliates, we sometimes refer to these individuals in this prospectus as our officers and employees for ease of reference. Please see “Certain Relationships and Related Party Transactions, and Director Independence—Our Agreements with Rentech.”
The following discussion describes and analyzes our compensation objectives and policies, as well as the material components of our executive compensation program for each of D. Hunt Ramsbottom, Dan J. Cohrs, John A. Ambrose, Wilfred R. Bahl, Jr. and Marc E. Wallis, our NEOs. Our NEOs were appointed to their positions during 2011 in connection with our formation and the formation of our general partner. Messrs. Ramsbottom and Cohrs also serve as officers of Rentech, our parent company, and are sometimes referred to in this registration statement as our “Shared NEOs” (and Messrs. Ambrose, Bahl and Wallis are sometimes referred to as our “Non-Shared NEOs”).
Following our formation and the formation of our general partner, our Shared NEOs, who were already officers of Rentech and REMC, also became officers of our general partner, while our Non-Shared NEOs, who were already officers of REMC, also became officers of our general partner. Upon the closing of our initial public offering, all of our NEOs ceased to be officers of, and to be employed by, REMC. The following table sets forth each NEO’s title(s) prior to our formation and the formation of our general partner in 2011, as well as such executive’s title(s) following appointment as our NEO.
| Officer |
Pre-Formation Title(s) |
Post-Formation Title(s) | ||
| D. Hunt Ramsbottom |
Chief Executive Officer, Rentech, Inc. Vice President, REMC |
Chief Executive Officer, Rentech, Inc. and Rentech Nitrogen GP, LLC | ||
| Dan J. Cohrs |
Chief Financial Officer, Rentech, Inc. Vice President and Treasurer, REMC |
Executive Vice President & Chief Financial Officer, Rentech, Inc. and Chief Financial Officer, Rentech Nitrogen GP, LLC | ||
| John A. Ambrose |
President, REMC | Chief Operating Officer, Rentech Nitrogen GP, LLC | ||
| Wilfred R. Bahl, Jr. |
Chief Financial Officer and Vice President, REMC | Senior Vice President of Finance and Administration, Rentech Nitrogen GP, LLC | ||
| Marc E. Wallis |
Vice President, Sales and Marketing, REMC | Senior Vice President of Sales and Marketing, Rentech Nitrogen GP, LLC | ||
90
Table of Contents
Compensation Philosophy
We operate in a highly competitive and dynamic industry, characterized by rapidly changing market requirements. To succeed in this environment, we need to recruit and retain a highly talented and seasoned team of executive, technical, sales, marketing, operations, financial and other business professionals. We recognize that our ability to attract and retain these professionals largely depends on how we compensate and reward our employees, including our NEOs. As discussed under the heading “Compensation Decisions: Roles of Rentech’s Compensation Committee, our General Partner and our Chief Executive Officer” below, prior to the closing of our initial public offering, compensation matters affecting our NEOs were administered by Rentech’s Compensation Committee with input from our compensation consultant and others. Following the closing of our initial public offering, responsibility and authority for compensation-related decisions: (i) for our Shared NEOs resides with Rentech’s Compensation Committee (subject to input and advice from our Chief Executive Officer with regard to our Chief Financial Officer), and (ii) for our Non-Shared NEOs resides with the board of directors of our general partner (subject to input and advice from our Chief Executive Officer), taking into consideration the recommendation of Rentech’s Compensation Committee, in all cases, administered in a manner consistent with the compensation philosophy discussed above. For ease of reference, we refer below to determinations and perspectives formulated by this group as our own. We anticipate that Rentech’s Compensation Committee and our general partner, as applicable, will conduct periodic reviews of our NEOs’ compensation and consider adjustments as appropriate.
As a newly formed entity, we are in the process of designing and implementing our compensation strategy and objectives to address our recruiting and retention needs, which we are building around the following principles and objectives:
• Attract, engage and retain the best executives to work for us, with experience and managerial talent that will build our reputation as an employer of choice in a highly-competitive and dynamic industry;
• Align compensation with our corporate strategies, business and financial objectives and the long-term interests of our unitholders with a focus on increasing long-term value and rewarding achievements of our short- and mid-term financial and strategic objectives;
• Motivate and reward executives whose knowledge, skills and performance ensure our continued success; and
• Ensure that our total compensation is fair, reasonable and competitive.
We seek to create an environment that is responsive to the needs of our employees, is open to employee communication and continual performance feedback, encourages teamwork and rewards commitment and performance. Our compensation program is intended to be flexible and complementary and to collectively serve the principles and objectives of our compensation philosophy. Each of the key elements of our executive compensation program is discussed in more detail below (see “—Core Components of Executive Compensation”).
Compensation Decisions: Roles of Rentech’s Compensation Committee, our General Partner and our Chief Executive Officer
Prior to our formation and the formation of our general partner, each of our NEOs served as an officer of REMC. Upon the closing of our initial public offering, all of our NEOs ceased to be officers of, and to be employed by, REMC. Our Shared NEOs also serve as officers of Rentech. Historically, the initial compensation arrangements for our NEOs have been determined in arm’s-length negotiations with each individual executive at the time of such executive’s hiring. Mr. Ramsbottom has been an officer of Rentech since September 2005 and an officer of REMC since its acquisition by Rentech in April 2006. Mr. Ramsbottom negotiated his initial employment terms with Rentech’s then-current board of directors at the time of his hiring. Mr. Cohrs was hired in October 2008 and negotiated his employment terms with Mr. Ramsbottom, our Chief Executive Officer, subject to the oversight and approval of Rentech’s Compensation Committee. Messrs. Wallis and Ambrose joined REMC shortly after its acquisition by Rentech, each negotiating his employment terms individually with our Chief Executive Officer, subject to the oversight and approval of Rentech’s Compensation Committee. Mr. Bahl was hired by REMC prior to Rentech’s acquisition of REMC in April 2006, but negotiated new terms of employment with our Chief Executive Officer, subject to the oversight and approval of Rentech’s Compensation Committee and board of directors, or Rentech’s Board of Directors, as applicable, at the time of Rentech’s acquisition of REMC.
In the years subsequent to their hiring (or, in the case of Mr. Bahl, since Rentech’s acquisition of REMC), including in 2011, changes to the terms and conditions of our NEOs’ employment, other than our Chief Executive Officer, have been determined by our Chief Executive Officer with the oversight and approval of Rentech’s Compensation Committee, subject to the terms of applicable employment and change-in-control/severance arrangements that are in place with our NEOs (discussed under the heading “—Severance Benefits” below). Changes to the terms and conditions of our Chief Executive Officer’s employment during that period, including during 2011, have been determined by Rentech’s Compensation Committee and Board of Directors, as applicable, subject to the terms and conditions of his employment agreement.
91
Table of Contents
Decisions regarding the terms and conditions of our NEOs’ employment have been influenced by a variety of factors, including, but not limited to:
| • | The NEO’s background, experience and accomplishments; |
| • | Our financial condition, performance and available resources; |
| • | Our need to fill a particular position or retain a particular executive; |
| • | An evaluation of the competitive market, based on the collective experience of the members of Rentech’s Compensation Committee, our Chief Executive Officer and advice from Rentech’s compensation consultant; |
| • | The NEO’s length of service; and |
| • | The compensation levels of our other executive officers. |
Generally, the focus of these compensation decisions has been to retain these skilled individuals and to incentivize them to help meet prescribed financial and other goals. The current compensation levels of our executive officers, including our NEOs, primarily reflect the varying roles and responsibilities of each individual, their accomplishments and the length of time each executive has been employed by Rentech and/or REMC.
Compensation Consultant
During fiscal years 2010 and 2011, Rentech’s Compensation Committee engaged Radford, an Aon Hewitt Company, as an independent compensation consultant to assist in the continuing analysis of the executive compensation program for certain of our officers, including our NEOs. Services provided by Radford during fiscal year 2011 with respect to our NEOs included:
| • | Analyzing and verifying Rentech’s peer group companies and applicable benchmarks; |
| • | Providing compensation survey data and assisting Rentech’s Compensation Committee with the interpretation of this data; |
| • | Advising on the reasonableness and effectiveness of our compensation components, levels and programs for our directors and officers, including our NEOs; and |
| • | Analyzing the impact of our initial public offering on our compensation components, levels and programs and advising as to any appropriate compensation changes, including any changes or additions to equity compensation. |
Rentech’s current peer group was established in 2010 based on discussions among the members of Rentech’s Compensation Committee, certain of Rentech’s executive officers (including certain Shared NEOs) and Radford. The peer group consists of alternative energy companies and certain technology companies with a related focus, in each case, with (i) annual revenues ranging from $50 million to $550 million, (ii) market values ranging from $80 million to $750 million, (iii) revenues ranging from $50 million to $550 million (with a median of $316 million), and (iv) similar employee numbers. Following are the companies that comprise Rentech’s current peer group:
| Advanced Energy Industries |
Fuel Tech | |
| Broadwind Energy |
Fuelcell Energy | |
| Cohu, Inc. |
LSB Industries | |
| Converge, Inc. |
Maxwell Technologies | |
| Echelon Corp. |
MGP Ingredients | |
| EMCORE Corp. |
Rudolph Technologies | |
92
Table of Contents
| Energy Conversion Devices |
Satcon Technology | |
| EnerNoc Inc. |
Ultra Clean Holdings | |
| Evergreen Solar |
Vicor Corp. | |
| FormFactor Inc. |
Zoltek | |
In mid-2010, Rentech’s Compensation Committee reviewed data points as a benchmark for various elements of executive compensation, including base salaries, target incentive as a percentage of salary, total cash compensation, long-term incentives and total direct compensation, based on information gathered from the public filings of Rentech’s peer companies set forth above. Rentech’s Compensation Committee also reviewed aggregated published survey data from Radford’s 2010 Global Technology Survey (using a data set comprised of public high-tech companies with revenue between $50 million and $500 million) in order to validate its benchmarks.
Rentech’s Compensation Committee determined that the compensation of our Shared NEOs was generally above the market median in totality and for individual components of compensation at that time (with the exception of Mr. Ramsbottom’s base salary, which was slightly below the median), yet still within reasonable market practices and in line with Rentech’s compensation philosophy and strategy. Specifically, Rentech’s base salaries and target total cash compensation were on average higher than the median of the market data. A comparison of Rentech’s long-term incentives and total direct compensation (comprised of base salary, annual cash incentives and equity incentives) also revealed levels above the median of the market data for our Shared NEOs. Based on this analysis, Rentech concluded that the level of our total compensation was well positioned to attract and retain the type of management team that we believe is necessary to successfully implement Rentech’s commercialization strategy. We believe that these levels and types of compensation are also consistent with our compensation philosophy and foster our compensation objectives.
Comparative data for our Non-Shared NEOs were not provided by Radford on an individualized basis due to the fact that they were not public company officers at the relevant times. However, compensation policies, including salary levels, annual cash incentives and equity award levels for our Non-Shared NEOs have been guided generally by the input received from Radford with respect to our executive compensation program and we believe that, as with our Shared NEOs, the compensation levels for these NEOs are appropriate for retaining the type of management team that we believe to be essential to our success.
In connection with our initial public offering, Rentech’s Compensation Committee expanded the scope of services provided by Radford by further engaging Radford to provide data and analysis with regard to the levels and types of compensation of our NEOs and directors in connection with and following our initial public offering, and to consider whether Rentech’s peer group remains an appropriate peer group for us. Radford serves at the discretion of Rentech’s Compensation Committee and may be terminated by that committee. We intend to continue to work with Radford to guide and shape our compensation program and we expect that Radford will provide compensation advice both generally for our Non-Shared NEOs and specifically with regard to services provided to us (as opposed to Rentech) by our Shared NEOs.
Radford’s total fee for services provided to Rentech’s Compensation Committee for fiscal year 2011 was approximately $60,000. Of that amount, approximately $12,000 in fees was allocated to us for Radford’s services.
Allocation
All of the executive officers and other personnel necessary for our business to function are employed and compensated by our general partner and/or Rentech, subject to reimbursement of the appropriate entity by us in accordance with the terms of the services agreement. Because each of our Shared NEOs is also an officer of Rentech, our Shared NEOs generally devote less than a majority of their total business time specifically to our general partner and to us. Rentech has the ultimate decision-making authority with respect to the portion of our Shared NEOs’ compensation that is allocated to us pursuant to Rentech’s allocation methodology, subject to the terms of the services agreement. Any such compensation allocation decisions are not subject to approval by us or our general partner. Please see “Certain Relationships and Related Party Transactions—Our Agreements with Rentech—Services Agreement.”
93
Table of Contents
Core Components of Executive Compensation
Through Rentech’s Compensation Committee, we design the principal components of our executive compensation program to fulfil one or more of the principles and objectives described above. Compensation of our NEOs consists of the following elements:
| • | Cash compensation comprised of base salary and annual cash incentive compensation; |
| • | Equity incentive compensation; |
| • | Certain severance and change in control benefits; |
| • | Health and welfare benefits and certain limited perquisites and other personal benefits; and |
| • | Retirement savings (401(k)) plan. |
We view each component of our executive compensation program as related but distinct, and we have historically reassessed the total compensation of our NEOs periodically to ensure that overall compensation objectives are met. In addition, in determining the appropriate level for each compensation component, we have considered, but not relied on exclusively, our understanding of the competitive market based on the collective experience of members of Rentech’s Compensation Committee (and our Chief Executive Officer with regard to the other NEOs), our recruiting and retention goals, our view of internal equity and consistency, the length of service of our executives, our overall financial and operational performance and other relevant considerations.
We have not adopted any formal or informal policies or guidelines for allocating compensation between currently-paid and long-term compensation, between cash and non-cash compensation, or among different forms of non-cash compensation. Generally, we provide a competitive, but balanced, total compensation package that provides the stability of a competitive, set income while also affording our executives the opportunity to be appropriately rewarded through cash and equity incentives if we attain short-term goals and perform well over time.
Each of the primary elements of our executive compensation program is discussed in more detail below. While we have identified particular compensation objectives that each element of executive compensation serves, our compensation programs are intended to be flexible and complementary and to collectively serve all of the executive compensation objectives described above. Accordingly, whether or not specifically mentioned below, we believe that, as a part of our overall executive compensation policy, each individual element, to a greater or lesser extent, serves each of our compensation objectives.
Cash Compensation
We provide our NEOs with cash compensation in the form of base salaries and annual cash incentive awards. Our cash compensation is structured to provide a market-level base salary for our NEOs while creating an opportunity to exceed market levels for total compensation if short- and long-term performance exceeds expectations. We believe that this mix appropriately combines the stability of non-variable compensation (in the form of base salary) with variable performance awards (in the form of annual cash incentives) that reward individual contributions to the success of the business.
Base Salary
As discussed above, base salaries for our NEOs were initially set in arm’s-length negotiations during the hiring process for these executives. These base salaries have historically been reviewed annually by Rentech’s Compensation Committee (with input from our Chief Executive Officer with respect to the other NEOs) and were again reviewed at the end of 2010 for purposes of determining 2011 salaries. Our NEOs are not entitled to any formulaic base salary increases.
Effective January 2011, Mr. Ramsbottom’s base salary increased by approximately 5% to $440,000 in recognition of his leadership of Rentech and to more closely align his salary to the median salary in Rentech’s peer group. Mr. Cohrs’ base salary also increased in January 2011 by approximately 4% to $377,500, effective as of January 2011, in recognition of his effective capital raising efforts on behalf of Rentech and his continued leadership as our Chief Financial Officer. Messrs. Ambrose, Bahl and Wallis also received annual salary increases, effective January 2011, of approximately 4%, 2.5% and 5%, respectively, in connection with their annual reviews. In addition, effective July 1, 2011, Mr. Wallis received a further salary increase of approximately 11%, raising his annual salary to $180,000. Mr. Wallis’ subsequent salary increase was intended as a retention incentive in recognition of the strong demand for experienced sales and marketing executives in the nitrogen fertilizer industry.
94
Table of Contents
The base salaries for our NEOs, both prior to and following their salary increases are set forth in the following table:
| Name |
Base Salary Before Increase ($) | Base Salary After Increase ($) | ||||||
| D. Hunt Ramsbottom |
419,000 | 440,000 | ||||||
| Dan J. Cohrs |
363,000 | 377,500 | ||||||
| John A. Ambrose |
175,854 | 182,884 | ||||||
| Wilfred R. Bahl, Jr. |
176,501 | 180,913 | ||||||
| Marc E. Wallis |
154,085 | 180,000 | (1) | |||||
| (1) | As discussed above, Mr. Wallis received an annual salary increase of approximately 5%, effective January 2011, and an additional salary increase of approximately 11%, effective July 1, 2011. |
In connection with the closing of our initial public offering, effective November 7, 2011, we increased the base salaries of each of our Shared NEOs by 10% to compensate these executives for their expanded responsibilities, duties and exposure to potential liabilities as senior officers of two publicly traded companies. These base salary increases are additional to any annual increases that Rentech’s Compensation Committee may make to the base salaries of our Shared NEOs in connection with annual salary reviews during our fiscal year 2012.
In addition, effective November 7, 2011, Messrs. Ambrose, Bahl and Wallis received salary increases of approximately 15%, 10% and 5%, respectively, upon the closing of our initial public offering pursuant to their respective post-IPO employment agreements to compensate these executives for their expanded responsibilities, duties and exposure to potential liabilities as senior officers of a publicly traded company (see “Narrative Disclosure to Summary Compensation Table and Grants of Plan-Based Awards Table”).
Annual Incentive Compensation
Rentech maintains an annual incentive program to reward executive officers, including our NEOs (other than Mr. Wallis), based on its financial and operational performance, achievement of specific milestones related to technology, financing and project development work associated with Rentech’s alternative energy business, and the individual NEO’s relative contribution to that performance during the year (referred to below as the our annual incentive program). We separately maintain a sales-based annual incentive program for Mr. Wallis to incentivize him in light of his position and responsibilities (referred to below as the sales incentive program). We recognize that successful completion of short-term objectives is critical in achieving our planned level of growth and attaining our other long-term business objectives. Accordingly, our annual and sales incentive programs are designed to reward executives for successfully taking the immediate steps necessary to implement our long-term business strategy.
Annual Incentive Program. During 2011, each of our NEOs (other than Mr. Wallis) was eligible to receive an incentive payment pursuant to Rentech’s annual incentive program, under which cash incentives are determined and paid by reference to (i) the achievement of certain pre-established financial and other performance criteria, and (ii) target bonus amounts (as set forth in the NEOs’ respective employment agreements or, in the case of NEOs who were not, during fiscal year 2011, parties to employment agreements, as determined by Rentech’s Compensation Committee). In the beginning of each fiscal year (including 2011), our CEO and other senior officers of Rentech develop a series of broad objectives, which are then reviewed and revised by Rentech’s Compensation Committee and Board of Directors. Following that review, Rentech’s Board of Directors sets the performance goals for the year, but retains discretion based on input from the Compensation Committee (and our Chief Executive Officer with respect to the other NEOs who participate in the annual incentive program) to increase or decrease annual incentive awards to levels as high as 200% of the NEO’s target bonus and as low as zero, in each case, based on performance during the relevant period.
For fiscal year 2011, the annual incentive awards are targeted (i) for Messrs. Ramsbottom and Cohrs at 100% and 60% of their respective base salaries (in accordance with their respective employment agreements) and (ii) for Messrs. Ambrose and Bahl, at 40% and 30% of their respective base salaries (in accordance with their relative seniority in our organization). Payment of annual incentive awards to our Shared NEOs will be based on the achievement by Rentech and/or REMC of specific financial targets, as well as
95
Table of Contents
certain technology, financial and development milestones relating to the development of Rentech’s alternative energy business, the performance of REMC and the performance of the individual executive. Payment of annual incentive awards to our Non-Shared NEOS other than Mr. Wallis will be based on the achievement of certain safety, production and financial goals primarily linked to REMC’s performance, as well as the performance of the individual executive.
Performance Goals Applicable to Our Shared NEOs
The performance goals applicable to our Shared NEOs for fiscal year 2011 are set forth below, along with determinations as to the attainment of these goals (parentheticals following the description of each goal provide guidelines indicating the approximate weight given to the attainment of each goal by Rentech’s Compensation Committee).
| 1. | Goal: A continued strong safety record at Rentech and REMC’s facilities with an OSHA recordable rate at or below a target rate of 4.0 (failure to attain this goal reduces the final bonus pool by 20%). |
Result: Goal attained. Rentech and REMC completed the year ended September 30, 2011 with an OSHA recordable rate of approximately 2.6 recordable incidents for every 200,000 hours worked at the Rentech and REMC’s facilities, which is well below the industry average for comparable operations.
| 2. | Goal: Total ammonia production ranging from approximately 230,000 tons to 280,000 tons, targeted at approximately 270,000 tons (2.5% weight). |
Result: Goal attained above target level. Total ammonia production at our facility in East Dubuque, Illinois for the fiscal year ending September 30, 2011 was approximately 273,000 tons.
| 3. | Goal: Performance expectations including: |
| • | Consolidated EBITDA targeted at approximately $15.0 million (15% weight). |
Result: Goal attained above target level. Consolidated EBITDA for the fiscal year ended September 30, 2011 was approximately $27.7 million.
| • | REMC EBITDA targeted at approximately $63 million (5% weight). |
Result: Goal attained above target level. REMC EBITDA for the fiscal year ended September 30, 2011 was approximately $81.7 million.
| • | Consolidated capital expenditures limit of approximately $49 million (2.5% weight). |
Result: Goal attained above target level. Consolidated capital expenditures for fiscal year ended September 30, 2011 was approximately $42.4 million.
| 4. | Goal: Raise capital proceeds, targeted at $50 million, sufficient to fund Rentech’s budgeted activities and provide a year-end cash cushion (10% weight). |
Result: Goal partially attained. Rentech received a distribution including approximately $47 million of new loan proceeds upon the closing of REMC’s June 10, 2011 five year $150 million secured term loan facility.
| 5. | Goal: Successful operation of Rentech’s Product Demonstration Unit during 2011 that meets or exceeds performance criteria aimed at improving the economic efficiency of the Rentech Process, targeted at operation for more than 30 days with acceptable catalyst usage levels (5% weight). |
Result: Goal partially attained. Rentech operated the Product Demonstration Unit for more than 30 days during 2011; however, catalyst usage objectives and overall efficiency did not fully meet expectations.
| 6. | Goal: Construction and integration of the ClearFuels Gasifier at Rentech’s Product Demonstration Unit on schedule, targeted at 75% operational completion (5% weight). |
96
Table of Contents
Result: Goal attained above target level. Rentech had completed approximately 80% of this project as of September 30, 2011.
| 7. | Goal: Close construction financing for Rentech’s project in Rialto, California or an alternate project (25% weight) and secure funding commitment and development milestones for an additional project (5% weight). |
Result: Goals not attained. Construction financing was not obtained for Rentech’s Rialto project (or an alternate project), nor was a funding commitment secured or development milestones established for an additional project.
| 8. | Goal: Complete design of catalyst recipe that meets catalyst cost targets (5% weight). |
Result: Goal partially attained.
| 9. | Goal: Other factors which contribute to the success of Rentech as determined by Rentech’s Board of Directors, including the Board’s subjective assessment of the executives’ contributions to attaining the objective goals specified above (20% weight). |
Result: Determined on a case-by-case basis.
Performance Goals Applicable to Our Non-Shared NEOs (Other than Mr. Wallis)
The performance goals applicable to our Non-Shared NEOs for fiscal year 2011 are set forth below, along with determinations as to the attainment of these goals (each of these goals will be weighted approximately evenly in determining annual incentive payments to our Non-Shared NEOs).
| 1. | Goal: A continued strong safety record at Rentech and REMC’s facilities with an OSHA recordable rate at or below a target rate of 4.0. |
Result: Rentech and REMC completed fiscal year 2011 with an OSHA recordable rate of approximately 2.6 recordable incidents for every 200,000 hours worked at Rentech and REMC’s facilities, which is well below the industry average for comparable operations.
| 2. | Goal: Total ammonia production ranging from approximately 230,000 tons to 280,000 tons, targeted at approximately 270,000 tons. |
Result: Goal attained above target level. Total ammonia production at our facility in East Dubuque, Illinois for the fiscal year ending September 30, 2011 was approximately 273,000 tons.
| 3. | Goal: REMC EBITDA targeted at approximately $63 million. |
Result: Goal attained above target level. REMC EBITDA for the fiscal year ended September 30, 2011 was approximately $81.7 million.
| 4. | Goal: Consolidated capital expenditures limit of approximately $49 million. |
Result: Goal attained above target level. Consolidated capital expenditures for fiscal year ended September 30, 2011 was approximately $42.4 million.
At the end of each year (including fiscal year 2011), our Chief Executive Officer develops a scorecard based on his own assessment and input from other members of Rentech’s senior management team that summarizes performance for each of his direct reports (including the other NEOs who participate in the annual incentive program) compared to the pre-established goals, taking into consideration any key accomplishments outside of the set goals for the year. Satisfaction of each goal is evaluated on a scale ranging from zero (did not meet) to two (exceptional performance) and the scorecard is then reviewed by Rentech’s Compensation Committee and modified as appropriate in its discretion. Final incentive payments for our NEOs participating in the annual incentive program are determined based on a combination of performance compared to the set goals and the individual’s contributions to Rentech’s and our overall success during the year. Mr. Ramsbottom and Mr. Cohrs will receive 2011 annual incentive payments equal to approximately 50% of their respective target bonuses based on the performance results described above. In
97
Table of Contents
addition, Mr. Ambrose and Mr. Bahl will receive 2011 annual incentive payments equal to approximately 120% of their respective target bonuses due to performance in excess of target levels at REMC for fiscal year 2011.
Sales Incentive Program. For fiscal year 2011, in light of the strong demand for experienced sales and marketing executives in the nitrogen fertilizer industry, Rentech implemented a sales incentive program for Mr. Wallis that links his annual incentive opportunity with performance factors specifically designed to promote sales and marketing activities advancing sales objectives. Rentech believes that a sales-based incentive program better ties Mr. Wallis’ variable compensation opportunity to his duties and responsibilities. Under the sales incentive program, Mr. Wallis is eligible to receive an incentive payment of up to 100% of his base salary based on the corresponding percentage (up to 100%) at which REMC attains its budgeted 2011 EBITDA. REMC exceeded its budgeted 2011 EBITDA of $63 million. Accordingly, we expect that Mr. Wallis will be paid in full for this component of his annual incentive award.
Mr. Wallis is also eligible to receive an additional payment of up to 50% of his base salary based on the attainment of the following scorecard of individual performance goals, determined and approved by Messrs. Ambrose and Diesch, as well as Rentech’s Senior Vice President, Human Resources (which goals are each weighted equally in determining the amount of any non-EBITDA-based annual incentive payable to Mr. Wallis).
| 1. | Goal: Raise contract sales price to a large purchaser of CO2 to levels comparable to those paid by comparably sized purchasers of CO2. |
Result: Goal attained at approximately 75%. No contract has been executed by the relevant purchaser; however, the terms of an agreement have been tentatively agreed upon.
| 2. | Goal: Convert 25% of acid sales requiring use of strong acid in formulation to sales requiring use of a lower strength acid. |
Result: Goal not attained. Lower strength acid sales did not materially increase over the relevant period.
| 3. | Goal: Begin sales of aqua ammonia from our Monsanto unit no later than September 1, 2011. |
Result: Goal not attained.
| 4. | Goal: Complete multi-year memorandum of agreement with a large company for the purchase of DEF. |
Result: Goal attained.
| 5. | Goal: Manage the sale of emission reduction credits generated by the installation of a catalytic converter on Nitric Acid Plant #1 in an amount to cover investment costs of approximately $975,000 associated with the project by September 30, 2011. |
Result : Goal attained at approximately 25%—50%. Contract for sales of emission reduction credits was in process as of September 30, 2011, but has not yet been finalized.
Mr. Wallis will receive a payout under his non-EBITDA-based annual incentive at approximately 22.54% of base salary based on attainment of approximately 45% of these performance goals (in addition to full payment of the EBITDA component of his incentive opportunity). In connection with the closing of our initial public offering, we are working with Radford to determine whether any new or enhanced process for establishing annual incentives should be implemented with respect to our Non-Shared NEOs (and other executives other than the Shared NEOs) to reflect changes resulting from our initial public offering.
98
Table of Contents
Long-Term Equity Incentive Awards
Rentech believes that senior executives, including our NEOs, should have an ongoing stake in the success of their employer to closely align their interests with those of its shareholders. Accordingly, equity awards covering shares of Rentech’s common stock have historically been a key component of our compensation program, including during 2011, as these awards have served to align the interests of our NEOs with those of Rentech’s shareholders and incentivize our NEOs to work toward long-term growth. Historically, our NEOs have received awards of both stock options and restricted stock units (RSUs), each covering shares of Rentech’s stock.
Stock options are intended to tie our NEOs’ compensation to the creation of shareholder value over time, while RSUs, which also tie compensation to longer-term shareholder return, enable us to confer value in excess of simple future appreciation in share price where appropriate. Historical levels and types of awards have varied over the years depending on prevailing economic conditions and other performance-related considerations at the time of grant.
Rentech’s equity awards are generally granted subject to time-vesting requirements in order to provide an appropriate retention incentive. In addition, certain grants of RSUs have historically been issued by Rentech with performance-based vesting conditions intended to incentivize our NEOs to outperform our peer companies and to reward the achievement of specific milestones in the development of commercial projects using our technologies.
In October 2010 (during our fiscal year 2011), Rentech granted the following equity incentive awards to our NEOs:
| Officer |
Stock Options | Restricted Stock Units (RSUs) |
||||||
| D. Hunt Ramsbottom |
700,000 | 300,000 | ||||||
| Dan J. Cohrs |
411,765 | 176,471 | ||||||
| John A. Ambrose |
61,765 | 26,471 | ||||||
| Wilfred R. Bahl, Jr. |
24,706 | 10,588 | ||||||
| Marc E. Wallis |
20,588 | 8,824 | ||||||
Each of these equity incentive awards vests in equal annual installments on each of the first three anniversaries of the applicable grant date, subject to the relevant NEO’s continued employment, and further subject to accelerated vesting in connection with (i) the executive’s termination of employment by the employer without cause or by the executive for good reason, in either case, in connection with a change of control of Rentech, or (ii) the executive’s death or disability. We believe that these vesting terms provide an appropriate retention incentive, while protecting the NEOs’ compensation opportunity upon the occurrence of events beyond their control. Based on prevailing economic conditions at the time of these grants, we believe that using a mix of “full value” RSUs together with stock options was appropriate. The RSUs confer value based on Rentech’s existing stock price and thereby provide a retention incentive with tangible value on the grant date. By contrast, the stock options confer value to the NEOs based solely on post-grant appreciation of Rentech’s shares.
Rentech generally granted incentive stock options (ISOs) to our NEOs, which offer preferential tax benefits to our NEOs if they satisfy statutory holding period requirements for the ISO shares after exercise (and certain other conditions are met), thereby providing an incentive for our NEOs to hold Rentech shares and further align their interests with those of Rentech’s shareholders. However, a portion of the stock options granted to Messrs. Ramsbottom and Cohrs were granted as nonqualified stock options to comply with statutory ISO limits. We believe that this mix of awards furthers our compensation objectives by incentivizing our NEOs to remain employed with us, to increase shareholder value and to hold Rentech’s shares for an extended duration. The size of these awards was dictated primarily by the applicable NEO’s relative seniority, responsibilities, individual performance and ability to contribute to an increase in shareholder value.
IPO-Related Equity Awards
In connection with the closing of our initial public offering, we made equity incentive grants to certain of our executives (referred to below as the IPO Grants), including our NEOs, to reward these executives for their success in completing our initial public offering and to incentivize these executives with respect to the additional demands that will be placed upon them in connection with our becoming a publicly traded company. The IPO Grants are additional to any annual grants of equity awards that Rentech’s Compensation Committee may make to our executives during our fiscal year 2012.
99
Table of Contents
The IPO Grants were comprised in equal parts (determined by reference to the fair market value of the shares or units underlying the awards, as applicable) of (i) unit-settled phantom units covering the Partnership’s common units (which will be granted in tandem with dividend equivalent rights) and (ii) stock-settled RSUs covering Rentech’s stock, in each case, vesting in ratable one-third increments over three years from the closing of our initial public offering, subject to accelerated vesting in certain circumstances. For Messrs. Ramsbottom, Cohrs, Ambrose, Bahl and Wallis, such grants had market values as of the applicable grant dates of approximately $1.3 million, $0.9 million, $0.4 million, $0.4 million and $0.4 million, respectively (divided approximately evenly between Partnership phantom units and Rentech RSUs).
The IPO Grants made to our NEOs are summarized in the table below:
| Officer |
Partnership Phantom Units |
Rentech Restricted Stock Units (RSUs) |
||||||
| D. Hunt Ramsbottom |
33,273 | 435,097 | ||||||
| Dan J. Cohrs |
23,158 | 302,834 | ||||||
| John A. Ambrose |
11,164 | 145,990 | ||||||
| Wilfred R. Bahl, Jr. |
10,306 | 134,760 | ||||||
| Marc E. Wallis |
9,447 | 123,530 | ||||||
We believe that awards covering equity interests of both Rentech and the Partnership are appropriate in light of the services provided by each of the NEOs for the benefit of the Partnership and the connection between the success of the Partnership and the value of Rentech’s stock in light of Rentech’s substantial ownership interest in the Partnership. We further believe that a three-year vesting schedule provides an appropriate retention incentive to these executives to help ensure the stability and consistency of our management team. In determining appropriate levels of IPO Grants, Rentech’s Compensation Committee considered, among other things, the role and responsibility of each NEO and the perceived need to reward and retain the NEO.
2011 Incentive Award Plan
In connection with our initial public offering, we adopted a 2011 long-term incentive plan (referred to as the “2011 LTIP”). Our general partner’s officers (including the NEOs), employees, consultants and non-employee directors, as well as other key employees of Rentech and certain of our other affiliates who make significant contributions to our business, are eligible to receive awards under the 2011 LTIP, thereby linking the recipients’ compensation directly to our performance. The description set forth below is a summary of the material features of the 2011 LTIP.
General
The 2011 LTIP provides for the grant of unit awards, restricted units, phantom units, unit options, unit appreciation rights, distribution equivalent rights, profits interest units and other unit-based awards. Subject to adjustment in the event of certain transactions or changes in capitalization, 3,825,000 common units may be delivered pursuant to awards under the 2011 LTIP. Units subject to awards that are cancelled or forfeited, or that otherwise terminate or expire, will be available for delivery pursuant to subsequently granted awards. Units that are withheld to satisfy tax withholding obligations or payment of an award’s exercise price will not be available for future awards. The 2011 LTIP is administered by the board of directors of our general partner or a committee designated by the board (referred to below collectively as the “plan administrator”), taking into consideration the recommendation of Rentech’s Compensation Committee. The 2011 LTIP is designed to promote our interests, as well as the interests of our unitholders, by rewarding the officers, employees and directors of our general partner and certain of its affiliates for delivering desired performance results, as well as by strengthening our ability to attract, retain and motivate qualified individuals to serve as directors, consultants and employees.
100
Table of Contents
Administration
Subject to the terms and conditions of the 2011 LTIP and applicable law, the plan administrator has the authority to interpret and administer the 2011 LTIP, determine the types of awards granted and the grantees, set the terms and conditions of awards and adopt rules as it deems appropriate for the administration of the plan. The plan administrator may delegate certain duties to a committee of directors and/or officers of our general partner subject to any limitations that may be imposed under Section 16 of the Exchange Act and/or stock exchange rules, as applicable.
Vesting
The plan administrator may, in its discretion, subject awards to vesting linked to the grantee’s completion of a period of service, the achievement of specified performance or financial objectives, a change in control and/or other criteria determined by the plan administrator and set forth in an award agreement.
Unit Awards
A unit award is an award of common units that are fully vested upon grant and are not subject to forfeiture. Unit awards may be paid in addition to, or in lieu of, cash or other compensation that would otherwise be payable to a participant. A unit award may be wholly discretionary in amount or it may be paid with respect to a bonus or other incentive compensation award, the amount of which is determined based on the achievement of performance criteria or other factors.
Restricted Units and Phantom Units
A restricted unit is a common unit that is subject to forfeiture. Upon vesting, the forfeiture restrictions lapse and the recipient holds a common unit that is not subject to forfeiture. A phantom unit is a notional unit that entitles the grantee to receive a common unit (or its cash equivalent) upon the vesting of the phantom unit or on a deferred basis upon specified future dates or events. Distributions made by us with respect to awards of restricted units may, in the discretion of the plan administrator, be subject to the same vesting requirements as the restricted units. The plan administrator, in its discretion, may also grant tandem distribution equivalent rights with respect to phantom units.
Distribution Equivalent Rights
Distribution equivalent rights are rights to receive an amount equal to all or a portion of the cash distributions made on common units underlying an award for the period during which the award remains outstanding.
Unit Options and Unit Appreciation Rights
Unit options represent the right to purchase a number of common units at a specified exercise price. Unit appreciation rights represent the right to receive the appreciation in the value of a number of common units over a specified strike price, either in cash or in common units, as determined by the plan administrator. Unit options and unit appreciation rights may be granted to such eligible individuals and with such terms as the plan administrator may determine, consistent with the 2011 LTIP; however, unit options and unit appreciation rights must have exercise prices that are no less than the fair market value of their underlying common units on the date of grant.
Profits Interest Units
Profits interest units are awards of units that are intended to constitute “profits interests” within the meaning of the Internal Revenue Code. Profits interest units may be subject to vesting conditions and other restrictions as the plan administrator may deem appropriate in accordance with the terms of the 2011 LTIP.
Other Unit-Based Awards
“Other unit-based awards” are awards that, in whole or in part, are valued by reference to the value of a common unit. These unit-based awards may contain such vesting, payment and other terms and conditions as the plan administrator may deem appropriate in accordance with the terms of the 2011 LTIP. Other unit-based awards may be paid in cash and/or in units (including restricted units), on a current or deferred basis, as the plan administrator may determine.
101
Table of Contents
Source of Common Units; Cost
Common units to be delivered with respect to awards may be newly-issued units, common units acquired by our general partner in the open market, common units already owned by our general partner or us, common units acquired by our general partner directly from us or any other person or any combination of the foregoing. Pursuant to our partnership agreement, our general partner will be entitled to reimbursement by us for the cost incurred in acquiring such common units. With respect to unit options, our general partner will be entitled to reimbursement from us for the difference between the cost it incurs in acquiring these common units and the proceeds it receives from an optionee at the time of exercise of an option. Thus, we will bear the cost of the unit options. If we issue new common units with respect to these awards, the total number of common units outstanding will increase, and our general partner will remit the proceeds it receives from a participant, if any, upon exercise of an award to us. With respect to any awards settled in cash, our general partner will be entitled to reimbursement by us for the amount of such cash settlement.
Adjustments
The plan administrator has broad discretion to equitably adjust the number and type of securities available for issuance under the 2011 LTIP, as well as the terms and conditions of outstanding and future awards, in the event of certain changes affecting our units, such as non-cash distributions, unit splits, combinations or exchanges of units, mergers, consolidations or distributions of our assets to unitholders. In addition, in the event of an “equity restructuring,” the plan administrator will make equitable adjustments to the 2011 LTIP and outstanding awards, including with respect to the number and type of units covered by each outstanding award and the terms and conditions of such awards.
Change in Control
In the event of a change in control (as defined in the 2011 LTIP), the plan administrator may, in its discretion: (i) provide for the termination of outstanding awards in exchange for payment or the replacement of such awards with other rights or property, with such payment in an amount equal to, or such other rights or property having a value equal to, the amount that would have been attained upon the exercise of such award or the realization of the participant’s rights under such award, (ii) provide that outstanding awards will be assumed by the surviving entity or substituted for similar awards covering equity of the surviving entity, (iii) make adjustments to the number and type of units covered by each outstanding award and the terms and conditions of such awards and/or (iv) provide that the outstanding awards will vest in full and become exercisable or payable upon such event.
Amendment or Termination of 2011 LTIP
The plan administrator, at its discretion, may terminate the 2011 LTIP at any time with respect to common units that are not yet subject to an outstanding award. The 2011 LTIP will automatically terminate on the 10th anniversary of the date it was initially adopted by our general partner. The plan administrator will also have the right to alter or amend the 2011 LTIP or any part of it from time to time, subject to approval by our unitholders to the extent necessary to comply with applicable law and securities exchange listing standards or rules, or to amend any outstanding award made under the 2011 LTIP, provided that no change in any outstanding award may be made that would materially reduce the rights or benefits of a participant without the consent of the affected participant.
Severance Benefits
We believe that vulnerability to termination of employment at the senior executive level creates uncertainty for our NEOs that is appropriately addressed by providing severance protections which enable and encourage these executives to focus their attention on their work duties and responsibilities in all situations. We operate in a highly volatile and acquisitive industry that heightens this vulnerability in the change-in-control context. Accordingly, in order to attract and retain our key managerial talent, Rentech (in the case of our Shared NEOs) and our general partner (in the case of our Non-Shared NEOs) are parties to agreements with our NEOs which provide for specified severance payments and benefits in connection with certain qualifying terminations of employment. The principles underlying the various components of these agreements are discussed in this section. For a description of the specific terms and conditions of each agreement, see “—Narrative Disclosure to Summary Compensation Table and Grants of Plan-Based Awards Table” and “—Potential Payments upon Termination or Change-in-Control” below. In connection with our initial public offering, the Non-Shared NEOs entered into employment agreements with our general partner that took effect upon the closing of our initial public offering and superseded their change in control severance agreements with REMC (the specific terms of these agreements are also described under the heading “Narrative Disclosure to Summary Compensation Table and Grants of Plan-Based Awards Table”).
102
Table of Contents
Under their employment agreements, our Shared NEOs are entitled to severance upon involuntary terminations without “cause” or for “good reason” (each as defined in the applicable employment agreement) consisting of (i) one year (in the case of Mr. Cohrs) or three years (in the case of Mr. Ramsbottom) of base salary continuation (payable over two years for Mr. Ramsbottom), (ii) payment of target bonus and (iii) up to eighteen months of subsidized healthcare premiums, in addition to certain accelerated equity vesting under the terms of individual equity awards. In the case of an involuntary termination of employment in connection with our non-renewal of the applicable agreement, Mr. Ramsbottom is entitled to the same severance, while Mr. Cohrs is entitled to a reduced severance consisting of only the salary continuation described above (but not payment of the target bonus or subsidized healthcare continuation) and, at Rentech’s discretion, an annual bonus for the fiscal year preceding the non-renewal. We believe that, in light of these NEOs’ seniority and the resulting vulnerability to involuntary termination, these severance payments and benefits provide an appropriate level of assurance in the non-transactional context. The specific levels of payments and benefits are determined by the relative seniority and duration of service of the NEOs.
In addition, if our Shared NEOs are involuntarily terminated (without cause, for good reason or due to non-renewal) in connection with a change in control, these NEOs are entitled to receive their cash severance in a lump-sum and are further eligible for a severance enhancement equal to the amount by which their respective prior-year bonuses exceeds their then-current target bonus (in the case of Mr. Ramsbottom, payment of this enhanced bonus, if applicable, would be in lieu of one year of salary payments, such that Mr. Ramsbottom would receive two years of salary payment plus the amount of his prior-year bonus instead of three years of salary). We believe that the lump-sum payment is appropriate to limit the NEOs’ exposure to any credit risk associated with new owners/management and that the potential enhancement provides an appropriate additional incentive to focus on the best interests of the shareholders in the context of a potential transaction. These NEOs are also entitled to a tax gross-up payment in the event that any “golden parachute” excise taxes are imposed on them under Section 280G of the Internal Revenue Code in connection with a transaction. The gross-up payments are intended to counter any disincentive the NEOs may have to consummate a beneficial transaction as a result of the potential imposition of these golden parachute excise taxes.
Under their change in control severance agreements with REMC, Messrs. Ambrose, Bahl and Wallis were entitled to severance payments and benefits upon an involuntary termination without cause or for good reason in connection with a change in control. These severance benefits were comprised of continuation salary payments for one year and payment of the executive’s target bonus for the year, in addition to up to one year of subsidized healthcare premiums. We believe that these “double trigger” arrangements (which only pay severance if a termination occurs in connection with a change in control) provided appropriate protections in the event of an involuntary termination without creating a potential windfall simply due to the consummation of a transaction. The terms of these agreements were established before these NEOs served as public company officers and reflect the more limited protections that we felt were appropriate for these executives at that time. As noted above, in connection with our initial public offering, the Non-Shared NEOs entered into employment agreements with our general partner that took effect upon the closing of our initial public offering and superseded their change in control severance agreements, providing severance protections that we believe are appropriate for their new roles as public company officers (the specific terms of these agreements are described under the heading “Narrative Disclosure to Summary Compensation Table and Grants of Plan-Based Awards Table”).
Benefits and Perquisites
Rentech maintains a standard complement of health and retirement benefit plans for our employees, including our NEOs, that provide medical, dental, and vision benefits, flexible spending accounts, a 401(k) savings plan (including an employer-match component), short-term and long-term disability insurance, accidental death and dismemberment insurance and life insurance coverage. These benefits are generally provided to our NEOs on the same terms and conditions as they are provided to our other non-union employees.
We believe that these health and retirement benefits comprise key elements of a comprehensive compensation program. Our health benefits help provide stability and peace of mind to our NEOs, thus enabling them to better focus on their work responsibilities, while our 401(k) plan provides a vehicle for tax-preferred retirement savings with additional compensation in the form of an employer match that adds to the overall desirability of our executive compensation package. Our employee benefits programs are designed to be affordable and competitive in relation to the market, as well as compliant with applicable laws and practices. Rentech periodically reviews and adjusts these employee benefits programs as needed based upon regular monitoring of applicable laws and practices in the competitive market.
Messrs. Ramsbottom and Cohrs receive reimbursement of certain financial advisor costs, and these executives, as well as Messrs. Ambrose and Bahl, also receive a monthly car allowance. Mr. Wallis has access to a company-provided car intended primarily for business use, but Mr. Wallis may make use of this car for certain personal matters as well. We also provided Mr. Bahl with supplemental group term life insurance coverage during 2011 and provided him with a gross-up payment to cover taxes resulting from our payment of the related premiums. While we believe that these benefits are appropriate and commensurate with these NEOs’ positions, we do not generally view perquisites or other personal benefits as a material component of our executive compensation
103
Table of Contents
program. In the future, we may provide additional or different perquisites or other personal benefits in limited circumstances, such as where we believe doing so is appropriate to assist an individual in the performance of his or her duties, to make our executive officers more efficient and effective, and for recruitment, motivation and/or retention purposes.
Tax and Accounting Considerations
Section 280G of the Internal Revenue Code
Section 280G of the Internal Revenue Code disallows a tax deduction with respect to excess parachute payments to certain executives of companies which undergo a change in control. In addition, Section 4999 of the Internal Revenue Code imposes a 20% excise tax on the individual with respect to the excess parachute payment. Parachute payments are compensation linked to or triggered by a change in control and may include, but are not limited to, bonus payments, severance payments, certain fringe benefits, and payments and acceleration of vesting from long-term incentive plans including stock options and other equity-based compensation. Excess parachute payments are parachute payments that exceed a threshold determined under Section 280G of the Internal Revenue Code based on the executive’s prior compensation. In approving compensation arrangements for our NEOs in the future, we expect to consider all elements of the cost of providing such compensation, including the potential impact of Section 280G of the Internal Revenue Code. However, we may authorize compensation arrangements that could give rise to loss of deductibility under Section 280G of the Internal Revenue Code and the imposition of excise taxes under Section 4999 of the Internal Revenue Code if we feel that such arrangements are appropriate to attract and retain executive talent.
Under their employment agreements with Rentech, Messrs. Ramsbottom and Cohrs are entitled to gross-up payments in the event that any excise taxes are imposed on them. Rentech has historically provided these protections to its senior executives to ensure that they will be properly incentivized in the event of a potential change in control of Rentech to maximize shareholder value in a transaction while minimizing concern for potential consequences of the transaction to these executives.
Section 409A of the Internal Revenue Code
Section 409A of the Internal Revenue Code requires that “nonqualified deferred compensation” be deferred and paid under plans or arrangements that satisfy the requirements of the statute with respect to the timing of deferral elections, timing of payments and certain other matters. Failure to satisfy these requirements can expose employees and other service providers to accelerated income tax liabilities, substantial additional taxes and interest on their vested compensation under such plans. Accordingly, as a general matter, it is our intention to design and administer our compensation and benefit plans and arrangements for all of our employees and other service providers, including our NEOs, so that they are either exempt from, or satisfy the requirements of, Section 409A of the Internal Revenue Code.
Accounting for Stock-Based Compensation
Rentech has followed, and we expect to follow, Financial Accounting Standards Board Accounting Standards Codification Topic 718, or ASC Topic 718, for stock-based compensation awards. ASC Topic 718 requires companies to calculate the grant date “fair value” of their stock-based awards using a variety of assumptions. ASC Topic 718 also requires companies to recognize the compensation cost of their stock-based awards in their income statements over the period that an employee is required to render service in exchange for the award. Grants of stock options, restricted stock, RSUs and other equity-based awards under equity incentive award plans have been (by Rentech) and will be accounted for under ASC Topic 718. We expect that we will regularly consider the accounting implications of significant compensation decisions, especially in connection with decisions that relate to our equity incentive award plans and programs. As accounting standards change, we may revise certain programs to appropriately align accounting expenses of our equity awards with our overall executive compensation philosophy and objectives.
Compensation Committee Report
The board of directors of our general partner does not have a Compensation Committee. The board of directors has reviewed and discussed with management the foregoing Compensation Discussion and Analysis and, based on such review and discussion, the board of directors determined that the Compensation Discussion and Analysis should be included in this report.
D. Hunt Ramsbottom
John H. Diesch
104
Table of Contents
Halbert S. Washburn
Michael F. Ray
Michael S. Burke
Keith B. Forman
Compensation Committee Interlocks and Insider Participation
During fiscal year 2011, the following individuals served as members of Rentech’s Compensation Committee: Michael S. Burke, Halbert S. Washburn, and Edward M. Stern. None of these individuals has ever served as an officer or employee of Rentech or any of its subsidiaries (including our general partner). No executive officer of Rentech or us has served as a director or member of the compensation committee of another entity at which an executive officer of such entity is also a director of Rentech.
Summary Compensation Table
We and our general partner were formed in July 2011. Accordingly, neither we nor our general partner accrued any obligations with respect to management compensation or benefits for directors and executive officers for any prior periods. The following table summarizes the compensation that was attributable to services performed for REMC for the fiscal year ending September 30, 2011 for each of our NEOs (excluding any estimate for non-equity incentive plan compensation).
With respect to our Shared NEOs, the amounts contained in the summary compensation table reflect the portion of these NEOs’ total compensation paid by Rentech that we estimate was attributable to services performed by these NEOs for REMC during fiscal year 2011, calculated by multiplying each amount by a good faith estimate of the percentage of time such NEO dedicated to such services for REMC. The estimated percentage of time allocable to REMC for each Shared NEO is as follows: D. Hunt Ramsbottom (20%) and Dan J. Cohrs (20%). Our Non-Shared NEOs devoted substantially all of their business time to REMC during the relevant period.
| Name and Principal Position |
Year | Salary ($) |
Stock Awards ($) (1) |
Option Awards ($) (2) |
Non- Equity Incentive Plan Compensation ($)(3) |
All Other Compensation ($)(4) |
Total ($)(5) |
|||||||||||||||||||||
| D. Hunt Ramsbottom(6) Chief Executive Officer |
2011 | 86,950 | 48,357 | 91,452 | 44,000 | 8,648 | 279,407 | |||||||||||||||||||||
| Dan J. Cohrs,(7) Chief Financial Officer |
2011 | 74,775 | 28,445 | 53,795 | 22,650 | 8,105 | 187,770 | |||||||||||||||||||||
| John A. Ambrose, Chief Operating Officer |
2011 | 181,127 | 21,334 | 40,346 | 87,780 | 13,855 | 344,442 | |||||||||||||||||||||
| Wilfred R. Bahl, Jr., Senior Vice President of Finance and Administration |
2011 | 179,810 | 8,533 | 16,139 | 65,124 | 17,470 | 287,076 | |||||||||||||||||||||
| Marc E. Wallis, Senior Vice President of Sales and Marketing |
2011 | 164,416 | 7,112 | 13,449 | 220,500 | 8,354 | 413,831 | |||||||||||||||||||||
105
Table of Contents
| (1) | Amounts reflect the full grant-date fair value of RSU awards granted, computed in accordance with ASC Topic 718, rather than the amounts paid to or realized by the named individual. Rentech provides information regarding the assumptions used to calculate the value of all Rentech stock awards made to executive officers in note 15 to its consolidated financial statements included in Rentech’s Form 10-K, filed December 14, 2011. There can be no assurance that awards will vest (in which case no value will be realized by the executive). |
| (2) | Amounts reflect the full grant-date fair value of stock options granted, computed in accordance with ASC Topic 718, rather than the amounts paid to or realized by the named individual. Rentech provides information regarding the assumptions used to calculate the value of all Rentech stock options granted to executive officers in note 15 to its consolidated financial statements included in Rentech’s Form 10-K, filed December 14, 2011. There can be no assurance that awards will vest (in which case no value will be realized by the executive). |
| (3) | Each of our NEOs (other than Mr. Wallis) participates in Rentech’s annual incentive program and is eligible to receive an annual incentive award based on the achievement of certain pre-established financial and other performance criteria and determined by reference to target bonuses either as set forth in their respective employment agreements or as determined by their seniority. Mr. Wallis participates in our sales incentive program and is eligible to receive an annual incentive award based on the attainment of sales and marketing goals. The amount of compensation payable under the annual and sales incentive programs was determined (i) for Messrs. Ramsbottom and Cohrs at approximately 50% of their respective target levels, (ii) for Messrs. Ambrose and Bahl at approximately 120% of their respective target levels, and (iii) for Mr. Wallis in an amount equal to approximately 122.5% of his base salary. For a description of the annual and sales incentive programs, see “—Annual Incentive Compensation” above. |
| (4) | Amounts under the “All Other Compensation” column consist of (i) 401(k) matching contributions for Messrs. Ramsbottom, Cohrs, Ambrose, Bahl and Wallis of $2,132, $2,079, $7,409, $8,456 and $7,158, respectively; and (ii) perquisites consisting of company-paid auto allowances, financial and tax planning benefits and long-term disability insurance. The following table identifies and quantifies these perquisites for the fiscal year ended September 30, 2011. With respect to our Shared NEOs, the amounts set forth below have been allocated based on the estimated percentage of time each Shared NEO dedicated to services for REMC during fiscal year 2011: |
Perquisites
| Name |
Auto Allowance |
Long-Term Disability |
Supplemental Life Insurance |
Financial and Tax Planning |
Tax Gross-up Payment |
Total | ||||||||||||||||||
| D. Hunt Ramsbottom |
2,880 | 50 | 49 | 3,537 | — | 6,516 | ||||||||||||||||||
| Dan J. Cohrs |
2,400 | 50 | 49 | 3,527 | — | 6,026 | ||||||||||||||||||
| John A. Ambrose |
6,000 | 252 | 194 | — | — | 6,446 | ||||||||||||||||||
| Wilfred R. Bahl, Jr. |
8,400 | 252 | 362 | — | — | 9,014 | ||||||||||||||||||
| Marc E. Wallis |
840 | (A) | 252 | 104 | — | — | 1,196 | |||||||||||||||||
| (A) | Represents the value of personal usage of a company-provided vehicle determined by multiplying 15% (the percentage of time that we estimate Mr. Wallis used the vehicle for personal purposes) by $5,600 (the total company costs associated with the vehicle). |
| (5) | Note that “Totals” do not yet reflect non-equity incentive compensation, as those amounts have not yet been determined. |
| (6) | We estimate that Mr. Ramsbottom dedicated approximately 20% of his work time to the business and affairs of REMC during the fiscal year ended September 30, 2011 and, accordingly, the compensation figures attributable to Mr. Ramsbottom in this Summary Compensation Table reflect 20% of his total compensation for each category. Mr. Ramsbottom’s “Total Compensation” for the year ended September 30, 2011, including amounts paid for services provided to Rentech and its affiliates, equaled $1,177,035 (excluding any non-equity incentive award that becomes payable). |
106
Table of Contents
| (7) | We estimate that Mr. Cohrs dedicated approximately 20% of his work time to the business and affairs of REMC during the fiscal year ended September 30, 2011 and, accordingly, the compensation figures attributable to Mr. Cohrs in this Summary Compensation Table reflect 20% of his total compensation for each category. Mr. Cohrs’ “Total Compensation” for the year ended September 30, 2011, including amounts paid for services provided to Rentech and its affiliates, equaled $825,604 (excluding any non-equity incentive award that becomes payable). |
Grants of Plan-Based Awards
The following table sets forth information with respect to the NEOs concerning the grant of plan-based awards from Rentech’s plan during fiscal year 2011. With respect to our Shared NEOs, the amounts set forth below reflect the portion of these NEOs’ plan-based awards that we estimate was attributable to services performed by these NEOs for REMC during fiscal year 2011, calculated in the same manner as amounts disclosed for these Shared NEOs in the Summary Compensation Table.
| Name |
Grant Date |
Estimated Future Payouts Under Non-Equity Incentive Plan Awards |
Estimated Future Payouts Under Equity Incentive Plan Awards |
All
Other Stock Awards: Number of Shares of Stock or Units (#) |
All Other Option Awards: Number of Securities Underlying Options (#)(1) |
Grant Date Fair Value of Stock and Option Awards ($)(1) |
||||||||||||||||||||||||||||||||||
| Threshold ($) |
Target ($) |
Maximum ($) |
Threshold (#) |
Target (#) |
Maximum (#) |
|||||||||||||||||||||||||||||||||||
| D. Hunt Ramsbottom |
10/4/2010 | — | — | — | — | — | — | 60,000 | (2) | $ | 48,357 | |||||||||||||||||||||||||||||
| 10/4/2010 | — | — | — | — | — | — | 39,100 | (3) | $ | 25,541 | ||||||||||||||||||||||||||||||
| 10/4/2010 | — | — | — | — | — | — | 24,058 | (3) | $ | 15,715 | ||||||||||||||||||||||||||||||
| 10/4/2010 | — | — | — | — | — | — | 76,842 | (3) | $ | 50,195 | ||||||||||||||||||||||||||||||
| |
2011 Annual Non-Equity Incentive |
|
$ | 0 | $ | 86,950 | $ | 173,900 | ||||||||||||||||||||||||||||||||
| Dan J. Cohrs |
10/4/2010 | — | — | — | — | — | — | 35,294 | (2) | $ | 28,445 | |||||||||||||||||||||||||||||
| 10/4/2010 | — | — | — | — | — | — | 63,158 | (3) | $ | 41,256 | ||||||||||||||||||||||||||||||
| 10/4/2010 | — | — | — | — | — | — | 19,195 | (3) | $ | 12,539 | ||||||||||||||||||||||||||||||
| |
2011 Annual Non-Equity Incentive |
|
$ | 0 | $ | 44,865 | $ | 89,730 | ||||||||||||||||||||||||||||||||
| John A. Ambrose |
10/4/2010 | — | — | — | — | — | — | 26,471 | (2) | $ | 21,334 | |||||||||||||||||||||||||||||
| 10/4/2010 | — | — | — | — | — | — | 61,765 | (3) | $ | 40,346 | ||||||||||||||||||||||||||||||
| |
2011 Annual Non-Equity Incentive |
|
— | $ | 72,451 | — | ||||||||||||||||||||||||||||||||||
| Wilfred R. Bahl, Jr. |
10/4/2010 | — | — | — | — | — | — | 10,588 | (2) | $ | 8,533 | |||||||||||||||||||||||||||||
| 10/4/2010 | — | — | — | — | — | — | 24,706 | (3) | $ | 16,139 | ||||||||||||||||||||||||||||||
| |
2011 Annual Non-Equity Incentive |
|
— | $ | 53,943 | — | ||||||||||||||||||||||||||||||||||
| Marc E. Wallis |
10/4/2010 | — | — | — | — | — | — | 8,824 | (2) | $ | 7,112 | |||||||||||||||||||||||||||||
| 10/4/2010 | — | — | — | — | — | — | 20,588 | (3) | $ | 13,449 | ||||||||||||||||||||||||||||||
| |
2011 Annual Non-Equity Incentive |
|
$ | 0 | $ | 164,416 | $ | 246,624 | ||||||||||||||||||||||||||||||||
107
Table of Contents
| (1) | All Rentech equity grants to NEOs other than Mr. Ramsbottom were made under Rentech’s 2009 Amended and Restated Incentive Award Plan. Mr. Ramsbottom’s RSU award and his two option awards covering 24,058 and 76,842 shares, respectively (each as allocated to REMC), were granted under Rentech’s Amended and Restated 2006 Incentive Award Plan, as amended. Mr. Ramsbottom’s option covering 39,100 shares (as allocated to REMC) was granted under Rentech’s 2005 Stock Option Plan. Amounts reflect the full grant date fair value of Rentech stock options or RSUs, as applicable, granted during the fiscal year ending September 30, 2011, computed in accordance with ASC Topic 718, rather than the amounts paid to or realized by the named individual. Rentech provides information regarding the assumptions used to calculate the fair value of all compensatory equity awards made to executive officers in note 15 to its consolidated financial statements included in Rentech’s Form 10-K, filed December 14, 2011. There can be no assurance that awards will vest or will be exercised, as applicable (in which case no value will be realized by the individual), or that the value upon vesting/exercise will approximate the aggregate grant date fair value determined under ASC Topic 718. |
| (2) | These Rentech RSUs will vest in three substantially equal annual installments on October 4, 2011, 2012 and 2013, subject to the executive’s continued employment through the applicable vesting date and accelerated vesting in connection with (i) the executive’s termination of employment by the employer without cause or by the executive for good reason in connection with a change of control of Rentech or (ii) the executive’s death or disability. |
| (3) | These Rentech stock options will vest in three substantially equal annual installments on October 4, 2011, 2012 and 2013, subject to the executive’s continued employment through the applicable vesting date and accelerated vesting in connection with (i) the executive’s termination of employment by the employer without cause or by the executive for good reason in connection with a change of control of Rentech or (ii) the executive’s death or disability. |
Narrative Disclosure to Summary Compensation Table
and Grants of Plan-Based Awards Table
Employment Agreements with Shared NEOs
Messrs. Ramsbottom and Cohrs are parties to employment agreements with Rentech that expire on December 31 and October 22, 2011, respectively, subject in each case to automatic one-year renewals absent 90-days’ advance notice from either party to the contrary. Under these employment agreements, Messrs. Ramsbottom and Cohrs are entitled, respectively, to (i) base salaries which, as of September 30, 2011, were $440,000 and $377,500, and (ii) annual incentive bonuses targeted at 100% and 60% of applicable base salary (with actual bonus eligibility for each executive ranging from zero to twice the applicable target).
In addition, the employment agreements provide for monthly auto allowances, as well as customary indemnification, health, welfare, retirement and vacation benefits. The Shared NEOs also receive reimbursement of certain financial and tax planning costs (though only Mr. Ramsbottom’s employment agreement expressly provides for such benefits; Rentech reimburses these costs for each of the Shared NEOs). The agreements also contain customary confidentiality and other restrictive covenants. Each of the Shared NEOs has executed a corporate confidentiality and proprietary rights agreement. Though not addressed in the employment agreements, each of the NEOs is entitled to accelerated vesting of certain equity awards in the event of a change in control of Rentech. For a discussion of the severance and change-in-control benefits for which our Shared NEOs are eligible under their employment agreements, as well as a description of the severance benefits for which our Non-Shared NEOs are eligible in connection with a change in control, see “—Potential Payments upon Termination or Change-in-Control” below.
108
Table of Contents
Post-IPO Employment Agreements
In connection with our initial public offering, our general partner entered into new employment agreements with each of our Non-Shared NEOs (referred to herein as the “post-IPO employment agreements”), which became effective upon the closing of our initial public offering and superseded these executives’ existing change in control severance agreements with REMC. Each post-IPO employment agreement continues for an initial term of two years, subject to automatic one-year renewals thereafter. Under their post-IPO employment agreements, Messrs. Ambrose, Bahl and Wallis receive initial annual base salaries of $210,000, $199,000 and $189,000, respectively. In addition, these agreements provide that Messrs. Ambrose and Bahl will be eligible to receive annual cash bonuses targeted at 40% and 30% of base salary, respectively (and capped at 80% and 60% of base salary, respectively), while Mr. Wallis will be eligible to receive a non-targeted annual bonus of up to 150% of base salary, in each case, based on the attainment of performance criteria established by our general partner’s board of directors.
Under the post-IPO employment agreements, our Non-Shared NEOs are entitled to severance upon a termination of employment without “cause” or for “good reason” (each as defined in the applicable agreement) consisting of (i) one year of base salary continuation, (ii) payment of the executive’s target bonus for the year in which termination occurs (or, in the case of Mr. Wallis who does not have a target bonus, payment of an additional amount equal to 100% of his base salary), and (iii) up to twelve months of subsidized healthcare premiums. In addition, if our general partner elects not to renew the employment term, the affected executive is entitled to a reduced severance consisting solely of one year of base salary continuation.
Under the terms of their post-IPO employment agreements, our Non-Shared NEOs are eligible to participate in our customary retirement, health, welfare, disability and other benefit plans. In addition, the post-IPO employment agreements contain customary non-competition and non-solicitation covenants effective during employment and for one year following termination.
Outstanding Equity Awards at Fiscal Year End
The following table sets forth information with respect to the NEOs detailing outstanding equity awards from Rentech as of September 30, 2011. This table does not include any equity awards from the Partnership, as the Partnership had not granted any equity awards at that time. With respect to our Shared NEOs, the amounts set forth below reflect the total number of each NEO’s outstanding equity awards as of September 30, 2011 rather than an allocation based on the estimated percentage of time each Shared NEO dedicated to services for REMC during fiscal year 2011. In addition to the vesting schedules described for each outstanding award in the notes to this table, certain awards may be eligible for accelerated vesting in certain circumstances (for a discussion of accelerated equity vesting, see “—Potential Payments upon Termination or Change-in-Control” below).
| Option Awards | Stock Awards | |||||||||||||||||||||||||||||||||||
| Name |
Number of Securities Underlying Unexercised Options (#) Exercisable |
Number of Securities Underlying Unexercised Options (#) Unexercisable |
Equity Incentive Plan Awards: Number of Securities Underlying Unexercised Unearned Options (#) |
Option Exercise Price ($) |
Option Expiration Date |
Number of Shares or Units of Stock that have not Vested (#) |
Market Value of Shares or Units of Stock that have not Vested ($)(1) |
Equity Incentive Plan Awards: Number of Unearned Shares, Units or Other Rights that have not Vested (#) |
Equity Incentive Plan Awards: Market or Payout Value of Unearned Shares, Units or Other Rights that have not Vested ($)(1) |
|||||||||||||||||||||||||||
| D. Hunt Ramsbottom |
250,000 | (2) | $ | 4.15 | 7/13/2016 | |||||||||||||||||||||||||||||||
| 787,500 | $ | 1.82 | (3) | |||||||||||||||||||||||||||||||||
| 700,000 | (4) | $ | 0.95 | 10/4/2020 | ||||||||||||||||||||||||||||||||
| 1,982,500 | $ | 1.82 | (5) | |||||||||||||||||||||||||||||||||
| 1,000,000 | (6) | $ | 780,000 | |||||||||||||||||||||||||||||||||
| 150,000 | (7) | $ | 117,000 | |||||||||||||||||||||||||||||||||
| 133,226 | (8) | $ | 103,916 | |||||||||||||||||||||||||||||||||
109
Table of Contents
| Option Awards | Stock Awards | |||||||||||||||||||||||||||||||||
| Name |
Number of Securities Underlying Unexercised Options (#) Exercisable |
Number of Securities Underlying Unexercised Options (#) Unexercisable |
Equity Incentive Plan Awards: Number of Securities Underlying Unexercised Unearned Options (#) |
Option Exercise Price ($) |
Option Expiration Date |
Number of Shares or Units of Stock that have not Vested (#) |
Market Value of Shares or Units of Stock that have not Vested ($)(1) |
Equity Incentive Plan Awards: Number of Unearned Shares, Units or Other Rights that have not Vested (#) |
Equity Incentive Plan Awards: Market or Payout Value of Unearned Shares, Units or Other Rights that have not Vested ($)(1) |
|||||||||||||||||||||||||
| 29,751 | (9) | $ | 23,206 | |||||||||||||||||||||||||||||||
| 300,000 | (10) | $ | 234,000 | |||||||||||||||||||||||||||||||
| Dan J. Cohrs |
108,334 | (11) | $ | 84,501 | ||||||||||||||||||||||||||||||
| 700,000 | (6) | $ | 546,000 | |||||||||||||||||||||||||||||||
| 123,333 | (7) | $ | 96,200 | |||||||||||||||||||||||||||||||
| 16,402 | (9) | $ | 12,794 | |||||||||||||||||||||||||||||||
| 411,765 | (4) | $ | 0.95 | 10/4/2020 | ||||||||||||||||||||||||||||||
| 176,471 | (10) | $ | 137,647 | |||||||||||||||||||||||||||||||
| John A. Ambrose |
33,333 | (7) | $ | 26,000 | ||||||||||||||||||||||||||||||
| 26,471 | (10) | $ | 20,647 | |||||||||||||||||||||||||||||||
| 61,765 | (4) | $ | 0.95 | 10/4/2020 | ||||||||||||||||||||||||||||||
| Wilfred R. Bahl, Jr. |
20,000 | (7) | $ | 15,600 | ||||||||||||||||||||||||||||||
| 30,000 | (2) | $ | 4.15 | 7/13/2016 | ||||||||||||||||||||||||||||||
| 10,588 | (10) | $ | 8,259 | |||||||||||||||||||||||||||||||
| 24,706 | (4) | $ | 0.95 | 10/4/2020 | ||||||||||||||||||||||||||||||
| Marc E. Wallis |
16,667 | (7) | $ | 13,000 | ||||||||||||||||||||||||||||||
| 8,824 | (10) | $ | 6,883 | |||||||||||||||||||||||||||||||
| 20,588 | (4) | $ | 0.95 | 10/4/2020 | ||||||||||||||||||||||||||||||
| (1) | Calculated based on the $0.78 closing price of Rentech’s common stock on September 30, 2011. |
| (2) | Represents a stock option award granted on July 14, 2006 that vested in three equal annual installments on each of July 14, 2007, 2008 and 2009. |
| (3) | Represents a warrant granted in 2005 and held by East Cliff Advisors, LLC (an entity affiliated with Mr. Ramsbottom) that vests and expires as follows: (i) half of the warrant will vest upon the sooner of Rentech’s stock price reaching $5.25 or higher for twelve consecutive trading days or December 31, 2011, subject to Mr. Ramsbottom’s continued employment through the applicable vesting date, and will expire on December 31, 2012; and (ii) the other half of the warrant will vest upon Rentech’s stock price reaching $5.25 or higher for twelve consecutive trading days and will expire on the earlier of the ninetieth day after Mr. Ramsbottom terminates employment or December 31, 2011. |
110
Table of Contents
| (4) | Represents stock options granted on October 4, 2010 that vest in three substantially equal annual installments on October 4, 2011, 2012 and 2013, subject to the executive’s continued employment through the applicable vesting date (these stock options are referred to below as the 2010 Options). |
| (5) | Represents a vested warrant held by East Cliff Advisors, LLC (an entity affiliated with Mr. Ramsbottom). The expiration date for this warrant is the earlier of the ninetieth day after Mr. Ramsbottom ceases to be employed by Rentech or December 31, 2011. This warrant was originally exercisable for 2,082,500 shares. Mr. Ramsbottom transferred a portion of the warrant exercisable for 100,000 shares to Sally Ramsbottom, his mother. |
| (6) | Represents RSUs granted on November 17, 2009 that are eligible to vest upon the attainment of milestones related to the development, construction and operation of Rentech’s Rialto Project or another comparable project designated by Rentech’s Compensation Committee. Subject to the executive’s continued employment through the applicable vesting date, sixty percent (60%) of the shares underlying each RSU award will vest upon the closing of financing for the project, twenty percent (20%) of the shares underlying each RSU award will vest upon completion of construction and initial operation of the project facility and twenty percent (20%) of the shares underlying each RSU award will vest upon sustained operation of the project facility (these RSUs are referred to below as the 2009 Performance-Vest RSUs). |
| (7) | Represents RSUs granted on November 17, 2009 that vest in three equal annual installments on November 17, 2010, 2011 and 2012, subject to the executive’s continued employment through the applicable vesting date (these RSUs are referred to below as the 2009 Time-Vest RSUs). |
| (8) | Represents RSUs granted on November 3, 2009, of which approximately 56% vested upon grant and the remaining portion will vest November 3, 2012, subject to the executive’s continued employment through the applicable vesting date (these RSUs are referred to below as Management Stock Purchase Plan RSUs). |
| (9) | Represents RSUs granted on December 10, 2009, of which 50% vested upon grant and the remaining portion will vest December 10, 2012, subject to the executive’s continued employment through the applicable vesting date (these RSUs are also referred to below as Management Stock Purchase Plan RSUs). |
| (10) | Represents RSUs granted on October 4, 2010 that will vest in three substantially equal annual installments on October 4, 2011, 2012 and 2013, subject to the executive’s continued employment through the applicable vesting date (these RSUs are referred to below as the 2010 RSUs). |
| (11) | Represents RSUs granted on December 30, 2008 that vest in three equal annual installments on October 22, 2009, 2010 and 2011, subject to the executive’s continued employment through the applicable vesting date (these RSUs are referred to below as the Cohrs Inducement RSUs). |
111
Table of Contents
Option Exercises and Stock Vested
The following table sets forth information with respect to the NEOs concerning the option exercises and stock vested under Rentech’s equity plan(s) during the fiscal year ending September 30, 2011. With respect to our Shared NEOs, the amounts set forth below reflect the total number of each NEO’s outstanding equity awards as of September 30, 2011 rather than an allocation based on the estimated percentage of time each Shared NEO dedicated to services for REMC during fiscal year 2011.
| Option Awards | Stock Awards | |||||||||||||||
| Name |
Number of Shares Acquired on Exercise (#) |
Value Realized on Exercise ($) |
Number of Shares Acquired on Vesting (#) |
Value Realized on Vesting ($)(1) |
||||||||||||
| D. Hunt Ramsbottom |
— | — | 357,687 | $ | 447,109 | |||||||||||
| Dan J. Cohrs |
— | — | 225,250 | $ | 271,813 | |||||||||||
| John A. Ambrose |
— | — | 22,667 | $ | 28,334 | |||||||||||
| Wilfred R. Bahl, Jr. |
— | — | 20,000 | $ | 25,000 | |||||||||||
| Marc E. Wallis |
— | — | 14,333 | $ | 17,916 | |||||||||||
| (1) | Amounts shown are based on the fair market value of Rentech’s common stock on the applicable vesting date. |
Potential Payments upon Termination or Change-in-Control
Our NEOs are entitled to certain payments and benefits upon qualifying terminations of employment, and in certain cases, upon a change in control. The following discussion describes the terms and conditions of these payments and benefits and the circumstances in which they will be paid or provided. All severance payments are conditioned upon the executive’s execution of a general release of claims against the employer.
Shared NEOs, Termination Not in Connection with a Change in Control
Under the Shared NEOs’ employment agreements (described in “—Severance Benefits” above), upon termination of the executive’s employment by Rentech without cause, by the executive with good reason or, in the case of Mr. Ramsbottom only, due to a non-renewal of his employment term by Rentech (each as defined in the employment agreements), the executive is entitled to receive: (i) an amount equal to three times (in the case of Mr. Ramsbottom) or one times (in the case of Mr. Cohrs) base salary, payable in substantially equal installments over a two-year period (for Mr. Ramsbottom) or a one-year period (for Mr. Cohrs), plus (ii) in the case of Mr. Cohrs, payment of his target annual bonus on the date that annual bonuses are paid generally for the year in which termination occurs, and (iii) company-paid continuation health benefits for up to eighteen months following the date of termination. Upon termination of Mr. Cohrs’ employment in connection with Rentech’s non-renewal of his employment term, he will be entitled to receive an amount equal to one times base salary, payable over the one-year period following termination, and will be eligible to receive an annual bonus for the year of termination.
112
Table of Contents
In addition, the Shared NEOs will be entitled to the following enhanced vesting provisions with respect to qualifying terminations occurring outside of the context of a change in control of Rentech:
| • | The 2010 Options, 2010 RSUs, the 2009 Time-Vest RSUs and the Management Stock Purchase Plan RSUs held by the executive will accelerate and vest in full upon a termination of employment due to the applicable executive’s death or disability. |
| • | The 2009 Performance-Vest RSUs held by the executive will, following the executive’s termination due to his death or disability, remain outstanding and eligible to vest for a period of six months following such termination and will vest if and to the extent that applicable vesting milestones are attained during such period. |
| • | The Cohrs Inducement RSU will vest upon Mr. Cohrs’ termination (i) without cause or for good reason, as to the number of shares for which the RSU would have vested over the twelve-month period immediately following such termination had Mr. Cohrs remained employed, and (ii) due to Mr. Cohrs’ death or disability, on an accelerated basis with respect to all shares subject to the RSU. |
Shared NEOs, Change in Control (No Termination)
The Shared NEOs are not entitled to any cash payments based solely on the occurrence of a change in control of Rentech (absent any qualifying termination), however, the following enhanced vesting provisions will apply: (i) the Shared NEOs will be entitled to full accelerated vesting upon such change in control with respect to their Management Stock Purchase Plan RSUs, and (ii) the Cohrs Inducement RSU will vest in full. The 2010 Options, 2010 RSUs, 2009 Time-Vest RSUs and 2009 Performance-Vest RSUs are not impacted by a change in control of Rentech (absent a qualifying termination in connection with such change in control).
Shared NEOs, Termination in Connection with a Change in Control
If either of the Shared NEOs terminates employment without cause, for good reason or due a non-renewal of his employment term by Rentech, in any case, within three months before or two years after a change in control of Rentech, then the executive will receive the severance described above, except that (i) the base salary component of the executive’s severance will be paid in a lump sum and (ii) if the executive’s actual annual bonus for the year immediately preceding the change in control exceeds his target bonus for the year in which the termination occurs, (A) in the case of Mr. Ramsbottom, he will receive two times base salary plus the amount of such prior-year bonus (instead of three times his base salary) and (B) in the case of Mr. Cohrs, he will receive one times base salary plus the amount of such prior-year bonus (instead of base salary plus target annual bonus). The Shared NEOs’ employment agreements entitle each of these executives to a “gross-up” payment from Rentech covering all taxes, penalties and interest associated with any “golden parachute” excise taxes that are imposed on the executives by reason of Internal Revenue Code Section 280G in connection with a change in control of Rentech.
In addition, the Shared NEOs will be entitled to the following enhanced vesting provisions with respect to qualifying terminations occurring in connection with a change in control of Rentech:
| • | The 2010 Options, the 2010 RSUs and the 2009 Time-Vest RSUs will vest in full if the executive terminates employment without cause or for good reason, in either case, within sixty days prior to or one year after the change in control. |
| • | As noted above, the Management Stock Purchase Plan RSUs held by the executive will vest in full upon the change in control (without regard to whether the executive terminates employment). |
| • | The 2009 Performance-Vest RSUs held by the executive will remain outstanding and eligible to vest for a period of six months following the executive’s termination without cause or for good reason, in either case, occurring within sixty days prior to or one year after the change in control, and these RSUs will vest if and to the extent that applicable vesting milestones are attained during such period. |
| • | The Cohrs Inducement RSU will vest in full if a change in control occurs within two months after Mr. Cohrs’ termination of employment without cause or for good reason (in addition to vesting in full if the change in control occurs while Mr. Cohrs remains employed). |
113
Table of Contents
Non-Shared NEOs, Termination in Connection with a Change in Control
During the fiscal year ending September 30, 2011, each of Messrs. Ambrose, Bahl and Wallis was party to a change in control severance benefits agreement with REMC, dated as of August 1, 2010, May 10, 2011, and August 12, 2008, respectively. Under these agreements, upon termination of employment by the employer without cause or by the executive for good reason (each as defined in the applicable agreement), in either case, within one month before or one year after a change in control of REMC, the executive was entitled to receive: (i) an amount equal to one times his annual base salary plus a bonus of 40% annual base salary or, with respect to Mr. Wallis, 20% of annual base salary, and (ii) company-paid continuation health benefits for up to 12 months. Cash severance payments will be paid in substantially equal installments over a twelve-month period following the date of termination (or, if later, the consummation of the change in control). During employment and for one year following termination, the change in control severance benefits agreements prohibited these NEOs from soliciting certain of our employees and customers. Upon the closing of our initial public offering, these agreements were superseded and replaced by the post-IPO employment agreements (see “Narrative Disclosure to Summary Compensation Table and Grants of Plan-Based Awards Table”).
In addition, the 2010 Options, the 2010 RSUs and the 2009 Time-Vest RSUs held by each Non-Shared NEO will vest in full if the executive terminates employment without cause or for good reason, in either case, within sixty days prior to or one year after the change in control. Each Non-Shared NEO is also entitled to full accelerated vesting of these equity awards if the executive terminates employment due to death or disability.
The following table summarizes the change-in-control and/or severance payments and benefits to which we expect that our NEOs would have become entitled if the relevant event(s) had occurred on September 30, 2011, in accordance with applicable disclosure rules. With respect to our Shared NEOs, the amounts set forth below reflect the portion of these NEOs’ change-in-control and severance payments that we estimate will be attributable to services performed by these NEOs for REMC during fiscal year 2011, calculated in the same manner as amounts disclosed for these Shared NEOs in the Summary Compensation Table.
| Name |
Benefit | Termination without Cause or for Good Reason ($) |
Termination due to Non- Renewal ($) |
Termination due to Death/ Disability ($) |
Qualifying Termination in Connection with a Change in Control |
Change in Control (No Termination) |
||||||||||||||||||
| D. Hunt |
||||||||||||||||||||||||
| Ramsbottom |
Cash Severance | $ | 264,000 | (1) | $ | 264,000 | (1) | — | $ | 264,000 | (2) | — | ||||||||||||
|
|
Value of Accelerated Stock Awards |
(3) |
— | — | $ | 19,125 | (4) | $ | 50,325 | (5) | $ | 5,085 | (6) | |||||||||||
|
|
Value of Accelerated Option Awards |
(7) |
— | — | $ | 0 | (8) | $ | 0 | (9) | — | |||||||||||||
| |
Value of Healthcare Premiums |
|
$ | 5,379 | (10) | $ | 5,379 | (10) | — | $ | 5,379 | (10) | — | |||||||||||
| |
Value of Excise Tax Gross-Up |
|
— | — | — | $ | — | (11) | $ | — | (11) | |||||||||||||
| Total | $ | 269,379 | $ | 269,379 | $ | 19,125 | $ | 319,704 | $ | 5,085 | ||||||||||||||
| Dan J. Cohrs |
Cash Severance | $ | 120,800 | (12) | $ | 75,500 | (13) | — | $ | 120,800 | (14) | — | ||||||||||||
|
|
Value of Accelerated Stock Awards |
(3) |
$ | 3,380 | (15) | — | $ | 13,246 | (16) | $ | 35,086 | (17) | $ | 3,892 | (18) | |||||||||
|
|
Value of Accelerated Option Awards |
(7) |
— | — | $ | 0 | (19) | $ | 0 | (20) | — | |||||||||||||
| |
Value of Healthcare Premiums |
|
$ | 5,379 | (10) | — | — | $ | 5,379 | (10) | — | |||||||||||||
| |
Value of Excise Tax Gross-Up |
|
— | — | — | $ | — | (11) | $ | — | (11) | |||||||||||||
| Total | $ | 129,559 | $ | 75,500 | $ | 13,246 | $ | 161,265 | $ | 3,892 | ||||||||||||||
114
Table of Contents
| Name |
Benefit | Termination without Cause or for Good Reason ($) |
Termination due to Non- Renewal ($) |
Termination due to Death/ Disability ($) |
Qualifying Termination in Connection with a Change in Control |
Change in Control (No Termination) |
||||||||||||||||||
| John A. Ambrose |
|
Cash Severance |
|
— | — | — | $ | 256,038 | (12) | — | ||||||||||||||
| |
Value of Accelerated Stock |
|
— | — | $ | 46,647 | (21) | $ | 46,647 | (21) | — | |||||||||||||
| |
Value of Accelerated Option |
|
— | — | $ | 0 | (22) | $ | 0 | (22) | — | |||||||||||||
| |
Value of Healthcare Premiums |
|
— | — | — | $ | 17,930 | (10) | — | |||||||||||||||
| Total | — | — | $ | 46,647 | $ | 320,615 | — | |||||||||||||||||
| Wilfred R. Bahl, Jr. |
|
Cash Severance |
|
— | — | — | $ | 253,278 | (12) | — | ||||||||||||||
| |
Value of Accelerated Stock Awards |
(3) |
— | — | $ | 23,859 | (23) | $ | 23,859 | (23) | — | |||||||||||||
| |
Value of Accelerated Option Awards |
(7) |
— | — | $ | 0 | (24) | $ | 0 | (24) | — | |||||||||||||
| |
Value of Healthcare Premiums |
|
— | — | — | $ | 17,930 | (10) | — | |||||||||||||||
| Total | — | — | $ | 23,859 | $ | 295,067 | — | |||||||||||||||||
| Marc E. Wallis |
|
Cash Severance |
|
— | — | — | $ | 216,000 | (12) | — | ||||||||||||||
| |
Value of Accelerated Stock Awards |
(3) |
— | — | $ | 19,883 | (25) | $ | 19,883 | (25) | — | |||||||||||||
| |
Value of Accelerated Option Awards |
(7) |
— | — | $ | 0 | (26) | $ | 0 | (26) | — | |||||||||||||
| |
Value of Healthcare Premiums |
|
— | — | — | $ | 17,930 | (10) | — | |||||||||||||||
| Total | — | — | $ | 19,883 | $ | 253,813 | — | |||||||||||||||||
| (1) | Represents three times Mr. Ramsbottom’s annual base salary, payable over the two-year period after his termination date. |
| (2) | Represents three times Mr. Ramsbottom’s annual base salary, payable in a lump sum upon termination. |
| (3) | Value of RSUs determined by multiplying the number of accelerating RSUs by the fair market value of Rentech’s common stock ($0.78) on September 30, 2011. |
| (4) | Represents the aggregate value of 60,000 unvested 2010 RSUs, 30,000 unvested 2009 Time-Vest RSUs and unvested 32,595 Management Stock Purchase Plan RSUs held by Mr. Ramsbottom that would have vested on an accelerated basis upon Mr. Ramsbottom’s termination due to death or disability on September 30, 2011. |
115
Table of Contents
| (5) | Represents the aggregate value of (i) 60,000 unvested 2010 RSUs, 30,000 unvested 2009 Time-Vest RSUs and 200,000 unvested 2009 Performance-Vest RSUs that would have vested on an accelerated basis if Mr. Ramsbottom terminated employment without cause or for good reason on September 30, 2011 and, in either case, such termination occurred within sixty days prior to or one year after a change in control of Rentech, and (ii) 32,595 unvested Management Stock Purchase Plan RSUs. We have assumed for purposes of this calculation that (A) all performance criteria applicable to the 2009 Performance-Vest RSUs were attained on September 30, 2011 (and, accordingly, the unvested 2009 Performance-Vest RSUs held by Mr. Ramsbottom vested in full on such date) and (B) the relevant change in control occurred on September 30, 2011 (and, accordingly, the unvested Management Stock Purchase Plan RSUs held by Mr. Ramsbottom vested in full on such date). |
| (6) | Represents the aggregate value of 32,595 unvested Management Stock Purchase Plan RSUs held by Mr. Ramsbottom that would have vested on an accelerated basis upon a change in control of Rentech. |
| (7) | Value of options determined by multiplying the fair market value of Rentech’s common stock ($0.78) on September 30, 2011, less the applicable exercise price, by the number of accelerating options. |
| (8) | Represents the aggregate value of 140,000 unvested 2010 Options held by Mr. Ramsbottom that would have vested on an accelerated basis upon Mr. Ramsbottom’s termination due to death or disability on September 30, 2011. |
| (9) | Represents the aggregate value of 140,000 unvested 2010 Options held by Mr. Ramsbottom that would have vested on an accelerated basis if Mr. Ramsbottom terminated employment without cause or for good reason on September 30, 2011 and, in either case, such termination occurred within sixty days prior to or one year after the change in control. |
| (10) | Represents the cost of Company-paid continuation health benefits for eighteen months (in the case of the Shared NEOs) or twelve months (in the case of the Non-Shared NEOs), based on our estimated costs to provide such coverage. For purposes of continuation health benefits, a “qualifying termination in connection with a change in control” means: (i) for Mr. Ramsbottom, a termination without cause, for good reason or due to Rentech’s non-renewal of his employment agreement within three months before or two years after a change in control of Rentech, and (ii) for the remaining NEOs, a termination without cause or for good reason (A) for Mr. Cohrs, within three months before or two years after a change in control of Rentech, and (B) for the Non-Shared NEOs, within one month before or one year after a change in control of REMC. |
| (11) | Represents tax gross-up payments to compensate for excise taxes imposed by Section 4999 of the Internal Revenue Code on the payments and benefits provided (as well as any related taxes on such payment). The assumptions used to calculate the excise tax gross-up include the following: an excise tax rate of 20%, a federal tax rate of 25%, California state tax rate of 8.0929% (in the case of Mr. Ramsbottom) or 7.3846% (in the case of Mr. Cohrs) and a Medicare tax rate of 1.45%. |
| (12) | Represents the executive’s annual base salary, payable over the one-year period after his termination date, plus (i) with respect to Mr. Cohrs, his target annual incentive bonus and (ii) with respect to Messrs. Ambrose, Bahl and Wallis, a bonus equal to 40%, 40% and 20% of their respective annual base salaries. |
| (13) | Represents Mr. Cohrs’ annual base salary, payable over the one-year period after his termination date. |
| (14) | Represents Mr. Cohrs’ annual base salary plus target bonus, payable in a lump sum upon termination. |
| (15) | Represents the aggregate value of 21,667 unvested Cohrs Inducement RSUs that would have vested on an accelerated basis if Mr. Cohrs terminated employment without cause or for good reason on September 30, 2011 (based on the number of Cohrs Inducement RSUs that would have vested over the one-year period following Mr. Cohrs termination, had he remained employed). |
| (16) | Represents the aggregate value of 21,667 unvested Cohrs Inducement RSUs, 35,294 unvested 2010 RSUs, 24,667 unvested 2009 Time-Vest RSUs, unvested 3,280 Management Stock Purchase Plan RSUs held by Mr. Cohrs that would have vested on an accelerated basis upon Mr. Cohrs’ termination due to death or disability on September 30, 2011. |
| (17) | Represents the aggregate value of (i) 35,294 unvested 2010 RSUs, 24,667 unvested 2009 Time-Vest RSUs and 140,000 unvested 2009 Performance-Vest RSUs that would have vested on an accelerated basis if Mr. Cohrs terminated employment without cause or for good reason on September 30, 2011 and, in either case, such termination occurred within sixty days prior to or one year after a change in control of Rentech, (ii) 21,667 unvested Cohrs Inducement RSUs, and (iii) 3,280 unvested Management Stock Purchase Plan RSUs. We have assumed for purposes of this calculation that (A) all performance criteria applicable to the 2009 Performance-Vest RSUs were attained on September 30, 2011 (and, accordingly, the unvested 2009 Performance-Vest RSUs held by Mr. Cohrs vested in full on such date) and (B) the relevant change in control occurred on September 30, 2011 (and, accordingly, the unvested Cohrs Inducement RSUs and the unvested Management Stock Purchase Plan RSUs held by Mr. Cohrs, in each case, vested in full on such date). |
116
Table of Contents
| (18) | Represents the aggregate value of 3,280 unvested Management Stock Purchase Plan RSUs held by Mr. Cohrs and 21,667 unvested Cohrs Inducement RSUs, in each case, that would have vested on an accelerated basis upon a change in control of Rentech. |
| (19) | Represents the aggregate value of 82,353 unvested 2010 Options held by Mr. Cohrs that would have vested on an accelerated basis upon Mr. Cohrs’ termination due to death or disability on September 30, 2011. |
| (20) | Represents the aggregate value of 82,353 unvested 2010 Options held by Mr. Cohrs that would have vested on an accelerated basis if Mr. Cohrs terminated employment without cause or for good reason on September 30, 2011 and, in either case, such termination occurred within sixty days prior to or one year after the change in control. |
| (21) | Represents the aggregate value of 26,471 unvested 2010 RSUs and 33,333 unvested 2009 Time-Vest RSUs held by Mr. Ambrose that would have vested on an accelerated basis upon either (i) Mr. Ambrose’s termination due to death or disability on September 30, 2011, or (ii) Mr. Ambrose’s termination without cause or for good reason within one month before or one year after a change in control of REMC. |
| (22) | Represents the aggregate value of 61,765 unvested 2010 Options held by Mr. Ambrose that would have vested on an accelerated basis upon either (i) Mr. Ambrose’s termination due to death or disability on September 30, 2011, or (ii) Mr. Ambrose’s termination without cause or for good reason within one month before or one year after a change in control of REMC, in each case. |
| (23) | Represents the aggregate value of 10,588 unvested 2010 RSUs and 20,000 unvested 2009 Time-Vest RSUs held by Mr. Bahl that would have vested on an accelerated basis upon either (i) Mr. Bahl’s termination due to death or disability on September 30, 2011, or (ii) Mr. Bahl’s termination without cause or for good reason within one month before or one year after a change in control of REMC. |
| (24) | Represents the aggregate value of 24,706 unvested 2010 Options held by Mr. Bahl that would have vested on an accelerated basis upon either (i) Mr. Bahl’s termination due to death or disability on September 30, 2011, or (ii) Mr. Bahl’s termination without cause or for good reason within one month before or one year after a change in control of REMC. |
| (25) | Represents the aggregate value of 8,824 unvested 2010 RSUs and 16,667 unvested 2009 Time-Vest RSUs held by Mr. Wallis that would have vested on an accelerated basis upon either (i) Mr. Wallis’ termination due to death or disability on September 30, 2011, or (ii) Mr. Wallis’ termination without cause or for good reason within one month before or one year after a change in control of REMC. |
| (26) | Represents the aggregate value of 20,588 unvested 2010 Options held by Mr. Wallis that would have vested on an accelerated basis upon either (i) Mr. Wallis’ termination due to death or disability on September 30, 2011, or (ii) Mr. Wallis’ termination without cause or for good reason within one month before or one year after a change in control of REMC, in each case. |
Director Compensation
We and our general partner were formed in July 2011 and have not yet developed or implemented a compensation program for our non-employee directors. Prior to our formation, directors of REMC were not separately compensated for their service on REMC’s board of directors. We are currently considering a compensation program for our non-employee directors for future implementation that may consist of some or all of annual retainer fees, committee chair retainer fees and/or long-term equity awards; however, there can be no assurance at this time that such a program will be implemented or that it will consist of the components noted here. Directors who are also employees of our general partner and/or Rentech will not receive fees for service on our board of directors. We have not made any payments to our non-employee directors or director nominees to date.
| ITEM 12. | SECURITY OWNERSHIP OF CERTAIN BENEFICIAL OWNERS AND MANAGEMENT AND RELATED UNITHOLDER MATTERS |
The following table presents information regarding beneficial ownership of our common units as of November 30, 2011 by:
| • | our general partner; |
| • | each of our general partner’s directors; |
117
Table of Contents
| • | each of our general partner’s named executive officers; |
| • | each unitholder known by us to beneficially hold five percent or more of our outstanding common units; and |
| • | all of our general partner’s executive officers and directors as a group. |
Beneficial ownership is determined under the rules of the SEC and generally includes voting or investment power with respect to securities. Unless indicated below, to our knowledge, the persons and entities named in the table have sole voting and sole investment power with respect to all common units beneficially owned, subject to community property laws where applicable. Except as otherwise indicated, the business address for each of our beneficial owners is c/o Rentech Nitrogen Partners, L.P., 10877 Wilshire Boulevard, Suite 600, Los Angeles, California 90024.
| Name and Address of Beneficial Owner |
Amount and Nature of Common Units Beneficially Owned |
Percentage of Total Common Units(1) |
||||||
| Rentech Nitrogen GP, LLC(2) |
— | — | ||||||
|
RNHI(3) |
23,250,000 | 60.8 | % | |||||
| D. Hunt Ramsbottom |
— | — | ||||||
| Dan J. Cohrs |
— | — | ||||||
| John H. Diesch |
— | — | ||||||
| John A. Ambrose |
— | — | ||||||
| Wilfred R. Bahl, Jr. |
— | — | ||||||
| Marc E. Wallis |
— | — | ||||||
| Colin M. Morris |
— | — | ||||||
| Halbert S. Washburn |
— | — | ||||||
| Michael F. Ray |
— | — | ||||||
| Michael S. Burke |
— | — | ||||||
| Keith B. Forman |
— | — | ||||||
| All directors and executive officers as a group (11 persons) |
— | — | ||||||
| * | Less than 1%. |
| (1) | Based on 38,250,000 common units outstanding as of November 30, 2011. |
| (2) | Our general partner, a wholly owned subsidiary of RNHI, manages and operates our business and has a non-economic general partner interest. |
| (3) | RNHI is an indirect wholly owned subsidiary of Rentech. |
The following table sets forth, as of November 30, 2011, the number of shares of common stock of Rentech owned by each of the named executive officers and directors of our general partner and all executive officers and directors of our general partner as a group.
Beneficial ownership is determined under the rules of the SEC and generally includes voting or investment power with respect to securities. Unless indicated below, to our knowledge, the persons and entities named in the table have sole voting and sole investment power with respect to all shares of common stock beneficially owned, subject to community property laws where applicable. Except as otherwise indicated, the business address for each of the following persons is c/o Rentech Nitrogen Partners, L.P., 10877 Wilshire Boulevard, Suite 600, Los Angeles, California 90024.
| Name and Address of Beneficial Owner |
Amount and Nature of Common Stock Beneficially Owned(1) |
Percentage of Total Common Stock(1)(2) |
||||||
| D. Hunt Ramsbottom(3 )(4) |
3,352,710 | 1.5 | % | |||||
| Dan J. Cohrs |
509,180 | * | ||||||
| John H. Diesch |
268,964 | * | ||||||
| John A. Ambrose |
73,738 | * | ||||||
| Wilfred R. Bahl, Jr. |
143,395 | * | ||||||
| Marc E. Wallis |
52,393 | * | ||||||
118
Table of Contents
| Name and Address of Beneficial Owner |
Amount and Nature of Common Stock Beneficially Owned(1) |
Percentage of Total Common Stock(1)(2) |
||||||
| Colin M. Morris |
409,258 | * | ||||||
| Halbert S. Washburn |
304,600 | * | ||||||
| Michael F. Ray(5) |
444,337 | * | ||||||
| Michael S. Burke |
297,600 | * | ||||||
| Keith B. Forman |
— | * | ||||||
| All directors and executive officers as a group (11 persons) |
5,856,175 | 2.6 | % | |||||
| * | Less than 1% |
| (1) | If a person has the right to acquire shares of common stock subject to options or other convertible or exercisable securities within 60 days of November 30, 2011, then such shares (including certain restricted stock units which are fully vested but will not be yet paid out until the earlier of the recipient’s termination and three years from the applicable award date, subject to any required payment delays arising under applicable tax laws) are deemed outstanding for purposes of computing the percentage ownership of that person, but are not deemed outstanding for purposes of computing the percentage ownership of any other person. The following shares of common stock subject to stock options and warrants may be acquired within 60 days of November 30, 2011 and are included in the table above: |
| • | D. Hunt Ramsbottom—1,982,500 under warrants and 483,333 under options; |
| • | Dan J. Cohrs—137,255 under options; |
| • | John H. Diesch—94,902 under options; |
| • | John A. Ambrose—20,588 under options; |
| • | Wilfred R. Bahl, Jr.—38,235 under options; |
| • | Marc E. Wallis—6,863 under options; |
| • | Colin M. Morris—129,902 under options; |
| • | Halbert S. Washburn—86,500 under options; |
| • | Michael F. Ray—86,500 under options; |
| • | Michael S. Burke—91,500 under options; and |
| • | all directors and executive officers as a group—1,982,500 under warrants and 1,175,578 under options. |
| (2) | Based on 225,215,961 shares of common stock outstanding as of November 30, 2011. |
| (3) | Includes a warrant held by East Cliff Advisors, LLC for 1,982,500 shares and excludes a warrant held by East Cliff Advisors, LLC for 787,500 shares. With respect to the warrant for 787,500 shares, the warrant will vest with respect to half of the shares upon the earlier of Rentech’s stock price reaching $5.25 per share or higher for 12 consecutive trading days or December 31, 2011 as long as Mr. Ramsbottom is still an employee of Rentech. The warrant will vest with respect to the other 393,750 shares upon Rentech’s stock price reaching $5.25 per share or higher for 12 consecutive trading days. The exercise price of the warrant is $1.82 per share. Mr. Ramsbottom is the managing member and has sole investment and voting power in East Cliff Advisors, LLC. |
| (4) | Includes 38,000 shares held for the benefit of Mr. Ramsbottom’s children as to which Mr. Ramsbottom disclaims beneficial ownership. |
| (5) | Includes 7,500 shares held by Mr. Ray’s spouse’s IRA as to which Mr. Ray disclaims beneficial ownership. |
| ITEM 13. CERTAIN | RELATIONSHIPS AND RELATED TRANSACTIONS, AND DIRECTOR INDEPENDENCE |
For a discussion of director independence, see Part III—Item 10 “Directors, Executive Officers and Corporate Governance.”
119
Table of Contents
RNHI, an indirect wholly-owned subsidiary of Rentech, owns (i) 23,250,000 common units, representing approximately 60.8% of our outstanding common units and (ii) all of the member interests in our general partner and our general partner own a general partner interest in us.
Distributions and Payments to Rentech and its Affiliates
The following table summarizes the distributions and payments to be made by us to Rentech and its affiliates (including our general partner) in connection with the ongoing operation and any liquidation of the Partnership. These distributions and payments were or will be determined by and among affiliated entities and, consequently, are not the result of arm’s-length negotiations.
Operational Stage
| Distributions to RNHI and its affiliates |
• We will generally make cash distributions to our unitholders pro rata, including to RNHI, as a holder of common units. RNHI owns 23,250,000 common units, representing approximately 60.8% of our outstanding common units, and would receive a pro rata percentage of the cash available for distribution that we distribute in respect thereof. | |
| Payments to our general partner and its affiliates |
• We will reimburse our general partner and its affiliates for all expenses incurred on our behalf. In addition we will reimburse Rentech for certain operating expenses and for the provision of various general and administrative services for our benefit under the services agreement. | |
| Liquidation Stage |
||
| Liquidation |
• Upon our liquidation, our unitholders will be entitled to receive liquidating distributions according to their respective capital account balances. | |
Transactions between REMC and Rentech
Management Services Agreement
REMC and Rentech entered into a management services agreement on April 26, 2006, as amended on July 29, 2011, pursuant to which Rentech agreed to provide management, consulting and financial planning services to REMC in connection with the operation and growth of REMC in the ordinary course of its business. As compensation for these services, REMC paid Rentech the actual corporate overhead costs incurred by Rentech on behalf of REMC, including, without limitation, compensation expenses for Rentech personnel providing services to REMC, stock-based and incentive bonus compensation expenses of REMC personnel, legal, audit, accounting and tax services expenses, income tax expenses and software expenses. Under the agreement, REMC agreed to indemnify Rentech and its affiliates against losses and liabilities incurred in connection with the performance of services under the agreement, unless such losses or liabilities arise from Rentech’s bad faith or gross negligence. Such charges were accrued during each quarter and due and payable by REMC from time to time upon Rentech’s demand and upon termination of the management services agreement. For the fiscal years ended September 30, 2011, 2010 and 2009, the total corporate overhead costs incurred by Rentech and allocated to REMC were approximately $2.0 million, $1.4 million and $1.6 million, respectively.
The management services agreement terminated in accordance with its terms at the closing of our initial public offering, and upon its termination, REMC paid Rentech any corporate overhead costs owed by REMC under the agreement. The amount of these corporate overhead costs was approximately $19.4 million, which primarily represent estimated income taxes attributable to REMC.
Intercompany Loans and Related Dividends
Between October 2007 and July 2010, REMC made the following intercompany loans to Rentech to supplement its working capital needs:
| • | In May 2008, REMC incurred a term loan in the principal amount of $26.5 million and made an intercompany loan to Rentech in the principal amount of approximately $32.4 million, which included approximately $24.8 million of net loan proceeds and $7.6 million of cash on hand. |
120
Table of Contents
| • | In June 2008, REMC upsized the May 2008 term loan to the principal amount of $53.0 million and used a portion of the net loan proceeds to make an intercompany loan to Rentech in the principal amount of approximately $15.1 million. |
| • | In January 2010, REMC refinanced its outstanding term loan with a new term loan in the principal amount of $62.5 million and used a portion of the net proceeds to make an intercompany loan to Rentech in the principal amount of approximately $17.6 million. |
| • | In July 2010, REMC incurred an incremental term loan in the principal amount of $20.0 million and used a portion of the net loan proceeds to make an intercompany loan to Rentech in the principal amount of approximately $18.5 million. |
| • | During the period from August 2007 through October 2009, REMC made other periodic intercompany loans to Rentech from cash on hand in an aggregate principal amount of approximately $86.9 million. |
These intercompany loans did not bear interest and were due and payable upon demand by REMC. Rentech could prepay these intercompany loans at any time and from time to time without premium or penalty.
During the period from October 1, 2007 through September 30, 2011, pursuant to the management services agreement, Rentech made payments for corporate overhead costs on behalf of REMC, and used a portion of Rentech’s net operating loss carryforwards to satisfy income taxes attributable to REMC. During this period, Rentech and REMC elected to offset approximately $77.9 million of such corporate overhead costs and net operating loss carryforwards against a portion of the intercompany loans. The amount of such offset included approximately $62.9 million of net operating loss carryforwards used to satisfy income taxes attributable to REMC. In June 2011, the remaining approximately $112.7 million of intercompany loans was reclassified as a dividend from REMC to Rentech. As of September 30, 2011, REMC owed Rentech approximately $20.1 million for corporate overhead costs paid by Rentech on REMC’s behalf and net operating loss carryforwards used by Rentech to satisfy income taxes attributable to REMC.
In connection with the ammonia expansion project, Rentech may provide the initial debt financing for this project in order to enable us to incur costs to keep the project on schedule as we seek debt financing to complete the project. We expect that the ammonia expansion project could cost approximately $100.0 million to complete, with approximately half of that amount expected to be spent during the fiscal year ending September 30, 2012. Under our new revolving credit facility, we do not have sufficient borrowing capacity to finance the entire cost of the ammonia capacity expansion project and the new revolving credit facility is designed to provide for seasonal working capital needs, not construction financing. As a result, in addition to the initial debt financing potentially provided by Rentech, we will need to obtain additional debt and/or equity financing to complete that project.
Other Dividends
In November 2010, REMC incurred an incremental term loan in the principal amount of $52.0 million and made a dividend to Rentech in the amount of approximately $50.9 million.
In March 2011, REMC paid a dividend to Rentech with cash on hand in the amount of $5.0 million.
In June 2011, REMC refinanced all of its existing term loans with a new $150.0 million term loan and made a dividend to Rentech in the amount of approximately $67.0 million.
At the closing of our initial public offering, REMC distributed all of its cash, in the amount of approximately $39.3 million, to RNHI.
Our Agreements with Rentech
At the closing of our initial public offering, we, our general partner and Rentech entered into the following agreements which govern the business relations among us, our general partner and Rentech. These agreements were not the result of arm’s-length negotiations and the terms of these agreements are not necessarily at least as favorable to each party to these agreements as terms which could have been obtained from unaffiliated third parties.
Contribution Agreement
At the closing of our initial public offering, we entered into a contribution, conveyance and assignment agreement, which we refer to as the contribution agreement, with Rentech, RDC, RNHI, our general partner and REMC. Under the contribution agreement, the following transactions, among other things, took place upon the closing of our initial public offering in the order they are listed:
| • | RDC converted into a corporation organized under the laws of the State of Delaware; |
| • | RDC contributed the capital stock in REMC to RNHI; |
| • | REMC converted into a limited liability company organized under the laws of the State of Delaware and changed its name to Rentech Nitrogen, LLC; |
121
Table of Contents
| • | REMC paid approximately $19.4 million to Rentech and, following such payment, our management services agreement with Rentech terminated in accordance with its terms; |
| • | REMC’s employees were transferred to, and became employees of, our general partner; |
| • | REMC distributed to RNHI all of REMC’s cash, which was approximately $39.3 million; |
| • | RNHI contributed the member interests in REMC to us in exchange for (i) 23,250,000 common units, and (ii) the right to receive from us approximately $34.7 million in cash, in part as a reimbursement for expenditures made by REMC during the two-year period preceding our initial public offering for the expansion and improvement of our facility; for federal income tax purposes, when REMC converted to a limited liability company (as described above), RNHI was treated as having been the party that made such expenditures with respect to our facility; |
| • | we (i) used approximately $150.8 million of the net proceeds of our initial public offering make a capital contribution to REMC for the repayment in full and termination of REMC’s existing term loan and the payment of related fees and expenses and (ii) used or will use the remainder of the net proceeds as described in Part II—Item 5 “Market for Registrant’s Common Units, Related Unitholder Matters and Issuer Purchases of Common Units—Use of Proceeds from the Sales of Registered Securities”; |
| • | we distributed approximately $34.7 million of the net proceeds of our initial public offering to RNHI to reimburse it for expenditures made by REMC during the two-year period preceding our initial public offering for the expansion and improvement of our facility, including expenditures for preliminary work relating to our expansion projects; |
| • | we used the balance of the net proceeds of our initial public offering to make a distribution to RNHI; |
| • | our partnership agreement and the limited liability company agreement of our general partner were amended and restated to the extent necessary to reflect the transactions in the contribution agreement; and |
| • | we redeemed the limited partner interest issued to RDC and subsequently transferred to RNHI and retired such limited partner interest in exchange for a payment of $980 to RNHI. |
The agreement also contains a provision whereby, in connection with the transfer of REMC’s employees to our general partner, all related benefit plans and other agreements between REMC and the transferred employees were assigned to us, subject to receipt of any necessary consents from third parties. The agreement also contains an indemnity provision whereby our general partner, as the indemnifying party, will indemnify us and REMC for any losses and liabilities incurred in connection with the transfer and employment of the transferred employees, including the transferred employees represented by collective bargaining agreements, and the then existing collective bargaining agreement covering such employees.
Omnibus Agreement
At the closing of our initial public offering, we entered into an omnibus agreement with our general partner and Rentech. Under the omnibus agreement, Rentech has agreed to indemnify us for:
| • | environmental liabilities of REMC (excluding liabilities related to the matter described in Part I—Item 3 “Legal Proceedings” in an amount not to exceed $550,000 and environmental liabilities relating to the potential removal of asbestos at our facility in an amount not to exceed $325,000) to the extent arising out of the ownership or operation of REMC prior to the closing of our initial public offering and that are asserted during the period ending on the third anniversary of the closing of our initial public offering; |
| • | liabilities relating to REMC (excluding environmental liabilities, pre-closing income tax liabilities, liabilities reflected on the balance sheet of REMC as of June 30, 2011 and liabilities that have arisen since June 30, 2011 in the ordinary course of business) to the extent arising out of the ownership or operation of REMC prior to the closing of our initial public offering and that are asserted during the period ending on the seventh anniversary of the closing of our initial public offering; |
122
Table of Contents
| • | pre-closing income tax liabilities that are asserted during the period ending on the 30th day after the expiration of the applicable statute of limitations; |
| • | our failure, as of the closing of our initial public offering, to be the owner of valid and indefeasible easement rights, contractual rights, leasehold interests and/or fee ownership interests in and to the lands on which our facility or our ammonia storage space in Niota, Illinois are located, and if such failure renders us liable to a third party or unable to use our facility or such ammonia storage space in substantially the same manner they were used and operated immediately prior to the closing of our initial public offering, which failure(s) are identified prior to the fifth anniversary of the closing of our initial public offering; and |
| • | events and conditions associated with any assets retained by Rentech. |
Rentech’s obligation to indemnify us for liabilities described in the first two bullets above will be subject to (i) a $250,000 aggregate annual deductible; and (ii) a $10.0 million aggregate cap. In addition, Rentech is not obligated to indemnify us for liabilities satisfied through the use of net operating loss carry-forwards in accordance with the terms of our management services agreement with Rentech.
We have agreed to indemnify Rentech and any of its direct or indirect subsidiaries (excluding us and any of our direct or indirect subsidiaries) for:
| • | liabilities of REMC (excluding post-closing income tax liabilities) to the extent arising out of the ownership or operation of REMC on or after the closing of our initial public offering; |
| • | post-closing income tax liabilities (excluding pre-closing income tax liabilities and income tax liabilities attributable to Rentech’s indirect ownership of REMC through its ownership in us after the closing of our initial public offering) that are asserted during the period ending on the 30th day after the expiration of the applicable statute of limitations; |
| • | liabilities related to the matter described in Part I—Item 3 “Legal Proceedings” in an amount not to exceed $550,000; |
| • | environmental liabilities relating to the potential removal of asbestos at our facility in an amount not to exceed $325,000; |
| • | any liabilities (excluding environmental liabilities and pre-closing income tax liabilities) to the extent reflected on the balance sheet of REMC as of June 30, 2011; and |
| • | any liabilities (excluding environmental liabilities and pre-closing income tax liabilities) that have arisen since June 30, 2011 in the ordinary course of business. |
Our obligation to indemnify Rentech for liabilities described in the first bullet above will be subject to (i) a $250,000 aggregate annual deductible and (ii) a $10.0 million aggregate cap.
Subject to the terms and conditions of the omnibus agreement, Rentech and its affiliates granted us and our general partner a royalty-free, worldwide, non-exclusive, non-sublicensable and non-transferable (without the prior written consent of Rentech) right and license to use the Rentech corporate logo and the Rentech name.
Services Agreement
At the closing of our initial public offering, we, our general partner and Rentech entered into a services agreement, pursuant to which we, our general partner and our operating company obtain certain management and other services from Rentech. Under this agreement, our general partner have engaged Rentech to provide certain administrative services to us. Rentech provides us with the following services under the agreement, among others:
| • | services from certain of Rentech’s employees in capacities equivalent to the capacities of corporate executive officers, except that those who serve in such capacities under the agreement shall serve us on a shared, part-time basis only, unless we and Rentech agree otherwise; |
| • | administrative and professional services, including legal, accounting services, human resources, information technology, insurance, tax, credit, finance, payroll, investor and public relations, communications, government affairs and regulatory affairs; |
123
Table of Contents
| • | recommendations on capital raising activities to the board of directors of our general partner, including the issuance of debt or equity securities, the entry into credit facilities and other capital market transactions; |
| • | managing or overseeing litigation and administrative or regulatory proceedings, and establishing appropriate insurance policies for us, and providing safety and environmental advice; |
| • | recommendations regarding the declaration and payment of cash distributions; and |
| • | managing or providing advice for other projects, including acquisitions, as may be agreed by Rentech and our general partner from time to time. |
As payment for services provided under the agreement, we, our general partner, and our operating subsidiary, are obligated to reimburse Rentech for (i) all costs, if any, incurred by Rentech or its affiliates in connection with the employment of its employees who are seconded to us and who provide us services under the agreement on a full-time basis, but excluding share-based compensation; (ii) a prorated share of costs incurred by Rentech or its affiliates in connection with the employment of its employees, excluding the seconded personnel, who provide us services under the agreement on a part-time basis, but excluding share-based compensation, and such prorated share shall be determined by Rentech on a commercially reasonable basis, based on the estimated percent of total working time that such personnel are engaged in performing services for us; (iii) a prorated share of certain administrative costs in accordance with the terms of the agreement, including office costs, services by outside vendors (including employee compensation and benefit plan services), other general and administrative costs; (iv) any costs, expenses and claims related to employee benefits provided to employees of our general partner, us or our operating subsidiary that have been paid by Rentech, but excluding share-based compensation; and (v) any taxes (other than income taxes, gross receipt taxes and similar taxes) incurred by Rentech or its affiliates for the services provided under the agreement. We are required to pay Rentech within 30 days for invoices it submits to us under the agreement.
We, our general partner and our operating company are not required to pay any salaries, bonuses or benefits directly to any of Rentech’s employees who provide services to us on a full-time or part-time basis; Rentech will continue to be responsible for their compensation. We expect that personnel performing the actual day-to-day business and operations at our facility will be employed directly by our general partner, and we will bear all salaries, bonuses, employee benefits and other personnel costs for these employees.
Either Rentech or our general partner may temporarily or permanently exclude any particular service from the scope of the agreement upon 180 days’ notice unless such notice is waived in writing by our general partner. At any time, Rentech may temporarily or permanently exclude any employee of Rentech or its affiliates from providing the services under the agreement. Rentech also has the right to delegate the performance of some or all of the services to be provided pursuant to the agreement to one of its affiliates or any other person or entity, though such delegation will not relieve Rentech from its obligations under the agreement. Beginning one year after the closing of our initial public offering, either Rentech or our general partner will have the right to terminate the agreement upon at least 180 days’ notice, but not more than one year’s notice. Furthermore, our general partner will have the right to terminate the agreement immediately if Rentech becomes bankrupt, or dissolves and commences liquidation or winding-up.
In order to facilitate the carrying out of services under the agreement, we, on the one hand, and Rentech and its affiliates, on the other, have granted one another certain royalty-free, non-exclusive and non-transferable rights to use one another’s intellectual property under certain circumstances. However, Rentech did not grant any right to license its alternative energy technology under the agreement.
The agreement also contains an indemnity provision whereby we, our general partner and our operating company, as indemnifying parties, have agreed to indemnify Rentech and its affiliates (other than the indemnifying parties themselves) against losses and liabilities incurred in connection with the performance of services under the agreement or any breach of the agreement, unless such losses or liabilities arise from a breach of the agreement by Rentech or other misconduct on its part, as provided in the agreement. The agreement also contains a provision stating that Rentech is an independent contractor under the agreement and nothing in the agreement may be construed to impose an implied or express fiduciary duty owed by Rentech, on the one hand, to the recipients of services under the agreement, on the other hand. The agreement prohibits recovery of loss of profits or revenue, or special, incidental, exemplary, punitive or consequential damages from Rentech or certain affiliates.
124
Table of Contents
Indemnification Agreements
At the closing of our initial public offering, we entered into indemnification agreements with each of the directors and executive officers of our general partner. These agreements provide indemnification to these directors and executive officers under certain circumstances for acts or omissions which may not be covered by directors’ and officers’ liability insurance.
Procedures for Review; Approval and Ratification of Related Person Transactions
The board of directors of our general partner adopted a Code of Business Conduct and Ethics in connection with the closing of our initial public offering that provides that the independent members of the board of directors of our general partner or an authorized independent committee of the board of directors periodically will review all transactions with a related person that are required to be disclosed under SEC rules and, when appropriate, initially authorize or ratify all such transactions. In the event that the independent members of the board of directors of our general partner or the authorized independent committee considers ratification of a transaction with a related person and determines not to so ratify, the Code of Business Conduct and Ethics provides that our management will make all reasonable efforts to cancel or annul the transaction.
The Code of Business Conduct and Ethics provides that, in determining whether or not to recommend the initial approval or ratification of a transaction with a related person, the independent members of the board of directors of our general partner or the authorized independent committee should consider all of the relevant facts and circumstances available, including (if applicable) but not limited to: (i) whether there is an appropriate business justification for the transaction; (ii) the benefits that accrue to us as a result of the transaction; (iii) the terms available to unrelated third parties entering into similar transactions; (iv) the impact of the transaction on a director’s independence (in the event the related person is a director, an immediate family member of a director or an entity in which a director or an immediately family member of a director is a partner, shareholder, member or executive officer); (v) the availability of other sources for comparable products or services; (vi) whether it is a single transaction or a series of ongoing, related transactions; and (vii) whether entering into the transaction would be consistent with the Code of Business Conduct and Ethics.
The Code of Business Conduct and Ethics described above was adopted in connection with the closing of our initial public offering, and as a result the transactions described above were not reviewed under such policy.
ITEM 14. PRINCIPAL ACCOUNTING FEES AND SERVICES
The charter of the audit committee of the board of directors of our general partner, which is available on our website at www.rentechnitrogen.com, requires the audit committee to pre-approve all audit services and non-audit services (other than de minimis non-audit services as defined by the Sarbanes-Oxley Act of 2002) to be provided by our independent registered public accounting firm. Rentech’s audit committee pre-approved all fees incurred in fiscal year 2011.
The following table presents fees billed and expected to be billed for professional audit services rendered by PricewaterhouseCoopers LLC for fiscal years 2011 and 2010 and fees billed and expected to be billed for other services rendered by PricewaterhouseCoopers LLC for fiscal years 2011 and 2010.
| Fiscal Year | Fiscal Year | |||||||
| 2011 | 2010 | |||||||
| PricewaterhouseCoopers LLP: |
||||||||
| Audit Fees (1) |
$ | 1,516,918 | $ | 491,402 | ||||
| Audit-Related Fees |
— | — | ||||||
| Tax Fees (2) |
— | 81,153 | ||||||
| All Other Fees |
— | — | ||||||
|
|
|
|
|
|||||
| Total |
$ | 1,516,918 | $ | 572,555 | ||||
|
|
|
|
|
|||||
| (1) | Represents the aggregate fees billed and expected to be billed for professional services rendered for the audit of REMC’s financial statements for fiscal years ended September 30, 2011 and 2010, assistance with Securities Act filings and related matters, consents issued in connection with Securities Act filings, and consultations on financial accounting and reporting standards arising during the course of the audit for fiscal years 2011 and 2010. Also includes REMC’s portion of aggregate fees billed and expected to be billed to Rentech for its consolidated financial statements for the fiscal years ended September 30, 2011 and 2010, and for the audit of Rentech’s internal control over financial reporting and for reviews of the consolidated financial statements included in Rentech’s quarterly reports on Form 10-Q. |
125
Table of Contents
| (2) | Represents REMC’s portion of aggregate fees billed to Rentech for its 2010 consolidated tax return. |
ITEM 15. EXHIBITS AND FINANCIAL STATEMENT SCHEDULES
(a)(1) and (2) Financial Statements and Schedules.
The information required by this Item is included in Part II—Item 8 “Financial Statements and Supplementary Data” of this report.
(b) Exhibits.
See Exhibit Index starting on page 127.
126
Table of Contents
EXHIBIT INDEX
| 3.1 | Certificate of Limited Partnership of Rentech Nitrogen Partners, L.P. (incorporated by reference to Exhibit 3.1 to the Form S-1 filed by the Registrant on August 5, 2011). | |
| 3.2 | Second Amended and Restated Agreement of Limited Partnership of Rentech Nitrogen Partners, L.P., dated as of November 9, 2011 (including form of common unit certificate) (incorporated by reference to Exhibit 3.1 to the Current Report on Form 8-K filed by the Registrant on November 9, 2011). | |
| 3.3 | Certificate of Formation of Rentech Nitrogen GP, LLC (incorporated by reference to Exhibit 3.3 to the Form S-1 filed by the Registrant on August 5, 2011). | |
| 3.4 | Second Amended and Restated Limited Liability Company Agreement of Rentech Nitrogen GP, LLC, dated November 9, 2011 (incorporated by reference to Exhibit 3.2 to the Current Report on Form 8-K filed by the Registrant on November 9, 2011). | |
| 10.1 | Distribution Agreement, dated April 26, 2006, between Royster-Clark Resources LLC and Rentech Development Corporation (incorporated by reference to Exhibit 10.1 to the Form S-1 filed by the Registrant on August 5, 2011). | |
| 10.2 | Amendment to Distribution Agreement, dated October 13, 2009, among Rentech Energy Midwest Corporation, Rentech Development Corporation and Agrium U.S.A., Inc. (incorporated by reference to Exhibit 10.2 to the Form S-1 filed by the Registrant on August 5, 2011). | |
| 10.3 | Assignment and Assumption Agreement, dated as of September 29, 2006, by and between Royster-Clark, Inc., Agrium U.S.A., Inc., and Rentech Development Corporation (incorporated by reference to Exhibit 10.3 to the Form S-1 filed by the Registrant on August 5, 2011). | |
| 10.4 | Credit Agreement, dated January 29, 2010, by and among Rentech Energy Midwest Corporation, as the borrower, Rentech, Inc. and Credit Suisse AG, Cayman Islands Branch, individually and as Administrative Agent and Collateral Agent (incorporated by reference to Exhibit 10.1 to Current Report on Form 8-K (File No. 001-15795) filed by Rentech, Inc. on February 1, 2010). | |
| 10.5 | Guarantee and Collateral Agreement, dated January 29, 2010, by and among Rentech Energy Midwest Corporation, Rentech, Inc., the subsidiaries of Rentech, Inc. listed therein and Credit Suisse AG, Cayman Islands Branch, as Collateral Agent (incorporated by reference to Exhibit 10.2 to Current Report on Form 8-K (File No. 001-15795) filed by Rentech, Inc. on February 1, 2010). | |
| 10.6 | Real Estate Mortgage, Assignment of Rents, Security Agreement and UCC Fixture Filing, dated January 29, 2010, by and among Rentech Energy Midwest Corporation, Rentech, Inc. and Credit Suisse AG, Cayman Islands Branch, as Administrative Agent and Collateral Agent (incorporated by reference to Exhibit 10.3 to Current Report on Form 8-K (File No. 001-15795) filed by Rentech, Inc. on February 1, 2010). | |
| 10.7 | Amendment to Credit Agreement, Waiver and Collateral Agent Consent, dated July 21, 2010, among Rentech Energy Midwest Corporation, Rentech, Inc., certain subsidiaries of Rentech, Inc., the Lenders party thereto and Credit Suisse AG, Cayman Islands Branch (incorporated by reference to Exhibit 10.1 to Current Report on Form 8-K (File No. 001-15795) filed by Rentech, Inc. on July 26, 2010). | |
| 10.8 | Incremental Loan Assumption Agreement, dated July 21, 2010, among Rentech Energy Midwest Corporation, Rentech, Inc., certain subsidiaries of Rentech, Inc., the Incremental Lenders party thereto and Credit Suisse AG, Cayman Islands Branch (incorporated by reference to Exhibit 10.2 to Current Report on Form 8-K (File No. 001-15795) filed by Rentech, Inc. on July 26, 2010). | |
| 10.9 | Second Amendment to Credit Agreement, Waiver and Collateral Agent Consent, dated November 24, 2010, among Rentech Energy Midwest Corporation, Rentech, Inc., certain subsidiaries of Rentech, Inc., the Lenders party thereto and Credit Suisse AG, Cayman Islands Branch (incorporated by reference to Exhibit 10.1 to Current Report on Form 8-K (File No. 001-15795) filed by Rentech, Inc. on November 29, 2010). | |
| 10.10 | Second Incremental Loan Assumption Agreement, dated November 24, 2010, among Rentech Energy Midwest Corporation, Rentech, Inc., certain subsidiaries of Rentech, Inc., the Incremental Lenders party thereto and Credit Suisse AG, Cayman Islands Branch (incorporated by reference to Exhibit 10.1 to Current Report on Form 8-K (File No. 001-15795) filed by Rentech, Inc. on November 29, 2010). | |
127
Table of Contents
| 10.11 | Credit Agreement, dated June 10, 2011, by and among Rentech Energy Midwest Corporation, as the borrower, Rentech, Inc., the lenders party thereto, Credit Suisse AG, Cayman Islands Branch, individually and as Administrative Agent and Collateral Agent and Credit Suisse Securities (USA) LLC as Sole Bookrunner, Sole Syndication Agent and Sole Lead Arranger (incorporated by reference to Exhibit 10.1 to Current Report on Form 8-K (File No. 001-15795) filed by Rentech, Inc. on June 14, 2011). | |
| 10.12 | Guarantee and Collateral Agreement, dated June 10, 2011, by and among Rentech Energy Midwest Corporation, Rentech, Inc., the subsidiaries of Rentech, Inc. listed therein and Credit Suisse AG, Cayman Islands Branch, as Collateral Agent (incorporated by reference to Exhibit 10.2 to Current Report on Form 8-K (File No. 001-15795) filed by Rentech, Inc. on June 14, 2011). | |
| 10.13 | Real Estate Mortgage, Assignment of Rents, Security Agreement and UCC Fixture Filing, dated June 10, 2011, by and among Rentech Energy Midwest Corporation, Rentech, Inc. and Credit Suisse AG, Cayman Islands Branch, as Administrative Agent and Collateral Agent (incorporated by reference to Exhibit 10.3 to Current Report on Form 8-K (File No. 001-15795) filed by Rentech, Inc. on June 14, 2011). | |
| 10.14 | Agreement, dated November 1, 2010, between Northern Illinois Gas Company, d/b/a Nicor Gas Company and Rentech Energy Midwest (incorporated by reference to Exhibit 10.14 to the Form S-1 filed by the Registrant on August 5, 2011). | |
| 10.15 | Services Agreement, dated as of November 9, 2011, by and among Rentech Nitrogen Partners, L.P., Rentech Nitrogen GP, LLC and Rentech, Inc. (incorporated by reference to Exhibit 10.3 to the Current Report on Form 8-K filed by the Registrant on November 9, 2011). | |
| 10.16 | Contribution, Conveyance and Assignment Agreement, dated as of November 9, 2011, by and among Rentech, Inc., Rentech Development Corporation, Rentech Nitrogen Holdings, Inc., Rentech Nitrogen GP, LLC, Rentech Nitrogen Partners, L.P. and Rentech Energy Midwest Corporation (incorporated by reference to Exhibit 10.1 to the Current Report on Form 8-K filed by the Registrant on November 9, 2011). | |
| 10.17 | Omnibus Agreement, dated as of November 9, 2011, by and among Rentech, Inc., Rentech Nitrogen GP, LLC and Rentech Nitrogen Partners, L.P. (incorporated by reference to Exhibit 10.2 to the Current Report on Form 8-K filed by the Registrant on November 9, 2011). | |
| 10.18† | Amended and Restated Employment Agreement by and between Rentech, Inc. and D. Hunt Ramsbottom, dated December 31, 2008 (incorporated by reference to Exhibit 10.43 to Amendment No. 1 to Annual Report on Form 10-K/A (File No. 001-15795) filed by Rentech, Inc. on January 28, 2009). | |
| 10.19† | Employment Agreement by and between Rentech, Inc. and Daniel J. Cohrs, dated October 22, 2008 (incorporated by reference to Exhibit 10.21 to Annual Report on Form 10-K for the fiscal year ended September 30, 2008 (File No. 001-15795) filed by Rentech, Inc. on December 15, 2008). | |
| 10.20† | Employment Agreement by and between Rentech, Inc. and John H. Diesch, dated November 3, 2009 (incorporated by reference to Exhibit 10.20 to the Form S-1 filed by the Registrant on August 5, 2011). | |
| 10.21† | Change in Control Severance Benefits Agreement by and between Rentech Energy Midwest Corporation and John A. Ambrose, dated August 1, 2010 (incorporated by reference to Exhibit 10.21 to the Form S-1 filed by the Registrant on August 5, 2011). | |
| 10.22† | Change in Control Severance Benefits Agreement by and between Rentech Energy Midwest Corporation and Wilfred R. Bahl, Jr., dated May 10, 2011 (incorporated by reference to Exhibit 10.22 to the Form S-1 filed by the Registrant on August 5, 2011). | |
| 10.23† | Change in Control Severance Benefits Agreement by and between Rentech Energy Midwest Corporation and Marc E. Wallis, dated August 12, 2008 (incorporated by reference to Exhibit 10.23 to the Form S-1 filed by the Registrant on August 5, 2011). | |
| 10.24† | Amended and Restated Rentech, Inc. 2006 Incentive Award Plan (incorporated by reference to Exhibit 10.1 to Current Report on Form 8-K (File No. 001-15795) filed by Rentech, Inc. on March 29, 2007). | |
| 10.25† | First Amendment to Rentech, Inc. Amended and Restated 2006 Incentive Award Plan (incorporated by reference to Exhibit 10.1 to Current Report on Form 8-K (File No. 001-15795) filed by Rentech, Inc. on November 6, 2009). | |
128
Table of Contents
| 10.26† | Rentech, Inc. 2009 Incentive Award Plan (incorporated by reference to Exhibit 10.1 to Current Report on Form 8-K (File No. 001-15795) filed by Rentech, Inc. on May 22, 2009). | |
| 10.27† | First Amendment to Rentech, Inc. 2009 Incentive Award Plan (incorporated by reference to Exhibit 10.2 to Current Report on Form 8-K (File No. 001-15795) filed by Rentech, Inc. on November 6, 2009). | |
| 10.28† | Rentech Nitrogen Partners, L.P. 2011 Long-Term Incentive Plan (incorporated by reference to Exhibit 10.1 to the Current Report on Form 8-K filed by the Registrant on November 8, 2009). | |
| 10.29† | Form of Rentech Nitrogen Partners, L.P. 2011 Long-Term Incentive Plan Phantom Unit Agreement (incorporated by reference to Exhibit 10.34 to Form S-1 filed by the Registrant on October 26, 2011). | |
| 10.30† | Form of Indemnification Agreement (incorporated by reference to Exhibit 10.30 to the Form S-1 filed by the Registrant on October 28, 2011). | |
| 10.31† | Employment Agreement, dated as of October 15, 2011 by and between Rentech Nitrogen GP, LLC and John A. Ambrose (incorporated by reference to Exhibit 10.31 to the Form S-1 filed by the Registrant on October 20, 2011). | |
| 10.32† | Employment Agreement, dated as of October 15, 2011 by and between Rentech Nitrogen GP, LLC and Wilfred R. Bahl, Jr. (incorporated by reference to Exhibit 10.32 to the Form S-1 filed by the Registrant on October 20, 2011). | |
| 10.33† | Employment Agreement, dated as of October 16, 2011 by and between Rentech Nitrogen GP, LLC and Marc E. Wallis (incorporated by reference to Exhibit 10.33 to Form S-1 filed by the Registrant on October 20, 2011). | |
| 10.34 | Credit Agreement, dated as of November 10, 2011, among Rentech Nitrogen, LLC, as borrower, Rentech Nitrogen Partners, L.P., as guarantor, General Electric Capital Corporation, as administrative agent, and the other lender parties thereto (incorporated by reference to Exhibit 10.1 to the Current Report on Form 8-K filed by the Registrant on November 15, 2011). | |
| 10.35 | Guaranty and Security Agreement, dated as of November 10, 2011, among Rentech Nitrogen, LLC, as borrower, Rentech Nitrogen Partners, L.P., as guarantor and General Electric Capital Corporation, as administrative agent (incorporated by reference to Exhibit 10.2 to the Current Report on Form 8-K filed by the Registrant on November 15, 2011). | |
| 10.36* | Indemnification Agreement dated November 9, 2011, by and between Rentech Nitrogen Partners, L.P. and D. Hunt Ramsbottom (all other Indemnification Agreements, which are substantially identical in all material respects, except as to the parties thereto and the dates of execution, are omitted pursuant to Instruction 2 to Item 601 of Regulation S-K). | |
| 21.1* | List of Subsidiaries of Rentech Nitrogen Partners, L.P. | |
| 23.1* | Consent of Independent Registered Public Accounting Firm. | |
| 31.1* | Certification of Registrant’s Chief Executive Officer pursuant to Rule 13a-14(a) or Rule 15d-14(a). | |
| 31.2* | Certification of Registrant’s Chief Financial Officer pursuant to Rule 13a-14(a) or Rule 15d-14(a). | |
| 32.1* | Certification of Registrant’s Chief Executive Officer pursuant to 18 U.S.C. Section 1350. This certification is being furnished solely to accompany this Annual Report on Form 10-K and is not being filed for purposes of Section 18 of the Securities Exchange Act of 1934, as amended, and is not to be incorporated by reference into any filing of the Company. | |
| 32.2* | Certification of Registrant’s Chief Financial Officer pursuant to 18 U.S.C. Section 1350. This certification is being furnished solely to accompany this Annual Report on Form 10-K and is not being filed for purposes of Section 18 of the Securities Exchange Act of 1934, as amended, and is not to be incorporated by reference into any filing of the Company. | |
| * | Included with this filing. |
| † | Management contract or compensatory plan or arrangement. |
129
Table of Contents
Pursuant to the requirements of Section 13 or 15(d) of the Securities Exchange Act of 1934, the registrant has duly caused this report to be signed on its behalf by the undersigned, thereunto duly authorized.
RENTECH NITROGEN PARTNERS, L.P.
BY: RENTECH NITROGEN GP, LLC, ITS GENERAL PARTNER
/s/ D. Hunt Ramsbottom
D. Hunt Ramsbottom,
Chief Executive Officer
Date: December 14, 2011
Pursuant to the requirements of the Securities Exchange Act of 1934, this report has been signed below by the following persons on behalf of the registrant and in the capacities and on the dates indicated.
| Signature |
Title |
Date | ||
| /S/ D. HUNT RAMSBOTTOM |
Chief Executive Officer and Director of Rentech Nitrogen GP, LLC (Principal Executive Officer) | December 14, 2011 | ||
| D. Hunt Ramsbottom |
||||
| /S/ DAN J. COHRS |
Chief Financial Officer of Rentech Nitrogen GP, LLC (Principal Financial and Accounting Officer) | December 14, 2011 | ||
| Dan J. Cohrs |
||||
| /S/ JOHN H. DIESCH |
President and Director of Rentech Nitrogen GP, LLC |
December 14, 2011 | ||
| John H. Diesch |
||||
| /S/ HALBERT S. WASHBURN |
Director of Rentech Nitrogen GP, LLC |
December 14, 2011 | ||
| Halbert S. Washburn |
||||
| /S/ MICHAEL S. BURKE |
Director of Rentech Nitrogen GP, LLC |
December 14, 2011 | ||
| Michael S. Burke |
||||
| /S/ KEITH B. FORMAN |
Director of Rentech Nitrogen GP, LLC |
December 14, 2011 | ||
| Keith B. Forman |
||||
| /S/ MICHAEL F. RAY |
Director of Rentech Nitrogen GP, LLC |
December 14, 2011 | ||
| Michael F. Ray | ||||
130