Attached files
| file | filename |
|---|---|
| EXCEL - IDEA: XBRL DOCUMENT - East Dubuque Nitrogen Partners, L.P. | Financial_Report.xls |
| EX-31.1 - EX-31.1 - East Dubuque Nitrogen Partners, L.P. | d824433dex311.htm |
| EX-32.1 - EX-32.1 - East Dubuque Nitrogen Partners, L.P. | d824433dex321.htm |
| EX-32.2 - EX-32.2 - East Dubuque Nitrogen Partners, L.P. | d824433dex322.htm |
| EX-21.1 - EX-21.1 - East Dubuque Nitrogen Partners, L.P. | d824433dex211.htm |
| EX-23.1 - EX-23.1 - East Dubuque Nitrogen Partners, L.P. | d824433dex231.htm |
| EX-31.2 - EX-31.2 - East Dubuque Nitrogen Partners, L.P. | d824433dex312.htm |
Table of Contents
UNITED STATES
SECURITIES AND EXCHANGE COMMISSION
Washington, D.C. 20549
Form 10-K
(Mark One)
| x | ANNUAL REPORT PURSUANT TO SECTION 13 OR 15(d) OF THE SECURITIES EXCHANGE ACT OF 1934 |
For the Fiscal Year Ended December 31, 2014
OR
| ¨ | TRANSITION REPORT PURSUANT TO SECTION 13 OR 15(d) OF THE SECURITIES EXCHANGE ACT OF 1934 |
For the Transition Period from to
Commission File No. 001-35334
RENTECH NITROGEN PARTNERS, L.P.
(Exact name of registrant as specified in its charter)
| Delaware | 45-2714747 | |
| (State or other jurisdiction of incorporation or organization) |
(I.R.S. Employer Identification No.) |
| 10877 Wilshire Boulevard, 10th Floor Los Angeles, California |
90024 | |
| (Address of principal executive offices) | (Zip Code) |
Registrant’s telephone number, including area code: (310) 571-9800
Securities registered pursuant to Section 12(b) of the Act:
| Title of Each Class |
Name of Each Exchange on Which Registered | |
| Common Units Representing Limited Partner Interests | New York Stock Exchange |
Securities registered pursuant to Section 12(g) of the Act: None
Indicate by check mark if the registrant is a well-known seasoned issuer, as defined in Rule 405 of the Securities Act. Yes x No ¨
Indicate by check mark if the registrant is not required to file reports pursuant to Section 13 or Section 15(d) of the Act. Yes ¨ No x
Indicate by check mark whether the registrant (1) has filed all reports required to be filed by Section 13 or 15(d) of the Securities Exchange Act of 1934 during the preceding 12 months (or for such shorter period that the registrant was required to file such reports), and (2) has been subject to such filing requirements for the past 90 days. Yes x No ¨
Indicate by check mark whether the registrant has submitted electronically and posted on its corporate Web site, if any, every Interactive Data File required to be submitted and posted pursuant to Rule 405 of Regulation S-T (§232.405 of this chapter) during the preceding 12 months (or for such shorter period that the registrant was required to submit and post such files). Yes x No ¨
Indicate by check mark if disclosure of delinquent filers pursuant to Item 405 of Regulation S-K (§229.405 of this chapter) is not contained herein, and will not be contained, to the best of registrant’s knowledge, in definitive proxy or information statements incorporated by reference in Part III of this Form 10-K or any amendment to this Form 10-K. x
Indicate by check mark whether the registrant is a large accelerated filer, an accelerated filer, a non-accelerated filer, or a smaller reporting company. See the definitions of “large accelerated filer,” “accelerated filer” and “smaller reporting company” in Rule 12b-2 of the Exchange Act. (Check one):
| Large accelerated filer | ¨ | Accelerated filer | x | |||
| Non-accelerated filer | ¨ (Do not check if a smaller reporting company) | Smaller reporting company | ¨ | |||
Indicate by check mark whether the registrant is a shell company (as defined in Rule 12b-2 of the Exchange Act). Yes ¨ No x
The aggregate market value of the voting and non-voting common equity held by non-affiliates as of June 30, 2014, the last business day of the registrant’s most recently completed second fiscal quarter, was approximately $264.2 million (based upon the closing price of the common units on June 30, 2014, as reported by the New York Stock Exchange).
As of February 27, 2015, the registrant had 38,913,396 common units outstanding.
DOCUMENTS INCORPORATED BY REFERENCE: None
Table of Contents
2
Table of Contents
FORWARD-LOOKING STATEMENTS
Certain statements and information included in this Annual Report on Form 10-K, or this Annual Report, and other reports or materials that we have filed or will file with the Securities and Exchange Commission, or the SEC (as well as information included in oral statements or other written statements made or to be made by us or our management), contain or may contain “forward-looking statements.” Statements that are predictive in nature, that depend upon or refer to future events or conditions or that include the words “will,” “believe,” “expect,” “anticipate,” “intend,” “estimate” and other expressions that are predictions of or indicate future events and trends and that do not relate to historical matters identify forward-looking statements. Our forward-looking statements include statements about our business strategy, our industry, our future profitability, our expected capital expenditures (including for maintenance or expansion projects and environmental expenditures) and the impact of such expenditures on our performance, and our operating costs. These statements involve known and unknown risks, uncertainties and other factors, which may cause our actual results and performance to be materially different from any future results or performance expressed or implied by these forward-looking statements. Factors that could affect our results include the risk factors detailed in Part I—Item 1A “Risk Factors” and from time to time in our periodic reports and registration statements filed with the SEC. You should not place undue reliance on our forward-looking statements. Although forward-looking statements reflect our good faith beliefs, forward-looking statements involve known and unknown risks, uncertainties and other factors, which may cause our actual results, performance or achievements to differ materially from anticipated future results, performance or achievements expressed or implied by such forward-looking statements. We undertake no obligation to publicly update or revise any forward-looking statement, whether as a result of new information, future events, changed circumstances or otherwise, unless required by law.
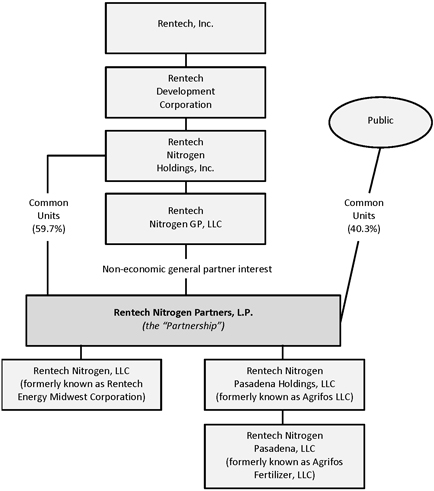
References in this report to “the Partnership,” “RNP,” “we,” “our,” “us” and like terms refer to Rentech Nitrogen Partners, L.P. and our subsidiaries, unless the context otherwise requires or where otherwise indicated. References in this report to “Rentech” refer to Rentech, Inc. and its subsidiaries other than us, unless the context otherwise requires or where otherwise indicated. References to “RDC” refer to Rentech Development Corporation, which is a wholly owned subsidiary of Rentech, references to “RNHI” refer to Rentech Nitrogen Holdings, Inc., which is a wholly owned subsidiary of RDC, and references to “Rentech Nitrogen GP” and “our general partner” refer to Rentech Nitrogen GP, LLC, which is our general partner and a wholly owned subsidiary of RNHI. References to “our operating companies” refer to Rentech Nitrogen, LLC, or RNLLC, which was formerly known as Rentech Energy Midwest Corporation, or REMC, and Rentech Nitrogen Pasadena, LLC, or RNPLLC, which was formerly known as Agrifos Fertilizer, LLC.
3
Table of Contents
Overview
We are a Delaware master limited partnership formed in July 2011 by Rentech, a company traded on the NASDAQ Stock Market under the symbol “RTK,” to own, operate and expand our fertilizer business. We own and operate two fertilizer facilities: our East Dubuque Facility and our Pasadena Facility. Our East Dubuque Facility produces primarily ammonia and urea ammonium nitrate solution, or UAN, using natural gas as the facility’s primary feedstock. Our Pasadena Facility produces ammonium sulfate, ammonium thiosulfate and sulfuric acid, using ammonia and sulfur as the facility’s primary feedstock.
On February 17, 2015, we announced that our general partner’s board has initiated a process to explore and evaluate potential strategic alternatives for the Partnership, which may include a sale of the Partnership, a merger with another party, a sale of some or all of our assets, or another strategic transaction. There can be no assurance that this strategic review process will result in a transaction.
Our East Dubuque Facility is located in the center of the Mid Corn Belt, the largest market in the United States for direct application of nitrogen fertilizer products. The Mid Corn Belt includes the States of Illinois, Indiana, Iowa, Missouri, Nebraska and Ohio. The States of Illinois and Iowa have been the top two corn producing states in the United States for the last 20 years according to the United States Department of Agriculture, or USDA. We consider the market for our East Dubuque Facility to be comprised of the States of Illinois, Iowa and Wisconsin.
Our East Dubuque Facility’s core market consists of the area located within an estimated 200-mile radius of the facility. In most instances, our customers take delivery of our nitrogen products at our East Dubuque Facility and then arrange and pay to transport them to their final destinations by truck. To the extent our products are picked up at our East Dubuque Facility, we do not incur any shipping costs, in contrast to nitrogen fertilizer producers located outside of the facility’s core market that must incur transportation and storage costs to transport their products to, and sell their products in, our market. In addition, our East Dubuque Facility does not maintain a fleet of trucks and, unlike some of our major competitors, our East Dubuque Facility does not maintain a fleet of rail cars because the facility’s customers generally are located close to the facility and prefer to be responsible for transportation. Having no need to maintain a fleet of trucks or rail cars lowers our East Dubuque Facility’s fixed costs. The combination of our East Dubuque Facility’s proximity to its customers and our storage capacity at the facility also allows for better timing of the pick-up and application of the facility’s products, as nitrogen fertilizer product shipments from more distant locations have a greater risk of missing the short periods of favorable weather conditions during which the application of nitrogen fertilizer may occur.
Our Pasadena Facility is the largest producer of synthetic ammonium sulfate and the third largest producer of ammonium sulfate in North America. We believe that our ammonium sulfate has several characteristics that distinguish it from competing products. In general, the ammonium sulfate that is available for sale in our industry is a byproduct of other processes and does not have certain characteristics valued by customers. Our ammonium sulfate is sized to the specifications preferred by customers and may more easily be blended with other fertilizer products. We also believe that our ammonium sulfate has a longer shelf-life, is more stable and is more easily transported and stored than many competing products.
Our Pasadena Facility is located on the Houston Ship Channel with access to transportation at favorable prices. The facility has two deep-water docks and access to the Mississippi waterway system and key international waterways. The facility is also connected to key domestic railways, which permit the efficient, cost-effective distribution of its products west of the Mississippi River. Our Pasadena Facility’s distributors purchase our products at our facility and then arrange and pay to transport them to their final destinations by truck, rail car or vessel. Our Pasadena Facility’s products are sold primarily through distributors to customers in the United States, and are applied to many types of crops including soybeans, potatoes, cotton, canola, alfalfa, corn and wheat.
Our Pasadena Facility purchases ammonia as a feedstock at contractual prices based on the monthly Tampa Index market, while our East Dubuque Facility sells ammonia at prevailing prices in the Mid Corn Belt region. Ammonia prices are typically significantly higher in the Mid Corn Belt than in Tampa.
Overview of Certain Significant Events that Occurred during 2014
During 2014, we (i) completed the urea expansion project at our East Dubuque Facility; (ii) substantially completed the power generation project and completed the sulfuric acid converter project at our Pasadena Facility; (iii) wrote off the remaining $27.2 million of goodwill relating to the acquisition of Agrifos LLC, or the Agrifos Acquisition; and (iv) reached an agreement with the seller in the Agrifos Acquisition to settle all existing and future indemnity claims relating to the Agrifos Acquisition, which resulted in income to us of $5.6 million.
4
Table of Contents
Several negative factors affected our operating results in 2014. Sales volumes were lower than we had expected due to both unplanned downtime at our East Dubuque Facility and a decision to reduce output and sales from our Pasadena Facility in order to improve the profitability of that facility. As discussed above, we also wrote down all of the remaining goodwill at our Pasadena Facility as a result of the continued outlook for profits to be lower than we had foreseen at the time of the Agrifos Acquisition.
We seek to continue to organically expand capacity at our fertilizer facilities, although any such expansion projects are likely to be smaller than the ongoing or recently-completed capacity expansions at each facility. We expect any expansion project to require new capital as we do not expect to use our operating cash flow to invest in any new growth projects. Expansion projects involve numerous risks and uncertainties, and there can be no assurance that we will be able to complete any expansion projects on a timely basis or at all.
Organizational Structure
The following diagram depicts our organizational structure as of February 27, 2015 (all percentage ownership interests are 100% unless otherwise noted):
Business
Our East Dubuque Facility
Our East Dubuque Facility is located on 210 acres in the northwest corner of Illinois on a 140-foot bluff above the Upper Mississippi River. Our East Dubuque Facility produces ammonia, urea ammonium nitrate solution, or UAN, liquid and granular urea, nitric acid and food-grade carbon dioxide, or CO2, using natural gas as its primary feedstock. We sell such products to customers located in the Mid Corn Belt region of the United States, the largest market in the United States for direct application of nitrogen fertilizer products. Our East Dubuque Facility operates continuously, except for planned shutdowns for maintenance and efficiency improvements, and unplanned shutdowns. Our East Dubuque Facility can optimize its product mix according to changes in demand and pricing for its various products. Some of these products are final products sold to customers, and others, including ammonia, are both final products and feedstocks for other products, such as UAN, nitric acid, liquid urea and granular urea.
5
Table of Contents
The following table sets forth our East Dubuque Facility’s current rated production capacity for the listed products in tons per day and tons per year, and its product storage capacity.
| Product |
Approximate Production Capacity | Product Storage Capacity | ||||||||
| Tons /Day | Tons /Year(1) | |||||||||
| Ammonia |
1,025 | 374,125 | 60,000 tons (3 tanks); 15,000 tons(2) | |||||||
| UAN |
1,100 | 401,500 | 80,000 tons (2 tanks) | |||||||
| Urea (liquid) |
484 | 176,660 | Limited capacity is not a factor | |||||||
| Urea (granular) |
140 | 51,100 | 12,000 granular ton warehouse | |||||||
| Nitric acid |
380 | 138,700 | Limited capacity is not a factor | |||||||
| CO2 |
350 | 127,750 | 1,900 tons | |||||||
| (1) | Production capacity for the year is based on daily rated production capacity times 365 days. The number of actual operating days will vary from year to year. |
| (2) | Represents 15,000 tons of storage capacity at the terminal of Agrium U.S.A., Inc., or Agrium, in Niota, Illinois where we have the right to store ammonia pursuant to our distribution agreement with Agrium. Our right to store ammonia at this terminal expires on June 30, 2016, but automatically renews for successive one year periods, unless we deliver a termination notice to Agrium with respect to such storage rights at least three months prior to an automatic renewal. Notwithstanding the foregoing, our right to use the storage space immediately terminates if the distribution agreement terminates in accordance with its terms. See “—Marketing and Distribution.” |
The following table sets forth the amount of products produced by, and shipped from, the East Dubuque Facility for the years ended December 31, 2014, 2013 and 2012:
| For the Years Ended December 31, |
||||||||||||
| 2014 | 2013 | 2012 | ||||||||||
| (in thousands of tons) | ||||||||||||
| Products Produced |
||||||||||||
| Ammonia(1) |
324 | 244 | 293 | |||||||||
| UAN |
269 | 262 | 301 | |||||||||
| Urea (liquid) |
150 | 137 | 139 | |||||||||
| Urea (granular) |
25 | 22 | 23 | |||||||||
| Nitric acid |
105 | 106 | 122 | |||||||||
| CO2 |
82 | 69 | 76 | |||||||||
| Products Shipped |
||||||||||||
| Ammonia |
153 | 103 | 149 | |||||||||
| UAN |
267 | 269 | 291 | |||||||||
| Urea (liquid) |
30 | 21 | 13 | |||||||||
| Urea (granular) |
25 | 22 | 22 | |||||||||
| Nitric acid |
11 | 14 | 14 | |||||||||
| CO2 |
81 | 71 | 76 | |||||||||
| (1) | Ammonia is used in the production of all other products produced by our East Dubuque Facility, except CO2. |
Expansion Projects
In 2014, we completed the urea expansion project at our East Dubuque Facility. As part of the project, we installed an additional CO2 compressor, which increased liquid urea production capacity at our East Dubuque Facility from 460 tons per day to 484 tons per day, or from 167,900 tons annually to 176,660 tons annually. We spent $3.2 million on this project.
We are regularly evaluating or pursuing opportunities to increase our profitability by expanding the East Dubuque Facility’s production capabilities and product offerings, including with the following expansion projects:
| • | Nitric Acid Expansion Project. In 2014, we commenced the replacement of a compressor train in one of our nitric acid plants at our East Dubuque Facility. This project is expected to increase nitric acid production at the facility by 30 tons per day or 11,000 tons annually, and decrease electric power usage. We expect to complete this project during the second quarter of 2015 at a cost of $7.0 million. This project will be funded initially with borrowings under the credit agreement we entered into in July 2014 with General Electric Capital Corporation, or the GE Credit Agreement. |
| • | Ammonia Synthesis Converter Project. We plan to replace the ammonia synthesis converter at our East Dubuque Facility, which is expected to increase reliability, production and plant efficiency. The project is expected to cost approximately $30.0 million and to be completed by the end of 2016. This project will be funded initially with borrowings under the GE Credit Agreement. |
6
Table of Contents
Products
Our East Dubuque Facility’s product sales are heavily weighted toward sales of ammonia and UAN, which together made up 80% or more of our East Dubuque Facility’s total revenues for the years ended December 31, 2014, 2013 and 2012. A majority of our East Dubuque Facility’s products are sold through our distribution agreement with Agrium as described below under “—Marketing and Distribution,” with the exception of CO2, which we sell directly to customers in the food and beverage market at negotiated contract prices. Ammonia and UAN are each sources of nitrogen, but each has its own characteristics, and customers’ preferences for each product vary according to the crop planted, soil and weather conditions, regional farming practices, relative prices and the cost and availability of storage, transportation, handling and application equipment. During the years ended December 31, 2014, 2013 and 2012, we sold more than 90% of our East Dubuque Facility’s nitrogen products to customers for agricultural application, with the remaining portion sold to customers for industrial uses.
Ammonia. Our East Dubuque Facility produces ammonia, the simplest form of nitrogen fertilizer and the feedstock for the production of other nitrogen fertilizers. The ammonia processing unit at our East Dubuque Facility has a current rated capacity of 1,025 tons per day. Our East Dubuque Facility’s ammonia product storage consists of three 20,000 ton tanks and 15,000 tons of leased storage in Niota, Illinois.
UAN. UAN is a liquid fertilizer that has a slight ammonia odor but, unlike ammonia, it does not need to be refrigerated or pressurized when transported or stored. Our East Dubuque Facility has two UAN storage tanks with a combined capacity of 80,000 tons.
Urea. Our East Dubuque Facility’s urea solution is (i) sold in its liquid state, (ii) processed into granular urea through the facility’s urea granulation plant to create dry granular urea, (iii) upgraded into UAN or (iv) upgraded into diesel exhaust fluid, or DEF. We assess market demand for each of these four end products and allocate our East Dubuque Facility’s urea solution as appropriate. We sell liquid urea, including DEF, primarily to industrial customers in the power, ethanol and diesel emissions markets. DEF is a urea-based chemical reactant that is intended to reduce nitrogen oxide emissions in the exhaust systems of certain diesel engines of trucks and off-road farm and construction equipment. Although we believe that there is high demand for our granular urea in agricultural markets, we sell it primarily to customers in specialty urea markets where the spherical shape and consistent size of the granules produced by our curtain granulation technology generally command a premium price. Our East Dubuque Facility has a 12,000 ton capacity bulk warehouse that can be used for storage of dry bulk granular urea.
Nitric Acid. Our East Dubuque Facility produces nitric acid through two separate nitric acid plants at the facility. Nitric acid is either sold to third parties or used within the facility for the production of ammonium nitrate solution, as an intermediate from which UAN is produced. We believe that our East Dubuque Facility currently has sufficient storage capacity available for the nitric acid produced at the facility.
CO2. CO2 is a gaseous product that is co-manufactured with ammonia, with 1.1 tons of CO2 produced per ton of ammonia produced. Our East Dubuque Facility utilizes CO2 in its urea production and has developed a market for CO2 through purification to a food grade liquid CO2. Our East Dubuque Facility has storage capacity for 1,900 tons of CO2. We have multiple CO2 sales agreements that allow for regular shipment of CO2 throughout the year, and our current storage capacity is sufficient to support our CO2 delivery commitments.
Marketing and Distribution
In 2006, we entered into a distribution agreement with Agrium under which a majority of our East Dubuque Facility’s products, including ammonia and UAN, are sold. Pursuant to the distribution agreement, Agrium is obligated to use commercially reasonable efforts to promote the sale of, and to solicit and secure orders from its customers for, ammonia, liquid and granular urea, UAN and nitric acid. Under the distribution agreement, Agrium bears the credit risk on products sold through Agrium pursuant to the agreement. The distribution agreement has a term that ends in April 2016, but automatically renews for subsequent one-year periods, unless either party delivers a termination notice to the other party at least three months prior to an automatic renewal.
7
Table of Contents
During the years ended December 31, 2014, 2013 and 2012, 78% or more of our East Dubuque Facility product sales were through Agrium pursuant to the distribution agreement, and the remainder sold directly to other customers. Our management approves price, quantity and other terms for each sale through Agrium, and we pay Agrium a commission for its services. Our rights under the distribution agreement include the right to store specified amounts of our ammonia for a monthly fee at Agrium’s ammonia terminal in Niota, Illinois, which serves as a distribution point where ammonia produced at our East Dubuque Facility is sold. Our right to store ammonia at Agrium’s terminal expires on June 30, 2016, but automatically renews for successive one year periods, unless we deliver a termination notice to Agrium with respect to such storage rights at least three months prior to an automatic renewal. Notwithstanding the foregoing, our right to use the storage space immediately terminates if the distribution agreement terminates in accordance with its terms. Outside of the distribution agreement, we also sell our East Dubuque Facility’s nitrogen products and CO2 directly to our customers.
Under the distribution agreement, we pay commissions to Agrium on applicable gross sales during the first 10 years of the agreement, not to exceed $5 million during each contract year. The commission rate is 5%. The effective commission rate associated with sales under the distribution agreement was 3.4% for the year ended December 31, 2014, 3.6% for the year ended December 31, 2013 and 2.7% for the year ended December 31, 2012.
Customers
We sell a majority of our East Dubuque Facility’s nitrogen products to customers located in the facility’s core market, which is the area located within an estimated 200-mile radius of the facility. Given the nature of our business, and consistent with industry practice, we generally do not have long-term minimum sales contracts for fertilizer products with any of our customers. The following table shows for the periods presented the percentage of our sales of products to our top five customers and sales to certain specific customers:
| For the Years Ended December 31, |
||||||||||||
| 2014 | 2013 | 2012 | ||||||||||
| Sales of Products to Top 5 Customers |
||||||||||||
| Ammonia, as a % of total ammonia sales |
62 | % | 57 | % | 54 | % | ||||||
| UAN, as a % of total UAN sales |
58 | % | 59 | % | 38 | % | ||||||
| Sales to Customers, as a % of total sales |
||||||||||||
| Agrium (as a direct customer) |
— | 2 | % | 2 | % | |||||||
| Crop Production Services, Inc., or CPS |
12 | % | 12 | % | 9 | % | ||||||
Seasonality and Volatility
Ammonia, UAN and other nitrogen based fertilizer sales are seasonal, based upon planting, growing and harvesting cycles, and product availability. Inventories are accumulated to allow for shipments to customers during the spring and fall fertilizer application seasons, which require significant storage capacity. The accumulation of inventory to be available for seasonal sales creates significant seasonal working capital requirements. This seasonality generally results in higher fertilizer prices during peak fertilizer application periods, with prices normally reaching their highest point in the spring, decreasing in the summer, and increasing again in the fall. Our East Dubuque Facility’s products are sold both on the spot market for immediate delivery and under prepaid contracts for future delivery of products at fixed prices. The terms of the prepaid contracts, including the percentage of the purchase price paid as a down payment, can vary from season to season. Variations in the proportion of product sold through forward sales contracts and variations in the terms of such contracts can increase the seasonal volatility of our cash flows and cause changes in the patterns of seasonal volatility from year-to-year. The cash from prepaid contracts is included in our operating cash flow in the quarter in which the cash is received, while revenue and cost of sales related to prepaid contracts are recognized when products are picked up or delivered and the customer takes title. As a result, the timing of cash received under prepaid contracts may be very different from the timing of recognition of income and expense under those same contracts; significant amounts of profit may be related to cash collected in earlier periods and recorded profits may not be accompanied by a corresponding collection of cash in a particular reporting period. See “Part II—Item 7. Management’s Discussion and Analysis of Financial Condition and Results of Operations.”
Another seasonal factor affecting our industry is the effect of weather-related conditions on the ability to transport products by barge on the Upper Mississippi River. During certain times of the winter, the Upper Mississippi River cannot be used for transport due to lock closures, which could preclude the transportation of nitrogen products by barge during this period and may increase transportation costs. The following table sets forth the percentage of ammonia and UAN tonnage sold that was transported from our East Dubuque Facility by barge:
| For the Years Ended December 31, |
||||||||||||
| 2014 | 2013 | 2012 | ||||||||||
| Ammonia |
— | 4.8 | % | 5.6 | % | |||||||
| UAN |
4.5 | % | — | 1.7 | % | |||||||
8
Table of Contents
The following table shows total tons of our East Dubuque Facility’s products shipped for each quarter presented below:
| For the Years Ended December 31, |
||||||||||||
| 2014 | 2013 | 2012 | ||||||||||
| (in thousands of tons) | ||||||||||||
| Ammonia |
||||||||||||
| Quarter ended March 31 |
7 | 11 | 30 | |||||||||
| Quarter ended June 30 |
72 | 41 | 40 | |||||||||
| Quarter ended September 30 |
27 | 24 | 31 | |||||||||
| Quarter ended December 31 |
47 | 27 | 48 | |||||||||
| UAN |
||||||||||||
| Quarter ended March 31 |
49 | 61 | 34 | |||||||||
| Quarter ended June 30 |
82 | 59 | 92 | |||||||||
| Quarter ended September 30 |
83 | 117 | 110 | |||||||||
| Quarter ended December 31 |
53 | 32 | 55 | |||||||||
| Other Nitrogen Products |
||||||||||||
| Quarter ended March 31 |
16 | 15 | 13 | |||||||||
| Quarter ended June 30 |
17 | 20 | 13 | |||||||||
| Quarter ended September 30 |
16 | 14 | 14 | |||||||||
| Quarter ended December 31 |
17 | 8 | 9 | |||||||||
| CO2 |
||||||||||||
| Quarter ended March 31 |
20 | 23 | 15 | |||||||||
| Quarter ended June 30 |
22 | 24 | 15 | |||||||||
| Quarter ended September 30 |
19 | 21 | 25 | |||||||||
| Quarter ended December 31 |
20 | 3 | 21 | |||||||||
|
|
|
|
|
|
|
|||||||
| Total Tons Shipped |
567 | 500 | 565 | |||||||||
|
|
|
|
|
|
|
|||||||
We typically ship the highest volume of tons from our East Dubuque Facility during the spring planting season, which occurs during the quarter ending June 30 of each year. The next highest volume of tons shipped is typically after the fall harvest during the quarter ending December 31 of each year. However, as reflected in the table above, the seasonal patterns may change substantially from year to year due to various circumstances, including timing of or changes in weather. These seasonal increases and decreases in demand also can cause fluctuations in sales prices. In winter seasons with warmer weather, early planting may shift significant ammonia sales into the quarter ending March 31. Wet or cold weather during the normal spring application season can delay deliveries that would normally occur in the spring. Weather conditions can also affect the mix of demand for our products at various times in the year. Certain weather and soil conditions favor the application of ammonia, while other conditions favor the application of UAN solution.
Raw Materials
The principal raw material used to produce nitrogen fertilizer products at our East Dubuque Facility is natural gas. We have historically purchased natural gas in the spot market, through the use of forward purchase contracts, or a combination of both. We use forward purchase contracts to lock in pricing for a portion of our East Dubuque Facility’s natural gas requirements. These forward purchase contracts are generally either fixed-price or index-price, short term in nature and for a fixed supply quantity. Our general policy is to purchase enough natural gas under fixed-price forward contracts to manufacture the products that have been sold under prepaid contracts for future delivery, effectively fixing a substantial portion of the gross margin on pre-sold product. We sometimes also purchase or fix prices on natural gas in excess of those requirements, when we believe that gas prices are attractive enough to lock in even without matching product pre-sales. We are able to purchase natural gas at competitive prices due to our East Dubuque Facility’s connection to the Northern Natural Gas interstate pipeline system, which is within one mile of the facility, and the facility’s connection to the ANR Pipeline Company, or ANR, pipeline. The pipelines are connected to Nicor Inc.’s, or Nicor’s, distribution system at the Chicago Citygate receipt point and at the Hampshire interconnect, respectively, from which natural gas is transported to the facility. Though we do not typically purchase natural gas for the purpose of resale, we occasionally sell natural gas when purchase commitments exceed production requirements and/or storage capacities, or
9
Table of Contents
when the margin from selling natural gas significantly exceeds the margin from producing additional ammonia. The East Dubuque Facility’s receipt point locations and access to the Chicago Citygate receipt point has allowed us to obtain relatively favorable natural gas prices for sales of our excess natural gas due to our proximity to the stable residential demand for the commodity in Chicago, Illinois. The following table shows the natural gas purchased and used in production:
| For the Years Ended December 31, |
||||||||||||
| 2014 | 2013 | 2012 | ||||||||||
| Volume (MMBtu, or million British thermal units) |
11,487,000 | 8,942,000 | 10,644,000 | |||||||||
We plan to continue to operate our East Dubuque Facility with natural gas as its primary feedstock. Competitors may have access to cheaper natural gas or other feedstocks that could provide them with a cost advantage. Depending on its magnitude, the amount of this cost advantage could offset our savings on transportation and storage costs as a result of our East Dubuque Facility’s location. The following table shows the average prices for natural gas in our cost of sales for the periods presented:
| For the Years Ended December 31, |
||||||||||||
| 2014 | 2013 | 2012 | ||||||||||
| Cost of natural gas ($ per MMBtu) |
$ | 5.00 | $ | 4.16 | $ | 3.59 | ||||||
Changes in the levels of natural gas prices and market prices of nitrogen-based products can materially affect our financial position and results of operations. Natural gas prices in the United States have experienced significant fluctuations over the last several years, increasing substantially in 2008 and subsequently declining to the current lower levels. Several recent discoveries of large natural gas deposits in North America, combined with advances in technology for natural gas production have caused large increases in the estimates of available natural gas reserves and production in the United States, contributing to significant reductions in the market price of natural gas.
In 2014, we entered into fixed-quantity forward purchase contracts at fixed and indexed prices for various delivery dates through June 30, 2015. As of December 31, 2014, the total MMBtus associated with these forward purchase contracts are 3.7 million and the total amount of the purchase commitments are $15.6 million, resulting in a weighted average rate per MMBtu of $4.18 in these commitments. During January and February 2015, we entered into additional fixed-quantity forward purchase contracts at fixed and indexed prices for various delivery dates through December 31, 2015. The total MMBtus associated with these additional forward purchase contracts are 2.7 million and the total amount of the purchase commitments is $7.7 million, resulting in a weighted average rate per MMBtu of $2.88 in these new commitments.
Transportation
In most instances, our East Dubuque Facility’s customers take delivery of nitrogen products at the facility, and then arrange and pay to transport the products to their final destinations by truck. Similarly, under the distribution agreement, neither we nor Agrium is responsible for transportation, and customers that purchase our East Dubuque Facility’s products through Agrium also take delivery of such products at the facility. When products are purchased for delivery at the facility, the customer is responsible for all costs of, and bears all risks associated with, the transportation of products from the facility.
In certain instances, customers take delivery of products at the final destination. In these circumstances, we are responsible for the associated transportation costs. In order to accommodate barge and rail deliveries, we own and operate a barge dock on the Mississippi River, and a rail spur that connects to the Burlington Northern Santa Fe Railway and the Canadian National Railway Company, or Canadian National. We also ship products by barge to our leased storage facility in Niota, Illinois, which provides another distribution point from which our customers may pick up our East Dubuque Facility’s products by truck.
Competition
Our East Dubuque Facility competes with a number of domestic and foreign producers of nitrogen fertilizer products, many of which are larger than us and have significantly greater financial and other resources than we do.
We believe that customers for nitrogen fertilizer products make purchasing decisions principally on the delivered price and availability of the product at the critical application times. Our East Dubuque Facility’s proximity to its customers provides us with a
10
Table of Contents
competitive advantage over producers located further away from those customers. The nitrogen fertilizer facilities closest to our East Dubuque Facility are located about 190 miles away in Fort Dodge, Iowa; 275 miles away in Creston, Iowa; 300 miles away in Port Neal, Iowa; and 350 miles away in Lima, Ohio. Our East Dubuque Facility’s physical location in the center of the Mid Corn Belt provides the facility with a transportation cost advantage compared to other producers who must ship their products over greater distances to our East Dubuque Facility’s market area. The combination of our East Dubuque Facility’s proximity to its customers and our storage capacity at the facility allows customers to better time the pick-up and application of our products, as deliveries from more distant locations have a greater risk of missing the short periods of favorable weather conditions during which the application of nitrogen fertilizer and planting may occur. However, other producers of nitrogen fertilizer products are constructing or contemplating the construction of new nitrogen fertilizer facilities in North America, including in the Mid Corn Belt. For example, Orascom Construction Industries Company, or OCI, an Egyptian producer of fertilizer products, has announced that a wholly owned subsidiary of OCI is constructing a facility located 165 miles away from our East Dubuque Facility that is designed to produce between 1.5 to 2.0 million metric tons per year of ammonia, urea, UAN and DEF and that it expects the facility to be operational in late 2015. If a new nitrogen fertilizer facility is completed in our East Dubuque Facility’s core market, it could benefit from the same competitive advantage associated with the location of our East Dubuque Facility. The completion of such a facility could have a material adverse effect on our results of operations, financial condition and ability to make cash distributions to our unitholders.
Our Pasadena Facility
On November 1, 2012, we completed our acquisition of 100% of the membership interests of Agrifos LLC, or Agrifos, from Agrifos Holdings Inc., or the Seller, pursuant to a Membership Interest Purchase Agreement, or the Purchase Agreement. Upon the closing of this transaction, or the Agrifos Acquisition, Agrifos became our wholly owned subsidiary and its name changed to Rentech Nitrogen Pasadena Holdings, LLC. Rentech Nitrogen Pasadena Holdings, LLC owns all of the member interests in RNPLLC, which owns and operates the Pasadena Facility.
Our Pasadena Facility is located on an 85 acre site located on the Houston Ship Channel which includes 2,700 linear feet of water frontage and two deep-water docks. The property also includes 415 acres of land, which contains phosphogypsum stacks. In early 2011 prior to our ownership, the Pasadena Facility ceased production of diammonium phosphate and monoammonium phosphate. Agrifos undertook major capital and maintenance projects at the Pasadena Facility, including decommissioning certain phosphate production assets, and converting a portion of the Pasadena Facility’s assets to the production of ammonium sulfate fertilizer. Ammonium sulfate is now the primary product of the Pasadena Facility. Following the conversion, the Pasadena Facility continues to produce sulfuric acid and ammonium thiosulfate.
Our Pasadena Facility is the largest producer of synthetic ammonium sulfate and the third largest producer of ammonium sulfate in North America. We believe that our ammonium sulfate has several characteristics that distinguish it from competing products. In general, the ammonium sulfate that is available for sale in our industry is a byproduct of other processes and does not have certain characteristics valued by customers. Our ammonium sulfate is sized to the specifications preferred by customers and may more easily be blended with other fertilizer products. We also believe that our ammonium sulfate has a longer shelf-life, is more stable and is more easily transported and stored than many other competing products.
In late 2014, we restructured operations at our Pasadena Facility. As part of the restructuring, our Pasadena Facility reduced expected annual production of ammonium sulfate by approximately 25 percent, to 500,000 tons. We intend to sell approximately 70 percent of the 500,000 tons in the domestic market and the remaining tons in New Zealand and Australia, which are the international markets with the highest net prices for ammonium sulfate. Our sales plan eliminates historically low-margin sales to Brazil, other than modest amounts expected during peak seasons when higher margins may be achievable. Our restructuring plan provides us the flexibility to increase ammonium sulfate production above the 500,000 ton rate, if market conditions are favorable.
We are evaluating opportunities to build terminalling assets on the site of our Pasadena Facility. We do not expect to invest significant amounts of our own capital in such assets, but expect to work with a joint venture partner on any such development.
The following table sets forth our Pasadena Facility’s current rated production capacity for the listed products in tons per day and tons per year, and our product storage capacity.
| Approximate Production Capacity | ||||||||||||
| Product |
Tons /Day | Tons /Year(1) | Product Storage Capacity | |||||||||
| Ammonium sulfate |
2,100 | 693,000 | 60,000 tons | |||||||||
| Sulfuric acid |
1,750 | 638,750 | 27,000 tons | |||||||||
| Ammonium thiosulfate |
220 | 80,300 | 14,000 tons | |||||||||
| (1) | Ammonium sulfate production capacity for the year is based on daily rated production capacity times 330 days given regular required cleanings of the granulator. Actual production, based on the restructuring plan, is expected to be 500,000 tons per year. Sulfuric acid and ammonium thiosulfate production capacities for the year are based on daily rated production capacity times 365 days. The number of actual operating days will vary from year to year. |
11
Table of Contents
The following table sets forth the amount of products produced by, and shipped from, our Pasadena Facility for the years ended December 31, 2014 and 2013 and the period beginning November 1, 2012 (the closing date of the Agrifos Acquisition) through December 31, 2012:
| For the Years Ended December 31, |
For the Period November 1, 2012 Through December 31, |
|||||||||||
| 2014 | 2013 | 2012 | ||||||||||
| (in thousands of tons) | ||||||||||||
| Products Produced |
||||||||||||
| Ammonium sulfate |
522 | 465 | 88 | |||||||||
| Sulfuric acid(1) |
447 | 478 | 69 | |||||||||
| Ammonium thiosulfate |
63 | 60 | 9 | |||||||||
| Products Shipped |
||||||||||||
| Ammonium sulfate |
572 | 428 | 115 | |||||||||
| Sulfuric acid |
112 | 148 | 27 | |||||||||
| Ammonium thiosulfate |
67 | 54 | — | |||||||||
| (1) | Our Pasadena Facility produces sulfuric acid primarily for the production of ammonium sulfate. |
Expansion Projects and Other Significant Capital Projects
In 2014, we substantially completed the power generation project and completed the sulfuric acid converter project at our Pasadena Facility. In the power generation project, we installed a steam turbine/generator set that uses excess steam produced from the sulfuric acid plant at the facility to produce electrical power. We expect that a portion of the power will be used in our Pasadena Facility, reducing electricity expenses, and the remaining power will be sold in the deregulated Texas power market, creating an additional revenue stream. We spent $30.8 million on this project through December 31, 2014. We replaced the sulfuric acid converter for a cost of $16.7 million.
Products
Our Pasadena Facility’s products are applied to many types of crops including soybeans, potatoes, cotton, canola, alfalfa, corn and wheat. Our Pasadena Facility’s product sales are heavily weighted toward sales of ammonium sulfate, which made up 80% or more of our Pasadena Facility’s total revenues for the years ended December 31, 2014 and 2013. Our Pasadena Facility’s products are sold primarily through distribution agreements as described below under “—Marketing and Distribution.”
Ammonium Sulfate. Ammonium sulfate is a solid dual-nutrient fertilizer produced by combining ammonia and sulfuric acid. The sulfur derived from ammonium sulfate is the form of sulfur most available as a nutrient for crops. Our Pasadena Facility produces ammonium sulfate that is sized to the specifications of other nitrogen, phosphate and potash fertilizer products which results in less segregation in blended products. The ammonium sulfate plant at our Pasadena Facility has a current rated capacity of 2,100 tons per day. Our Pasadena Facility has storage capacity for 60,000 tons of ammonium sulfate. In addition, we have an arrangement with Interoceanic Corporation, or IOC, that permits us to store approximately 60,000 tons of ammonium sulfate at IOC-controlled terminals, which are located near end customers of our Pasadena Facility’s ammonium sulfate.
Sulfuric Acid. Sulfuric acid not used for production of ammonium sulfate is sold to third parties. The majority of the sulfuric acid sold by our Pasadena Facility is sold through a distributor to industrial consumers. Our Pasadena Facility has storage capacity for 27,000 tons of sulfuric acid.
Ammonium Thiosulfate. Ammonium thiosulfate is a liquid fertilizer. Ammonium thiosulfate typically is combined with UAN to help increase the efficiency of nitrogen in crops. Our Pasadena Facility has storage capacity for 14,000 tons of ammonium thiosulfate.
12
Table of Contents
Marketing and Distribution
We sell substantially all of our Pasadena Facility’s products through marketing and distribution agreements. Pursuant to an exclusive marketing agreement we have entered into with IOC, IOC has the exclusive right and obligation to market and sell all of our Pasadena Facility’s ammonium sulfate product. Under the marketing agreement, IOC is required to use commercially reasonable efforts to market the product to obtain the most advantageous price. We compensate IOC for transportation and storage costs relating to the ammonium sulfate product it markets through the pricing structure under the marketing agreement. The marketing agreement has a term that ends December 31, 2016, but automatically renews for subsequent one-year periods (unless either party delivers a termination notice to the other party at least 210 days prior to an automatic renewal). The marketing agreement may be terminated prior to its stated term for specified causes. During the years ended December 31, 2014 and 2013, the marketing agreement with IOC accounted for all of our Pasadena Facility’s ammonium sulfate revenues. The ammonium sulfate storage arrangement with IOC currently is not governed by a written contract. We also have marketing and distribution agreements to sell other products that automatically renew for successive one year periods.
Customers
We sell substantially all of the products from our Pasadena Facility to IOC and our other distributors, and we do not have direct contact with our distributors’ customers. Our distributors sell a majority of our Pasadena Facility’s products to customers located west of the Mississippi River. Through our distributors, we sold all of our Pasadena Facility’s nitrogen products to customers for agricultural uses during the years ended December 31, 2014 and 2013 . Given the nature of our business, and consistent with industry practice, we do not have direct sales contracts for fertilizer products with any of our end customers. The majority of the sulfuric acid our Pasadena Facility sells to its distributor is placed with industrial consumers.
Seasonality and Volatility
Significant seasonal weather factors have affected demand for and timing of deliveries for our Pasadena Facility’s domestic agricultural products. Domestic prices for ammonium sulfate and ammonium thiosulfate normally reach their highest point in the spring, decreasing in the summer, and increasing again in the fall. Sales prices of these products are adjusted seasonally in order to facilitate distribution of the products throughout the year. Sales to Australia, Brazil and New Zealand may partially offset this domestic seasonal pattern because they are in the southern hemisphere. We operate the ammonium sulfate plant at our Pasadena Facility throughout the year to the extent that there is available storage capacity for this product. We manage our storage capacity by distributing the product through IOC to customers in both domestic and offshore markets throughout the year. If storage capacity were to be insufficient, we would be forced to cease or reduce production of the product until storage capacity became available. Our Pasadena Facility’s ammonium sulfate product is delivered to IOC and sold at prevailing market prices. See “Part II—Item 7. Management’s Discussion and Analysis of Financial Condition and Results of Operations.”
Because we sell sulfuric acid through a distributor to industrial consumers, demand for this product generally is constant during the year. Sales of industrial products, such as sulfuric acid, are generally not impacted by seasons and weather. We typically ship sulfuric acid from our Pasadena Facility each month of the year with the majority of the product sold under annual contracts.
Raw Materials
The principal raw materials used to produce nitrogen fertilizer products at our Pasadena Facility are ammonia and sulfur. We purchase ammonia for use at the facility from OCI Beaumont, LLC, or OCI Beaumont. OCI Beaumont operates an ammonia and methanol production facility on the Neches River in Nederland, Texas just outside of Beaumont, Texas. Ammonia pricing is based on a published Tampa, Florida market index that is set on a quarterly basis through negotiations between large industry producers and consumers, or the Tampa Index. The Tampa Index is commonly used in annual contracts for both the agricultural and industrial sectors, and is based on the most recent major industry transactions in the Tampa market. Pricing considerations for ammonia incorporate international supply-demand, ocean freight and production factors. An 1,800 short ton ammonia barge delivers ammonia from Beaumont, Texas to our Pasadena Facility, pursuant to a long term lease we entered into with Port Arthur Towing Company. Ammonia purchased and used in production at our Pasadena Facility was 155,000 tons in the year ended December 31, 2014 and 128,000 tons in the year ended December 31, 2013.
We obtain sulfur for our Pasadena Facility primarily by truck from local refineries in the Houston area and, to a lesser extent, by rail car. Major suppliers of sulfur to our Pasadena Facility include refiners, such as Phillips 66 Company, Shell Oil Products U.S. and Valero Energy Corporation. Our contracts with these refiners generally have a term of one year. Once pricing for the first quarter of a year is negotiated, the price then fluctuates up or down each subsequent quarter based on changes to the Tampa Index. Sulfur purchased and used in production at our Pasadena Facility was 194,000 tons in the year ended December 31, 2014 and 172,000 tons in the year ended December 31, 2013.
13
Table of Contents
Transportation
Our Pasadena Facility is located on the Houston Ship Channel with access to various modes of transportation at favorable prices. The facility has two deep-water docks and access to the Mississippi waterway system and key international waterways. The docks at the facility are suitable for loading and unloading bulk or liquid barges with payloads of up to 35,000 tons. The facility is also connected to key domestic railways which permit the efficient, cost-effective distribution of its products west of the Mississippi River. We believe this provides a significant cost advantage relative to producers located on the East Coast that are forced to switch railways when shipping product to this region. Our location on the Houston Ship Channel allows our distributors or us to use low cost barge and vessel transport when selling products and purchasing feedstocks.
Competition
Our Pasadena Facility competes with a number of domestic and foreign producers of nitrogen fertilizer products, many of which are larger than we are and have significantly greater financial and other resources than we do. We believe that customers who purchase the product make purchasing decisions based, in part, on the product’s size and shelf life. The majority of ammonium sulfate produced in North America and globally is generated as a byproduct of another process. We believe that our ammonium sulfate (which we refer to as synthetic ammonium sulfate) is made specifically for fertilizer, is sized to the specifications preferred by customers, is more easily blended with other fertilizer products and is better suited for use in agricultural application equipment. We also believe that our ammonium sulfate has a longer shelf-life, is more stable and is more easily transported and stored than many other competing products. Honeywell International Inc., or Honeywell, the largest producer of ammonium sulfate in the United States is located in Hopewell, Virginia, about 1,350 miles away from our Pasadena Facility. BASF AG, the second largest producer of ammonium sulfate, is located in Freeport, Texas, about 60 miles away from our Pasadena Facility. Our Pasadena Facility has access to transportation at favorable prices, such as low cost barge and vessel. We believe that our close proximity to sources of our primary feedstocks and access to low-cost transportation enables the facility to offer competitive pricing to customers adjacent to and west of the Mississippi River.
We also face competition from numerous regional producers of sulfuric acid, including E. I. du Pont de Nemours and Company located in El Paso and La Porte, Texas and Burnside, Louisiana, Eco Services located in Baytown and Houston, Texas and Chemtrade Logistics Inc., located in Beaumont, Texas.
Growth Plans
We seek to continue to organically expand capacity at our Fertilizer Facilities, although any such expansion projects are likely to be smaller than the ongoing or recently-completed capacity expansions at each facility. We expect any expansion project to require new capital as we do not expect to use our operating cash flow to invest in any new growth projects. Expansion projects involve numerous risks and uncertainties, and there can be no assurance that we will be able to complete any expansion projects on a timely basis or at all.
Environmental Matters
Our business is subject to extensive and frequently changing federal, state and local, environmental, health and safety regulations governing a wide range of matters, including the emission of air pollutants, the release of hazardous substances into the environment, the treatment and discharge of waste water and the storage, handling, use and transportation of our fertilizer products, raw materials, and other substances that are part of our operations. These laws include the Clean Air Act, or the CAA, the federal Water Pollution Control Act, or the Clean Water Act, the Resource Conservation and Recovery Act, or RCRA, the Comprehensive Environmental Response, Compensation and Liability Act, or CERCLA, the Toxic Substances Control Act, or the TSCA, and various other federal, state and local laws and regulations. These laws, their underlying regulatory requirements and the enforcement thereof impact us by imposing:
| • | restrictions on operations or the need to install enhanced or additional controls; |
| • | the need to obtain and comply with permits and authorizations; |
| • | liability for the investigation and remediation of contaminated soil and groundwater at current and former facilities (if any) and off-site waste disposal locations; and |
| • | specifications for the products we market. |
14
Table of Contents
These laws significantly affect our operating activities as well as the level of our operating costs and capital expenditures. Failure to comply with environmental laws, including the permits issued to us thereunder, generally could result in substantial fines, penalties or other sanctions, court orders to install pollution-control equipment, permit revocations and facility shutdowns. The following table shows capital expenditures related to environmental, health and safety at the East Dubuque Facility and the Pasadena Facility:
| For the Years Ended December 31, |
||||||||||||
| 2014 | 2013 | 2012 | ||||||||||
| (in millions) | ||||||||||||
| East Dubuque Facility |
$ | 0.2 | $ | 0.2 | $ | 0.3 | ||||||
| Pasadena Facility |
0.2 | 0.3 | 1.0 | |||||||||
Our operations require numerous permits and authorizations. A decision by a governmental regulator to revoke or substantially modify an existing permit or authorization could have a material adverse effect on our ability to continue operations at the impacted facility. Expansion of our operations is predicated upon obtaining the necessary environmental permits and authorizations. We may experience delays in obtaining or be unable to obtain required permits, which may delay or interrupt our operations and limit our growth and revenue.
In addition, environmental, health and safety laws may impose joint and several liability, without regard to fault, for cleanup of a contaminated site on current owners and operators of the site, former owners and operators of the site at the time of the disposal of the hazardous substances, any person who arranges for the transportation, disposal or treatment of the hazardous substances, and the transporters who select the disposal and treatment facilities, regardless of the care exercised by such persons. Private parties, including the owners of properties adjacent to other facilities where our wastes are taken for disposal, also may have the right to pursue legal actions to enforce compliance as well as to seek damages for non-compliance with environmental laws and regulations or for personal injury or property or natural resource damages. In addition, the risk of accidental spills or releases could expose us to significant liabilities that could have a material adverse effect on our business, financial condition or results of operations.
The laws and regulations to which we are subject are complex, change frequently and have tended to become more stringent over time. The ultimate impact on our business of complying with existing laws and regulations is not always clearly known or determinable due in part to the fact that our operations may change over time and certain implementing regulations for laws, such as the CAA, have not yet been finalized, are under governmental or judicial review or are being revised. These laws and regulations could result in increased capital, operating and compliance costs.
Our facilities have experienced some level of regulatory scrutiny in the past, and we may be subject to further regulatory inspections, future requests for investigation or assertions of liability relating to environmental issues. In the future, we could incur material liabilities or costs related to environmental matters, and these environmental liabilities or costs (including fines or other sanctions) could have a material adverse effect on our results of operations, financial condition and ability to make cash distributions.
Certain environmental regulations and risks associated with our business are outlined below. We strive to maintain compliance with these regulations; however, they are complex and varied, and our operations are heavily regulated, and we may, from time to time, fall out of compliance. For example, the Pasadena Facility may not comply with wastewater and stormwater discharge requirements and solid and hazardous waste requirements. As another example, the Illinois Environmental Protection Agency, or the IEPA, alleged that an ammonia release at our East Dubuque Facility violated environmental laws, and we entered into a settlement agreement with the IEPA in August 2013 requiring us to connect a device at the facility to an ammonia safety flare by December 1, 2015.
The Federal Clean Air Act. The CAA and its implementing regulations, as well as the corresponding state laws and regulations that regulate emissions of pollutants into the air, impose permitting and emission control requirements relating to specific air pollutants, as well as the requirement to maintain a risk management program to help prevent accidental releases of certain substances. Standards promulgated pursuant to the CAA may require that we install controls at or make other changes to our facilities. If new controls or changes to operations are needed, the costs could be significant. In addition, failure to comply with the requirements of the CAA and its implementing regulations could result in substantial fines, civil or criminal penalties, or other sanctions.
The regulation of air emissions under the CAA requires that we obtain various construction and operating permits, including Title V air permits and incur capital expenditures for the installation of certain air pollution control devices at our facilities. Measures have been taken to comply with various regulations specific to our operations, such as National Emission Standard for Hazardous Air Pollutants, New Source Performance Standards and New Source Review. We have incurred, and expect to continue to incur, substantial capital expenditures to maintain compliance with these and other air emission regulations that have been promulgated or may be promulgated or revised in the future. As one example, we entered into a consent decree that required us to take action to achieve compliance with the emissions limits and other requirements applicable to our East Dubuque Facility.
15
Table of Contents
In July 2011, we voluntarily began operating what we believe is the first tertiary nitrous oxide, or N2O, catalytic converter in the United States on one of our nitric acid plants at our East Dubuque Facility. This converter is designed to convert approximately 90% of the N2O generated in our production of nitric acid into nitrogen and oxygen at that one plant. During the year ended December 31, 2014, 91%, or 331 metric tonnes, of N2O generated by that plant was converted into nitrogen and oxygen. In late December 2013, we installed a N2O abatement catalyst in the other nitric acid plant at our East Dubuque Facility. This catalyst is also designed to convert approximately 90% of the N2O generated in our production of nitric acid into nitrogen and oxygen. During the year ended December 31, 2014, 93%, or 340 metric tonnes, of N2O generated by that plant was converted into nitrogen and oxygen. We monitor and record the reduction in N2O emissions, which is verified by a third party. We have listed the credits on an active registry, such as the Climate Registry maintained by the Climate Action Reserve, and sell the credits for a profit. We have entered into a five-year agreement to supply emission reduction credits with sales totaling $0.5 million for the year ended December 31, 2014 and $0.1 million during each of the years ended December 31, 2013 and 2012.
Release Reporting. The release of hazardous substances or extremely hazardous substances into the environment is subject to release reporting requirements under federal and state environmental laws, including the Emergency Planning and Community Right-to-Know Act. We occasionally experience releases of hazardous or extremely hazardous substances from our operations or properties. We report such releases to the EPA, the IEPA, the Texas Commission on Environmental Quality, and other relevant federal, state and local agencies as required by applicable laws and regulations. If we fail to properly report a release, or if the release violates the law or our permits, it could cause us to become the subject of a governmental enforcement action or third-party claims. Government enforcement or third-party claims relating to releases of hazardous or extremely hazardous substances could result in significant expenditures and liability.
Clean Water Act. The Clean Water Act and analogous state laws impose restrictions and strict controls with respect to the discharge of pollutants, including spills and leaks of oil and other substances, into waters of the United States. The discharge of pollutants into regulated waters is prohibited, except in accordance with the terms of a permit issued by the EPA or an analogous state agency. The Clean Water Act and regulations implemented thereunder also prohibit the discharge of dredge and fill material into regulated waters, including wetlands, unless authorized by an appropriately issued permit. In addition, the Clean Water Act and analogous state laws require individual permits or coverage under general permits for discharges of storm water runoff from certain types of facilities. Spill prevention, control and countermeasure requirements of federal laws require appropriate containment berms and similar structures to help prevent the contamination of navigable waters by a petroleum hydrocarbon tank spill, rupture or leak. Federal and state regulatory agencies can impose administrative, civil and criminal penalties for non-compliance with discharge permits or other requirements of the Clean Water Act and analogous state laws and regulations.
Greenhouse Gas Emissions. Legislative and regulatory measures to address greenhouse gas, or GHG, emissions (including CO2, methane and N2O) are in various phases of discussion or implementation. At the federal legislative level, Congress has previously considered legislation requiring a mandatory reduction of GHG emissions. Although Congressional passage of such legislation does not appear imminent at this time, it could be adopted at a future date. It is also possible that Congress may pass alternative climate change bills that do not mandate a nationwide cap-and-trade program and instead focus on promoting renewable energy and energy efficiency or impose a carbon fee.
Management of Hazardous Substances and Contamination. Under CERCLA and related state laws, certain persons may be liable at sites where or from release or threatened release of hazardous substances has occurred or is threatened. These persons can include the current owner or operator of property where a release or threatened release occurred, any persons who owned or operated the property when the release occurred, and any persons who disposed of, or arranged for the transportation or disposal of, hazardous substances at a contaminated property. Liability under CERCLA is strict, retroactive and, under certain circumstances, joint and several, so that any responsible party may be held liable for the entire cost of investigating and remediating the release of hazardous substances. RCRA regulates the generation, treatment, storage, handling, transportation and disposal of solid waste and requires states to develop programs to ensure the safe disposal of solid waste. Under RCRA, persons may be liable at sites where the past or present storage, handling, treatment, transportation, or disposal of any solid or hazardous waste may present an imminent and substantial endangerment to health or the environment. These persons can include the current owner or operator of property where disposal occurred, any persons who owned or operated the property when the disposal occurred, and any persons who disposed of, or arranged for the transportation or disposal of, hazardous substances at a contaminated property. Liability under RCRA is strict and, under certain circumstances, joint and several, so that any responsible party may be held liable for the entire cost of investigating and remediating the release of hazardous substances. As is the case with all companies engaged in similar industries, depending on the underlying facts and circumstances we face potential exposure from future claims and lawsuits involving environmental matters, including soil and water contamination, personal injury or property damage allegedly caused by hazardous substances that we manufactured, handled, used, stored, transported, spilled, disposed of or released. We cannot assure you that we will not become involved in future proceedings related to our release of hazardous or extremely hazardous substances or that, if we were held responsible for damages in any existing or future proceedings, such costs would be covered by insurance or would not be material. For a discussion of hazardous substances management at the Pasadena Facility, see the risk factor captioned “There are phosphogypsum
16
Table of Contents
stacks located at the Pasadena Facility that will require closure. In the event we become financially obligated for the costs of closure, this would have a material adverse effect on our business, cash flow and ability to make cash distributions to our unitholders.” For a discussion of releases at the Pasadena Facility, see the risk factor captioned “Soil and groundwater at the Pasadena Facility is pervasively contaminated, and we may incur costs to investigate and remediate known or suspected contamination at the Pasadena Facility. We may also face legal actions or sanctions or incur costs related to contamination or noncompliance with environmental laws at the facility.”
Underground Injection Operations. Underground injection operations are subject to the Safe Drinking Water Act, or SWDA, as well as analogous state laws and regulations. Under the SWDA, the EPA established the underground injection control, or UIC program, which includes requirements for permitting, testing, monitoring, record keeping, and reporting of injection well activities, as well as a prohibition against the migration of fluid containing any contaminant into underground sources of drinking water. ExxonMobil Corporation (a former owner of the Pasadena Facility), or ExxonMobil, operates injection wells located at or surrounded by our Pasadena Facility for the disposal of wastewater related to the phosphogypsum stacks. State regulations require that a permit be obtained from the applicable regulatory agencies to operate underground injection wells. Any leakage from the subsurface portions of the injection wells could cause degradation of fresh groundwater resources, potentially resulting in suspension of ExxonMobil’s UIC permit, which could adversely impact the closure of the phosphogypsum stacks.
Environmental Insurance. We have a premises pollution liability insurance policy which covers third party bodily injury and property damages claims, remediation costs and associated legal defense expenses for pollution conditions at or migrating from our facilities and the transportation risks associated with moving waste from our facilities to offsite locations for unloading or depositing waste. The policy also covers business interruptions and non-owned disposal sites. Our policy is subject to a limit and self-insured retention and contains other terms, exclusions, conditions and limitations that could apply to a particular pollution condition claim, including the closure post closure of the gypsum stacks (the responsibility of ExxonMobil) and we cannot guarantee that a claim will be adequately insured for all potential damages.
Safety, Health and Security Matters
We are subject to a number of federal and state laws and regulations related to safety, including the federal Occupational Safety and Health Act, or OSHA, and comparable state statutes, the purpose of which are to protect the health and safety of workers. Various OSHA standards may apply to our operations, including standards concerning notices of hazards, safety in excavation and demolition work, the handling of asbestos and asbestos-containing materials and worker training and emergency response programs. We also are subject to OSHA Process Safety Management regulations, which are designed to prevent or minimize the consequences of catastrophic releases of toxic, reactive, flammable or explosive chemicals. These regulations apply to any process that involves a chemical at or above the specified thresholds or any process that involves flammable liquid or gas, pressurized tanks, caverns and wells in excess of 10,000 pounds at various locations. We have an internal safety, health and security program designed to monitor and enforce compliance with worker safety requirements. We also are subject to EPA Chemical Accident Prevention Provisions, known as the Risk Management Plan requirements, which are designed to prevent the accidental release of toxic, reactive, flammable or explosive materials, and the United States Coast Guard’s Maritime Security Standards for Facilities, which are designed to regulate the security of high-risk maritime facilities.
Employees
As of December 31, 2014, we had 101 non-unionized and salaried employees, and 166 unionized employees. We believe that we have good relations with our employees. We have collective bargaining agreements in place covering unionized employees at our East Dubuque Facility and our Pasadena Facility. The agreement for the East Dubuque Facility expires on October 17, 2016. There are two agreements for the Pasadena Facility. One agreement expires on March 28, 2016 and the other expires on April 30, 2016. We have not experienced work stoppages in the recent past.
Financial Information
We operate in two business segments. All of our properties are located in the United States and all of the related revenues are derived from purchasers located in the United States. Our financial information is included in “Part II—Item 8. Financial Statements and Supplementary Data.”
Properties
We operate our East Dubuque Facility on a 210 acre site in East Dubuque, Illinois adjacent to the Mississippi River. We own the land, buildings, several special purpose structures, equipment, storage tanks and specialized truck, rail and river barge loading facilities, and hold easements for the roadways, wells, the rail track and the barge dock. We also have the right to store 15,000 tons of ammonia at Agrium’s terminal in Niota, Illinois. See “—Our East Dubuque Facility—Marketing and Distribution.”
17
Table of Contents
We operate our Pasadena Facility on an 85 acre site in Pasadena, Texas located on the Houston Ship Channel which includes 2,700 linear feet of water frontage and two deep-water docks. The property also includes 415 acres of unused land which contains phosphogypsum stacks. In addition, we have an arrangement with IOC that permits us to store approximately 60,000 tons of ammonium sulfate at IOC-controlled terminals, which are located near end customers of our Pasadena Facility’s ammonium sulfate. This arrangement currently is not governed by a written contract. See “—Our Pasadena Facility—Marketing and Distribution.”
Available Information
Our Annual Report on Form 10-K, Quarterly Reports on Form 10-Q, Current Reports on Form 8-K and amendments to those reports are available free of charge as soon as reasonably practical after they are filed or furnished to the SEC, at the “Investor Relations” portion of our website, www.rentechnitrogen.com. Materials we file with the SEC may be read and copied at the SEC’s Public Reference Room at 100 F Street, NE, Washington, D.C. 20549. Information on the operation of the Public Reference Room may be obtained by calling the SEC at 1-800-SEC-0330. The SEC also maintains an Internet website at www.sec.gov that contains reports and other information regarding us that we file electronically with the SEC. The information contained on our website does not constitute part of this report.
Set forth below are certain risk factors related to our business. Actual results could differ materially from those anticipated as a result of these and various other factors, including those set forth in our other periodic and current reports filed with the SEC, from time to time. If any risks or uncertainties develop into an actual event, our business, financial condition, cash flow or results of operations could be materially adversely affected. In that case, we might not be able to pay distributions on our common units, the trading price of our common units could decline and you could lose all or part of your investment. Although many of our business risks are comparable to those faced by a corporation engaged in a similar business, limited partner interests are inherently different from the capital stock of a corporation and involve additional risks described below.
Risks Related to Our Business
We may not have sufficient cash available for distribution to pay any quarterly distributions on our common units.
We may not have sufficient cash available for distribution each quarter to enable us to pay any distributions to our common unitholders. Furthermore, our partnership agreement does not require us to pay distributions on a quarterly basis or otherwise. The amount of cash we will be able to distribute on our common units principally depends on the amount of cash flow we generate from our operations, which is directly dependent upon the operating margins we generate, which have been volatile historically, and cash collections under prepaid contracts for our products. Our operating margins are significantly affected by the price and availability of natural gas, ammonia and sulfur, market-driven product prices we are able to charge our customers and our production costs, as well as seasonality, weather conditions, governmental regulation, unplanned maintenance or shutdowns at our facilities and global and domestic demand for nitrogen fertilizer products, among other factors. In addition:
| • | Our partnership agreement does not provide for any minimum quarterly distribution and our quarterly distributions, if any, will be subject to significant fluctuations directly related to the cash flow we generate after payment of our expenses due to the nature of our business. |
| • | The amount of distributions we make, if any, and the decision to make any distribution at all is determined by the board of directors of our general partner, whose interests may differ from those of our common unitholders. Our general partner has limited fiduciary and contractual duties, which may permit it to favor its own interests or the interests of Rentech to the detriment of our common unitholders. |
| • | The $320.0 million aggregate principal amount of 6.5% second lien senior secured notes due 2021, or the Notes, and the GE Credit Agreement limit, and any credit facility or other debt instruments we enter into in the future may limit, the distributions that we can make. Our Notes and GE Credit Agreement contain, and any future credit facility or debt instruments we enter into may contain, financial tests and covenants that we must satisfy prior to making distributions. Any failure to comply with these tests and covenants could result in the applicable lenders prohibiting distributions by us. |
| • | The amount of cash available to pay any quarterly distribution to our unitholders depends primarily on our cash flow, and not solely on our profitability, which is affected by non-cash items that may be large relative to our reported net income. As a result, we may make distributions during periods when we record losses and may not make distributions during periods when we record net income. |
18
Table of Contents
| • | The actual amount of cash available for distribution will depend on numerous factors, some of which are beyond our control, including the availability and price of natural gas, ammonia and sulfur, our operating costs, global and domestic demand for nitrogen fertilizer products, fluctuations in our capital expenditures and working capital needs, our product pre-sale and cash collection cycle and the amount of fees and expenses we incur. |
| • | Under Section 17-607 of the Delaware Revised Uniform Limited Partnership Act, or Delaware Act, we are prohibited from making a distribution to our limited partners if the distribution would cause our liabilities to exceed the fair value of our assets. |
The amount of our quarterly cash distributions, if any, will vary significantly both quarterly and annually and will be directly dependent on the performance of our business. Unlike most publicly traded limited partnerships, we do not have a minimum quarterly distribution or employ structures intended to consistently maintain or increase distributions over time.
Investors who are looking for an investment that will pay regular and predictable quarterly distributions should not invest in our common units. We expect our business performance will be more seasonal and volatile, and our cash flow will be less stable, than the business performance and cash flow of most publicly traded limited partnerships. Our quarterly distributions per common unit have been as high as $1.17 and as low as $0.05. Our cash available for distribution was negative in the fourth quarter of 2013. Accordingly, our quarterly cash distributions have been and will be volatile and are expected to vary quarterly and annually. Unlike most publicly traded limited partnerships, we do not have a minimum quarterly distribution or employ structures intended to consistently maintain or increase distributions over time. The amount of our quarterly cash distributions will be directly dependent on the performance of our business, which has been volatile historically for reasons including volatile nitrogen fertilizer and natural gas prices, unplanned outages, seasonal and global fluctuations in demand for nitrogen fertilizer products and the timing of our product pre-sale and cash collections. Because our quarterly distributions will be subject to significant fluctuations directly related to the cash flow we generate after payment of our fixed and variable expenses, future quarterly distributions paid to our unitholders will vary significantly from quarter to quarter and may be zero. Given the seasonal nature of our business, we expect that our unitholders will have direct exposure to fluctuations in the margins we realize on sales of nitrogen fertilizers and other products that we produce. In addition, we frequently make product sales pursuant to prepaid contracts, whereby we receive cash in respect of product to be picked up by or delivered to a customer at a later date, but do not record revenue in respect of such sales until product is picked up or delivered. The cash received from product prepayments increases our operating cash flow in the quarter in which the cash is received, but may effectively reduce our operating cash flow in a subsequent quarter if the cash was received in a quarter prior to the one in which the revenue is recorded.
We may modify or revoke our cash distribution policy at any time at our discretion. Our partnership agreement does not require us to make any distributions at all.
Our current cash distribution policy is to distribute all of the cash available for distribution we generate each quarter to unitholders of record on a pro rata basis. However, we may change such policy at any time at our discretion and could elect not to make distributions for one or more quarters. Our partnership agreement does not require us to make any distributions at all. Accordingly, investors are cautioned not to place undue reliance on the permanence of such a policy in making an investment decision. Any modification or revocation of our cash distribution policy could substantially reduce or eliminate the amounts of distributions to our unitholders.
Our operations may become unprofitable and may require substantial working capital financing.
In recent years, we have generated positive income from operations and positive cash flow from operations. However, in the past, we sustained losses and negative cash flow from operations. Our profits and cash flow are subject to changes in the prices for our products and our main inputs, natural gas, ammonia and sulfur, which are commodities, and, as such, the prices can be volatile in response to numerous factors outside of our control. For example, during the year ended December 31, 2014, the market prices for ammonia and sulfur increased at a faster rate than the increase in prices for our ammonium sulfate and sulfur acid products. As a result, our Pasadena Facility had to write-down $6.0 million of ammonium sulfate inventory to market value, which contributed to a gross loss at the Pasadena Facility for the year. Further, our profits depend on maintaining high rates of production of our products, and interruptions in operations at our facilities could materially adversely affect our profitability. In the fourth quarter of 2013, we experienced disruptions at both of our facilities. The Pasadena Facility underwent a turnaround in December 2013, which lasted longer than anticipated due to issues with a contractor and weather delays, and experienced several relatively small disruptions in production that, in the aggregate, negatively impacted production in 2013. The East Dubuque Facility also experienced a turnaround and a fire, which halted the production of all products in late November and for most of December 2013. These events significantly contributed to a substantial decrease in sales volume in ammonia and UAN sales between the years ended 31, 2013 and 2012. If we are not able to operate our facilities at a profit or if we are not able to retain cash or access a sufficient amount of financing for our working capital needs, our business, financial condition, cash flow, results of operations and ability to pay cash distributions could be materially adversely affected, which could adversely affect the trading price of our common units.
19
Table of Contents
The nitrogen fertilizer business and nitrogen fertilizer prices are seasonal, cyclical and highly volatile and have experienced substantial and sudden downturns in the past. Currently, nitrogen fertilizer demand is at a relative high point and could decrease significantly in the future. Cycles in demand and pricing could potentially expose us to significant fluctuations in our operating and financial results, and expose you to substantial volatility in our quarterly distributions and material reductions in the trading price of our common units.
We are exposed to fluctuations in nitrogen fertilizer demand and prices in the agricultural industry. These fluctuations historically have had, and could in the future have, significant effects on prices across all nitrogen fertilizer products and, in turn, our financial condition, cash flow and results of operations, which could result in significant volatility or material reductions in the price of our common units or an inability to pay cash distributions to our unitholders.
Nitrogen fertilizer products are commodities, the prices of which can be highly volatile. The price of nitrogen fertilizer products depends on a number of factors, including general economic conditions, cyclical trends in end-user markets, supply and demand imbalances, the prices of natural gas, ammonia, sulfur and other raw materials, the prices of other commodities such as corn, soybeans, potatoes, cotton, canola, alfalfa and wheat, and weather conditions, all of which have a greater relevance because of the seasonal nature of fertilizer application. If seasonal demand exceeds the projections on which we base production, our customers may acquire nitrogen fertilizer products from our competitors, and our profitability will be negatively impacted. If seasonal demand is less than we expect, we will be left with excess inventory for which we have limited storage capacity and that will have to be stored or liquidated, which could adversely affect our operating margins and our ability to pay cash distributions.
Demand for nitrogen fertilizer products is dependent on demand for crop nutrients by the global agricultural industry. In recent years, nitrogen fertilizer products have been in high demand, driven by a growing world population, changes in dietary habits and an expanded production of corn. Supply is affected by available capacity and operating rates of nitrogen producers, raw material costs, government policies and global trade. Our results of operations in any year could be negatively impacted by these factors. For example, our results for the year ended December 31, 2014 were heavily affected by significant unanticipated declines in nitrogen prices. During the year ended December 31, 2014, fertilizer prices fell due to weather factors, reduced expectations for corn acreage in 2015 and increased volumes of urea exported from China. A significant or prolonged decrease in nitrogen fertilizer prices would have a material adverse effect on our business, cash flow and ability to make cash distributions to our unitholders. Further, the margins on the sale of ammonium sulfate fertilizer products are currently lower than the margins on our other main nitrogen fertilizer products. If our costs to produce ammonium sulfate fertilizer products increase and the prices at which we sell these products do not correspondingly increase, our profits from the sale of these products may decrease or we may suffer losses on these sales. For example, during the year ended December 31, 2014, our Pasadena Facility suffered a gross loss due to lower ammonium sulfate sales prices, a write-down of inventory and other factors. A significant or prolonged decrease in profits (or increase in losses) on the sale of our ammonium sulfate fertilizer products would have a material adverse effect on our business, cash flow and ability to make cash distributions to our unitholders.
Any decline in United States agricultural production or crop prices or limitations on the use of nitrogen fertilizer for agricultural purposes could have a material adverse effect on the market for nitrogen fertilizer, and on our results of operations, financial condition and ability to make cash distributions to our unitholders.
Conditions in the United States agricultural industry significantly impact our operating results. This is particularly the case in the production of corn, which is a major driver of the demand for nitrogen fertilizer products in the United States. The United States agricultural industry in general, and the production and prices of corn in particular, can be affected by a number of factors, including weather patterns and soil conditions, current and projected grain inventories and prices, domestic and international supply of and demand for United States agricultural products and United States and foreign policies regarding trade in agricultural products. Prices for these agricultural products can decrease suddenly and significantly.
State and federal governmental regulations and policies, including farm and biofuel subsidies and commodity support programs, as well as the prices of fertilizer products, may also directly or indirectly influence the number of acres planted, the mix of crops planted and the use of fertilizers for particular agricultural applications. Developments in crop technology, such as nitrogen fixation, the conversion of atmospheric nitrogen into compounds that plants can assimilate, could also reduce the use of chemical fertilizers and adversely affect the demand for nitrogen fertilizer. In addition, from time to time various state legislatures have considered limitations on the use and application of chemical fertilizers due to concerns about the impact of these products on the environment. The adoption or enforcement of such regulations could adversely affect the demand for and prices of nitrogen fertilizers, which could adversely affect our results of operations, cash flows and ability to make cash distributions to our unitholders.
20
Table of Contents
A major factor underlying the current high level of demand for our nitrogen-based fertilizer products is the expanding production of ethanol. A decrease in ethanol production, an increase in ethanol imports or a shift away from corn as a principal raw material used to produce ethanol could have a material adverse effect on our results of operations, financial condition and ability to make cash distributions to our unitholders.
A major factor underlying the current level of demand for corn and the use of nitrogen fertilizer products is the current production level of ethanol in the United States. Ethanol production in the United States is dependent in part upon a myriad of federal and state incentives. Such incentive programs may not be renewed, or if renewed, they may be renewed on terms significantly less favorable to ethanol producers than current incentive programs. Studies showing that expanded ethanol production may increase the level of GHGs in the environment, or other factors, may reduce political support for ethanol production. Furthermore, the EPA has proposed reducing 2014 renewable blending mandates, which could reduce the level of corn-based ethanol to be blended into the nation’s gasoline supply. If the target for use of renewable fuels such as ethanol is reduced, the demand for corn may fall significantly. Moreover, the current trend in ethanol production research is to develop an efficient method of producing ethanol from cellulose-based biomass. If another ethanol-related subsidy is not implemented, or if an efficient method of producing ethanol from cellulose-based biomass is developed and commercially deployed at scale, the demand for corn may decrease significantly. Any reduction in the demand for corn and, in turn, for nitrogen fertilizer products could have a material adverse effect on our results of operations, financial condition and ability to make cash distributions to our unitholders.
We face competition from other nitrogen fertilizer producers.
We have a number of competitors in the nitrogen fertilizer business in the United States and in other countries, including state-owned and government-subsidized entities. Our East Dubuque Facility’s principal competitors include domestic and foreign fertilizer producers, major grain companies and independent distributors and brokers, including Koch, CF Industries, Agrium, Gavilon, LLC, CHS Inc., Transammonia, Inc., OCI and Helm Fertilizer Corp. Our Pasadena Facility’s principal competitors include domestic and foreign fertilizer producers and independent distributors and brokers, including BASF AG, Honeywell, Agrium, Royal DSM N.V., Dakota Gasification Company and Martin Midstream Partners L.P. and producers of nitrogen fertilizer in China.
Some competitors have greater total resources, or better name recognition, and are less dependent on earnings from fertilizer sales, which make them less vulnerable to industry downturns and better positioned to pursue new expansion and development opportunities. For example, certain of our East Dubuque Facility’s nitrogen fertilizer competitors have recently expanded production capacity for their nitrogen fertilizer products. Furthermore, a few dormant nitrogen production facilities located outside of the East Dubuque Facility’s core market have recently resumed operations. The additional capacity has placed downward pressure on average sales prices for ammonia and UAN. Moreover, we may face additional competition due to further expansion of facilities that are currently operating and the reopening of currently dormant facilities. Also, other producers of nitrogen fertilizer products are contemplating the construction of new nitrogen fertilizer facilities in North America, including in the Mid Corn Belt. For example, OCI has announced that it is constructing a facility located 165 miles away from our East Dubuque Facility that is designed to produce between 1.5 to 2.0 million metric tons per year of ammonia, urea, UAN and diesel exhaust fluid. The facility is expected to begin production in late 2015. If a new nitrogen fertilizer facility is completed in the East Dubuque Facility’s core market, it could benefit from the same competitive advantage associated with the location of the facility. As a result, the completion of such a facility could have a material adverse effect on our business and cash flow.
Many of our competitors in the nitrogen fertilizer business incur greater costs than we and our customers do in transporting their products over longer distances via rail, ships, barges and pipelines. There can be no assurance that our competitors’ transportation costs will not decline or that additional pipelines will not be built in the future, lowering the price at which our competitors can sell their products, which could have a material adverse effect on our results of operations and financial condition.
Our competitive position could also suffer to the extent that we are not able to adapt our nitrogen fertilizer product mix to meet the needs of our customers or expand our own resources either through investments in new or existing operations or through joint ventures or partnerships. An inability to compete successfully in the nitrogen fertilizer business could result in the loss of customers, which could adversely affect our sales and profitability. In addition, as a result of increased pricing pressures in the nitrogen fertilizer business caused by competition, we may in the future experience reductions in our profit margins on sales, or may be unable to pass future input price increases on to our customers, which would reduce our cash flows. For example, higher exports of ammonium sulfate from China during 2014 put downward pressure on ammonium sulfate prices, and prices for ammonia and sulfur, key inputs for ammonium sulfate, increased significantly. The factors together negatively impacted product margins for ammonium sulfate.
21
Table of Contents
Our business is seasonal, which may result in our carrying significant amounts of inventory and seasonal variations in working capital. Our inability to predict future seasonal nitrogen fertilizer demand accurately may result in excess inventory or product shortages.
Our business is highly seasonal. Historically, most of the annual deliveries of the products from our East Dubuque Facility have occurred during the quarters ending June 30 and December 31 of each year due to the condensed nature of the spring planting season and the fall harvest in the East Dubuque Facility’s market. Farmers in that market tend to apply nitrogen fertilizer during two short application periods, one in the spring and the other in the fall. Since interim period operating results reflect the seasonal nature of our business, they are not indicative of results expected for the full fiscal year. In addition, results for comparable quarters can vary significantly from one year to the next due primarily to weather-related shifts in planting schedules and purchase patterns of our customers. We expect to incur substantial expenditures for fixed costs throughout the year and substantial expenditures for inventory in advance of the spring planting season and fall harvest season in our East Dubuque Facility’s market as we build inventories during these low demand periods. Seasonality also relates to the limited windows of opportunity that nitrogen fertilizer customers have to complete required tasks at each stage of crop cultivation. Should events such as adverse weather or production or transportation interruptions occur during these seasonal windows, we would face the possibility of reduced revenue without the opportunity to recover until the following season. In addition, an adverse weather pattern affecting one of our markets could have a material adverse effect on the demand for our products and our revenues, and we may not have sufficient geographic diversity in our customer base to mitigate such effects. Because of the seasonality of agriculture, we also expect to face the risk of significant inventory carrying costs should our customers’ activities be curtailed during their normal seasons. The seasonality can negatively impact accounts receivable collections and increase bad debts. In addition, variations in the proportion of product sold through forward sales and variances in the terms and timing of prepaid contracts can affect working capital requirements and increase the seasonal and year-to-year volatility of our cash flow and cash available for distribution to our unitholders.
If seasonal demand for nitrogen fertilizer exceeds our projections, we will not have enough product and our customers may acquire products from our competitors. If seasonal demand is less than we expect, we will be left with excess inventory and higher working capital and liquidity requirements.
The degree of seasonality of our business can change significantly from year to year due to conditions in the agricultural industry and other factors. As a consequence of our seasonality, we expect that our distributions will be volatile and will vary quarterly and annually.
Any operational disruption at our facilities as a result of equipment failure, an accident, adverse weather, a natural disaster or another interruption could result in a reduction of sales volumes and could cause us to incur substantial expenditures. A prolonged disruption could materially affect the cash flow we expect from our facilities, or lead to a default under our GE Credit Agreement or our Notes.
The equipment at our facilities could fail and could be difficult to replace. Our facilities may be subject to significant interruption if they were to experience a major accident or equipment failure, including accidents or equipment failures caused during expansion projects, or if they were damaged by severe weather or natural disaster. Significant shutdowns at our facilities could significantly reduce the amount of product available for sale, which could reduce or eliminate profits and cash flow from our operations. In the fourth quarter of 2013, for example, we experienced operational disruptions at both of our facilities, which negatively affected our results of operations. Our East Dubuque Facility halted production due to a fire and operated at reduced rates following its turnaround after the discovery of the need for repairs to the foundation of one of its syngas compressors. Our Pasadena Facility also underwent a turnaround in December 2013, which lasted longer than anticipated due to issues with a contractor and weather delays. In addition, we are preparing to replace the ammonia synthesis converter at our East Dubuque Facility, which we expect to be completed by the end of 2016. However, if the existing ammonia synthesis converter were to fail or suffer damage prior to completion of its replacement, this could cause a shutdown of our East Dubuque Facility. Repairs to our facilities could be expensive, and could be so extensive that our facilities could not economically be placed back into service. It has become increasingly difficult to obtain replacement parts for equipment and the unavailability of replacement parts could impede our ability to make repairs to our facilities when needed. We currently maintain property insurance, including business interruption insurance, but we may not have sufficient coverage, or may be unable in the future to obtain sufficient coverage at reasonable costs. A prolonged disruption at our facilities could materially affect the cash flow we expect from our facilities, or lead to a default under our GE Credit Agreement or our Notes. In addition, operations at our facilities are subject to hazards inherent in chemical processing. Some of those hazards may cause personal injury and loss of life, severe damage to or destruction of property and equipment and environmental damage, and may result in suspension of operations and the imposition of civil or criminal penalties. As a result, operational disruptions at our facilities could materially adversely impact our business, financial condition, results of operations and cash flow.
22
Table of Contents
The market for natural gas has been volatile. Natural gas prices are currently at a relative low point. An increase in natural gas prices could impact our relative competitive position when compared to other foreign and domestic nitrogen fertilizer producers, and if prices for natural gas increase significantly, we may not be able to economically operate our East Dubuque Facility.
The operation of our East Dubuque Facility with natural gas as the primary feedstock exposes us to market risk due to increases in natural gas prices, particularly if the price of natural gas in the United States were to become higher than the price of natural gas outside the United States. An increase in natural gas prices would impact our East Dubuque Facility’s operations by making us less competitive with competitors who do not use natural gas as their primary feedstock, and would therefore have a material adverse impact on the trading price of our common units. In addition, if natural gas prices in the United States were to increase relative to prices of natural gas paid by foreign nitrogen fertilizer producers, this may negatively affect our competitive position in the Mid Corn Belt region and thus have a material adverse effect on our results of operations, financial condition and cash flows.
The profitability of operating our East Dubuque Facility is significantly dependent on the cost of natural gas, and our East Dubuque Facility has operated in the past, and may operate in the future, at a net loss. Local factors may affect the price of natural gas available to us, in addition to factors that determine the benchmark prices of natural gas. Since we expect to purchase a substantial portion of our natural gas for use in our East Dubuque Facility on the spot market we remain susceptible to fluctuations in the price of natural gas in general and in local markets in particular. We also expect to use short-term, fixed supply, fixed price forward purchase contracts to lock in pricing for a portion of our natural gas requirements. Our ability to enter into forward purchase contracts is dependent upon our creditworthiness and, in the event of a deterioration in our credit, counterparties could refuse to enter into forward purchase contracts on acceptable terms. If we are unable to enter into forward purchase contracts for the supply of natural gas, we would need to purchase natural gas on the spot market, which would impair our ability to hedge our exposure to risk from fluctuations in natural gas prices. If we fix the price of natural gas with forward purchase contracts, and natural gas prices decrease, then our cost of sales could be higher than it would have been in the absence of the forward purchase contracts. However, forward purchase contracts may not protect us from all of the increases in natural gas prices. A hypothetical increase of $0.10 per MMBtu of natural gas would increase our cost to produce one ton of ammonia by $3.30. Higher than anticipated costs for the catalyst and other materials used at our East Dubuque Facility could also adversely affect operating results. These increased costs could materially and adversely affect our results of operations, financial condition and ability to make cash distributions to our unitholders.
Any interruption in the supply of natural gas to our East Dubuque Facility through Nicor could have a material adverse effect on our results of operations, financial condition and our ability to make cash distributions.
Our East Dubuque operations depend on the availability of natural gas. We have an agreement with Nicor pursuant to which we access natural gas from the ANR and Northern Natural Gas pipelines. Our access to satisfactory supplies of natural gas through Nicor could be disrupted due to a number of causes, including volume limitations under the agreement, pipeline malfunctions, service interruptions, mechanical failures or other reasons. The agreement extends for five consecutive periods of 12 months each, with the first period having commenced on November 1, 2010 and the last period ending October 31, 2015. For each period, Nicor may establish a bidding period during which we may match the best bid received by Nicor for the natural gas capacity provided under the agreement. We could be out-bid for any of the remaining periods under the agreement. In addition, upon expiration of the last period, we may be unable to renew the agreement on satisfactory terms, or at all. Any disruption in the supply of natural gas to our East Dubuque Facility could restrict our ability to continue to make products at the facility. In the event we needed to obtain natural gas from another source, we would need to build a new connection from that source to our East Dubuque Facility and negotiate related easement rights, which would be costly, disruptive and/or unfeasible. As a result, any interruption in the supply of natural gas through Nicor could have a material adverse effect on our results of operations, financial condition and ability to make cash distributions.
The markets for ammonia and sulfur have been volatile. If prices for either ammonia or sulfur increase or decrease significantly, we may not be able to economically operate our Pasadena Facility.
The operation of our Pasadena Facility with ammonia and sulfur as its primary feedstocks also exposes us to market risk due to increases in ammonia or sulfur prices. Since we expect to purchase a substantial portion of our ammonia and sulfur for use in our Pasadena Facility on the spot market we remain susceptible to fluctuations in the respective prices of ammonia and sulfur. The margins on the sale of ammonium sulfate fertilizer products are relatively low. If our costs to produce ammonium sulfate fertilizer products increase and the prices at which we sell these products do not correspondingly increase, our profits from the sale of these products may decrease or we may suffer losses on these sales. A hypothetical increase of $10.00 per ton of ammonia would increase the cost to produce one ton of ammonium sulfate by $2.50. A hypothetical increase of $10.00 per ton of sulfur would also increase the cost to produce one ton of ammonium sulfate by $2.50. We do not believe that there is any significant opportunity to reduce the costs of these inputs through hedging.
During the year ended December 31, 2014, the prices paid by our Pasadena Facility for ammonia and sulfur increased substantially, which increased our costs of inputs, but the prices of our products did not rise at the same rate. As a result, during the year ended December 31, 2014, we had significant amounts of inventory at costs representing input costs higher than the current
23
Table of Contents
market price for our products, and we incurred an approximate $6.0 million write-down of ammonium sulfate inventory. Market prices for ammonia and sulfur products may continue to remain low, which could have a materially adverse effect on our results of operations and financial condition.
The success of our ammonium sulfate fertilizer business depends on our ability to improve product sales and margins and to reduce cost at the Pasadena Facility.
Our ammonium sulfate fertilizer business has a limited operating history upon which its business and products can be evaluated. The Pasadena Facility produced phosphate fertilizer until early 2011 when it underwent a conversion to produce ammonium sulfate fertilizer products. In late 2014, we restructured operations at our Pasadena Facility, including to reduce expected annual production of ammonium sulfate by approximately 25 percent, to 500,000 tons. Because our ammonium sulfate fertilizer business has a limited operating history, we may not be able to effectively:
| • | maintain product quality, product sales prices, margins and operating costs at levels that we currently expect; |
| • | achieve production rates and on-stream factors that we currently expect; |
| • | implement potential capital improvements to lower costs and increase revenues at the Pasadena Facility; |
| • | attract and retain customers for our products from our existing production capacity; |
| • | comply with evolving regulatory requirements, including environmental regulations; |
| • | anticipate and adapt to changes in the ammonium sulfate fertilizer market; |
| • | maintain and develop strategic relationships with distributors and suppliers to facilitate the distribution and acquire necessary materials for our products; and |
| • | attract, retain and motivate qualified personnel. |
The operations at the Pasadena Facility are subject to many of the risks inherent in the growth of a new business. The likelihood of the facility’s success must be evaluated in light of the challenges, expenses, difficulties, complications and delays frequently encountered in the operation of a new business. Moreover, the sales prices for ammonium sulfate have significantly worsened and remain low. We cannot assure you that we will achieve the goals set forth above or any goals we may set in the future. Our failure to meet any of these goals could have a material adverse effect on our business, cash flow and ability to make cash distributions to our unitholders.
We have recorded goodwill impairment charges and recorded write-downs of finished goods and raw material inventories with respect to our Pasadena Facility, and we could be required to record additional material impairment charges and write-downs in the future.
During 2014, we lowered our profitability expectations for the Pasadena Facility primarily due to lower projected market prices for ammonium sulfate. As a result, during the year ended December 31, 2014, we recorded a goodwill impairment charge of $27.2 million relating to the Agrifos Acquisition, and we incurred an approximate $6.0 million write-down of ammonium sulfate inventory. The future profitability of our Pasadena Facility will be significantly affected by, among other things, nitrogen fertilizer product prices and the prices of the inputs to its production processes. It is possible that adverse changes to supply and demand factors relating to the Pasadena Facility’s nitrogen fertilizer products could require us to lower further our expectations for the profitability of the facility in the future. If this were to occur, we could be required to record additional material impairment charges, including with respect to impairment of long-lived assets, and additional write-downs, which could have a material adverse effect on our results of operations, the trading price of our common unit and our reputation.
There are phosphogypsum stacks located at the Pasadena Facility that will require closure. In the event we become financially obligated for the costs of closure, this would have a material adverse effect on our business, cash flow and ability to make cash distributions to our unitholders.
The Pasadena Facility was used for phosphoric acid production until 2011, which resulted in the creation of a number of phosphogypsum stacks at the Pasadena Facility. Phosphogypsum stacks are composed of the mineral processing waste that is the byproduct of the extraction of phosphorous from mineral ores. Certain of the stacks also have been or are used for other waste materials and wastewater. Applicable environmental laws extensively regulate phosphogypsum stacks.
The EPA reached a CAFO with ExxonMobil in September 2010 making ExxonMobil responsible for closure of the stacks, proper disposal of process wastewater related to the stacks and other expenses. In addition, the asset purchase agreement between a subsidiary of Agrifos and ExxonMobil, or the 1998 APA, pursuant to which the subsidiary purchased the Pasadena Facility in 1998 also makes ExxonMobil liable for closure and post-closure care of the stacks, with certain limitations relating to use of the stacks after the date of the agreement. ExxonMobil is in the process of closing the “south stack” (a large phosphogypsum stack that combines “stacks 2, 3 and 5”) and “stack 4” at the facility. ExxonMobil has not yet started closure of “stack 1” at the facility, which is the only
24
Table of Contents
remaining stack that is currently in use for disposal of waste streams. Although ExxonMobil has expended significant funds and resources relating to the closures, we cannot assure you that ExxonMobil will remain able and willing to complete closure and post-closure care of the stacks in the future, including as a result of actions taken by Agrifos prior to the closing of the Agrifos Acquisition. As of January 2012, ExxonMobil estimated that its total outstanding costs associated with the closures and long-term maintenance, monitoring and care of the stacks will be $102.0 million over the next 50 years. However, the actual amount of such costs could be in excess of this amount.
As discussed above, the costs of closure and post-closure care of the stacks will be substantial. If we become financially responsible for the costs of closure of the stacks, this would have a material adverse effect on our business, cash flow and ability to make cash distributions to our unitholders.
Soil and groundwater at the Pasadena Facility is pervasively contaminated, and we may incur costs to investigate and remediate known or suspected contamination at the Pasadena Facility. We may also face legal actions or sanctions or incur costs related to contamination or noncompliance with environmental laws at the facility.
The soil and groundwater at the Pasadena Facility is pervasively contaminated. The facility has produced fertilizer since as early as the 1940s, and a large number of spills and releases have occurred at the facility, many of which involved hazardous substances. Furthermore, naturally occurring and other radioactive contaminants have been discovered at the facility in the past, and asbestos-containing materials currently exist at the facility. In the past there have been numerous instances of weather events which have resulted in flooding and releases of hazardous substances from the facility. We cannot assure you that past environmental investigations at the facility were complete, and there may be other contaminants at the facility that have not been detected. Contamination at the Pasadena Facility has the potential to result in toxic tort, property damage, personal injury and natural resources damages claims or other lawsuits. Further, regulators may require investigation and remediation at the facility in the future at significant expense.
ExxonMobil submitted Affected Property Assessment Reports, or APARs, under the Texas Risk Reduction Program to the Texas Commission on Environmental Quality, or the TCEQ, beginning in 2011 for the plant site and phosphogypsum stacks at the Pasadena Facility. The APARs identify instances in which various regulatory limits for numerous hazardous materials in both the soil and groundwater at the plant site and in the vicinity of the stacks have been exceeded. TCEQ is requiring ExxonMobil to perform significant additional investigative work as part of the APAR process. The TCEQ may also require further remediation of the contamination at the Pasadena Facility. The TCEQ or other regulatory agencies may hold Agrifos or its subsidiaries responsible for certain of the contamination at the Pasadena Facility.
In the past, governmental authorities have alleged or determined that the Pasadena Facility has been in substantial noncompliance with environmental laws and the Pasadena Facility has been the subject of numerous regulatory enforcement actions. The facility has also been subject to a number of past or current governmental enforcement actions, consent agreements, orders, and lawsuits, including, as examples, actions concerning the closure of the phosphogypsum stacks at the facility, the release of process water and wastewater, hydrogen fluoride emissions, emissions of oxides of sulfur, releases of ammonia and other hazardous substances, various alleged Clean Water Act violations, the potential for off-site contamination, and other matters. In the future, we may be required to expend significant funds to attain or maintain compliance with environmental laws. For example, the facility may not comply with wastewater and stormwater discharge requirements and solid and hazardous waste requirements. Following closure of phosphogypsum stack 1 at the facility, we may need to upgrade the facility’s wastewater system and arrange for offsite disposal of wastes that are currently disposed of onsite in order to maintain compliance with environmental laws, and the costs to design, construct, and operate such a system could be material. Regulatory findings of noncompliance could trigger sanctions, including monetary penalties, require installation of control or other equipment or other modifications, adverse permit modifications, the forced curtailment or termination of operations or other adverse impacts.
The costs we may incur in connection with the matters described above could be material. Subject to the terms and conditions of the 1998 APA, we are entitled to indemnification from ExxonMobil for certain losses relating to environmental matters relating to the facility and arising out of conditions present prior to our acquisition of the facility. However, our rights to indemnification under this agreement is subject to important limitations, and we cannot assure you we will be able to obtain payment from ExxonMobil on a timely basis, or at all. Depending on the amount of the costs we may incur for such matters in a given period, this could have a material adverse effect on the results of our business, cash flow and ability to make cash distributions to our unitholders.
Due to our lack of diversification, adverse developments in the nitrogen fertilizer industry or at either of our facilities could adversely affect our results of operations and our ability to make distributions to our unitholders.
We rely primarily on the revenues generated from our two facilities. An adverse development in the market for nitrogen fertilizer products in our regions generally or at either of our facilities in particular would have a significantly greater impact on our
25
Table of Contents
operations and cash available for distribution to our unitholders than it would on other companies that are more diversified geographically or that have a more diverse asset and product base. The largest publicly traded companies with which we compete sell a more diverse range of fertilizer products to broader markets.
Our facilities face operating hazards and interruptions, including unplanned maintenance or shutdowns. We could face potentially significant costs to the extent these hazards or interruptions cause a material decline in production and are not fully covered by our existing insurance coverage. Insurance companies that currently insure companies in our industry may cease to do so, may change the coverage provided or may substantially increase premiums in the future.
Our operations are subject to significant operating hazards and interruptions. Any significant curtailing of production at one of our facilities or individual units within one of our facilities could result in materially lower levels of revenues and cash flow for the duration of any shutdown and materially adversely impact our ability to make cash distributions to our unitholders. Operations at our facilities could be curtailed or partially or completely shut down, temporarily or permanently, as the result of a number of circumstances, most of which are not within our control, such as:
| • | unplanned maintenance or catastrophic events such as a major accident or fire, damage by severe weather, flooding or other natural disaster; |
| • | labor difficulties that result in a work stoppage or slowdown; |
| • | environmental proceedings or other litigation that compel the cessation of all or a portion of the operations at one of our facilities; |
| • | increasingly stringent environmental and emission regulations; |
| • | a disruption in the supply of natural gas to our East Dubuque Facility or ammonia or sulfur to our Pasadena Facility; and |
| • | a governmental ban or other limitation on the use of nitrogen fertilizer products, either generally or specifically those manufactured at our facilities. |
The magnitude of the effect on us of any unplanned shutdown will depend on the length of the shutdown and the extent of the operations affected by the shutdown.
Our East Dubuque Facility has been in operation since 1965. Our Pasadena Facility has been in operation producing various products since the 1940s. In 2011, the Pasadena Facility was converted to the production of high-quality granulated synthetic ammonium sulfate, and began selling ammonium sulfate and ammonium thiosulfate as its primary products. Historically, our East Dubuque Facility and Pasadena Facility have required a planned maintenance turnaround every two years. Starting with our planned maintenance turnaround in 2016, our East Dubuque Facility will have a planned maintenance turnaround every three years. Turnarounds at our East Dubuque Facility generally last between 18 and 25 days, and turnarounds at our Pasadena Facility generally last between 14 and 25 days. We intend to alternate the year in which a turnaround occurs at each facility, so that both facilities do not experience a turnaround in the same year. Upon completion of a facility turnaround, we may face delays and difficulties restarting production at our facilities. During the fourth quarter of 2013, our East Dubuque Facility halted production due to a turnaround and a fire. Our Pasadena Facility also underwent a turnaround in December of 2013, which lasted longer than anticipated due to issues with a contractor and weather delays. The duration of our turnarounds or other shutdowns, and the impact they have on our operations, have in the past and could in the future materially adversely affect our cash flow and ability to make cash distributions in the quarter or quarters in which such turnarounds or shutdowns occur.
A major accident, fire, explosion, flood, severe weather event, terrorist attack or other event also could damage our facilities or the environment and the surrounding communities or result in injuries or loss of life. Scheduled and unplanned maintenance could reduce our cash flow and ability to make cash distributions to our unitholders during or for the period of time that any portion of our facilities are not operating. Any unplanned future shutdowns could have a material adverse effect on our ability to make cash distributions to our unitholders.
If we experience significant property damage, business interruption, environmental claims, fines, penalties or other liabilities, our business could be materially adversely affected to the extent the damages or claims exceed the amount of valid and collectible insurance available to us. We are currently insured under Rentech’s casualty, environmental, property and business interruption insurance policies. The policies are subject to limits, deductibles, and waiting periods and also contain exclusions and conditions that could have a material adverse impact on our ability to receive indemnification thereunder, as well as customary sub-limits for particular types of losses. For example, the current property policies contain specific sub-limits for losses resulting from business interruptions and for damage caused by covered flooding or named windstorms and resulting flooding or storm surge. We are fully exposed to all losses in excess of the applicable limits and sub-limits and for certain losses due to business interruptions.
Under the insurance policies that cover our Pasadena Facility, property exposures are subject to limits, deductibles and waiting periods with respect to insured physical damage and time element occurrences. Catastrophic perils such as named windstorms, floods and storm surges are subject to additional limitations that apply to each occurrence. The policies also contain exclusions and conditions that could have a material adverse impact on our ability to receive indemnification thereunder, as well as customary sub-limits for particular types of losses. For example the current property policy contains specific sub-limits for losses resulting from business interruption.
26
Table of Contents
Market factors, including but not limited to catastrophic perils that impact our industry, significant changes in the investment returns of insurance companies, insurance company solvency trends and industry loss ratios and loss trends, can negatively impact the future cost and availability of insurance. There can be no assurance that we will be able to buy and maintain insurance with adequate limits, reasonable pricing terms and conditions or collect from insurance claims that we make.
Our results of operations are highly dependent upon and fluctuate based upon business and economic conditions and governmental policies affecting the agricultural industry. These factors are outside of our control and may significantly affect our profitability.
Our results of operations are highly dependent upon business and economic conditions and governmental policies affecting the agricultural industry, which we cannot control. The agricultural products business can be affected by a number of factors. The most important of these factors, for United States markets, are:
| • | weather patterns and field conditions (particularly during periods of traditionally high nitrogen fertilizer consumption); |
| • | quantities of nitrogen fertilizers imported to and exported from North America; |
| • | current and projected grain inventories and prices, which are heavily influenced by United States exports and world-wide grain markets; and |
| • | United States governmental policies, including farm and biofuel policies, which may directly or indirectly influence the number of acres planted, the level of grain inventories, the mix of crops planted or crop prices. |
International market conditions, which are also outside of our control, may also significantly influence our operating results. The international market for nitrogen fertilizers is influenced by such factors as the relative value of the United States dollar and its impact upon the cost of importing nitrogen fertilizers, foreign agricultural policies, the existence of, or changes in, import or foreign currency exchange barriers in certain foreign markets, changes in the hard currency demands of certain countries and other regulatory policies of foreign governments, as well as the laws and policies of the United States affecting foreign trade and investment.
Ammonia can be very volatile and extremely hazardous. Any liability for accidents involving ammonia that cause severe damage to property or injury to the environment and human health could have a material adverse effect on our results of operations, financial condition and ability to make cash distributions. In addition, the costs of transporting ammonia could increase significantly in the future.
We produce, process, store, handle, distribute and transport ammonia, which can be very volatile and extremely hazardous. Major accidents or releases involving ammonia could cause severe damage or injury to property, the environment and human health, as well as a possible disruption of supplies and markets. Such an event could result in civil lawsuits, fines, penalties and regulatory enforcement proceedings, all of which could lead to significant liabilities. Any damage to persons, equipment or property or other disruption of our ability to produce or distribute our products could result in a significant decrease in operating revenues and significant additional cost to replace or repair and insure our assets, which could have a material adverse effect on our results of operations, financial condition and ability to make cash distributions. We periodically experience releases of ammonia related to leaks from our equipment or error in operation and use of equipment at our facilities. Similar events may occur in the future.
These circumstances may result in sudden, severe damage or injury to property, the environment and human health. In the event of pollution, we may be held responsible even if we are not at fault and even if we complied with the laws and regulations in effect at the time of the accident. Litigation arising from accidents involving ammonia may result in our being named as a defendant in lawsuits asserting claims for large amounts of damages, which could have a material adverse effect on our results of operations, financial condition and ability to make cash distributions. Given the risks inherent in transporting ammonia, the costs of transporting ammonia could increase significantly in the future.
We are subject to risks and uncertainties related to transportation and equipment that are beyond our control and that may have a material adverse effect on our results of operations, financial condition and ability to make distributions.
Although our customers and distributors generally pick up our products at our facilities, we occasionally rely on barge and railroad companies to ship products to our customers and distributors. The availability of these transportation services and related equipment is subject to various hazards, including extreme weather conditions, work stoppages, delays, spills, derailments and other
27
Table of Contents
accidents and other operating hazards. For example, barge transport can be impacted by lock closures resulting from inclement weather or surface conditions, including fog, rain, snow, wind, ice, strong currents, floods, droughts and other unplanned natural phenomena, lock malfunction, tow conditions and other conditions. Further, the limited number of towing companies and of barges available for ammonia transport may also impact the availability of transportation for our products. These transportation services and equipment are also subject to environmental, safety and other regulatory oversight. Due to concerns related to terrorism or accidents, local, state and federal governments could implement new regulations affecting the transportation of our products. In addition, new regulations could be implemented affecting the equipment used to ship products from our facilities. Any delay in our ability to ship our products as a result of transportation companies’ failure to operate properly, the implementation of new and more stringent regulatory requirements affecting transportation operations or equipment, or significant increases in the cost of these services or equipment could have a material adverse effect on our results of operations, financial condition and ability to make cash distributions.
Our business is subject to extensive and frequently changing environmental laws and regulations. We expect that the cost of compliance with these laws and regulations will increase over time, and we could become subject to material environmental liabilities.
Our business is subject to extensive and frequently changing federal, state and local environmental, health and safety regulations governing the emission and release of hazardous substances into the environment, the treatment and discharge of waste water and the storage, handling, use and transportation of our nitrogen fertilizer products. These laws include the CAA, the federal Clean Water Act, the RCRA, CERCLA, the TSCA, and various other federal, state and local laws and regulations. Violations of these laws and regulations could result in substantial penalties, injunctive orders compelling installation of additional controls, civil and criminal sanctions, permit revocations or facility shutdowns. In addition, new environmental laws and regulations, new interpretations of existing laws and regulations, increased governmental enforcement of laws and regulations or other developments could require us to make additional expenditures. Many of these laws and regulations are becoming increasingly stringent, and we expect the cost of compliance with these requirements to increase over time. The ultimate impact on our business of complying with existing laws and regulations is not always clearly known or determinable due in part to the fact that our operations may change over time and certain implementing regulations for laws, such as the CAA, have not yet been finalized, are under governmental or judicial review or are being revised. These expenditures or costs for environmental compliance could have a material adverse effect on our results of operations, financial condition and ability to make cash distributions.
Our operations, as well as expansion of such operations, require numerous permits and authorizations. Failure to obtain, renew or comply with these permits or environmental laws generally could result in substantial fines, penalties or other sanctions, court orders to install pollution-control equipment, permit revocations and facility shutdowns. We may experience delays in obtaining or be unable to obtain required permits, which may delay or interrupt our operations and limit our growth and revenue. A decision by a government agency to revoke or substantially modify an existing permit or approval could have a material adverse effect on our ability to continue operations and on our business, financial condition and results of operations.
Our business is subject to accidental spills, discharges or other releases of hazardous substances into the environment. Past or future spills related to our facilities or transportation of products or hazardous substances from our facilities may give rise to liability (including strict liability, or liability without fault, and potential cleanup responsibility) to governmental entities or private parties under federal, state or local environmental laws, as well as under common law. For example, we could be held strictly liable under CERCLA, for past or future spills without regard to fault or whether our actions were in compliance with the law at the time of the spills. Pursuant to CERCLA and similar state statutes, we could be held liable for contamination associated with our facilities, facilities we formerly owned or operated (if any) and facilities to which we transported or arranged for the transportation of wastes or byproducts containing hazardous substances for treatment, storage or disposal. The potential penalties and cleanup costs for past or future releases or spills, liability to third parties for damage to their property or exposure to hazardous substances, or the need to address newly discovered information or conditions that may require response actions could be significant and could have a material adverse effect on our results of operations, financial condition and ability to make cash distributions. For a discussion of releases at the Pasadena Facility, see the risk factor captioned “Soil and groundwater at the Pasadena Facility is pervasively contaminated, and we may incur costs to investigate and remediate known or suspected contamination at the Pasadena Facility. We may also face legal actions or sanctions or incur costs related to contamination or noncompliance with environmental laws at the facility.” In addition, limited subsurface investigation indicates the presence of certain contamination at the East Dubuque facility. In the future, we may determine that there are conditions at the East Dubuque Facility that require remediation or other response.
We may incur future costs relating to the off-site disposal of hazardous wastes. Companies that dispose of, or arrange for the transportation or disposal of, hazardous substances at off-site locations may be held jointly and severally liable for the costs of investigation and remediation of contamination at those off-site locations, regardless of fault. We could become involved in litigation or other proceedings involving off-site waste disposal and the damages or costs in any such proceedings could be material.
28
Table of Contents
Environmental laws and regulations on fertilizer end-use and application and numeric nutrient water quality criteria could have a material adverse impact on fertilizer demand in the future.
Future environmental laws and regulations on the end-use and application of fertilizers could cause changes in demand for our products. In addition, future environmental laws and regulations, or new interpretations of existing laws or regulations, could limit our ability to market and sell our products to end users. From time to time, various state legislatures have proposed bans or other limitations on fertilizer products. In addition, a number of states have adopted or proposed numeric nutrient water quality criteria that could result in decreased demand for our fertilizer products in those states. Any such laws, regulations or interpretations could have a material adverse effect on our results of operations, financial condition and ability to make cash distributions.
Climate change laws, regulations, and impacts could have a material adverse effect on our results of operations, financial condition and ability to make cash distributions.
Legislative and regulatory measures to address GHG emissions (including CO2, methane and N2O) are in various phases of discussion or implementation. At the federal legislative level, Congress has previously considered legislation requiring a mandatory reduction of GHG emissions. Although Congressional passage of such legislation does not appear imminent at this time, it could be adopted at a future date. It is also possible that Congress may pass alternative climate change bills that do not mandate a nationwide cap-and-trade program and instead focus on promoting renewable energy and energy efficiency or impose a carbon fee.
In the absence of congressional legislation curbing GHG emissions, the EPA is moving ahead administratively under its CAA authority. In October 2009, the EPA finalized a rule requiring certain large emitters of GHGs to inventory and report their GHG emissions to the EPA. In accordance with the rule, we monitor our GHG emissions from our facilities and began reporting the emissions to the EPA annually beginning in September 2011. In December 2009, the EPA finalized its “endangerment finding” that GHG emissions, including CO2, pose a threat to human health and welfare. The finding allows the EPA to regulate GHG emissions as air pollutants under the CAA. The EPA adopted regulations that limit emissions of greenhouse gases from motor vehicles, which then triggered the imposition of CAA construction and operating permit requirements under the Prevention of Significant Deterioration, or PSD, and Title V permitting programs for certain large stationary sources that are already subject to these requirements due to emissions of conventional, or criteria, pollutants. Facilities that are required to obtain permits for their GHG emissions are required to reduce those emissions using “best available control technology,” or BACT, standards, which are currently being developed on a case-by-case basis. Future modification to one of our facilities may require us to satisfy BACT requirements and potentially require us to meet other CAA requirements applicable to GHG emissions. A number of states also have adopted reporting and mitigation requirements.
The implementation of additional EPA regulations and/or the passage of federal or state climate change legislation would likely increase the costs we incur to (i) operate and maintain our facilities, (ii) install new emission controls on our facilities and (iii) administer and manage any GHG emissions program. Increased costs associated with compliance with any future legislation or regulation of GHG emissions, if it occurs, may have a material adverse effect on our results of operations, financial condition and ability to make cash distributions. In addition, climate change legislation and regulations may result in increased costs not only for our business but also for agricultural producers that utilize our fertilizer products, thereby potentially decreasing demand for our nitrogen fertilizer products. Decreased demand for our fertilizer products may have a material adverse effect on our results of operations, financial condition and ability to make cash distributions.
Similarly, the impact of potential climate change on our operations and those of our customers is uncertain and could adversely affect us.
Agrium is a distributor and customer of a significant portion of our nitrogen fertilizer products, and we have the right to store products at Agrium’s terminal in Niota, Illinois. Any loss of Agrium as our distributor or customer, loss of our storage rights or decline in sales of products through or to Agrium could materially adversely affect our results of operations, financial condition and ability to make cash distributions.
We use Agrium as a distributor of a significant portion of our nitrogen fertilizer products of our East Dubuque Facility pursuant to a distribution agreement between Agrium and us. For the years ended December 31, 2014, 2013 and 2012, 78% or more of our East Dubuque Facility’s total product sales were made through Agrium. Under the distribution agreement, if we are unable to reach an agreement with Agrium for the purchase and sale of our products, Agrium is under no obligation to make such purchase and sale. Agrium sells products that compete with ours, and may be incentivized to prioritize the sale of its products over ours. In the event of any decline in sales of our products through Agrium as distributor, we may not be able to find buyers for our products.
29
Table of Contents
The distribution agreement has a term that ends in April 2016, but automatically renews for subsequent one-year periods (unless either party delivers a termination notice to the other party at least three months prior to an automatic renewal). The distribution agreement may be terminated prior to its stated term for specified causes. Under the distribution agreement, Agrium bears the credit risk on products sold through Agrium pursuant to the agreement. Agrium also is largely responsible for marketing our products to customers and the associated expense. As a result, if our distribution agreement with Agrium terminates for any reason, Agrium would no longer bear the credit risk on the sale of any of our products and we would become responsible for all of the marketing costs for our products.
Under the distribution agreement, we have the right to store up to 15,000 tons of ammonia at Agrium’s terminal in Niota, Illinois, and we sell a portion of our ammonia at that terminal. Our right to store ammonia at the terminal expires on June 30, 2016, but automatically renews for successive one year periods, unless we deliver a termination notice to Agrium with respect to such storage rights at least three months prior to an automatic renewal. Our right to use the storage space immediately terminates if the distribution agreement terminates in accordance with its terms. Ammonia storage sites and terminals served by barge on the Mississippi River are controlled primarily by CF Industries, Koch and Agrium, each of which is one of our competitors. If we lose the right to store ammonia at the Niota, Illinois terminal, we may not be able to find suitable replacement storage on acceptable terms, or at all, and we may be forced to reduce production. We also may lose sales to customers that purchase products at the terminal.
In addition to distributing our products, Agrium is also one of our significant customers. For the years ended December 31, 2014, 2013 and 2012, 0%, 2% and 2%, respectively, of our total product sales were to Agrium as a direct customer (rather than a distributor) and 12%, 12% and 9%, respectively, of our total product sales were to CPS, a controlled affiliate of Agrium. Agrium or CPS could elect to reduce or cease purchasing our products for a number of reasons, especially if our relationship with Agrium as a distributor were to end. If our sales to Agrium as a direct customer or CPS decline, we may not be able to find other customers to purchase the excess supply of our products.
Sales of our products through or to Agrium could decline or the distribution agreement or our rights to storage could terminate as a result of a number of causes which are outside of our control. Any loss of Agrium as our distributor or customer, loss of our storage rights or decline in sales of products through Agrium could materially adversely affect our results of operations, financial condition and ability to make cash distributions.
IOC is the exclusive distributor of our ammonium sulfate fertilizer. Any loss of IOC as our distributor could materially adversely affect our results of operations, financial condition and ability to make cash distributions.
We have a marketing agreement that grants IOC the exclusive right and obligation to market and sell all of our Pasadena Facility’s granular ammonium sulfate. The marketing agreement has a term that ends December 31, 2016, but automatically renews for subsequent one-year periods (unless either party delivers a termination notice to the other party at least 210 days prior to an automatic renewal). The marketing agreement may be terminated prior to its stated term for specified causes. If we are unable to renew our contract with IOC, we may be unable to find buyers for our granular ammonium sulfate. In addition, we have an arrangement with IOC that permits us to store approximately 60,000 tons of ammonium sulfate at IOC-controlled terminals, which are located near end customers of our Pasadena Facility’s ammonium sulfate. This arrangement currently is not governed by a written contract. If we lose the right to store ammonium sulfate at these IOC-controlled terminals, we may not be able to find suitable replacement storage on acceptable terms, or at all, and we may be forced to reduce production. Any loss of IOC as our distributor, loss of our storage rights or decline in sales of products through IOC could materially adversely affect our results of operations, financial condition and ability to make cash distributions.
Due to our dependence on significant customers, the loss of one or more of our significant customers could adversely affect our results of operations and our ability to make distributions to our unitholders.
Our business depends on significant customers, and the loss of one or several significant customers may have a material adverse effect on our results of operations, financial condition and ability to make cash distributions to our unitholders. In the aggregate, our top five ammonia customers represented 62%, 57% and 54%, respectively, of our ammonia sales for the years ended December 31, 2014, 2013 and 2012, and our top five UAN customers represented 58%, 59% and 38%, respectively, of our UAN sales for the same periods. For the years ended December 31, 2014, 2013 and 2012, 0%, 2% and 2%, respectively, of our East Dubuque Facility’s total product sales were to Agrium as a direct customer (rather than a distributor) and 12%, 12% and 9%, respectively, of our East Dubuque Facility’s total product sales were to CPS, a controlled affiliate of Agrium. During the period beginning November 1, 2012 through December 31, 2014, the marketing agreement with IOC accounted for 100% of our Pasadena Facility’s revenues from the sale of ammonium sulfate. Given the nature of our business, and consistent with industry practice, we generally do not have long-term minimum sales contracts with any of our customers. If our sales to any of our significant customers were to decline, we may not be able to find other customers to purchase the excess supply of our products. The loss of one or several of our significant customers, or a significant reduction in purchase volume by any of them, could have a material adverse effect on our results of operations, financial condition and ability to make cash distributions.
30
Table of Contents
The sale of our products to customers in international markets exposes us to additional risks that could harm our business, operating results, and financial condition.
Our Pasadena Facility’s products are sold through distributors to customers in North America, New Zealand, Australia, Brazil and Thailand, and our distributors could expand sales to additional international markets in the future. In addition to risks described elsewhere in this section, the sale of our products in international markets expose us to other risks, including the following:
| • | changes in local political, economic, social and labor conditions, which may adversely harm our business; |
| • | import and export requirements, tariffs, trade disputes and barriers, and customs classifications that may prevent our distributors from offering our products to a particular market; |
| • | longer payment cycles in some countries, increased credit risk, and higher levels of payment fraud; |
| • | still developing foreign laws and legal systems; |
| • | uncertainty regarding liability for products, including uncertainty as a result of local laws and lack of legal precedent; |
| • | different employee/employer relationships, existence of workers’ councils and labor unions and other challenges caused by distance, language, and cultural differences, making it harder to do business in certain jurisdictions; and |
| • | natural disasters, military or political conflicts, including war and other hostilities and public health issues and outbreaks. |
In addition, our distributors must comply with complex foreign and United States laws and regulations that apply to international sales and operations. These numerous and sometimes conflicting laws and regulations include internal control and disclosure rules, anti-corruption laws, such as the Foreign Corrupt Practices Act, and other local laws prohibiting corrupt payments to governmental officials, and antitrust and competition regulations, among others. Violations of these laws and regulations could result in fines and penalties, criminal sanctions against our distributors, prohibitions on the conduct of their business and on our ability to offer our products in one or more countries, and could also materially affect our brand, our ability to attract and retain employees, our business and our operating results. Although we have implemented policies and procedures designed to ensure our distributors’ compliance with these laws and regulations, there can be no assurance that our distributors will not violate our policies.
We are largely dependent on our customers and distributors to transport purchased goods from our facilities because we do not maintain a fleet of trucks or rail cars.
We do not maintain a fleet of trucks and, unlike some of our major competitors, we do not maintain a fleet of rail cars. Our customers and distributors generally are located close to our facilities and have been willing and able to transport purchased goods from each facility. In most instances, our customers and distributors purchase products for delivery at the facility and then arrange and pay to transport them to their final destinations by truck. However, in the future, the transportation needs of our customers and distributors as well as their preferences may change, and those customers and distributors may no longer be willing or able to transport purchased goods from our facilities. In the event that our competitors are able to transport their products more efficiently or cost effectively than our customers and distributors, those customers and distributors may reduce or cease purchases of our products. If this were to occur, we could be forced to make a substantial investment in a fleet of trucks and/or rail cars to meet the delivery needs of customers and distributors, and this would be expensive and time consuming. We may not be able to obtain transportation capabilities on a timely basis or at all, and our inability to provide transportation for products could have a material adverse effect on our business, cash flow and ability to make distributions.
We are subject to strict laws and regulations regarding employee and process safety, and failure to comply with these laws and regulations could have a material adverse effect on our results of operations, financial condition and ability to make cash distributions.
We are subject to a number of federal and state laws and regulations related to safety, including OSHA and comparable state statutes, the purpose of which are to protect the health and safety of workers. In addition, OSHA requires that we maintain information about hazardous materials used or produced in our operations and that we provide this information to employees, state and local governmental authorities, and local residents. Failure to comply with OSHA requirements and other related state regulations, including general industry standards, record keeping requirements and monitoring and control of occupational exposure to regulated substances, could have a material adverse effect on our results of operations, financial condition and ability to make cash distributions if we are subjected to significant penalties, fines or compliance costs.
31
Table of Contents
There are significant risks associated with expansion and other projects that may prevent completion of those projects on budget, on schedule or at all.
We may undertake additional expansion projects at our East Dubuque Facility and our Pasadena Facility. Projects of the scope and scale we are undertaking or may undertake in the future entail significant risks, including:
| • | unanticipated cost increases; |
| • | unforeseen engineering or environmental problems; |
| • | work stoppages; |
| • | weather interference; |
| • | unavailability of necessary equipment; and |
| • | unavailability of financing on acceptable terms. |
Construction, equipment or staffing problems or difficulties in obtaining any of the requisite licenses, permits and authorizations from regulatory authorities could increase the total cost, delay or prevent the construction or completion of a project.
In addition, we cannot assure you that we will have adequate sources of funding to undertake or complete major projects. As a result, we may need to obtain additional debt and/or equity financing to complete such projects. There is no guarantee that we will be able to obtain other debt or equity financing on acceptable terms or at all. Moreover, if we are able to complete these projects, production levels at our facilities may not meet expectations that we have set.
32
Table of Contents
As a result of these factors, we cannot assure you that our projects will commence operations on schedule or at all, that the costs for the projects will not exceed budgeted amounts or that production levels will achieve the expectations that we have set. Failure to complete a project on budget, on schedule or at all or to achieve expected production levels may adversely impact our ability to grow our business.
Expansion of our production capacity may change the balance of supply and demand in our markets, and our new products may not achieve market acceptance.
We increased our capacity to produce ammonia and urea and started to produce and sell DEF. Increased production of our existing products may reduce the selling price for those products as a result of market saturation. We may be required to sell these products at lower prices, or may not be able to sell all of the products we produce. In addition, there can be no assurance that our new products will be well-received or that we will achieve revenues or profitability levels we expect. If we cannot sell our products or are forced to reduce the prices at which we sell them, this could have a material adverse effect on our results of operations, financial condition and the ability to make cash distributions to our unitholders.
A shortage of skilled labor, together with rising labor costs, could adversely affect our results of operations and cash available for distribution to our unitholders.
Efficient production of nitrogen fertilizer using modern techniques and equipment requires skilled employees. To the extent that the services of skilled labor becomes unavailable to us for any reason, including as a result of the expiration and non-renewal of our collective bargaining agreement or the retirement of experienced employees from our aging work force, we would be required to hire other personnel. We have a collective bargaining agreement in place covering unionized employees at our East Dubuque Facility which will expire in October 2016. In addition, we have two collective bargaining agreements for our Pasadena Facility. One of these agreements expires on March 28, 2016, and the other will expire on April 30, 2016. Upon expiration, we may be unable to renew the collective bargaining agreements on satisfactory terms or at all. We face hiring competition from our competitors, our customers and other companies operating in our industry, and we may not be able to locate or employ qualified replacements on acceptable terms or at all. If our current skilled employees quit, retire or otherwise cease to be employed by us and we are unable to locate or hire qualified replacements, or if the cost to locate and hire qualified replacements for these employees increases materially, our results of operations and cash available for distribution to our unitholders could be adversely affected.
Any reduction in our credit rating could adversely affect our fertilizer business.
Rating agencies regularly evaluate the Notes, and their ratings are based on a number of factors, including our financial strength as well as factors not entirely within its control, including conditions affecting the fertilizer industry generally. There can be no assurance that the Notes will maintain their current ratings. In September 2014, Standard & Poor’s downgraded the Notes one notch to B-. While this action had little to no detrimental impact on our profitability, borrowing costs, or ability to access the capital markets, future downgrades to the Notes or our credit rating could adversely affect our profitability, borrowing costs, or ability to access the capital markets or otherwise have a negative effect on our results of operations or financial condition. Additionally, a downgrade of the credit rating of any particular security issued by us could negatively affect the ability of the holders of that security to sell the securities and the prices at which any such securities may be sold.
Our GE Credit Agreement and the Indenture governing our Notes contain significant limitations on our business operations, including our ability to make distributions to our common unitholders and other payments.
In July 2014, we entered into the GE Credit Agreement, comprised of a $50.0 million senior secured revolving credit facility, or the GE Credit Facility. In April 2013, we entered into an indenture, or the Indenture, governing our Notes.
The Indenture prohibits us from making distributions to our common unitholders if any Default (except a Reporting Default) or Event of Default (each as defined in the Indenture) exists. In addition, the Indenture contains covenants limiting our ability to pay distributions to our common unitholders. The covenants apply differently depending on our Fixed Charge Coverage Ratio (as defined in the Indenture). If the Fixed Charge Coverage Ratio is not less than 1.75 to 1.0, we will generally be permitted to make restricted payments, including distributions to our common unitholders, without substantive restriction. If the Fixed Charge Coverage ratio is less than 1.75 to 1.0, we will generally be permitted to make restricted payments, including distributions to our common unitholders, up to an aggregate $60.0 million basket plus certain other amounts referred to as “incremental funds” under the Indenture. For the year ended December 31, 2014, our Fixed Charge Coverage ratio was 3.60 to 1.00.
Under the GE Credit Agreement, in the event that, on a pro forma basis, less than 30% of the commitment amount is available for borrowing on any distribution date, then in order to make a distribution on such date (a) the Partnership must maintain a first lien leverage ratio no greater than 1.0 to 1 on a pro forma basis and (b) the sum of (i) the undrawn amount under the GE Credit Facility and (ii) cash maintained by the Partnership and its subsidiaries in collateral deposit accounts must be at least $5 million (after giving effect
33
Table of Contents
to the distribution). In addition, before the Partnership can make distributions, there cannot be any default under the GE Credit Agreement. The GE Credit Agreement also contains a requirement that the Partnership maintain a first lien leverage ratio not to exceed 1.0 to 1 at the end of each fiscal quarter where less than 30% of the commitment amount is available for drawing under the GE Credit Facility or a default has occurred and is continuing. As of December 31, 2014, the first lien leverage ratio was 0.20 to 1.
We are subject to covenants contained in the agreements governing our indebtedness and may be subject to additional agreements governing other future indebtedness. These covenants restrict our ability to, among other things, incur, assume or permit to exist additional indebtedness, guarantees and other contingent obligations, incur liens, make negative pledges, pay dividends or make other distributions, make payments to our subsidiaries, make certain loans and investments, consolidate, merge or sell all or substantially all of our assets, enter into sale-leaseback transactions and enter into transactions with our affiliates. Any failure to comply with these covenants could result in a default under our GE Credit Agreement or the Notes. Upon a default, unless waived, the lenders under our GE Credit Agreement and holders of our Notes would have all remedies available to a secured lender, including the ability to cause the outstanding amounts of such indebtedness to become due and payable in full, institute foreclosure proceedings against our assets, and force us into bankruptcy or liquidation.
We may not have sufficient funds to repay the loans under the GE Credit Agreement or to repurchase the Notes upon the occurrence of certain “change of control” events.
Upon the occurrence of a certain events defined as a “change of control” (as defined in the Indenture) each holder of the Notes may require us to repurchase some or all of the Notes at a repurchase price equal to 101% of their face amount, plus any accrued and unpaid interest. Further, the occurrence of such a change of control would constitute an event of default under the GE Credit Agreement, allowing the lenders thereunder to accelerate the loans under the agreement.
If a change of control event occurs, we may not have sufficient funds to satisfy our obligations under the Indenture and/or the GE Credit Agreement. Our failure to satisfy these obligations would be a default under the applicable agreement giving rise to the applicable counterparties’ right to pursue remedies against us. As a result, any failure to meet these obligations would have a material adverse effect on us.
We are a holding company and depend upon our subsidiaries for our cash flow.
We are a holding company. All of our operations are conducted and most of our assets are owned by our operating companies, which are our wholly owned subsidiaries, and we intend to continue to conduct our operations at the operating companies and any of our future subsidiaries. Consequently, our cash flow and our ability to meet our obligations or to make cash distributions depend upon the cash flow of our operating companies and any of our future subsidiaries and the payment of funds by our operating companies and any of our future subsidiaries to us in the form of dividends or otherwise. The ability of our operating companies and any of our future subsidiaries to make any payments to us depend on their earnings, the terms of their indebtedness, including the terms of any credit facilities and legal restrictions. In particular, our Notes and GE Credit Agreement impose, and future credit facilities entered into by our operating companies or any of our future subsidiaries may impose, significant limitations on the ability of our subsidiaries to make distributions to us and consequently our ability to make distributions to our unitholders.
Our relationship with Rentech and its business, results of operations, financial condition and prospects subjects us to potential risks that are beyond our control.
Due to our relationship with Rentech, adverse developments or announcements concerning Rentech, its business, results of operations, financial condition or prospects could materially adversely affect our financial condition, even if we have not suffered any similar development. In addition, the credit and business risk profiles of Rentech may be factors considered in credit evaluations of us. Another factor that may be considered is the financial condition of Rentech, including the degree of its dependence on cash flow from us to further its business strategy and continue its operations. In 2013, Rentech ceased operations at, reduced staffing at, and mothballed its product demonstration unit, and eliminated all related research and development activities related to its technologies. Rentech has a history of operating losses and has never operated at a profit. If Rentech does not achieve significant amounts of revenues and operate at a profit on an ongoing basis in the future, Rentech may be unable to continue its operations at its current level. Ultimately, Rentech’s ability to remain in business will depend upon earning a profit from our nitrogen fertilizer business and/or its wood fibre processing business. The credit and risk profile of Rentech could adversely affect our credit ratings and risk profile, which could increase our borrowing costs or hinder our ability to raise capital. Furthermore, financial constraints at Rentech may cause Rentech to make business decisions, including decisions to liquidate the common units that it holds in us or its interest in our general partner, which may adversely affect our business and the market price of our common units.
34
Table of Contents
An event of default under the A&R Credit Agreement or Rentech’s default of certain obligations under Rentech’s guaranty for such credit facility could trigger an acceleration under the A&R Credit Agreement and a sale of our common units owned by RNHI, or the Underlying Equity, thus reducing Rentech’s ownership of our common units.
In February 2015, RNHI, an indirect wholly owned subsidiary of Rentech, obtained financing by entering into an amended and restated credit agreement (the “A&R Credit Agreement”) and Rentech borrowed $75.0 million under such facility. As a result of the A&R Credit Agreement, we are subject to risks relating to the A&R Credit Agreement.
The A&R Credit Agreement contains customary mandatory prepayment events and events of default, including defaults by Rentech and RNHI. An event of default under the A&R Credit Agreement or Rentech’s default of certain obligations under Rentech’s guaranty for such credit facility could trigger an acceleration under the A&R Credit Agreement and a foreclosure and sale of the Underlying Equity. Such foreclosure and sale would likely result in the change of ownership of our common units.
We are exploring and evaluating potential strategic alternatives and there can be no assurance that we will be successful in identifying, or completing any strategic alternative, that any such strategic alternative will yield additional value for us or that the process will not have an adverse impact on our business.
On February 17, 2015, we announced that our general partner’s board of directors of our general partner had initiated a process to explore and evaluate potential strategic alternatives for the Partnership, which may include a sale of the Partnership, a merger with another party, a sale of some or all of its assets, or another strategic transaction. However, there can be no assurance that the exploration of strategic alternatives will result in the identification or consummation of any transaction. In addition, we expect to incur substantial expenses associated with identifying and evaluating potential strategic alternatives. The process of exploring strategic alternatives may be time consuming and disruptive to our business operations and, if we and the general partner are unable to effectively manage the process, our business, financial condition, and results of operations could be adversely affected. No decision has been made with respect to any transaction and we cannot assure you that the general partner will be able to identify and undertake any transaction that allows our unitholders to realize an increase in the value of their common units or provide any guidance on the timing of such action, if any. We also cannot assure you that any potential transaction or other strategic alternative, if identified, evaluated and consummated, will provide greater value to our unitholders than that reflected in the current price of our common units. Any potential transaction would be dependent upon a number of factors that may be beyond our control, including, among other factors, market conditions, industry trends, the interest of third parties in our business and the availability of financing to potential buyers on reasonable terms. A transaction to sell all or substantially all of our assets, including by way of a merger, generally requires the approval of the holders of a majority of our outstanding common units. We do not intend to comment regarding the evaluation of strategic alternatives until such time as the board of directors of our general partner has determined the outcome of the process or otherwise has deemed that disclosure is appropriate. As a consequence, perceived uncertainties related to our future may result in the loss of potential business opportunities and volatility in the market price of our common units and may make it more difficult for us to attract and retain qualified personnel and business partners.
Our Chief Executive Officer transition involves significant risks and our ability to successfully manage this transition and other organizational change could impact our business results.
Mr. Forman was elected as our Chief Executive Officer, and as Chief Executive Officer and President of Rentech, on December 9, 2014. He is in the process of assessing our business and refining our strategy and operations. Leadership transitions can be inherently difficult to manage, and an inadequate transition of our CEO may cause disruption to our business, including our relationships with customers. In addition, we continue to execute a number of significant business and organizational changes. Successfully managing these changes, including retention of particularly key employees, is critical to our business success.
Risks Related to an Investment in Us
We intend to distribute all of the cash available for distribution we generate each quarter, which could limit our ability to grow.
Our policy is to distribute all of the cash available for distribution we generate each quarter to our unitholders. Cash available for distribution for each quarter will be determined by the board of directors of our general partner following the end of such quarter. As a result, our general partner will rely primarily upon external financing sources, including commercial bank borrowings and the issuance of debt and equity securities by us, to fund our expansion capital expenditures, and accordingly, to the extent we are unable to finance growth externally, our cash distribution policy will significantly impair our ability to grow.
In addition, because we intend to distribute all of the cash available for distribution that we generate each quarter, our growth may not be as fast as that of businesses that reinvest their cash available for distribution to expand ongoing operations. To the extent
35
Table of Contents
we issue additional units in connection with any expansion capital expenditures, the payment of distributions on those additional units will decrease the amount we distribute on each outstanding unit. There are no limitations in our partnership agreement on our ability to issue additional units, including units ranking senior to the common units. The incurrence of additional commercial borrowings or other debt to finance our growth strategy would result in increased interest expense, which, in turn, would reduce the cash available for distribution that we have to distribute to our unitholders.
The board of directors and officers of our general partner have fiduciary duties to Rentech, and the interests of Rentech may differ significantly from, or conflict with, the interests of our public common unitholders.
Our general partner is responsible for managing us. Although our general partner has fiduciary duties to manage us in a manner that is in, or not opposed to, our best interests, the fiduciary duties are specifically limited by the express terms of our partnership agreement, and the directors and officers of our general partner also have fiduciary duties to manage our general partner in a manner beneficial to Rentech and its shareholders. The interests of Rentech and its shareholders may differ from, or conflict with, the interests of our common unitholders. In resolving these conflicts, our general partner may favor its own interests or the interests of holders of Rentech’s common stock over our interests and those of our common unitholders.
The potential conflicts of interest include, among others, the following:
| • | Neither our partnership agreement nor any other agreement requires the owners of our general partner to pursue a business strategy that favors us. The affiliates of our general partner have fiduciary duties to make decisions in their own best interests and in the best interest of holders of Rentech’s common stock, which may be contrary to our interests. In addition, our general partner is allowed to take into account the interests of parties other than us or our unitholders in resolving conflicts of interest, which has the effect of limiting its fiduciary duty to our unitholders. |
| • | Our general partner has limited its liability and reduced its fiduciary duties under our partnership agreement and has also restricted the remedies available to our unitholders for actions that, without the limitations, might constitute breaches of fiduciary duty. As a result of purchasing common units, unitholders consent to some actions and conflicts of interest that might otherwise constitute a breach of fiduciary or other duties under applicable state law. |
| • | The board of directors of our general partner will determine the amount and timing of asset purchases and sales, capital expenditures, borrowings, repayment of indebtedness and issuances of additional partner interests, each of which can affect the amount of cash that is available for distribution to our common unitholders. |
| • | Our partnership agreement does not restrict our general partner from causing us to pay it or its affiliates for any services rendered to us or entering into additional contractual arrangements with any of these entities on our behalf. There is no limitation on the amounts our general partner can cause us to pay it or its affiliates. |
| • | Our general partner may exercise its rights to call and purchase all of our common units if at any time it and its affiliates own more than 80% of our common units. |
| • | Our general partner controls the enforcement of obligations owed to us by it and its affiliates. In addition, our general partner determines whether to retain separate counsel or others to perform services for us. |
| • | Our general partner determines which costs incurred by it and its affiliates are reimbursable by us. |
| • | Certain of the executive officers of our general partner, and certain directors of our general partner, also serve as directors and/or executive officers of Rentech. The executive officers who work for both Rentech and our general partner, including our chief executive officer, chief financial officer and general counsel, divide their time between our business and the business of Rentech. These executive officers will face conflicts of interest from time to time in making decisions which may benefit either us or Rentech. |
36
Table of Contents
Our partnership agreement limits the liability and reduces the fiduciary duties of our general partner and restricts the remedies available to us and our common unitholders for actions taken by our general partner that might otherwise constitute breaches of fiduciary duty.
Our partnership agreement limits the liability and reduces the fiduciary duties of our general partner, while also restricting the remedies available to our common unitholders for actions that, without these limitations and reductions, might constitute breaches of fiduciary duty. Delaware partnership law permits such contractual reductions of fiduciary duty. By purchasing common units, common unitholders consent to some actions that might otherwise constitute a breach of fiduciary or other duties applicable under state law. Our partnership agreement contains provisions that reduce the standards to which our general partner would otherwise be held by state fiduciary duty law. For example:
| • | Our partnership agreement provides that our general partner will not have any liability to us or our unitholders for decisions made in its capacity as general partner so long as it acted in good faith, meaning it subjectively believed that the decisions were in, or not opposed to, our best interests. |
| • | Our partnership agreement provides that the doctrine of corporate opportunity, or any analogous doctrine, shall not apply to our general partner. The owners of our general partner are permitted to engage in separate businesses which directly compete with us and are not required to share or communicate or offer any potential business opportunities to us even if the opportunity is one that we might reasonably have pursued. The partnership agreement provides that the owners of our general partner will not be liable to us or any unitholder for breach of any duty or obligation by reason of the fact that such person pursued or acquired for itself any business opportunity. |
| • | Our partnership agreement provides that our general partner and the officers and directors of our general partner will not be liable for monetary damages to us for any acts or omissions unless there has been a final and non-appealable judgment entered by a court of competent jurisdiction determining that our general partner or those persons acted in bad faith or engaged in fraud or willful misconduct or, in the case of a criminal matter, acted with knowledge that such person’s conduct was criminal. |
| • | Our partnership agreement generally provides that affiliate transactions and resolutions of conflicts of interest not approved by the conflicts committee of the board of directors of our general partner and not involving a vote of unitholders must be on terms no less favorable to us than those generally provided to or available from unrelated third parties or be “fair and reasonable.” In determining whether a transaction or resolution is “fair and reasonable,” our general partner may consider the totality of the relationship between the parties involved, including other transactions that may be particularly advantageous or beneficial to us. |
| • | Our partnership agreement provides that in resolving conflicts of interest, it will be conclusively deemed that in making its decision, the conflicts committee acted in good faith. |
By purchasing a common unit, a unitholder will become bound by the provisions of our partnership agreement, including the provisions described above.
Our partnership agreement permits our general partner to make a number of decisions in its individual capacity or in its sole discretion and, as such, our general partner has no duty or obligation to give any consideration to any interest of, or factors affecting, us, our affiliates or our common unitholders in making these decisions.
Our partnership agreement contains provisions that permit our general partner to make a number of decisions in its individual capacity, as opposed to its capacity as our general partner, or in its sole discretion. This entitles our general partner to consider only the interests and factors that it desires, and it has no duty or obligation to give any consideration to any interest of, or factors affecting, us, our affiliates or our common unitholders. Decisions made by our general partner in its individual capacity or in its sole discretion will be made by RNHI as the sole member of our general partner, and not by the board of directors of our general partner. Examples include the exercise of the general partner’s call right, its voting rights with respect to any common units it may own, its registration rights and its determination whether or not to consent to any merger or consolidation or amendment to our partnership agreement. In effect, the standards to which our general partner would otherwise be held by state fiduciary duty law are reduced. By purchasing a common unit, a unitholder will become bound by the provisions of our partnership agreement, including the provisions described above.
RNHI has the power to appoint and remove our general partner’s directors.
RNHI has the power to appoint and remove all of the members of the board of directors of our general partner. Our general partner has control over all decisions related to our operations. Our public unitholders do not have an ability to influence any operating decisions and will not be able to prevent us from entering into any transactions. Furthermore, the goals and objectives of Rentech, as the indirect owner of our general partner, may not be consistent with those of our public unitholders.
37
Table of Contents
Common units are subject to our general partner’s call right.
If at any time our general partner and its affiliates own more than 80% of our common units, our general partner will have the right, which it may assign to any of its affiliates or to us, but not the obligation, to purchase all, but not less than all, of the common units held by public unitholders at a price not less than their then-current market price, as calculated pursuant to the terms of our partnership agreement. As a result, you may be required to sell your common units at an undesirable time or price and may not receive any return on your investment. You may also incur a tax liability upon a sale of your common units. Our general partner is not obligated to obtain a fairness opinion regarding the value of the common units to be repurchased by it upon exercise of the call right. There is no restriction in our partnership agreement that prevents our general partner from issuing additional common units and then exercising its call right. Our general partner may use its own discretion, free of fiduciary duty restrictions, in determining whether to exercise this right.
Our unitholders have limited voting rights and are not entitled to elect our general partner or our general partner’s directors.
Unlike the holders of common stock in a corporation, our unitholders have only limited voting rights on matters affecting our business and, therefore, limited ability to influence management’s decisions regarding our business. Unitholders will have no right to elect our general partner or our general partner’s board of directors on an annual or other continuing basis. The board of directors of our general partner, including the independent directors, will be chosen entirely by Rentech as the indirect owner of the general partner and not by our common unitholders. Unlike publicly traded corporations, we will not hold annual meetings of our unitholders to elect directors or conduct other matters routinely conducted at annual meetings of shareholders. Furthermore, even if our unitholders are dissatisfied with the performance of our general partner, they will have no practical ability to remove our general partner. As a result of these limitations, the price at which the common units will trade could be diminished.
Our public unitholders will not have sufficient voting power to remove our general partner without Rentech’s consent.
Rentech indirectly owns 59.7% of our common units. Our general partner may be removed by a vote of the holders of at least 66 2/3% of our outstanding common units, including any common units held by our general partner and its affiliates (including Rentech), voting together as a single class. As a result, public holders of our common units are not able to remove the general partner, under any circumstances, unless Rentech sells some of the common units that it owns or we sell additional units to the public.
Our partnership agreement restricts the voting rights of unitholders owning 20% or more of our common units (other than our general partner and its affiliates and permitted transferees).
Our partnership agreement restricts unitholders’ voting rights by providing that any units held by a person that owns 20% or more of any class of units then outstanding, other than our general partner, its affiliates, their transferees and persons who acquired such units with the prior approval of the board of directors of our general partner, may not vote on any matter. Our partnership agreement also contains provisions limiting the ability of common unitholders to call meetings or to acquire information about our operations, as well as other provisions limiting the ability of our common unitholders to influence the manner or direction of management.
Cost reimbursements due to our general partner and its affiliates will reduce cash available for distribution to you.
Prior to making any distribution on our outstanding units, we will reimburse our general partner for all expenses it incurs on our behalf including, without limitation, our pro rata portion of management compensation and overhead charged by Rentech in accordance with our services agreement. The services agreement does not contain any cap on the amount we may be required to pay pursuant to this agreement. The payment of these amounts, including allocated overhead, to our general partner and its affiliates could adversely affect our ability to make distributions to you.
Limited partners may not have limited liability if a court finds that unitholder action constitutes control of our business.
A general partner of a partnership generally has unlimited liability for the obligations of the partnership, except for those contractual obligations of the partnership that are expressly made without recourse to the general partner. Our partnership is organized under Delaware law and our operating companies conduct business in Illinois and Texas. Limited partners could be liable for our obligations as if such limited partners were general partners if a court or government agency determined that:
| • | we were conducting business in a state but had not complied with that particular state’s partnership statute; or |
| • | limited partners’ right to act with other unitholders to remove or replace our general partner, to approve some amendments to our partnership agreement or to take other actions under our partnership agreement constituted “control” of our business. |
38
Table of Contents
Unitholders may have liability to repay distributions.
In the event that: (i) we make distributions to our unitholders when our nonrecourse liabilities exceed the sum of (a) the fair market value of our assets not subject to recourse liability and (b) the excess of the fair market value of our assets subject to recourse liability over such liability, or a distribution causes such a result, and (ii) a unitholder knows at the time of the distribution of such circumstances, such unitholder will be liable for a period of three years from the time of the impermissible distribution to repay the distribution under Section 17-607 of the Delaware Act.
Likewise, upon the winding up of the Partnership, in the event that (a) we do not distribute assets in the following order: (i) to creditors in satisfaction of their liabilities; (ii) to partners and former partners in satisfaction of liabilities for distributions owed under our partnership agreement; (iii) to partners for the return of their contribution; and (iv) to the partners in the proportions in which the partners share in distributions, and (b) a unitholder knows at the time of the distribution of such circumstances, then such unitholder will be liable for a period of three years from the impermissible distribution to repay the distribution under Section 17-804 of the Delaware Act.
A purchaser of common units who becomes a limited partner is liable for the obligations of the transferring limited partner to make contributions to the Partnership that are known by the purchaser at the time it became a limited partner, and for unknown obligations if the liabilities could be determined from our partnership agreement.
Our unitholders who fail to furnish certain information requested by our general partner or who our general partner, upon receipt of such information, determines are not eligible citizens may not be entitled to receive distributions in kind upon our liquidation and their common units will be subject to redemption.
Our general partner may require each limited partner to furnish information about his nationality, citizenship or related status. If a limited partner fails to furnish information about his nationality, citizenship or other related status within a reasonable period after a request for the information or our general partner determines after receipt of the information that the limited partner is not an eligible citizen, the limited partner may be treated as an ineligible holder. An ineligible holder does not have the right to direct the voting of his common units and may not receive distributions in kind upon our liquidation. Furthermore, we have the right to redeem all of the common units of any holder that is an ineligible holder. The redemption price will be paid in cash or by delivery of a promissory note, as determined by our general partner.
Common units held by persons who are non-taxpaying assignees will be subject to the possibility of redemption.
To avoid any adverse effect on the maximum applicable rates chargeable to customers by us under certain laws or regulations that may be applicable to our future business or operations, or in order to reverse an adverse determination that has occurred regarding such maximum rate, our partnership agreement gives our general partner the power to amend the partnership agreement. If our general partner determines that our not being treated as an association taxable as a corporation or otherwise taxable as an entity for United States federal income tax purposes, coupled with the tax status (or lack of proof thereof) of one or more of our limited partners, has, or is reasonably likely to have, a material adverse effect on the maximum applicable rates chargeable to customers by us, then our general partner may adopt such amendments to our partnership agreement as it determines are necessary or advisable to obtain proof of the United States federal income tax status of our limited partners (and their owners, to the extent relevant) and permit us to redeem the common units held by any person whose tax status has or is reasonably likely to have a material adverse effect on the maximum applicable rates or who fails to comply with the procedures instituted by our general partner to obtain proof of the United States federal income tax status.
Our general partner’s interest in us and the control of our general partner may be transferred to a third party without unitholder consent.
Our general partner may transfer its general partner interest in us to a third party in a merger or in a sale of all or substantially all of its assets without the consent of the unitholders. Furthermore, there is no restriction in our partnership agreement on the ability of RNHI to transfer its equity interest in our general partner to a third party. The new equity owner of our general partner would then be in a position to replace the board of directors and the officers of our general partner with its own choices and to influence the decisions taken by the board of directors and officers of our general partner.
Increases in interest rates could adversely impact our unit price and our ability to issue additional equity or incur debt.
We cannot predict how interest rates will react to changing market conditions. Interest rates on our GE Credit Agreement and future credit facilities and debt securities could be higher than current levels, causing our financing costs to increase accordingly. Additionally, as with other yield-oriented securities, we expect that our unit price will be impacted by the level of our quarterly cash distributions and implied distribution yield. The distribution yield is often used by investors to compare and rank related yield-oriented
39
Table of Contents
securities for investment decision-making purposes. Therefore, changes in interest rates may affect the yield requirements of investors who invest in our common units, and a rising interest rate environment could have a material adverse impact on our unit price and our ability to issue additional equity or to incur debt as well as increasing our interest costs.
We may issue additional common units and other equity interests without your approval, which would dilute your existing ownership interests.
Under our partnership agreement, we are authorized to issue an unlimited number of additional interests without a vote of the unitholders. The issuance by us of additional common units or other equity interests of equal or senior rank will have the following effects:
| • | the proportionate ownership interest of unitholders immediately prior to the issuance will decrease; |
| • | the amount of cash distributions on each unit will decrease; |
| • | the ratio of our taxable income to distributions may increase; |
| • | the relative voting strength of each previously outstanding unit will be diminished; and |
| • | the market price of the common units may decline. |
In addition, our partnership agreement does not prohibit the issuance by our subsidiaries of equity interests, which may effectively rank senior to the common units.
The level of indebtedness we could incur in the future could adversely affect our ability to raise additional capital to fund our operations, limit our ability to react to changes in the economy or our industry and prevent us from meeting our obligations.
In April 2013, the Partnership and Rentech Nitrogen Finance Corporation, our wholly owned subsidiary (“Finance Corporation” and collectively with the Partnership, the “Issuers”), issued the Notes. In July 2014, the Partnership and Finance Corporation entered into the GE Credit Agreement. The level of indebtedness we could incur in the future could have important consequences, including:
| • | increasing our vulnerability to general economic and industry conditions; |
| • | requiring all or a substantial portion of our cash flow from operations to be dedicated to the payment of principal and interest on our indebtedness, therefore restricting or reducing our ability to use our cash flow to make distributions or to fund our operations, capital expenditures and future business opportunities; |
| • | limiting our ability to obtain additional financing for working capital, capital expenditures, debt service requirements, and general corporate or other purposes; |
| • | incurring higher interest expense in the event of increases in our GE Credit Agreement’s variable interest rates; |
| • | limiting our ability to adjust to changing market conditions and placing us at a competitive disadvantage compared to our competitors who have greater capital resources; |
| • | limiting our ability to make investments, dispose of assets, pay cash distributions or repurchase common units; and |
| • | subjecting us to financial and other restrictive covenants in our indebtedness, which may restrict our activities, and the failure to comply with which could result in an event of default. |
Our ability to make scheduled debt payments, to refinance our obligations with respect to our indebtedness and to fund capital and non-capital expenditures necessary to maintain the condition of our operating assets and properties, as well as to provide capacity for the growth of our business, depends on our financial and operating performance, which, in turn, is subject to prevailing economic conditions and financial, business, competitive, legal and other factors.
If our cash flow and capital resources are insufficient to fund our debt service obligations, we may be forced to reduce distributions, reduce or delay capital expenditures, investments or other business activities, sell assets, seek additional capital or restructure or refinance our indebtedness. These alternative measures may not be successful and may not permit us to meet our scheduled debt service obligations. Failure to pay our indebtedness on time would constitute an event of default under the agreements governing our indebtedness, which would give rise to our lenders’ ability to accelerate the obligations and seek other remedies against us.
We have identified and disclosed material weaknesses in our internal control over financial reporting, which could, if not remediated, result in material misstatements in our financial statements, adversely affect investor confidence, impair the value of our common units and increase our cost of raising capital. There is also the risk that additional control weaknesses could be discovered.
Our management identified material weaknesses in our internal control over financial reporting for the fiscal year ended December 31, 2014 relating to (i) the review of the cash flow forecasts used in the accounting for long-lived asset recoverability and goodwill impairment, (ii) the determination of the goodwill impairment charge in accordance with generally accepted accounting principles, and (iii) maintaining documentation supporting management’s review of events and changes in circumstances that indicate it is more likely than not that a goodwill impairment has occurred between annual impairment tests. For a discussion of our internal control over financial reporting and a description of the identified material weaknesses, see “Part II—Item 9A. Controls and Procedures.”
A material weakness is a deficiency, or combination of deficiencies, in internal control over financial reporting, such that there is a reasonable possibility that a material misstatement of the annual or interim financial statements will not be prevented or detected on a timely basis. Although management has implemented, and is continuing to implement, certain procedures to strengthen our internal controls, material weaknesses in our internal control over financial reporting could adversely impact our ability to provide timely and accurate financial information. If we are unsuccessful in implementing or following our remediation plan, or if we discover additional control weaknesses, we may not be able to accurately report our financial condition, results of operations or cash flows or maintain effective internal control over financial reporting. If we are unable to report financial information timely and accurately or to maintain effective disclosure controls and procedures, we could be subject to, among other things, regulatory or enforcement actions by the SEC and NYSE, including a delisting from NYSE, securities litigation and a general loss of investor confidence, any one of which could adversely affect investor confidence, impair the value of our common units and increase our cost of raising capital.
40
Table of Contents
Tax Risks
Our tax treatment depends on our status as a partnership for United States federal income tax purposes, as well as our not being subject to a material amount of entity-level taxation by individual states. If the Internal Revenue Service (“IRS”) were to treat us as a corporation for United States federal income tax purposes or if we were to become subject to additional amounts of entity-level taxation for state tax purposes, then our cash available for distribution to our unitholders would be substantially reduced.
The anticipated after-tax economic benefit of an investment in our common units depends largely on our being treated as a partnership for United States federal income tax purposes. We have not requested, and do not plan to request, a ruling from the IRS regarding our classification as a partnership.
Despite the fact that we are a limited partnership under Delaware law, it is possible in certain circumstances for a partnership such as ours to be treated as a corporation for United States federal income tax purposes. A change in our current business or a change in current law could cause us to be treated as a corporation for federal income tax purposes or otherwise subject us to entity-level taxation.
If we were treated as a corporation for United States federal income tax purposes, we would pay United States federal income tax on our taxable income at the applicable corporate tax rate, which is currently a maximum of 35%, and would likely pay additional state and local income taxes at varying rates. Distributions to our unitholders would generally be taxed again as corporate dividends (to the extent of our current and accumulated earnings and profits), and no income, gains, losses, deductions or credits would flow through to our unitholders. Moreover, if we were to be treated as a corporation for United States federal income tax purposes, there would be a material reduction in the anticipated cash flow and after tax return to our unitholders, likely causing a substantial reduction in the value of our common units.
In addition, changes in current state laws may subject us to additional entity-level taxation by individual states. We own assets and conduct business in Illinois and Texas. Several states are evaluating ways to subject partnerships to entity-level taxation through the imposition of state income, franchise or other forms of taxation. For example, the State of Texas currently imposes a franchise tax on the taxable margin of corporations and other entities, including limited partnerships. Imposition of taxes on us in other jurisdictions in which we may operate in the future could substantially reduce our cash available for distribution to unitholders.
The tax treatment of publicly traded limited partnerships or an investment in our common units could be subject to potential legislative, judicial or administrative changes and differing interpretations, possibly on a retroactive basis.
The present United States federal income tax treatment of publicly traded limited partnerships, including us, or an investment in our common units may be modified by administrative, legislative or judicial interpretation at any time, including on a retroactive basis. For example, from time to time, members of Congress and the President propose and consider substantive changes to the existing United States federal income tax laws that affect publicly traded limited partnerships, including the elimination of the qualifying income exception under Internal Revenue Code Section 7704(d), upon which we rely for our treatment as a partnership for United States federal income tax purposes. Any modification to the United States federal income tax laws and interpretations thereof may or may not be retroactively applied and could make it more difficult or impossible to meet the exception for us to be treated as a partnership for United States federal income tax purposes. However, we are unable to predict whether any such changes, or other proposals, will ultimately be enacted or, if enacted, whether they will be enacted in their proposed form, or whether they will apply to us. Any such changes could cause a substantial reduction in the value of our common units.
If the IRS contests any of the United States federal income tax positions we take, the market for our common units may be materially and adversely impacted, and the cost of any IRS contest will reduce our cash available for distribution to our unitholders.
We have not requested, and do not plan to request, a ruling from the IRS with respect to our treatment as a partnership for United States federal income tax purposes. The IRS may adopt positions that differ from the positions we take, and the IRS’s positions may ultimately be sustained. It may be necessary to resort to administrative or court proceedings to sustain some or all of the positions we take and such positions may not ultimately be sustained. A court may not agree with some or all of the positions we take. Any contest with the IRS, and the outcome of any IRS contest, may materially and adversely impact the market for our common units and the price at which they trade. In addition, our costs of any contest with the IRS will be borne indirectly by our unitholders because the costs will reduce our cash available for distribution.
41
Table of Contents
Unitholders’ share of our income will be taxable for United States federal income tax purposes even if they do not receive any cash distributions from us.
Because we expect to be treated as a partnership for United States federal income tax purposes, our unitholders will be treated as partners to whom we will allocate taxable income that could be different in amount than the cash we distribute. A unitholder’s allocable share of our taxable income will be taxable to him, which may require the payment of United States federal income taxes and, in some cases, state and local income taxes on his share of our taxable income, even if he receives no cash distributions from us. Unitholders may not receive cash distributions from us equal to their share of our taxable income or even equal to the actual tax liability that results from that income. Adjustments resulting from an IRS audit may require each unitholder to adjust a prior year’s tax liability, and possibly may result in an audit of his or her return. Any audit of a unitholder’s return could result in adjustments not related to our returns, as well as those related to our returns.
Tax gain or loss on the disposition of our common units could be more or less than expected.
If our unitholders sell common units, they will recognize a gain or loss for United States federal income tax purposes equal to the difference between the amount realized and their tax basis in those common units. Because distributions in excess of their allocable share of our net taxable income decrease their tax basis in their common units, the amount, if any, of such prior excess distributions with respect to the common units our unitholders sell will, in effect, become taxable income to our unitholders if they sell such common units at a price greater than their tax basis in those common units, even if the price they receive is less than their original cost. Furthermore, a substantial portion of the amount realized on any sale of a unitholder’s common units, whether or not representing gain, may be taxed as ordinary income due to potential recapture items, including depreciation recapture. In addition, because the amount realized includes a unitholder’s share of our nonrecourse liabilities, if our unitholders sell common units, they may incur a tax liability in excess of the amount of cash the unitholders receive from the sale.
Tax-exempt entities and non-U.S. persons face unique tax issues from owning our common units that may result in adverse tax consequences to them.
Investment in our common units by tax-exempt entities, such as employee benefit plans and individual retirement accounts (known as IRAs), and non-U.S. persons, raises issues unique to them. For example, virtually all of our income allocated to organizations that are exempt from United States federal income tax, including IRAs and other retirement plans, will be unrelated business taxable income and will be taxable to them. Distributions to non-U.S. persons will be reduced by withholding taxes, generally at the highest applicable effective tax rate, and non-U.S. persons will be required to file United States federal and state income tax returns and pay United States federal and state tax on their share of our taxable income. Unitholders that are tax-exempt entities or non-U.S. persons should consult their tax advisors before investing in our common units.
We will treat each purchaser of our common units as having the same tax benefits without regard to the actual common units purchased. The IRS may challenge this treatment, which could adversely affect the value of our common units.
Due to our inability to match transferors and transferees of common units and for other reasons, we will adopt depreciation and amortization positions that may not conform to all aspects of existing Treasury Regulations promulgated under the Internal Revenue Code, referred to as “Treasury Regulations.” A successful IRS challenge to those positions could adversely affect the amount of tax benefits available to our unitholders. It also could affect the timing of these tax benefits or the amount of gain from a unitholder’s sale of common units and could cause a substantial reduction in the value of our common units or result in audit adjustments to our unitholders’ tax returns.
We will prorate our items of income, gain, loss and deduction, for United States federal income tax purposes, between transferors and transferees of our common units each month based upon the ownership of our common units on the first day of each month, instead of on the basis of the date a particular common unit is transferred. The IRS may challenge this treatment, which could change the allocation of items of income, gain, loss and deduction among our unitholders.
We will prorate our items of income, gain, loss and deduction between transferors and transferees of our common units each month based upon the ownership of our common units on the first day of each month, instead of on the basis of the date a particular common unit is transferred. The use of this proration method may not be permitted under existing Treasury Regulations. Recently, however, the United States Treasury Department issued proposed Treasury Regulations that provide a safe harbor pursuant to which publicly traded partnerships may use a similar monthly simplifying convention to allocate tax items among transferor and transferee unitholders. Nonetheless, the proposed Treasury Regulations do not specifically authorize the use of the proration method we have adopted. If the IRS were to challenge our proration method or new Treasury Regulations were issued requiring a change, we may be required to change the allocation of items of income, gain, loss and deduction among our unitholders.
42
Table of Contents
A unitholder whose common units are loaned to a “short seller” to effect a short sale of common units may be considered as having disposed of those common units. If so, the unitholder would no longer be treated for United States federal income tax purposes as a partner with respect to those common units during the period of the loan and may recognize gain or loss from the disposition.
Because a unitholder whose common units are loaned to a “short seller” to effect a short sale of common units may be considered as having disposed of the loaned common units, he may no longer be treated for United States federal income tax purposes as a partner with respect to those common units during the period of the loan to the short seller and the unitholder may recognize gain or loss from such disposition. Moreover, during the period of the loan to the short seller, any of our income, gain, loss or deduction with respect to those common units may not be reportable by the unitholder and any cash distributions received by the common unitholder as to those common units could be fully taxable as ordinary income. Unitholders desiring to assure their status as partners and avoid the risk of gain recognition from a loan to a short seller are advised to consult a tax advisor to discuss whether it is advisable to modify any applicable brokerage account agreements to prohibit their brokers from loaning their common units.
The sale or exchange of 50% or more of our capital and profits interests during any 12-month period will result in the termination of the Partnership for United States federal income tax purposes.
We will be considered to have technically terminated the Partnership for United States federal income tax purposes if there is a sale or exchange of 50% or more of the total interests in our capital and profits within a 12-month period. For purposes of determining whether the 50% threshold has been met, multiple sales of the same common unit will be counted only once. While we would continue our existence as a Delaware limited partnership, our technical termination would, among other things, result in the closing of our taxable year for all unitholders, which would result in us filing two tax returns (and our unitholders could receive two Schedules K-1 if relief was not available, as described below) for one fiscal year and could result in a significant deferral of depreciation deductions allowable in computing our taxable income. In the case of a unitholder reporting on a taxable year other than a fiscal year ending December 31, the closing of our taxable year may also result in more than 12 months of our taxable income or loss being includable in his taxable income for the year of termination. A technical termination currently would not affect our classification as a partnership for United States federal income tax purposes, but instead, we would be treated as a new partnership for such tax purposes. If treated as a new partnership, we must make new tax elections, including a new election under Section 754 of the Internal Revenue Code, and could be subject to penalties if we are unable to determine that a technical termination occurred. The IRS has announced a publicly traded limited partnership relief procedure whereby a publicly traded limited partnership that has technically terminated may request special relief that, if granted, would, among other things, permit the Partnership to provide only a single Schedule K-1 to unitholders for the tax year notwithstanding two partnership tax years.
Unitholders will likely be subject to state and local taxes and return filing requirements in jurisdictions where they do not live as a result of investing in our common units.
In addition to United States federal income taxes, unitholders will likely be subject to other taxes, including state and local taxes, unincorporated business taxes and estate, inheritance or intangible taxes that are imposed by the various jurisdictions in which we do business or control property now or in the future, even if they do not live in any of those jurisdictions. Unitholders will likely be required to file state and local income tax returns and pay state and local income taxes in some or all of these various jurisdictions. Further, unitholders may be subject to penalties for failure to comply with those requirements. We currently own assets and conduct business in Illinois and Texas, and Illinois currently imposes a personal income tax on individuals. As we expand our business, we may own or control assets or conduct business in additional states that impose a personal income tax. It is the responsibility of each unitholder to file all United States federal, state, local and non-United States tax returns.
ITEM 1B. UNRESOLVED STAFF COMMENTS
Not Applicable.
The information required to be disclosed in this Item 2 is incorporated herein by reference to “Part I—Item 1. Business—Properties.”
We are party to litigation from time to time in the normal course of business. We maintain insurance to cover certain actions and believe that resolution of our current litigation matters will not have a material adverse effect on us.
43
Table of Contents
We are negotiating a settlement agreement with Region 6 of the Environmental Protection Agency relating to an ammonia release that occurred at our Pasadena Facility on April 20, 2014. We estimate the amount of the penalty required by the settlement agreement to be approximately $0.1 million.
ITEM 4. MINE SAFETY DISCLOSURES
Not Applicable.
ITEM 5. MARKET FOR REGISTRANT’S COMMON UNITS, RELATED UNITHOLDER MATTERS AND ISSUER PURCHASES OF COMMON UNITS
Our common units are traded on the New York Stock Exchange, or the NYSE, under the symbol “RNF.” The following table sets forth the range of high and low closing prices for our common units as reported by the NYSE for each quarterly period during the years ended December 31, 2014 and 2013:
| Year Ended December 31, 2014 |
High | Low | ||||||
| First Quarter, ended March 31, 2014 |
$ | 21.10 | $ | 17.30 | ||||
| Second Quarter, ended June 30, 2014 |
$ | 19.07 | $ | 15.42 | ||||
| Third Quarter, ended September 30, 2014 |
$ | 16.79 | $ | 12.39 | ||||
| Fourth Quarter, ended December 31, 2014 |
$ | 12.88 | $ | 8.97 | ||||
| Year Ended December 31, 2013 |
High | Low | ||||||
| First Quarter, ended March 31, 2013 |
$ | 48.40 | $ | 33.20 | ||||
| Second Quarter, ended June 30, 2013 |
$ | 37.00 | $ | 27.85 | ||||
| Third Quarter, ended September 30, 2013 |
$ | 31.77 | $ | 24.52 | ||||
| Fourth Quarter, ended December 31, 2013 |
$ | 28.91 | $ | 17.10 | ||||
The number of unitholders of record as of February 27, 2015 was 51. Based upon the securities position listings maintained for our common units by registered clearing agencies, we estimate the number of beneficial owners is not less than 12,200.
Our policy is to distribute to our unitholders all of the cash available for distribution that we generate each quarter, subject to a determination by the board of directors of our general partner that our projected liquidity is adequate to provide for our forecasted operating and working capital needs. Cash available for distribution for each quarter will be determined by the board of directors of our general partner following the end of each quarter. We expect that cash available for distribution for each quarter will generally be calculated as the cash we generate during the quarter, less cash needed for maintenance capital expenditures not funded by capital proceeds, debt service and other contractual obligations, and any increases in cash reserves for future operating or capital needs that the board of directors of our general partner deems necessary or appropriate. Increases or decreases in such reserves may be determined at any time by the board of directors of our general partner as it considers, among other things, the cash flows or cash needs expected in approaching periods. We do not intend to maintain excess distribution coverage for the purpose of maintaining stability or growth in our quarterly distribution, nor do we intend to incur debt to pay quarterly distributions. We have no legal obligation to pay distributions. Distributions are not required by our partnership agreement and our distribution policy is subject to change at any time at the discretion of the board of directors of the general partner. Any distributions made by us to our unitholders will be done on a pro rata basis. Distributions will be paid on or about 60 days after the end of each quarter.
The Notes and the GE Credit Agreement provide that dividends and distributions from us and our operating companies are permitted so long as no default or event of default has occurred, exists or will result therefrom and we have satisfied certain other conditions as described under “Part II—Item 7. Management’s Discussion and Analysis of Financial Condition and Results of Operations—Liquidity and Capital Resources—Notes Offering” and “Part II—Item 7. Management’s Discussion and Analysis of Financial Condition and Results of Operations—Liquidity and Capital Resources—GE Credit Agreement.”
44
Table of Contents
The following is a summary of cash distributions paid to common unitholders and holders of phantom units during the years ended December 31, 2014 and 2013 for the respective quarters to which the distributions relate:
| December 31, 2013 |
March 31, 2014 |
June 30, 2014 |
September 30, 2014 |
Total Cash Distributions Paid in 2014 |
||||||||||||||||
| (in thousands, except for per unit amounts) | ||||||||||||||||||||
| Distribution to common unitholders — affiliates |
$ | 1,162 | $ | 1,861 | $ | 3,022 | $ | 1,163 | $ | 7,208 | ||||||||||
| Distribution to common unitholders — non-affiliates |
792 | 1,266 | 2,060 | 789 | 4,907 | |||||||||||||||
|
|
|
|
|
|
|
|
|
|
|
|||||||||||
| Total amount paid |
$ | 1,954 | $ | 3,127 | $ | 5,082 | $ | 1,952 | $ | 12,115 | ||||||||||
|
|
|
|
|
|
|
|
|
|
|
|||||||||||
| Per common unit |
$ | 0.05 | $ | 0.08 | $ | 0.13 | $ | 0.05 | $ | 0.31 | ||||||||||
|
|
|
|
|
|
|
|
|
|
|
|||||||||||
| Common and phantom units outstanding |
39,081 | 39,081 | 39,098 | 39,030 | ||||||||||||||||
|
|
|
|
|
|
|
|
|
|||||||||||||
| December 31, 2012 |
March 31, 2013 |
June 30, 2013 |
September 30, 2013 |
Total Cash Distributions Paid in 2013 |
||||||||||||||||
| (in thousands, except for per unit amounts) | ||||||||||||||||||||
| Distribution to common unitholders — affiliates |
$ | 17,437 | $ | 11,626 | $ | 19,762 | $ | 6,277 | $ | 55,102 | ||||||||||
| Distribution to common unitholders — non-affiliates |
11,809 | 7,873 | 13,393 | 4,254 | 37,329 | |||||||||||||||
|
|
|
|
|
|
|
|
|
|
|
|||||||||||
| Total amount paid |
$ | 29,246 | $ | 19,499 | $ | 33,155 | $ | 10,531 | $ | 92,431 | ||||||||||
|
|
|
|
|
|
|
|
|
|
|
|||||||||||
| Per common unit |
$ | 0.75 | $ | 0.50 | $ | 0.85 | $ | 0.27 | $ | 2.37 | ||||||||||
|
|
|
|
|
|
|
|
|
|
|
|||||||||||
| Common and phantom units outstanding |
38,996 | 38,995 | 39,004 | 39,003 | ||||||||||||||||
|
|
|
|
|
|
|
|
|
|||||||||||||
On February 27, 2015, we made a cash distribution to our common unitholders and payments to holders of phantom units for the period October 1, 2014 through and including December 31, 2014 of $0.30 per unit, or $11.7 million in the aggregate.
Equity Compensation Plan Information
See “Part III—Item 12. Security Ownership of Certain Beneficial Owners and Management and Related Unitholder Matters” for information regarding securities authorized for issuance under equity compensation plans.
Purchases of Equity Securities by the Issuer
We did not repurchase any of our common units during the year ended December 31, 2014, and we do not have any announced or existing plans to repurchase any of our common units.
45
Table of Contents
ITEM 6. SELECTED FINANCIAL DATA
During 2012, the board of directors of our general partner approved a change in our fiscal year end from September 30 to December 31. The following tables include selected summary financial data for the years ended December 31, 2014, 2013, 2012 and 2011, the three months ended December 31, 2011 and 2010 and each of the two fiscal years ended September 30, 2011 and 2010. The statement of operations data for the calendar year ended December 31, 2011 was derived by deducting the statement of operations data for the three months ended December 31, 2010 from the statement of operations data for the fiscal year ended September 30, 2011 and then adding the statement of operations data from the three months ended December 31, 2011. The statements of operations data for calendar year ended December 31, 2011 and the three months ended December 31, 2010, while not required, are presented for comparison purposes.
The operations of the Pasadena Facility are included effective November 1, 2012, the date of the closing of the Agrifos Acquisition. The data below should be read in conjunction with “Part II—Item 7. Management’s Discussion and Analysis of Financial Condition and Results of Operations” and “Part II—Item 8. Financial Statements and Supplementary Data.”
| Calendar Years Ended December 31, |
Three Months Ended December 31, |
Fiscal Years Ended September 30, |
||||||||||||||||||||||||||||||
| 2014 | 2013 | 2012 | 2011 | 2011 | 2010 | 2011 | 2010 | |||||||||||||||||||||||||
| (unaudited) | (unaudited) | |||||||||||||||||||||||||||||||
| (in thousands, except per unit data, product pricing, $ per MMBtu and on-stream factors) | ||||||||||||||||||||||||||||||||
| STATEMENTS OF OPERATIONS DATA |
||||||||||||||||||||||||||||||||
| Revenues |
$ | 334,612 | $ | 311,375 | $ | 261,635 | $ | 199,909 | $ | 63,014 | $ | 42,962 | $ | 179,857 | $ | 131,396 | ||||||||||||||||
| Cost of sales |
$ | 274,135 | $ | 240,021 | $ | 129,796 | $ | 113,911 | $ | 37,460 | $ | 26,835 | $ | 103,286 | $ | 106,020 | ||||||||||||||||
| Gross profit |
$ | 60,477 | $ | 71,354 | $ | 131,839 | $ | 85,998 | $ | 25,554 | $ | 16,127 | $ | 76,571 | $ | 25,376 | ||||||||||||||||
| Operating income |
$ | 13,213 | $ | 19,157 | $ | 111,563 | $ | 77,918 | $ | 22,648 | $ | 14,584 | $ | 69,854 | $ | 20,389 | ||||||||||||||||
| Other expenses, net |
$ | (14,257 | ) | $ | (15,185 | ) | $ | (4,257 | ) | $ | (32,218 | ) | $ | (12,193 | ) | $ | (7,488 | ) | $ | (27,513 | ) | $ | (12,036 | ) | ||||||||
| Income (loss) before income taxes |
$ | (1,044 | ) | $ | 3,972 | $ | 107,306 | $ | 45,700 | $ | 10,455 | $ | 7,096 | $ | 42,341 | $ | 8,353 | |||||||||||||||
| Income tax (benefit) expense |
$ | 18 | $ | (96 | ) | $ | 303 | $ | 14,643 | $ | — | $ | 2,772 | $ | 17,415 | $ | 3,344 | |||||||||||||||
| Net income (loss) |
$ | (1,062 | ) | $ | 4,068 | $ | 107,003 | $ | 31,057 | $ | 10,455 | $ | 4,324 | $ | 24,926 | $ | 5,009 | |||||||||||||||
| Net income subsequent to initial public offering (November 9, 2011 through December 31, 2011) |
$ | 11,331 | $ | 11,331 | ||||||||||||||||||||||||||||
| Net income (loss) per common unit—Basic and Diluted |
$ | (0.03 | ) | $ | 0.10 | $ | 2.78 | $ | 0.30 | $ | 0.30 | |||||||||||||||||||||
| Weighted-average units used to compute net income (loss) per common unit: |
||||||||||||||||||||||||||||||||
| Basic |
38,898 | 38,850 | 38,350 | 38,250 | 38,250 | |||||||||||||||||||||||||||
| Diluted |
38,898 | 38,945 | 38,352 | 38,255 | 38,255 | |||||||||||||||||||||||||||
| FINANCIAL AND OTHER DATA |
||||||||||||||||||||||||||||||||
| Net cash flow provided by (used in): |
||||||||||||||||||||||||||||||||
| Operating activities |
$ | 64,879 | $ | 44,458 | $ | 132,546 | $ | 53,973 | $ | (5,979 | ) | $ | 23,717 | $ | 83,668 | $ | 20,144 | |||||||||||||||
| Investing activities |
$ | (72,560 | ) | $ | (90,540 | ) | $ | (186,825 | ) | $ | (26,740 | ) | $ | (11,566 | ) | $ | (2,212 | ) | $ | (17,386 | ) | $ | (11,583 | ) | ||||||||
| Financing activities |
$ | 1,649 | $ | 24,343 | $ | 65,242 | $ | (19,018 | ) | $ | 11,009 | $ | (19,818 | ) | $ | (49,844 | ) | $ | (10,288 | ) | ||||||||||||
| Adjusted EBITDA(1) |
$ | 64,677 | $ | 66,498 | $ | 128,154 | $ | 88,624 | $ | 25,935 | $ | 17,189 | $ | 79,878 | $ | 30,967 | ||||||||||||||||
| Cash available for distribution per unit(1) |
$ | 0.56 | $ | 1.67 | $ | 3.30 | $ | 0.53 | $ | 0.53 | ||||||||||||||||||||||
| KEY OPERATING DATA |
||||||||||||||||||||||||||||||||
| Products sold (tons): |
||||||||||||||||||||||||||||||||
| Ammonia(2) |
153 | 103 | 149 | 135 | 55 | 44 | 125 | 153 | ||||||||||||||||||||||||
| UAN(2) |
267 | 269 | 291 | 301 | 65 | 79 | 315 | 294 | ||||||||||||||||||||||||
| Ammonium sulfate(3) |
572 | 428 | 115 | |||||||||||||||||||||||||||||
| Products pricing (dollars per ton): |
||||||||||||||||||||||||||||||||
| Ammonia(2) |
$ | 549 | $ | 650 | $ | 669 | $ | 652 | $ | 684 | $ | 512 | $ | 588 | $ | 377 | ||||||||||||||||
| UAN(2) |
$ | 280 | $ | 295 | $ | 326 | $ | 297 | $ | 307 | $ | 193 | $ | 269 | $ | 180 | ||||||||||||||||
| Ammonium sulfate(3) |
$ | 203 | $ | 251 | $ | 300 | ||||||||||||||||||||||||||
| Production (tons): |
||||||||||||||||||||||||||||||||
| Ammonia(2) |
324 | 244 | 293 | 261 | 63 | 75 | 273 | 267 | ||||||||||||||||||||||||
| UAN(2) |
269 | 262 | 301 | 294 | 68 | 86 | 312 | 287 | ||||||||||||||||||||||||
| Ammonium sulfate(3) |
522 | 465 | 88 | |||||||||||||||||||||||||||||
| Natural gas used in production(2): |
||||||||||||||||||||||||||||||||
| Volume (MMBtu) |
11,487 | 8,942 | 10,644 | 9,789 | 2,299 | 2,813 | 10,303 | 9,923 | ||||||||||||||||||||||||
| Pricing ($ per MMBtu) |
$ | 4.98 | $ | 4.18 | $ | 3.55 | $ | 4.74 | $ | 4.71 | $ | 4.82 | $ | 4.76 | $ | 4.95 | ||||||||||||||||
| Natural gas in cost of sales (2): |
||||||||||||||||||||||||||||||||
| Volume (MMBtu) |
11,335 | 10,085 | 11,166 | 10,893 | 3,414 | 3,056 | 10,275 | 11,757 | ||||||||||||||||||||||||
| Pricing ($ per MMBtu) |
$ | 5.00 | $ | 4.16 | $ | 3.59 | $ | 4.76 | $ | 4.75 | $ | 4.38 | $ | 4.66 | $ | 4.79 | ||||||||||||||||
| On-stream factors(4): |
||||||||||||||||||||||||||||||||
| Ammonia(2) |
95.6 | % | 83.6 | % | 95.4 | % | 92.3 | % | 83.7 | % | 100.0 | % | 96.4 | % | 91.8 | % | ||||||||||||||||
| UAN(2) |
95.3 | % | 84.1 | % | 95.1 | % | 92.6 | % | 84.8 | % | 100.0 | % | 96.4 | % | 92.9 | % | ||||||||||||||||
| Ammonium sulfate(3) (5) |
82.7 | % | 76.2 | % | 88.0 | % | ||||||||||||||||||||||||||
46
Table of Contents
| As of December 31, | As of September 30, | |||||||||||||||||||||||||||
| 2014 | 2013 | 2012 | 2011 | 2010 | 2011 | 2010 | ||||||||||||||||||||||
| (unaudited) | ||||||||||||||||||||||||||||
| (in thousands) | ||||||||||||||||||||||||||||
| BALANCE SHEET DATA |
||||||||||||||||||||||||||||
| Cash |
$ | 28,028 | $ | 34,060 | $ | 55,799 | $ | 44,836 | $ | 36,621 | $ | 51,372 | $ | 34,934 | ||||||||||||||
| Working capital |
$ | 14,499 | $ | 21,188 | $ | 23,218 | $ | 31,645 | $ | (6,350 | ) | $ | (32,270 | ) | $ | 22,565 | ||||||||||||
| Construction in progress |
$ | 47,758 | $ | 33,531 | $ | 61,147 | $ | 7,062 | $ | 4,553 | $ | 20,318 | $ | 2,474 | ||||||||||||||
| Total assets |
$ | 414,316 | $ | 406,344 | $ | 376,645 | $ | 130,443 | $ | 114,052 | $ | 152,408 | $ | 108,837 | ||||||||||||||
| Debt |
$ | 335,000 | $ | 320,000 | $ | 193,290 | $ | — | $ | 91,779 | $ | 146,250 | $ | 60,875 | ||||||||||||||
| Total long-term liabilities |
$ | 342,147 | $ | 324,642 | $ | 192,961 | $ | 277 | $ | 68,446 | $ | 114,981 | $ | 54,549 | ||||||||||||||
| Total partners’ capital / stockholder’s equity (deficit) |
$ | 8,891 | $ | 23,125 | $ | 109,404 | $ | 99,191 | $ | (22,843 | ) | $ | (76,133 | ) | $ | 20,334 | ||||||||||||
| (1) | Adjusted EBITDA is defined as net income (loss) plus interest expense and other financing costs, loss on debt extinguishment, income tax (benefit) expense, depreciation and amortization, Pasadena goodwill impairment and fair value adjustment to earn-out consideration, less the loss on interest rate swaps. We calculate cash available for distribution as used in this table as Adjusted EBITDA plus non-cash compensation expense and distribution of cash reserves, less the sum of maintenance capital expenditures not funded by financing proceeds, net interest expense and other debt service and cash reserved for working capital purposes. Adjusted EBITDA and cash available for distribution are used as supplemental financial measures by management and by external users of our consolidated financial statements, such as investors and commercial banks, to assess: |
| • | the financial performance of our assets without regard to financing methods, capital structure or historical cost basis; and |
| • | our operating performance and return on invested capital compared to those of other publicly traded limited partnerships and other public companies, without regard to financing methods and capital structure. |
Adjusted EBITDA and cash available for distribution should not be considered alternatives to net income, operating income, net cash provided by operating activities or any other measure of financial performance or liquidity presented in accordance with generally accepted accounting principles in the United States of America, or GAAP. Adjusted EBITDA and cash available for distribution may have material limitations as performance measures because they exclude items that are necessary elements of our costs and operations. In addition, Adjusted EBITDA and cash available for distribution presented by other companies may not be comparable to our presentation, since each company may define these terms differently.
47
Table of Contents
The table below reconciles Adjusted EBITDA, which is a non-GAAP financial measure, to net income (loss) for the periods presented.
| For the Years Ended December 31, |
Three Months Ended December 31, |
Fiscal Years Ended September 30, |
||||||||||||||||||||||||||||||
| 2014 | 2013 | 2012 | 2011 | 2011 | 2010 | 2011 | 2010 | |||||||||||||||||||||||||
| (unaudited, in thousands) | ||||||||||||||||||||||||||||||||
| Net income (loss) |
$ | (1,062 | ) | $ | 4,068 | $ | 107,003 | $ | 31,057 | $ | 10,455 | $ | 4,324 | $ | 24,926 | $ | 5,009 | |||||||||||||||
| Add: |
||||||||||||||||||||||||||||||||
| Net interest expense |
19,057 | 14,098 | 1,424 | 12,735 | 1,933 | 2,899 | 13,701 | 9,802 | ||||||||||||||||||||||||
| Pasadena goodwill impairment |
27,202 | 30,029 | — | — | — | — | — | — | ||||||||||||||||||||||||
| Agrifos settlement |
(5,632 | ) | — | — | — | — | — | — | — | |||||||||||||||||||||||
| Loss on debt extinguishment |
635 | 6,001 | 2,114 | 19,486 | 10,263 | 4,593 | 13,816 | 2,268 | ||||||||||||||||||||||||
| Gain on fair value adjustment to earn-out consideration |
— | (4,920 | ) | — | — | — | — | — | — | |||||||||||||||||||||||
| Loss on interest rate swap |
— | 7 | 951 | — | — | — | — | — | ||||||||||||||||||||||||
| Income tax (benefit) expense |
18 | (96 | ) | 303 | 14,643 | — | 2,772 | 17,415 | 3,344 | |||||||||||||||||||||||
| Depreciation and amortization |
24,257 | 17,312 | 12,460 | 10,706 | 3,287 | 2,601 | 10,020 | 10,544 | ||||||||||||||||||||||||
| Acquisition costs |
— | — | 4,131 | — | — | — | — | — | ||||||||||||||||||||||||
| Other |
202 | (1 | ) | (232 | ) | (3 | ) | (3 | ) | — | — | — | ||||||||||||||||||||
|
|
|
|
|
|
|
|
|
|
|
|
|
|
|
|
|
|||||||||||||||||
| Adjusted EBITDA |
$ | 64,677 | $ | 66,498 | $ | 128,154 | $ | 88,624 | $ | 25,935 | $ | 17,189 | $ | 79,878 | $ | 30,967 | ||||||||||||||||
|
|
|
|
|
|
|
|
|
|
|
|
|
|
|
|
|
|||||||||||||||||
The table below reconciles cash available for distribution to Adjusted EBITDA, both of which are non-GAAP financial measures, for the periods presented.
| For the Years Ended December 31, |
Three Months Ended December 31, |
|||||||||||||||||||||||
| 2014 | 2013 | 2012 | 2011 | 2014(a) | 2011 | |||||||||||||||||||
| Adjusted EBITDA |
$ | 64,677 | $ | 66,498 | $ | 128,154 | $ | 88,624 | $ | 13,422 | $ | 25,935 | ||||||||||||
| Less: Activity prior to initial public offering |
— | — | (64,489 | ) | — | (1,800 | ) | |||||||||||||||||
| Plus: Non-cash compensation expense |
1,283 | 1,460 | 2,827 | 63 | 124 | 63 | ||||||||||||||||||
| Less: Maintenance capital expenditures (b) |
(17,188 | ) | (10,984 | ) | (8,500 | ) | (266 | ) | (3,584 | ) | (266 | ) | ||||||||||||
| Plus: Portion of maintenance capital expenditures funded by offering proceeds |
— | — | — | 1,765 | — | 1,765 | ||||||||||||||||||
| Less: Net interest expense |
(19,057 | ) | (17,972 | ) | (1,446 | ) | (57 | ) | (4,620 | ) | (57 | ) | ||||||||||||
| Less: Cash reserved for working capital |
(7,929 | ) | — | — | (5,391 | ) | — | (5,391 | ) | |||||||||||||||
| Plus: Distribution of cash reserves for working capital |
— | 25,871 | 6,110 | — | 6,332 | — | ||||||||||||||||||
|
|
|
|
|
|
|
|
|
|
|
|
|
|||||||||||||
| Cash available for distribution |
$ | 21,786 | $ | 64,873 | $ | 127,145 | $ | 20,249 | $ | 11,674 | $ | 20,249 | ||||||||||||
|
|
|
|
|
|
|
|
|
|
|
|
|
|||||||||||||
| Cash available for distribution per unit |
$ | 0.56 | $ | 1.67 | $ | 3.30 | $ | 0.53 | $ | 0.30 | $ | 0.53 | ||||||||||||
| Common units outstanding(c) |
38,868 | 38,856 | 38,529 | 38,250 | 38,913 | 38,250 | ||||||||||||||||||
| (a) | The amounts in this column are also included in the amounts for the calendar year ended December 31, 2014. This column provides information relating to the cash distribution paid on February 27, 2015. |
| (b) | Excludes maintenance capital expenditures at our Pasadena Facility funded by debt in the amount of $14.5 million for the year ended December 31, 2014 and $7.3 million for the year ended December 31, 2013. |
| (c) | Common units outstanding for each period represents average common units for distributions paid. |
| (2) | Key operating data for the East Dubuque Facility. |
| (3) | Key operating data for the Pasadena Facility. |
48
Table of Contents
| (4) | The respective on-stream factors for the ammonia, UAN and ammonium sulfate plant equal the total days the applicable plant operated in any given period, divided by the total days in that period. |
| (5) | The ammonium sulfate plant is typically out of service for 12 to 14 hours per week for regular maintenance. |
ITEM 7. MANAGEMENT’S DISCUSSION AND ANALYSIS OF FINANCIAL CONDITION AND RESULTS OF OPERATIONS
You should read the following discussion and analysis of our financial condition, results of operations and cash flows in conjunction with the consolidated financial statements and related notes included elsewhere in this report. This discussion and analysis contains forward-looking statements that involve risks, uncertainties and assumptions. Our actual results may differ materially from those anticipated in these forward-looking statements as a result of a number of factors, including, but not limited to, those set forth under “Part I—Item 1A. Risk Factors,” “Forward-Looking Statements” and elsewhere in this report.
OVERVIEW
We are a Delaware master limited partnership formed in July 2011 by Rentech to own, operate and expand our fertilizer business. We own and operate two fertilizer facilities: our East Dubuque Facility and our Pasadena Facility. Our East Dubuque Facility is located in East Dubuque, Illinois and produces primarily ammonia and urea ammonium nitrate solution, or UAN, using natural gas as the facility’s primary feedstock. Our Pasadena Facility is located in Pasadena, Texas, and produces ammonium sulfate, ammonium thiosulfate and sulfuric acid, using ammonia and sulfur as the facility’s primary feedstock. The facility also produces electricity for sale.
Our East Dubuque Facility is located in the center of the Mid Corn Belt, the largest market in the United States for direct application of nitrogen fertilizer products. The Mid Corn Belt includes the States of Illinois, Indiana, Iowa, Missouri, Nebraska and Ohio. The States of Illinois and Iowa have been the top two corn producing states in the United States for the last 20 years according to the USDA. We consider the market for our East Dubuque Facility to be comprised of the States of Illinois, Iowa and Wisconsin.
Our East Dubuque Facility’s core market consists of the area located within an estimated 200-mile radius of the facility. In most instances, our customers take delivery of our nitrogen products at our East Dubuque Facility and then arrange and pay to transport them to their final destinations by truck. To the extent our products are picked up at our East Dubuque Facility, we do not incur any shipping costs, in contrast to nitrogen fertilizer producers located outside of the facility’s core market that must incur transportation and storage costs to transport their products to, and sell their products in, our market. In addition, our East Dubuque Facility does not maintain a fleet of trucks and, unlike some of our major competitors, our East Dubuque Facility does not maintain a fleet of rail cars because the facility’s customers generally are located close to the facility and prefer to be responsible for transportation. Having no need to maintain a fleet of trucks or rail cars lowers our East Dubuque Facility’s fixed costs. The combination of our East Dubuque Facility’s proximity to its customers and our storage capacity at the facility also allows for better timing of the pick-up and application of the facility’s products, as nitrogen fertilizer product shipments from more distant locations have a greater risk of missing the short periods of favorable weather conditions during which the application of nitrogen fertilizer may occur.
Our Pasadena Facility is the largest producer of synthetic ammonium sulfate and the third largest producer of ammonium sulfate in North America. We believe that our ammonium sulfate has several characteristics that distinguish it from competing products. In general, the ammonium sulfate that is available for sale in our industry is a byproduct of other processes and does not have certain characteristics valued by customers. Our ammonium sulfate is sized to the specifications preferred by customers and may more easily be blended with other fertilizer products. We also believe that our ammonium sulfate has a longer shelf-life, is more stable and is more easily transported and stored than many competing products.
Our Pasadena Facility is located on the Houston Ship Channel with access to transportation at favorable prices. The facility has two deep-water docks and access to the Mississippi waterway system and key international waterways. The facility is also connected to key domestic railways, which permit the efficient, cost-effective distribution of its products west of the Mississippi River. Our Pasadena Facility’s distributors purchase our products at our facility and then arrange and pay to transport them to their final destinations by truck, rail car or vessel. Our Pasadena Facility’s products are sold primarily through distributors to customers in the United States, and are applied to many types of crops including soybeans, potatoes, cotton, canola, alfalfa, corn and wheat.
While we experience seasonality in our domestic sales of ammonium sulfate and ammonium thiosulfate, our sales internationally offset a portion of this seasonal impact in our total revenues. Further, we adjust the sales prices of these products seasonally in order to facilitate distribution of the products throughout the year. We operate the ammonium sulfate plant at our Pasadena Facility throughout the year to the extent that there is available on-site storage capacity for this product. We have 60,000 tons of storage capacity for ammonium sulfate at the facility, and an arrangement with IOC that permits us to store approximately 60,000 tons of ammonium sulfate at IOC-controlled terminals. We manage the storage capacity by distributing the product through IOC to customers in both domestic and offshore markets throughout the year. If storage capacity becomes insufficient, we would be forced to cease production of the product until such capacity becomes available. Our Pasadena Facility’s fertilizer products are delivered to IOC and sold at prevailing market prices for immediate delivery.
49
Table of Contents
Our Pasadena Facility purchases ammonia as a feedstock at contractual prices based on the monthly Tampa Index market, while our East Dubuque Facility sells ammonia at prevailing prices in the Mid Corn Belt region. Ammonia prices are typically significantly higher in the Mid Corn Belt than in Tampa.
Several negative factors affected our operating results in 2014. Sales volumes were lower than we had expected due to both unplanned downtime at the East Dubuque Facility and a decision to reduce output and sales from our Pasadena Facility in order to improve the profitability of that facility. We also wrote down all of the remaining goodwill ($27.2 million) at our Pasadena Facility during the year, reflecting the continued outlook for profits to be lower than we had foreseen at the time of the Agrifos Acquisition. For further information concerning our potential financing needs and related risks, see “Part I—Item 1. Business” and “Part I— Item 1A. Risk Factors.”
Factors Affecting Comparability of Financial Information
Our historical results of operations for the periods presented may not be comparable with our results of operations for subsequent periods for the reasons discussed below.
Agrifos Acquisition
The Pasadena Facility’s operations are included in our historical operating results from the closing date of the Agrifos Acquisition, which was November 1, 2012. Our Pasadena Facility produces three products that we did not produce or sell before the Agrifos Acquisition: ammonium sulfate, ammonium thiosulfate and sulfuric acid. The Agrifos Acquisition also broadened the geographic area into which our products are sold. Upon the closing of the acquisition (i) general and administrative expenses as well as sales-related expenses increased due to the addition of RNPLLC’s operations, (ii) depreciation and amortization expenses have increased due to the increase in fixed and intangible assets, which were recorded at fair value on the date of the Agrifos Acquisition, and (iii) interest expense increased due to the debt incurred to finance a significant portion of the purchase price for the Agrifos Acquisition. As a result, our results of operations for the periods prior to and after the closing date of the Agrifos Acquisition may not be comparable.
Expansion Projects and Other Significant Capital Projects
As discussed in “Part I—Item 1. Business—Our East Dubuque Facility—Expansion Projects and Other Significant Capital Projects” and “Part I—Item 1. Business—Our Pasadena Facility —Expansion Projects and Other Significant Capital Projects,” we have commenced additional projects and are evaluating other potential projects to expand the production capabilities and product offerings at our facilities. We expect to incur significant costs and expenses developing and building such projects. Our depreciation expense has increased and we expect our depreciation expense to increase further as we place additional assets into service. Consequently, our operating results may not be comparable for periods before, during and after the construction of any expansion project or other significant capital project.
Restructuring of Pasadena’s Operations
In late 2014, we restructured operations at our Pasadena Facility. As part of the restructuring, our Pasadena Facility reduced expected annual production of ammonium sulfate by approximately 25 percent, to 500,000 tons. We intend to sell 70 percent of the 500,000 tons in the domestic market and the remaining tons in New Zealand and Australia, which are historically the international markets with the highest net prices for ammonium sulfate. Our sales plan reduces historically low-margin sales to Brazil, other than modest amounts expected during peak seasons when higher margins may be achievable. The restructuring plan provides the flexibility to increase ammonium sulfate production above the 500,000 ton rate for limited periods, if needed. The restructuring plan also included a reduction of the number of contractors and employees at the Pasadena Facility, which reduced the full-time equivalent workforce by approximately 20 percent. Severance and other one-time employee-related expenses of $0.2 million were recorded for the year ended December 31, 2014 in connection with these reductions in the workforce.
We expect the restructuring to reduce operating and selling, general and administrative expenses and annual maintenance capital expenditures. This should enable our Pasadena Facility’s operations, including the benefits from our power generation project, to generate positive EBITDA in 2015, based on our current outlook for input costs and prices of ammonium sulfate and other products. We cannot assure you that we will obtain these anticipated benefits from the restructuring. If we do not obtain the anticipated benefits, this could have a material adverse effect on our results of operations and financial condition.
50
Table of Contents
Key Industry Factors
Supply and Demand
Our earnings and cash flow from operations are significantly affected by nitrogen fertilizer product prices, the prices of the inputs to our production processes, and the timing of product deliveries as required by our customers. The price at which we ultimately sell our nitrogen fertilizer products depends on numerous factors, including the global and local supply and demand for nitrogen fertilizer products which, in turn, depends on, among other factors, world grain demand and prices, inventory and production levels, changes in world population, the cost and availability of natural gas, ammonia and sulfur in various regions of the world, the cost and availability of fertilizer transportation infrastructure, weather conditions, the availability of imports and the extent of government intervention in agriculture markets. Nitrogen fertilizer prices are also affected by local factors, including weather and soil conditions, local market conditions and the operating levels of competing facilities. Construction of new facilities or the expansion or upgrade of our competitors’ existing facilities, international political and economic developments and other factors are likely to continue to play an important role in nitrogen fertilizer industry economics. These factors can impact, among other things, the level of inventories in the market, resulting in price volatility and a reduction in product margins. In addition, demand for fertilizers is affected by the aggregate crop planting decisions and fertilizer application rate decisions of individual farmers. Individual farmers make planting decisions based largely on the prospective profitability of a harvest, while the specific varieties and amounts of fertilizer they apply depend on factors including crop prices, their current liquidity, soil conditions, weather patterns and the types of crops planted. Moreover, the industry typically experiences seasonal fluctuations in demand for nitrogen fertilizer products.
Our results for 2014 were adversely affected by escalating feedstock costs at our Pasadena Facility, higher exports of ammonium sulfate, which typically sells at a discount from products sold in the domestic market, and low-priced urea from China that put downward pressure on fertilizer prices. In addition, we incurred significant incremental maintenance costs due to unscheduled down time at both our East Dubuque and Pasadena facilities, which also decreased the amount of product available for sale. Escalating costs for ammonia and sulfur drove our Pasadena Facility’s production costs much higher than expected. Offshore ammonia prices surged higher during the second half of 2014, without a corresponding increase in nitrogen fertilizer prices that has historically occurred. The increase in ammonia prices was due to lower ammonia production caused by natural gas curtailments and political unrest in multiple areas of the globe. These conditions have improved with Black Sea ammonia shipments resuming along with increased ammonia production in Trinidad. Chinese urea exports rose throughout the year increasing by more than five million tons, as compared to 2013. Chinese ammonium sulfate exports also grew during the same period. These factors were the key reasons for the downward pressure on our fertilizer prices. Market conditions have improved during the first two months of 2015 for our Pasadena operations with Tampa ammonia prices declining. At the same time, ammonium sulfate prices remain firm along with lower levels of inventory available. Midwest ammonia prices have remained firm and stable during the dynamic swing in offshore pricing. The spread between Tampa and Midwest prices continues to widen. As of the date of this report, grain prices are lower than they have been in the past three years. Farmers may switch corn acres that generate low returns to other crops. Current corn planting estimates are slightly below the actual amounts for 2014. We do not anticipate that our East Dubuque Facility’s market will experience this decline. However, lower aggregate corn acres could reduce the total nitrogen consumed in North America, which could negatively impact our business. At this time, natural gas prices are very favorable, which is expected to positively impact our business.
Natural Gas Prices
Natural gas is the primary feedstock for the production of nitrogen fertilizers at our East Dubuque Facility. For the year ended December 31, 2014, natural gas accounted for 64% of the production costs for ammonia, 65% of ammonia production costs for the year ended December 31, 2013 and 64% of ammonia production costs for the year ended December 31, 2012. Over the last five years, United States natural gas reserves have increased significantly due to, among other factors, advances in extracting shale gas, which have reduced and stabilized natural gas prices, providing North America with a cost advantage over Europe. As a result, our competitive position and that of other North American nitrogen fertilizer producers have been positively impacted.
51
Table of Contents
We historically have purchased natural gas in the spot market, through the use of forward purchase contracts, or a combination of both. We historically have used forward purchase contracts to lock in pricing for a portion of our East Dubuque Facility’s natural gas requirements. These forward purchase contracts are generally either fixed-price or index-price, short-term in nature and for a fixed supply quantity. We are able to purchase natural gas at competitive prices due to our East Dubuque Facility’s connection to Nicor’s distribution system and its proximity to the Northern Natural Gas interstate pipeline system. Over the past several years, natural gas prices have experienced significant fluctuations, which has had an impact on our East Dubuque Facility’s cost of producing nitrogen fertilizer. The following table shows the amount we spent on natural gas in cost of sales and the average cost per MMBtu:
| For the Years Ended December 31, |
||||||||||||
| 2014 | 2013 | 2012 | ||||||||||
| Natural Gas in Cost of Sales: |
||||||||||||
| Amount spent |
$ | 56.7 million | $ | 42.0 million | $ | 39.9 million | ||||||
| Pricing ($ per MMBtu) |
$ | 5.00 | $ | 4.16 | $ | 3.59 | ||||||
For more information on natural gas purchase commitments see “Part I—Item 1. Business—Our East Dubuque Facility—Raw Materials.”
Ammonia Prices
Ammonia, along with sulfuric acid, are the primary feedstocks for the production of ammonium sulfate at our Pasadena Facility. Ammonia accounts for 80% and sulfur accounts for 20% of the raw material composition of ammonium sulfate. Ammonia pricing is based on a published Tampa, Florida market index. The Tampa Index is commonly used in annual contracts for both the agricultural and industrial sectors, and is based on the most recent major industry transactions in the Tampa market. Pricing considerations for ammonia incorporate international supply-demand, ocean freight and production factors. Over the past several years, ammonia prices have experienced large fluctuations. During the year ended December 31, 2014, our Pasadena Facility spent $66.0 million on ammonia, $68.1 million on ammonia in the year ended December 31, 2013 and $74.8 million on ammonia in the year ended December 31, 2012. During the years ended December 31, 2014, 2013 and 2012, 90%, 90% and 75%, respectively, of the sulfuric acid used in our Pasadena Facility’s production of ammonium sulfate was produced at our Pasadena Facility.
Sulfur Prices
Sulfur is the primary feedstock for the production of sulfuric acid at our Pasadena Facility, accounting for 100% of the raw material composition of sulfuric acid. Our contracts with the major suppliers of sulfur generally have a term of one year. Once pricing for the first quarter of a year is negotiated, the price then fluctuates up or down each subsequent quarter based on changes to the Tampa Index that is set on a quarterly basis through negotiations between large industry producers and consumers. Over the past several years, sulfur prices have experienced significant fluctuations. Our Pasadena Facility spent $17.9 million on sulfur during the year ended December 31, 2014, $20.8 million for the year ended December 31, 2013 and $26.0 million for the year ended December 31, 2012.
Transportation Costs
Costs for transporting nitrogen fertilizer can be significant relative to its selling price. For example, ammonia is costly to transport because it is a toxic gas at ambient temperatures and therefore must be transported under refrigeration in specialized equipment. The United States imported an average of over 50% of its annual fertilizer needs between 1999 and 2009 according to the USDA. Therefore, nitrogen fertilizer prices in North America are influenced by the cost to transport product from exporting countries, granting an advantage to local producers who ship over shorter distances.
The price of our East Dubuque Facility’s nitrogen fertilizer products is impacted by our transportation cost advantage over out-of-region competitors serving our East Dubuque Facility’s core market. In most instances, our East Dubuque Facility’s customers purchase our nitrogen products at the facility and then arrange and pay to transport them to their final destinations by truck. To the extent our products are picked up at the facility, we do not incur any shipping costs, in contrast to nitrogen fertilizer producers outside of our East Dubuque Facility’s core market that must incur transportation and storage costs to transport their products to, and sell their products in, our market. Accordingly, we may offer our East Dubuque Facility’s nitrogen fertilizers at market prices that factor in the storage and transportation costs of out-of-region producers without having incurred such costs. In addition, we do not maintain a fleet of trucks and, unlike some of our major competitors, we do not maintain a fleet of rail cars, which lowers our fixed costs.
52
Table of Contents
Our Pasadena Facility is located on the Houston Ship Channel with access to transportation at favorable prices by barge, truck or rail. The facility has two deep-water docks and access to the Mississippi waterway system and international waterways. The docks at the facility are suitable for loading and unloading bulk or liquid barges with payloads of up to 35,000 tons. The facility is also connected to key domestic railways which permit the efficient, cost-effective distribution of its products west of the Mississippi River. Our location on the Houston Ship Channel allows our distributors or us to use low cost barge and vessel transport when selling products and purchasing feedstocks. Our Pasadena Facility’s distributors purchase our products at our facility and then arrange and pay to transport them to their final destinations by truck, rail car or vessel.
Key Operational Factors
Prepaid contracts
We enter into prepaid contracts committing our East Dubuque Facility’s customers to purchase the facility’s nitrogen fertilizer products at a later date. To a lesser extent, we also enter into prepaid contracts for our Pasadena Facility’s products. These customers pay a portion of the contract price for our products shortly after entering into such contracts and the remaining balance of the contract price prior to picking up or delivery of the products. We recognize revenue when products are picked-up or delivered and the customer takes title. The cash received from product prepayments increases our operating cash flow in the quarter in which the cash is received, but may effectively reduce our operating cash flow in a subsequent quarter if the cash was received in a quarter prior to the one in which the revenue is recorded. Our policy is to purchase under fixed-price forward contracts approximately enough natural gas to manufacture the products that have been sold by our East Dubuque Facility under prepaid contracts for later delivery, effectively fixing most of the gross margin on pre-sold product. Our earnings and operating cash flow in future periods may be affected by the degree to which we continue this practice or seek to maximize our gross margins by more opportunistically timing product sales and natural gas purchases.
Facility Reliability
Consistent, safe and reliable operations at our facilities are critical to our financial performance and results of operations. Unplanned shutdowns of our facilities may result in lost margin opportunity, increased maintenance expense, a temporary increase in working capital investment and reduced inventory available for sale. The financial impact of planned shutdowns, including facility turnarounds, is mitigated through a diligent planning process that takes into account the availability of resources to perform the needed maintenance, feedstock logistics and other factors. Our facilities generally undergo a facility turnaround every two years. Turnarounds at our East Dubuque Facility typically last 18 to 25 days and cost approximately $4.0 to $6.0 million per turnaround, and turnarounds at our Pasadena Facility generally last between 14 and 25 days and cost approximately $2.0 to $4.0 million per turnaround. These costs are expensed as incurred. Our East Dubuque Facility underwent a turnaround in the fourth quarter of 2013 at a cost of $7.9 million so that we could complete the ammonia production and storage capacity project at the East Dubuque Facility. This turnaround lasted longer than expected, which resulted in higher turnaround expenses than expected. Our Pasadena Facility underwent a turnaround in the third quarter of 2014 at a cost of $2.1 million plus unanticipated maintenance expenses of $1.3 million. In December 2013, the ammonium sulfate plant at the Pasadena Facility underwent a turnaround in order to complete the ammonium sulfate debottlenecking and production capacity project at a cost of $1.7 million. Except in cases in which a turnaround may be needed to complete expansion or other projects (as was the case in 2014 and 2013), we intend to alternate the year in which a turnaround occurs at each facility, so that both facilities do not experience a turnaround in the same year.
In many cases, we also perform significant maintenance capital projects at our facilities during a turnaround to minimize disruption to our operations. These capital projects are capitalized as property, plant and equipment rather than expensed as turnaround costs. See “—Liquidity and Capital Resources—Capital Expenditures” for more information related to maintenance capital expenditure at our East Dubuque Facility and at our Pasadena Facility.
CRITICAL ACCOUNTING POLICIES AND ESTIMATES
Preparing our consolidated financial statements in conformity with GAAP requires management to make estimates and judgments that affect the reported amounts of assets, liabilities, revenues, and expenses, and related disclosure of contingent assets and liabilities. Actual results may differ based on the accuracy of the information utilized and subsequent events. Our accounting policies are described in the notes to our audited consolidated financial statements included elsewhere in this report. Our critical accounting policies, estimates and assumptions could materially affect the amounts recorded in our consolidated financial statements. The most significant estimates and assumptions relate to: revenue recognition, inventories, valuation of long-lived assets and intangible assets, recoverability of goodwill, accounting for major maintenance and the acquisition method of accounting.
Revenue Recognition. We recognize revenue when the following elements are substantially satisfied: when the customer takes ownership from our facilities or storage locations and assumes risk of loss; there are no uncertainties regarding customer acceptance; collection of the related receivable is probable; there is persuasive evidence that a sale arrangement exists and the sales price is fixed or determinable. Management assesses the business environment, the customer’s financial condition, historical collection experience, accounts receivable aging and customer disputes to determine whether collectibility is reasonably assured. If collectibility is not considered reasonably assured at the time of sale, we do not recognize revenue until collection occurs.
53
Table of Contents
Certain product sales occur under prepaid contracts which require payment in advance of delivery. We record a liability for deferred revenue in the amount of, and upon receipt of, cash in advance of shipment. We recognize revenue related to prepaid contracts and relieve the liability for deferred revenue when customers take ownership of products. A significant portion of the revenue recognized during any period may be related to prepaid contracts, for which cash may have been collected during an earlier period, with the result being that a significant portion of revenue recognized during a period may not generate cash receipts during that period.
Natural gas, although not typically purchased for the purpose of resale, is occasionally sold under certain circumstances. Natural gas is sold when purchase commitments are in excess of production requirements or storage capacities, or when the margin from selling natural gas significantly exceeds the margin from producing additional ammonia, in which case the sales price is recorded in revenues and the related cost is recorded in cost of sales.
Inventories. Our inventory is stated at the lower of cost or estimated net realizable value. The cost of inventories is determined using the first-in first-out method. We perform an analysis of our inventory balances at least quarterly to determine if the carrying amount of inventories exceeds their net realizable value. The analysis of estimated net realizable value is based on customer orders, market trends and historical pricing. If the carrying amount exceeds the estimated net realizable value, the carrying amount is reduced to the estimated net realizable value. We allocate fixed production overhead costs to inventory based on the normal capacity of our production facilities.
Valuation of Long-Lived Assets and Finite-Lived Intangible Assets. We assess the realizable value of long-lived assets and finite-lived intangible assets for potential impairment whenever events or changes in circumstances indicate that the carrying value may not be recoverable. In assessing the recoverability of our assets, we make assumptions regarding estimated future cash flows and other factors to determine the fair value of the respective assets. As applicable, we make assumptions regarding the useful lives of the assets. If these estimates or their related assumptions change in the future, we may be required to record impairment charges for these assets.
Recoverability of Goodwill. We recorded goodwill impairments in 2014 and 2013. We test goodwill for impairment annually, or more often if an event or change of circumstance indicates that an impairment may have occurred. The first step of the required impairment test consists of a comparison of the fair value of a reporting unit to its carrying value. The determination of fair value involves a high degree of judgment as there are significant assumptions underlying the valuation. If the fair value of a reporting unit is greater than its carrying value, then there is no indication of potential impairment and step two of the goodwill impairment test is not required. If an indication of potential impairment exists, then step two is required whereby the fair value of the reporting unit is allocated to all of its assets and liabilities excluding goodwill, with the residual amount representing the fair value of goodwill. An impairment loss is measured as the amount by which the book value of the reporting unit’s goodwill exceeds the estimated fair value of goodwill.
Accounting for Major Maintenance. Expenditures for improving, replacing or adding to assets are capitalized. Expenditures for the acquisition, construction or development of new assets to maintain operating capacity, or to comply with environmental, health, safety or other regulations, are also capitalized. Costs of general maintenance and repairs are expensed. The East Dubuque Facility and Pasadena Facility require a planned maintenance turnaround every two years. Turnarounds at the East Dubuque Facility generally last between 18 and 25 days, and turnarounds at the Pasadena Facility generally last between 14 and 25 days. We intend to alternate the year in which a turnaround occurs at each facility, so that both facilities do not experience a turnaround in the same year. As a result, the facilities incur turnaround expenses which represent the cost of shutting down the plants for planned maintenance. Such costs are expensed as incurred. In many cases, the East Dubuque Facility and the Pasadena Facility also perform significant maintenance capital projects at the plants during a turnaround to minimize disruption to operations. Such projects are capitalized as property, plant and equipment rather than expensed as turnaround costs.
Examples of maintenance capital projects include the installation of additional components and projects that increase an asset’s useful life, increase the quantity or quality of the product manufactured or create efficiencies in the production process. Major turnaround costs, which are expensed, include gas, electricity and other shutdown and startup costs, labor, contractor and materials costs used to complete non-capital activities such as opening, dismantling, inspecting and reassembling major vessels, testing pressure and safety devices, cleaning or hydro-jetting major exchangers, replacing gaskets, repacking valves, checking instrument calibration and performing mechanical integrity inspections, all of which are completed with the goal of improving reliability and likelihood for continuous operation until the next turnaround.
Acquisition Method of Accounting. We account for business combinations using the acquisition method of accounting, which requires, among other things, that assets acquired, liabilities assumed and potential earn-out consideration be recognized at their respective fair values as of the acquisition date. The earn-out consideration will be measured at each reporting date with changes in its fair value recognized in the consolidated statements of operations.
54
Table of Contents
Business Segments
We operate in two business segments, as described below. The Pasadena Facility’s operations are only included in our historical operating results from the closing date of the Agrifos Acquisition, which was November 1, 2012.
| • | East Dubuque – The operations of the East Dubuque Facility, which produces primarily ammonia and UAN. |
| • | Pasadena – The operations of the Pasadena Facility, which produces primarily ammonium sulfate. |
| For the Years Ended December 31, |
||||||||||||
| 2014 | 2013 | 2012 | ||||||||||
| (in thousands) | ||||||||||||
| Revenues: |
||||||||||||
| East Dubuque |
$ | 196,379 | $ | 177,700 | $ | 224,205 | ||||||
| Pasadena |
138,233 | 133,675 | 37,430 | |||||||||
|
|
|
|
|
|
|
|||||||
| Total revenues |
$ | 334,612 | $ | 311,375 | $ | 261,635 | ||||||
|
|
|
|
|
|
|
|||||||
| Gross profit (loss): |
||||||||||||
| East Dubuque |
$ | 74,785 | $ | 80,883 | $ | 133,543 | ||||||
| Pasadena |
(14,308 | ) | (9,529 | ) | (1,704 | ) | ||||||
|
|
|
|
|
|
|
|||||||
| Total gross profit |
$ | 60,477 | $ | 71,354 | $ | 131,839 | ||||||
|
|
|
|
|
|
|
|||||||
| Operating income (loss) |
||||||||||||
| East Dubuque |
$ | 69,888 | $ | 75,310 | $ | 125,984 | ||||||
| Pasadena |
(47,907 | ) | (48,208 | ) | (2,648 | ) | ||||||
|
|
|
|
|
|
|
|||||||
| Total segment operating income |
$ | 21,981 | $ | 27,102 | $ | 123,336 | ||||||
|
|
|
|
|
|
|
|||||||
| Net income (loss): |
||||||||||||
| East Dubuque |
$ | 69,803 | $ | 75,244 | $ | 123,721 | ||||||
| Pasadena |
(47,925 | ) | (48,357 | ) | (2,648 | ) | ||||||
|
|
|
|
|
|
|
|||||||
| Total segment net income |
$ | 21,878 | $ | 26,887 | $ | 121,073 | ||||||
|
|
|
|
|
|
|
|||||||
| Reconciliation of segment net income to consolidated net income (loss): |
||||||||||||
| Segment net income |
$ | 21,878 | $ | 26,887 | $ | 121,073 | ||||||
| Partnership and unallocated expenses recorded as selling, general and administrative expenses |
(8,768 | ) | (7,945 | ) | (11,773 | ) | ||||||
| Partnership and unallocated income (expenses) recorded as other income (expense) |
4,800 | (1,081 | ) | 232 | ||||||||
| Unallocated interest expense and loss on interest rate swaps |
(18,972 | ) | (14,096 | ) | (2,226 | ) | ||||||
| Income tax benefit (expense) |
— | 303 | (303 | ) | ||||||||
|
|
|
|
|
|
|
|||||||
| Consolidated net income (loss) |
$ | (1,062 | ) | $ | 4,068 | $ | 107,003 | |||||
|
|
|
|
|
|
|
|||||||
Partnership and unallocated expenses represent costs that relate directly to us and our subsidiaries but are not allocated to a segment. Partnership and unallocated expenses recorded in selling, general and administrative expenses consist primarily of business development expenses for the Partnership; unit-based compensation expense for executives of the Partnership; services from Rentech for executive, legal, finance, accounting, human resources, and investor relations support in accordance with the services agreement between the Partnership and Rentech; audit and tax fees; legal fees; compensation for Partnership level personnel; certain insurance costs; and board of director expenses.
Partnership and unallocated expenses recorded as selling, general and administrative expenses for the year ended December 31, 2014 were $8.8 million, compared to $7.9 million for the same period in the prior year. The increase was primarily due to a one-time expense related to severance of $1.0 million, partially offset by a decrease in bonus expense of $0.5 million. Non-cash unit–based compensation expense, recorded in selling, general and administrative expenses, was $1.3 million for the year ended December 31, 2014, compared to $1.5 million for the same period in the prior year.
55
Table of Contents
Partnership and unallocated expenses recorded as selling, general and administrative expenses for the year ended December 31, 2013 were $7.9 million, compared to $11.8 million for the same period in the prior year. The decrease was primarily due to decreases in business development expenses of $3.5 million and unit-based compensation of $1.4 million, partially offset by increases in various professional services fees of $0.5 million and salaries of $0.5 million.
Partnership and unallocated income recorded as other income for the year ended December 31, 2014 was $4.8 million, compared to partnership and unallocated expense recorded as other expense of $1.1 million for the same period in the prior year. The primary reason for the change from expense to income was the Agrifos settlement of $5.6 million in October 2014. Under the Agrifos settlement, we reached an agreement to settle all existing and future indemnity claims we may have under the Membership Interest Purchase Agreement dated October 31, 2012, as amended, pursuant to the Agrifos Acquisition. The parties agreed to distribute $5.0 million of cash and 59,186 Partnership common units to us held in escrow accounts established at the closing of the acquisition from a portion of the initial purchase price to satisfy potential indemnity claims. The remaining $0.9 million of cash and 264,090 Partnership common units held in escrow was released to Agrifos Holdings Inc. We also had a loss on debt extinguishment for the year ended December 31, 2014 of $0.6 million. During the year ended December 31, 2013, we had a loss on debt extinguishment of $6.0 million partially offset by a fair value adjustment to earn-out consideration of $4.9 million.
Partnership and unallocated expense recorded as other expense for the year ended December 31, 2013 was $1.1 million, compared to partnership and unallocated income recorded as other income of $0.2 million for the year ended December 31, 2012. The increase in partnership and unallocated expenses recorded as other expense between the calendar years ended December 31, 2013 and 2012 was primarily due to loss on debt extinguishment of $6.0 million partially offset by a fair value adjustment to earn-out consideration of $4.9 million.
Unallocated interest expense for the years ended December 31, 2014 and 2013 represents primarily interest expense on the Notes, which were issued in April 2013.
East Dubuque
COMPARISON OF THE RESULTS OF OPERATIONS FOR THE YEAR ENDED DECEMBER 31, 2014 AND 2013
Revenues
| For the Years Ended December 31, |
||||||||
| 2014 | 2013 | |||||||
| (in thousands) | ||||||||
| Revenues: |
||||||||
| Product shipments |
$ | 189,778 | $ | 174,194 | ||||
| Other |
6,601 | 3,506 | ||||||
|
|
|
|
|
|||||
| Total revenues |
$ | 196,379 | $ | 177,700 | ||||
|
|
|
|
|
|||||
| For the Year Ended December 31, 2014 |
For the Year Ended December 31, 2013 |
|||||||||||||||
| Tons | Revenue | Tons | Revenue | |||||||||||||
| (in thousands) | ||||||||||||||||
| Revenues: |
||||||||||||||||
| Ammonia |
153 | $ | 83,796 | 103 | $ | 66,796 | ||||||||||
| UAN |
267 | 74,666 | 269 | 79,377 | ||||||||||||
| Urea (liquid and granular) |
55 | 24,920 | 43 | 20,455 | ||||||||||||
| CO2 |
81 | 2,593 | 71 | 2,416 | ||||||||||||
| Nitric Acid |
11 | 3,803 | 14 | 5,150 | ||||||||||||
| Other |
N/A | 6,601 | N/A | 3,506 | ||||||||||||
|
|
|
|
|
|
|
|
|
|||||||||
| Total |
567 | $ | 196,379 | 500 | $ | 177,700 | ||||||||||
|
|
|
|
|
|
|
|
|
|||||||||
We generate revenue primarily from the sale of nitrogen fertilizer products manufactured at our East Dubuque Facility. Our East Dubuque Facility produces ammonia, UAN, liquid and granular urea, which are nitrogen fertilizers that use natural gas as a feedstock. We also produce nitric acid and food-grade CO2. Nitrogen fertilizer products are used primarily in the production of corn. Revenues are seasonal based on the planting, growing, and harvesting cycles of customers who use nitrogen fertilizer.
56
Table of Contents
Revenues for the year ended December 31, 2014 were $196.4 million, compared to $177.7 million for the same period in the prior year. The increase was due to higher sales volumes for ammonia and urea and higher natural gas sales, partially offset by lower sales prices for ammonia, UAN and urea.
Ammonia production capacity increased 23% after we completed the ammonia expansion project in December 2013. This additional ammonia available for sale enabled higher ammonia deliveries during the year ended December 31, 2014. During the fourth quarter of 2013, production was interrupted due to a planned turnaround and a subsequent fire, which resulted in lower amounts of ammonia available for sale in 2013. Urea sales increased during 2014 due to higher sales of DEF and granular urea.
Average sales prices per ton for the year ended December 31, 2014 were 16% lower for ammonia and 5% lower for UAN, as compared to the year ended December 31, 2013. These two products comprised 81% of our East Dubuque Facility’s revenues for the year ended December 31, 2014 and 82% for the year ended December 31, 2013. The decreases in our sales prices for ammonia and UAN were consistent with the decline in global nitrogen fertilizer prices in the earlier portions of the respective years, partially offset by increases in the latter portions of the respective years. These decreases were caused by significantly higher levels of low-priced urea in the global market, particularly from China. Prices were also affected by additional nitrogen fertilizer production brought on line in North America over the last 12 months.
Other revenues consist primarily of natural gas sales. We occasionally sell natural gas when purchase commitments exceed production requirements or storage capacities, or when the margin from selling natural gas significantly exceeds the margin from producing additional ammonia. During the year ended December 31, 2014, we recorded $6.1 million in natural gas sales and $0.5 million in sales of nitrous oxide emission reduction credits. On rare occasions, we have also purchased natural gas with the specific intent of immediately reselling it when local market anomalies create low-risk opportunities for gain. During the first quarter of 2014, temporary operational problems with a natural gas pipeline in the Midwest caused a significant spike in the local price of natural gas. This created a unique opportunity to purchase natural gas from other locations at lower prices for the purpose of reselling it at significantly higher prices. We also sold natural gas originally purchased for production at a gross profit that exceeded the expected gross profits from additional production using that natural gas. During the first quarter of 2014, we sold, at an average price of $29.90 per MMBtu, 151,000 MMBtus of natural gas that cost an average of $9.42 per MMBtu. The total $4.5 million in natural gas sales in the first quarter resulted in a gross profit of $3.1 million, which was significantly higher than the profit we would likely have realized on the 2,900 tons of lost ammonia production. During the year ended December 31, 2013, we recorded $3.4 million in natural gas sales and $0.1 million in sales of nitrous oxide emission reduction credits.
Cost of Sales
| For the Years Ended December 31, |
||||||||
| 2014 | 2013 | |||||||
| (in thousands) | ||||||||
| Total cost of sales |
$ | 121,594 | $ | 96,817 | ||||
|
|
|
|
|
|||||
Cost of sales primarily consists of the cost of natural gas (East Dubuque’s primary feedstock), labor, depreciation and electricity. Cost of sales for the year ended December 31, 2014 was $121.6 million, compared to $96.8 million for the same period in the prior year. The increase in the cost of sales was primarily due to an increase in depreciation, the cost of natural gas and electricity. Increased natural gas costs were due to an increase in product sales volumes, additional natural gas purchased for resale and a loss on natural gas derivatives of $4.0 million. Natural gas comprised 47% and labor costs comprised 13% of cost of sales on product shipments for the year ended December 31, 2014. For the year ended December 31, 2013, natural gas was 43% and labor was 12% of cost of sales. Depreciation expense included in cost of sales was $15.7 million for the year ended December 31, 2014 and $9.0 million for the year ended December 31, 2013. The increase in depreciation expense was primarily due to the completion of the ammonia expansion project in late 2013. Increased electricity costs reflected higher rates and usage due in part to the new equipment installed as part of the ammonia expansion project. During the year ended December 31, 2014, we recorded an additional $0.9 million of expense reimbursements under an insurance claim filed for the fire, which occurred in 2013.
Gross Profit
| For the Years Ended December 31, |
||||||||
| 2014 | 2013 | |||||||
| (in thousands) | ||||||||
| Total gross profit |
$ | 74,785 | $ | 80,883 | ||||
|
|
|
|
|
|||||
57
Table of Contents
Gross profit was $74.8 million for the year ended December 31, 2014, compared to $80.9 million for the year ended December 31, 2013. Gross profit margin was 38% for the year ended December 31, 2014, compared to 46% for the year ended December 31, 2013. The decreases in gross profit and gross margin were primarily due to lower product pricing and increased costs of natural gas, depreciation and electricity.
Gross profit margin can vary significantly from period to period. Nitrogen fertilizer and natural gas are both commodities, the prices of which can vary significantly from period to period and do not always move in the same direction. In addition, certain fixed costs of operating our East Dubuque Facility are recorded in cost of sales. Their impact on gross profit and gross margins varies as product sales volumes vary seasonally.
During the fourth quarter of 2014, our East Dubuque Facility’s ammonia plant was shut down for seven days for unplanned maintenance. Also, during the third quarter of 2014, our East Dubuque Facility’s ammonia plant was shut down for ten days for unplanned maintenance. Gross profit was negatively impacted as the outages reduced the amount of product available for sale. Problems with the ammonia synthesis converter caused the shut-downs in both of the outage cases. The converter was damaged during a fire in 2013, then repaired and returned to service. The facility is currently operating near capacity, but it is possible that additional repairs will be needed before the converter is expected to be replaced at the end of 2016.
Operating Expenses
| For the Years Ended December 31, |
||||||||
| 2014 | 2013 | |||||||
| (in thousands) | ||||||||
| Operating expenses: |
||||||||
| Selling, general and administrative |
$ | 4,165 | $ | 4,576 | ||||
| Depreciation and amortization |
194 | 191 | ||||||
| Other |
537 | 806 | ||||||
|
|
|
|
|
|||||
| Total operating expenses |
$ | 4,896 | $ | 5,573 | ||||
|
|
|
|
|
|||||
Operating expenses were $4.9 million for the year ended December 31, 2014, compared to $5.6 million for the year ended December 31, 2013. These expenses were primarily comprised of selling, general and administrative expenses, depreciation expense and asset disposal costs.
Selling, General and Administrative Expenses. Selling, general and administrative expenses for the year ended December 31, 2014 were $4.2 million, compared to $4.6 million for the year ended December 31, 2013. This decrease was primarily due to decreases in various professional services fees of $0.3 million.
Depreciation and Amortization. Depreciation expense included in operating expense was $0.2 million for the years ended December 31, 2014 and 2013. The majority of depreciation expense incurred was a manufacturing cost and was distributed between cost of sales and finished goods inventory, based on production volumes and ending inventory levels. However, a portion of depreciation expense was associated with assets supporting general and administrative functions and was recorded in operating expense.
Other. Other expenses include loss on disposal of fixed assets, which was $0.5 million for the year ended December 31, 2014, compared to $0.8 million for the prior year.
Operating Income
| For the Years Ended December 31, |
||||||||
| 2014 | 2013 | |||||||
| (in thousands) | ||||||||
| Total operating income |
$ | 69,888 | $ | 75,310 | ||||
|
|
|
|
|
|||||
58
Table of Contents
Operating income was $69.9 million for the year ended December 31, 2014, compared to $75.3 million for the year ended December 31, 2013. The decrease was primarily due to lower product pricing, and increased costs of natural gas, depreciation and electricity.
COMPARISON OF THE RESULTS OF OPERATIONS FOR THE YEAR ENDED DECEMBER 31, 2013 AND 2012
Revenues
| For the Years Ended December 31, |
||||||||
| 2013 | 2012 | |||||||
| (in thousands) | ||||||||
| Revenues: |
||||||||
| Product shipments |
$ | 174,194 | $ | 222,936 | ||||
| Other |
3,506 | 1,269 | ||||||
|
|
|
|
|
|||||
| Total revenues |
$ | 177,700 | $ | 224,205 | ||||
|
|
|
|
|
|||||
| For the Year Ended December 31, 2013 |
For the Year Ended December 31, 2012 |
|||||||||||||||
| Tons | Revenue | Tons | Revenue | |||||||||||||
| (in thousands) | ||||||||||||||||
| Revenues: |
||||||||||||||||
| Ammonia |
103 | $ | 66,796 | 149 | $ | 99,378 | ||||||||||
| UAN |
269 | 79,377 | 291 | 94,836 | ||||||||||||
| Urea (liquid and granular) |
43 | 20,455 | 35 | 21,189 | ||||||||||||
| CO2 |
71 | 2,416 | 76 | 2,517 | ||||||||||||
| Nitric Acid |
14 | 5,150 | 14 | 5,016 | ||||||||||||
| Other |
N/A | 3,506 | N/A | 1,269 | ||||||||||||
|
|
|
|
|
|
|
|
|
|||||||||
| Total |
500 | $ | 177,700 | 565 | $ | 224,205 | ||||||||||
|
|
|
|
|
|
|
|
|
|||||||||
Revenues were $177.7 million for the year ended December 31, 2013 compared to $224.2 million for the year ended December 31, 2012. The decrease in revenue for the year ended December 31, 2013 compared to the year ended December 31, 2012 was primarily the result of a decrease in ammonia and UAN sales volumes and sales prices.
Average sales prices per ton for the year ended December 31, 2013 were 3% lower for ammonia and 10% lower for UAN, as compared to the year ended December 31, 2012. These two products comprised 82% of our East Dubuque Facility’s revenues for the year ended December 31, 2013 and 87% for the year ended December 31, 2012. The decrease in sales prices for UAN for the year ended December 31, 2013 as compared to 2012 was largely due to weather. The drought in the Midwestern region of the United States during the spring and summer of 2012 created expectations of poor corn yields and anticipated increases in acreage dedicated to corn in 2013; as a result, fertilizer prices remained high throughout 2012. Nitrogen fertilizer prices then declined significantly in the second half of 2013 as wet weather persisted throughout much of the country which severely limited the spring planting and application season.
During the fourth quarter of 2013, our East Dubuque Facility halted production due to a planned turnaround and a fire. For most of October and a portion of November, we underwent a turnaround, which lasted slightly longer than anticipated due to operating difficulties experienced while commissioning new equipment. Our East Dubuque Facility also operated at reduced rates following the turnaround after the discovery of the need for repairs to the foundation of one of its syngas compressors. At the end of November, we experienced a fire that began in the ammonia converter of the ammonia synthesis loop. As a result of the fire, the production of all products was halted in late November and for most of December. During the turnaround and the aftermath of the fire, we were able to continue shipments of our products from inventory. These fourth quarter events were the primary reason why ammonia and UAN sales volume decreased between the years ended December 31, 2013 and 2012.
59
Table of Contents
Other revenue consists primarily of sales of excess inventory of natural gas. Sales of natural gas for the year ended December 30, 2013 was $3.4 million, compared to $1.1 million for the year ended December 31, 2012.
Cost of Sales
| For the Years Ended December 31, |
||||||||
| 2013 | 2012 | |||||||
| (in thousands) | ||||||||
| Total cost of sales |
$ | 96,817 | $ | 90,662 | ||||
|
|
|
|
|
|||||
Cost of sales was $96.8 million for the year ended December 31, 2013 compared to $90.7 million for the year ended December 31, 2012. The increase in cost of sales was primarily due to turnaround expenses in 2013 of $7.9 million, higher market prices for natural gas which increased the cost of natural gas by $2.7 million, fixed operating costs while idle of $4.3 million, and the $1.0 million insurance deductible for the fire which occurred in late November 2013, all of which were partially offset by lower sales volumes. Turnaround expenses represent the cost of maintenance during turnarounds, which occur every two years. A facility turnaround at the East Dubuque Facility occurred in October and November of 2013. The East Dubuque Facility has fixed production costs that it incurs whether or not the facility is operating. These production costs are recorded directly to cost of sales when the facility is idle. We filed an insurance claim for $2.7 million related to damage caused by the fire, and incurred the $1.0 million deductible under our property insurance policy in 2013. We received payment of $1.7 million for the claim in 2014.
Natural gas costs comprised 43% of cost of sales for each of the years ended December 31, 2013 and December 31, 2012. Labor costs comprised 12% of cost of sales for the year ended December 31, 2013 compared to 14% of cost of sales for the year ended December 31, 2012. Depreciation expense included in cost of sales was $9.0 million, or 10% of cost of sales, for the year ended December 31, 2013, and $10.7 million, or 12% of cost of sales, for the year ended December 31, 2012.
Gross Profit
| For the Years Ended December 31, |
||||||||
| 2013 | 2012 | |||||||
| (in thousands) | ||||||||
| Total gross profit |
$ | 80,883 | $ | 133,543 | ||||
|
|
|
|
|
|||||
Gross profit was $80.9 million for the year ended December 31, 2013 compared to $133.5 million for the year ended December 31, 2012. Gross profit margin was 46% for the year ended December 31, 2013 as compared to 60% for the year ended December 31, 2012.
Gross profit margin can vary significantly from period to period due to changes in nitrogen fertilizer prices and natural gas costs, both of which are commodities. The prices of these commodities can vary significantly from period to period and do not always move in the same direction. In addition, there are certain fixed costs of operating our East Dubuque Facility that are recorded in cost of sales and whose impact on gross profit and gross margins varies as product sales volumes vary seasonally. The decrease in gross profit margin during the year ended December 31, 2013 was primarily due to a decrease in revenues and an increase in cost of sales as described above.
Operating Expenses
| For the Years Ended December 31, |
||||||||
| 2013 | 2012 | |||||||
| (in thousands) | ||||||||
| Operating expenses: |
||||||||
| Selling, general and administrative |
$ | 4,576 | $ | 6,242 | ||||
| Depreciation and amortization |
191 | 807 | ||||||
| Other |
806 | 510 | ||||||
|
|
|
|
|
|||||
| Total operating expenses |
$ | 5,573 | $ | 7,559 | ||||
|
|
|
|
|
|||||
60
Table of Contents
Operating expenses were $5.6 million for the year ended December 31, 2013 compared to $7.6 million for the year ended December 31, 2012. These expenses were primarily comprised of selling, general and administrative expenses and depreciation expense.
Selling, General and Administrative Expenses. Selling, general and administrative expenses were $4.6 million for the year ended December 31, 2013 compared to $6.2 million for the year ended December 31, 2012.
This decrease was primarily due to decreases in various professional services fees of $0.6 million, salaries of $0.4 million and debt related expenses of $0.4 million.
Depreciation and Amortization. Depreciation expense for the year ended December 31, 2013 was $0.2 million, compared to $0.8 million for the year ended December 31, 2012. This decrease was primarily due to the acceleration of depreciation in 2012 on an asset that was dismantled as part of the ammonia production and storage capacity expansion project and certain software having been fully depreciated. A portion of depreciation expense is associated with assets supporting general and administrative functions and is recorded in operating expense. The majority of depreciation expense, as a manufacturing cost, is distributed between cost of sales and finished goods inventory, based on production volumes and ending inventory levels.
Operating Income
| For the Years Ended December 31, |
||||||||
| 2013 | 2012 | |||||||
| (in thousands) | ||||||||
| Total operating income |
$ | 75,310 | $ | 125,984 | ||||
|
|
|
|
|
|||||
Operating income was $75.3 million for the year ended December 31, 2013 compared to $126.0 million for the year ended December 31, 2012. The decrease was primarily due to lower revenues and higher cost of sales partially offset by lower selling, general and administrative expenses and depreciation and amortization expense as described above.
Other Income (Expense), Net
| For the Years Ended December 31, |
||||||||
| 2013 | 2012 | |||||||
| (in thousands) | ||||||||
| Other income (expense), net: |
||||||||
| Interest expense |
$ | — | $ | (194 | ) | |||
| Loss on debt extinguishment |
— | (2,114 | ) | |||||
| Other income, net |
— | 45 | ||||||
|
|
|
|
|
|||||
| Total other expense, net |
$ | — | $ | (2,263 | ) | |||
|
|
|
|
|
|||||
Other expense, net was $0 for the year ended December 31, 2013 compared to $2.3 million for the year ended December 31, 2012. The entry into the credit agreement entered into in October 2012, or the Second 2012 Credit Agreement, and the payoff of the credit agreement entered into in February 2012, or the First 2012 Credit Agreement, resulted in a loss on debt extinguishment of $2.1 million for the year ended December 31, 2012.
61
Table of Contents
Pasadena
COMPARISON OF THE RESULTS OF OPERATIONS FOR THE YEAR ENDED DECEMBER 31, 2014 AND 2013
Revenues
| For the Years Ended December 31, |
||||||||
| 2014 | 2013 | |||||||
| (in thousands) | ||||||||
| Total revenues |
$ | 138,233 | $ | 133,675 | ||||
|
|
|
|
|
|||||
| For the Year Ended December 31, 2014 |
For the Year Ended December 31, 2013 |
|||||||||||||||
| Tons | Revenue | Tons | Revenue | |||||||||||||
| (in thousands) | ||||||||||||||||
| Revenues: |
||||||||||||||||
| Ammonium sulfate |
572 | $ | 116,330 | 428 | $ | 107,435 | ||||||||||
| Sulfuric acid |
112 | 9,624 | 148 | 13,514 | ||||||||||||
| Ammonium thiosulfate |
67 | 10,217 | 54 | 10,221 | ||||||||||||
| Other |
N/A | 2,062 | N/A | 2,505 | ||||||||||||
|
|
|
|
|
|
|
|
|
|||||||||
| Total |
751 | $ | 138,233 | 630 | $ | 133,675 | ||||||||||
|
|
|
|
|
|
|
|
|
|||||||||
We generate revenue from sales of nitrogen fertilizer and other products manufactured at our Pasadena Facility. The facility produces ammonium sulfate and ammonium thiosulfate, which are nitrogen fertilizers, as well as sulfuric acid. These fertilizer products are used in growing corn, soybeans, potatoes, cotton, canola, alfalfa and wheat. Revenues from domestic sales are seasonal based on planting, growing, and harvesting cycles of customers who use nitrogen fertilizer. Planting seasons in the Southern Hemisphere are typically opposite those in the United States thus ammonium sulfate international sales partially offset domestic seasonality.
Revenues for the year ended December 31, 2014 were $138.2 million, compared to $133.7 million for the year ended December 31, 2013. The increase was due to higher sales volumes for ammonium sulfate, partially offset by lower sales volumes for sulfuric acid and lower sales prices for ammonium sulfate and sulfuric acid.
Ammonium sulfate production increased after we completed the debottlenecking project in December 2013. Also, demand increased due to favorable weather during the planting season and an increase in international orders. We produce ammonium sulfate by combining ammonia and sulfuric acid, which we also produce to make ammonium sulfate or to sell to the industrial market. After expanding ammonium sulfate production capacity, less sulfuric acid was available for sale causing a decline in sulfuric acid sales volume during the year ended December 31, 2014 as compared to the same period in the prior year.
Average sales prices per ton decreased by 19% for ammonium sulfate and 6% for sulfuric acid for the year ended December 31, 2014, as compared with the same period in the prior year. These two products comprised 91% of our Pasadena Facility’s revenues for the year ended December 31, 2014 and 90% for the year ended December 31, 2013. A higher proportion of export sales, priced lower than domestic sales, contributed to the decline in average product price. Furthermore, higher exports of ammonium sulfate from China put downward pressure on prices. The additional supplies from China originated from new plants that produce ammonium sulfate as a by-product of manufacturing caprolactam.
Cost of Sales
| For the Years Ended December 31, |
||||||||
| 2014 | 2013 | |||||||
| (in thousands) | ||||||||
| Total cost of sales |
$ | 152,541 | $ | 143,204 | ||||
|
|
|
|
|
|||||
Cost of sales primarily consists of the cost of ammonia, sulfur, labor, depreciation and electricity. Cost of sales for the year ended December 31, 2014 was $152.5 million, compared to $143.2 million for the year ended December 31, 2013. The increase in cost of sales was primarily due to selling a higher volume of ammonium sulfate and higher unit prices for inputs. Ammonia and sulfur
62
Table of Contents
together comprised 61% of cost of sales for the year ended December 31, 2014, compared to 59% for the same period in the prior year. Labor costs comprised 7% of cost of sales for each of the years ended December 31, 2014 and 2013. For the year ended December 31, 2014, we wrote down our ammonium sulfate inventory by $6.0 million because production costs exceeded market prices. During the same period in the prior year, we wrote down our ammonium sulfate, sulfur and sulfuric acid inventory by $12.4 million due to lower market prices of ammonium sulfate and sulfuric acid. During the year ended December 31, 2014, we incurred turnaround expenses of $2.1 million and unanticipated maintenance expenses of $1.3 million. Turnaround expenses represent maintenance costs incurred during planned shut-downs. The duration of the 2014 turnaround was extended by 13 days, as compared to the duration of a typical turnaround, to undertake activities necessary to tie-in the new sulfuric acid converter and cogeneration projects. During the extended outage, we conducted a comprehensive examination of other components within the sulfuric acid plant. This examination resulted in the discovery and repair of previously unidentified items. The incremental cost of these items and the extended downtime was approximately $1.3 million. These activities are not expected to recur in the future. Prices for ammonia and sulfur, key inputs for ammonium sulfate, increased significantly during 2014. Global ammonia supplies were lower than normal due to production issues in Egypt, Algeria, Trinidad and Qatar, as well as political issues in Libya and Ukraine. Because our sulfuric acid plant was down during the turnaround period, in order to continue producing ammonium sulfate and meet sales demand for sulfuric acid, we purchased sulfuric acid, which increased the cost of sales for the year ended December 31, 2014.
Depreciation expense included in cost of sales was $7.0 million for the year ended December 31, 2014 and $4.2 million for the year ended December 31, 2013. The increased depreciation expense was primarily due to an increase in property, plant and equipment resulting from the completion of the debottlenecking project in late 2013, and the increase in ammonium sulfate volumes sold in 2014 compared to 2013.
Gross Loss
| For the Years Ended December 31, |
||||||||
| 2014 | 2013 | |||||||
| (in thousands) | ||||||||
| Total gross loss |
$ | (14,308 | ) | $ | (9,529 | ) | ||
|
|
|
|
|
|||||
Gross loss was $14.3 million for the year ended December 31, 2014, compared to $9.5 million for the year ended December 31, 2013. Gross loss margin for the year ended December 31, 2014 was 10%, compared to gross loss margin of 7% for the year ended December 31, 2013. The decreases in gross profit and gross profit margin were primarily due to declines in average sales prices for ammonium sulfate, increases in the unit prices of raw materials, turnaround expenses and other unplanned maintenance expenses.
Gross profit margin at our Pasadena Facility can vary significantly from period to period due to changes in the prices of nitrogen fertilizer, ammonia and sulfur, which are all commodities. The prices of these commodities can vary significantly from period to period and do not always move in the same direction. In addition, certain fixed costs of operating our Pasadena Facility are recorded in cost of sales. Their impact on gross profit and gross margins varies as product sales volumes vary seasonally. Moreover, forward sales contracts have not developed for ammonium sulfate to the extent that they have for other nitrogen fertilizer products, so it is not possible to lock in product prices and input prices at the same time, as has been our practice for a significant portion of the sales at our East Dubuque Facility. Since input prices for ammonium sulfate are typically fixed several months before the corresponding product sales prices are known, margins may be compressed during a declining commodity market. See “Note 8 — Goodwill” to the consolidated financial statements included in “Part II — Item 8. Financial Statements and Supplementary Data” in this report.
Operating Expenses
| For the Years Ended December 31, |
||||||||
| 2014 | 2013 | |||||||
| (in thousands) | ||||||||
| Operating expenses: |
||||||||
| Selling, general and administrative |
$ | 5,078 | $ | 4,764 | ||||
| Depreciation and amortization |
1,315 | 3,886 | ||||||
| Pasadena goodwill impairment |
27,202 | 30,029 | ||||||
| Other |
5 | — | ||||||
|
|
|
|
|
|||||
| Total operating expenses |
$ | 33,600 | $ | 38,679 | ||||
|
|
|
|
|
|||||
63
Table of Contents
Operating expenses were comprised primarily of selling, general and administrative expenses, depreciation expense and Pasadena goodwill impairment. Operating expenses were $33.6 million for the year ended December 31, 2014, compared to $38.7 million for the same period in the prior year.
Selling, General and Administrative Expenses. Selling, general and administrative expenses for the year ended December 31, 2014 were $5.1 million, compared to $4.8 million for the same period in the prior year.
Depreciation and Amortization. Depreciation and amortization expense included in operating expenses was $1.3 million for the year ended December 31, 2014, compared to $3.9 million for the years ended December 31, 2013. Depreciation and amortization expense represents primarily amortization of intangible assets. The decreases between periods were primarily due to an intangible asset having been fully amortized at December 31, 2013. The majority of depreciation expense incurred was a manufacturing cost and was distributed between cost of sales and finished goods inventory, based on production volumes and ending inventory levels.
Pasadena Goodwill Impairment. Pasadena goodwill impairment was $27.2 million for the year ended December 31, 2014, compared to $30.0 million for the year ended December 31, 2013. There is no remaining goodwill associated with the Pasadena Facility. See “Note 8 — Goodwill” to the consolidated financial statements included in “Part II — Item 8. Financial Statements and Supplementary Data” in this report.
Operating Loss
| For the Years Ended December 31, |
||||||||
| 2014 | 2013 | |||||||
| (in thousands) | ||||||||
| Total operating loss |
$ | (47,907 | ) | $ | (48,208 | ) | ||
|
|
|
|
|
|||||
Operating loss was $47.9 million for the year ended December 31, 2014, compared to an operating loss of $48.2 million for the year ended December 31, 2013. The improvement in the operating loss was primarily due to a lower goodwill impairment, inventory write-down, and depreciation and amortization expense, partially offset by the decline in average sales prices for ammonium sulfate, increases in the unit price of raw materials, and turnaround and maintenance expenses in 2014, as described above.
COMPARISON OF THE RESULTS OF OPERATIONS FOR THE YEARS ENDED DECEMBER 31, 2013 AND 2012
The Pasadena Facility’s operations are only included in our historical operating results from the closing date of the Agrifos Acquisition, which was November 1, 2012.
Revenues
| For the Years Ended December 31, |
||||||||
| 2013 | 2012 | |||||||
| (in thousands) | ||||||||
| Total revenues |
$ | 133,675 | $ | 37,430 | ||||
|
|
|
|
|
|||||
| For the Year Ended December 31, 2013 |
For the Year Ended December 31, 2012 |
|||||||||||||||
| Tons | Revenue | Tons | Revenue | |||||||||||||
| (in thousands) | ||||||||||||||||
| Revenues: |
||||||||||||||||
| Ammonium sulfate |
428 | $ | 107,435 | 115 | $ | 34,493 | ||||||||||
| Sulfuric acid |
148 | 13,514 | 27 | 2,586 | ||||||||||||
| Ammonium thiosulfate |
54 | 10,221 | — | — | ||||||||||||
| Other |
N/A | 2,505 | N/A | 351 | ||||||||||||
|
|
|
|
|
|
|
|
|
|||||||||
| Total |
630 | $ | 133,675 | 142 | $ | 37,430 | ||||||||||
|
|
|
|
|
|
|
|
|
|||||||||
64
Table of Contents
Revenues were $133.7 million for the year ended December 31, 2013, compared to $37.4 million for the year ended December 31, 2012. The increase in revenue for the year ended December 31, 2013 compared to the year ended December 31, 2012 reflects our full year of ownership of the Pasadena Facility.
Average sales prices per ton decreased by 16% for ammonium sulfate and by 5% for sulfuric acid for the year ended December 31, 2013 as compared with the year ended December 31, 2012. These two products comprised 90% of our Pasadena Facility’s revenues for the year ended December 31, 2013 and 99% for the year ended December 31, 2012. The decrease in sales prices for the ammonium sulfate for the year ended December 31, 2013 was in part a result of weather which delayed the application of the product. During the year ended December 31, 2013 significant volumes of urea were exported from China and this supply also suppressed global urea and other nitrogen fertilizer prices. The sales price for ammonium sulfate has significantly worsened and still remains low. Our Pasadena Facility also underwent a turnaround in December 2013, which lasted a little longer than anticipated due to issues with a contractor and weather delays, and experienced several relatively small disruptions in production that reduced production during 2013. During the turnaround, we conducted scheduled debottlenecking and reliability improvement projects. Our Pasadena Facility was off-line for three weeks in December 2013.
Cost of Sales
| For the Years Ended December 31, |
||||||||
| 2013 | 2012 | |||||||
| (in thousands) | ||||||||
| Total cost of sales |
$ | 143,204 | $ | 39,134 | ||||
|
|
|
|
|
|||||
Costs of sales were $143.2 million for the year ended December 31, 2013 compared to $39.1 million for the year ended December 31, 2012. The increase in cost of sales for the year ended December 31, 2013 compared to the year ended December 31, 2012 reflects our full year of ownership of the Pasadena Facility. Cost of sales consists primarily of expenses for ammonia, sulfur, labor and depreciation. Ammonia and sulfur together comprised 59% of cost of sales for the year ended December 31, 2013, compared to 64% for the year ended December 31, 2012. Labor costs comprised 7% of cost of sales for the year ended December 31, 2013, compared to 5% for the year ended December 31, 2012. Depreciation expense included in cost of sales was $4.2 million for the year ended December 31, 2013 and $0.4 million for the year ended December 31, 2012. During the year ended December 31, 2013, we incurred a write-down of ammonium sulfate, sulfur and sulfuric acid inventory to market value of $12.4 million due primarily to lower market prices of ammonium sulfate, in accordance with accounting guidance. Cost of sales includes turnaround expenses of $1.7 million. Turnaround expenses represent the cost of maintenance during turnarounds, which occur every two years.
Cost of sales also includes maintenance expenses. Turnaround at the sulfuric acid plant occurred in November 2012. As a result, we incurred turnaround expenses of $0.8 million. The turnaround was originally scheduled for the first quarter of 2013, but due to two unexpected outages at the sulfuric acid plant, we decided to conduct the turnaround early. As a result of the two unexpected outages, we incurred $0.5 million in additional expenses. The acquisition method of accounting required that the inventory be recognized at fair value as of the closing date of the Agrifos Acquisition. This resulted in the value of inventory, which was sold during the two-month period ended December 31, 2012, being increased by $3.4 million.
Gross Loss
| For the Years Ended December 31, |
||||||||
| 2013 | 2012 | |||||||
| (in thousands) | ||||||||
| Total gross loss |
$ | (9,529 | ) | $ | (1,704 | ) | ||
|
|
|
|
|
|||||
Gross loss margins for the year ended December 31, 2013 was 7% and 5% for the year ended December 31, 2012. Gross loss for year ended December 31, 2013 is due to lower ammonium sulfate sale prices and the write-down of inventory, as described above. Similar to our East Dubuque Facility, gross profit margin can vary significantly from period to period due to changes in the prices of nitrogen fertilizer, ammonia and sulfur, which are commodities. The prices of these commodities can vary significantly from period to period and do not always move in the same direction. In addition, there are certain fixed costs of operating our Pasadena Facility that are recorded in cost of sales and whose impact on gross profit and gross margins varies as product sales volumes vary seasonally. Moreover, forward sales contracts have not developed for ammonium sulfate to the extent that they have for other nitrogen fertilizer products, so it is not possible to lock product prices and input prices at the same time, as has been our practice for a portion of the
65
Table of Contents
sales of the most important products of our East Dubuque Facility. Since input prices for ammonium sulfate are typically fixed several months before the corresponding product price, margins may be compressed during a declining commodity market. Gross loss for year ended December 31, 2012 was primarily due to reduced margins due to the write-up of inventory to fair value, along with the turnaround expenses at the sulfuric acid plant and expenses related to two unexpected outages of the sulfuric acid plant.
Operating Expenses
| For the Years Ended December 31, |
||||||||
| 2013 | 2012 | |||||||
| (in thousands) | ||||||||
| Operating expenses: |
||||||||
| Selling, general and administrative |
$ | 4,764 | $ | 361 | ||||
| Depreciation and amortization |
3,886 | 583 | ||||||
| Pasadena goodwill impairment |
30,029 | — | ||||||
|
|
|
|
|
|||||
| Total operating expenses |
$ | 38,679 | $ | 944 | ||||
|
|
|
|
|
|||||
Operating expenses were $38.7 million for the year ended December 31, 2013 compared to $0.9 million for the year ended December 31, 2012. These expenses were primarily comprised of selling, general and administrative expense, depreciation expense and Pasadena goodwill impairment.
Selling, General and Administrative Expenses. Selling, general and administrative expenses were $4.8 million for the year ended December 31, 2013. These expenses are for general administrative purposes at our Pasadena Facility, such as general management salaries and travel, legal, consulting, information technology, and banking fees. Selling, general and administrative expenses for the year ended December 31, 2013 included $0.7 million in integration related expenses.
Depreciation and Amortization. Amortization expense was $3.9 million for the year ended December 31, 2013. This amount represents amortization of intangible assets. The depreciation expense relating to fixed assets is a manufacturing cost which is distributed between cost of sales and finished goods inventory, based on production volumes and ending inventory levels.
Pasadena Goodwill Impairment. Pasadena goodwill impairment was $30.0 million for the year ended December 31, 2013. See “Note 8 — Goodwill” to the consolidated financial statements included in “Part II — Item 8. Financial Statements and Supplementary Data” in this report.
Operating Loss
| For the Years Ended December 31, |
||||||||
| 2013 | 2012 | |||||||
| (in thousands) | ||||||||
| Total operating loss |
$ | (48,208 | ) | $ | (2,648 | ) | ||
|
|
|
|
|
|||||
Operating loss for the year ended December 31, 2013 was $48.2 million, compared to operating loss of $2.6 million for the same period in the prior year. The increase in operating loss was due to lower ammonium sulfate sale prices, the write-down of inventory and the Pasadena goodwill impairment, as described above.
LIQUIDITY AND CAPITAL RESOURCES
At December 31, 2014, our current assets totaled $77.8 million. Current assets included cash of $28.0 million, accounts receivable of $16.7 million and inventories of $27.7 million. At December 31, 2014, our current liabilities were $63.3 million and our long-term liabilities were $342.1 million, comprised primarily of the Notes.
On February 17, 2015, we announced that our general partner’s board has initiated a process to explore and evaluate potential strategic alternatives for the Partnership, which may include a sale of the Partnership, a merger with another party, a sale of some or all of our assets, or another strategic transaction. There can be no assurance that this strategic review process will result in a transaction.
66
Table of Contents
Sources of Capital
Our principal sources of capital have historically been cash from operations, the proceeds of our initial public offering, and borrowings. Our current outstanding debt obligations are the Notes and the GE Credit Agreement. We expect to be able to fund our operating needs, including maintenance capital expenditures, from operating cash flow, cash on hand and borrowings under the GE Credit Agreement, for at least the next 12 months. We expect to fund our announced expansion projects through borrowings under the GE Credit Agreement. If additional expansion projects were to exceed the capacity available under the GE Credit Agreement, we would need to fund them with new capital.
Capital markets have experienced periods of significant volatility in the recent past, and access to those markets may become difficult. If we need to access capital markets, we cannot assure you that we will be able to do so on acceptable terms, or at all.
Notes Offering
The Notes, with a principal amount of $320.0 million, bear interest at a rate of 6.5% per year, and are payable semi-annually in arrears on April 15 and October 15 of each year. The Notes will mature on April 15, 2021, unless repurchased or redeemed earlier in accordance with their terms. For a description of the terms of the Notes, see “Note 9 — Debt” to the consolidated financial statements included in “Part II—Item 8. Financial Statements and Supplementary Data” in this report.
GE Credit Agreement
On July 22, 2014, we replaced a prior revolving credit agreement by entering into the GE Credit Agreement. The GE Credit Agreement consists of a $50.0 million senior secured revolving credit facility with a $10.0 million letter of credit sublimit. As of December 31, 2014, we had $15.0 million outstanding borrowings under the GE Credit Agreement.
Under the GE Credit Agreement, in the event that, on a pro forma basis, less than 30% of the commitment amount is available for borrowing on any distribution date, then in order to make a distribution on such date (a) we must maintain a first lien leverage ratio no greater than 1 to 1 on a pro forma basis and (b) the sum of (i) the undrawn amount under the GE Credit Facility and (ii) cash maintained by us and our subsidiaries in collateral deposit accounts must be at least $5 million (after giving effect to the distribution). In addition, before we can make distributions, there cannot be any default under the GE Credit Agreement. The GE Credit Agreement also contains a requirement that we maintain a first lien leverage ratio not to exceed 1.0 to 1.0 at the end of each fiscal quarter where less than 30% of the commitment amount is available for drawing under the GE Credit Facility or a default has occurred and is continuing. The first lien leverage ratio as of December 31, 2014 was 0.20 to 1.0.
Borrowing pursuant to our GE Credit Agreement is subject to compliance with certain conditions, and we, as of the filing date of this report, are in compliance with those conditions. Based on our current forecast, we expect to be able to borrow under the GE Credit Agreement. For a description of the terms of the GE Credit Agreement, see “Note 9 — Debt” to the consolidated financial statements included in “Part II—Item 8. Financial Statements and Supplementary Data” in this report.
Shelf Registration
We have an effective shelf registration statement with the SEC, which allows us and Rentech’s subsidiary RNHI, from time to time, in one or more offerings, to offer and sell up to $500.0 million in the aggregate of securities comprised of (i) up to $265.5 million of common units and debt securities to be offered and sold by us in primary offerings and (ii) up to 12.5 million common units to be offered and sold by RNHI in secondary offerings. This report shall not constitute an offer to sell or the solicitation of an offer to buy, nor shall there be any sale of securities in any jurisdiction in which such offer, solicitation or sale would be unlawful prior to registration or qualification under the securities laws of any such jurisdiction.
Uses of Capital
Our primary uses of cash have been, and are expected to continue to be, for operating expenses, capital expenditures, debt service and cash distributions to common unitholders.
Capital Expenditures
We divide our capital expenditures into two categories: maintenance and expansion. Maintenance capital expenditures include those for improving, replacing or adding to our assets, as well as expenditures for acquiring, constructing or developing new assets to maintain our operating capacity, or to comply with environmental, health, safety or other regulations. Maintenance capital expenditures that are required to comply with regulations may also improve the output, efficiency or reliability of our facilities. Expansion capital expenditures are those incurred for acquisitions or capital improvements that we expect will increase our operating capacity or operating income over the long term. We generally fund maintenance capital expenditures from operating cash flow, and expansion capital expenditures from new capital. However, at our Pasadena Facility, we funded the sulfuric acid converter, a major maintenance project, from the proceeds of the Notes.
67
Table of Contents
Maintenance capital expenditures for our East Dubuque Facility totaled $9.4 million for the year ended December 31, 2014, $9.3 million for the year ended December 31, 2013, and $7.9 million for the year ended December 31, 2012. Maintenance capital expenditures for our East Dubuque Facility are expected to be $10.7 million for the year ending December 31, 2015. Expansion capital expenditures for our East Dubuque Facility totaled $14.4 million for the year ended December 31, 2014, $50.5 million for the year ended December 31, 2013, and $52.4 million for the year ended December 31, 2012. Expansion capital expenditures for our East Dubuque Facility are expected to be $19.0 million for the year ending December 31, 2015, of which $14.1 million is related to the ammonia synthesis converter project.
Maintenance capital expenditures for our Pasadena Facility totaled $22.3 million, including $14.5 million spent as part of the project to replace the sulfuric acid converter, for the year ended December 31, 2014. In 2013, maintenance capital expenditures for the Pasadena Facility totaled $9.0 million, including $2.4 million spent as part of the project to replace the sulfuric acid converter. Maintenance capital expenditures for our Pasadena Facility are expected to be $4.0 million for the year ending December 31, 2015. Expansion capital expenditures for our Pasadena Facility totaled $14.4 million for the year ended December 31, 2014, primarily related to the power generation project, and $24.2 million in the year ended December 31, 2013, primarily related to the power generation project and the ammonium sulfate debottlenecking and production capacity project. Expansion capital expenditures for our Pasadena Facility are expected to be $1.8 million for the year ending December 31, 2015, primarily related to the power generation project.
Our forecasted capital expenditures are subject to change due to unanticipated increases in the cost, scope and completion time for our capital projects. For example, we may experience increases in labor or equipment costs necessary to comply with government regulations or to complete projects that sustain or improve the profitability of our facilities.
Distributions
Our policy is generally to distribute to our unitholders all of the cash available for distribution we generate each quarter, which could materially affect our liquidity and limit our ability to grow. Cash available for distribution for each quarter will be determined by the board of directors of our general partner following the end of such quarter. Cash available for distribution for each quarter will generally be calculated as the cash we generate during the quarter, less cash needed for maintenance capital expenditures not funded by capital proceeds, debt service and other contractual obligations and any increases in cash reserves for future operating or capital needs that the board deems necessary or appropriate. Increases or decreases in such reserves may be determined at any time by the board as it considers, among other things, the cash flows or cash needs expected in approaching periods. We do not intend to maintain excess distribution coverage for the purpose of maintaining stability or growth in our quarterly distribution, nor do we intend to incur debt to pay quarterly distributions. As a result of our quarterly distributions, our liquidity may be significantly affected. However, our partnership agreement does not require us to pay cash distributions on a quarterly or other basis, and we may change our distribution policy at any time and from time to time.
The following is a summary of cash distributions paid to common unitholders and holders of phantom units during the year ended December 31, 2014 for the respective quarter to which the distributions relate:
| December 31, 2013 |
March 31, 2014 |
June 30, 2014 |
September 30, 2014 |
Total Cash Distributions Paid in 2014 |
||||||||||||||||
| Distribution to common unitholders — affiliates |
$ | 1,162 | $ | 1,861 | $ | 3,022 | $ | 1,163 | $ | 7,208 | ||||||||||
| Distribution to common unitholders — non-affiliates |
792 | 1,266 | 2,060 | 789 | 4,907 | |||||||||||||||
|
|
|
|
|
|
|
|
|
|
|
|||||||||||
| Total amount paid |
$ | 1,954 | $ | 3,127 | $ | 5,082 | $ | 1,952 | $ | 12,115 | ||||||||||
|
|
|
|
|
|
|
|
|
|
|
|||||||||||
| Per common unit |
$ | 0.05 | $ | 0.08 | $ | 0.13 | $ | 0.05 | $ | 0.31 | ||||||||||
|
|
|
|
|
|
|
|
|
|
|
|||||||||||
| Common and phantom units outstanding |
39,081 | 39,081 | 39,098 | 39,030 | ||||||||||||||||
|
|
|
|
|
|
|
|
|
|||||||||||||
On February 12, 2015, we announced a cash distribution to our common unitholders and payments to holders of phantom units for the period October 1, 2014 through and including December 31, 2014 of $0.30 per common unit or $11.7 million in the aggregate. This distribution will bring cumulative cash distributed for the twelve months ended December 31, 2014 to $0.56 per common unit. The cash distribution was paid on February 27, 2015, to unitholders of record at the close of business on February 23, 2015.
CASH FLOWS
Operating Activities
Net cash provided by operating activities for the year ended December 31, 2014 was $64.9 million. We had net loss of $1.1 million for the year ended December 31, 2014 including a goodwill impairment charge of $27.2 million, which relates to the Agrifos Acquisition. We also had non-cash unit-based compensation expense relating to our common units of $1.3 million. We had a loss on gas derivatives of $4.0 million relating to our forward purchase natural gas contracts. Accounts receivable increased by $9.3 million due primarily to collections timing at our Pasadena Facility and higher ammonia deliveries at our East Dubuque Facility during the year ended December 31, 2014.
68
Table of Contents
Net cash provided by operating activities for the year ended December 31, 2013 was $44.5 million. We had net income of $4.1 million for the year ended December 31, 2013. For the year ended December 31, 2013, we had Pasadena goodwill impairment of $30.0 million relating to the Agrifos Acquisition. During this period, we issued the Notes and paid off the outstanding principal balance under our Second 2012 Credit Agreement, which resulted in a loss on the extinguishment of debt of $6.0 million. We also had unit-based compensation expense relating to our common units of $1.5 million. Due to the fire and the resulting interruption of production, our East Dubuque Facility had excess natural gas which it sold. Accrued interest increased by $3.8 million due to the Notes.
Net cash provided by operating activities for the year ended December 31, 2012 was $132.5 million. We had net income of $107.0 million for the year ended December 31, 2012. During this period, we entered into our Second 2012 Credit Agreement and paid off the outstanding principal balance under our First 2012 Credit Agreement. This transaction resulted in a loss on the extinguishment of debt of $2.1 million. We also had unit-based compensation expense relating to our common units of $2.8 million. Deposits on natural gas contracts decreased by $2.8 million due to obtaining lines of credit with two natural gas vendors that had previously required prepayment. Accrued liabilities decreased by $4.7 million due to a decrease in Pasadena Facility’s accrued liabilities of $9.1 million primarily due to the payment of bonuses of $7.2 million, which was partially offset by an increase in East Dubuque Facility’s accrued liabilities primarily from amounts due to customers for recent overpayments and refunds on prepaid contracts that we chose to cancel.
Investing Activities
Net cash used in investing activities was $72.6 million for the year ended December 31, 2014, $90.5 million for the year ended December 31, 2013 and $186.8 million for the year ended December 31, 2012. Net cash used in the investing activities for the year ended December 31, 2014 was primarily related to the projects at our East Dubuque Facility and our Pasadena Facility. At our East Dubuque Facility, we are upgrading a nitric acid compressor train and completed our urea expansion project during the year ended December 31, 2014. At our Pasadena Facility, we replaced our sulfuric acid converter and completed our power generation project during the year ended December 31, 2014.
Net cash used in investing activities for the year ended December 31, 2013 was primarily related to the ammonia production and storage capacity expansion project at our East Dubuque Facility, and the ammonium sulfate debottlenecking and production capacity project, the power generation project and the initial phases of the sulfuric acid converter replacement project at our Pasadena Facility.
In the year ended December 31, 2012, we paid $128.6 million, net of cash received, for the Agrifos Acquisition. The amount for purchase of property, plant, equipment and construction in progress of $57.6 million for the year ended December 31, 2012 relates primarily to the ammonia production and storage capacity expansion project, the urea expansion project and the DEF build-out.
Financing Activities
Net cash provided by financing activities was $1.6 million for the year ended December 31, 2014, $24.3 million for the year ended December 31, 2013 and $65.2 million for the year ended December 31, 2012. During the year ended December 31, 2014, we borrowed $15.0 million under the GE Credit Agreement. We also made distributions of $12.1 million to our unitholders in 2014. During the year ended December 31, 2013, we issued the Notes for $320.0 million and paid off the Second 2012 Credit Agreement in the amount of $205.0 million. We also made distributions of $92.4 million during the year ended December 31, 2013. During the year ended December 31, 2012, we had borrowings under our Second 2012 Credit Agreement and our First 2012 Credit Agreement which totaled $222.8 million and repaid borrowings under our First 2012 credit agreement of $29.5 million. We also made distributions of $118.8 million during the year ended December 31, 2012.
CONTRACTUAL OBLIGATIONS
The following table lists our significant contractual obligations and their future payments at December 31, 2014:
| Contractual Obligations |
Total | Less than 1 Year |
1-3 Years | 3-5 Years | More than 5 Years |
|||||||||||||||
| (in thousands) | ||||||||||||||||||||
| Notes (1) |
$ | 320,000 | $ | — | $ | — | $ | — | $ | 320,000 | ||||||||||
| GE Credit Agreement (2) |
15,000 | — | — | 15,000 | — | |||||||||||||||
| Interest on debt (3) |
133,171 | 21,323 | 42,646 | 42,418 | 26,784 | |||||||||||||||
| Natural gas (4) |
15,568 | 15,568 | — | — | — | |||||||||||||||
| Purchase obligations (5) |
13,850 | 13,850 | — | — | — | |||||||||||||||
| Asset retirement obligation (6) |
4,194 | — | — | — | 4,194 | |||||||||||||||
| Operating leases |
7,624 | 3,612 | 4,012 | — | — | |||||||||||||||
| Gas and electricity fixed charges (7) |
679 | 679 | — | — | — | |||||||||||||||
| Pension plans and postretirement plan (8) |
83 | 83 | — | — | — | |||||||||||||||
|
|
|
|
|
|
|
|
|
|
|
|||||||||||
| Total |
$ | 510,169 | $ | 55,115 | $ | 46,658 | $ | 57,418 | $ | 350,978 | ||||||||||
|
|
|
|
|
|
|
|
|
|
|
|||||||||||
69
Table of Contents
| (1) | There is $320.0 million of principal outstanding under the Notes. |
| (2) | There is $15.0 million of principal outstanding under the GE Credit Agreement. |
| (3) | Interest on debt assumes interest rates existing at December 31, 2014 for variable rate debt. |
| (4) | As of December 31, 2014, the natural gas forward purchase contracts included delivery dates through June 30, 2015. During January and February 2015, we entered into additional fixed-quantity forward purchase contracts at fixed and indexed prices for various delivery dates through December 31, 2015. The total MMBtus associated with these additional forward purchase contracts are 2.7 million and the total amount of the purchase commitments is $7.7 million, resulting in a weighted average rate per MMBtu of $2.88 in these new commitments. We are required to make additional prepayments under these forward purchase contracts in the event that market prices fall below the purchase prices in the contracts. |
| (5) | The amount presented represents certain open purchase orders with our vendors. Not all of our open purchase orders are purchase obligations, since some of the orders are not enforceable or legally binding on us until the goods are received or the services are provided. |
| (6) | We have recorded asset retirement obligations, or AROs, related to future costs associated with the removal of contaminated material upon removal of the phosphoric acid plant at our Pasadena Facility and handling and disposal of asbestos at our East Dubuque Facility. The fair value of a liability for an ARO is recorded in the period in which it is incurred and the cost of such liability increases the carrying amount of the related long-lived asset by the same amount. The liability is accreted each period through charges to operating expense and the capitalized cost is depreciated over the remaining useful life of the asset. The obligation is considered long-term and, therefore, considered to be incurred more than five years after December 31, 2014. |
| (7) | As part of the natural gas transportation and electricity supply contracts at our East Dubuque Facility, we must pay monthly fixed charges over the term of the contracts. |
| (8) | We expect to contribute $0 to the pension plans and $83,000 to the postretirement plan in 2015. |
OFF-BALANCE SHEET ARRANGEMENTS
We did not have any material off-balance sheet arrangements as of December 31, 2014.
RECENT ACCOUNTING PRONOUNCEMENTS FROM FINANCIAL STATEMENT DISCLOSURES
For a discussion of the recent accounting pronouncements relevant to our operations, please refer to “Note 2 — Recent Accounting Pronouncements” of the consolidated financial statements included in “ Part II — Item 8. Financial Statements and Supplementary Data.”
ITEM 7A. QUANTITATIVE AND QUALITATIVE DISCLOSURES ABOUT MARKET RISK
Interest Rate Risk. We are exposed to interest rate risks related to the GE Credit Agreement. Borrowings under the GE Credit Agreement bear interest at a rate equal to an applicable margin plus, at our option, either (a) in the case of base rate borrowings, a rate equal to the highest of (1) the prime rate, (2) the federal funds rate plus 0.5% or (3) LIBOR for an interest period of one month plus 1.00% or (b) in the case of LIBOR borrowings, the offered rate per annum for deposits of dollars for the applicable interest period on the day that is two business days prior to the first day of such interest period. The applicable margin for borrowings under the GE Credit Agreement is 2.25% with respect to base rate borrowings and 3.25% with respect to LIBOR borrowings. As of the date of this report, we had $15.0 million outstanding borrowings under the GE Credit Agreement. Assuming the entire $50.0 million was outstanding under the GE Credit Agreement, an increase or decrease of 100 basis points in the LIBOR rates would result in an increase or decrease in annual interest expense of $0.5 million.
Commodity Price Risk. Our East Dubuque Facility is exposed to significant market risk due to potential changes in prices for fertilizer products and natural gas. Natural gas is the primary raw material used in the production of various nitrogen-based products manufactured at our East Dubuque Facility. Market prices of nitrogen-based products are affected by changes in the prices of commodities such as corn and natural gas as well as by supply and demand and other factors. Currently, we purchase natural gas for use in our East Dubuque Facility on the spot market, and through short-term, fixed supply, fixed price and index price purchase contracts. Natural gas prices have fluctuated during the last several years, increasing substantially in 2008 and subsequently declining to the current lower levels. A hypothetical increase of $0.10 per MMBtu of natural gas would increase the cost to produce one ton of ammonia by $3.30.
In the normal course of business, we currently produce nitrogen-based fertilizer products throughout the year to supply the needs of our East Dubuque Facility’s customers during the high-delivery-volume spring and fall seasons. The value of fertilizer
70
Table of Contents
product inventory is subject to market risk due to fluctuations in the relevant commodity prices. Prices of nitrogen fertilizer products can be volatile. We believe that market prices of nitrogen products are affected by changes in grain prices and demand, natural gas prices and other factors.
We enter into fixed-price prepaid contracts committing our East Dubuque Facility’s customers to purchase our nitrogen fertilizer products at a later date. To a lesser extent, we also enter into prepaid contracts for our Pasadena Facility’s products. By using fixed-price forward contracts, we purchase enough natural gas to manufacture the products that have been sold by our East Dubuque Facility under prepaid contracts for later delivery. We believe that entering into such fixed-price contracts for natural gas and prepaid contracts effectively allows us to fix most of the gross margin on pre-sold product and mitigate risk of increasing market prices of natural gas or decreasing market prices of nitrogen to the extent of such pre-sold products. However, this practice also subjects us to the risk that we may have locked in margins at levels lower than those that might be available if, in periods following these contract dates, natural gas prices were to fall, or nitrogen fertilizer commodity prices were to increase. In addition, we occasionally make forward purchases of natural gas that are not directly linked to specific prepaid contracts. To the extent we make such purchases, we may be unable to benefit from lower natural gas prices in subsequent periods.
Our Pasadena Facility is exposed to significant market risk due to potential changes in prices for fertilizer products, and for ammonia, sulfuric acid and sulfur. Ammonia and sulfuric acid are the primary raw materials used in the production of ammonium sulfate which is the primary product manufactured at our Pasadena Facility. Sulfur is the primary raw material used in the production of sulfuric acid, which our Pasadena Facility produces for both internal consumption in the production of ammonium sulfate and for sales to third parties. During the year ended December 31, 2014, 90% of the sulfuric acid used in our Pasadena Facility’s production of ammonium sulfate was produced at our Pasadena Facility. We purchase a substantial portion of our ammonia and sulfur for use in our Pasadena Facility at prices based on market indices. The market price of ammonium sulfate is affected by changes in the prices of commodities such as soybeans, potatoes, cotton, canola, alfalfa, corn, wheat, ammonia and sulfur as well as by supply and demand for ammonium sulfate and other nitrogen fertilizers, and by other factors such as the price of its other inputs. The margins on the sale of ammonium sulfate fertilizer products are relatively low. If our costs to produce ammonium sulfate fertilizer products increase and the prices at which we sell these products do not correspondingly increase, our profits from the sale of these products may decrease or we may suffer losses on these sales. If the price of our products falls rapidly, we may not be able to recover the costs of our raw materials inventory that was purchased at an earlier time when commodity prices were at higher levels. A hypothetical increase of $10.00 per ton of ammonia would increase the cost to produce one ton of ammonium sulfate by $2.50. A hypothetical increase of $10.00 per ton of sulfur would also increase the cost to produce one ton of ammonium sulfate by $2.50.
Our Pasadena Facility purchases ammonia as a feedstock at contractual prices based on a published Tampa, Florida market index, while our East Dubuque Facility sells similar quantities of ammonia at prevailing prices in the Mid Corn Belt, which are typically significantly higher than Tampa ammonia prices.
71
Table of Contents
ITEM 8. FINANCIAL STATEMENTS AND SUPPLEMENTARY DATA
RENTECH NITROGEN PARTNERS, L.P.
INDEX TO CONSOLIDATED FINANCIAL STATEMENTS
| Page | ||||
| Consolidated Financial Statements of Rentech Nitrogen Partners, L.P.: |
||||
| 73 | ||||
| 74 | ||||
| 75 | ||||
| 76 | ||||
| 77 | ||||
| 78 | ||||
| 80 | ||||
72
Table of Contents
Report of Independent Registered Public Accounting Firm
To the Board of Directors of Rentech Nitrogen GP, LLC and Unitholders of Rentech Nitrogen Partners, L.P.
In our opinion, the consolidated financial statements listed in the accompanying index present fairly, in all material respects, the financial position of Rentech Nitrogen Partners, L.P. and its subsidiaries at December 31, 2014 and 2013, and the results of their operations and their cash flows for each of the three years in the period ended December 31, 2014 in conformity with accounting principles generally accepted in the United States of America. Also, in our opinion, the Partnership did not maintain, in all material respects, effective internal control over financial reporting as of December 31, 2014 based on criteria established in Internal Control — Integrated Framework (2013) issued by the Committee of Sponsoring Organizations of the Treadway Commission (COSO) because material weaknesses in internal control over financial reporting related to (i) the review of the cash flow forecasts used in the accounting for long-lived asset recoverability and goodwill impairment, (ii) the determination of the goodwill impairment charge in accordance with generally accepted accounting principles, and (iii) maintaining documentation supporting management’s review of events and changes in circumstances that indicate it is more likely than not that a goodwill impairment has occurred between annual impairment tests existed as of that date. A material weakness is a deficiency, or a combination of deficiencies, in internal control over financial reporting, such that there is a reasonable possibility that a material misstatement of the annual or interim financial statements will not be prevented or detected on a timely basis. The material weaknesses referred to above are described in Management’s Annual Report on Internal Control Over Financial Reporting appearing under Item 9A. We considered these material weaknesses in determining the nature, timing, and extent of audit tests applied in our audit of the 2014 consolidated financial statements, and our opinion regarding the effectiveness of the Partnership’s internal control over financial reporting does not affect our opinion on those consolidated financial statements. The Partnership’s management is responsible for these financial statements, for maintaining effective internal control over financial reporting and for its assessment of the effectiveness of internal control over financial reporting included in Management’s Annual Report on Internal Control Over Financial Reporting appearing under Item 9A. Our responsibility is to express opinions on these financial statements and on the Partnership’s internal control over financial reporting based on our integrated audits. We conducted our audits in accordance with the standards of the Public Company Accounting Oversight Board (United States). Those standards require that we plan and perform the audits to obtain reasonable assurance about whether the financial statements are free of material misstatement and whether effective internal control over financial reporting was maintained in all material respects. Our audits of the financial statements included examining, on a test basis, evidence supporting the amounts and disclosures in the financial statements, assessing the accounting principles used and significant estimates made by management, and evaluating the overall financial statement presentation. Our audit of internal control over financial reporting included obtaining an understanding of internal control over financial reporting, assessing the risk that a material weakness exists, and testing and evaluating the design and operating effectiveness of internal control based on the assessed risk. Our audits also included performing such other procedures as we considered necessary in the circumstances. We believe that our audits provide a reasonable basis for our opinions.
A company’s internal control over financial reporting is a process designed to provide reasonable assurance regarding the reliability of financial reporting and the preparation of financial statements for external purposes in accordance with generally accepted accounting principles. A company’s internal control over financial reporting includes those policies and procedures that (i) pertain to the maintenance of records that, in reasonable detail, accurately and fairly reflect the transactions and dispositions of the assets of the company; (ii) provide reasonable assurance that transactions are recorded as necessary to permit preparation of financial statements in accordance with generally accepted accounting principles, and that receipts and expenditures of the company are being made only in accordance with authorizations of management and directors of the company; and (iii) provide reasonable assurance regarding prevention or timely detection of unauthorized acquisition, use, or disposition of the company’s assets that could have a material effect on the financial statements.
Because of its inherent limitations, internal control over financial reporting may not prevent or detect misstatements. Also, projections of any evaluation of effectiveness to future periods are subject to the risk that controls may become inadequate because of changes in conditions, or that the degree of compliance with the policies or procedures may deteriorate.
| /s/ PricewaterhouseCoopers LLP |
| Los Angeles, California |
| March 16, 2015 |
73
Table of Contents
RENTECH NITROGEN PARTNERS, L.P.
Consolidated Balance Sheets
(Amounts in thousands, except per share data)
| As of December 31, | ||||||||
| 2014 | 2013 | |||||||
| ASSETS | ||||||||
| Current assets |
||||||||
| Cash |
$ | 28,028 | $ | 34,060 | ||||
| Accounts receivable |
16,714 | 7,434 | ||||||
| Inventories |
27,736 | 31,102 | ||||||
| Prepaid expenses and other current assets |
4,942 | 4,942 | ||||||
| Other receivables, net |
357 | 2,227 | ||||||
|
|
|
|
|
|||||
| Total current assets |
77,777 | 79,765 | ||||||
|
|
|
|
|
|||||
| Property, plant and equipment, net |
259,011 | 234,359 | ||||||
|
|
|
|
|
|||||
| Construction in progress |
47,758 | 33,531 | ||||||
|
|
|
|
|
|||||
| Other assets |
||||||||
| Goodwill |
— | 27,202 | ||||||
| Intangible assets |
21,114 | 22,298 | ||||||
| Debt issuance costs |
8,315 | 8,404 | ||||||
| Other assets |
341 | 785 | ||||||
|
|
|
|
|
|||||
| Total other assets |
29,770 | 58,689 | ||||||
|
|
|
|
|
|||||
| Total assets |
$ | 414,316 | $ | 406,344 | ||||
|
|
|
|
|
|||||
| LIABILITIES AND PARTNERS’ CAPITAL | ||||||||
| Current liabilities |
||||||||
| Accounts payable |
$ | 14,846 | $ | 9,793 | ||||
| Payable to general partner |
3,035 | 5,353 | ||||||
| Accrued liabilities |
14,203 | 18,444 | ||||||
| Deferred revenue |
26,700 | 20,365 | ||||||
| Accrued interest |
4,494 | 4,622 | ||||||
|
|
|
|
|
|||||
| Total current liabilities |
63,278 | 58,577 | ||||||
|
|
|
|
|
|||||
| Long-term liabilities |
||||||||
| Debt |
335,000 | 320,000 | ||||||
| Asset retirement obligation |
4,194 | 2,822 | ||||||
| Other |
2,953 | 1,820 | ||||||
|
|
|
|
|
|||||
| Total long-term liabilities |
342,147 | 324,642 | ||||||
|
|
|
|
|
|||||
| Total liabilities |
405,425 | 383,219 | ||||||
|
|
|
|
|
|||||
| Commitments and contingencies (Note 10) |
||||||||
| Partners’ capital |
||||||||
| Common unitholders — 38,913 and 38,889 units issued and outstanding at December 31, 2014 and 2013, respectively |
8,886 | 21,816 | ||||||
| Accumulated other comprehensive income |
5 | 1,309 | ||||||
| General partner’s interest |
— | — | ||||||
|
|
|
|
|
|||||
| Total partners’ capital |
8,891 | 23,125 | ||||||
|
|
|
|
|
|||||
| Total liabilities and partners’ capital |
$ | 414,316 | $ | 406,344 | ||||
|
|
|
|
|
|||||
See Accompanying Notes to Consolidated Financial Statements.
74
Table of Contents
RENTECH NITROGEN PARTNERS, L.P.
Consolidated Statements of Operations
(Amounts in thousands, except per unit data)
| For the Years Ended December 31, |
||||||||||||
| 2014 | 2013 | 2012 | ||||||||||
| Revenues |
$ | 334,612 | $ | 311,375 | $ | 261,635 | ||||||
| Cost of sales |
274,135 | 240,021 | 129,796 | |||||||||
|
|
|
|
|
|
|
|||||||
| Gross profit |
60,477 | 71,354 | 131,839 | |||||||||
|
|
|
|
|
|
|
|||||||
| Operating expenses |
||||||||||||
| Selling, general and administrative expense |
18,011 | 17,285 | 18,376 | |||||||||
| Depreciation and amortization |
1,509 | 4,077 | 1,390 | |||||||||
| Pasadena goodwill impairment |
27,202 | 30,029 | — | |||||||||
| Other |
542 | 806 | 510 | |||||||||
|
|
|
|
|
|
|
|||||||
| Total operating expenses |
47,264 | 52,197 | 20,276 | |||||||||
|
|
|
|
|
|
|
|||||||
| Operating income |
13,213 | 19,157 | 111,563 | |||||||||
|
|
|
|
|
|
|
|||||||
| Other income (expense), net |
||||||||||||
| Interest expense |
(19,057 | ) | (14,098 | ) | (1,469 | ) | ||||||
| Agrifos settlement |
5,632 | — | — | |||||||||
| Loss on debt extinguishment |
(635 | ) | (6,001 | ) | (2,114 | ) | ||||||
| Gain on fair value adjustment to earn-out consideration |
— | 4,920 | — | |||||||||
| Other expense, net |
(197 | ) | (6 | ) | (674 | ) | ||||||
|
|
|
|
|
|
|
|||||||
| Total other expenses, net |
(14,257 | ) | (15,185 | ) | (4,257 | ) | ||||||
|
|
|
|
|
|
|
|||||||
| Income (loss) before income taxes |
(1,044 | ) | 3,972 | 107,306 | ||||||||
| Income tax (benefit) expense |
18 | (96 | ) | 303 | ||||||||
|
|
|
|
|
|
|
|||||||
| Net income (loss) |
$ | (1,062 | ) | $ | 4,068 | $ | 107,003 | |||||
|
|
|
|
|
|
|
|||||||
| Net income (loss) per common unit allocated to common unitholders — Basic and Diluted |
$ | (0.03 | ) | $ | 0.10 | $ | 2.78 | |||||
| Weighted-average units used to compute net income (loss) per common unit: |
||||||||||||
| Basic |
38,898 | 38,850 | 38,350 | |||||||||
| Diluted |
38,898 | 38,945 | 38,352 | |||||||||
See Accompanying Notes to Consolidated Financial Statements.
75
Table of Contents
RENTECH NITROGEN PARTNERS, L.P.
Consolidated Statements of Comprehensive Income (Loss)
(Amounts in thousands)
| For the Years Ended December 31, |
||||||||||||
| 2014 | 2013 | 2012 | ||||||||||
| Net income (loss) |
$ | (1,062 | ) | $ | 4,068 | $ | 107,003 | |||||
| Other comprehensive income (loss), net of tax: |
||||||||||||
| Pension and postretirement plan adjustments |
(1,304 | ) | 1,143 | 166 | ||||||||
|
|
|
|
|
|
|
|||||||
| Other comprehensive income (loss) |
(1,304 | ) | 1,143 | 166 | ||||||||
|
|
|
|
|
|
|
|||||||
| Comprehensive income (loss) |
$ | (2,366 | ) | $ | 5,211 | $ | 107,169 | |||||
|
|
|
|
|
|
|
|||||||
See Accompanying Notes to Consolidated Financial Statements.
76
Table of Contents
RENTECH NITROGEN PARTNERS, L.P.
Consolidated Statements of Partners’ Capital
(Amounts in thousands)
| Number of Common Units |
Common Unitholders |
Accumulated Other Comprehensive Income |
General Partner |
Total Partners’ Capital |
||||||||||||||||
| Balance, December 31, 2011 |
38,250 | $ | 99,191 | $ | — | $ | — | $ | 99,191 | |||||||||||
| Common units issued for acquisition |
539 | 20,000 | — | — | 20,000 | |||||||||||||||
| Common units |
50 | (736 | ) | — | — | (736 | ) | |||||||||||||
| Distributions to common unitholders — affiliates |
— | (71,610 | ) | — | — | (71,610 | ) | |||||||||||||
| Distributions to common unitholders — non-affiliates |
— | (47,205 | ) | — | — | (47,205 | ) | |||||||||||||
| Unit-based compensation expense |
— | 2,827 | — | — | 2,827 | |||||||||||||||
| Net income |
— | 107,003 | — | — | 107,003 | |||||||||||||||
| Other comprehensive income |
— | — | 166 | — | 166 | |||||||||||||||
| Other |
— | (232 | ) | — | — | (232 | ) | |||||||||||||
|
|
|
|
|
|
|
|
|
|
|
|||||||||||
| Balance, December 31, 2012 |
38,839 | $ | 109,238 | $ | 166 | $ | — | $ | 109,404 | |||||||||||
| Common units |
50 | (519 | ) | — | — | (519 | ) | |||||||||||||
| Distributions to common unitholders — affiliates |
— | (55,102 | ) | — | — | (55,102 | ) | |||||||||||||
| Distributions to common unitholders — non-affiliates |
— | (37,329 | ) | — | — | (37,329 | ) | |||||||||||||
| Unit-based compensation expense |
— | 1,460 | — | — | 1,460 | |||||||||||||||
| Net income |
— | 4,068 | — | — | 4,068 | |||||||||||||||
| Other comprehensive income |
— | — | 1,143 | — | 1,143 | |||||||||||||||
|
|
|
|
|
|
|
|
|
|
|
|||||||||||
| Balance, December 31, 2013 |
38,889 | $ | 21,816 | $ | 1,309 | $ | — | $ | 23,125 | |||||||||||
| Common units |
83 | (404 | ) | — | — | (404 | ) | |||||||||||||
| Common units returned — Agrifos settlement |
(59 | ) | (632 | ) | — | — | (632 | ) | ||||||||||||
| Distributions to common unitholders — affiliates |
— | (7,208 | ) | — | — | (7,208 | ) | |||||||||||||
| Distributions to common unitholders — non-affiliates |
— | (4,907 | ) | — | — | (4,907 | ) | |||||||||||||
| Unit-based compensation expense |
— | 1,283 | — | — | 1,283 | |||||||||||||||
| Net loss |
— | (1,062 | ) | — | — | (1,062 | ) | |||||||||||||
| Other comprehensive loss |
— | — | (1,304 | ) | — | (1,304 | ) | |||||||||||||
|
|
|
|
|
|
|
|
|
|
|
|||||||||||
| Balance, December 31, 2014 |
38,913 | $ | 8,886 | $ | 5 | $ | — | $ | 8,891 | |||||||||||
|
|
|
|
|
|
|
|
|
|
|
|||||||||||
See Accompanying Notes to Consolidated Financial Statements.
77
Table of Contents
RENTECH NITROGEN PARTNERS, L.P.
Consolidated Statements of Cash Flows
(Amounts in thousands)
| For the Years Ended December 31, |
||||||||||||
| 2014 | 2013 | 2012 | ||||||||||
| Cash flows from operating activities |
||||||||||||
| Net income (loss) |
$ | (1,062 | ) | $ | 4,068 | $ | 107,003 | |||||
| Adjustments to reconcile net income (loss) to net cash provided by operating activities |
||||||||||||
| Depreciation and amortization |
24,257 | 17,312 | 12,460 | |||||||||
| Utilization of spare parts |
5,398 | 3,778 | 2,042 | |||||||||
| Write-down of inventory |
6,045 | 12,360 | — | |||||||||
| Non-cash interest expense |
1,192 | 961 | 387 | |||||||||
| Pasadena goodwill impairment |
27,202 | 30,029 | — | |||||||||
| Loss on debt extinguishment |
635 | 6,001 | 2,114 | |||||||||
| (Gain) loss on interest rate swaps |
— | (17 | ) | 929 | ||||||||
| Unit-based compensation |
1,283 | 1,460 | 2,827 | |||||||||
| Unrealized loss on gas derivatives |
3,955 | — | — | |||||||||
| Other |
(1,287 | ) | 1,779 | (118 | ) | |||||||
| Changes in operating assets and liabilities: |
||||||||||||
| Accounts receivable |
(9,280 | ) | 2,271 | 999 | ||||||||
| Other receivables |
1,870 | 399 | 2 | |||||||||
| Inventories |
(1,757 | ) | (16,190 | ) | 8,727 | |||||||
| Other assets |
322 | (767 | ) | 2,807 | ||||||||
| Prepaid expenses and other current assets |
(707 | ) | (1,515 | ) | (90 | ) | ||||||
| Accounts payable |
4,887 | (5,289 | ) | 1,020 | ||||||||
| Deferred revenue |
6,335 | (9,295 | ) | (3,972 | ) | |||||||
| Accrued interest |
438 | 3,780 | 119 | |||||||||
| Accrued liabilities, accrued payroll and other |
(4,847 | ) | (6,667 | ) | (4,710 | ) | ||||||
|
|
|
|
|
|
|
|||||||
| Net cash provided by operating activities |
64,879 | 44,458 | 132,546 | |||||||||
|
|
|
|
|
|
|
|||||||
| Cash flows from investing activities |
||||||||||||
| Payment for acquisition, net of cash acquired |
— | (290 | ) | (128,596 | ) | |||||||
| Capital expenditures |
(71,663 | ) | (90,288 | ) | (57,571 | ) | ||||||
| Other items |
(897 | ) | 38 | (658 | ) | |||||||
|
|
|
|
|
|
|
|||||||
| Net cash used in investing activities |
(72,560 | ) | (90,540 | ) | (186,825 | ) | ||||||
|
|
|
|
|
|
|
|||||||
| Cash flows from financing activities |
||||||||||||
| Proceeds from issuance of notes |
— | 320,000 | — | |||||||||
| Payment of offering costs |
— | (972 | ) | — | ||||||||
| Proceeds from initial public offering, net of costs |
— | — | (245 | ) | ||||||||
| Proceeds from credit facilities and term loan, net of original issue discount |
15,000 | 15,600 | 222,780 | |||||||||
| Proceeds from bridge loan from parent |
— | — | 5,860 | |||||||||
| Payment of bridge loan to parent |
— | — | (5,860 | ) | ||||||||
| Payments and retirement of debt |
— | (208,890 | ) | (30,490 | ) | |||||||
| Payment of debt issuance costs |
(1,236 | ) | (8,964 | ) | (7,788 | ) | ||||||
| Payment of bridge loan fee to parent, net |
— | — | (200 | ) | ||||||||
| Distributions to common unitholders – affiliates |
(7,208 | ) | (55,102 | ) | (71,610 | ) | ||||||
See Accompanying Notes to Consolidated Financial Statements.
78
Table of Contents
RENTECH NITROGEN PARTNERS, L.P.
Consolidated Statements of Cash Flows—Continued
(Amounts in thousands)
| For the Years Ended December 31, |
||||||||||||
| 2014 | 2013 | 2012 | ||||||||||
| Distribution to common unitholders — non-affiliates |
(4,907 | ) | (37,329 | ) | (47,205 | ) | ||||||
|
|
|
|
|
|
|
|||||||
| Net cash provided by financing activities |
1,649 | 24,343 | 65,242 | |||||||||
|
|
|
|
|
|
|
|||||||
| Increase (decrease) in cash |
(6,032 | ) | (21,739 | ) | 10,963 | |||||||
| Cash, beginning of period |
34,060 | 55,799 | 44,836 | |||||||||
|
|
|
|
|
|
|
|||||||
| Cash, end of period |
$ | 28,028 | $ | 34,060 | $ | 55,799 | ||||||
|
|
|
|
|
|
|
|||||||
For the years ended December 31, 2014, 2013 and 2012, the Partnership made certain cash payments as follows:
| For the Years Ended December 31, |
||||||||||||
| 2014 | 2013 | 2012 | ||||||||||
| Cash payments of interest, net of capitalized interest of $3,077 (Dec 2014), $3,243 (Dec 2013) and $701 (Dec 2012) |
$ | 17,787 | $ | 9,674 | $ | 964 | ||||||
Excluded from the consolidated statements of cash flows were the effects of certain non-cash financing and investing activities as follows:
| For the Years Ended December 31, |
||||||||||||
| 2014 | 2013 | 2012 | ||||||||||
| Purchase of property, plant, equipment and construction in progress in accounts payable and accrued liabilities |
$ | 5,739 | $ | 10,509 | $ | 5,223 | ||||||
| Increase in asset retirement obligation |
1,265 | — | — | |||||||||
| Current deposits transferred into construction in progress |
— | — | 1,505 | |||||||||
| Units issued related to acquisition |
— | — | 20,000 | |||||||||
See Accompanying Notes to Consolidated Financial Statements.
79
Table of Contents
RENTECH NITROGEN PARTNERS, L.P.
Notes to Consolidated Financial Statements
Note 1 — Description of Business
Description of Business
Rentech Nitrogen Partners, L.P. (“RNP”, “the Partnership,” “we,” “us” or “our”) owns and operates two fertilizer facilities: our East Dubuque Facility and our Pasadena Facility. Our East Dubuque Facility is located in East Dubuque, Illinois. We produce primarily ammonia and urea ammonium nitrate solution (“UAN”) at our East Dubuque Facility, using natural gas as the facility’s primary feedstock. Our Pasadena Facility, which we acquired in November 2012, is located in Pasadena, Texas. We produce ammonium sulfate, ammonium thiosulfate and sulfuric acid at our Pasadena Facility, using ammonia and sulfur as the facility’s primary feedstocks.
We were formed in 2011 by Rentech, Inc. (“Rentech”). Rentech Nitrogen Holdings, Inc. (“RNHI”), Rentech’s indirect wholly owned subsidiary, owns approximately 60% of the outstanding Partnership common units and Rentech Nitrogen GP, LLC (the “General Partner”), RNHI’s wholly owned subsidiary, owns 100% of the non-economic general partner interest in us.
On November 1, 2012, the Partnership completed its acquisition of 100% of the membership interests of Agrifos LLC (“Agrifos”) from Agrifos Holdings Inc. (the “Seller”), pursuant to a Membership Interest Purchase Agreement (the “Agrifos Purchase Agreement”). Upon the closing of this transaction (the “Agrifos Acquisition”), Agrifos became a wholly owned subsidiary of the Partnership and its name changed to Rentech Nitrogen Pasadena Holdings, LLC (“RNPH”). RNPH owns all of the member interests in Rentech Nitrogen Pasadena, LLC (“RNPLLC”), formerly known as Agrifos Fertilizer, LLC, which owns and operates the Pasadena Facility. For information on the Agrifos Acquisition refer to Note 3 — Agrifos Acquisition.
Note 2 — Summary of Certain Significant Accounting Policies
Principles of Consolidation
The accompanying consolidated financial statements include the accounts of the Partnership and its wholly owned subsidiaries. All significant intercompany accounts and transactions have been eliminated in consolidation.
Use of Estimates
The preparation of consolidated financial statements in conformity with accounting principles generally accepted in the United States of America requires management to make estimates and assumptions that affect the reported amounts of assets and liabilities, the disclosure of contingent assets and liabilities as of the date of the consolidated financial statements, and the reported amounts of revenues and expenses during the reporting period. Actual results could differ from those estimates.
Revenue Recognition
East Dubuque and Pasadena Policy
Revenues are recognized when customers take ownership upon shipment from the East Dubuque Facility, Pasadena Facility, East Dubuque Facility’s leased facility or Pasadena Facility’s distributors’ facilities and (i) customer assumes risk of loss, (ii) there are no uncertainties regarding customer acceptance, (iii) collection of the related receivable is probable, (iv) persuasive evidence of a sale arrangement exists and (v) the sales price is fixed or determinable. Management assesses the business environment, the customer’s financial condition, historical collection experience, accounts receivable aging and customer disputes to determine whether collectability is reasonably assured. If collectability is not considered reasonably assured at the time of sale, the Partnership does not recognize revenue until collection occurs.
Natural gas, though not typically purchased for the purpose of resale, is occasionally sold by the East Dubuque Facility when contracted quantities received are in excess of production and storage capacities, in which case the sales price is recorded in revenues and the related cost is recorded in cost of sales. Natural gas sales were $6.1 million for the year ended December 31, 2014, $3.4 million for the year ended December 31, 2013 and $1.1 million for the year ended December 31, 2012.
East Dubuque Contracts
RNLLC has a distribution agreement (the “Distribution Agreement”) with Agrium U.S.A., Inc. (“Agrium”). The Distribution Agreement is for a 10 year period, subject to renewal options. Pursuant to the Distribution Agreement, Agrium is obligated to use commercially reasonable efforts to promote the sale of, and solicit and secure orders from its customers for nitrogen fertilizer products
80
Table of Contents
manufactured at the East Dubuque Facility, and to purchase from RNLLC nitrogen fertilizer products manufactured at the facility for prices to be negotiated in good faith from time to time. Under the Distribution Agreement, Agrium is appointed as the exclusive distributor for the sale, purchase and resale of nitrogen products manufactured at the East Dubuque Facility. Sale terms are negotiated and approved by RNLLC. Agrium bears the credit risk on products sold through Agrium pursuant to the Distribution Agreement. If an agreement is not reached on the terms and conditions of any proposed Agrium sale transaction, RNLLC has the right to sell to third parties provided the sale is on the same timetable and volumes and at a price not lower than the one proposed by Agrium. For the years ended December 31, 2014, 2013 and 2012, the Distribution Agreement accounted for 78%, 79% and 83%, respectively, of net revenues from product sales for the East Dubuque Facility. Receivables from Agrium accounted for 36% and 84% of the total accounts receivable balance of the East Dubuque Facility as of December 31, 2014 and 2013, respectively. Agrium made more timely payments in 2014 than in 2013 which accounted for the lower percentage in 2014.
RNP negotiates sales with other customers and these transactions are not subject to the terms of the Distribution Agreement.
Under the Distribution Agreement, the East Dubuque Facility pays commissions to Agrium not to exceed $5 million during each contract year on applicable gross sales during the first 10 years of the agreement. The commission rate is 5%. The effective commission rate for the year ended December 31, 2014 was 3.4%, 3.6% for the year ended December 31, 2013 and 2.7% for the year ended December 31, 2012. The commission expense was recorded in cost of sales for all periods.
Pasadena Contracts
We sell substantially all of our Pasadena Facility’s products through marketing and distribution agreements. Pursuant to an exclusive marketing agreement we have entered into with Interoceanic Corporation (“IOC”), IOC has the exclusive right and obligation to market and sell all of our Pasadena Facility’s ammonium sulfate product. Under the marketing agreement, IOC is required to use commercially reasonable efforts to market the product to obtain the most advantageous price. We compensate IOC for transportation and storage costs relating to the ammonium sulfate product it markets through the pricing structure under the marketing agreement. The marketing agreement has a term that ends December 31, 2016, but automatically renews for subsequent one-year periods (unless either party delivers a termination notice to the other party at least 210 days prior to an automatic renewal). The marketing agreement may be terminated prior to its stated term for specified causes. During the years ended December 31, 2014, 2013 and the period beginning November 1, 2012 through December 31, 2012, the marketing agreement with IOC accounted for 100% of our Pasadena Facility’s revenues from the sale of ammonium sulfate. In addition, we have an arrangement with IOC that permits us to store approximately 60,000 tons of ammonium sulfate at IOC-controlled terminals, which are located near end customers of our Pasadena Facility’s ammonium sulfate. This arrangement currently is not governed by a written contract. We also have marketing and distribution agreements to sell other products that automatically renew for successive one year periods.
Deferred Revenue
A significant portion of the revenue recognized during any period may be related to prepaid contracts or products stored at IOC facilities, for which cash was collected during an earlier period, with the result that a significant portion of revenue recognized during a period may not generate cash receipts during that period. As of December 31, 2014 deferred revenue was $26.7 million and $20.4 million for the year ended December 31, 2013. At the East Dubuque Facility, we record a liability for deferred revenue to the extent that payment has been received under prepaid contracts, which create obligations for delivery of product within a specified period of time in the future. The terms of these prepaid contracts require payment in advance of delivery. At the Pasadena Facility, IOC pre-pays a portion of the sales price for shipments received into its storage facilities. The Partnership recognizes revenue related to the prepaid contracts or products stored at IOC facilities and relieves the liability for deferred revenue when products are shipped (including shipments to end customers from IOC facilities).
Cost of Sales
Cost of sales are comprised of manufacturing costs related to the Partnership’s fertilizer products. Cost of sales expenses include direct materials (such as natural gas, ammonia, sulfur and sulfur acid), direct labor, indirect labor, employee fringe benefits, depreciation on plant machinery, electricity and other costs, including shipping and handling charges incurred to transport products sold.
The Partnership enters into short-term contracts to purchase physical supplies of natural gas in fixed quantities at both fixed and indexed prices. The Partnership anticipates that it will physically receive the contract quantities and use them in the production of fertilizer. The Partnership believes it is probable that the counterparties will fulfill their contractual obligations when executing these contracts. Natural gas purchases, including the cost of transportation to the East Dubuque Facility, are recorded at the point of delivery into the pipeline system.
81
Table of Contents
Accounting for Derivative Instruments
Accounting guidance establishes accounting and reporting requirements for derivative instruments and hedging activities. This guidance requires recognition of all derivative instruments as assets or liabilities on the Partnership’s consolidated balance sheets and measurement of those instruments at fair value. The accounting treatment of changes in fair value is dependent upon whether or not a derivative instrument is designated as a hedge and if so, the type of hedge. The Partnership currently does not designate any of its derivatives as hedges for financial accounting purposes. Gains and losses on derivative instruments not designated as hedges are currently included in earnings and reported under cash flows from operating activities.
Cash
The Partnership has checking and savings accounts with major financial institutions. At times balances with these financial institutions may be in excess of federally insured limits.
Accounts and Other Receivables
Trade receivables are recorded at net realizable value. The allowance for doubtful accounts reflects the Partnership’s best estimate of probable losses inherent in the accounts receivable balance. The Partnership determines the allowance based on known troubled accounts, historical experience, and other currently available evidence. The Partnership reviews its allowance for doubtful accounts quarterly. Past due balances over 90 days and over a specified amount are reviewed individually for collectibility. Account balances are charged off against the allowance after all means of collection have been exhausted and the potential for recovery is considered remote.
Inventories
Inventories consist of raw materials and finished goods. The primary raw material used by the East Dubuque Facility in the production of its nitrogen products is natural gas. The primary raw materials used by the Pasadena Facility in the production of its products are ammonia and sulfur. Raw materials also include certain chemicals used in the manufacturing process. Finished goods include the products stored at each plant that are ready for shipment along with any inventory that may be stored at remote facilities. Inventories on the balance sheets included depreciation in the amount of $2.1 million at December 31, 2014 and $1.2 million at December 31, 2013.
Inventories are stated at the lower of cost or estimated net realizable value. The cost of inventories is determined using the first-in first-out method. The estimated net realizable value is based on customer orders, market trends and historical pricing. On at least a quarterly basis, the Partnership performs an analysis of its inventory balances to determine if the carrying amount of inventories exceeds its net realizable value. If the carrying amount exceeds the estimated net realizable value, the carrying amount is reduced to the estimated net realizable value. During turnarounds at the East Dubuque and Pasadena Facilities, the Partnership allocates fixed production overhead costs to inventory based on the normal capacity of its production facilities and unallocated overhead costs are recognized as expense in the period incurred.
Property, Plant and Equipment
Property, plant and equipment is stated at cost less accumulated depreciation. Depreciation expense is calculated using the straight-line method over the estimated useful lives of the assets, except for platinum catalyst, as follows:
| Type of Asset |
Estimated Useful Life | |
| Building and building improvements | 20-40 years | |
| Land improvements | 10-20 years | |
| Machinery and equipment | 7-10 years | |
| Furniture, fixtures and office equipment | 5-10 years | |
| Computer equipment and software | 3-5 years | |
| Vehicles | 3-5 years | |
| Ammonia catalyst | 3-10 years | |
| Platinum catalyst | Based on units of production |
Expenditures during turnarounds or at other times for improving, replacing or adding to RNP’s assets are capitalized. Expenditures for the acquisition, construction or development of new assets to maintain RNP’s operating capacity, or to comply with environmental, health, safety or other regulations, are also capitalized. Costs of general maintenance and repairs are expensed.
82
Table of Contents
When property, plant and equipment is retired or otherwise disposed of, the asset and accumulated depreciation are removed from the accounts and the resulting gain or loss is reflected in operating expenses.
Spare parts are maintained by each facility to reduce the length of possible interruptions in plant operations from an infrastructure breakdown at the facility. The spare parts may be held for use for years before the spare parts are used. As a result, they are capitalized as a fixed asset at cost. When spare parts are utilized, the book values of the assets are charged to earnings as a cost of production. Periodically, the spare parts are evaluated for obsolescence and impairment and if the value of the spare parts is impaired, it is charged against earnings.
Long-lived assets and construction in progress are reviewed whenever events or changes in circumstances indicate that the carrying amount may not be recoverable. If the expected future cash flow from the use of the asset and its eventual disposition is less than the carrying amount of the asset, an impairment loss is recognized and measured using the asset’s fair value.
The Partnership capitalizes certain direct development costs associated with internal-use software, including external direct costs of material and services, and payroll costs for employees devoting time to software implementation projects. Costs incurred during the preliminary project stage, as well as maintenance and training costs, are expensed as incurred.
The Partnership has recorded asset retirement obligations (“AROs”) related to future costs associated with (i) the removal of contaminated material at the former phosphorous plant at the Pasadena Facility and (ii) disposal of asbestos at the East Dubuque Facility. The fair value of a liability for an ARO is recorded in the period in which it is incurred and the cost of such liability increases the carrying amount of the related long-lived asset by the same amount. The liability is accreted each period through charges to operating expense and the capitalized cost is depreciated over the remaining useful life of the asset.
A reconciliation of the change in the carrying value of the AROs is as follows:
| Balance at December 31, 2013 |
$ | 2,822 | ||
| Accretion expense |
107 | |||
| Revisions in the estimated cash flows |
1,265 | |||
|
|
|
|||
| Balance at December 31, 2014 |
$ | 4,194 | ||
|
|
|
Construction in Progress
We also capitalize costs for improvements to the existing machinery and equipment at our facilities and certain costs associated with our information technology initiatives. We do not depreciate construction in progress costs until the underlying assets are placed into service.
Acquisition Method of Accounting
The Partnership accounts for business combinations using the acquisition method of accounting, which requires, among other things, that assets acquired, liabilities assumed and earn-out consideration be recognized at their fair values as of the acquisition date.
Goodwill
Goodwill represents the excess of the purchase price over the fair value of identifiable net assets acquired in a business combination. The Partnership tests goodwill for impairment annually, or more often if an event or circumstance indicates that an impairment may have occurred. The analysis of the potential impairment of goodwill is a two-step process. Step one of the impairment test consists of comparing the fair value of the reporting unit with the aggregate carrying value, including goodwill. If the carrying value of a reporting unit exceeds the reporting unit’s fair value, step two must be performed to determine the amount, if any, of the goodwill impairment.
There are significant assumptions involved in performing a goodwill impairment test, which include discount rates, terminal growth rates, future sales prices of end products, raw material costs, and sales volumes. The various valuation methods used (income approach, replacement cost and market approach) are weighted in determining fair value. See “Note 8 — Goodwill.”
83
Table of Contents
Intangible Assets
Intangible assets arose in conjunction with the Agrifos Acquisition (See Note 3 — Agrifos Acquisition) and consist of technology to produce ammonium sulfate and the Pasadena Facility’s marketing agreement with IOC.
Intangible assets consist of the following at December 31, 2014 and 2013:
| 2014 | 2013 | Average Life | ||||||||||
| (in thousands) | ||||||||||||
| Technologies to produce fertilizers |
$ | 23,680 | $ | 23,680 | 20 | |||||||
| Fertilizer marketing agreements |
3,088 | 3,088 | 1.5 | |||||||||
|
|
|
|
|
|||||||||
| Intangibles, gross |
$ | 26,768 | $ | 26,768 | ||||||||
| Less: accumulated amortization |
(5,654 | ) | (4,470 | ) | ||||||||
|
|
|
|
|
|||||||||
| Intangibles, net |
$ | 21,114 | $ | 22,298 | ||||||||
|
|
|
|
|
|||||||||
At December 31, 2014, accumulated amortization for technologies and marketing agreements was $2.6 million and $3.1 million, respectively. The amortization of the assets will result in amortization expense of $1.2 million for each of the next five years.
Technologies to produce fertilizers consist of certain proprietary technological processes, technological functions, intellectual property, formulations, and trade secrets to produce commercial volumes of synthetic ammonium sulfate fertilizer.
Income Taxes
We are not a taxable entity for federal income tax purposes. As such, we do not directly pay federal income tax. Our taxable income or loss, which may vary substantially from the net income or net loss we report in our consolidated statement of operations, is includable in the federal income tax returns of each partner. The aggregate difference in the basis of our net assets for financial and tax reporting purposes cannot be readily determined as we do not have access to information about each partner’s tax attributes in us.
Net Income Per Common Unit
The Partnership’s net income is allocated wholly to the common unitholders since the General Partner has a non-economic interest.
Basic income per common unit allocated to common unitholders is calculated by dividing net income allocated to common unitholders by the weighted average number of common units outstanding for the period. Diluted net income per common unit allocated to common unitholders is calculated by dividing net income allocated to common unitholders by the weighted average number of common units outstanding plus the dilutive effect, calculated using the “treasury stock” method for the unvested phantom units. Phantom units are settled for common units upon vesting and are issued in tandem with distribution rights during the vesting period.
Comprehensive Income (Loss)
Comprehensive income (loss) includes all changes in partners’ capital during the period from non-owner sources. To date, accumulated other comprehensive income (loss) is comprised of adjustments to the defined benefit pension plans and the postretirement benefit plan.
Quarterly Distributions of Available Cash
The Partnership’s policy is to distribute all of the cash available for distribution that it generates each quarter. Cash available for distribution for each quarter will be determined by the board of directors (the “Board”) of the General Partner following the end of each quarter. The Partnership expects that cash available for distribution for each quarter will generally be calculated as the cash it generates during the quarter, less cash needed for maintenance capital expenditures not funded by capital proceeds, debt service and other contractual obligations, and any increases in cash reserves for future operating or capital needs that the Board of the General Partner deems necessary or appropriate. Increases or decreases in such reserves may be determined at any time by the Board of the General Partner as it considers, among other things, the cash flows or cash needs expected in approaching periods. The Partnership does not intend to maintain excess distribution coverage for the purpose of maintaining stability or growth in its quarterly distribution, nor does it intend to incur debt to pay quarterly distributions. The Partnership has no legal obligation to pay distributions. Distributions are not required by the Partnership’s partnership agreement and the Partnership’s distribution policy is subject to change at any time at the discretion of the Board of the General Partner. Any distributions made by the Partnership to its unitholders will be done on a pro rata basis.
84
Table of Contents
Related Parties
The Partnership, the General Partner and Rentech have entered into a services agreement, pursuant to which the Partnership and the General Partner obtain certain management and other services from Rentech. Under the services agreement, the Partnership, its subsidiaries and the General Partner are obligated to reimburse Rentech for (i) all costs, excluding share-based compensation, incurred by Rentech or its affiliates in connection with the employment of its employees who are seconded to the Partnership and who provide the Partnership services under the agreement on a full-time basis; (ii) a prorated share of costs, excluding share-based compensation, incurred by Rentech or its affiliates in connection with the employment of its employees, excluding seconded personnel, who provide the Partnership services under the agreement on a part-time basis, with such prorated share determined by Rentech on a commercially reasonable basis, based on the estimated percent of total working time that such personnel are engaged in performing services for the Partnership; (iii) a prorated share of certain administrative costs, in accordance with the agreement, including office costs, services by outside vendors, other general and administrative costs; and (iv) any taxes (other than income taxes, gross receipt taxes and similar taxes) incurred by Rentech or its affiliates for the services provided under the agreement. In accordance with the services agreement, Rentech billed the Partnership $8.6 million for the year ended December 31, 2014, $18.6 million for the year ended December 31, 2013 and $14.1 million for the year ended December 31, 2012.
Recent Accounting Pronouncements
In May 2014, the Financial Accounting Standards Board (the “FASB”) issued guidance that will significantly enhance comparability of revenue recognition practices across entities, industries, jurisdictions, and capital markets. This guidance is effective for fiscal years, and interim periods within those years, beginning after December 15, 2016. Early application is not permitted. The Partnership is evaluating the provisions of this guidance and the potential impact, if any, on its consolidated financial position, results of operations and disclosures.
In June 2014, the FASB issued guidance on accounting for share-based payments when the terms of an award provide that a performance target could be achieved after the requisite service period. This guidance is effective for fiscal years, and interim periods within those years, beginning after December 15, 2015. The Partnership is evaluating the provisions of this guidance and the potential impact, if any, on its consolidated financial position, results of operations and disclosures.
In August 2014, the FASB issued guidance on presentation of financial statements – going concern, which applies to all companies. It requires management to evaluate whether there are conditions or events, considered in the aggregate, that raise substantial doubt about the entity’s ability to continue as a going concern within one year after the date that the financial statements are issued. This guidance is effective for the annual period ending after December 15, 2016, and for annual periods and interim periods thereafter. The Partnership is evaluating the provisions of this guidance and the potential impact, if any, on its consolidated financial position, results of operations and disclosures.
In January 2015, the FASB issued guidance, which eliminates the concept of extraordinary items. This guidance is effective for fiscal years, and interim periods within those fiscal years, beginning after December 15, 2015. The Partnership is evaluating the provisions of this guidance and the potential impact, if any, on its consolidated financial position, results of operations and disclosures.
Note 3 — Agrifos Acquisition
On November 1, 2012, the Company acquired all of the membership interest of Agrifos. The purchase price for Agrifos and its subsidiaries consisted of an initial purchase price of $136.3 million in cash, less working capital adjustments, and $20.0 million in common units representing limited partnership interests in the Partnership (the “Common Units”), which reduced Rentech’s ownership interest in the Partnership at the time from 60.8% to 59.9%, as well as potential earn-out consideration of up to $50.0 million to be paid in Common Units or cash at the Partnership’s option based on the amount by which the two-year Adjusted EBITDA, as defined in the Agrifos Purchase Agreement, of the Pasadena Facility exceeds certain thresholds. We deposited with an escrow agent in several escrow accounts a portion of the initial consideration consisting of an aggregate of $7.25 million in cash, and 323,276 Common Units, to satisfy certain indemnity claims.
In October 2014, RNP reached an agreement to settle all existing and future indemnity claims it may have under the Agrifos Purchase Agreement. The parties agreed to distribute $5.0 million of cash and 59,186 Partnership common units to RNP held in escrow. The remaining $0.9 million of cash and 264,090 Partnership common units held in escrow were released to the Seller. No earn-out consideration was earned. During the year ended December 31, 2014, the Company recognized income from the Agrifos settlement of $5.6 million.
85
Table of Contents
This business combination has been accounted for using the acquisition method of accounting, which requires, among other things, that most assets acquired, liabilities assumed and earn-out consideration be recognized at their fair values as of the acquisition date.
The purchase price consisted of the following (amounts in thousands):
| Cash (through borrowings under a previous credit agreement) less working capital adjustments |
$ | 136,308 | ||
| Fair market value of 538,793 Common Units issued |
20,000 | |||
| Estimate of potential earn-out consideration(1) |
4,920 | |||
|
|
|
|||
| Total purchase price |
$ | 161,228 | ||
|
|
|
| (1) | The amount of earn-out consideration reflected in the table above reflects the Partnership’s estimate, as of November 1, 2012, of the amount of the earn-out consideration it will be required to pay pursuant to the Agrifos Purchase Agreement, as defined in Note 4 – Fair Value. The earn-out consideration will be measured at each reporting date with changes in its fair value recognized in the consolidated statements of operations. As of December 31, 2013, the fair value of the potential earn-out consideration was $0. |
The Partnership’s final purchase price allocation as of November 1, 2012 is as follows (amounts in thousands):
| Cash |
$ | 2,622 | ||
| Accounts receivable |
3,204 | |||
| Inventories |
30,373 | |||
| Prepaid expenses and other current assets |
566 | |||
| Property, plant and equipment |
68,688 | |||
| Construction in progress |
7,011 | |||
| Intangible assets (Technology—$23,680 and Marketing Agreement—$3,088) |
26,768 | |||
| Goodwill |
57,231 | |||
| Other assets |
73 | |||
| Accounts payable |
(10,638 | ) | ||
| Accrued liabilities |
(6,640 | ) | ||
| Customer deposits |
(13,301 | ) | ||
| Asset retirement obligation |
(2,776 | ) | ||
| Other long-term liabilities |
(1,953 | ) | ||
|
|
|
|||
| Total purchase price |
$ | 161,228 | ||
|
|
|
The operations of Agrifos are included in the consolidated statement of operations effective November 1, 2012. During the calendar year ended December 31, 2012, the Partnership recorded revenue and net loss related to Agrifos of approximately $37.4 million and $2.6 million, respectively. Acquisition related costs for this acquisition totaled approximately $4.1 million for the calendar year ended December 31, 2012 and have been included in the consolidated statements of income within selling, general and administrative expense.
Pro Forma Information
The unaudited pro forma information has been prepared as if the Agrifos Acquisition had taken place on January 1, 2012. The unaudited pro forma information is not necessarily indicative of the results that the Partnership would have achieved had the transactions actually taken place on January 1, 2012, and the unaudited pro forma information does not purport to be indicative of future financial operating results.
| For the Calendar Year Ended December 31, 2012 | ||||||||||||
| As Reported | Pro Forma Adjustments |
Pro Forma | ||||||||||
| (in thousands) | ||||||||||||
| Revenues |
$ | 261,635 | $ | 126,484 | $ | 388,119 | ||||||
| Net income |
$ | 107,003 | $ | (1,497 | ) | $ | 105,506 | |||||
| Net income per common unit |
$ | 2.78 | $ | (0.07 | ) | $ | 2.71 | |||||
86
Table of Contents
Note 4 — Fair Value
Fair value is defined as the price that would be received to sell an asset or paid to transfer a liability in an orderly transaction between market participants at the measurement date in a principal or most advantageous market. Fair value is a market-based measurement that is determined based on inputs, which refer broadly to assumptions that market participants use in pricing assets or liabilities. These inputs can be readily observable, market corroborated or generally unobservable inputs. The Partnership makes certain assumptions it believes that market participants would use in pricing assets or liabilities, including assumptions about risk, and the risks inherent in the inputs to valuation techniques. Credit risk of the Partnership and its counterparties is incorporated in the valuation of assets and liabilities. The Partnership believes it uses valuation techniques that maximize the use of observable market-based inputs and minimize the use of unobservable inputs.
Accounting guidance provides for a fair value hierarchy that prioritizes the inputs to valuation techniques used to measure fair value in three broad levels. The fair value hierarchy gives the highest priority to quoted prices (unadjusted) in active markets for identical assets or liabilities (Level 1) and the lowest priority to unobservable inputs (Level 3). In some cases, the inputs used to measure fair value might fall in different levels of the fair value hierarchy. All assets and liabilities are required to be classified in their entirety based on the lowest level of input that is significant to the fair value measurement in its entirety. Assessing the significance of a particular input may require judgment in considering factors specific to the asset or liability, and may affect the valuation of the asset or liability and its placement within the fair value hierarchy. The Partnership classifies fair value balances based on the fair value hierarchy, defined as follows:
| • | Level 1 — Consists of unadjusted quoted prices in active markets for identical assets or liabilities that the Partnership has the ability to access as of the reporting date. |
| • | Level 2 — Consists of inputs other than quoted prices included within Level 1 that are directly observable for the asset or liability or indirectly observable through corroboration with observable market data. |
| • | Level 3 — Consists of unobservable inputs for assets or liabilities whose fair value is estimated based on internally developed models or methodologies using inputs that are generally less readily observable and supported by little, if any, market activity at the measurement date. Unobservable inputs are developed based on the best available information and subject to cost-benefit constraints. |
Fair values of cash, receivables, deposits, other current assets, accounts payable, accrued liabilities and other current liabilities were assumed to approximate carrying value since they are short term and can be settled on demand.
The following table presents the fair value and carrying value of the Partnership’s borrowings as of December 31, 2014.
| Fair Value | Carrying Value | |||||||||||||||
| (in thousands) | ||||||||||||||||
| Level 1 | Level 2 | Level 3 | ||||||||||||||
| Liabilities |
||||||||||||||||
| Notes |
$ | 310,202 | $ | — | $ | — | $ | 320,000 | ||||||||
| GE Credit Agreement |
— | 15,000 | — | 15,000 | ||||||||||||
The following table presents the fair value and carrying value of the Partnership’s borrowings as of December 31, 2013.
| Fair Value | Carrying Value | |||||||||||||||
| (in thousands) | ||||||||||||||||
| Level 1 | Level 2 | Level 3 | ||||||||||||||
| Liabilities |
||||||||||||||||
| Notes |
$ | 318,400 | $ | — | $ | — | $ | 320,000 | ||||||||
Notes
The Notes, as defined in “Note 9 – Debt”, are deemed to be Level 1 financial instruments because there was an active market for such debt. The fair value of such debt was determined based on market prices.
87
Table of Contents
GE Credit Agreement
The GE Credit Agreement, as defined in “Note 9 — Debt”, is deemed to be a Level 2 financial instrument because the measurement is based on observable market data. It is concluded that the carrying value of the GE Credit Agreement approximates the fair value of such loan as of December 31, 2014 based on its floating interest rate and the Company’s assessment that the fixed-rate margin is still at market.
Earn-out Consideration
There was potential additional consideration the Partnership may have been required to pay under the Agrifos Purchase Agreement. The earn-out consideration was deemed to be a Level 3 financial instrument because the measurement is based on unobservable inputs. The fair value of earn-out consideration was determined based on the Partnership’s analysis of various scenarios involving the achievement of certain levels of Adjusted EBITDA, as defined in the Agrifos Purchase Agreement, over a two-year period. The scenarios, which included a weighted probability factor, involved assumptions relating to the market prices of the Partnership’s products and feedstocks, as well as product profitability and production. The earn-out consideration was measured at each reporting date with changes in its fair value recognized in the consolidated statements of income. For the calendar year ended December 31, 2013, the fair value of the liability decreased by approximately $4.9 million. At December 31, 2013, the fair value of the potential earn-out consideration relating to the Agrifos Acquisition was $0. The decrease in fair value was a result of lower than expected profitability in 2013 due primarily to unfavorable weather and increased Chinese exports, as well as a reduced outlook for longer-term profitability due to reduced levels of nitrogen fertilizer prices. Due to an unusually wet spring, there was a shortened planting season which resulted in lower ammonium sulfate revenues during the calendar year ended December 31, 2013. In addition, significant volumes of urea were exported from China and this supply suppressed global urea and other nitrogen fertilizer prices.
The levels within the fair value hierarchy at which the Partnership’s financial instruments have been evaluated have not changed for any of the Partnership’s financial instruments during the years ended December 31, 2014 and 2013.
Note 5 — Derivative Instruments
Forward Natural Gas Contracts
The Partnership uses commodity-based derivatives to minimize its exposure to the fluctuations in natural gas prices. The Partnership recognizes the unrealized gains or losses related to the commodity-based derivative instruments in its consolidated financial statements. The Partnership does not have any master netting agreements or collateral relating to these derivatives.
Our East Dubuque Facility enters into forward natural gas purchase contracts to reduce its exposure to the fluctuations in natural gas prices. The forward natural gas contracts are deemed to be Level 2 financial instruments because the measurement is based on observable market data. The fair value of such contracts had been determined based on market prices. Gain or loss associated with forward gas contracts is recorded in cost of sales on the consolidated statements of operations. The amount of unrealized loss recorded was $4.0 million for the year ended December 31, 2014. These forward natural gas contracts are recorded in accrued liabilities on the consolidated balance sheets.
| Current Liabilities |
||||
| (in thousands) | ||||
| Forward natural gas contracts: |
||||
| Gross amounts recognized |
$ | 3,955 | ||
| Gross amounts offset in consolidated balance sheets |
— | |||
|
|
|
|||
| Net amounts presented in the consolidated balance sheets |
$ | 3,955 | ||
|
|
|
|||
The following table presents the financial instruments that were accounted for at fair value by level as of December 31, 2014.
| Level 1 | Level 2 | Level 3 | ||||||||||
| (in thousands) | ||||||||||||
| Liabilities |
||||||||||||
| Forward gas contracts |
$ | — | $ | 3,955 | $ | — | ||||||
88
Table of Contents
Interest Rate Swaps
In 2012, RNLLC entered into two forward starting interest rate swaps in notional amounts which covered a portion of its outstanding borrowings. The interest rate swaps were deemed to be Level 2 financial instruments because the measurements were based on observable market data. The Partnership used a standard swap contract valuation method to value its interest rate derivatives, and the inputs it used for present value discounting included forward one-month and three-month LIBOR rates, risk-free interest rates and an estimate of credit risk. The change in fair value was recorded in other expense, net on the consolidated statement of operations. The realized loss represents the cash payments required under the interest rate swaps.
Net gain (loss) on interest rate swaps:
| For the Years Ended December 31, |
||||||||
| 2013 | 2012 | |||||||
| (in thousands) | ||||||||
| Realized loss |
$ | (24 | ) | $ | (22 | ) | ||
| Unrealized gain (loss) |
17 | (929 | ) | |||||
|
|
|
|
|
|||||
| Total net loss on interest rate swaps |
$ | (7 | ) | $ | (951 | ) | ||
|
|
|
|
|
|||||
During the year ended December 31, 2013, the Partnership paid $0.9 million to terminate the interest rate swaps as described above.
Note 6 — Inventories
Inventories consisted of the following:
| As of December 31, | ||||||||
| 2014 | 2013 | |||||||
| (in thousands) | ||||||||
| Finished goods |
$ | 24,097 | $ | 26,690 | ||||
| Raw materials |
3,493 | 4,193 | ||||||
| Other |
146 | 219 | ||||||
|
|
|
|
|
|||||
| Total inventory |
$ | 27,736 | $ | 31,102 | ||||
|
|
|
|
|
|||||
During the year ended December 31, 2014, the Partnership wrote down the value of the Pasadena Facility’s ammonium sulfate inventory by $6.0 million to market value. During the year ended December 31, 2013, the Partnership wrote down the value of the Pasadena Facility’s ammonium sulfate, sulfur and sulfuric acid inventory by $12.4 million to market value. The various write-downs were reflected in cost of goods sold for the applicable periods.
Note 7 — Property, Plant and Equipment
Property, plant and equipment consisted of the following:
| As of December 31, | ||||||||
| 2014 | 2013 | |||||||
| (in thousands) | ||||||||
| Land and land improvements |
$ | 23,184 | $ | 22,540 | ||||
| Buildings and building improvements |
29,747 | 27,307 | ||||||
| Machinery and equipment |
290,140 | 246,963 | ||||||
89
Table of Contents
| As of December 31, | ||||||||
| 2014 | 2013 | |||||||
| (in thousands) | ||||||||
| Furniture, fixtures and office equipment |
316 | 258 | ||||||
| Computer equipment and computer software |
3,312 | 3,759 | ||||||
| Vehicles |
186 | 186 | ||||||
| Other |
1,476 | 210 | ||||||
|
|
|
|
|
|||||
| 348,361 | 301,223 | |||||||
| Less: Accumulated depreciation |
(89,350 | ) | (66,864 | ) | ||||
|
|
|
|
|
|||||
| Total property, plant and equipment, net |
$ | 259,011 | $ | 234,359 | ||||
|
|
|
|
|
|||||
The construction in progress balance at December 31, 2014 was $47.8 million, which includes $1.7 million of capitalized interest costs. The construction in progress balance represents primarily the costs associated with the power generation project and the sulfuric acid converter replacement project. The construction in progress balance at December 31, 2013 was $33.5 million, which includes $0.7 million of capitalized interest costs. The construction in progress balance represents primarily the costs associated with the ammonia production and storage capacity expansion project.
Note 8 — Goodwill
A reconciliation of the change in the carrying value of goodwill is as follows (in thousands):
| Balance at December 31, 2012 – Pasadena |
$ | 56,592 | ||
| Increase attributable to Pasadena |
639 | |||
| Goodwill impairment – Pasadena |
(30,029 | ) | ||
|
|
|
|||
| Balance at December 31, 2013 – Pasadena |
$ | 27,202 | ||
| Goodwill impairment – Pasadena |
(27,202 | ) | ||
|
|
|
|||
| Balance at December 31, 2014 |
$ | — | ||
|
|
|
The goodwill resulting from the Agrifos Acquisition is amortizable for tax purposes.
The Partnership tests goodwill assets for impairment annually, or more often if an event or circumstances indicate an impairment may have occurred. Between annual goodwill impairment tests, the Partnership qualitatively assesses whether or not it is necessary to perform the two-step goodwill impairment test for each reporting unit. If based on the results of its qualitative assessment, it is more likely than not that the fair value of the reporting unit exceeds its carrying value, then the two-step goodwill impairment test is not required.
Year Ended December 31, 2014
During the three months ended June 30, 2014, the Partnership wrote down the value of the Pasadena Facility’s ammonium sulfate inventory by $2.8 million to market value. Management considered this inventory impairment, negative gross margin and negative EBITDA in the second quarter of 2014, as well as revised cash flow projections developed during the second quarter of 2014, all taken together, as indicators that a potential impairment of the goodwill related to the Pasadena Facility may have occurred. Factors that affect cash flow include, but are not limited to: product prices; product sales volumes; feedstock prices, labor, maintenance, and other operating costs; required capital expenditures; and plant productivity.
Cash flow projections decreased primarily because of a decline in forecasted product margins. The reduction of prices in the forecast was the result of an evaluation of many factors, including recent deterioration in reported margins. A global decline in nitrogen prices, along with higher exports of ammonium sulfate from China, put downward pressure on ammonium sulfate prices. The additional supplies from China originate from new plants that produce ammonium sulfate as a by-product of manufacturing caprolactam. Current prices for ammonia and sulfur, key inputs for ammonium sulfate, had increased significantly during the second quarter. Global ammonia supplies were tight, supported by production issues in Egypt, Algeria, Trinidad and Qatar, as well as political issues in Libya and Ukraine.
The analysis of the potential impairment of goodwill is a two-step process. Step one of the impairment test consists of comparing the fair value of the reporting unit with the aggregate carrying value, including goodwill. If the carrying value of a reporting unit exceeds the reporting unit’s fair value, step two must be performed to determine the amount, if any, of the goodwill impairment. Step one of the goodwill impairment test involves a high degree of judgment and consists of a comparison of the fair value of a reporting unit with its book value. The fair value of the Pasadena reporting unit was based upon various assumptions and
90
Table of Contents
was based primarily on the discounted cash flows that the business could be expected to generate in the future (the “Income Approach”). The Income Approach valuation method required the Company to make projections of revenue and costs over a multi-year period. Additionally, the Partnership made an estimate of a weighted average cost of capital that a market participant would use as a discount rate. The Partnership also considered other valuation methods including the replacement cost and market approach. Based upon its analysis of the fair value of the Pasadena reporting unit, the Partnership believed it was probable that the Pasadena reporting unit had a carrying value in excess of its fair value at June 30, 2014. The inputs utilized in the analyses were classified as Level 3 inputs within the fair value hierarchy as defined in accounting guidance.
Step two of the goodwill impairment test consists of comparing the implied fair value of the reporting unit’s goodwill against the carrying value of the goodwill. The estimated difference between the fair value of the entire reporting unit as determined in step one and the net fair value of all identifiable assets and liabilities represents the implied fair value of goodwill. The valuation of assets and liabilities in step two is performed only for purposes of assessing goodwill for impairment and the Partnership did not adjust the net book value of the assets and liabilities on its consolidated balance sheets other than goodwill as a result of this process. Completion of step two of the goodwill impairment test indicated no remaining residual value of goodwill and resulted in the Partnership recording an impairment charge of $27.2 million. The goodwill impairment was primarily the result of a decrease in the implied fair value of the Pasadena reporting unit. A deterioration in projected cash flows and an increase in the rate used to discount such cash flows contributed to this decrease. In addition, the implied residual value of goodwill decreased because of an increase in the amount of invested capital at the Pasadena Facility, which primarily was the result of capital expenditures for the power generation project and expenditures to replace the sulfuric acid converter. The Partnership also considered the realizability of long-lived assets and intangible assets at June 30, 2014 and noted that no impairment of such assets was required.
Year Ended December 31, 2013
The inventory impairment (see Note 6 – Inventories), negative gross margin and EBITDA in the calendar year ended December 31, 2013 and revised cash flow projections developed during the calendar year ended December 31, 2013 indicated that an impairment of the goodwill related to the Pasadena Facility was probable.
Ammonium sulfate is the primary product of the Pasadena Facility. Results for the calendar year ended December 31, 2013 and our projections of future cash flow from the production and sale of this product are worse than the results originally projected in late 2012, when the Partnership acquired Agrifos. The expected results and cash flows as of 2012 were utilized to allocate the purchase price of the Agrifos Acquisition, as described in Note 3 – Agrifos Acquisition. The primary cause of the reduction in the estimated fair value of the Pasadena reporting unit is the decline in the cash flow expected to be generated from the sale of ammonium sulfate, compared to the expectations at the time of the acquisition. A major cause of the lower expected cash flows is a decline in the level of prices, and expected prices, for nitrogen fertilizer caused by, among other things, lower corn prices, poor weather conditions for fertilizer application throughout the United States in 2013 and increased supply of urea from China.
Factors that affect cash flows include, but are not limited to, product prices; product transportation costs; product sales volumes; feedstock prices and availability; labor, maintenance, and other operating costs; required capital expenditures, and plant productivity. The Pasadena Facility generated negative EBITDA during the calendar year ended December 31, 2013. EBITDA is currently expected to be positive in 2014, but the current projection is well below the projection at the time of the acquisition, and is based on current and projected levels of prices for the products of, and inputs for, the Pasadena Facility. Current and projected prices for the products and inputs are below the levels at the time of the acquisition, yielding expectations for lower variable dollar margins per ton of product, even though percentage margins are expected to be consistent with those at the time of the acquisition because the prices of ammonium sulfate and its major raw materials have dropped by similar percentages. Lower dollar variable margins provide fewer dollars per ton sold to cover the fixed costs of the facility, resulting in reduced expectations of cash generated by the facility in a lower-price environment. In addition, the Pasadena Facility’s production has been lower than expected due to plant outages, and costs have been higher than expected due to higher maintenance expense.
Based upon its analysis of the value of the Pasadena reporting unit using the Income Approach, the Partnership recorded an estimated impairment to goodwill of $30.0 million during the quarter ended September 30, 2013. During the quarter ended December 31, 2013, the Partnership performed a “step 2” analysis of goodwill and determined no adjustment to the initial goodwill impairment charge was necessary. There are significant assumptions involved in determining a goodwill impairment charge, which includes discount rates, terminal growth rates, future prices of end products and raw materials, terminal values and production volumes. The various valuation methods used (income approach, replacement cost, market approach) are also weighted in determining fair market value. Changes to any of these assumptions could increase or decrease the fair value of the Pasadena reporting unit. At December 31, 2013 the fair value of the Pasadena reporting unit was essentially equal to its carrying value and any adverse change to the critical assumptions used to measure discounted cash flows could result in a diminution in fair value that may result in additional goodwill impairment charges.
91
Table of Contents
Note 9 — Debt
The Partnership’s debt obligations at December 31, 2014 consist of $320.0 million of Notes and $15.0 million in outstanding advances under the GE Credit Agreement, as defined below. The Partnership’s debt obligations at December 31, 2013 consist of $320.0 million of Notes, as defined below. Debt premium, discount and issuance expenses incurred in connection with financing are deferred and amortized on a straight line basis.
Notes Offering
On April 12, 2013, the Partnership and Rentech Nitrogen Finance Corporation, a wholly owned subsidiary of the Partnership (“Finance Corporation” and collectively with the Partnership, the “Issuers”), issued $320.0 million of 6.5% second lien senior secured notes due 2021 (the “Notes”) to qualified institutional buyers and non-United States persons in a private offering exempt from the registration requirements of the Securities Act of 1933, as amended. The Notes bear interest at a rate of 6.5% per year, payable semi-annually in arrears on April 15 and October 15 of each year. The Notes will mature on April 15, 2021, unless repurchased or redeemed earlier in accordance with their terms. The Partnership used part of the net proceeds from the offering to repay in full and terminate a credit agreement entered into in October 2012 (“the 2012 Credit Agreement”) and related interest rate swaps, and used the remaining proceeds to pay for expenditures related to its expansion projects and for general partnership purposes. The payoff of the 2012 Credit Agreement resulted in a loss on debt extinguishment, for the year ended December 31, 2013, of $6.0 million.
The Notes are fully and unconditionally guaranteed, jointly and severally, by each of the Partnership’s existing domestic subsidiaries, other than Finance Corporation. In addition, the Notes and the guarantees thereof are collateralized by a second priority lien on substantially all of the Partnership’s and the guarantors’ assets, subject to permitted liens.
The Issuers may redeem some or all of the Notes at any time prior to April 15, 2016 at a redemption price equal to 100% of the principal amount of the Notes redeemed, plus a “make whole” premium, and accrued and unpaid interest, if any, to the date of redemption. At any time prior to April 15, 2016, the Partnership may also, on any one or more occasions, redeem up to 35% of the aggregate principal amount of the Notes issued with the net proceeds of certain equity offerings at 106.5% of the principal amount of the Notes, plus accrued and unpaid interest, if any, to the date of redemption. On or after April 15, 2016, the Partnership may redeem some or all of the Notes at a premium that will decrease over time, plus accrued and unpaid interest, if any, to the redemption date.
Credit Agreement
On April 12, 2013, the Partnership and Finance Corporation entered into a credit agreement (the “Credit Agreement”). The Credit Agreement consisted of a $35.0 million senior secured revolving credit facility. As of December 31, 2013, the Partnership had no outstanding borrowings under the Credit Agreement. The Credit Agreement was terminated on July 22, 2014 and replaced with the GE Credit Agreement (defined below). The termination of the Credit Agreement resulted in a loss on debt extinguishment of $0.6 million for the year ended December 31, 2014.
GE Credit Agreement
On July 22, 2014, the Partnership replaced the Credit Agreement by entering into a new credit agreement (the “GE Credit Agreement”) by and among the Partnership and Finance Corporation as borrowers (the “GE Borrowers”), certain subsidiaries of the Partnership, as guarantors, General Electric Capital Corporation, for itself as agent for the lenders party thereto, the other financial institutions party thereto, and GE Capital Markets, Inc., as sole lead arranger and bookrunner.
The GE Credit Agreement consists of a $50.0 million senior secured revolving credit facility (the “GE Credit Facility”) with a $10.0 million letter of credit sublimit. At December 31, 2014, a letter of credit had been issued, but not drawn upon, in the amount of $1.8 million. The Partnership expects that the GE Credit Agreement will be used to fund growth projects, working capital needs, letters of credit and for other general partnership purposes.
Borrowings under the GE Credit Agreement bear interest at a rate equal to an applicable margin plus, at the GE Borrowers’ option, either (a) in the case of base rate borrowings, a rate equal to the highest of (1) the prime rate, (2) the federal funds rate plus 0.5% or (3) LIBOR for an interest period of one month plus 1.00% or (b) in the case of LIBOR borrowings, the offered rate per annum for deposits of dollars for the applicable interest period on the day that is two business days prior to the first day of such interest period. The applicable margin for borrowings under the GE Credit Agreement is 2.25% with respect to base rate borrowings and 3.25% with respect to LIBOR borrowings.
The GE Borrowers are required to pay a fee to the lenders under the GE Credit Agreement on the average undrawn available portion of the GE Credit Facility at a rate equal to 0.50% per annum. If letters of credit are issued, the GE Borrowers will also pay a fee to the lenders under the GE Credit Agreement at a rate equal to the product of the average daily undrawn face amount of all letters of credit issued, guaranteed or supported by risk participation agreements multiplied by a per annum rate equal to the applicable margin with respect to LIBOR borrowings. The GE Borrowers are also required to pay customary letter of credit fees on issued letters of credit. In the event the GE Borrowers reduce or terminate the commitments under the GE Credit Facility on or prior to the 18-month anniversary of the closing date, the GE Borrowers shall pay a prepayment fee equal to 1.0% of the amount of the commitment reduction.
92
Table of Contents
The GE Credit Agreement terminates on July 22, 2019. The GE Borrowers may voluntarily prepay their utilization and/or permanently cancel all or part of the available commitments under the GE Credit Agreement in minimum increments of $5.0 million (subject to the prepayment fee described above). Amounts repaid may be reborrowed. Borrowings under the GE Credit Agreement are subject to mandatory prepayment under certain circumstances, with customary exceptions, from the proceeds of permitted dispositions of assets and from certain insurance and condemnation proceeds.
RNLLC, RNPLLC and RNPH guarantee the GE Credit Agreement. The obligations under the GE Credit Agreement and the subsidiary guarantees thereof are secured by the same collateral securing the Notes, which includes substantially all the assets of the Partnership and its subsidiaries. After the occurrence and during the continuation of an event of default, proceeds of any collection, sale, foreclosure or other realization upon any collateral will be applied to repay obligations under the GE Credit Agreement and the subsidiary guarantees thereof to the extent secured by the collateral before any such proceeds are applied to repay obligations under the Notes.
The GE Credit Agreement contains a number of customary representations and warranties, affirmative and negative covenants and events of default. The covenants include, among other things, compliance with environmental laws, limitations on the incurrence of indebtedness and liens, the making of investments, the sale of assets and the making of restricted payments. In the event that, on a pro forma basis, less than 30% of the commitment amount is available for borrowing on any distribution date, then in order to make a distribution on such date (a) the Partnership must maintain a first lien leverage ratio no greater than 1.0 to 1 on a pro forma basis and (b) the sum of (i) the undrawn amount under the GE Credit Facility and (ii) cash maintained by the Partnership and its subsidiaries in collateral deposit accounts must be at least $5 million (after giving effect to the distribution). In addition, before the Partnership can make distributions, there cannot be any default under the GE Credit Agreement. The GE Credit Agreement also contains a requirement that the Partnership maintain a first lien leverage ratio not to exceed 1.0 to 1 at the end of each fiscal quarter where less than 30% of the commitment amount is available for drawing under the GE Credit Facility or a default has occurred and is continuing.
As of December 31, 2014, the Partnership was in compliance with all covenants under the Notes and the GE Credit Agreement.
Debt consists of the following:
| As of December 31, | ||||||||
| 2014 | 2013 | |||||||
| (in thousands) | ||||||||
| Debt |
$ | 335,000 | $ | 320,000 | ||||
| Less: current portion |
— | — | ||||||
|
|
|
|
|
|||||
| Debt, long term portion |
$ | 335,000 | $ | 320,000 | ||||
|
|
|
|
|
|||||
Future maturities of the total debt are as follows (in thousands):
| For the Years Ending December 31, |
||||
| 2015 |
$ | — | ||
| 2016 |
— | |||
| 2017 |
— | |||
| 2018 |
— | |||
| 2019 |
15,000 | |||
| Thereafter |
320,000 | |||
|
|
|
|||
| $ | 335,000 | |||
|
|
|
|||
The entry into the 2012 Credit Agreement and the payoff of the previous credit agreement resulted in a loss on debt extinguishment of approximately $2.1 million for the calendar year ended December 31, 2012.
Note 10 — Commitments and Contingencies
Natural Gas Forward Purchase Contracts
The Partnership’s policy and practice are to enter into fixed-price forward purchase contracts for natural gas in conjunction with contracted nitrogen fertilizer product sales in order to substantially fix gross margin on those product sales contracts. The Partnership may also enter into a limited amount of additional fixed-price forward purchase contracts for natural gas in order to reduce monthly
93
Table of Contents
and seasonal gas price volatility. The Partnership occasionally enters into index-price contracts for the purchase of natural gas. The Partnership has entered into multiple natural gas forward purchase contracts for various delivery dates through June 30, 2015. Commitments for natural gas purchases consist of the following:
| As of December 31, | ||||||||
| 2014 | 2013 | |||||||
| (in thousands, except weighted average rate) | ||||||||
| MMBtus under fixed-price contracts |
3,188 | 2,071 | ||||||
| MMBtus under index-price contracts |
540 | 81 | ||||||
|
|
|
|
|
|||||
| Total MMBtus under contracts |
3,728 | 2,152 | ||||||
|
|
|
|
|
|||||
| Commitments to purchase natural gas |
$ | 15,568 | $ | 8,571 | ||||
| Weighted average rate per MMBtu based on the fixed rates and the indexes applicable to each contract |
$ | 4.18 | $ | 3.98 | ||||
As of December 31, 2014, deposits against these forward gas contracts were $0.9 million. During January and February 2015, the Partnership entered into additional fixed-quantity forward purchase contracts at fixed and indexed prices for various delivery dates through December 31, 2015. The total MMBtus associated with these additional forward purchase contracts are 2.7 million and the total amount of the purchase commitments is $7.7 million, resulting in a weighted average rate per MMBtu of $2.88 in these new commitments. The Partnership is required to make additional prepayments under these forward purchase contracts in the event that market prices fall below the purchase prices in the contracts.
Operating Leases
The Partnership has various operating leases of real and personal property which expire through March 2018. Total lease expense for the year ended December 31, 2014 was $3.5 million, $1.0 million for the year ended December 31, 2013 and $1.1 million for the year ended December 31, 2012.
Future minimum lease payments as of December 31, 2014 are as follows (in thousands):
| For the Years Ending December 31, |
||||
| 2015 |
$ | 3,735 | ||
| 2016 |
3,222 | |||
| 2017 |
978 | |||
| 2018 |
— | |||
| 2019 |
— | |||
|
|
|
|||
| $ | 7,935 | |||
|
|
|
|||
Litigation
The Partnership is party to litigation from time to time in the normal course of business. The Partnership accrues liabilities related to litigation only when it concludes that it is probable that it will incur costs related to such litigation, and can reasonably estimate the amount of such costs. In cases where the Partnership determines that it is not probable, but reasonably possible that it has a material obligation, it discloses such obligations and the possible loss or range of loss, if such estimate can be made. The outcome of the Partnership’s current material litigation matters are not estimable or probable. The Partnership maintains insurance to cover certain actions and believes that resolution of its current litigation matters will not have a material adverse effect on the Partnership’s financial statements.
Regulation
The Partnership’s business is subject to extensive and frequently changing federal, state and local, environmental, health and safety regulations governing a wide range of matters, including the emission of air pollutants, the release of hazardous substances into the environment, the treatment and discharge of waste water and the storage, handling, use and transportation of the Partnership’s fertilizer products, raw materials, and other substances that are part of our operations. These laws include the Clean Air Act (the “CAA”), the federal Water Pollution Control Act, the Resource Conservation and Recovery Act, the Comprehensive Environmental Response, Compensation and Liability Act, the Toxic Substances Control Act, and various other federal, state and local laws and
94
Table of Contents
regulations. The laws and regulations to which the Partnership is subject are complex, change frequently and have tended to become more stringent over time. The ultimate impact on the Partnership’s business of complying with existing laws and regulations is not always clearly known or determinable due in part to the fact that the Partnership’s operations may change over time and certain implementing regulations for laws, such as the CAA, have not yet been finalized, are under governmental or judicial review or are being revised. These laws and regulations could result in increased capital, operating and compliance costs.
The Partnership entered into a settlement agreement with the Illinois Environmental Protection Agency in August 2013 requiring it to connect a device at the East Dubuque Facility to an ammonia safety flare by December 1, 2015. The Partnership estimates the cost of the project required by the settlement agreement as being $0.4 million.
The Partnership is negotiating a settlement agreement with Region 6 of the Environmental Protection Agency relating to an ammonia release that occurred at the Pasadena Facility on April 20, 2014. The Partnership estimates the amount of the penalty required by the settlement agreement to be approximately $0.1 million.
Note 11 — Partners’ Capital and Partnership Distributions
The Partnership had outstanding 219,858 unit-settled phantom units at December 31, 2014 and 193,632 unit-settled phantom units at December 31, 2013. Each phantom unit entitles the holder to payments in amounts equal to the amounts of any distributions made to an outstanding unit by the Partnership. Payments to outstanding phantom units are not subtracted from operating cash flow in the calculation of cash available for distribution, but the payments made to phantom unitholders are recorded as distributions for accounting purposes. For information on the announcement of cash distributions refer to “Note 18 — Subsequent Events”.
The following is a summary of cash distributions paid to common unitholders and holders of phantom units during the years ended December 31, 2014 and 2013 for the respective quarters to which the distributions relate:
| December 31, 2013 |
March 31, 2014 |
June 30, 2014 |
September 30, 2014 |
Total Cash Distributions Paid in 2014 |
||||||||||||||||
| (in thousands, except for per unit amounts) | ||||||||||||||||||||
| Distribution to common unitholders — affiliates |
$ | 1,162 | $ | 1,861 | $ | 3,022 | $ | 1,163 | $ | 7,208 | ||||||||||
| Distribution to common unitholders — non-affiliates |
792 | 1,266 | 2,060 | 789 | 4,907 | |||||||||||||||
|
|
|
|
|
|
|
|
|
|
|
|||||||||||
| Total amount paid |
$ | 1,954 | $ | 3,127 | $ | 5,082 | $ | 1,952 | $ | 12,115 | ||||||||||
|
|
|
|
|
|
|
|
|
|
|
|||||||||||
| Per common unit |
$ | 0.05 | $ | 0.08 | $ | 0.13 | $ | 0.05 | $ | 0.31 | ||||||||||
|
|
|
|
|
|
|
|
|
|
|
|||||||||||
| Common and phantom units outstanding |
39,081 | 39,081 | 39,098 | 39,030 | ||||||||||||||||
|
|
|
|
|
|
|
|
|
|||||||||||||
| December 31, 2012 |
March 31, 2013 |
June 30, 2013 |
September 30, 2013 |
Total Cash Distributions Paid in 2013 |
||||||||||||||||
| (in thousands, except for per unit amounts) | ||||||||||||||||||||
| Distribution to common unitholders — affiliates |
$ | 17,437 | $ | 11,626 | $ | 19,762 | $ | 6,277 | $ | 55,102 | ||||||||||
| Distribution to common unitholders — non-affiliates |
11,809 | 7,873 | 13,393 | 4,254 | 37,329 | |||||||||||||||
|
|
|
|
|
|
|
|
|
|
|
|||||||||||
| Total amount paid |
$ | 29,246 | $ | 19,499 | $ | 33,155 | $ | 10,531 | $ | 92,431 | ||||||||||
|
|
|
|
|
|
|
|
|
|
|
|||||||||||
| Per common unit |
$ | 0.75 | $ | 0.50 | $ | 0.85 | $ | 0.27 | $ | 2.37 | ||||||||||
|
|
|
|
|
|
|
|
|
|
|
|||||||||||
| Common and phantom units outstanding |
38,996 | 38,995 | 39,004 | 39,003 | ||||||||||||||||
|
|
|
|
|
|
|
|
|
|||||||||||||
Shelf Registration Statement
The Partnership and Finance Corporation filed a shelf registration statement with the SEC, which allowed for the offer and sale of up to $500 million in the aggregate of securities comprised of (i) $265.5 million of common units and debt securities to be offered
95
Table of Contents
and sold by the Partnership in primary offerings and (ii) up to 12.5 million common units to be offered and sold by RNHI in secondary offerings. The debt securities may be issued by the Partnership and co-issued by Finance Corporation, and may be guaranteed by one or more of the Partnership’s subsidiaries. Each subsidiary guarantor of the debt securities would be exempt from reporting under the Securities Exchange Act of 1934, as amended (the “Exchange Act”) pursuant to Rule 12h-5 under the Exchange Act. The Partnership has no independent assets or operations, the guarantees of its subsidiary guarantors are joint and several and full and unconditional, subject to customary automatic release provisions. The Partnership’s subsidiaries other than its subsidiary guarantors are minor and there are no significant restrictions on the Partnership’s ability or the ability of any subsidiary guarantor to obtain funds from its subsidiaries.
Note 12 — Long-Term Incentive Equity Awards and Other Equity Based Compensation
The General Partner’s officers, employees and non-employee directors, as well as other key employees of Rentech, the indirect parent of the General Partner, and certain of the Partnership’s other affiliates who make significant contributions to its business, are eligible to receive awards under the Rentech Nitrogen Partners, L.P. 2011 Long-Term Incentive Plan (“LTIP”), thereby linking the recipients’ compensation directly to the Partnership’s performance. The LTIP provides for the grant of unit awards, restricted units, phantom units, unit options, unit appreciation rights, distribution equivalent rights, profits interest units and other unit-based awards. Subject to adjustment in the event of certain transactions or changes in capitalization, 3,825,000 common units may be delivered pursuant to awards under the LTIP.
The accounting guidance requires all share-based payments, including grants of stock options, to be recognized in the statement of operations, based on their fair values. Some grants under the LTIP are marked-to market at each reporting date. Most grants have graded vesting provisions where an equal number of shares vest on each anniversary of the grant date. Rentech and RNP allocate the total compensation cost on a straight-line attribution method over the requisite service period. Equity based compensation expense that the Partnership records is included in selling, general and administrative expense.
During the years ended December 31, 2014, 2013 and 2012, charges associated with all equity-based grants issued by RNP under the LTIP were recorded as follows:
| For the Years Ended December 31, |
||||||||||||
| 2014 | 2013 | 2012 | ||||||||||
| (in thousands) | ||||||||||||
| Unit-based compensation expense |
$ | 1,283 | $ | 1,460 | $ | 2,827 | ||||||
|
|
|
|
|
|
|
|||||||
Phantom unit transactions during the years ended December 31, 2014, 2013 and 2012 are summarized as follows:
| Number of Shares |
Weighted Average Grant Date Fair Value |
Aggregate Intrinsic Value |
||||||||||
| Outstanding at December 31, 2011 |
163,388 | $ | 18.40 | |||||||||
| Granted |
54,059 | 34.86 | ||||||||||
| Vested and Settled in Shares |
(42,350 | ) | (15.68 | ) | ||||||||
| Vested and Surrendered for Withholding Taxes Payable |
(20,040 | ) | (18.40 | ) | ||||||||
| Canceled / Expired |
(119 | ) | (18.40 | ) | ||||||||
|
|
|
|||||||||||
| Outstanding at December 31, 2012 |
154,938 | 23.78 | ||||||||||
| Granted |
116,508 | 18.71 | ||||||||||
| Vested and Settled in Shares |
(49,409 | ) | (23.42 | ) | ||||||||
| Vested and Surrendered for Withholding Taxes Payable |
(27,127 | ) | (21.75 | ) | ||||||||
| Canceled / Expired |
(1,278 | ) | (35.14 | ) | ||||||||
|
|
|
|||||||||||
| Outstanding at December 31, 2013 |
193,632 | 20.97 | ||||||||||
| Granted |
160,088 | 10.93 | ||||||||||
| Vested and Settled in Shares |
(83,471 | ) | (20.68 | ) | ||||||||
| Vested and Surrendered for Withholding Taxes Payable |
(35,342 | ) | (20.91 | ) | ||||||||
| Canceled / Expired |
(15,049 | ) | (24.79 | ) | ||||||||
|
|
|
|||||||||||
| Outstanding at December 31, 2014 |
219,858 | $ | 11.33 | $ | 2,310,711 | |||||||
|
|
|
|||||||||||
96
Table of Contents
During the year ended December 31, 2014, the Partnership issued 160,088 unit-settled phantom units (which entitle the holder to distribution rights during the vesting period) covering the Partnership’s common units. 142,228 of the phantom units are time-vested awards that vest in three equal annual installments. 5,970 of the phantom units were time-vested awards issued to the directors that vested on the one-year anniversary of the grant date. The phantom unit grants resulted in unit-based compensation expense of $1.1 million for the year ended December 31, 2014.
As of December 31, 2014, there was $2.3 million of total unrecognized compensation cost related to non-vested share-based compensation arrangements from previously granted phantom units. That cost is expected to be recognized over a weighted-average period of 2.5 years.
During the year ended December 31, 2014, the Partnership issued a total of 11,890 common units which were fully vested at date of grant. The common units were issued to the directors and resulted in unit-based compensation expense of $0.2 million.
Note 13 — Employee Benefit Plans
Defined Contribution Plan
Salaried employees participate in Rentech’s 401(k) plan while union employees participate in the Partnership’s 401(k) plan. Salaried employees who are at least 18 years of age and have 60 days of service are eligible to participate in Rentech’s plan on the first of the month following 60 days and share in the employer matching contribution. During 2014, Rentech matched 100% of the first 3% and 50% of the next 3% of the Rentech plan participant’s salary deferrals. Participants are fully vested in both matching and any discretionary contributions made to the plan by Rentech. Union employees who are at least 18 years of age and have been employed by RNP for 120 days are eligible to participate in the Partnership’s plan. Union employees at the East Dubuque Facility hired before October 20, 1999 receive a Partnership contribution of 4% of compensation and a Partnership match of 50% of the first 2% of the participant’s salary deferrals. Union employees hired after October 19, 1999 receive a Partnership matching contribution of 100% of the first 2% of the participant’s salary deferrals and then 75% of the next 4% of the participant’s salary deferrals. Participants are fully vested in both matching and any discretionary contributions made to the plan by RNP. The Partnership contributed to the plans $0.8 million for the year ended December 31, 2014, $0.8 million for the year ended December 31, 2013 and $0.5 million for the year ended December 31, 2012.
Pension and Postretirement Benefit Plans
Reporting and disclosures related to pension and other postretirement benefit plans require that companies include an additional asset or liability on the balance sheet to reflect the funded status of retirement and other postretirement benefit plans, and a corresponding after-tax adjustment to accumulated other comprehensive income.
The Partnership has two noncontributory pension plans (the “Pension Plans”), which cover either hourly paid employees represented by collective bargaining agreements in effect at its Pasadena Facility or hourly employees at its Pasadena Facility who have 1,000 hours of service during a year of employment.
The Partnership has a postretirement benefit plan (the “Postretirement Plan”) for certain employees at its Pasadena Facility. The plan provides a fixed dollar amount to supplement payment of eligible medical expenses. The amount of the supplement under the plan is based on years of service and the type of coverage elected (single or family members and spouses). Participants are eligible for supplements at retirement after age 55 with at least 20 years of service to be paid until the attainment of age 65 or another disqualifying event, if earlier.
97
Table of Contents
The following tables summarize the projected benefit obligation, the assets and the funded status of the Pension Plans and the Postretirement Plan at December 31, 2014 and 2013:
| As of December 31, 2014 | As of December 31, 2013 | |||||||||||||||
| Pension | Postretirement | Pension | Postretirement | |||||||||||||
| (in thousands) | ||||||||||||||||
| Projected benefit obligation |
||||||||||||||||
| Benefit obligation at beginning of year |
$ | 4,505 | $ | 853 | $ | 4,841 | $ | 1,136 | ||||||||
| Service cost |
106 | 35 | 137 | 43 | ||||||||||||
| Interest cost |
213 | 37 | 194 | 43 | ||||||||||||
| Amendment |
— | — | — | — | ||||||||||||
| Actuarial (gain) loss |
1,125 | 93 | (528 | ) | (233 | ) | ||||||||||
| Actual benefit paid |
(153 | ) | (91 | ) | (139 | ) | (136 | ) | ||||||||
|
|
|
|
|
|
|
|
|
|||||||||
| Benefit obligation at end of year |
5,796 | 927 | 4,505 | 853 | ||||||||||||
|
|
|
|
|
|
|
|
|
|||||||||
| Fair value of plan assets |
||||||||||||||||
| Fair value of plan assets at beginning of year |
4,927 | — | 4,333 | — | ||||||||||||
| Actual return on plan assets |
251 | — | 624 | — | ||||||||||||
| Employer contributions |
— | 91 | 109 | 136 | ||||||||||||
| Actual benefit paid |
(153 | ) | (91 | ) | (139 | ) | (136 | ) | ||||||||
|
|
|
|
|
|
|
|
|
|||||||||
| Fair value of plan assets at end of year |
5,025 | — | 4,927 | — | ||||||||||||
|
|
|
|
|
|
|
|
|
|||||||||
| Funded status at end of year |
$ | (771 | ) | $ | (927 | ) | $ | 422 | $ | (853 | ) | |||||
|
|
|
|
|
|
|
|
|
|||||||||
| Amounts recognized in the consolidated balance sheet |
||||||||||||||||
| Noncurrent assets |
$ | — | $ | — | $ | 422 | $ | — | ||||||||
| Current liabilities |
— | (81 | ) | — | (86 | ) | ||||||||||
| Noncurrent liabilities |
(771 | ) | (846 | ) | — | (767 | ) | |||||||||
|
|
|
|
|
|
|
|
|
|||||||||
| $ | (771 | ) | $ | (927 | ) | $ | 422 | $ | (853 | ) | ||||||
|
|
|
|
|
|
|
|
|
|||||||||
As of December 31, 2014 and 2013, the accumulated benefit obligation equaled the projected benefit obligation.
The components of net periodic benefit cost and other changes in plan assets and benefit obligations recognized in other comprehensive income are as follows for the years ended December 31, 2014, 2013 and 2012:
| For the Year Ended December 31, 2014 |
For the Year Ended December 31, 2013 |
For the Year Ended December 31, 2012 |
||||||||||||||||||||||
| Pension | Postretirement | Pension | Postretirement | Pension | Postretirement | |||||||||||||||||||
| (in thousands) | ||||||||||||||||||||||||
| Net periodic benefit cost |
||||||||||||||||||||||||
| Service cost |
$ | 107 | $ | 35 | $ | 137 | $ | 43 | $ | 29 | $ | 4 | ||||||||||||
| Interest cost |
213 | 37 | 194 | 43 | 31 | 5 | ||||||||||||||||||
| Expected return on plan assets |
(290 | ) | — | (260 | ) | — | (42 | ) | — | |||||||||||||||
| Amortization of prior service cost |
— | 22 | — | 22 | — | — | ||||||||||||||||||
| Amortization of net gain |
(54 | ) | — | (5 | ) | — | — | — | ||||||||||||||||
| Recognized gain |
— | (16 | ) | — | — | — | — | |||||||||||||||||
|
|
|
|
|
|
|
|
|
|
|
|
|
|||||||||||||
| Net periodic pension costs |
$ | (24 | ) | $ | 78 | $ | 66 | $ | 108 | $ | 18 | $ | 9 | |||||||||||
|
|
|
|
|
|
|
|
|
|
|
|
|
|||||||||||||
| Other changes in plan assets and benefit obligations recognized in other comprehensive income |
||||||||||||||||||||||||
| Net actuarial (gain) loss |
$ | 1,163 | $ | 93 | $ | (893 | ) | $ | (233 | ) | $ | (444 | ) | $ | (54 | ) | ||||||||
| Recognized actuarial gain |
54 | 16 | 5 | — | — | — | ||||||||||||||||||
| Prior service cost |
— | — | — | — | — | 332 | ||||||||||||||||||
| Recognized prior service cost |
— | (22 | ) | — | (22 | ) | — | — | ||||||||||||||||
|
|
|
|
|
|
|
|
|
|
|
|
|
|||||||||||||
| Total recognized in other comprehensive (income) loss |
$ | 1,217 | $ | 87 | $ | (888 | ) | $ | (255 | ) | $ | (444 | ) | $ | 278 | |||||||||
|
|
|
|
|
|
|
|
|
|
|
|
|
|||||||||||||
98
Table of Contents
Accumulated other comprehensive income (loss) at December 31, 2014, 2013 and 2012 consists of the following amounts that have not yet been recognized in net periodic benefit cost:
| As of December 31, 2014 | As of December 31, 2013 | As of December 31, 2012 | ||||||||||||||||||||||
| Pension | Postretirement | Pension | Postretirement | Pension | Postretirement | |||||||||||||||||||
| (in thousands) | ||||||||||||||||||||||||
| Net gain |
$ | (114 | ) | $ | (178 | ) | $ | (1,332 | ) | $ | (287 | ) | $ | (444 | ) | $ | (54 | ) | ||||||
| Prior service cost |
— | 287 | — | 310 | — | 332 | ||||||||||||||||||
|
|
|
|
|
|
|
|
|
|
|
|
|
|||||||||||||
| $ | (114 | ) | $ | 109 | $ | (1,332 | ) | $ | 23 | $ | (444 | ) | $ | 278 | ||||||||||
|
|
|
|
|
|
|
|
|
|
|
|
|
|||||||||||||
The expected portion of the accumulated other comprehensive loss expected to be recognized as a component of net periodic benefit cost in 2015 is $0 for the Pension Plans and $16,000 for the Postretirement Plan.
Weighted average assumptions used to determine benefit obligations:
| As of December 31, 2014 | As of December 31, 2013 | As of December 31, 2012 | ||||||||||||||||||||||
| Pension | Postretirement | Pension | Postretirement | Pension | Postretirement | |||||||||||||||||||
| Discount rate |
4.0 | % | 3.9 | % | 4.8 | % | 4.7 | % | 4.1 | % | 4.0 | % | ||||||||||||
Weighted average assumptions used to determine net pension cost:
| For the Year Ended December 31, 2014 |
For the Year Ended December 31, 2013 |
For the Year Ended December 31, 2012 |
||||||||||||||||||||||
| Pension | Postretirement | Pension | Postretirement | Pension | Postretirement | |||||||||||||||||||
| Discount rate |
4.8 | % | 4.7 | % | 4.1 | % | 4.0 | % | 3.6 | % | 3.6 | % | ||||||||||||
| Expected rate of return on assets |
6.0 | % | N/A | 6.0 | % | N/A | 6.0 | % | N/A | |||||||||||||||
Determination of the Expected Long-Term Rate of Return on Assets
The overall expected long-term rate of return on assets assumption is based on the long-term target asset allocation for plan assets and capital markets return forecasts for asset classes employed. A portion of the asset returns are subject to taxation, so the expected long-term rate of return for these assets is determined on an after-tax basis. The GAAP gain/loss methodology provides that differences between expected and actual returns are recognized over the average future service of employees.
| Postretirement As of December 31, |
||||||||||||
| 2014 | 2013 | 2012 | ||||||||||
| Health care cost trend: initial |
9.00 | % | 7.25 | % | 7.50 | % | ||||||
| Health care cost trend: ultimate |
5.00 | % | 5.00 | % | 5.00 | % | ||||||
| Year ultimate reached |
2025 | 2023 | 2023 | |||||||||
As the Postretirement Plan provides a fixed dollar amount to participants, increasing or decreasing the health care cost trend rate by 1% would not have a material impact on the December 31, 2014 and 2013 obligations.
99
Table of Contents
| As of December 31, 2014 | As of December 31, 2013 | |||||||||||||||
| Target Allocation |
Percentage of Pension Plan Assets 2014 |
Target Allocation |
Percentage of Pension Plan Assets 2013 |
|||||||||||||
| Asset Category |
||||||||||||||||
| Equity securities |
50 | % | 52 | % | 50 | % | 52 | % | ||||||||
| Debt securities |
50 | % | 48 | % | 50 | % | 48 | % | ||||||||
The goals of the Pension Plans’ asset investment strategy are to:
| 1) | Provide benefits to the participants and their beneficiaries and defray the reasonable expenses of administering the Pension Plans. |
| 2) | Contribute the amounts necessary to maintain the Pension Plans on a sound actuarial basis and to satisfy the minimum funding standards established by law. |
| 3) | Invest without distinction between principal and income and in such securities or property, real or personal, wherever situated, including, but not limited to, stocks, common or preferred, bonds and other evidence of indebtedness or ownership, and real estate or any interest therein, taking into consideration the short and long-term financial needs of the Pension Plans. |
The Pension Plans seek to maintain compliance with the Employee Retirement Income Security Act of 1974, as amended, and any applicable regulations and laws.
The pension plan assets are deemed to be Level 2 financial instruments at December 31, 2014 and Level 1 at December 31, 2013. The fair value of such assets had been determined based on market prices. The fair value of the pension plan assets consist of the following at December 31, 2014 and 2013 (in thousands):
| As of December 31, | ||||||||
| In thousands |
2014 | 2013 | ||||||
| Mutual funds — equity |
$ | 2,671 | $ | 2,560 | ||||
| Mutual funds — fixed income |
2,151 | 2,356 | ||||||
| Other |
203 | 11 | ||||||
|
|
|
|
|
|||||
| Fair value of plan assets |
$ | 5,025 | $ | 4,927 | ||||
|
|
|
|
|
|||||
The Partnership expects to contribute $0 to the Pension Plans and $83,000 to the Postretirement Plan, in 2015.
Expected Future Benefit Payments:
| Pension | Postretirement | |||||||
| (in thousands) | ||||||||
| 2015 |
$ | 209 | $ | 83 | ||||
| 2016 |
214 | 65 | ||||||
| 2017 |
226 | 74 | ||||||
| 2018 |
232 | 69 | ||||||
| 2019 |
238 | 53 | ||||||
| 2020-2024 |
1,297 | 240 | ||||||
Note 14 — Income Taxes
For the year ended December 31, 2014, the Partnership recorded a state income tax expense of $0.02 million on income attributable to the Partnership, most of which is attributable to Texas Margin Tax due to the Texas Comptroller.
For the year ended December 31, 2013, the Partnership recorded a state income tax benefit of $0.1 million on income attributable to the Partnership, $0.2 million of which is attributable to replacement tax for the Illinois Department of Revenue partially offset by $0.1 million of tax expense attributable to Texas Margin Tax due to the Texas Comptroller.
For the year ended December 31, 2012, the Partnership recorded a state income tax provision of $0.3 million on income attributable to the Partnership, $800 of which is attributable to annual minimum franchise tax due to California Franchise Tax Board, $0.3 million is attributable to replacement tax due to Illinois Department of Revenue and $45,000 is attributable to Texas Margin Tax due to the Texas Comptroller.
100
Table of Contents
Note 15 — Segment Information
The Partnership operates in two business segments, as described below. The Pasadena Facility’s operations are only included in our historical operating results from the closing date of the Agrifos Acquisition, which was November 1, 2012.
| • | East Dubuque – The operations of the East Dubuque Facility, which produces primarily ammonia and UAN. |
| • | Pasadena – The operations of the Pasadena Facility, which produces primarily ammonium sulfate. |
The Partnership’s reportable operating segments have been determined in accordance with the Partnership’s internal management structure, which is organized based on operating activities. The Partnership evaluates performance based upon several factors, of which the primary financial measure is segment-operating income (loss).
| For the Years Ended December 31, |
||||||||||||
| 2014 | 2013 | 2012 | ||||||||||
| (in thousands) | ||||||||||||
| Revenues: |
||||||||||||
| East Dubuque |
$ | 196,379 | $ | 177,700 | $ | 224,205 | ||||||
| Pasadena |
138,233 | 133,675 | 37,430 | |||||||||
|
|
|
|
|
|
|
|||||||
| Total revenues |
$ | 334,612 | $ | 311,375 | $ | 261,635 | ||||||
|
|
|
|
|
|
|
|||||||
| Gross profit (loss): |
||||||||||||
| East Dubuque |
$ | 74,785 | $ | 80,883 | $ | 133,543 | ||||||
| Pasadena |
(14,308 | ) | (9,529 | ) | (1,704 | ) | ||||||
|
|
|
|
|
|
|
|||||||
| Total gross profit |
$ | 60,477 | $ | 71,354 | $ | 131,839 | ||||||
|
|
|
|
|
|
|
|||||||
| Selling, general and administrative expenses: |
||||||||||||
| East Dubuque |
$ | 4,165 | $ | 4,576 | $ | 6,242 | ||||||
| Pasadena |
5,078 | 4,764 | 361 | |||||||||
|
|
|
|
|
|
|
|||||||
| Total segment selling, general and administrative expenses |
$ | 9,243 | $ | 9,340 | $ | 6,603 | ||||||
|
|
|
|
|
|
|
|||||||
| Depreciation and amortization: |
||||||||||||
| East Dubuque |
$ | 194 | $ | 191 | $ | 807 | ||||||
| Pasadena |
1,315 | 3,886 | 583 | |||||||||
|
|
|
|
|
|
|
|||||||
| Total segment depreciation and amortization recorded in operating expenses |
1,509 | 4,077 | 1,390 | |||||||||
|
|
|
|
|
|
|
|||||||
| East Dubuque |
15,718 | 9,048 | 10,690 | |||||||||
| Pasadena |
7,030 | 4,187 | 380 | |||||||||
|
|
|
|
|
|
|
|||||||
| Total depreciation and amortization recorded in cost of sales |
22,748 | 13,235 | 11,070 | |||||||||
|
|
|
|
|
|
|
|||||||
| Total segment depreciation and amortization |
$ | 24,257 | $ | 17,312 | $ | 12,460 | ||||||
|
|
|
|
|
|
|
|||||||
| Other operating expenses: |
||||||||||||
| East Dubuque |
$ | 537 | $ | 806 | $ | 510 | ||||||
| Pasadena |
27,207 | 30,029 | — | |||||||||
|
|
|
|
|
|
|
|||||||
| Total segment other operating expenses |
$ | 27,744 | $ | 30,835 | $ | 510 | ||||||
|
|
|
|
|
|
|
|||||||
| Operating income (loss): |
||||||||||||
| East Dubuque |
$ | 69,888 | $ | 75,310 | $ | 125,984 | ||||||
| Pasadena |
(47,907 | ) | (48,208 | ) | (2,648 | ) | ||||||
|
|
|
|
|
|
|
|||||||
| Total segment operating income |
$ | 21,981 | $ | 27,102 | $ | 123,336 | ||||||
|
|
|
|
|
|
|
|||||||
| Interest expense: |
||||||||||||
| East Dubuque |
$ | 85 | $ | — | $ | 194 | ||||||
| Pasadena |
— | 8 | — | |||||||||
|
|
|
|
|
|
|
|||||||
| Total segment interest expense |
$ | 85 | $ | 8 | $ | 194 | ||||||
|
|
|
|
|
|
|
|||||||
| Net income (loss): |
||||||||||||
| East Dubuque |
$ | 69,803 | $ | 75,244 | $ | 123,721 | ||||||
| Pasadena |
(47,925 | ) | (48,357 | ) | (2,648 | ) | ||||||
|
|
|
|
|
|
|
|||||||
| Total segment net income |
$ | 21,878 | $ | 26,887 | $ | 121,073 | ||||||
|
|
|
|
|
|
|
|||||||
101
Table of Contents
| For the Years Ended December 31, |
||||||||||||
| 2014 | 2013 | 2012 | ||||||||||
| (in thousands) | ||||||||||||
| Reconciliation of segment net income to consolidated net income (loss): |
||||||||||||
| Segment net income |
$ | 21,878 | $ | 26,887 | $ | 121,073 | ||||||
| Partnership and unallocated expenses recorded as selling, general and administrative expenses |
(8,768 | ) | (7,945 | ) | (11,773 | ) | ||||||
| Partnership and unallocated income (expenses) recorded as other income (expense) |
4,800 | (1,081 | ) | 232 | ||||||||
| Unallocated interest expense and loss on interest rate swaps |
(18,972 | ) | (14,096 | ) | (2,226 | ) | ||||||
| Income tax benefit (expense) |
— | 303 | (303 | ) | ||||||||
|
|
|
|
|
|
|
|||||||
| Consolidated net income (loss) |
$ | (1,062 | ) | $ | 4,068 | $ | 107,003 | |||||
|
|
|
|
|
|
|
|||||||
| As of December 31, 2014 |
As of December 31, 2013 |
|||||||
| (in thousands) | ||||||||
| Total assets |
||||||||
| East Dubuque |
$ | 186,508 | $ | 175,430 | ||||
| Pasadena |
193,737 | 188,836 | ||||||
|
|
|
|
|
|||||
| Total segment assets |
$ | 380,245 | $ | 364,266 | ||||
|
|
|
|
|
|||||
| Reconciliation of segment total assets to consolidated total assets: |
||||||||
| Segment total assets |
$ | 380,245 | $ | 364,266 | ||||
| Partnership and other |
34,071 | 42,078 | ||||||
|
|
|
|
|
|||||
| Consolidated total assets |
$ | 414,316 | $ | 406,344 | ||||
|
|
|
|
|
|||||
| For the Years Ended December 31, |
||||||||||||
| 2014 | 2013 | 2012 | ||||||||||
| (in thousands) | ||||||||||||
| Capital expenditures |
||||||||||||
| East Dubuque |
$ | 24,872 | $ | 57,981 | $ | 56,050 | ||||||
| Pasadena |
46,791 | 32,307 | 1,521 | |||||||||
| Partnership and other |
— | — | — | |||||||||
|
|
|
|
|
|
|
|||||||
| Total capital expenditures |
$ | 71,663 | $ | 90,288 | $ | 57,571 | ||||||
|
|
|
|
|
|
|
|||||||
Note 16 — Net Income (Loss) Per Common Unit
The following table sets forth the computation of basic and diluted net income per common unit.
| For the Years Ended December 31, |
||||||||||||
| 2014 | 2013 | 2012 | ||||||||||
| (in thousands, except for per unit data) | ||||||||||||
| Numerator: |
||||||||||||
| Net income (loss) |
$ | (1,062 | ) | $ | 4,068 | $ | 107,003 | |||||
| Less: Income (loss) allocated to unvested units |
(60 | ) | 366 | 491 | ||||||||
|
|
|
|
|
|
|
|||||||
| Net income (loss) allocated to common unitholders |
$ | (1,122 | ) | $ | 3,702 | $ | 106,512 | |||||
|
|
|
|
|
|
|
|||||||
102
Table of Contents
| For the Years Ended December 31, |
||||||||||||
| 2014 | 2013 | 2012 | ||||||||||
| (in thousands, except for per unit data) | ||||||||||||
| Denominator: |
||||||||||||
| Weighted average common units outstanding |
38,898 | 38,850 | 38,350 | |||||||||
| Effect of dilutive units: |
||||||||||||
| Phantom Units |
— | 95 | 2 | |||||||||
|
|
|
|
|
|
|
|||||||
| Diluted units outstanding |
38,898 | 38,945 | 38,352 | |||||||||
|
|
|
|
|
|
|
|||||||
| Basic net income (loss) per common unit |
$ | (0.03 | ) | $ | 0.10 | $ | 2.78 | |||||
|
|
|
|
|
|
|
|||||||
| Diluted net income (loss) per common unit |
$ | (0.03 | ) | $ | 0.10 | $ | 2.78 | |||||
|
|
|
|
|
|
|
|||||||
For the years ended December 31, 2014, 2013 and 2012, 220,000, zero and 149,000 phantom units, respectively, were excluded from the calculation of diluted net income (loss) per common unit because their inclusion would have been anti-dilutive.
Note 17 — Selected Quarterly Financial Data (Unaudited)
Selected unaudited condensed financial information for the years ended December 31, 2014 and 2013 is presented in the tables below (in thousands, except per share data).
| First Quarter |
Second Quarter |
Third Quarter |
Fourth Quarter |
|||||||||||||
| For the 2014 Year |
||||||||||||||||
| Revenues |
$ | 56,280 | $ | 113,609 | $ | 84,163 | $ | 80,560 | ||||||||
| Gross profit |
$ | 13,764 | $ | 28,219 | $ | 6,688 | $ | 11,806 | ||||||||
| Operating income (loss) |
$ | 8,159 | $ | (4,090 | ) | $ | 2,181 | $ | 6,963 | |||||||
| Income (loss) before income taxes |
$ | 3,155 | $ | (8,899 | ) | $ | (3,078 | ) | $ | 7,778 | ||||||
| Net income (loss) |
$ | 3,125 | $ | (8,924 | ) | $ | (3,105 | ) | $ | 7,842 | ||||||
| Net income (loss) per common unit—Basic |
$ | 0.08 | $ | (0.23 | ) | $ | (0.08 | ) | $ | 0.20 | ||||||
| Net income (loss) per common unit—Diluted |
$ | 0.08 | $ | (0.23 | ) | $ | (0.08 | ) | $ | 0.20 | ||||||
| For the 2013 Year |
||||||||||||||||
| Revenues |
$ | 59,564 | $ | 103,956 | $ | 93,279 | $ | 54,576 | ||||||||
| Gross profit (loss) |
$ | 22,719 | $ | 39,848 | $ | 16,820 | $ | (8,033 | ) | |||||||
| Operating income (loss) |
$ | 17,015 | $ | 34,046 | $ | (18,335 | ) | $ | (13,569 | ) | ||||||
| Income (loss) before income taxes |
$ | 15,089 | $ | 28,846 | $ | (22,022 | ) | $ | (17,941 | ) | ||||||
| Net income (loss) |
$ | 15,009 | $ | 28,721 | $ | (22,255 | ) | $ | (17,407 | ) | ||||||
| Net income (loss) per common unit—Basic |
$ | 0.38 | $ | 0.74 | $ | (0.57 | ) | $ | (0.45 | ) | ||||||
| Net income (loss) per common unit—Diluted |
$ | 0.38 | $ | 0.74 | $ | (0.57 | ) | $ | (0.45 | ) | ||||||
The income before income taxes during the three months ended December 31, 2014 was primarily attributable to (i) higher sales prices for ammonia, UAN and ammonium sulfate; and (ii) the Agrifos settlement income of $5.6 million, partially offset by (a) a loss on gas derivatives of $3.1 million; and (b) write-down of inventory of $1.5 million.
The gross loss during the three months ended December 31, 2013 was primarily attributable to (i) turnaround expenses at the East Dubuque Facility of $7.8 million and the Pasadena Facility of $1.7 million; (ii) a write-down of the Pasadena Facility’s inventory of $5.1 million; (iii) fixed operating costs while the East Dubuque Facility was idle of $4.2 million; and (iv) the $1.0 million insurance deductible for the fire which occurred in November 2013 at the East Dubuque Facility.
103
Table of Contents
Note 18 — Subsequent Events
Distributions
On February 12, 2015, the Partnership announced a cash distribution to its common unitholders for the period October 1, 2014 through and including December 31, 2014 of $0.30 per common unit which resulted in total distributions in the amount of $11.7 million, including payments to phantom unitholders. The cash distribution was paid on February 27, 2015 to unitholders of record at the close of business on February 23, 2015.
Exploring Strategic Alternatives
On February 17, 2015, RNP announced that its board has initiated a process to explore and evaluate potential strategic alternatives for the Partnership, which may include a sale of the Partnership, a merger with another party, a sale of some or all of its assets, or another strategic transaction. RNP has retained a financial advisor to assist with the strategic review process. There can be no assurance that this strategic review process will result in a transaction. As of December 31, 2014, the assets did not qualify as “held for sale”.
104
Table of Contents
ITEM 9. CHANGES IN AND DISAGREEMENTS WITH ACCOUNTANTS ON ACCOUNTING AND FINANCIAL DISCLOSURE
None.
ITEM 9A. CONTROLS AND PROCEDURES
Evaluation of Disclosure Controls and Procedures
We maintain disclosure controls and procedures, or DCP, that are designed to ensure that information required to be disclosed by us in reports that we file or submit under the Securities Exchange Act of 1934, as amended, or the Exchange Act, is recorded, processed, summarized and reported within the time periods specified in the SEC’s rules and forms, and that such information is accumulated and communicated to our management, including our general partners’ principal executive officer, or Chief Executive Officer, and principal financial officer, or Chief Financial Officer, as appropriate, to allow for timely decisions regarding required disclosure. In designing and evaluating DCP, management recognizes that any controls and procedures, no matter how well designed and operated, can provide only reasonable assurance of achieving the desired control objectives. Management is required to apply its judgment in evaluating the cost-benefit relationship of possible controls and procedures.
The Partnership, under the supervision and with the participation of the Partnership’s management, including the Partnership’s Chief Executive Officer and Chief Financial Officer, evaluated the effectiveness of the design and operation of the Partnership’s DCP as of the end of the period covered by this report. As we previously reported in 2014, management identified material weaknesses in internal control over financial reporting, or ICFR, as described below. Based on their evaluation, our Chief Executive Officer and Chief Financial Officer concluded that our DCP were not effective as of December 31, 2014.
Management’s Annual Report on Internal Control Over Financial Reporting
Management is responsible for establishing and maintaining adequate ICFR (as defined in Rule 13a-15(f) of the Exchange Act). Our ICFR is designed to provide reasonable assurance regarding the reliability of financial reporting and the preparation of financial statements for external purposes in accordance with generally accepted accounting principles. Our ICFR includes policies and procedures that pertain to the maintenance of records that, in reasonable detail, accurately and fairly reflect the transactions and dispositions of our assets; provide reasonable assurance that transactions are recorded as necessary to permit preparation of financial statements in accordance with generally accepted accounting principles, and that receipts and expenditures are being made only in accordance with authorizations of our management and directors; and provide reasonable assurance regarding prevention or timely detection of unauthorized acquisition, use or disposition of our assets that could have a material effect on our financial statements. Because of its inherent limitations, ICFR may not prevent or detect misstatements. Also, projections of any evaluation of effectiveness to future periods are subject to the risk that controls may become inadequate because of changes in conditions or that the degree of compliance with the policies and procedures may deteriorate. However, these inherent limitations are known features of the financial reporting process, and it is possible to design into the process safeguards to reduce, though not eliminate, the risk.
Management, with the participation of our Chief Executive Officer and Chief Financial Officer, conducted an evaluation of the effectiveness of our ICFR as of December 31, 2014. Management based its assessment on criteria established in Internal Control-Integrated Framework (2013) issued by the Committee of Sponsoring Organizations of the Treadway Commission, or COSO.
As we previously reported in 2014, we identified the following material weaknesses that continue to exist as of December 31, 2014. A material weakness is a deficiency, or combination of deficiencies, in ICFR, such that there is a reasonable possibility that a material misstatement of the annual or interim financial statements will not be prevented or detected on a timely basis.
We did not design and maintain effective internal controls over (i) the review of the cash flow forecasts used in the accounting for long-lived asset recoverability and goodwill impairment, (ii) the determination of the goodwill impairment charge in accordance with generally accepted accounting principles, and (iii) maintaining documentation supporting management’s review of events and changes in circumstances that indicate it is more likely than not that a goodwill impairment has occurred between annual impairment tests. Specifically, with respect to (i) and (ii), we did not design and maintain effective internal controls related to determining the fair value of reporting units for the purpose of performing goodwill impairment testing and documenting management’s review of assumptions used in our cash flow forecasts for long-lived asset recoverability and goodwill impairment.
These control deficiencies did not result in a material misstatement to our consolidated financial statements for the year ended December 31, 2014. However, these control deficiencies, if unremediated, could, in another reporting period, result in a material misstatement to the annual or interim consolidated financial statements that would not be prevented or detected by the controls. Accordingly, our management has determined that these control deficiencies constitute material weaknesses.
As a result of the material weaknesses described above, management concluded we did not maintain effective ICFR as of December 31, 2014 based on the criteria in Internal Control – Integrated Framework (2013) issued by COSO.
105
Table of Contents
The effectiveness of our internal control over financial reporting as of December 31, 2014 has been audited by PricewaterhouseCoopers LLP, an independent registered public accounting firm, as stated in their report which appears herein.
Plan for Remediation of the Material Weaknesses
We have implemented and are continuing to implement a number of measures to address the material weaknesses identified. Specifically, we are designing additional controls over documentation and review of the inputs and results of our cash flow forecasts and the identification of events and changes in circumstances that may indicate potential impairment of goodwill. These controls are expected to include the implementation of additional review activities by qualified personnel and additional documentation and support of conclusions with regard to accounting for long-lived asset recoverability and goodwill impairment. We are also designing additional controls around identification and documentation relating to accounting for goodwill impairment. These controls are expected to include the implementation of additional review activities by qualified personnel, additional documentation and the development and use of checklists and procedures related to accounting for long-lived asset recoverability and goodwill impairment. We are in the process of implementing our remediation plan, and expect the control weaknesses to be remediated in the coming reporting periods. However, we are unable at this time to estimate when the remediation will be completed.
The process of designing and implementing an effective financial reporting system is a continuous effort that requires us to anticipate and react to changes in our business and the economic and regulatory environments and to expend significant resources to maintain a financial reporting system that is adequate to satisfy our reporting obligations. As we continue to evaluate and take actions to improve our ICFR, we may determine to take additional actions to address control deficiencies or determine to modify certain of the remediation measures described above. We cannot assure you that the measures we have taken to date, or any measures we may take in the future, will be sufficient to remediate the material weaknesses we have identified or avoid potential future material weaknesses.
Changes in Internal Control over Financial Reporting
There were changes in our ICFR during the quarter ended December 31, 2014 that materially affected, or are reasonably likely to materially affect, our ICFR. During the fourth quarter of 2014, we designed and implemented additional controls to reconcile our financial forecasts to third party expert reports and to reconcile the carrying value of reporting units to appropriate support.
There is no information required to be disclosed in a report on Form 8-K during the three months ended December 31, 2014 that has not previously been reported.
ITEM 10. DIRECTORS, EXECUTIVE OFFICERS AND CORPORATE GOVERNANCE
Management of Rentech Nitrogen Partners, L.P.
Our general partner, Rentech Nitrogen GP, LLC, manages our operations and activities subject to the terms and conditions specified in our partnership agreement. Our general partner is owned by RNHI, an indirect wholly owned subsidiary of Rentech. The operations of our general partner in its capacity as general partner are managed by its board of directors. Actions by our general partner that are made in its individual capacity or in its sole discretion will be made by RNHI as the sole member of our general partner and not by the board of directors of our general partner. Our general partner is not elected by our unitholders. The officers of our general partner manage the day-to-day affairs of our business.
Whenever our general partner makes a determination or takes or declines to take an action in its individual, rather than representative, capacity, it is entitled to make such determination or to take or decline to take such other action free of any fiduciary duty or obligation whatsoever to us, any limited partner or assignee, and it is not required to act in good faith or pursuant to any other standard imposed by our partnership agreement or under Delaware law or any other law. Examples include the exercise of its call right or its registration rights, its voting rights with respect to the units it owns and its determination whether or not to consent to any merger or consolidation of the Partnership.
Limited partners are not entitled to elect the directors of our general partner or directly or indirectly participate in our management or operation. Our partnership agreement contains various provisions which replace default fiduciary duties with contractual governance standards. Our general partner is liable, as a general partner, for all of our debts (to the extent not paid from our assets), except for indebtedness or other obligations that are made expressly non-recourse to it. Our general partner therefore may cause us to incur indebtedness or other obligations that are non-recourse to it. Our GE Credit Agreement and Notes are non-recourse to our general partner.
106
Table of Contents
As a publicly traded limited partnership, we qualify for certain exemptions from the New York Stock Exchange’s corporate governance requirements, including:
| • | the requirement that a majority of the board of directors of our general partner consist of independent directors; and |
| • | the requirement that the board of directors of our general partner have a nominating/corporate governance committee and a compensation committee that are composed entirely of independent directors. |
Our general partner’s board of directors currently is comprised of a majority of independent directors. However, our general partner’s board of directors does not currently intend to establish a nominating/corporate governance committee or a compensation committee. Accordingly, unitholders do not have the same protections afforded to equityholders of companies that are subject to all of the corporate governance requirements of the New York Stock Exchange.
The board of directors of our general partner currently consists of six directors. In accordance with the rules of the New York Stock Exchange, we are required to have at least three independent directors. Our six-member board of directors currently includes four independent directors.
To promote open discussion among independent and non-management directors, we schedule regular executive sessions in which our independent or non-management directors meet without management participation.
The board of directors of our general partner has one standing committee, which is its audit committee. The members of the audit committee currently consist of Michael S. Burke, James F. Dietz and Michael F. Ray, and Mr. Burke is the chairman of the audit committee. The board of directors of our general partner has determined that Messrs. Burke, Dietz and Ray are each independent directors who meet the independence requirements established by the New York Stock Exchange and the Exchange Act, and that, based upon their education and experience, Messrs. Burke, Dietz and Ray each have the requisite qualifications to qualify under the rules of the SEC, and designated Mr. Burke and Mr. Dietz as audit committee financial experts. The audit committee’s primary functions include reviewing our external financial reporting, recommending engagement of our independent auditors and reviewing procedures for internal auditing and the adequacy of our internal accounting controls.
The board of directors of our general partner may from time to time establish a conflicts committee, which would not be a standing committee, consisting entirely of independent directors. Pursuant to our partnership agreement, the board may, but is not required to, seek the approval of the conflicts committee whenever a conflict arises between our general partner or its affiliates, on the one hand, and us or any public unitholder, on the other. The conflicts committee may then determine whether the resolution of the conflict of interest is in the best interests of the Partnership. The members of the conflicts committee may not be officers or employees of our general partner or directors, officers or employees of its affiliates, and must meet the independence standard established by the New York Stock Exchange and the Exchange Act to serve on an audit committee of a board of directors. Any matters approved by the conflicts committee will be conclusively deemed to be fair and reasonable to us, approved by all of our partners and not a breach by the general partner of any duties it may owe us or our unitholders.
Meetings and Other Information
During 2014, the board of directors of our general partner had nine meetings and our audit committee had six meetings. None of the directors attended fewer than 75% of the aggregate number of meetings of the board of directors and committees of the board on which the director served.
Communications with Directors
Unitholders and other interested parties wishing to communicate with the board of directors of our general partner may send a written communication addressed to:
Rentech Nitrogen GP, LLC
10877 Wilshire Blvd., 10th Floor
Los Angeles, CA 90024
Attention: Secretary
107
Table of Contents
Our secretary will forward all appropriate communications directly to the board or to any individual director or directors, depending upon the facts and circumstances outlined in the communication. Any unitholder or other interested party who is interested in contacting only the independent directors or non-management directors as a group or the director who presides over the meetings of the independent directors or non-management directors may also send written communications to the contact above and should state for whom the communication is intended.
Code of Business Conduct and Ethics
Our committee charters and governance guidelines, as well as our Code of Business Conduct and Ethics that applies to our directors, officers and employees, our Disclosure Policy and our Whistleblower Policy are available on our website at http://www.rentechnitrogen.com. We intend to disclose any amendment to or waiver of our Code of Business Conduct and Ethics either on our website or by filing a Current Report on Form 8-K. Our website address referenced above is not intended to be an active hyperlink, and the contents of our website shall not be deemed to be incorporated herein.
Section 16(a) Beneficial Ownership Reporting Compliance
Section 16(a) of the Exchange Act requires the executive officers and directors of our general partner, and persons who beneficially own more than ten percent of a registered class of our equity securities, or, collectively, the Insiders, to file initial reports of ownership and reports of changes in ownership with the SEC. Insiders are required by SEC regulations to furnish us with copies of all Section 16(a) forms they file. To our knowledge, based solely on our review of the copies of such reports furnished to us or written representations from certain Insiders that no other reports were required to be filed during fiscal year 2014, all filing requirements under Section 16(a) applicable to our Insiders were satisfied timely.
Report of the Audit Committee
The audit committee of our general partner oversees our financial reporting process on behalf of the board of directors. Management has the primary responsibility for the financial statements and the reporting process. In fulfilling its oversight responsibilities, the audit committee reviewed and discussed with management the audited financial statements contained in this report.
Our independent registered public accounting firm, PricewaterhouseCoopers LLP, is responsible for expressing an opinion on the conformity of the audited financial statements with accounting principles generally accepted in the United States of America. The audit committee reviewed with PricewaterhouseCoopers LLP their judgment as to the quality, not just the acceptability, of our accounting principles and such other matters as are required to be discussed with the audit committee under generally accepted auditing standards.
The audit committee discussed with PricewaterhouseCoopers LLP the matters required to be discussed by SAS 61 (Codification of Statement on Auditing Standards, AU § 380), as may be modified or supplemented. The committee received written disclosures and the letter from PricewaterhouseCoopers LLP required by PCAOB Rule 3526 Communication with Audit Committees Concerning Independence, as may be modified or supplemented, and has discussed with PricewaterhouseCoopers LLP its independence from management and the Partnership.
Based on the reviews and discussions referred to above, the audit committee recommended to the board of directors that the audited financial statements be included in this report for filing with the SEC.
| Michael S. Burke, Chairman |
| James F. Dietz |
| Michael F. Ray |
Executive Officers and Directors
The following table sets forth the names, positions and ages (as of February 27, 2015) of the executive officers and directors of our general partner.
Keith B. Forman, Dan J. Cohrs and Colin M. Morris are also officers of Rentech and provide their services to our general partner and us pursuant to the services agreement we entered into among us, Rentech and our general partner. These officers divide their working time between the management of Rentech and us.
108
Table of Contents
| Name |
Age | Position With Our General Partner | ||||
| Keith B. Forman |
56 | Chief Executive Officer and Director | ||||
| Dan J. Cohrs |
62 | Chief Financial Officer | ||||
| John H. Diesch |
57 | President and Director | ||||
| Wilfred R. Bahl, Jr. |
64 | Senior Vice President of Finance and Administration | ||||
| Marc E. Wallis |
54 | Senior Vice President of Sales and Marketing | ||||
| Colin M. Morris |
42 | Senior Vice President, General Counsel and Secretary | ||||
| Michael S. Burke |
51 | Director | ||||
| James F. Dietz |
68 | Director | ||||
| Michael F. Ray |
61 | Director | ||||
| Halbert S. Washburn |
54 | Director | ||||
Keith B. Forman. Keith B. Forman was appointed Chief Executive Officer in December 2014 and was appointed as a member of the board of directors of our general partner at the closing of our initial public offering. Mr. Forman was also appointed as Chief Executive Officer and President of Rentech in December 2014. Since April 2007, Mr. Forman has been a director of Capital Product Partners L.P., a publicly traded shipping limited partnership specializing in the seaborne transportation of oil, refined oil products, chemicals and dry cargoes. Mr. Forman currently serves as the Chairman of its conflicts committee and is a member of its audit committee. Since May of 2011, Mr. Forman has served as a Senior Advisor to Industry Funds Management (IFM). IFM is an Australian based fund investing in infrastructure projects around the world including making investments in energy related infrastructure. Since November of 2013, Mr. Forman has served as a director of Applied Consultants, Inc., a privately held (by Nautic Partners) company with a roster of over 1,500 consulting engineers who work in the midstream pipeline construction and maintenance industry. From November 2007 until March 2010, Mr. Forman served as Partner and Chief Financial Officer of Crestwood Midstream Partners LP, a private investment partnership focused on making equity investments in the midstream energy market. From January 2004 to July 2005, Mr. Forman was Senior Vice President, Finance for El Paso Corporation, a provider of natural gas services. From January 1992 to December 2003, he served as Chief Financial Officer of GulfTerra Energy Partners L.P., a publicly traded master limited partnership, and was responsible for the financing activities of the partnership, including its commercial and investment banking relationships. Mr. Forman received a B.A. degree in economics and political science from Vanderbilt University. The board of directors of our general partner has determined that Mr. Forman brings to the board of directors accounting, financial and directorial experience, including extensive experience with master limited partnerships, and therefore he should serve on the board of directors of our general partner.
Dan J. Cohrs. Dan J. Cohrs was appointed Chief Financial Officer of our general partner in July 2011. Since October 2008, Mr. Cohrs has served as Executive Vice President and Chief Financial Officer of Rentech. Mr. Cohrs has more than 25 years of experience in corporate finance, strategy and planning, and mergers and acquisitions. From April 2008 through September 2008, Mr. Cohrs served as Chief Development and Financial Officer of Agency 3.0, LLC, a private digital advertising and consulting agency in Los Angeles, California and he was a Partner and a Board Member of Agency 3.0, LLC until September 2009. From August 2007 through September 2008, he served as Chief Development & Financial Officer of Skycrest Ventures, LLC, a private investment and consulting firm in Los Angeles that was related to Agency 3.0, LLC. From June 2006 to May 2007, Mr. Cohrs served as a consultant for finance and corporate development, as well as Interim Chief Financial Officer for several months during that period of time for Amp’d Mobile, a private mobile media entertainment company in Los Angeles. From 2003 to 2007, Mr. Cohrs worked as an independent consultant and advised companies regarding financings, investor presentations and business plans. Also from November 2005 to March 2006, Mr. Cohrs served as a Visiting Senior Lecturer at Cornell University’s Johnson School of Management in the area of corporate governance. From May 1998 to June 2003, Mr. Cohrs served as Executive Vice President and Chief Financial Officer of Global Crossing Ltd. Prior to being employed at Global Crossing Ltd., Mr. Cohrs held senior positions in finance and strategy at Marriot Corporation, Northwest Airlines, Inc. and GTE Corporation, a predecessor of Verizon Communications, Inc.
On June 1, 2007, Amp’d Mobile, Inc. filed a petition for bankruptcy under chapter 11 of title 11 of the United States Code, 11 U.S.C. § 101, et seq., or the Bankruptcy Code, with the United States Bankruptcy Court for the District of Delaware. On January 28, 2002, Global Crossing Ltd., and certain of its direct and indirect subsidiaries, filed a petition for bankruptcy under chapter 11 of title 11 of the Bankruptcy Code with the United States Bankruptcy Court for the Southern District of New York. On April 11, 2005, the SEC, Global Crossing Ltd., Mr. Cohrs (at the relevant time, the Chief Financial Officer of Global Crossing Ltd.) and other members of Global Crossing Ltd.’s senior management reached a settlement related to an SEC investigation regarding alleged violations of the reporting provisions of Section 13(a) of the Securities Exchange Act of 1934 (and the regulations thereunder). The parties to the agreement (other than the SEC) agreed not to cause any violations of such reporting provisions in the future, and in connection with a parallel civil action, Mr. Cohrs agreed to pay a $100,000 civil penalty. In the SEC order, none of the allegations related to fraud, no party admitted liability and no other violations of securities laws were alleged. Also in connection with Global Crossing, Ltd., on July 16, 2004, Mr. Cohrs and the Secretary of the United States Department of Labor entered into a settlement agreement, the relevant restrictions of which expired on July 16, 2009, pursuant to which Mr. Cohrs agreed, among other things, that he would give notice to the Secretary, and if the Secretary objected, then he would not serve in a fiduciary capacity with respect to any plan covered by the Employee Retirement Income Security Act, or ERISA.
109
Table of Contents
John H. Diesch. John H. Diesch was appointed President and a member of the board of directors of our general partner in July 2011. From 2008 to 2013, Mr. Diesch served as Senior Vice President of Operations of Rentech and was responsible for plant operations at our facilities and Rentech’s Product Demonstration Unit in Commerce City, Colorado. From April 2006 to January 2008, Mr. Diesch served as President of RNLLC (formerly REMC) and Vice President of Operations for Rentech. From April 1999 to April 2006, Mr. Diesch served as Managing Director of Royster-Clark Nitrogen, Inc., and previously served as Vice President and General Manager of nitrogen production and distribution for IMC AgriBusiness Inc., an agricultural fertilizer manufacturer. In 1991, he joined Vigoro Industries Inc., a manufacturer and distributor of potash, nitrogen fertilizers and related products, as North Bend, Ohio Plant Manager after serving as Plant Manager, Production Manager and Process Engineer with Arcadian Corporation, a nitrogen manufacturer, Columbia Nitrogen Corp., a manufacturer of fertilizer products, and Monsanto Company, a multinational agricultural biotechnology corporation. Mr. Diesch is a member of the board of directors of the Fertilizer Institute, a former member of the board of directors of the Gasification Technologies Council and previously served as director of the Dubuque Area Chamber of Commerce, and was recently management Chairman of the Board for the Dubuque Area Labor Management Council. The board of directors of our general partner has determined that Mr. Diesch brings to the board of directors knowledge of our business and our industry and valuable insight into the operation of our facilities, and therefore he should serve on the board of directors of our general partner.
Wilfred R. Bahl, Jr. Wilfred R. Bahl, Jr. was appointed Senior Vice President of Finance and Administration of our general partner in July 2011. Since April 2006, Mr. Bahl has served as the Vice President and Chief Financial Officer of RNLLC (formerly REMC). He has 41 years of finance experience, with 35 of those years at our facility. From 1999 to 2006, Mr. Bahl was the Director of Finance and Energy for Royster-Clark Nitrogen, Inc. From 1998 to 1999, he served as Vice President of Business Development and, from 1995 to 1998, he served as the Vice President of Finance and Administration of IMC Nitrogen Co. From 1991 to 1995, he served as Vice President of Finance for Phoenix Chemical Co. In 1987, he served as Treasurer and was appointed to the board of directors of Phoenix Chemical Co and was appointed to the executive committee of the board of directors in 1989. From 1980 to 1987, Mr. Bahl served as the Administrative and Accounting Manager of N-Ren Corporation and later served as its Controller. Prior to joining N-Ren Corporation, he held various accounting positions with Flexsteel Industries, Inc., a furniture manufacturer, and Eska Company, a manufacturer of snow blower and outboard motors.
Marc E. Wallis. Marc E. Wallis was appointed Senior Vice President of Sales and Marketing of our general partner in July 2011. Mr. Wallis has served as Vice President, Sales and Marketing of RNLLC (formerly REMC) since 2006 and has a long history working with our East Dubuque Facility. From 2000 to 2006, he held the position of National Accounts Sales Manager of RNLLC (formerly REMC). From 1995 to 2000, Mr. Wallis held the positions of Director of Sales and Purchasing at IMC Agribusiness Inc., the prior owner of our East Dubuque Facility. From 1987 to 1995, Mr. Wallis held the position of Director of Purchasing at the Vigoro Corporation, a manufacturer and distributor of potash, nitrogen fertilizers and related products.
Colin M. Morris. Colin M. Morris has served as Senior Vice President, General Counsel and Secretary of our general partner and Rentech since October 2011. From July 2011 to October 2011, Mr. Morris served as the Vice President, General Counsel and Secretary of our general partner and from June 2006 to October 2011, Mr. Morris served as the Vice President, General Counsel and Secretary of Rentech. Mr. Morris practiced corporate and securities law at the Los Angeles office of Latham & Watkins LLP from June 2004 to May 2006. From September 2000 to May 2004, Mr. Morris practiced corporate and securities law in the Silicon Valley office of Wilson, Sonsini, Goodrich and Rosati. Prior to that, Mr. Morris practiced corporate and securities law in the Silicon Valley office of Pillsbury Winthrop Shaw Pittman LLP.
Michael S. Burke. Michael S. Burke was appointed as a member of the board of directors of our general partner in July 2011. Mr. Burke serves as chair of the Audit Committee and is a member of the Compensation Committee of Rentech. He is a member of the Audit Committee of Rentech Nitrogen GP, LLC. Since March 2007, Mr. Burke has served as a member of the board of directors of Rentech. Mr. Burke is the Chief Executive Officer and President of AECOM Technology Corporation, or AECOM, a global provider of professional technical and management support services to government and commercial clients. Mr. Burke was appointed chairman of the board of AECOM on March 4, 2015. From October 1, 2011 through March 5, 2014, Mr. Burke served as President of AECOM. From December 2006 through September 2011, Mr. Burke served as Executive Vice President, Chief Financial Officer of AECOM. Mr. Burke joined AECOM as Senior Vice President, Corporate Strategy in October 2005. From 1990 to 2005, Mr. Burke was with the accounting firm, KPMG LLP, where he served in various senior leadership positions, most recently as a Western Area Managing Partner from 2002 to 2005 and was a member of the board of directors of KPMG from 2000 through 2005. While on the board of directors of KPMG, Mr. Burke served as the Chairman of the Board Process and Governance Committee and a member of the Audit and Finance Committee. Mr. Burke also serves on various charitable and community boards. Mr. Burke received a B.S. degree in accounting from the University of Scranton and a J.D. degree from Southwestern University. The board of directors of our general partner has determined that Mr. Burke brings to the board of directors extensive accounting, financial and business experience, including experience as an executive officer of a public company, and therefore he should serve on the board of directors of our general partner.
110
Table of Contents
James F. Dietz. James F. Dietz was appointed as a member of the board of directors of our general partner in February 2012 and serves on the Audit Committee. Mr. Dietz served on the board of directors and the audit committee of Prospect Global Resources, Inc., a publicly traded company on NASDAQ engaged in the development of a potash mine in the Holbrook Basin of eastern Arizona, from November 2012 until he resigned in February 2013. Mr. Dietz has over 41 years of experience in the fertilizer and chemical industries. Mr. Dietz most recently served as Executive Vice President and Chief Operating Officer of Potash Corporation of Saskatchewan Inc., or PotashCorp, from November 2000 until his retirement in June 2010. In November 2000, Mr. Dietz was named Executive Vice President & Chief Operating Officer for PotashCorp. From 1998 to November 2000, Mr. Dietz served as President of PotashCorp Nitrogen, and from 1997 to 1998, as Executive Vice President. In addition to responsibility for PotashCorp’s worldwide operations, Mr. Dietz had responsibility for the corporation’s Safety, Health, and Environment performance and the Procurement functions. From 1993 to 1997, Mr. Dietz was Vice President of Manufacturing with Arcadian Corporation in Memphis, Tennessee. From 1969 to 1993, Mr. Dietz had increasing operational responsibility for Standard Oil of Ohio (Sohio) and BP, both in the United States and the United Kingdom. Mr. Dietz received a Bachelor of Chemical Engineering degree from The Ohio State University in 1969 and his Master of Science in Chemical Engineering in 1970. The board of directors of our general partner has determined that Mr. Dietz brings to the board of directors valuable knowledge of and experience in the chemical and nitrogen fertilizer industries, and therefore he should serve on the board of directors of our general partner.
Michael F. Ray. Michael F. Ray was appointed as a member of the board of directors of our general partner in July 2011 and serves on the Audit Committee. From May 2005 until April 2014, Mr. Ray served as a member of the board of directors of Rentech. Mr. Ray served as the Chairman of Rentech’s Compensation Committee from 2005 until 2010 and has served as a member of Rentech’s Audit Committee from 2008 until 2014. Mr. Ray founded and, since 2001, has served as President of ThioSolv, LLC. ThioSolv, LLC is in the business of developing and licensing sulfur and ammonia recovery technologies for the refining and chemical sector. Also, since May 2005, Mr. Ray has served as General Partner of GBTX Leasing, LLC, a company that owns and leases rail cars for the movement of liquid chemicals and salts which was sold in 2014. Since 2008, Mr. Ray has served as a member of the board of directors and the Technology Committee for Cyanco Corporation, a producer of sodium cyanide in the Western United States, and a subsidiary of Oaktree Capital Management, OCM Cyanco Holdings, LLC, which holds a controlling interest in Cyanco Corporation. From 1995 to 2001, Mr. Ray served as Vice President of Business Development for the Catalyst and Chemicals Division of The Coastal Corporation, a natural gas, pipeline, refining, coal and chemical company. Mr. Ray served as President (from 1990 to 1995) of Coastal Chem, Inc., a producer of ammonia, urea, UAN and industrial ammonium nitrate, methanol, fuel additives and carbon dioxide. Prior to serving as President Mr. Ray held the positions of Vice President of Corporate Development and Administration (from 1986 to 1990) and Vice President of Carbon Dioxide Marketing (from 1985 to 1986). Mr. Ray served as Regional Operations Manager (from 1981 to 1985) and Plant Manager (from 1980 to 1981) of Liquid Carbonic Corporation, a seller of carbon dioxide products. Mr. Ray previously served as a member of the board of directors of Coastal Chem, Inc., a subsidiary of a publicly traded company, Cheyenne LEADS and Wyoming Heritage Society. Mr. Ray also served on the Nitrogen Fertilizer Industry Ad Hoc Committee, the University of Wyoming EPSCOR Steering Committee and Wyoming Governor’s committee for evaluating state employee compensation. Mr. Ray holds a B.S. degree in industrial technology from Western Washington University, as well as an M.B.A from Houston Baptist University. The board of directors of our general partner has determined that Mr. Ray brings to the board of directors valuable knowledge of and experience in the chemical and nitrogen fertilizer industries and directorial and governance experience as a director of Coastal Chem, Inc., and therefore he should serve on the board of directors of our general partner.
Halbert S. Washburn. Halbert S. Washburn was appointed as a member of the board of directors of our general partner in July 2011. Since December 2005, Mr. Washburn has served as a member of the board of directors of Rentech, and since June 2011 has served as its Chairman. Mr. Washburn has over 25 years of experience in the energy industry. Since April 2010, Mr. Washburn has been the Chief Executive Officer of BreitBurn GP, LLC, the general partner of BreitBurn Energy Partners LP. From August 2006 until April 2010, he was the co-Chief Executive Officer and served on the board of directors of BreitBurn GP, LLC. In December 2011, he was reappointed as a member of the board of directors of BreitBurn GP, LLC. He has served as the co-President and a director of BreitBurn Energy Corporation since 1988. He also has served as a co-Chief Executive Officer and a director for Pacific Coast Energy Holdings, LLC (formerly BreitBurn Energy Holdings, LLC) and as co-Chief Executive Officer and a director of PCEC (GP), LLC (formerly BEH (GP), LLC). Since September 2013, Mr. Washburn has served on the board of directors of Jones Energy, Inc., a publically traded oil and gas exploration and production company. Mr. Washburn previously served as Chairman on the Executive Committee of the board of directors of the California Independent Petroleum Association. He also served as Chairman of the Stanford University Petroleum Investments Committee and as Secretary and Chairman of the Wildcat Committee. The board of directors of our general partner has determined that Mr. Washburn brings to the board of directors knowledge of our business and extensive experience with master limited partnerships, including his service as an executive officer and director of several BreitBurn entities, and therefore he should serve on the board of directors of our general partner.
The directors of our general partner hold office until the earliest of their death, resignation or removal.
111
Table of Contents
ITEM 11. EXECUTIVE COMPENSATION
Compensation Discussion and Analysis
Executive Summary
This Compensation Discussion and Analysis provides an overview and analysis of our executive compensation program during the Partnership’s fiscal year ended December 31, 2014, or fiscal year 2014, for our named executive officers, or NEOs. Our executive compensation program is designed to align executive pay with individual performance on both short- and long-term bases, to link executive pay to specific, measurable financial, technological and development achievements intended to create value for securityholders and to utilize compensation as a tool to attract and retain the high-caliber executives that are critical to our long-term success.
The following table sets forth the key elements of our NEOs’ compensation, along with the primary objectives associated with each element of compensation.
| Compensation Element |
Primary Objective | |
| Base salary | To recognize performance of job responsibilities, provide stable income and attract and retain experienced individuals with superior talent. | |
| Annual incentive compensation | To promote achievement of short-term performance objectives and reward individual contributions to their completion. | |
| Long-term equity incentive awards | To encourage decision-making keyed to long-term performance, align the interests of our NEOs with unitholder interests, encourage the maximization of our unit value and retain key executives. | |
| Severance and change in control benefits | To encourage the continued attention and dedication of our NEOs and provide reasonable individual security to enable our NEOs to focus on our best interests, particularly when considering strategic alternatives. | |
| Retirement savings (401(k) plan) | To provide an opportunity for tax-efficient savings with the added economic incentive of employer matching contributions. | |
| Other elements of compensation and perquisites |
To attract and retain talented executives in a cost-efficient manner by providing benefits with perceived values that exceed their cost. | |
To serve the foregoing objectives, our overall compensation program is generally designed to be flexible rather than purely formulaic. In alignment with the objectives set forth above, the board of directors of our general partner and Rentech’s Compensation Committee have generally determined the overall compensation of our NEOs and its allocation among the elements described above, relying on the analyses and advice provided by Rentech’s compensation consultant as well as input from our management team. Our general partner and Rentech’s Compensation Committee have generally made these determinations in executive sessions without our management team present, but have also sought input from our Chief Executive Officer with regard to individual NEO performance and compensation besides his own.
Our compensation decisions for our NEOs with respect to 2014 are discussed in detail below. This discussion is intended to be read in conjunction with the executive compensation tables and related disclosures that follow this Compensation Discussion and Analysis.
Named Executive Officers
Rentech Nitrogen GP, LLC, our general partner, manages our operations and activities on our behalf through its officers and directors and is solely responsible for providing the employees and other personnel necessary to conduct our operations. Although all of the employees that conduct our business are employed by our general partner, its affiliates and certain of our subsidiaries, we sometimes refer to these individuals in this report as our officers and employees for ease of reference. Please see Item 13 “Certain Relationships and Related Transactions, and Director Independence—Our Agreements with Rentech.”
The following discussion describes and analyzes our compensation objectives and policies, as well as the material components of our executive compensation program for each of Keith B. Forman, D. Hunt Ramsbottom, Dan J. Cohrs, John H. Diesch, John A. Ambrose and Marc E. Wallis, our NEOs. During fiscal year 2014, Mr. Ramsbottom served as the Chief Executive Officer of our general partner through December 9, 2014, and Mr. Forman served as the Chief Executive Officer of our general partner from December 9, 2014 through December 31, 2014. Our NEOs (other than Mr. Forman) were appointed to their positions during 2011 in
112
Table of Contents
connection with our formation and the formation of our general partner. Messrs. Forman and Cohrs also serve as officers of Rentech, our parent company, and Mr. Ramsbottom served as an officer of Rentech until December 9, 2014. Messrs. Forman, Ramsbottom and Cohrs are sometimes referred to in this Annual Report as our “Shared NEOs” (and Messrs. Diesch, Ambrose and Wallis are sometimes referred to as our “Non-Shared NEOs”). For purposes of the discussion, except as otherwise expressly provided below, references to Shared NEOs with regard to events, determinations and other matters occurring on or prior to December 9, 2014 include Mr. Ramsbottom and exclude Mr. Forman, while references to Shared NEOs with regard to events, determinations and other matters occurring after December 9, 2014 include Mr. Forman and exclude Mr. Ramsbottom. Mr. Ambrose retired and thus ceased to serve as one of our officers, effective January 9, 2015.
The following discussion and analysis describes our compensation objectives and policies for each of our NEOs for 2014, who consisted of:
| Officer |
Title(s) | |
| Keith B. Forman | Chief Executive Officer and President, Rentech, Inc. and Chief Executive Officer, Rentech Nitrogen GP, LLC | |
| D. Hunt Ramsbottom | Former Chief Executive Officer and President, Rentech, Inc. and Former Chief Executive Officer, Rentech Nitrogen GP, LLC | |
| Dan J. Cohrs | Executive Vice President & Chief Financial Officer, Rentech, Inc. and Chief Financial Officer, Rentech Nitrogen GP, LLC | |
| John H. Diesch | President, Rentech Nitrogen GP, LLC | |
| John A. Ambrose | Chief Operating Officer, Rentech Nitrogen GP, LLC | |
| Marc E. Wallis | Senior Vice President of Sales and Marketing, Rentech Nitrogen GP, LLC | |
Compensation Philosophy
We operate in a highly competitive and dynamic industry, characterized by rapidly changing market requirements. To succeed in this environment, we need to recruit and retain a highly talented and seasoned team of executive, technical, sales, marketing, operations, financial and other business professionals. We recognize that our ability to attract and retain these professionals largely depends on how we compensate and reward our employees, including our NEOs. As discussed under the heading “—Compensation Decisions: Roles of Rentech’s Compensation Committee, our General Partner and our Chief Executive Officer” below, responsibility and authority for compensation-related decisions: (i) for our Shared NEOs resides with Rentech’s Compensation Committee (subject to input and advice from our Chief Executive Officer with regard to our Chief Financial Officer), and (ii) for our Non-Shared NEOs resides with the board of directors of our general partner (subject to input and advice from our Chief Executive Officer), taking into consideration the recommendation of Rentech’s Compensation Committee, in all cases, administered in a manner consistent with the compensation philosophy discussed above. For ease of reference, we refer below to determinations and perspectives formulated by this group as our own. Rentech’s Compensation Committee and our general partner, as applicable, conduct periodic reviews of our NEOs’ compensation and consider adjustments as appropriate.
We have designed and implemented our compensation strategy and objectives to address our recruiting and retention needs, which we have built around the following principles and objectives:
| • | Attract, engage and retain the best executives to work for us, with experience and managerial talent that will build our reputation as an employer of choice in a highly-competitive and dynamic industry; |
| • | Align compensation with our corporate strategies, business and financial objectives and the long-term interests of our unitholders with a focus on increasing long-term value and rewarding achievements of our short- and mid-term financial and strategic objectives; |
| • | Motivate and reward executives whose knowledge, skills and performance ensure our continued success; and |
| • | Ensure that our total compensation is fair, reasonable and competitive. |
113
Table of Contents
We seek to create an environment that is responsive to the needs of our employees, is open to employee communication and continual performance feedback, encourages teamwork and rewards commitment and performance. Our compensation program is intended to be flexible and complementary and to collectively serve the principles and objectives of our compensation philosophy. Each of the key elements of our executive compensation program is discussed in more detail below (see “—Core Components of Executive Compensation”).
Compensation Decisions: Roles of Rentech’s Compensation Committee, our General Partner and our Chief Executive Officer
Historically, the initial compensation arrangements for our NEOs have been determined in arm’s-length negotiations with each individual executive at the time of such executive’s hiring. Prior to our initial public offering in 2011, compensation decisions with respect to our NEOs were made by the Rentech Compensation Committee and Board of Directors. Since our public offering in 2011, compensation decisions for our Shared NEOs continue to be made by the Rentech Compensation Committee and Board of Directors, as applicable, while compensation decisions for our Non-Shared NEOs are made by our general partner’s Board and Chief Executive Officer based on recommendations from the Rentech Compensation Committee.
Decisions regarding the terms and conditions of our NEOs’ employment have been influenced by a variety of factors, including, but not limited to:
| • | The NEO’s background, experience and accomplishments; |
| • | Our financial condition, performance and available resources; |
| • | Our need to fill a particular position or retain a particular executive; |
| • | An evaluation of the competitive market, based on the collective experience of the members of Rentech’s Compensation Committee, our Chief Executive Officer and advice from Rentech’s compensation consultant; |
| • | The NEO’s length of service; and |
| • | The compensation levels of our other executive officers. |
Generally, the focus of these compensation decisions has been to retain these skilled individuals and to incentivize them to help meet prescribed financial and other goals. The current compensation levels of our executive officers, including our NEOs, primarily reflect the varying roles and responsibilities of each individual, their accomplishments and the length of time each executive has been employed by Rentech and/or us.
Compensation Consultant
The Partnership does not have its own compensation consultant. However, during 2014, Rentech’s Compensation Committee engaged Frederic W. Cook & Co., Inc. (“Cook”) as an independent compensation consultant to analyze Rentech’s existing executive compensation programs, assist with the design of future compensation programs that more closely align its executive officers’ interests with those of its shareholders, and ensure that the levels and types of compensation provided to its executives (including our Shared NEOs and Mr. Diesch) and directors continue to reflect market practices. Cook serves at the discretion of Rentech’s Compensation Committee and Cook may be terminated by Rentech’s Compensation Committee in its discretion. Rentech’s Compensation Committee has assessed the independence of Cook pursuant to the rules prescribed by the SEC and has concluded that no conflict of interest existed in 2014 or currently exists that would prevent Cook from serving as an independent consultant to Rentech’s Compensation Committee.
Services Provided With Respect to 2014 Compensation
Services provided by Cook in 2014 included the following:
| • | Analyzing Rentech’s peer group companies and advising on appropriate changes to such companies so that they align with Rentech’s business mix and size; |
| • | Reviewing and analyzing officer and non-employee director compensation data for Rentech and providing analysis with regard to the amounts of such compensation, its alignment with performance and its consistency with good governance practice; and |
| • | Analyzing Rentech’s compensation components, and incentive designs, to calibrate the compensation opportunities of its directors and officers (including our Shared NEOs and Mr. Diesch) relative to its peer group companies. |
114
Table of Contents
Comparison to Market Practices
Rentech’s Compensation Committee provides levels and elements of executive compensation, including base salaries, target annual incentive as a percentage of salary, total cash compensation, long-term incentives and total direct compensation, based on information gathered from the public filings of (i) Rentech’s peer group companies (with respect to our Shared NEOs) and (ii) the Partnership’s peer group companies (with respect to our Non-Shared NEOs), discussed below, as well as industry-specific published survey data (discussed in more detail below). Additional information on Rentech’s peer group companies can be found in Rentech’s Form 10-K, filed March 16, 2015.
The Partnership’s current peer group was established in September 2011 based on discussions among the members of Rentech’s Compensation Committee, certain of Rentech’s executive officers (including certain Shared NEOs) and Radford, an Aon Hewitt Company, which was our prior independent compensation consultant. The peer group consists of chemical manufacturing, fertilizer, and oil and gas companies, in each case, with (i) annual revenues ranging from $90 million to $715 million, (ii) market values ranging from $57 million to $4.0 billion (with a median of $732 million), and (iii) similar employee numbers. Following are the companies that comprise our current peer group:
| American Vanguard Corp. | Innophos Holdings | |
| American Pacific Corp. | Innospec | |
| Balchem Corp. | LSB Industries | |
| Calgon Carbon Corp. | NL Industries | |
| Cambrex | PAA Natural Gas Storage | |
| Chesapeake Midstream Partners, L.P. | Quaker Chemical Corp. | |
| CVR Partners, L.P. | Terra Nitrogen Company LP | |
| Flotek Industries | Tesoro Logistics LP | |
| FutureFuel | Western Gas Partners, LP | |
| Hawkins Inc. |
In September 2014, Rentech’s Compensation Committee conducted a review of compensation data provided by Cook with regard to the levels and types of compensation provided to our NEOs, other than with respect to Mr. Forman whose service as the Chief Executive Officer of our general partner began in December 2014. The information provided by Cook included data gathered from the public filings of our peer group and of Rentech’s peer group. Rentech’s Compensation Committee considered this data when determining the final incentive awards earned by our NEOs for 2014 under our annual incentive compensation programs and the levels and types of equity awards granted to our NEOs during 2014. Rentech expects to continue to use its peer group and the Partnership’s peer group for purposes of assessing Rentech’s and our compensation programs through at least 2015.
During its 2014 review which occurred in September 2014, Rentech’s Compensation Committee reviewed the compensation of the Shared NEOs and Mr. Diesch relative to the Rentech’s peer group with respect to total compensation and for individual components of compensation and determined it was within the desired market range and in line with our compensation philosophy. A comparison of 2014 long-term equity incentives showed (i) above-median equity award levels for our Shared NEOs (with respect to Rentech’s current peer group), and (ii) that these equity awards were weighted considerably more toward performance-based vesting than the equity awards granted to similarly-situated executives of its peer group (i.e., 60% of long-term incentives at Rentech versus about 30% for peer company officers on average). In contrast, Rentech’s Compensation Committee determined that the compensation of our Non-Shared NEOs was generally in line with our peer group and consistent with our stated philosophy with respect to total compensation. However, Mr. Wallis’ annual incentive opportunity was above the median of the market (compared to our peer group).
Based on these reviews, Rentech’s Compensation Committee concluded that the level of our NEOs’ total compensation was well-positioned to attract and retain the type of management team that we believe is necessary to successfully implement our business strategy. Specifically, the compensation levels of our Shared NEOs are appropriate in light of the scope of duties they provide both to us and to Rentech, as well as the high degree of performance required for the incentive award components of their compensation to actually be delivered, while the Non-Shared NEOs are provided with reasonable levels of cash compensation (compared to our peer group) and are weighted towards variable compensation that is based on the appreciation in our unit value over time, which we believe is appropriate to incentivize them to work toward the long-term growth of our recently public company and aligns their interests with those of our unitholders. We believe that these levels and types of compensation were also consistent with our compensation philosophy, fostered our compensation objectives and continued to provide appropriate incentives through 2015.
115
Table of Contents
Allocation
All of the executive officers and other personnel necessary for our business to function are employed and compensated by our general partner, our subsidiaries and/or Rentech, subject to reimbursement of the appropriate entity by us in accordance with the terms of the services agreement. Because each of our Shared NEOs is also an officer of Rentech, our Shared NEOs generally devote less than a majority of their total business time specifically to our general partner and to us. Rentech has the ultimate decision-making authority with respect to the portion of our Shared NEOs’ compensation that is allocated to us pursuant to Rentech’s allocation methodology, subject to the terms of the services agreement. Any such compensation allocation decisions are not subject to approval by us or our general partner. Please see Item 13 “Certain Relationships and Related Transactions, and Director Independence—Our Agreements with Rentech—Services Agreement.”
Core Components of Executive Compensation
Through Rentech’s Compensation Committee, we design the principal components of our executive compensation program to fulfill one or more of the principles and objectives described above. Compensation of our NEOs consists of the following elements:
| • | Cash compensation comprised of base salary and annual cash incentive compensation; |
| • | Equity incentive compensation; |
| • | Certain severance and change in control benefits; |
| • | Health and welfare benefits and certain limited perquisites and other personal benefits; and |
| • | Retirement savings (401(k)) plan. |
We view each component of our executive compensation program as related but distinct, and we have historically reassessed the total compensation of our NEOs periodically to ensure that overall compensation objectives are met. In addition, in determining the appropriate level for each compensation component, we have considered, but not relied on exclusively, our understanding of the competitive market based on the collective experience of members of Rentech’s Compensation Committee (and our Chief Executive Officer with regard to the other NEOs), our recruiting and retention goals, our view of internal equity and consistency, the length of service of our executives, our overall financial and operational performance and other relevant considerations.
We have not adopted any formal or informal policies or guidelines for allocating compensation between currently-paid and long-term compensation, between cash and non-cash compensation, or among different forms of non-cash compensation. Generally, we offer a competitive, but balanced, total compensation package that provides the stability of a competitive, fixed income while also affording our executives the opportunity to be appropriately rewarded through cash and equity incentives if we attain short-term goals and perform well over time. However, we have increasingly used performance-based metrics to incentivize our employees and specifically our NEOs.
Each of the primary elements of our executive compensation program is discussed in more detail below. While we have identified particular compensation objectives that each element of executive compensation serves, our compensation programs are intended to be flexible and complementary and to collectively serve all of the executive compensation objectives described above. Accordingly, whether or not specifically mentioned below, we believe that, as a part of our overall executive compensation policy, each individual element, to a greater or lesser extent, serves each of our compensation objectives.
Cash Compensation
We provide our NEOs with cash compensation in the form of base salaries and annual cash incentive awards. Our cash compensation is structured to provide a market-level base salary for our NEOs while creating an opportunity to exceed market levels for total compensation if short- and long-term performance exceeds expectations. We believe that this mix appropriately combines the stability of non-variable compensation (in the form of base salary) with variable performance awards (in the form of annual cash incentives) that reward the performance of Rentech (in the case of Shared NEOs) or the Partnership (in the case of Non-Shared NEOs) and individual contributions to the success of the business.
Base Salary
As discussed above, base salaries for our NEOs were initially set in arm’s-length negotiations during the hiring process for these executives. These base salaries have historically been reviewed annually by Rentech’s Compensation Committee (with respect to our Shared NEOs) and our general partner’s board of directors (with respect to our Non-Shared NEOs) (with input from our Chief Executive Officer with respect to the other NEOs) and were again reviewed at the end of 2014 for purposes of determining 2015 salaries. Our NEOs are not entitled to any contractual or other formulaic base salary increases. Rentech’s Compensation Committee (with respect to our Shared NEOs) and our general partner’s board of directors (with respect to our Non-Shared NEOs) determined not to increase our NEOs’ base salaries for 2015; accordingly, our NEOs’ base salaries for 2015 will remain the same as in 2014. Mr. Forman’s base salary was set in December in connection with his hiring as our Chief Executive Officer and was, at the time Mr. Forman became our Chief Executive Officer, the lowest salary of any Chief Executive Officer in the Partnership’s current peer group.
116
Table of Contents
The annual base salary rates for our NEOs during fiscal year 2014 are set forth in the following table:
| Name |
Base Salary ($) | |||
| Keith B. Forman |
200,000 | |||
| D. Hunt Ramsbottom |
650,000 | |||
| Dan J. Cohrs |
464,000 | |||
| John H. Diesch |
335,000 | |||
| Marc E. Wallis |
222,000 | |||
Annual Incentive Compensation
Rentech maintains an annual incentive compensation program to reward its executive officers, including our Shared NEOs, based on its financial and operational performance, achievement of specific milestones related to operation and expansion of its business, financing and project development work, and the individual NEO’s relative contributions to Rentech’s performance during the year (referred to below as the Rentech annual incentive program). We separately maintain an annual incentive program to reward our executive officers, including our Non-Shared NEOs (excluding our Shared NEOs and Mr. Wallis), based on our financial and operational performance, achievement of specific milestones related to the expansion of our facilities and the individual NEO’s relative contributions to that performance during the year (referred to below as the RNP annual incentive program). In addition, in lieu of Mr. Wallis’ participation in the RNP annual incentive program, we maintain a sales-based annual incentive program for Mr. Wallis to incentivize him in light of his position and responsibilities (referred to below as the sales incentive program). We recognize that successful completion of short-term objectives is critical in achieving our planned level of growth and attaining our other long-term business objectives. Accordingly, our annual and sales incentive programs are designed to reward executives for successfully taking the immediate steps necessary to implement our long-term business strategy.
Annual Incentive Programs
During 2014, (i) each of our Shared NEOs (excluding Mr. Forman, whose employment with us commenced in December 2014) was eligible to receive an incentive payment pursuant to the Rentech annual incentive program and (ii) each of our Non-Shared NEOs (excluding Mr. Wallis) was eligible to receive an incentive payment pursuant to the RNP annual incentive program. Under both annual incentive programs, cash incentives were determined and paid by reference to (i) the achievement of certain pre-established operational and financial goals and commercial and project development criteria, and (ii) target bonus amounts (as set forth in the NEOs’ respective employment agreements). The goals are weighted based on importance for the year. In the beginning of 2014, as in prior fiscal years with respect to Rentech, our CEO and other senior officers of Rentech developed a series of broad objectives for each of Rentech and us, which were then reviewed and revised by Rentech’s Compensation Committee and board of directors and the board of directors of our general partner. Following that review, Rentech’s board of directors and our general partner’s board of directors set the 2014 performance goals for the Rentech and RNP annual incentive programs, respectively, but retained discretion based on input from the Compensation Committee (and our Chief Executive Officer with respect to the other NEOs who participate in the annual incentive programs) to increase or decrease annual incentive award payouts to levels as high as 200% of the NEO’s target bonus and as low as zero, in each case, based on performance during the relevant period. The goals were designed to be challenging with no guarantee that any portion of the target award would actually be earned. The 2014 annual incentive awards were targeted for Messrs. Cohrs, Diesch and Ambrose at 60%, 50% and 40% of their respective base salaries (in accordance with their respective employment agreements). Mr. Ramsbottom’s 2014 annual incentive award was targeted at 100% of his base salary (in accordance with his employment agreement); however, he was not eligible to receive an annual incentive award payment for 2014 because his employment terminated prior to the end of fiscal year 2014. Payment of annual incentive awards to our NEOs (other than Mr. Wallis) was based on the achievement by Rentech and/or us, as applicable, of the specific targets and goals set forth below for the applicable annual incentive program, as well as the performance of the individual executive (and was subject to adjustment as described above).
Rentech Annual Incentive Program Performance Goals
The 2014 performance goals applicable to our Shared NEOs (excluding Mr. Forman) under the Rentech annual incentive program are set forth below, along with determinations as to the attainment of these goals (parentheticals following the description of each goal provide guidelines indicating the approximate weight given to the attainment of each goal).
| 1. | Goal: Environmental, Health, Safety & Sustainability, or EHS&S, goals, including: |
| • | A continued strong safety record at Rentech’s facilities, including our facilities, with an OSHA recordable rate below a target rate of 3.5 and fewer than 6.0 reportable environmental release events.* |
Result: Goal not attained. Safety performance was strong during 2014 with an OSHA recordable rate of 2.94 recordable incidents for every 200,000 hours worked at Rentech facilities in fiscal year 2014; however, Rentech experienced 6 reportable environmental release events.
117
Table of Contents
| • | Completion of mandated EHS&S training.* |
Result: Goal attained. We completed all required training.
| • | Completion of 80% or more of EHS&S process review action items.* |
Result: Goal attained. We completed required process review action items.
| * | These Goals are not weighted in arriving at the initial award amounts under the annual incentive program, but failure to attain these Goals can result in a reduction of the final pool by up to 20%. |
| 2. | Goal: Operations goals, including: |
| • | Total ammonia production ranging from 350,000 tons to 380,000 tons, targeted at 370,000 tons (5% weight). |
Result: Goal not attained. Total ammonia production for the fiscal year ending December 31, 2014 equaled 327,000 tons.
| • | Total ammonium sulfate production ranging from 640,000 tons to 695,000 tons, targeted at 675,000 tons (5% weight). |
Result: Goal not attained. Total ammonium sulfate production for the fiscal year ending December 31, 2014 equaled 522,000 tons.
| 3. | Goal: Financial achievements, including: |
| • | RNP EBITDA ranging from $100.0 million to $128.0 million, targeted at $102.0 million (10% weight). |
Result: Goal not attained. RNP EBITDA for the year ended December 31, 2014 equaled $65.0 million.
| • | EBITDA for Rentech’s wood fibre business ranging from $16.0 million to $23.0 million, targeted at $17.0 million (5% weight). |
Result: Goal not attained. EBITDA for Rentech’s wood fibre business for the year ended December 31, 2014 equaled $3.0 million.
| • | Unallocated Rentech corporate S,G&A expense ranging from $21.0 million to $24.6 million (5% weight). |
Result: Goal not attained. Unallocated Rentech S,G&A expense for the year ended December 31, 2014 equaled $25.0 million.
| • | Raise capital for Rentech’s wood fibre business ranging from $60.0 million to $70.0 million, targeted at $65.0 million (5% weight). |
Result: Goal attained. Capital of $100.0 million was raised for Rentech’s wood fibre business during the year ended December 31, 2014.
| 4. | Goal: Technology achievements, including: |
| • | Close deal to sell Rentech’s alternative energy technologies in a timeframe that results in the achievement of certain EBITDA targets, and the completion of certain milestones towards the first performance payment (5% weight). |
Result: Goal not attained. Rentech’s alternative energy technologies were sold, but EBITDA targets and performance milestones were not achieved.
| 5. | Goal: Rentech commercial achievements, including: |
| • | Produce wood pellets by summer of 2014 (10% weight). |
Result: Goal not attained. Wood pellets not produced by summer of 2014.
| • | Complete the construction of two wood pellet plants on budget (10% weight). |
Result: Goal not attained. Final construction costs will exceed budget.
| • | Increase production at two wood pellet plants by December 2014 (10% weight). |
Result: Goal not attained. Production was not increased by December 2014.
118
Table of Contents
| • | Complete acquisitions, projects and/or partnerships, including all necessary material definitive agreements, that lead to a wood processing business with a certain annualized run rate (10% weight). |
Result: Goal attained. The Atikokan and Wawa wood pellet plants and the acquisition of New England Wood Pellet, LLC achieved this goal.
| 6. | Goal: Other factors which contribute to the success of Rentech as determined by Rentech’s Compensation Committee and board of directors (20% weight). |
Result: The Compensation Committee did not exercise its discretion to take into account any additional factors which contributed to Rentech’s success or adjust the results of the performance goals.
RNP Annual Incentive Program Performance Goals
The 2014 performance goals applicable to our Non-Shared NEOs (other than Mr. Wallis) under the RNP annual incentive program are set forth below, along with determinations as to the attainment of these goals (parentheticals following the description of each goal provide guidelines indicating the approximate weight given to the attainment of each goal).
| 1. | Goal: EHS&S goals (failure to attain these goals would have reduced the final bonus pool by 20%), including: |
| • | A continued strong safety record at our facilities with an OSHA recordable rate below a target rate of 3.5. |
Result: Goal attained. We completed fiscal year 2014 with an OSHA recordable rate of 2.95 recordable incidents for every 200,000 hours worked at our facilities.
| • | Completion of mandated EHS&S training. |
Result: Goal attained. We completed all required training.
| • | Fewer than 6 reportable environmental release events. |
Result: Goal not attained. We experienced 6 reportable environmental release events.
| • | Completion of 80% or more of EHS&S process review action items. |
Result: Goal attained. We completed required process review action items.
| 2. | Goal: Operations goals, including: |
| • | Total ammonia production ranging from 350,000 tons to 380,000 tons, targeted at 370,000 tons (10% weight). |
Result: Goal not attained. Total ammonia production for the fiscal year ending December 31, 2014 equaled 327,000 tons.
| • | Total ammonia upgraded in amounts ranging from 160,000 tons to 175,000 tons, targeted at 170,000 tons (5% weight). |
Result: Goal not attained. Total ammonia upgraded for the fiscal year ending December 31, 2014 equaled 145,000 tons.
| • | Total ammonium sulfate production ranging from 640,000 tons to 695,000 tons, targeted at 675,000 tons (10% weight). |
Result: Goal not attained. Total ammonium sulfate production for the fiscal year ending December 31, 2014 equaled 522,000 tons.
| • | Total sulfuric acid production ranging from 535,000 tons to 585,000 tons, targeted at 565,000 tons (5% weight). |
Result: Goal not attained. Total sulfuric acid production for the fiscal year ending December 31, 2014 equaled 445,000 tons.
| 3. | Goal: Financial goals, including: |
| • | East Dubuque Facility EBITDA ranging from $90.0 million to $115.0 million, targeted at $100.0 million (15% weight). |
Result: Goal not attained. EBITDA for fiscal year 2014 equaled $89.8 million.
| • | Pasadena Facility EBITDA ranging from $10.0 million to $13.0 million, targeted at $11.0 million (10% weight). |
Result: Goal not attained. EBITDA for fiscal year 2014 equaled $(12.4) million.
119
Table of Contents
| 4. | Goal: Project expansion goals, including: |
| • | East Dubuque Facility’s ammonia expansion performance test is completed by March 30, 2014 (5% weight). |
Result: Goal attained. The ammonia expansion performance test was completed March 21, 2014.
| • | East Dubuque Facility’s ammonia storage tank is completed by March 30, 2014 (5% weight). |
Result: Goal attained. Project was completed on January 31, 2014.
| • | East Dubuque Facility’s CO2 compressor project is completed by July 31, 2014 and on budget (5% weight). |
Result: Goal not attained. Project on budget, but was not completed until December 2014.
| • | Pasadena Facility’s power generation project is completed on budget, commissioned and generates power in 2014 (10% weight). |
Result: Goal not attained. Project was completed, commissioned and generated power in 2014, but costs exceeded budget.
| 5. | Goal: Other factors which contribute to the success of the Partnership and Rentech, as determined by our board of directors, (20% weight). |
Result: The Compensation Committee did not exercise its discretion to take into account any additional factors which contributed to the Partnership’s and Rentech’s success or adjust the results of the performance goals.
Final incentive payments for our NEOs participating in the annual incentive programs were determined by our board based on Rentech’s and/or our (as applicable) performance compared to the set goals under the applicable programs. Messrs. Cohrs, Diesch and Ambrose received 2014 annual incentive payments equal to 15%, 15% and 18% of their respective target bonuses based on the performance results described above (or 9%, 8% and 7% of their respective base salaries). These payments were determined based on the achievement of the formulaic goals set forth above for each NEO with no bonus adjustment based on individual assessment.
Sales Incentive Program
In light of the continued strong demand for experienced sales and marketing executives in the nitrogen fertilizer industry through 2014, we continued our use of a sales incentive program for Mr. Wallis similar to the program in which Mr. Wallis participated in fiscal year 2013, which linked his annual incentive opportunity with performance factors specifically designed to promote sales and marketing activities advancing sales objectives. We believe that a sales-based incentive program better ties Mr. Wallis’ variable compensation opportunity to his duties and responsibilities. Under the sales incentive program, Mr. Wallis was eligible to receive an incentive payment of up to 100% of his base salary based on the corresponding percentage (up to 100%) at which we attained our budgeted 2014 EBITDA, and Mr. Wallis received an actual incentive payment of $154,068 based on our EBITDA performance.
In addition to Mr. Wallis’ EBITDA-based incentive opportunity, Mr. Wallis was eligible to receive an additional payment of up to 50% of his base salary based on the attainment of the following scorecard of individual performance goals, determined and approved by Mr. Diesch, as well as Rentech’s Senior Vice President, Human Resources (parentheticals following the description of each goal provide guidelines indicating the approximate weight given to the attainment of each goal).
| 1. | Goal: Sign a non-binding term sheet for ammonia feedstock for our Pasadena Facility (10% weight). |
Result: Goal not attained. Term sheet not signed.
| 2. | Goal: Reduce cost of sulfur feedstock for our Pasadena Facility (10% weight). |
Result: Goal attained.
| 3. | Goal: Manage ammonium sulfate inventory to prevent a production curtailment (10% weight). |
Result: Goal not attained. Production of ammonium sulfate was constrained. However, production levels were maintained at the maximum allowable levels throughout the year.
| 4. | Goal: Complete the Australian Quarantine and Inspection Service certification and transact first ammonium sulfate sale to Australia. (10% weight). |
Result: Goal 50% attained. Certification was achieved in fourth quarter of 2014.
| 5. | Goal: Execute ammonia offtake agreement for our East Dubuque Facility with TKI. (10% weight). |
Result: Goal attained.
120
Table of Contents
Mr. Wallis received a payout under his non-EBITDA-based annual incentive at 25% of base salary based on attainment of 50% of these performance objectives. Thus, Mr. Wallis earned a total 2014 annual incentive (combining his sales incentive payment and his individual performance incentive payment) of $209,568.
Discretionary Bonus
In addition to Mr. Ambrose’s annual incentive payment under the RNP annual incentive program, in 2014, we paid Mr. Ambrose a one-time discretionary bonus in an aggregate amount equal to $20,000. This bonus was paid in recognition of Mr. Ambrose’s successful leadership of an effort to repair our East Dubuque Facility after a fire occurred at the plant during the fourth quarter of 2013.
Long-Term Equity Incentive Awards
We believe that senior executives, including our NEOs, should have an ongoing stake in the success of their employer, including, in the case of the Shared NEOs, Rentech, in order to closely align their interests with those of our unitholders and, for our Shared NEOs, Rentech’s shareholders. We further believe that equity awards provide meaningful retention and performance incentives that appropriately encourage our executive officers, including our NEOs, to remain employed with us and, in the case of our Shared NEOs, with Rentech, and to put forth their best efforts and performance at all times. Accordingly, equity incentive awards have historically been a key component of Rentech’s and our compensation program, including during 2014, as these awards have served to align the interests of our NEOs with those of our unitholders and, in the case of our Shared NEOs, Rentech’s shareholders, and to incentivize our NEOs to work toward long-term growth. During 2014, Rentech granted equity awards to our Shared NEOs, excluding Messrs. Ramsbottom and Forman, under its 2009 Incentive Award Plan and we granted equity awards to all of our NEOs, excluding Messrs. Ramsbottom, Forman and Ambrose, under our 2011 Long-Term Incentive Plan. Each of these plans is intended to provide incentives for a broad group of service providers, including employees (both NEOs and other employees), directors and consultants, in each case, who are critical to our success (and, in the case of our Shared NEOs, to the success of Rentech) and to the creation of unitholder/shareholder value.
In December 2014, in connection with Mr. Forman’s commencement of employment with Rentech, Rentech granted Mr. Forman a nonqualified stock option and an award of performance-vesting restricted stock units. These awards were provided as an inducement to Mr. Forman’s commencement of employment with Rentech and were granted outside of Rentech’s 2009 Incentive Award Plan in accordance with applicable stock exchange rules. The aggregate value of Mr. Forman’s 2014 equity awards was above the median of Rentech’s peer group to compensate for his significantly below-median cash compensation levels in a way that promotes alignment of the CEO’s interests with those of shareholders. However, his total compensation remained below the median of the total compensation of peer group CEOs.
During 2014, in order to promote the unit/share ownership, performance and retention goals described above, (i) Rentech granted equity awards to our Shared NEOs (except for Mr. Ramsbottom) comprised of performance-vesting restricted stock units (“PSUs”) and, with respect to Mr. Forman only, nonqualified stock options, and (ii) we granted equity awards to all of our NEOs (except for Messrs. Ramsbottom and Forman) comprised of phantom units (“phantom units”) that are settled in our common units upon vesting and which entitle their holders to dividend and other distribution rights while the phantom units are outstanding (these equity awards are collectively referred to below as the “2014 Awards”). Each PSU and phantom unit confers upon its holder the right to receive one share of Rentech common stock (in the case of PSUs) or one of our common units (in the case of phantom units) without payment of purchase price, thereby delivering the full grant-date value of the underlying shares or units, as well as any post-grant share or unit price appreciation. Awards were granted at the end of 2014 in order to allow the amounts to be calibrated to reflect total unitholder/shareholder return performance during the year and performance versus internal goals.
We note that, in respect of 2014 services, Rentech equity awards were granted only to our Shared NEOs (excluding Mr. Ramsbottom) and only in respect of services provided to Rentech. We include a discussion of these awards here in order to provide a comprehensive discussion of compensation decisions pertaining to our NEOs for the relevant year, but note that the full expense of the Rentech equity awards was borne by Rentech (and, similarly, the full expense of all Partnership equity awards, which are granted solely in respect of services provided to the Partnership, was borne by the Partnership, as reflected in the compensation tables below). Mr. Ramsbottom’s employment terminated before Rentech and the Partnership granted equity awards to their respective executive officers respect of 2014 services. Accordingly, Mr. Ramsbottom did not receive grants of Rentech equity awards in respect of his 2014 services to Rentech or grants of Partnership phantom units in respect of his 2014 service to the Partnership.
Partnership Phantom Units.
The RNP phantom units granted as 2014 Awards vest in substantially equal, annual increments over a period of three years, subject to continued service through the applicable vesting date. Phantom units are tied to time-vesting requirements in order to provide a strong retention incentive to our NEOs through the applicable vesting period. Each phantom unit confers upon its holder the right to receive dividend equivalent payments for dividends declared over the portion of the vesting period during which such
121
Table of Contents
phantom unit is outstanding, payable as and when dividends are paid to unitholders without regard to the vested status of the award. The RNP phantom units granted as 2014 Awards are subject to accelerated vesting only in connection with certain qualifying terminations of employment in connection with a change in control and in the case of death or disability (as described under “—Potential Payments upon Termination or Change-in-Control” below). We believe that the applicable vesting periods provide an important retention incentive, while accelerated vesting (where appropriate) protects executives against forfeiture of their awards in appropriate circumstances and aligns management’s incentives more closely with the interests of our unitholders.
Rentech Options.
The Rentech stock option granted to Mr. Forman in 2014 vests and becomes exercisable with respect to one-fourth of the shares subject thereto on the first anniversary of the vesting commencement date, and with respect to one-forty-eighth of the shares subject thereto on each monthly anniversary of the vesting commencement date thereafter, subject to Mr. Forman’s continued services through the applicable vesting date. The stock option is subject to accelerated vesting upon a termination of Mr. Forman’s employment with Rentech without “cause” or for “good reason’ (each such term as defined in Mr. Forman’s employment agreement with Rentech), in either case, within two years following a change in control of Rentech. Any such accelerated vesting is subject to Mr. Forman’s execution and non-revocation of a general release of claims.
Rentech PSUs.
The Rentech PSUs granted to our Shared NEOs (other than Mr. Ramsbottom) in 2014 require both continued service and the attainment of challenging total shareholder return (TSR) performance criteria as conditions to vesting, thereby providing both retention and enhanced performance incentives. Specifically, the PSUs confer upon the Shared NEOs the right to receive a number of stock-settled PSUs determined based on Rentech’s TSR over a four-year period commencing on December 14, 2014 or, with respect to Mr. Forman, December 9, 2014 (in either case, the “Vesting Commencement Date”). PSUs are subject to threshold vesting upon the attainment of TSR of at least 50% during the performance period, and are forfeited if this threshold TSR level is not attained. Payout of PSUs at target level requires attainment of TSR of at least 100% during the four-year performance period, and PSUs provide for a maximum payout upon TSR attainment of at least 200% during the performance period.
Each PSU also confers upon its holder the right to receive dividend equivalent payments for dividends declared over the portion of the performance period during which such PSU is outstanding, payable only if and when the underlying PSU vests. Rentech’s Compensation Committee determined to grant PSUs that vest based on Rentech’s TSR achievement because it believes that long-term TSR is a key measure of Rentech’s performance for its shareholders.
For purposes of the PSUs, TSR is generally calculated as the per share increase in value equal to the sum of (i) Rentech’s per share stock price increase, with stock price generally calculated as the trailing thirty trading-day stock price average through the date on which TSR is measured (or, if the applicable measurement date is the date on which a change in control of Rentech occurs, the per share change in control transaction proceeds), plus (ii) Rentech’s aggregate per share dividends, in each case, over the performance period (or relevant portion thereof).
Generally, an amount ranging from (i) 0% to 100% of the target PSUs are eligible to vest on the second anniversary of the Vesting Commencement Date and (ii) 0% to 200% of the target PSUs are eligible to vest on each of third and fourth anniversaries of the Vesting Commencement Date and any date on which a change in control occurs prior to the fourth anniversary of the Vesting Commencement Date, in each case, based on Rentech’s per share TSR (and the executive’s continued service) through the applicable anniversary or date on which the change in control occurs (each such date, a “measurement date”). The number of PSUs that actually vest on each measurement date is determined based on Rentech’s per share TSR from the date of grant through the applicable measurement date. With respect to the measurement date occurring on the second anniversary of the Vesting Commencement Date (the “year 2 measurement date”), 100% of the target PSUs will vest upon Rentech’s attainment of per share TSR at the maximum level (e.g., upon the increase of its per share TSR by 200% through the year 2 measurement date), and zero PSUs will vest if per share TSR is attained at less than the maximum level. The table below (the “PSU Vesting Table”) sets forth the percentage of target PSUs that will vest on the measurement dates occurring on the third and fourth anniversaries of the Vesting Commencement Date (the “year 3 measurement date” and “year 4 measurement date,” respectively) at the threshold, target and maximum levels (e.g., upon the increase of our per share TSR by 50%, 100% and 200%, respectively, through the applicable measurement date):
| TSR at Measurement Date |
Percent of Target PSUs Earned and Vested | |
| TSR increase is less than 50%: | Zero PSUs | |
| TSR increase equals or exceeds 50%: | 50% of Target PSUs | |
| TSR increase equals or exceeds 100%: | 100% of Target PSUs | |
| TSR increase equals or exceeds 200%: | 200% of Target PSUs |
122
Table of Contents
If Rentech achieves an increase in per share TSR between the achievement levels specified in the above table, then the number of PSUs that will vest on the applicable measurement date will be determined based on straight-line interpolation between the applicable attainment levels.
PSUs will be paid to our Shared NEOs in shares of Rentech stock as and when they are earned and vest, subject to the executive’s continued service through the applicable measurement date. Dividend equivalents that become payable with respect to earned and vested PSUs will generally be paid in cash upon or shortly after vesting of the underlying PSU to which such dividend equivalents relate (only if and when the underlying PSU ultimately vests).
2014 Awards Table
In determining appropriate levels of equity grants for the 2014 Awards, we considered, among other things, the role(s) and responsibilities of each NEO and the perceived need to reward and retain the NEO. The following table sets forth the 2014 Awards that we and Rentech granted to our NEOs during 2014:
| Officer | Grant Date | Rentech Restricted Stock Units (RSUs) |
Rentech Performance Stock Units (PSUs)(1) |
Rentech Stock Options | Partnership Phantom Units | |||||||||||||||
| Keith B. Forman |
12/30/14 | — | 1,008,265 | 1,102,491 | — | |||||||||||||||
| D. Hunt Ramsbottom |
— | — | — | — | — | |||||||||||||||
| Dan J. Cohrs |
12/19/14 | — | 300,297 | — | — | |||||||||||||||
| 12/30/14 | — | — | — | 7,554 | ||||||||||||||||
| John H. Diesch |
12/30/14 | — | — | — | 23,242 | |||||||||||||||
| John A. Ambrose |
— | — | — | — | — | |||||||||||||||
| Marc E. Wallis |
12/30/14 | — | — | — | 6,364 | |||||||||||||||
| (1) | Performance stock units reflect target amounts. |
Severance Benefits
We believe that vulnerability to termination of employment at the senior executive level, both within and outside of the change in control context, creates concern and uncertainty for our NEOs that is appropriately addressed by providing severance protections which enable and encourage these executives to focus their attention on their work duties and responsibilities in all situations. We operate in a highly volatile and acquisitive industry that heightens this vulnerability in the change-in-control context. Accordingly, in order to attract and retain our key managerial talent, Rentech (in the case of our Shared NEOs) and our general partner (in the case of our Non-Shared NEOs) are parties to employment agreements with our NEOs which provide for specified severance payments and benefits in connection with certain qualifying terminations of employment. The principles underlying the various components of these agreements are discussed in this section. For a description of the specific terms and conditions of each agreement, see “—Narrative Disclosure to Summary Compensation Table and Grants of Plan-Based Awards Table” and “—Potential Payments upon Termination or Change-in-Control” below.
Shared NEOs
Under their employment agreements, our Shared NEOs are (and Mr. Ramsbottom was, during his employment with Rentech) entitled to severance upon involuntary terminations without “cause” or for “good reason” (each as defined in the applicable employment agreement) consisting of (i) three times (in the case of Mr. Ramsbottom) or one time (in the case of Mr. Cohrs) base salary, or in the case of Mr. Forman, the greater of two years of base salary or $1.0 million (unless such termination occurs on or prior to June 9, 2015, in which case such amount shall instead equal $400,000) payable over a two-year period (or, in the case of Mr. Cohrs, a one-year period) (ii) in the case of Mr. Cohrs, payment of target bonus and (iii) up to eighteen months of subsidized healthcare premiums, in addition to certain accelerated equity vesting under the terms of individual equity awards. In the case of an involuntary termination of employment in connection with our non-renewal of the agreement, Mr. Ramsbottom was entitled to the same severance, Mr. Forman is not entitled to severance, and Mr. Cohrs is entitled to a reduced severance consisting of only the salary continuation described above (but not payment of the target bonus or subsidized healthcare continuation) and, at Rentech’s discretion, an annual bonus for the fiscal year preceding the non-renewal. We believe that, in light of these NEOs’ seniority and the resulting vulnerability to involuntary termination, these severance payments and benefits provide an appropriate level of assurance in the non-transactional context. The specific levels of payments and benefits are determined by the relative seniority and duration of service of the NEOs.
In addition, if our Shared NEOs are involuntarily terminated (without cause, for good reason or, with respect to Messrs. Ramsbottom and Cohrs only, due to non-renewal) in connection with a change in control, these NEOs are entitled to receive their cash
123
Table of Contents
severance in a lump-sum and Mr. Cohrs is further eligible for a severance enhancement equal to the amounts by which their respective prior-year bonuses exceed their then-current target bonuses We believe that the lump-sum payment is appropriate to limit the NEOs’ exposure to any credit risk associated with new owners/management and that the potential enhancement provides an appropriate additional incentive to focus on the best interests of the shareholders in the context of a potential transaction. These NEOs are also entitled to a tax gross-up payment in the event that any “golden parachute” excise taxes are imposed on them under Section 280G of the Internal Revenue Code in connection with a transaction. The gross-up payments are provided under employment agreements that were not amended or entered into during 2014, and are intended to counter any disincentive the NEOs may have to consummate a beneficial transaction as a result of the potential imposition of these golden parachute excise taxes.
Non-Shared NEOs
Under their employment agreements, Messrs. Diesch, Ambrose and Wallis are entitled to severance payments and benefits upon an involuntary termination without “cause” or for “good reason” (each as defined in the applicable employment agreement). These severance benefits are comprised of continuation salary payments for one year and payment of the executive’s target bonus for the year, in addition to up to eighteen months (in the case of Mr. Diesch) or one year (in the case of the other Non-Shared NEOs) of subsidized healthcare premiums. In the case of an involuntary termination of employment in connection with our non-renewal of the applicable agreement, Messrs. Diesch, Ambrose and Wallis are entitled to a reduced severance consisting of only the salary continuation described above (but not payment of the target bonus or subsidized healthcare continuation) and, at our discretion, an annual bonus for the fiscal year preceding the non-renewal.
In addition, if Mr. Diesch is involuntarily terminated (without cause, for good reason or due to non-renewal) in connection with a change in control, he is entitled to receive his cash severance in a lump-sum and is further eligible for a severance enhancement equal to the amounts by which his prior-year bonus exceeds his then-current target bonus. Mr. Diesch is also entitled to a tax gross-up payment in the event that any “golden parachute” excise taxes are imposed on him under Section 280G of the Internal Revenue Code in connection with a transaction. The gross-up payment provided under Mr. Diesch’s employment agreement was originally entered into with Rentech in 2009, was not materially amended or entered into during 2014, and is intended to counter any disincentive that he may have to consummate a beneficial transaction as a result of the potential imposition of these golden parachute excise taxes.
Benefits and Perquisites
Rentech maintains a standard complement of health and retirement benefit plans for our employees, including our NEOs, that provide medical, dental, and vision benefits, flexible spending accounts, a 401(k) savings plan (including an employer-match component), short-term and long-term disability insurance, accidental death and dismemberment insurance and life insurance coverage. These benefits are generally provided to our NEOs on the same terms and conditions as they are provided to our other non-union employees.
We believe that these health and retirement benefits comprise key elements of a comprehensive compensation program. Our health benefits help provide stability and peace of mind to our NEOs, thus enabling them to better focus on their work responsibilities, while our 401(k) plan provides a vehicle for tax-preferred retirement savings with additional compensation in the form of an employer match that adds to the overall desirability of our executive compensation package. Our employee benefits programs are designed to be affordable and competitive in relation to the market, as well as compliant with applicable laws and practices. We periodically review and adjust these employee benefits programs as needed based upon regular monitoring of applicable laws and practices in the competitive market.
During 2014, Messrs. Ramsbottom and Cohrs received reimbursement of certain financial advisor costs, and Messrs. Ramsbottom, Cohrs, Diesch and Ambrose received a monthly car allowance. Mr. Wallis has access to a company-provided car intended primarily for business use, but Mr. Wallis may make use of this car for certain personal matters as well. While we believe that these benefits are appropriate and commensurate with these NEOs’ positions, we do not generally view perquisites or other personal benefits as a material component of our executive compensation program. In the future, we may provide additional or different perquisites or other personal benefits in limited circumstances, such as where we believe doing so is appropriate to assist an individual in the performance of his or her duties, to make our executive officers more efficient and effective, and for recruitment, motivation and/or retention purposes.
Tax and Accounting Considerations
Section 280G of the Internal Revenue Code
Section 280G of the Internal Revenue Code disallows a tax deduction with respect to excess parachute payments to certain executives of companies which undergo a change in control. In addition, Section 4999 of the Internal Revenue Code imposes a 20% excise tax on the individual with respect to the excess parachute payment. Parachute payments are compensation linked to or triggered
124
Table of Contents
by a change in control and may include, but are not limited to, bonus payments, severance payments, certain fringe benefits, and payments and acceleration of vesting from long-term incentive plans including stock options and other equity-based compensation. Excess parachute payments are parachute payments that exceed a threshold determined under Section 280G of the Internal Revenue Code based on the executive’s prior compensation. In approving compensation arrangements for our NEOs in the future, we expect to consider all elements of the cost of providing such compensation, including the potential impact of Section 280G of the Internal Revenue Code. However, we may authorize compensation arrangements that could give rise to loss of deductibility under Section 280G of the Internal Revenue Code and the imposition of excise taxes under Section 4999 of the Internal Revenue Code if we feel that such arrangements are appropriate to attract and retain executive talent.
Under their employment agreements with Rentech or, in the case of Mr. Diesch, RNP, Messrs. Cohrs and Diesch are and Mr. Ramsbottom was (prior to his termination of employment) entitled to gross-up payments in the event that any excise taxes are imposed on them. Rentech has historically provided these protections to its senior executives (including, at the time such employment agreements were entered into, Mr. Diesch) to ensure that they will be properly incentivized in the event of a potential change in control of Rentech to maximize shareholder value in a transaction while minimizing concern for potential consequences of the transaction to these executives. The need for such protection is enhanced by Rentech’s and our emphasis on performance-based equity compensation, which has higher values if accelerated in connection with a successful change in control transaction than if the equity compensation awards had been time-vested. We have committed not to provide any new tax gross-up rights to any executives that do not currently have such protection.
Section 409A of the Internal Revenue Code
Section 409A of the Internal Revenue Code requires that “nonqualified deferred compensation” be deferred and paid under plans or arrangements that satisfy the requirements of the statute with respect to the timing of deferral elections, timing of payments and certain other matters. Failure to satisfy these requirements can expose employees and other service providers to accelerated income tax liabilities, substantial additional taxes and interest on their vested compensation under such plans. Accordingly, as a general matter, it is our intention to design and administer our compensation and benefit plans and arrangements for all of our employees and other service providers, including our NEOs, so that they are either exempt from, or satisfy the requirements of, Section 409A of the Internal Revenue Code.
Accounting for Stock-Based and Unit-Based Compensation
We have followed Financial Accounting Standards Board Accounting Standards Codification Topic 718, or ASC Topic 718, in accounting for stock-based and unit-based compensation awards. ASC Topic 718 requires companies to calculate the grant date “fair value” of their stock-based and unit based awards using a variety of assumptions. ASC Topic 718 also requires companies to recognize the compensation cost of their stock-based and unit-based awards in their income statements over the period that an employee is required to render service in exchange for the award. We expect that we will regularly consider the accounting implications of significant compensation decisions, especially in connection with decisions that relate to our equity incentive award plans and programs. As accounting standards change, we may revise certain programs to appropriately align accounting expenses of our equity awards with our overall executive compensation philosophy and objectives.
Compensation Report
The board of directors of our general partner does not have a Compensation Committee. The board of directors has reviewed and discussed with management the foregoing Compensation Discussion and Analysis and, based on such review and discussion, the board of directors determined that the Compensation Discussion and Analysis should be included in this report.
Michael S. Burke
John H. Diesch
James F. Dietz
Keith B. Forman
Michael F. Ray
Halbert S. Washburn
Compensation Committee Interlocks and Insider Participation
During fiscal year 2014, the following individuals served as members of Rentech’s Compensation Committee: Michael S. Burke, Edward M. Stern, and Halbert S. Washburn. None of these individuals has ever served as an officer or employee of Rentech or any of its subsidiaries (including our general partner). No executive officer of Rentech or us has served as a director or member of the compensation committee of another entity at which an executive officer of such entity is also a director of Rentech.
125
Table of Contents
Summary Compensation Table
The following table summarizes the compensation that was attributable to services performed for us during the years ending December 31, 2014, 2013 and 2012 for each of our NEOs.
With respect to our Shared NEOs, the non-equity amounts contained in the summary compensation table reflect the portion of these NEOs’ total compensation paid by Rentech that we estimate was attributable to services performed by these NEOs for us during the relevant period, calculated by multiplying each amount by a good faith estimate of the percentage of time such NEO dedicated to such services for us. The estimated percentage of time allocable to us for Messrs. Forman, Ramsbottom and Cohrs are 40%, 45% and 35%, respectively, during year 2014. The estimated percentage of time allocable to us for Messrs. Ramsbottom, Cohrs and Diesch are 48%, 35% and 79% respectively, during year 2013 (or, for Mr. Diesch, who served as a Shared NEO through December 30, 2013, the portion of 2013 during which he served as a Shared NEO), and the estimated percentage of time allocable to us for Messrs. Ramsbottom and Cohrs are 50% and 37%, respectively, during the year 2012. Our Non-Shared NEOs devoted substantially all of their business time to us during the relevant periods.
Beginning in 2012, Messrs. Ambrose and Wallis received only Partnership equity awards, while our Shared NEOs received both Rentech equity awards (for service to Rentech) and Partnership equity incentive awards (for service to us). Beginning in 2013, Mr. Diesch received only Partnership equity awards. For tables (or portions thereof) specific to compensation, only the values of Partnership equity awards are included, as no portion of any Rentech equity awards were paid in respect of services to us in these periods.
The values of Rentech equity awards and cash compensation paid to our Shared NEOs by, and allocated to, Rentech, are disclosed in the footnotes to the tables.
| Name and Principal Position |
Year | Salary ($) |
Bonus ($)(1) |
Stock Awards ($)(2) |
Option Awards ($)(3) |
Non- Equity Incentive Plan Compensation ($)(4) |
All Other Compensation ($)(5) |
Total ($) |
||||||||||||||||||||||
| Keith B. Forman, |
2014 | 4,615 | — | — | — | — | 127,753 | 132,368 | ||||||||||||||||||||||
| D. Hunt Ramsbottom, |
2014 | 290,769 | — | — | — | — | 30,371 | 321,140 | ||||||||||||||||||||||
| 2013 | 264,000 | — | 239,993 | — | 211,200 | 161,475 | 876,668 | |||||||||||||||||||||||
| 2012 | 248,600 | — | 210,000 | — | 466,125 | 194,877 | 1,119,602 | |||||||||||||||||||||||
| Dan J. Cohrs, |
2014 | 162,212 | — | 74,331 | — | 14,616 | 20,729 | 271,888 | ||||||||||||||||||||||
| 2013 | 157,500 | — | 130,004 | — | 75,600 | 86,824 | 449,928 | |||||||||||||||||||||||
| 2012 | 157,833 | — | 90,000 | — | 177,562 | 119,369 | 544,764 | |||||||||||||||||||||||
| John H. Diesch, President (10) |
2014 | 334,615 | — | 228,701 | — | 25,125 | 34,322 | 622,763 | ||||||||||||||||||||||
| 2013 | 256,750 | — | 399,995 | — | 77,025 | 78,782 | 812,552 | |||||||||||||||||||||||
| John A. Ambrose, |
2014 | 257,692 | 20,000 | — | — | 18,576 | 26,067 | 322,335 | ||||||||||||||||||||||
| 2013 | 250,000 | — | 69,993 | — | 55,000 | 56,852 | 431,845 | |||||||||||||||||||||||
| 2012 | 217,661 | — | 105,000 | — | 153,450 | 85,881 | 561,992 | |||||||||||||||||||||||
| Marc E. Wallis, |
2014 | 221,731 | — | 62,622 | — | 209,568 | 13,488 | 507,409 | ||||||||||||||||||||||
| 2013 | 215,000 | — | 69,993 | — | 176,300 | 33,784 | 495,077 | |||||||||||||||||||||||
| 2012 | 195,615 | — | 70,013 | — | 342,300 | 58,195 | 666,123 | |||||||||||||||||||||||
| (1) | Amount represents a one-time payment to Mr. Ambrose for successfully leading an effort to repair our East Dubuque Facility after a fire occurred at the plant. For additional information, please see “—Annual Incentive Compensation” above. |
| (2) | Amounts disclosed for 2014 reflect the full grant-date fair value of 2014 Partnership phantom unit awards granted to our Non-Shared NEOs. In addition to the reported Partnership awards, Mr. Forman received 2014 Rentech PSUs with a full grant-date fair value of $1,260,331, and Mr. Cohrs received 2014 Rentech PSUs with a full grant-date fair value of $366,362. All equity award values described in this Note have been computed in accordance with ASC Topic 718, rather than the amounts paid to or realized by the named individual. There can be no assurance that unvested awards will vest (and, absent vesting, no value will |
126
Table of Contents
| be realized by the executive for the unvested award). The Partnership provides information regarding the assumptions used to calculate the value of all Partnership unit awards made to executive officers in Note 12 to its consolidated financial statements included in “Part II — Item 8 Financial Statements and Supplementary Data” in this Annual Report. Rentech provides information regarding the assumptions used to calculate the value of all Rentech stock awards made to executive officers in Note 18 to its consolidated financial statements included in “Part II — Item 8 Financial Statements and Supplementary Data” in Rentech’s Form 10-K, filed March 16, 2015. |
| (3) | Mr. Forman received 2014 Rentech stock options with full grant-date fair values of $582,115, the value of which has been computed in accordance with ASC Topic 718. Rentech provides information regarding the assumptions used to calculate the value of all Rentech options granted to executive officers in Note 18 to its consolidated financial statements included in “Part II — Item 8. Financial Statements and Supplementary Data” in Rentech’s Form 10-K, filed March 16, 2015. |
| (4) | Each of our Shared NEOs (excluding Mr. Forman) participated in the Rentech annual incentive program and each of our Non-Shared NEOs (excluding Mr. Wallis) participated in the RNP annual incentive program during 2014 and each such NEO (excluding Mr. Ramsbottom, whose employment terminated in December 2014) received an annual incentive award based on the achievement of certain financial and other performance criteria and determined by reference to target bonuses as set forth in their respective employment agreements. Mr. Wallis participated in our 2014 sales incentive program and received an annual incentive award based on the attainment of sales and marketing goals. For 2014, the amount of compensation payable under the annual and sales incentive programs was determined (i) for Messrs. Cohrs, Diesch and Ambrose at 15%, 15% and 18% of their respective target levels (or 9%,8% and 7% of their respective base salaries) and (ii) for Mr. Wallis in an amount equal to 94% of his base salary. For Mr. Cohrs, disclosed amounts were pro-rated as described in Notes 8 and 9 below – the full amount of Mr. Cohrs 2014 incentive awards (including the portions reported in the table) was $41,760. For a description of the annual incentive programs in which our NEOs participated during 2014, please see “—Annual Incentive Compensation” above. |
| (5) | Amounts under the “All Other Compensation” column for the year ended December 31, 2014 consist of (i) in the case of Mr. Forman, director fees earned while serving on our board prior to his employment with Rentech, including: (A) cash director fees equal to $47,250; (B) an award of 1,490 Partnership phantom units with a grant-date fair value of $26,895; and (C) an award of 2,970 Partnership common units with a grant-date fair value of $53,608, (ii) 401(k) matching contributions for Messrs. Ramsbottom, Cohrs, Diesch, Ambrose and Wallis of $3,956, $3,620, $12,262, $9,975 and $8,759, respectively, (iii) perquisites consisting of company-paid auto allowances, company-paid health evaluations, financial and tax planning benefits and long-term disability insurance, and (iv) payments made to Messrs. Ramsbottom, Cohrs, Diesch, Ambrose and Wallis of $8,364, $4,845, $8,992, $3,024 and $2,548, respectively, with respect to their outstanding phantom units as a result of our declaration of cash distributions. For Messrs. Ramsbottom and Cohrs, disclosed amounts (in both the table above and the Perquisites table below) were pro-rated as described in Notes 8 and 9 below – the full amounts of their 2014 “All Other Compensation” (including the portions reported in the table) were $57,269 and $50,233, respectively. The grant-date fair values of the phantom units and common units awarded to Mr. Forman during 2014 were computed in accordance with ASC Topic 718. The Partnership provides information regarding the assumptions used to calculate the value of all Partnership unit awards made to executive officers in Note 12 to its consolidated financial statements included in “Part II — Item 8. Financial Statements and Supplementary Data” in this Annual Report. The following table identifies and quantifies the perquisites provided to our Named Executive Officers during 2014. |
Perquisites
| Name | Auto Allowance |
Health Evaluations |
Long- Term Disability |
Life Insurance | Financial and Tax Planning |
Tax Gross-up Payment |
Total | |||||||||||||||||||||
| Keith B. Forman |
— | — | — | — | — | — | — | |||||||||||||||||||||
| D. Hunt Ramsbottom |
6,231 | 1,463 | 166 | 296 | 9,895 | — | 18,051 | |||||||||||||||||||||
| Dan J. Cohrs |
4,200 | — | 134 | 239 | 7,691 | — | 12,264 | |||||||||||||||||||||
| John H. Diesch |
12,000 | — | 384 | 684 | — | — | 13,068 | |||||||||||||||||||||
| John A. Ambrose |
12,000 | — | 384 | 684 | — | — | 13,068 | |||||||||||||||||||||
| Marc E. Wallis |
1,113 | (A) | — | 384 | 684 | — | — | 2,181 | ||||||||||||||||||||
| (A) | Represents the value of personal usage of a company-provided vehicle determined by multiplying 20% (the percentage of time that we estimate Mr. Wallis used the vehicle for personal purposes) by $5,565 (the total company costs associated with the vehicle). |
| (6) | Mr. Forman was appointed as chief executive officer and president of Rentech and chief executive officer of our general partner effective December 9, 2014. |
| (7) | Effective December 9, 2014, Mr. Ramsbottom ceased to serve as the chief executive officer and president of Rentech and chief executive officer of our general partner. Mr. Ramsbottom also resigned as a member of the board of directors for both companies, effective December 9, 2014. |
127
Table of Contents
| (8) | We estimate that Mr. Ramsbottom dedicated 45%, 48% and 50% of his work time to our business and affairs during years 2014, 2013 and 2012, respectively, and, accordingly, the compensation figures attributable to Mr. Ramsbottom in this Summary Compensation Table reflect 45%, 48% and 50% of his total compensation for each category, except that 100% of the grant-date fair value of the Partnership phantom units is included in the “Stock Awards” column because the Partnership phantom units were made in respect of services performed solely for us. Mr. Ramsbottom’s “Total Compensation” for years 2014, 2013 and 2012, including amounts paid for services provided to Rentech and its affiliates, equaled $703,423, $2,473,791 and $3,115,429, respectively. |
| (9) | We estimate that Mr. Cohrs dedicated 35%, 35% and 37% of his work time to our business and affairs during years 2014, 2013 and 2012, respectively, and, accordingly, the compensation figures attributable to Mr. Cohrs in this Summary Compensation Table reflect 35%, 35% and 37% of his total compensation for each category, except that 100% of the grant-date fair value of the Partnership phantom units is included in the “Stock Awards” column because the Partnership phantom units were made in respect of services performed solely for us. Mr. Cohrs’ “Total Compensation” for years 2014, 2013 and 2012, including amounts paid for services provided to Rentech and its affiliates, equaled $996,149, $1,495,694 and $1,707,087, respectively. |
| (10) | We estimate that Mr. Diesch dedicated 79% of his work time to our business and affairs during year 2013 (based on his role as a Shared NEO through December 30, 2013 and as a Non-Shared NEO for the remainder of 2013), and, accordingly, the compensation figures attributable to Mr. Diesch in this Summary Compensation Table reflect 79% of his total compensation for each category, except that 100% of the grant-date fair value of the Partnership phantom units is included in the “Stock Awards” column because the Partnership phantom units were made in respect of services performed solely for us. |
| (11) | Mr. Ambrose retired effective January 9, 2015. |
Grants of Plan-Based Awards
The following table sets forth information with respect to the NEOs concerning the grant of plan-based awards from the Partnership’s plan during 2014. With respect to our Shared NEOs, the non-equity incentive amounts set forth below reflect the portion of these NEOs’ plan-based awards that we estimate was attributable to services performed by these NEOs for us during the year 2014, calculated in the same manner as amounts disclosed for these Shared NEOs in the Summary Compensation Table. As noted above, during 2014, Partnership equity awards granted to our NEOs (including our Shared NEOs) were made entirely in respect of services (and were thus allocated in their entirety) to the Partnership, and Rentech equity awards (granted only to Messrs. Forman and Cohrs) were made entirely in respect of services (and were thus allocated in their entirety) to Rentech – accordingly, the table below does not include 2014 grants of Rentech equity awards; however, the value of 2014 Rentech equity awards granted to Messrs. Forman and Cohrs is disclosed in the notes to the table.
| Name |
Estimated Possible Payouts Under Non-Equity Incentive Plan Awards |
Estimated Future Payouts Under Equity Incentive Plan Awards |
All Other Stock Awards: Number of Shares of Stock |
All Other Option Awards: Number of Securities Underlying |
Exercise or Base Price of Option |
Grant Date Fair Value of Stock and Option |
||||||||||||||||||||||||||||||||||||
| Grant Date |
Threshold ($) |
Target ($) |
Maximum ($) |
Threshold (#) |
Target (#) |
Maximum (#) |
or Units (#)(1) |
Options (#)(1) |
Awards ($/Sh) |
Awards ($)(1) |
||||||||||||||||||||||||||||||||
| Keith B. Forman (5) |
07/01/2014 | $ | — | $ | — | $ | — | — | — | — | 2,970 | (2) | — | — | $ | 53,608 | ||||||||||||||||||||||||||
| 07/01/2014 | $ | — | $ | — | $ | — | — | — | — | 1,490 | (3) | — | — | $ | 26,895 | |||||||||||||||||||||||||||
| D. Hunt Ramsbottom |
2014 Annual Non-Equity Incentive |
$ | — | $ | 292,500 | $ | 585,000 | — | — | — | — | — | — | — | ||||||||||||||||||||||||||||
| Dan J. Cohrs |
12/30/2014 |
— | — | — | — | — | — | 7,554 | (4) | — | — | $ | 74,331 | |||||||||||||||||||||||||||||
| 2014 Annual Non- Equity Incentive |
$ | — | $ | 97,440 | $ | 194,880 | — | — | — | — | — | — | — | |||||||||||||||||||||||||||||
| John H. Diesch |
12/30/2014 |
— | — | — | — | — | — | 23,242 | (4) | — | — | $ | 228,701 | |||||||||||||||||||||||||||||
| 2014 Annual Non- Equity Incentive |
$ | — | $ | 167,500 | $ | 335,000 | — | — | — | — | — | — | — | |||||||||||||||||||||||||||||
| John A. Ambrose |
2014 Annual Non- Equity Incentive |
$ | — | $ | 103,200 | $ | 206,400 | — | — | — | — | — | — | — | ||||||||||||||||||||||||||||
| Marc E. Wallis |
12/30/2014 |
— | — | — | — | — | — | 6,364 | (4) | — | — | $ | 62,622 | |||||||||||||||||||||||||||||
| 2014 Annual Non- Equity Incentive |
$ | — | $ | 222,000 | $ | 333,000 | — | — | — | — | — | — | — | |||||||||||||||||||||||||||||
| (1) | All of our equity grant awards were made under the Rentech Nitrogen Partners, L.P. 2011 Long-Term Incentive Plan. In addition to the awards disclosed in this table, Messrs. Forman and Cohrs received 2014 grants of equity incentive awards from Rentech in respect of services provided to Rentech with grant-date fair values of $1,842,446 and $366,362, respectively, which are disclosed |
| (2) | These Partnership phantom units were granted and vested on July 1, 2014. |
| (3) | These Partnership phantom units were granted on July 1, 2014 and vest on the one-year anniversary of the grant date. |
128
Table of Contents
| in the 2014 Awards Table. Amounts disclosed in the table reflect the full grant date fair value of Partnership phantom units granted during fiscal year 2014, computed in accordance with ASC Topic 718, rather than the amounts paid to or realized by the named individual. We provide information regarding the assumptions used to calculate the fair value of all compensatory equity awards made to executive officers in Note 12 to our consolidated financial statements in Part II — Item 8 “Financial Statements and Supplementary Data” included in this report. There can be no assurance that awards will vest (and, absent vesting no value will be realized by the executive for the unvested award), or that the value upon vesting will approximate the aggregate grant date fair value determined under ASC Topic 718. |
| (4) | These Partnership phantom units were granted on December 30, 2014 and vest in three substantially equal installments on December 14, 2015, 2016 and 2017, subject to the executive’s continued employment through the applicable vesting date and accelerated vesting (i) upon the executive’s termination of employment by the employer without cause or by the executive for good reason, in either case, in connection with a change of control of the Partnership or (ii) upon the executive’s death or disability. |
| (5) | Mr. Forman commenced employment with us in December 2014. Accordingly, he was not eligible to participate in Rentech’s or our 2014 annual incentive plan. Mr. Forman received 2014 grants of equity incentive awards from Rentech in respect of services provided to Rentech, as described in more detail in Note 1 above. |
Narrative Disclosure to Summary Compensation Table
and Grants of Plan-Based Awards Table
Employment Agreements
The employment arrangements with our NEOs (including our Shared NEOs and Non-Shared NEOs) are all “at will” and may be terminated at any time by us, subject to the severance provisions thereof.
Employment Agreements with Shared NEOs
Each of Messrs. Forman and Cohrs are and Mr. Ramsbottom was, during his employment with Rentech, party to an employment agreement with Rentech. Mr. Forman’s employment agreement does not have a set term. Mr. Cohrs’ employment agreement expires on October 22, 2015, subject to automatic one-year renewals absent 90-days’ advance notice from either party to the contrary. Mr. Ramsbottom’s employment agreement terminated in December 2014, after Mr. Ramsbottom ceased to serve as the chief executive officer and president of Rentech and as the chief executive officer of our general partner.
Under their employment agreements, Messrs. Forman and Cohrs are entitled, respectively, to (i) base salaries which, effective as of January 1, 2015, were $200,000 and $464,000, and (ii) in Mr. Cohrs case, an annual incentive bonus targeted at 60% of his base salary (with actual bonus eligibility ranging from zero to twice the applicable target). Mr. Ramsbottom’s employment agreement provided for a base salary which, during 2014, was $650,000 and an annual incentive bonus targeted at 100% of his base salary (with actual bonus eligibility ranging from zero to twice the applicable target).
In addition, the employment agreements provide for customary indemnification, health, welfare, retirement and vacation benefits and, in the case of Messrs. Ramsbottom and Cohrs, a monthly auto allowance. The Shared NEOs, excluding Mr. Forman, also receive reimbursement of certain financial and tax planning costs (although only Mr. Ramsbottom’s employment agreement expressly provided for such benefits, Rentech reimburses these costs for each Shared NEO). The agreements also contain customary confidentiality and other restrictive covenants. Each of the Shared NEOs has executed a corporate confidentiality and proprietary rights agreement. Though not addressed in the employment agreements, each of the NEOs is entitled to accelerated vesting of certain equity awards in the event of a change in control of Rentech. For a discussion of the severance and change-in-control benefits for which our Shared NEOs are eligible under their employment agreements, as well as a description of the severance benefits for which our Non-Shared NEOs are eligible in connection with a change in control, see “—Potential Payments upon Termination or Change-in-Control” below.
Employment Agreements with Non-Shared NEOs
Messrs. Diesch, Ambrose and Wallis are parties to employment agreements with our general partner that expire on November 3, 2015, October 15, 2015 and October 16, 2015, respectively, subject to automatic one-year renewals absent 30-days’ (or, in the case of Mr. Diesch, 90 days’) advance notice from either party to the contrary. Under their employment agreements, Messrs. Diesch, Ambrose and Wallis receive annual base salaries which, effective as of January 1, 2015, were $335,000, $258,000 and $222,000, respectively.
129
Table of Contents
In addition, these agreements provide that Messrs. Diesch and Ambrose will be eligible to receive annual cash bonuses targeted at 50% and 40% of base salary, respectively (and capped at 100% and 80% of base salary, respectively), while Mr. Wallis will be eligible to receive a non-targeted annual bonus of up to 150% of base salary, in each case, based on the attainment of performance criteria established by our general partner’s board of directors.
Under their employment agreements, our Non-Shared NEOs are entitled to severance upon a termination of employment without “cause” or for “good reason” (each as defined in the applicable agreement) consisting of (i) one year of base salary continuation, (ii) payment of the executive’s target bonus for the year in which termination occurs (or, in the case of Mr. Wallis who does not have a target bonus, payment of an additional amount equal to 100% of his base salary), and (iii) up to eighteen months (in the case of Mr. Diesch) or twelve months (in the case of Messrs. Ambrose and Wallis) of subsidized healthcare premiums. In addition, if our general partner elects not to renew the employment term, the affected executive is entitled to a reduced severance consisting solely of one year of base salary continuation.
Under the terms of their employment agreements, our Non-Shared NEOs are eligible to participate in our customary retirement, health, welfare, disability and other benefit plans. In addition, the employment agreements contain customary non-solicitation (and, in the case of Messrs. Ambrose and Wallis, non-competition) covenants effective during employment and for one year following termination.
Outstanding Equity Awards at December 31, 2014
The following table sets forth information with respect to the NEOs detailing outstanding equity awards from Rentech and the Partnership as of December 31, 2014. With respect to our Shared NEOs, the amounts set forth below reflect the total number of each NEO’s outstanding equity awards as of December 31, 2014 rather than an allocation based on the estimated percentage of time each Shared NEO dedicated to services for the Partnership or based on the entity issuing the award due to the fact that outstanding awards include prior year awards, part of which were allocable to services provided to the Partnership. In addition to the vesting schedules described for each outstanding award in the notes to this table, certain awards may be eligible for accelerated vesting in certain circumstances (for a discussion of accelerated equity vesting, see “—Potential Payments upon Termination or Change-in-Control” below).
| Option Awards | Stock Awards | |||||||||||||||||||||||||||||||||||||
| Name |
Number of Securities Underlying Unexercised Options (#) Exercisable |
Number of Securities Underlying Unexercised Options (#) Unexercisable |
Equity Incentive Plan Awards: Number of Securities Underlying Unexercised Unearned Options (#) |
Option Exercise Price ($) |
Option Expiration Date |
Number of Units or Shares of Stock that have not Vested (#) |
Market Value of Units or Shares of Stock that have not Vested ($) (1) |
Equity Incentive Plan Awards: Number of Unearned Shares, Units or Other Rights that have not Vested (#) |
Equity Incentive Plan Awards: Market or Payout Value of Unearned Shares, Units or Other Rights that have not Vested ($)(1) |
Notes | ||||||||||||||||||||||||||||
| Keith B. Forman |
— | 1,102,491 | — | $ | 1.24 | 12/30/2019 | — | — | — | — | (2 | ) | ||||||||||||||||||||||||||
| — | — | — | — | — | — | — | 504,133 | $ | 635,207 | (3 | ) | |||||||||||||||||||||||||||
| — | — | — | — | — | 1,490 | $ | 15,660 | — | — | (13 | ) | |||||||||||||||||||||||||||
| D. Hunt Ramsbottom |
268,773 | — | — | $ | 3.87 | 6/8/2015 | — | — | — | — | (4 | ) | ||||||||||||||||||||||||||
| 752,567 | — | — | $ | 0.89 | 6/8/2015 | — | — | — | — | (5 | ) | |||||||||||||||||||||||||||
| Dan J. Cohrs |
442,687 | — | — | $ | 0.89 | 10/4/2020 | — | — | — | — | (5 | ) | ||||||||||||||||||||||||||
| — | — | — | — | — | 10,564 | $ | 13,311 | — | — | (6 | ) | |||||||||||||||||||||||||||
| — | — | — | — | — | — | — | 83,004 | $ | 104,585 | (7 | ) | |||||||||||||||||||||||||||
| — | — | — | — | — | 800 | $ | 8,408 | — | — | (8 | ) | |||||||||||||||||||||||||||
| — | — | — | — | — | 51,896 | $ | 65,389 | — | — | (9 | ) | |||||||||||||||||||||||||||
| — | — | — | — | — | — | — | 138,298 | $ | 174,255 | (10 | ) | |||||||||||||||||||||||||||
| — | — | — | — | — | 5,036 | $ | 52,928 | — | — | (11 | ) | |||||||||||||||||||||||||||
| — | — | — | — | — | — | — | 150,149 | $ | 189,187 | (3 | ) | |||||||||||||||||||||||||||
| — | — | — | — | — | 7,554 | $ | 79,393 | — | — | (12 | ) | |||||||||||||||||||||||||||
| John H. Diesch |
43,003 | — | — | $ | 3.87 | 7/13/2016 | — | — | — | — | (4 | ) | ||||||||||||||||||||||||||
| 177,075 | — | — | $ | 0.89 | 10/4/2020 | — | — | — | — | (5 | ) | |||||||||||||||||||||||||||
| — | — | — | — | — | 10,564 | $ | 13,311 | — | — | (6 | ) | |||||||||||||||||||||||||||
| — | — | — | — | — | — | — | 83,004 | $ | 104,585 | (7 | ) | |||||||||||||||||||||||||||
| — | — | — | — | — | 800 | $ | 8,408 | — | — | (8 | ) | |||||||||||||||||||||||||||
| — | — | — | — | — | 15,495 | $ | 162,852 | — | — | (11 | ) | |||||||||||||||||||||||||||
| — | — | — | — | — | 23,242 | $ | 244,273 | — | — | (12 | ) | |||||||||||||||||||||||||||
| John A. Ambrose |
22,134 | — | — | $ | 0.89 | 10/4/2020 | — | — | — | — | (5 | ) | ||||||||||||||||||||||||||
| — | — | — | — | — | 933 | $ | 9,806 | — | — | (8 | ) | |||||||||||||||||||||||||||
| — | — | — | — | — | 2,711 | $ | 28,493 | — | — | (11 | ) | |||||||||||||||||||||||||||
| Marc E. Wallis |
22,134 | — | — | $ | 0.89 | 10/4/2020 | — | — | — | — | (5 | ) | ||||||||||||||||||||||||||
| — | — | — | — | — | 622 | $ | 6,537 | — | — | (8 | ) | |||||||||||||||||||||||||||
| — | — | — | — | — | 2,711 | $ | 28,493 | — | — | (11 | ) | |||||||||||||||||||||||||||
| — | — | — | — | — | 6,364 | $ | 66,886 | — | — | (12 | ) | |||||||||||||||||||||||||||
130
Table of Contents
| (1) | Rentech equity award values were calculated based on the $1.26 closing price of Rentech’s common stock on December 31, 2014. The Partnership’s phantom unit award values were calculated based on the $10.51 closing price of the Partnership’s common units on December 31, 2014. |
| (2) | Represents Rentech stock options granted on December 30, 2014 of which one-fourth will vest on December 9, 2015, and the balance will vest in equal monthly increments thereafter for the following three years, subject to the executive’s continued employment through the applicable vesting date (these options are referred to below as the 2014 Options). |
| (3) | Represents Rentech PSUs granted on December 30, 2014 (with respect to Mr. Forman) or December 19, 2014 (with respect to Mr. Cohrs), vesting over a four-year period based on the increase in Rentech’s per share total shareholder return (or per share change in control transaction proceeds, as applicable) over the fair market value of a share of Rentech stock on the grant date, subject to the executive’s continued employment through the applicable vesting date, as described in more detail in “—Long-Term Equity Incentive Awards” above (these PSUs are referred to below as the 2014 PSUs). |
| (4) | Represents Rentech stock options granted on July 14, 2006 that vested in three equal annual installments on each of July 14, 2007, 2008 and 2009. |
| (5) | Represents Rentech stock options granted on October 4, 2010 that vested in three equal annual installments on each of October 4, 2011, 2012 and 2013. |
| (6) | Represents Rentech RSUs granted on December 14, 2012, which vested one-third installments on each of December 14, 2013 and 2014, and the remaining unvested one-third of which will vest on December 14, 2015, subject to the executive’s continued employment through the applicable vesting date (these RSUs are referred to below as the 2012 RSUs). |
| (7) | Represents Rentech PSUs granted on December 14, 2012, vesting on each of the first three anniversaries of the grant date based on the level of total shareholder return over the average fair market value for the thirty trading-day period through the grant date, subject to the executive’s continued employment through the applicable vesting date (these PSUs are referred to below as the 2012 PSUs). |
| (8) | Represents the Partnership’s phantom units granted on December 14, 2012, which vested as to one-third on each of December 14, 2013 and 2014, and the remaining unvested one-third of which will vest on December 14, 2015, subject to the executive’s continued employment through the applicable vesting date (these units are referred to below as the 2012 Phantom Units). |
| (9) | Represents Rentech RSUs granted on December 18, 2013, which vested as to one-third on December 14, 2013, and the remaining two-thirds of which will vest in two substantially equal annual installments on December 14, 2015 and 2016, subject to the executive’s continued employment through the applicable vesting date (these RSUs are referred to below as the 2013 RSUs). |
| (10) | Represents Rentech PSUs granted on December 18, 2013, vesting on each of the first three anniversaries of December 14, 2013 based on the level of total shareholder return over the average fair market value for the thirty trading-day period through the grant date, subject to the executive’s continued employment through the applicable vesting date, as described in more detail in “—Long-Term Equity Incentive Awards” above (these PSUs are referred to below as the 2013 PSUs). |
| (11) | Represents the Partnership’s phantom units granted on December 18, 2013, which vested as to one-third on December 14, 2013, and the remaining two-thirds of which will vest in two substantially equal installments on December 14, 2015 and 2016, subject to the executive’s continued employment through the applicable vesting date (these units are referred to below as the 2013 Phantom Units). |
| (12) | Represents the Partnership’s phantom units granted on December 30, 2014, vesting in three substantially equal installments on December 14, 2015, 2016 and 2017, subject to the executive’s continued employment through the applicable vesting date (these units are referred to below as the 2014 Phantom Units). |
| (13) | Represents the Partnership’s phantom units granted on July 1, 2014 which vest on the one-year anniversary grant date. |
Option Exercises, Stock Vested and Units Vested
The following table sets forth information with respect to the NEOs concerning the option exercises and stock vested under Rentech’s equity plan(s) and the phantom units vested under the Partnership’s plan during 2014. With respect to our Shared NEOs, the
131
Table of Contents
amounts set forth below reflect the total number of each NEO’s equity awards rather than an allocation based on the estimated percentage of time each Shared NEO dedicated to services for us due to the fact that awards exercised and/or vested include prior year awards, portions of which were allocable to services provided to the Partnership.
| Stock Awards | Unit Awards | |||||||||||||||
| Name |
Number of Shares Acquired on Vesting (#) |
Value Realized on Vesting ($)(1) |
Number of Units Acquired on Vesting (#) |
Value Realized on Vesting ($)(2) |
||||||||||||
| Keith B. Forman |
— | $ | — | 2,970 | $ | 53,608 | ||||||||||
| D. Hunt Ramsbottom |
351,544 | $ | 508,620 | 17,605 | $ | 198,480 | ||||||||||
| Dan J. Cohrs |
202,767 | $ | 294,916 | 11,038 | $ | 126,795 | ||||||||||
| John H. Diesch |
107,155 | $ | 159,057 | 13,512 | $ | 141,445 | ||||||||||
| John A. Ambrose |
54,151 | $ | 81,987 | 6,844 | $ | 76,331 | ||||||||||
| Marc E. Wallis |
43,266 | $ | 65,415 | 5,444 | $ | 60,887 | ||||||||||
| (1) | Amounts shown are based on the fair market value of Rentech’s common stock on the applicable vesting date. |
| (2) | Amounts shown are based on the fair market value of the Partnership’s common units on the applicable vesting date. |
Potential Payments upon Termination or Change-in-Control
Our NEOs are entitled to certain payments and benefits upon qualifying terminations of employment, and in certain cases, upon a change in control. The following discussion describes the terms and conditions of these payments and benefits and the circumstances in which they will be paid or provided, in each case, assuming the relevant event(s) occurred on December 31, 2014. All severance payments are conditioned upon the executive’s execution of a general release of claims against the employer.
For purposes of the following discussion, “change in control” refers to a change in control of Rentech or the Partnership, as follows: with respect to the severance payments and benefits provided to our Shared NEOs pursuant to their respective employment agreements, a change in control refers to a change in control of Rentech. With respect to (a) the severance payments and benefits provided to our Non-Shared NEOs pursuant to their respective employment agreements, (b) the 2014 Phantom Units, (c) the 2013 Phantom Units, and (d) the 2012 Phantom Units, a change in control refers to a change in control of the Partnership. Note that 2012, 2013 and 2014 Rentech equity awards are not included here or in the discussion below, as such awards pertain solely to services provided by our Shared NEOs to Rentech (and the costs of such awards are borne solely by Rentech).
Shared NEOs, Termination Not in Connection with a Change in Control
Under the Shared NEOs’ employment agreements (described in “—Severance Benefits” above), upon termination of the executive’s employment by Rentech without cause or by the executive with good reason (each as defined in the employment agreements) or, with respect to Mr. Ramsbottom, due to Rentech’s non-renewal of the employment term, the executive is entitled to receive: (i) three times (in the case of Mr. Ramsbottom) or one time (in the case of Mr. Cohrs) base salary, or, in the case of Mr. Forman, an amount equal to the greater of two times base salary or $1.0 million (unless such termination occurs on or prior to June 9, 2015, in which case such amount shall instead equal $400,000), payable over a two-year period (or, with respect to Mr. Cohrs, over a one-year period), (ii) in the case of Mr. Cohrs, payment of his target annual bonus on the date that annual bonuses are paid generally for the year in which termination occurs, and (iii) company-paid continuation health benefits for up to eighteen months following the date of termination. Upon termination of Mr. Cohrs’ employment in connection with Rentech’s non-renewal of his employment term, he will be entitled to receive an amount equal to one times base salary, payable over the one-year period following termination, and, at Rentech’s discretion, an annual bonus for the fiscal year preceding the non-renewal.
132
Table of Contents
In addition, the 2014 Phantom Units, 2013 Phantom Units and 2012 Phantom Units held by the Shared NEOs will accelerate and vest in full upon a termination of employment due to the applicable executive’s death or disability.
In connection with Mr. Ramsbottom’s termination of employment with Rentech in December 2014, he became entitled to receive the severance benefits described above consisting of a cash severance payment totaling three times his base salary (or $1,950,000) payable over a two-year period, plus the payment of his monthly premiums for continued health benefits for up to eighteen months following termination (with an estimated value, based on Rentech’s costs to provide such coverage, equal to $29,480).
Shared NEOs, Change in Control (No Termination)
The Shared NEOs are not entitled to any cash payments based solely on the occurrence of a change in control of Rentech (absent any qualifying termination). The 2014 Phantom Units, 2013 Phantom Units and 2012 Phantom Units are not impacted by a change in control of Rentech (absent a qualifying termination in connection with such change in control).
Shared NEOs, Termination in Connection with a Change in Control
If any of the Shared NEOs terminates employment without cause, for good reason or (with respect to Messrs. Ramsbottom and Cohrs only) due to a non-renewal of his employment term by Rentech, in any case, within three months before or two years after a change in control, then the executive will receive the severance described above, except that (i) the base salary component of the executive’s severance will be paid in a lump sum and (ii) if the executive’s actual annual bonus for the year immediately preceding the change in control exceeds his target bonus for the year in which the termination occurs, (A) in the case of Mr. Ramsbottom, he would have received two times base salary plus the amount of such prior year bonus (instead of three times his base salary) and (B) in the case of Mr. Cohrs, he will receive one times base salary plus the amount of such prior-year bonus (instead of base salary plus target annual bonus). The employment agreements for Messrs. Ramsbottom and Cohrs entitle each of these executives to a “gross-up” payment from Rentech covering all taxes, penalties and interest associated with any “golden parachute” excise taxes that are imposed on the executives by reason of Internal Revenue Code Section 280G in connection with a change in control, though Mr. Ramsbottom’s gross-up provision terminated in connection with his ceasing employment Rentech and us.
In addition, the 2014 Phantom Units, 2013 Phantom Units and 2012 Phantom Units held by the Shared NEOs will vest in full if the executive terminates employment without cause or for good reason, in either case, within sixty days prior to or eighteen months after the change in control.
Non-Shared NEOs, Termination Not in Connection with a Change in Control
Under the Non-Shared NEOs’ employment agreements, upon termination of employment by the employer without cause or by the executive for good reason (each as defined in the applicable agreement), the executive is entitled to receive: (i) an amount equal to one times his annual base salary, payable in substantially equal instalments over a twelve-month period following the date of termination, plus one times his target bonus for the year in which termination occurs (or, in the case of Mr. Wallis, who does not have a target bonus, payment of an additional amount equal to 100% of his base salary), and (ii) up to 18 months (in the case of Mr. Diesch) or 12 months (in the case of Messrs. Ambrose and Wallis) of subsidized healthcare premiums. If our general partner elects not to renew the employment term, the executive is entitled to a reduced severance consisting solely of one year of base salary continuation. During employment and for one year following termination, the employment agreements prohibited these NEOs from soliciting certain of our employees and customers.
In addition, the 2014 Phantom Units, 2013 Phantom Units and 2012 Phantom Units held by the Non-Shared NEOs will accelerate and vest in full upon a termination of employment due to the applicable executive’s death or disability.
Non-Shared NEOs, Change in Control (No Termination)
The Non-Shared NEOs are not entitled to any cash payments or any accelerated vesting of equity awards based solely on the occurrence of a change in control (absent any qualifying termination).
Non-Shared NEOs, Termination in Connection with a Change in Control
If the Non-Shared NEOs terminate employment without cause, for good reason or due to a non-renewal of the applicable employment term by us, in any case, in connection with a change in control, then the executive will receive the severance described above, except that, for Mr. Diesch, cash severance will be paid in a lump-sum and will be increased by the amount (if any) by which his prior-year bonus exceeds his then-current target bonus. Mr. Diesch is also entitled to a “gross-up” payment covering all taxes,
133
Table of Contents
penalties and interest associated with any “golden parachute” excise taxes that are imposed on the executives by reason of Internal Revenue Code Section 280G in connection with a change in control. In addition, the 2014 Phantom Units, 2013 Phantom Units and 2012 Phantom Units held by the applicable executive will vest in full if the executive terminates employment without cause or for good reason, in either case, within sixty days prior to or eighteen months after the change in control. The 2014 Phantom Units, 2013 Phantom Units and 2012 Phantom Units also vest in full upon the executive’s termination of employment due to death or disability (whether or not in connection with a change in control).
The following table summarizes the change-in-control and/or severance payments and benefits to which we expect that our NEOs would have become entitled if the relevant event(s) had occurred on December 31, 2014, in accordance with applicable disclosure rules. For purposes of the following table, we have assumed that a change in control of each relevant entity, whether Rentech and/or the Partnership, occurred on December 31, 2014, in order to provide a complete representation of the payments and benefits that each NEO would have become entitled to receive upon the occurrence of the relevant event(s). With respect to our Shared NEOs, the amounts set forth below reflect the portion of these NEOs’ change-in-control and severance payments that we estimate would have been attributable to services performed by these NEOs for the Partnership during fiscal year 2014, calculated in the same manner as amounts disclosed for these Shared NEOs in the Summary Compensation Table. The severance benefits that Mr. Ramsbottom became entitled to receive upon his termination of employment with Rentech in December 2014 are described above (rather than in the table below).
| Name |
Benefit |
Termination without Cause or for Good Reason ($) |
Termination due to Non- Renewal ($) |
Termination due to Death/ Disability ($) |
Qualifying Termination in Connection with a Change in Control |
Other Terminations |
||||||||||||||||
| Keith B. Forman |
Cash Severance | $ | 160,000 | (1) | $ | — | $ | — | $ | 160,000 | (2) | — | ||||||||||
| Value of Healthcare Premiums | 11,792 | (3) | — | — | 11,792 | (3) | — | |||||||||||||||
| Total | $ | 171,792 | $ | — | $ | — | $ | 171,792 | $ | |||||||||||||
| Dan J. Cohrs |
Cash Severance | $ | 259,840 | (4) | $ | 162,400 | (5) | $ | — | $ | 177,016 | (6) | $ | — | ||||||||
| Value of Accelerated Units(7) | — | — | 140,729 | (8) | 140,729 | (9) | — | |||||||||||||||
| Value of Healthcare Premiums | 10,318 | (3) | — | — | 10,318 | (3) | — | |||||||||||||||
| Total | $ | 270,158 | $ | 162,400 | $ | 140,729 | $ | 328,063 | (10) | $ | — | |||||||||||
| John H. Diesch |
Cash Severance | $ | 502,500 | (4) | $ | 335,000 | (5) | $ | — | $ | 360,125 | (6) | $ | — | ||||||||
| Value of Accelerated Units(7) | — | — | 415,534 | (11) | 415,534 | (12) | — | |||||||||||||||
| Value of Healthcare Premiums | 29,480 | (3) | — | — | 29,480 | (3) | — | |||||||||||||||
| Total | $ | 531,980 | $ | 335,000 | $ | 415,534 | $ | 805,139 | (10) | $ | — | |||||||||||
| John A. Ambrose(13) |
Cash Severance | $ | 361,200 | (4) | $ | 258,000 | (5) | — | — | $ | — | |||||||||||
| Value of Accelerated Units(7) |
— | — | 38,298 | (14) | 38,298 | (15) | — | |||||||||||||||
| Value of Healthcare Premiums | 19,653 | (3) | — | — | — | — | ||||||||||||||||
| Total | $ | 380,853 | $ | 258,000 | $ | 38,298 | $ | 38,298 | $ | — | ||||||||||||
| Marc E. Wallis |
Cash Severance | $ | 444,000 | (4) | $ | 222,000 | (5) | $ | — | $ | — | $ | — | |||||||||
| Value of Accelerated Units(7) |
— | — | 101,915 | (16) | 101,915 | (17) | — | |||||||||||||||
| Value of Healthcare Premiums | 19,653 | (3) | — | — | — | — | ||||||||||||||||
| Total | $ | 463,653 | $ | 222,000 | $ | 101,915 | $ | 101,915 | $ | — | ||||||||||||
| (1) | Represents two times Mr. Forman’s annual base salary, payable over the two-year period after his termination date. |
| (2) | Represents two times Mr. Forman’s annual base salary, payable in a lump sum upon termination. |
| (3) | Represents the cost of Company-paid continuation health benefits for eighteen months (in the case of Messrs. Forman, Cohrs and Diesch) or twelve months (in the case of Messrs. Ambrose and Wallis), based on our estimated costs to provide such coverage. |
134
Table of Contents
| (4) | Represents the executive’s annual base salary, payable over the one-year period after his termination date, plus (i) with respect to Messrs. Cohrs, Diesch and Ambrose, their target annual incentive bonuses and (ii) with respect to Mr. Wallis, a bonus equal to 100% of his annual base salary. |
| (5) | Represents executive’s annual base salary, payable over the one-year period after his termination date. |
| (6) | Represents executive’s annual base salary plus target bonus which equals the prior year’s bonus, payable in a lump sum upon termination. |
| (7) | Value of 2014 Phantom Units, 2013 Phantom Units and 2012 Phantom Units determined by multiplying the number of accelerating Partnership units by the fair market value of the Partnership’s common unit on December 31, 2014 ($10.51). |
| (8) | Represents the aggregate value of 7,554 unvested 2014 Phantom Units, 5,036 unvested 2013 Phantom Units and 800 unvested 2012 Phantom Units held by Mr. Cohrs that would have vested on an accelerated basis upon Mr. Cohrs’ termination due to death or disability on December 31, 2014. |
| (9) | Represents the aggregate value of 7,554 unvested 2014 Phantom Units, 5,036 unvested 2013 Phantom Units and 800 unvested 2012 Phantom Units held by Mr. Cohrs that would have vested on an accelerated basis if Mr. Cohrs terminated employment without cause or for good reason on December 31, 2014 and, in either case, such termination occurred within sixty days prior to or eighteen months after a change in control. |
| (10) | As of December 31, 2014, no excise taxes would have been imposed by Section 4999 of the Internal Revenue Code on the relevant payments and benefits, meaning that no gross-up obligations would have applied. Accordingly, no gross-up amounts are included in these figures. |
| (11) | Represents the aggregate value of 23,242 unvested 2014 Phantom Units, 15,495 unvested 2013 Phantom Units and 800 unvested 2012 Phantom Units held by Mr. Diesch that would have vested on an accelerated basis upon Mr. Diesch’s termination due to death or disability on December 31, 2014. |
| (12) | Represents the aggregate value of 23,242 unvested 2014 Phantom Units, 15,495 unvested 2013 Phantom Units and 800 unvested 2012 Phantom Units held by Mr. Diesch that would have vested on an accelerated basis if Mr. Diesch terminated employment without cause or for good reason on December 31, 2014 and, in either case, such termination occurred within sixty days prior to or eighteen months after a change in control. |
| (13) | Mr. Ambrose elected to retire and depart from the Partnership, and ceased to serve as officer of us, effective January 9, 2015. |
| (14) | Represents the aggregate value of 2,711 unvested 2013 Phantom Units and 933 unvested 2012 Phantom Units held by Mr. Ambrose that would have vested on an accelerated basis upon Mr. Ambrose’s termination due to death or disability on December 31, 2014. |
| (15) | Represents the aggregate value of 2,711 unvested 2013 Phantom Units and 933 unvested 2012 Phantom Units held by Mr. Ambrose that would have vested on an accelerated basis if Mr. Ambrose terminated employment without cause or for good reason on December 31, 2014 and, in either case, such termination occurred within sixty days prior to or eighteen months after a change in control. |
| (16) | Represents the aggregate value of 6,364 unvested 2014 Phantom Units, 2,711 unvested 2013 Phantom Units and 622 unvested 2012 Phantom Units held by Mr. Wallis that would have vested on an accelerated basis upon Mr. Wallis termination due to death or disability on December 31, 2014. |
| (17) | Represents the aggregate value of 6,364 unvested 2014 Phantom Units, 2,711 unvested 2013 Phantom Units and 622 unvested 2012 Phantom Units held by Mr. Wallis that would have vested on an accelerated basis if Mr. Wallis terminated employment without cause or for good reason on December 31, 2014 and, in either case, such termination occurred within sixty days prior to or eighteen months after a change in control. |
Director Compensation
Directors who are also employees of the Partnership do not receive additional compensation for their services on our board of directors. During 2014, Michael S. Burke, Michael F. Ray and Halbert S. Washburn served as non-employee members of our board of directors and of the board of directors of Rentech and, except as otherwise described below, are referred to in this Annual Report as our “Shared Directors.” James F. Dietz and Mr. Forman, who served as non-employee members of our board of directors during 2014,
135
Table of Contents
are referred to herein as our “Non-Shared Directors” (except as otherwise described below). Mr. Forman served as a non-employee member of our board of directors until his commencement of employment with Rentech and our general partner on December 9, 2014. Accordingly, Mr. Forman was a Non-Shared Director until December 9, 2014, and was a Shared Director from December 9, 2014 through December 31, 2014. In addition, on April 9, 2014, Mr. Ray resigned from Rentech’s board. Accordingly, Mr. Ray was a Shared Director from January 1, 2014 through April 9, 2014, and a Non-Shared Director for the remainder of 2014.
Our compensation plan for Non-Shared Directors provides for an annual retainer of $40,000 to be paid in quarterly increments of $10,000 to each Non-Shared Director. The Chairman of our board of directors, if any, receives $25,000 per year. Any Non-Shared Director serving as the Chairman of our Audit Committee receives $17,500 per year and any Non-Shared Director serving as a member of our Audit Committee receives $7,500 per year. Our Shared Directors are entitled to receive reduced retainers equal to $20,000 to be paid in quarterly increments of $5,000 to each Shared Director based on the substantial overlap of the services they provide to us and the services they provide as directors of Rentech. Any Shared Director serving as the Chairman of the Audit Committee receives $10,000 per year and any Shared Director serving as a member of the Audit Committee receive $4,000 per year. Directors are also reimbursed for reasonable out-of-pocket expenses incurred in their capacity as directors. No additional cash fees are paid to directors for attendance at our board of directors or committee meetings.
Each newly elected non-employee member of our board of directors is granted a phantom unit award with a fair market value on the date of grant equal to $25,000, with such award vesting on the one-year anniversary of the grant date. In addition, each Non-Shared Director serving immediately following Rentech’s annual meeting of stockholders is granted (i) an award of our common units with a fair market value on the date of grant equal to $50,000 and (ii) a phantom unit award with a fair market value on the date of grant equal to $25,000, with each such award vesting on the one-year anniversary of the grant date. Each Shared Director serving immediately following Rentech’s annual meeting of stockholders is also granted (i) an award of our common units with a fair market value on the date of grant equal to $25,000 and (ii) a phantom unit award with a fair market value on the date of grant equal to $12,500, with each such award vesting on the one-year anniversary of the grant date.
Each member of our board of directors who served as both a Shared Director and Non-Shared Director during 2014 was compensated as a Shared Director with respect to cash payments made during the period of 2014 during which he served as a Shared Director and as a Non-Shared Director with respect to cash payments made during the period of 2014 during which he served as a Non-Shared Director. The following table sets forth compensation information with respect to our non-employee directors for the fiscal year ended December 31, 2014:
| Names (1) |
Fees Earned or Paid in Cash ($) |
Unit Awards ($)(2)(3) | Total ($) | |||||||||
| Michael S. Burke |
$ | 30,000 | $ | 40,432 | $ | 70,432 | ||||||
| James F. Dietz |
$ | 47,500 | $ | 80,503 | $ | 128,003 | ||||||
| Michael F. Ray |
$ | 35,250 | $ | 80,503 | $ | 115,753 | ||||||
| Halbert S. Washburn |
$ | 20,000 | $ | 40,432 | $ | 60,432 | ||||||
| (1) | The compensation that Mr. Forman received during the year ended December 31, 2014 in his capacity as a director is reflected in the Summary Compensation Table above in accordance with SEC disclosure rules. |
| (2) | Amounts reflect the full grant-date fair value of the 2014 phantom unit awards, calculated in accordance with ASC Topic 718. We provide information regarding the assumptions used to calculate the value of all Partnership phantom unit awards made to non-employee directors in Note 12 to our consolidated financial statements included in Part II—Item 8 “Financial Statements and Supplementary Data” in this Annual Report. On July 1, 2014, Messrs. Burke, Dietz, Forman, Ray and Washburn were granted phantom units that will vest on July 1, 2015 in the amounts of 750, 1,490, 1,490, 1,490 and 750, respectively. In addition, on July 1, 2014, Messrs. Burke, Dietz, Forman, Ray and Washburn were granted common units in the amounts of 1,490, 2,970, 2,970, 2,970 and 1,490, respectively. |
| (3) | The aggregate number of phantom unit awards held by Messrs. Burke, Dietz, Forman, Ray and Washburn as of December 31, 2014 was 750, 1,490, 1,490, 1,490, and 750 phantom units, respectively. |
136
Table of Contents
ITEM 12. SECURITY OWNERSHIP OF CERTAIN BENEFICIAL OWNERS AND MANAGEMENT AND RELATED UNITHOLDER MATTERS
The following table presents information regarding beneficial ownership of our common units as of March 2, 2015 by:
| • | our general partner; |
| • | each of our general partner’s directors; |
| • | each of our general partner’s named executive officers; |
| • | each unitholder known by us to beneficially hold five percent or more of our outstanding common units; and |
| • | all of our general partner’s executive officers and directors as a group. |
Beneficial ownership is determined under the rules of the SEC and generally includes voting or investment power with respect to securities. Unless indicated below, to our knowledge, the persons and entities named in the table have sole voting and sole investment power with respect to all common units beneficially owned, subject to community property laws where applicable. Except as otherwise indicated, the business address for each of our beneficial owners is c/o Rentech Nitrogen Partners, L.P., 10877 Wilshire Boulevard, 10th Floor, Los Angeles, California 90024.
| Name and Address of Beneficial Owner |
Amount and Nature of Common Units Beneficially Owned(1) |
Percentage of Total Common Units(2) |
||||||
| Rentech Nitrogen GP, LLC(3) |
— | — | ||||||
| RNHI(4) |
23,250,000 | 59.7 | ||||||
| John A. Ambrose(5) |
12,707 | — | ||||||
| Keith B. Forman |
9,960 | — | ||||||
| Dan J. Cohrs |
15,851 | — | ||||||
| John H. Diesch |
16,533 | — | ||||||
| D. Hunt Ramsbottom(6) |
23,257 | — | ||||||
| Marc E. Wallis |
7,688 | — | ||||||
| Michael S. Burke |
5,630 | — | ||||||
| James F. Dietz |
14,388 | — | ||||||
| Michael F. Ray |
7,110 | — | ||||||
| Halbert S. Washburn |
5,230 | — | ||||||
| All directors and executive officers as a group (10 persons) |
107,203 | — | ||||||
| * | Less than 1%. |
| (1) | The Security Ownership table above does not include unvested phantom units held by NEOs that will vest assuming the continued employment of the NEO beyond each applicable vesting date: |
| • | Keith B. Forman – 1,490 phantom units; |
| • | Dan J. Cohrs – 13,390 phantom units; |
| • | John H. Diesch – 39,537 phantom units; |
| • | Marc E. Wallis – 9,697 phantom units; |
| • | Michael S. Burke – 750 phantom units; |
| • | James F. Dietz – 1,490 phantom units; |
| • | Michael F. Ray – 1,490 phantom units; and |
| • | Halbert S. Washburn – 750 phantom units. |
137
Table of Contents
| (2) | Based on 38,913,396 common units outstanding as of March 2, 2015. |
| (3) | Our general partner, a wholly owned subsidiary of RNHI, manages and operates our business and has a non-economic general partner interest. |
| (4) | RNHI is an indirect wholly owned subsidiary of Rentech. |
| (5) | As of January 9, 2015, Mr. Ambrose’s last day of employment with us. |
| (6) | As of December 15, 2014, Mr. Ramsbottom’s last day of employment with us and Rentech. |
The following table sets forth, as of March 2, 2015, the number of shares of common stock of Rentech owned by each of the named executive officers and directors of our general partner and all executive officers and directors of our general partner as a group.
Beneficial ownership is determined under the rules of the SEC and generally includes voting or investment power with respect to securities. Unless indicated below, to our knowledge, the persons and entities named in the table have sole voting and sole investment power with respect to all shares of common stock beneficially owned, subject to community property laws where applicable. Except as otherwise indicated, the business address for each of the following persons is c/o Rentech Nitrogen Partners, L.P., 10877 Wilshire Boulevard, 10th Floor, Los Angeles, California 90024.
| Name and Address of Beneficial Owner |
Amount and Nature of Common Stock Beneficially Owned(1)(2) |
Percentage of Total Common Stock(1)(3) |
||||||
| John A. Ambrose(4) |
237,733 | * | ||||||
| Keith B. Forman |
— | * | ||||||
| Dan J. Cohrs |
1,300,265 | * | ||||||
| John H. Diesch |
724,972 | * | ||||||
| D. Hunt Ramsbottom(5) |
2,716,969 | 1.2 | ||||||
| Marc E. Wallis |
92,458 | * | ||||||
| Michael S. Burke |
409,625 | * | ||||||
| James F. Dietz |
— | * | ||||||
| Michael F. Ray(6) |
512,988 | * | ||||||
| Halbert S. Washburn |
468,328 | * | ||||||
| All directors and executive officers as a group (10 persons) |
4,675,738 | 2.0 | ||||||
| * | Less than 1% |
| (1) | If a person has the right to acquire shares of common stock subject to options or other convertible or exercisable securities within 60 days of March 2, 2015, then such shares (including certain restricted stock units which are fully vested but will not be yet paid out until the earlier of the recipient’s termination and three years from the applicable award date, subject to any required payment delays arising under applicable tax laws) are deemed outstanding for purposes of computing the percentage ownership of that person, but are not deemed outstanding for purposes of computing the percentage ownership of any other person. The following shares of common stock subject to stock options and warrants may be acquired within 60 days of March 2, 2015 and are included in the table above: |
| • | John A. Ambrose—22,135 under options; |
| • | Dan J. Cohrs—442,687 under options; |
| • | John H. Diesch—220,078 under options; |
| • | D. Hunt Ramsbottom —1,021,340 under options; |
| • | Marc E. Wallis—22,134 under options; |
| • | Michael S. Burke—44,616 under options and 6,474 RSUs; |
| • | Michael F. Ray—28,490 under options; |
| • | Halbert S. Washburn—44,616 under options and 7,968 RSUs; and |
| • | all directors and executive officers as a group—1,119,140 under options and 14,442 RSUs. |
138
Table of Contents
| (2) | The Security Ownership table above does not include the following: |
(A) PSUs granted during the year ended December 31, 2014 and held by our NEOs that vest over a four year period based on the level of total shareholder return over such period (the numbers below represent the target number of PSUs that may be issued to the NEOs):
| • | Keith B. Forman — 1,008,265 PSUs; and |
| • | Dan J. Cohrs — 300,297 PSUs. |
PSUs granted prior to January 1, 2014 and held by NEOs that vest over a three year period based on the level of total shareholder return over such period (the numbers below represent the target number of PSUs that may be issued to the NEOs):
| • | Dan J. Cohrs — 442,603 PSUs. |
(B) unvested RSUs and options held by NEOs that will vest assuming the continued employment of the officer or director beyond each applicable vesting date:
| • | Keith B. Forman — 1,102,491 under options; |
| • | Dan J. Cohrs — 62,459 RSUs; |
| • | John H. Diesch — 10,563 RSUs; |
| • | Michael S. Burke — 16,474 RSUs; |
| • | Halbert S. Washburn — 17,969 RSUs. |
| (3) | Based on 229,421,453 shares of common stock outstanding as of March 2, 2015. |
| (4) | As of January 9, 2015, Mr. Ambrose’s last day of employment with us. |
| (5) | As of December 15, 2014, Mr. Ramsbottom’s last day of employment with Rentech. |
| (6) | As of April 9, 2014, Mr. Ray’s last day on Rentech’s board. Includes 7,500 shares held by Mr. Ray’s spouse’s IRA as to which Mr. Ray disclaims beneficial ownership. |
Equity Compensation Plan Information
The following table provides information as of December 31, 2014 with respect to our compensation plan under which our equity securities are authorized for issuance.
| Plan category |
Number of securities to be issued upon exercise of outstanding options, warrants and rights (a) |
Weighted-average exercise price of outstanding options, warrants and rights (b) |
Number of securities remaining available for future issuance under equity compensation plans (excluding securities reflected in column (a)) (c) |
|||||||||
| Equity compensation plans approved by security holders |
219,858 | (1) | — | (2) | 3,339,513 | |||||||
| Equity compensation plans not approved by security holders |
— | — | — | |||||||||
|
|
|
|
|
|
|
|||||||
| Total |
219,858 | — | 3,339,513 | |||||||||
|
|
|
|
|
|
|
|||||||
| (1) | Represents phantom units awarded under the LTIP. |
| (2) | Phantom units do not have an exercise price. Payout is based on completing a specified period of employment. |
The LTIP provides for the grant of unit awards, restricted units, phantom units, unit options, unit appreciation rights, distribution equivalent rights, profits interest units and other unit-based awards.
139
Table of Contents
ITEM 13. CERTAIN RELATIONSHIPS AND RELATED TRANSACTIONS, AND DIRECTOR INDEPENDENCE
For a discussion of director independence, see “Part III — Item 10. Directors, Executive Officers and Corporate Governance.”
RNHI, an indirect wholly owned subsidiary of Rentech, owns (i) 23,250,000 common units, representing 59.7% of our outstanding common units and (ii) all of the member interests in our general partner and our general partner own a general partner interest in us.
Distributions and Payments to Rentech and its Affiliates
The following table summarizes the distributions and payments to be made by us to Rentech and its affiliates (including our general partner) in connection with the ongoing operation and any liquidation of the Partnership. These distributions and payments were or will be determined by and among affiliated entities and, consequently, are not the result of arm’s-length negotiations.
Operational Stage
| Distributions to RNHI and its affiliates |
• |
We will generally make cash distributions to our unitholders pro rata, including to RNHI, as a holder of common units. RNHI owns 23,250,000 common units, representing 59.7% of our outstanding common units, and would receive a pro rata percentage of the cash available for distribution that we distribute in respect thereof. | ||
| Payments to our general partner and its affiliates |
• | We will reimburse our general partner and its affiliates for all expenses incurred on our behalf. In addition we will reimburse Rentech for certain operating expenses and for the provision of various general and administrative services for our benefit under the services agreement. | ||
|
Liquidation Stage |
||||
|
Liquidation |
• | Upon our liquidation, our unitholders will be entitled to receive liquidating distributions according to their respective capital account balances. | ||
Our Agreements with Rentech
At the closing of our initial public offering, we, our general partner and Rentech entered into the following agreements which govern the business relations among us, our general partner and Rentech. These agreements were not the result of arm’s-length negotiations and the terms of these agreements are not necessarily at least as favorable to each party to these agreements as terms which could have been obtained from unaffiliated third parties.
Omnibus Agreement
At the closing of our initial public offering, we entered into an omnibus agreement with our general partner and Rentech. Under the omnibus agreement, Rentech has agreed to indemnify us for:
| • | liabilities relating to REMC (excluding environmental liabilities, pre-closing income tax liabilities, liabilities reflected on the balance sheet of REMC as of June 30, 2011 and liabilities that have arisen since June 30, 2011 in the ordinary course of business) to the extent arising out of the ownership or operation of REMC prior to the closing of our initial public offering and that are asserted during the period ending on the seventh anniversary of the closing of our initial public offering; |
| • | pre-closing income tax liabilities that are asserted during the period ending on the 30th day after the expiration of the applicable statute of limitations; |
| • | our failure, as of the closing of our initial public offering, to be the owner of valid and indefeasible easement rights, contractual rights, leasehold interests and/or fee ownership interests in and to the lands on which our East Dubuque Facility or our ammonia storage space in Niota, Illinois are located, and if such failure renders us liable to a third party or |
140
Table of Contents
| unable to use our East Dubuque Facility or such ammonia storage space in substantially the same manner they were used and operated immediately prior to the closing of our initial public offering, which failure(s) are identified prior to the fifth anniversary of the closing of our initial public offering; and |
| • | events and conditions associated with any assets retained by Rentech. |
Rentech’s obligation to indemnify us for liabilities described in the first bullet above will be subject to (i) a $250,000 aggregate annual deductible; and (ii) a $10.0 million aggregate cap. In addition, Rentech is not obligated to indemnify us for liabilities satisfied through the use of net operating loss carry-forwards in accordance with the terms of our management services agreement with Rentech.
We have agreed to indemnify Rentech and any of its direct or indirect subsidiaries (excluding us and any of our direct or indirect subsidiaries) for:
| • | liabilities of REMC (excluding post-closing income tax liabilities) to the extent arising out of the ownership or operation of REMC on or after the closing of our initial public offering; |
| • | post-closing income tax liabilities (excluding pre-closing income tax liabilities and income tax liabilities attributable to Rentech’s indirect ownership of REMC through its ownership in us after the closing of our initial public offering) that are asserted during the period ending on the 30th day after the expiration of the applicable statute of limitations; |
| • | environmental liabilities relating to the potential removal of asbestos at our East Dubuque Facility in an amount not to exceed $325,000; |
| • | any liabilities (excluding environmental liabilities and pre-closing income tax liabilities) to the extent reflected on the balance sheet of REMC as of June 30, 2011; and |
| • | any liabilities (excluding environmental liabilities and pre-closing income tax liabilities) that have arisen since June 30, 2011 in the ordinary course of business. |
Our obligation to indemnify Rentech for liabilities described in the first bullet above will be subject to (i) a $250,000 aggregate annual deductible and (ii) a $10.0 million aggregate cap.
Subject to the terms and conditions of the omnibus agreement, Rentech and its affiliates granted us and our general partner a royalty-free, worldwide, non-exclusive, non-sublicensable and non-transferable (without the prior written consent of Rentech) right and license to use the Rentech corporate logo and the Rentech name.
Services Agreement
At the closing of our initial public offering, we, our general partner and Rentech entered into a services agreement, pursuant to which we, our general partner and our operating subsidiaries obtain certain management and other services from Rentech. Under this agreement, our general partner have engaged Rentech to provide certain administrative services to us. Rentech provides us with the following services under the agreement, among others:
| • | services from certain of Rentech’s employees in capacities equivalent to the capacities of corporate executive officers, except that those who serve in such capacities under the agreement shall serve us on a shared, part-time basis only, unless we and Rentech agree otherwise; |
| • | administrative and professional services, including legal, accounting services, human resources, information technology, insurance, tax, credit, finance, payroll, investor and public relations, communications, government affairs and regulatory affairs; |
| • | recommendations on capital raising activities to the board of directors of our general partner, including the issuance of debt or equity securities, the entry into credit facilities and other capital market transactions; |
| • | managing or overseeing litigation and administrative or regulatory proceedings, and establishing appropriate insurance policies for us, and providing safety and environmental advice; |
| • | recommendations regarding the declaration and payment of cash distributions; and |
| • | managing or providing advice for other projects, including acquisitions, as may be agreed by Rentech and our general partner from time to time. |
As payment for services provided under the agreement, we, our general partner, and our operating subsidiaries, are obligated to reimburse Rentech for (i) all costs, if any, incurred by Rentech or its affiliates in connection with the employment of its employees
141
Table of Contents
who are seconded to us and who provide us services under the agreement on a full-time basis, but excluding share-based compensation; (ii) a prorated share of costs incurred by Rentech or its affiliates in connection with the employment of its employees, excluding the seconded personnel, who provide us services under the agreement on a part-time basis, but excluding share-based compensation, and such prorated share shall be determined by Rentech on a commercially reasonable basis, based on the estimated percent of total working time that such personnel are engaged in performing services for us; (iii) a prorated share of certain administrative costs in accordance with the terms of the agreement, including office costs, services by outside vendors (including employee compensation and benefit plan services), other general and administrative costs; (iv) any costs, expenses and claims related to employee benefits provided to employees of our general partner, us or our operating subsidiaries that have been paid by Rentech, but excluding share-based compensation; and (v) any taxes (other than income taxes, gross receipt taxes and similar taxes) incurred by Rentech or its affiliates for the services provided under the agreement. We are required to pay Rentech within 30 days for invoices it submits to us under the agreement.
We, our general partner and our operating subsidiaries are not required to pay any salaries, bonuses or benefits directly to any of Rentech’s employees who provide services to us on a full-time or part-time basis; Rentech will continue to be responsible for their compensation. We expect that personnel performing the actual day-to-day business and operations at our facilities will be employed directly by our general partner, and we will bear all salaries, bonuses, employee benefits and other personnel costs for these employees.
Either Rentech or our general partner may temporarily or permanently exclude any particular service from the scope of the agreement upon 180 days’ notice unless such notice is waived in writing by our general partner. At any time, Rentech may temporarily or permanently exclude any employee of Rentech or its affiliates from providing the services under the agreement. Rentech also has the right to delegate the performance of some or all of the services to be provided pursuant to the agreement to one of its affiliates or any other person or entity, though such delegation will not relieve Rentech from its obligations under the agreement. Either Rentech or our general partner has the right to terminate the agreement upon at least 180 days’ notice, but not more than one year’s notice. Furthermore, our general partner will have the right to terminate the agreement immediately if Rentech becomes bankrupt, or dissolves and commences liquidation or winding-up.
In order to facilitate the carrying out of services under the agreement, we, on the one hand, and Rentech and its affiliates, on the other, have granted one another certain royalty-free, non-exclusive and non-transferable rights to use one another’s intellectual property under certain circumstances. However, Rentech did not grant any right to license its alternative energy technology under the agreement.
The agreement also contains an indemnity provision whereby we, our general partner and our operating subsidiaries, as indemnifying parties, have agreed to indemnify Rentech and its affiliates (other than the indemnifying parties themselves) against losses and liabilities incurred in connection with the performance of services under the agreement or any breach of the agreement, unless such losses or liabilities arise from a breach of the agreement by Rentech or other misconduct on its part, as provided in the agreement. The agreement also contains a provision stating that Rentech is an independent contractor under the agreement and nothing in the agreement may be construed to impose an implied or express fiduciary duty owed by Rentech, on the one hand, to the recipients of services under the agreement, on the other hand. The agreement prohibits recovery of loss of profits or revenue, or special, incidental, exemplary, punitive or consequential damages from Rentech or certain affiliates.
Indemnification Agreements
At the closing of our initial public offering, we entered into indemnification agreements with each of the directors and executive officers of our general partner. These agreements provide indemnification to these directors and executive officers under certain circumstances for acts or omissions which may not be covered by directors’ and officers’ liability insurance.
Procedures for Review, Approval and Ratification of Related Person Transactions
The board of directors of our general partner adopted a Code of Business Conduct and Ethics in connection with the closing of our initial public offering that provides that the independent members of the board of directors of our general partner or an authorized independent committee of the board of directors periodically will review all transactions with a related person that are required to be disclosed under SEC rules and, when appropriate, initially authorize or ratify all such transactions. In the event that the independent members of the board of directors of our general partner or the authorized independent committee considers ratification of a transaction with a related person and determines not to so ratify, the Code of Business Conduct and Ethics provides that our management will make all reasonable efforts to cancel or annul the transaction.
The Code of Business Conduct and Ethics provides that, in determining whether or not to recommend the initial approval or ratification of a transaction with a related person, the independent members of the board of directors of our general partner or the
142
Table of Contents
authorized independent committee should consider all of the relevant facts and circumstances available, including (if applicable) but not limited to: (i) whether there is an appropriate business justification for the transaction; (ii) the benefits that accrue to us as a result of the transaction; (iii) the terms available to unrelated third parties entering into similar transactions; (iv) the impact of the transaction on a director’s independence (in the event the related person is a director, an immediate family member of a director or an entity in which a director or an immediately family member of a director is a partner, shareholder, member or executive officer); (v) the availability of other sources for comparable products or services; (vi) whether it is a single transaction or a series of ongoing, related transactions; and (vii) whether entering into the transaction would be consistent with the Code of Business Conduct and Ethics.
The Code of Business Conduct and Ethics described above was adopted in connection with the closing of our initial public offering, and as a result the transactions described above were not reviewed under such policy.
ITEM 14. PRINCIPAL ACCOUNTANT FEES AND SERVICES
The charter of the audit committee of the board of directors of our general partner, which is available on our website at www.rentechnitrogen.com, requires the audit committee to pre-approve all audit services and non-audit services (other than de minimis non-audit services as defined by the Sarbanes-Oxley Act of 2002) to be provided by our independent registered public accounting firm. Non-audit services were reviewed with the Audit Committee, which concluded that the provision of such services by PricewaterhouseCoopers LLP were compatible with the maintenance of that firm’s independence in the conduct of its auditing functions. The audit committee pre-approved all fees incurred in the years ended December 31, 2014 and 2013.
The following table presents fees billed and expected to be billed for audit fees, audit-related fees, tax fees and other services rendered by PricewaterhouseCoopers LLC for the years ended December 31, 2014 and 2013.
| For the Years Ended December 31, | ||||||||
| 2014 | 2013 | |||||||
| Audit Fees (1) |
$ | 1,257,750 | $ | 1,066,250 | ||||
| Audit-Related Fees |
— | — | ||||||
| Tax Fees |
— | — | ||||||
| All Other Fees |
— | — | ||||||
|
|
|
|
|
|||||
| Total |
$ | 1,257,750 | $ | 1,066,250 | ||||
|
|
|
|
|
|||||
| (1) | Represents the aggregate fees billed and expected to be billed for professional services rendered for the audit of our consolidated financial statements for the years ended December 31, 2014 and 2013, and for the audit of our internal control over financial reporting and reviews of the financial statements included in our quarterly reports on Form 10-Q, assistance with Securities Act filings and related matters, consents issued in connection with Securities Act filings, and consultations on financial accounting and reporting standards arising during the course of the audit for the years ended December 31, 2014 and 2013. |
ITEM 15. EXHIBITS AND FINANCIAL STATEMENT SCHEDULES
(a)(1) and (2) Financial Statements and Schedules.
The information required by this Item is included in “Part II—Item 8. Financial Statements and Supplementary Data” of this report.
(b) Exhibits.
See Exhibit Index.
143
Table of Contents
EXHIBIT INDEX
| 3.1 | Certificate of Limited Partnership of Rentech Nitrogen Partners, L.P. (incorporated by reference to Exhibit 3.1 to the Form S-1 filed by the Registrant on August 5, 2011). | |
| 3.2 | Third Amended and Restated Agreement of Limited Partnership of Rentech Nitrogen Partners, L.P., dated as of November 1, 2012 (including form of common unit certificate) (incorporated by reference to Exhibit 3.1 to the Current Report on Form 8-K filed by the Registrant on November 5, 2012). | |
| 3.3 | Certificate of Formation of Rentech Nitrogen GP, LLC (incorporated by reference to Exhibit 3.3 to the Form S-1 filed by the Registrant on August 5, 2011). | |
| 3.4 | Second Amended and Restated Limited Liability Company Agreement of Rentech Nitrogen GP, LLC, dated November 9, 2011 (incorporated by reference to Exhibit 3.2 to the Current Report on Form 8-K filed by the Registrant on November 9, 2011). | |
| 4.1 | Indenture, dated as April 12, 2013, among Rentech Nitrogen Partners, L.P., Rentech Nitrogen Finance Corporation, the guarantors named therein, Wells Fargo Bank, National Association, as Trustee, and Wilmington Trust, National Association, as Collateral Trustee (incorporated by reference from Exhibit 4.1 to the Current Report on Form 8-K (File No. 001-35334) filed by the Registrant with the Securities and Exchange Commission on April 16, 2013). | |
| 4.2 | Forms of 6.5% Second Lien Senior Secured Notes due 2021 (incorporated by reference from Exhibit 4.2 to the Current Report on Form 8-K (File No. 001-35334) filed by the Registrant with the Securities and Exchange Commission on April 16, 2013). | |
| 4.3 | Intercreditor Agreement, dated as of April 12, 2013, among Credit Suisse AG, Cayman Islands Branch, as priority lien agent, Wilmington Trust, National Association, as second lien collateral trustee, Rentech Nitrogen Partners, L.P., Rentech Nitrogen Finance Corporation and the subsidiaries of Rentech Nitrogen Partners, L.P. named therein (incorporated by reference from Exhibit 4.3 to the Current Report on Form 8-K (File No. 001-35334) filed by the Registrant with the Securities and Exchange Commission on April 16, 2013). | |
| 10.1 | Distribution Agreement, dated April 26, 2006, between Royster-Clark Resources LLC and Rentech Development Corporation (incorporated by reference to Exhibit 10.1 to the Form S-1 filed by the Registrant on August 5, 2011). | |
| 10.2 | Amendment to Distribution Agreement, dated October 13, 2009, among Rentech Energy Midwest Corporation, Rentech Development Corporation and Agrium U.S.A., Inc. (incorporated by reference to Exhibit 10.2 to the Form S-1 filed by the Registrant on August 5, 2011). | |
| 10.3 | Assignment and Assumption Agreement, dated as of September 29, 2006, by and between Royster-Clark, Inc., Agrium U.S.A., Inc., and Rentech Development Corporation (incorporated by reference to Exhibit 10.3 to the Form S-1 filed by the Registrant on August 5, 2011). | |
| 10.4 | Agreement, dated November 1, 2010, between Northern Illinois Gas Company, d/b/a Nicor Gas Company and Rentech Energy Midwest (incorporated by reference to Exhibit 10.14 to the Form S-1 filed by the Registrant on August 5, 2011). | |
| 10.5 | Services Agreement, dated as of November 9, 2011, by and among Rentech Nitrogen Partners, L.P., Rentech Nitrogen GP, LLC and Rentech, Inc. (incorporated by reference to Exhibit 10.3 to the Current Report on Form 8-K filed by the Registrant on November 9, 2011). | |
| 10.6 | Contribution, Conveyance and Assignment Agreement, dated as of November 9, 2011, by and among Rentech, Inc., Rentech Development Corporation, Rentech Nitrogen Holdings, Inc., Rentech Nitrogen GP, LLC, Rentech Nitrogen Partners, L.P. and Rentech Energy Midwest Corporation (incorporated by reference to Exhibit 10.1 to the Current Report on Form 8-K filed by the Registrant on November 9, 2011). | |
| 10.7 | Omnibus Agreement, dated as of November 9, 2011, by and among Rentech, Inc., Rentech Nitrogen GP, LLC and Rentech Nitrogen Partners, L.P. (incorporated by reference to Exhibit 10.2 to the Current Report on Form 8-K filed by the Registrant on November 9, 2011). | |
| 10.8† | Amended and Restated Employment Agreement by and between Rentech, Inc. and D. Hunt Ramsbottom, dated December 31, 2008 (incorporated by reference to Exhibit 10.43 to Amendment No. 1 to Annual Report on Form 10-K/A (File No. 001-15795) filed by Rentech, Inc. on January 28, 2009). | |
| 10.9† | Employment Agreement by and between Rentech, Inc. and Daniel J. Cohrs, dated October 22, 2008 (incorporated by reference to Exhibit 10.21 to Annual Report on Form 10-K for the fiscal year ended September 30, 2008 (File No. 001-15795) filed by Rentech, Inc. on December 15, 2008). | |
144
Table of Contents
| 10.10† | Employment Agreement by and between Rentech, Inc. and John H. Diesch, dated November 3, 2009 (incorporated by reference to Exhibit 10.20 to the Form S-1 filed by the Registrant on August 5, 2011). | |
| 10.11† | Amended and Restated Rentech, Inc. 2006 Incentive Award Plan (incorporated by reference to Exhibit 10.1 to Current Report on Form 8-K (File No. 001-15795) filed by Rentech, Inc. on March 29, 2007). | |
| 10.12† | First Amendment to Rentech, Inc. Amended and Restated 2006 Incentive Award Plan (incorporated by reference to Exhibit 10.1 to Current Report on Form 8-K (File No. 001-15795) filed by Rentech, Inc. on November 6, 2009). | |
| 10.13† | Rentech, Inc. 2009 Incentive Award Plan (incorporated by reference to Exhibit 10.1 to Current Report on Form 8-K (File No. 001-15795) filed by Rentech, Inc. on May 22, 2009). | |
| 10.14† | First Amendment to Rentech, Inc. 2009 Incentive Award Plan (incorporated by reference to Exhibit 10.2 to Current Report on Form 8-K (File No. 001-15795) filed by Rentech, Inc. on November 6, 2009). | |
| 10.15† | Employment Agreement, dated as of November 3, 2009 by and between Rentech, Inc. and Colin Morris (incorporated by reference to Exhibit 10.3 to the Current Report on Form 8-K filed by Rentech, Inc. on November 6, 2009). | |
| 10.16† | Employment Agreement, dated as of October 15, 2011 by and between Rentech Nitrogen GP, LLC and John A. Ambrose (incorporated by reference to Exhibit 10.31 to the Form S-1 filed by the Registrant on October 20, 2011). | |
| 10.17† | Employment Agreement, dated as of October 15, 2011 by and between Rentech Nitrogen GP, LLC and Wilfred R. Bahl, Jr. (incorporated by reference to Exhibit 10.32 to the Form S-1 filed by the Registrant on October 20, 2011). | |
| 10.18† | Employment Agreement, dated as of October 16, 2011 by and between Rentech Nitrogen GP, LLC and Marc E. Wallis (incorporated by reference to Exhibit 10.33 to Form S-1 filed by the Registrant on October 20, 2011). | |
| 10.19 | Indemnification Agreement dated November 9, 2011, by and between Rentech Nitrogen Partners, L.P. and D. Hunt Ramsbottom (all other Indemnification Agreements, which are substantially identical in all material respects, except as to the parties thereto and the dates of execution, are omitted pursuant to Instruction 2 to Item 601 of Regulation S-K) (incorporated by reference to Exhibit 10.36 to the Annual Report on Form 10-K filed by the Registrant on December 14, 2012). | |
| 10.20 | Asset Purchase Agreement, dated as of September 10, 1998, by and between ExxonMobil Corporation (formerly known as Mobil Oil Corporation) and Rentech Nitrogen Pasadena, LLC (formerly known as Agrifos Fertilizer L.P.) (incorporated by reference to Exhibit 10.35 to the Annual Report on Form 10-K filed by the Registrant on March 18, 2013). | |
| 10.21+ | Marketing Agreement, dated as of March 22, 2011, by and between Interoceanic Corporation and Rentech Nitrogen Pasadena, LLC (Agrifos Fertilizer L.L.C.) (incorporated by reference to Exhibit 10.36 to the Annual Report on Form 10-K filed by the Registrant on March 18, 2013). | |
| 10.22 | Credit Agreement, dated as of April 12, 2013, among Rentech Nitrogen Partners, L.P. and Rentech Nitrogen Finance Corporation, as borrowers, the other parties thereto that are designated as credit parties from time to time, Credit Suisse AG, Cayman Islands Brach, for itself and as agent for all lenders, the other financial institutions party thereto, as lenders, Credit Suisse Securities (USA) LLC, as sole lead arranger and bookrunner, and BMO Harris Bank, N.A., as syndication agent (incorporated by reference to Exhibit 10.1 to the Quarterly Report on Form 10-Q filed by the Registrant on May 9, 2013). | |
| 10.23+ | Amended and Restated Marketing Agreement, effective as of January 1, 2014, by and between Interoceanic Corporation and Rentech Nitrogen Pasadena, LLC (Agrifos Fertilizer L.L.C.). (incorporated by reference to Exhibit 10.32 to the Annual Report on Form 10-K filed by the Registrant on March 17, 2014). | |
| 10.24 | First Amendment to Credit Agreement, dated as of March 7, 2014, by and among Rentech Nitrogen Partners, L.P., Rentech Nitrogen Finance Corporation, the subsidiary guarantors party hereto, the lenders party hereto and Credit Suisse AG, Cayman Islands Branch, as agent for the lenders. (incorporated by reference to Exhibit 10.33 to the Annual Report on Form 10-K filed by the Registrant on March 17, 2014). | |
| 10.25 | Assignment of Employment Agreement, dated as of December 30, 2013, by and between Rentech, Inc., Rentech Nitrogen GP, LLC and John Diesch. (incorporated by reference to Exhibit 10.34 to the Annual Report on Form 10-K filed by the Registrant on March 17, 2014). | |
145
Table of Contents
| 10.26 | Credit Agreement, dated as of July 22, 2014, among Rentech Nitrogen Partners, L.P. and Rentech Nitrogen Finance Corporation, as borrowers, Rentech Nitrogen LLC, Rentech Nitrogen Pasadena Holdings, LLC and Rentech Nitrogen Pasadena, LLC, as subsidiary guarantors, and General Electric Capital Corporation, as administrative agent, GE Capital Markets, Inc. as sole lead arranger and bookrunner, and the other lender parties thereto (incorporated by reference to Exhibit 10.1 to the Current Report on Form 8-K filed by the Partnership on July 25, 2014). | |
| 10.27 | First Amendment to Credit Agreement, dated as of August 13, 2014, among Rentech Nitrogen Partners, L.P. and Rentech Nitrogen Finance Corporation, as borrowers, Rentech Nitrogen LLC, Rentech Nitrogen Pasadena Holdings, LLC and Rentech Nitrogen Pasadena, LLC, as subsidiary guarantors, and General Electric Capital Corporation, as agent, and the lenders parties thereto (incorporated by reference to Exhibit 10.1 to the Current Report on Form 8-K filed by the Partnership on August 18, 2014). | |
| 10.28† | Employment Agreement, entered into as of December 30, 2014 and effective as of December 9, 2014, by and between Rentech, Inc. and Keith B. Forman (incorporated by reference to Exhibit 10.1 to the Current Report on Form 8-K/A filed by Rentech, Inc. and the Partnership on January 6, 2015). | |
| 10.29† | Inducement Total Shareholder Return Performance Share Award entered into as of December 30, 2014 by and between Rentech, Inc. and Keith B. Forman (incorporated by reference to Exhibit 10.2 to the Current Report on Form 8-K/A filed by Rentech, Inc. and the Partnership on January 6, 2015). | |
| 10.30† | Inducement Stock Option Grant Notice and Stock Option Agreement entered into as of December 30, 2014 by and between Rentech, Inc. and Keith B. Forman (incorporated by reference to Exhibit 10.3 to the Current Report on Form 8-K/A filed by Rentech, Inc. and the Partnership on January 6, 2015). | |
| 21.1** | List of Subsidiaries of Rentech Nitrogen Partners, L.P. | |
| 23.1** | Consent of Independent Registered Public Accounting Firm. | |
| 31.1** | Certification of Registrant’s Chief Executive Officer pursuant to Rule 13a-14(a) or Rule 15d-14(a). | |
| 31.2** | Certification of Registrant’s Chief Financial Officer pursuant to Rule 13a-14(a) or Rule 15d-14(a). | |
| 32.1** | Certification of Registrant’s Chief Executive Officer pursuant to 18 U.S.C. Section 1350. This certification is being furnished solely to accompany this Annual Report on Form 10-K and is not being filed for purposes of Section 18 of the Securities Exchange Act of 1934, as amended, and is not to be incorporated by reference into any filing of the Company. | |
| 32.2** | Certification of Registrant’s Chief Financial Officer pursuant to 18 U.S.C. Section 1350. This certification is being furnished solely to accompany this Annual Report on Form 10-K and is not being filed for purposes of Section 18 of the Securities Exchange Act of 1934, as amended, and is not to be incorporated by reference into any filing of the Company. | |
| 101 | The following financial information from the Partnership’s Annual Report on Form 10-K for the year ended December 31, 2014 formatted in Extensible Business Reporting Language (“XBRL”) includes: (i) the Consolidated Balance Sheets, (ii) the Consolidated Statements of Operations, (iii) the Consolidated Statements of Partners’ Capital, (iv) the Consolidated Statements of Cash Flows and (v) the Notes to Consolidated Financial Statements, detailed tagged. | |
| * | Schedules and exhibits have been omitted from this Exhibit pursuant to Item 601(b)(2) of Regulation S-K and are not filed herewith. The Partnership agrees to furnish supplementally a copy of the omitted schedules and exhibits to the Securities and Exchange Commission upon request. |
| ** | Included with this filing. |
| † | Management contract or compensatory plan or arrangement. |
| + | Certain portions of this Exhibit have been omitted and filed separately under an application for confidential treatment. |
146
Table of Contents
Pursuant to the requirements of Section 13 or 15(d) of the Securities Exchange Act of 1934, the registrant has duly caused this report to be signed on its behalf by the undersigned, thereunto duly authorized.
| RENTECH NITROGEN PARTNERS, L.P. | ||
| BY: | RENTECH NITROGEN GP, LLC, ITS GENERAL PARTNER | |
| /s/ Keith B. Forman | ||
| Keith B. Forman, | ||
| Chief Executive Officer | ||
Date: March 16, 2015
Pursuant to the requirements of the Securities Exchange Act of 1934, this report has been signed below by the following persons on behalf of the registrant and in the capacities and on the dates indicated.
| Signature |
Title |
Date | ||
| /S/ Keith B. Forman Keith B. Forman |
Chief Executive Officer and Director of Rentech Nitrogen GP, LLC (Principal Executive Officer) |
March 16, 2015 | ||
| /S/ DAN J. COHRS Dan J. Cohrs |
Chief Financial Officer of Rentech Nitrogen GP, LLC (Principal Financial Officer) |
March 16, 2015 | ||
| /S/ JEFFREY R. SPAIN Jeffrey R. Spain |
Senior Vice President and Treasurer of Rentech Nitrogen GP, LLC (Principal Accounting Officer) |
March 16, 2015 | ||
| /S/ JOHN H. DIESCH John H. Diesch |
President and Director of Rentech Nitrogen GP, LLC |
March 16, 2015 | ||
| /S/ MICHAEL S. BURKE Michael S. Burke |
Director of Rentech Nitrogen GP, LLC |
March 16, 2015 | ||
| /S/ JAMES F. DIETZ James F. Dietz |
Director of Rentech Nitrogen GP, LLC |
March 16, 2015 | ||
| /S/ MICHAEL F. RAY Michael F. Ray |
Director of Rentech Nitrogen GP, LLC |
March 16, 2015 | ||
| /S/ HALBERT S. WASHBURN Halbert S. Washburn |
Director of Rentech Nitrogen GP, LLC |
March 16, 2015 | ||
147