Attached files
| file | filename |
|---|---|
| 8-K - FORM 8-K - NTELOS HOLDINGS CORP. | d253623d8k.htm |
 Investor
Presentation November 2011
Exhibit 99.1 |
 Use of
Non-GAAP Financial Measures Included
in
this
presentation
are
certain
non-GAAP
financial
measures
that
are
not
determined
in
accordance
with
US
generally
accepted
accounting
principles.
These
financial
performance
measures
are
not
indicative
of
cash
provided
or
used
by
operating
activities
and
exclude
the
effects
of
certain
operating,
capital
and
financing
costs
and
may
differ
from
comparable
information
provided
by
other
companies,
and
they
should
not
be
considered
in
isolation,
as
an
alternative
to,
or
more
meaningful
than
measures
of
financial
performance
determined
in
accordance
with
US
generally
accepted
accounting
principles.
These
financial
performance
measures
are
commonly
used
in
the
industry
and
are
presented
because
NTELOS
believes
they
provide
relevant
and
useful
information
to
investors.
NTELOS
utilizes
these
financial
performance
measures
to
assess
its
ability
to
meet
future
capital
expenditure
and
working
capital
requirements,
to
incur
indebtedness
if
necessary,
and
to
fund
continued
growth.
NTELOS
also
uses
these
financial
performance
measures
to
evaluate
the
performance
of
its
business,
for
budget
planning
purposes
and
as
factors
in
its
employee
compensation
programs.
Please
review
the
reconciliations
of
non-GAAP
financial
measures
contained
in
the
press
release
filed
by
the
Company
with
the
SEC
on
Form
8-K
on
November
7,
2011.
Any
statements
contained
in
this
presentation
that
are
not
statements
of
historical
fact,
including
statements
about
our
beliefs
and
expectations,
are
forward-
looking
statements
and
should
be
evaluated
as
such.
The
words
“anticipates,”
“believes,”
“expects,”
“intends,”
“plans,”
“estimates,”
“targets,”
“projects,”
“should,”
“may,”
“will”
and
similar
words
and
expressions
are
intended
to
identify
forward-looking
statements.
Such
forward-looking
statements
reflect,
among
other
things,
our
current
expectations,
plans
and
strategies,
and
anticipated
financial
results,
all
of
which
are
subject
to
known
and
unknown
risks,
uncertainties
and
factors
that
may
cause
our
actual
results
to
differ
materially
from
those
expressed
or
implied
by
these
forward-looking
statements.
Many
of
these
risks
are
beyond
our
ability
to
control
or
predict.
Because
of
these
risks,
uncertainties
and
assumptions,
you
should
not
place
undue
reliance
on
these
forward-looking
statements.
Furthermore,
forward-looking
statements
speak
only
as
of
the
date
they
are
made.
We
do
not
undertake
any
obligation
to
update
or
review
any
forward-looking
information,
whether
as
a
result
of
new
information,
future
events
or
otherwise.
Important
factors
with
respect
to
any
such
forward-looking
statements,
including
certain
risks
and
uncertainties
that
could
cause
actual
results
to
differ
from
those
contained
in
the
forward-looking
statements,
include,
but
are
not
limited
to:
rapid
development
and
intense
competition
in
the
telecommunications
industry;
adverse
economic
conditions;
operating
and
financial
restrictions
imposed
by
our
senior
credit
facility;
our
cash
and
capital
requirements;
declining
prices
for
our
services;
the
potential
to
experience
a
high
rate
of
customer
turnover;
our
dependence
on
our
affiliation
with
Sprint
Nextel
(“Sprint”);
a
potential
increase
in
our
roaming
rates
and
wireless
handset
subsidy
costs;
increased
costs
to
support
continued
growth
of
data
usage
on
our
network;
the
potential
for
Sprint
to
build
networks
in
our
markets;
federal
and
state
regulatory
fees,
requirements
and
developments;
loss
of
our
cell
sites;
the
rates
of
penetration
in
the
wireless
telecommunications
industry;
and
our
reliance
on
certain
suppliers
and
vendors.
These
risks
and
uncertainties
are
not
intended
to
represent
a
complete
list
of
all
risks
and
uncertainties
inherent
in
our
business,
and
should
be
read
in
conjunction
with
the
more
detailed
cautionary
statements
and
risk
factors
included
in
our
SEC
filings,
including
our
Annual
Reports
filed
on
Forms
10-K.
Special Note Regarding Forward-Looking Statements
Presentation of Financial and Other Important Information
2 |
 NASDAQ
National Markets “NTLS” Headquartered in Waynesboro, VA
Spin-off of legacy wireline operations
Completed on October 31, 2011
Wireline operations now operate as Lumos Networks (NASDAQ: “LMOS”)
Who We Are
3 |
 Company
Overview Wireless
(both
postpay
and
prepaid)
subscribers
of
approximately
415,000
8.1
million
licensed
POPs;
covered
POPs
of
5.9
million
Wholesale
network
provider
to
Sprint
in
a
significant
portion
of
territory
86%
of
network
is
CDMA
3G
EVDO
Market
Cap
of
approximately
$470
million
(as
of
November
4,
2011)
Pro
Forma
LTM
Financials
as
of
September
30,
2011
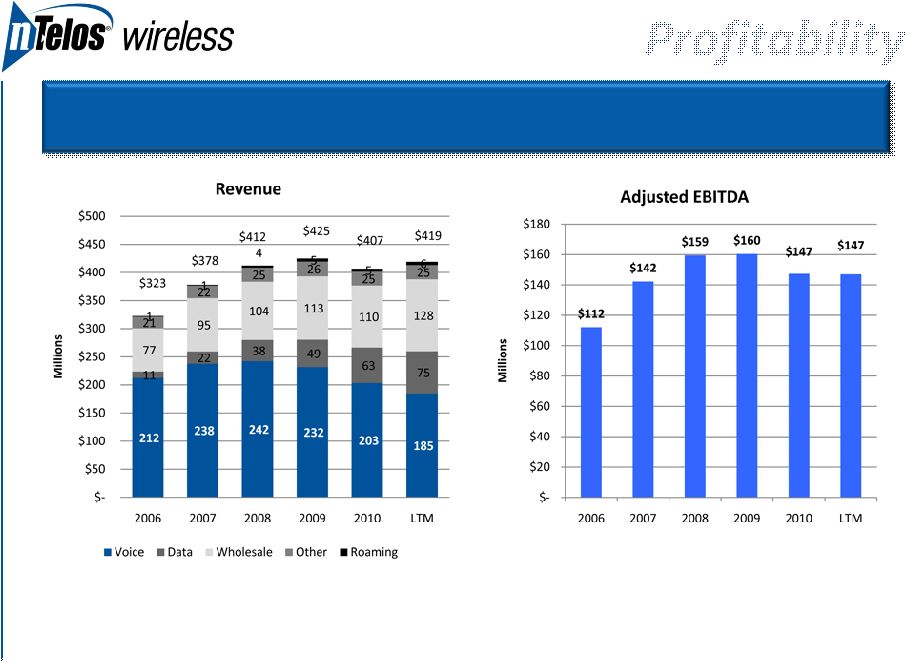
Revenue
of
$419
million
Adjusted
EBITDA
of
$142
million
Net
Debt
of
$403
million
with
Net
Debt
Leverage
of
2.8X
Who We Are
4
Notes:
“Adjusted
EBITDA”
is
defined
as
EBITDA
plus
ARO
accretion,
equity
based
compensation
charges,
acquisition
related
and
business
segment
charges.
“Net
Debt”
is
defined
as
total
debt
less
cash.
“Net
Debt
Leverage”
is
defined
as
Net
Debt
divided
by
Adjusted
EBITDA. |
 Leading
“pure-play” regional wireless company
Platform for organic and strategic growth
Unique growth and income investment opportunity
Wholesale revenue continues to grow
NTELOS declared $0.42/share dividend on 11/3/11, payable on 1/12/12
Strong Free Cash Flow characteristics
Attractive strategic asset set
Exclusive network provider to Sprint in region
Unique network footprint in Mid-Atlantic region
Experienced senior management team
Investment Rationale
5
Note: “Free Cash Flow”
is defined as Adjusted EBITDA less capital expenditures.
|
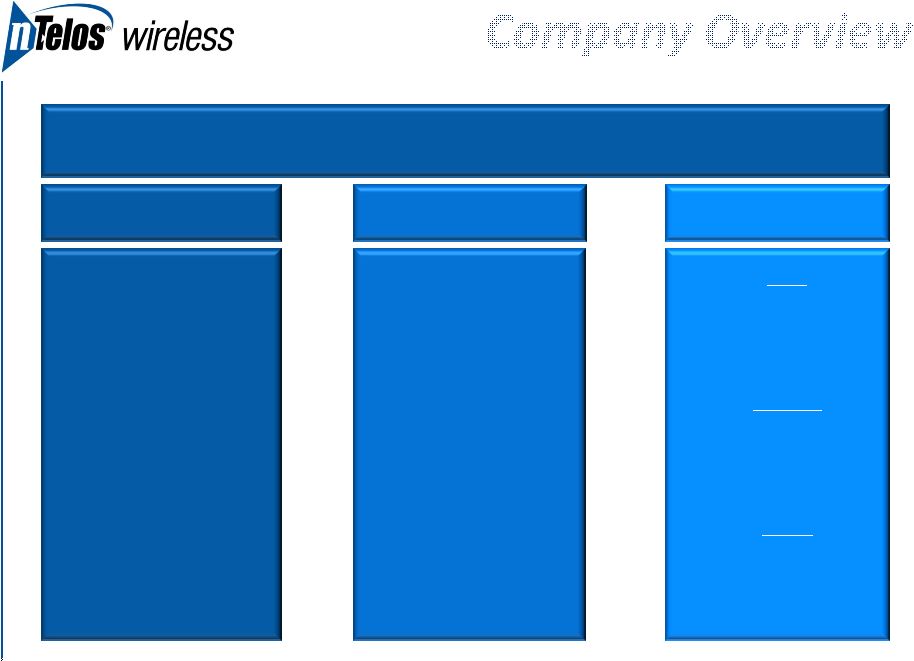
 6
NTELOS Covered Network
Sprint Wholesale Markets
Strategic Network Assets
Where We Operate |
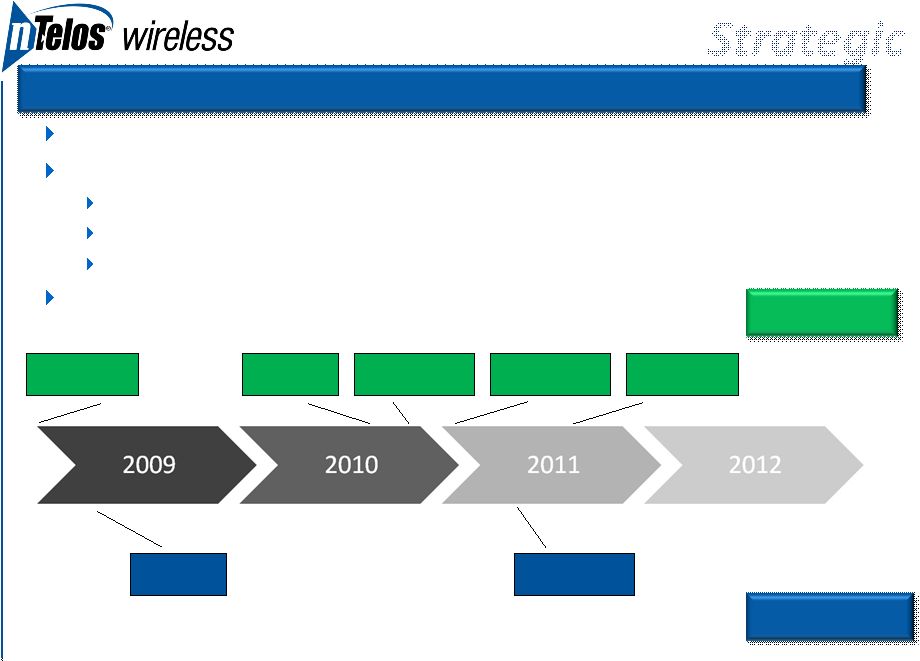
 Poised for
Growth Wholesale revenue from Sprint up 22% YOY (Sprint calculated revenue
excluding support from the $9 million minimum is up 33% YOY)
Postpay Data ARPU up 22% YOY
Profitable
5 years of minimum 35% Adjusted EBITDA margin
21% 5 year FCF margin
Stable
Diverse revenue stream from postpaid, prepaid and wholesale customers
Strategic
Exclusive relationship with Sprint through July 2015
Unique network footprint in Mid-Atlantic region
7
Note: Results for the nine months ending September 30, 2011.
Poised for Growth. Profitable. Stable. Strategic |
 NTELOS
Retail Wireless Strategy 8
Mission
Mission
Vision
Vision
Strategic
Strategic
Differentiators
Differentiators
We
We
Inspire
Inspire
Loyalty
Loyalty
Highest in revenue
Highest in revenue
and subscriber
and subscriber
market share growth
market share growth
of all carriers in our
of all carriers in our
markets
markets
through 2016
through 2016
Value
Value
Unlimited nationwide
Unlimited nationwide
plans always less
plans always less
expensive than AT&T and
expensive than AT&T and
Verizon Wireless
Verizon Wireless
Simplicity
Simplicity
Cutting through the
Cutting through the
complexity with simple,
complexity with simple,
customer friendly
customer friendly
products and plans
products and plans
Service
Service
Creating “raving fans,”
leveraging local retail and
customer service
presence |
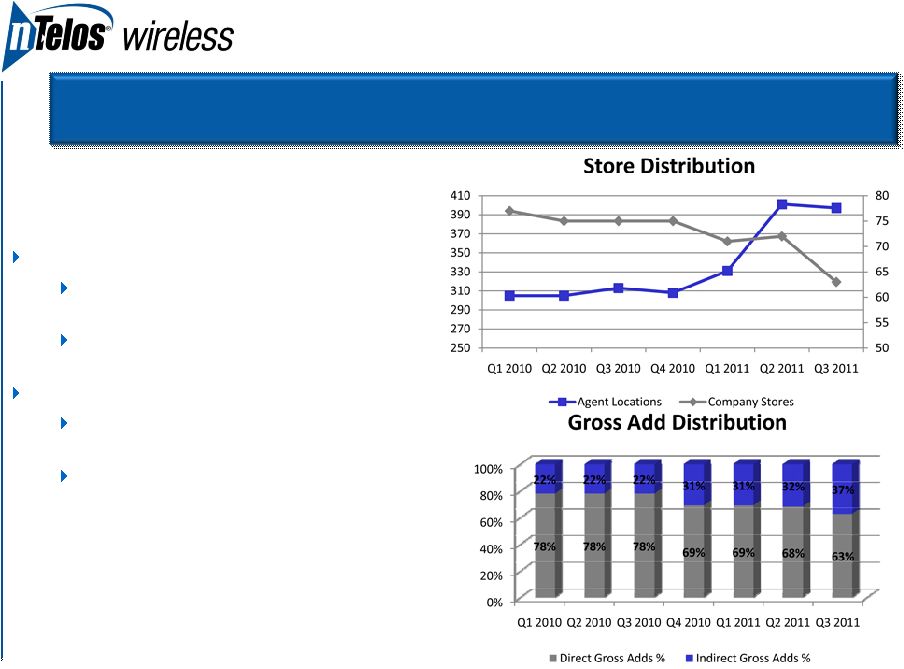 Redefined
distribution strategy NTELOS Owned Retail Stores
55% of NTELOS owned retail stores will
have new look by the end of 2011
A majority of remaining NTELOS owned
retail stores will be retrofitted in 2012
Indirect Distribution Expansions
Significant growth in Indirect channel from
313 doors in 3Q10 to 397 in 3Q 2011.
Grew the number of Exclusive Retail
Partners (ERP’s) from 18 in 3Q 2010 to 52
in 3Q 2011.
9
9
Platform for Organic Growth –
Distribution Strategy |
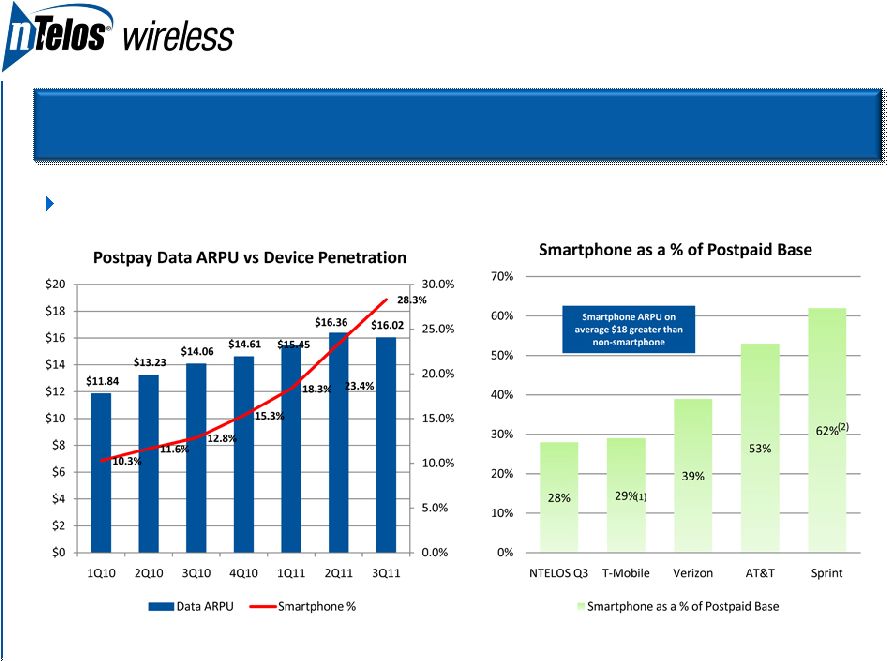 10
Increased smartphone penetration drives ARPU and lowers churn
10
(1)
Q211 –
Have not reported Q311
(2)
% of CDMA Postpay base
Platform for Organic Growth –
Smartphone Explosion |
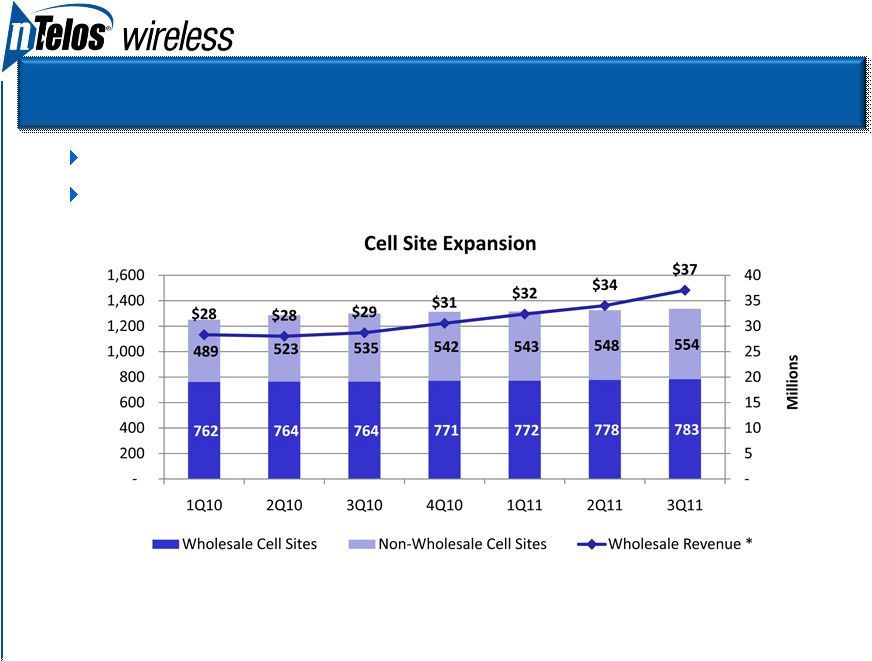 11
Network investments driving wholesale revenue growth
Sprint wholesale revenue up 33% YOY*
Platform for Organic Growth –
Wholesale Revenues
•
Excluding support from the contracted minimums in the prior year. •
Wholesale Revenue shown above is Total Wholesale Revenue, which includes revenue from Sprint. |
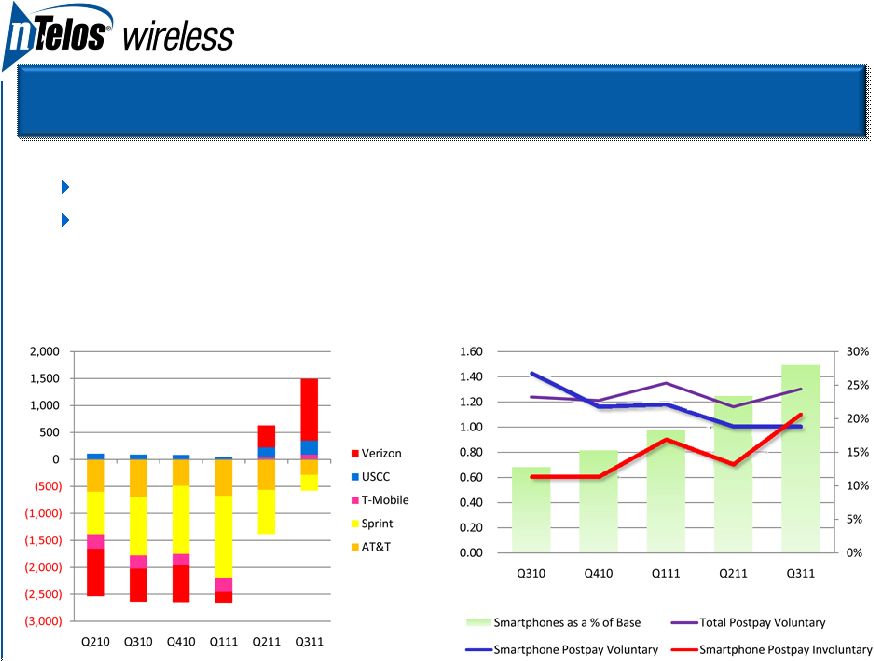 12
Subscriber ports now net positive for first time since July 2007
Smartphone customers have better churn characteristics
Wireless Number Porting
Postpay Voluntary Churn (%)
Leading Indicators Support Strategy and Execution |
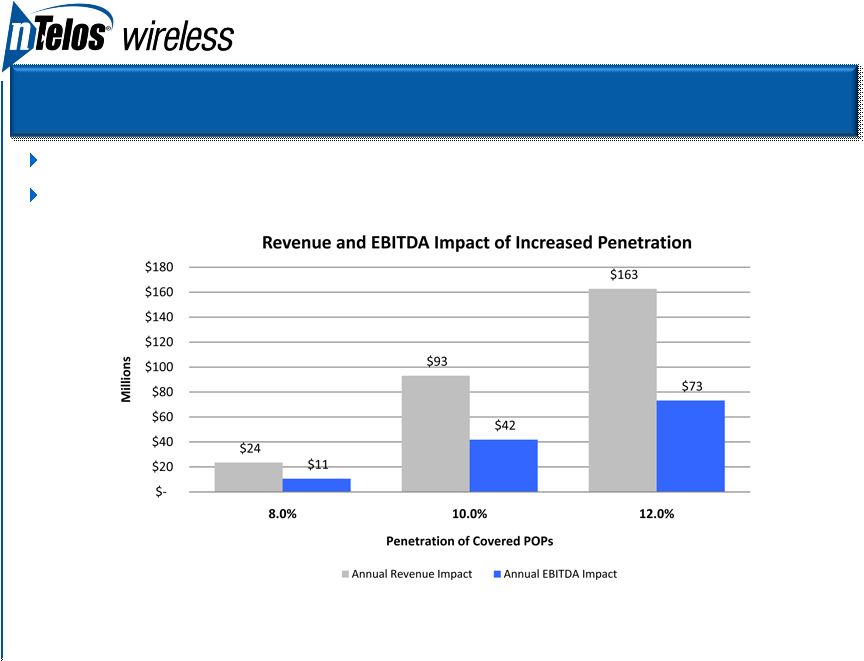 13
Moderate increases in penetration provide substantial retail revenue and EBITDA growth
1% increase in market share = 58k incremental subs
* Assumes current subscriber base mix at higher penetration and applies operating financial
metrics to illustrate subscriber base. * Assumes 45% incremental EBITDA margin.
* Current NTELOS combined share in all markets is 7.3%.
“Size of the Prize” |
 14
Network upgrade to EVDO drove revenue growth
Note: CAPEX numbers exclude IT.
Investment in EVDO |
 Fast follower
with LTE Well positioned with Sprint for technology upgrade
LightSquared
Clearwire
Stand alone
LTE field trials completed
Industry Milestones
NTELOS Milestones
VZ launch in 30
cities
First LTE Device
Introduced
15
EVDO Build
Completion
Metro PCS
initial Launch
AT&T launch in
10 cities
Sprint WiMAX
in Baltimore
LTE Field Trials
Completed
4G Roadmap |
 Financial
Summary |
 17
Managing to Growth |
 18
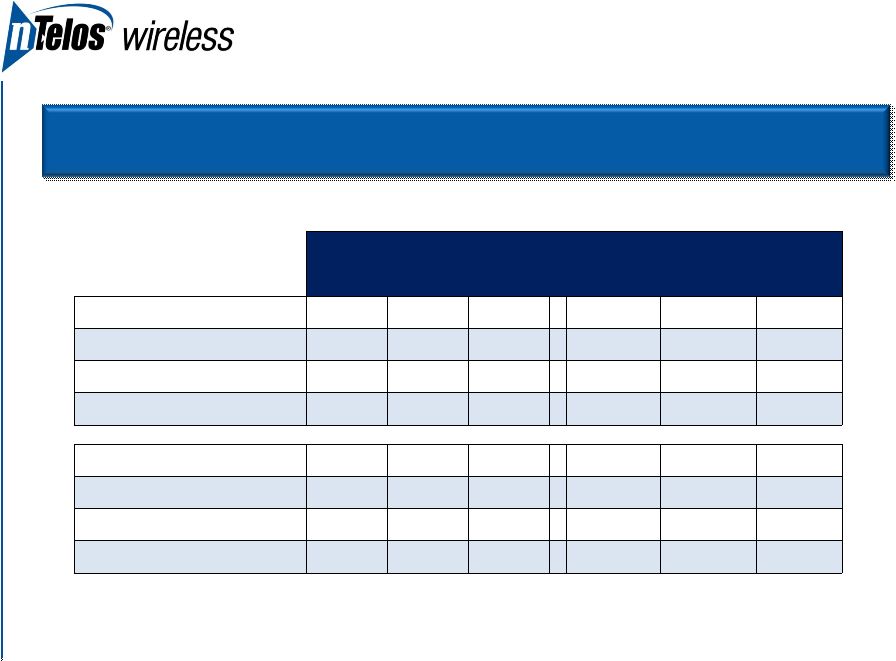
Financial Overview
2009
2010
LTM
Sept YTD 2010
Sept YTD 2011
YOY Delta
Gross Adds (000s)
176
165
161
120
117
(4)
Ending Subscribers (000s)
439
432
415
434
415
(19)
ARPU -
blended
$53.20
$50.85
$50.54
$50.60
$50.18
($0.42)
Churn -
blended
3.27%
3.25%
3.50%
3.17%
3.50%
-0.33%
Revenue ($mm)
$425
$407
$419
$304
$317
13
Adjusted EBITDA ($mm)
$162
$148
$147
$113
$112
($1)
CAPEX ($mm)
$51
$39
$45
$30
$36
($6)
FCF ($mm)
$111
$109
$102
$83
$77
$7 |
 19
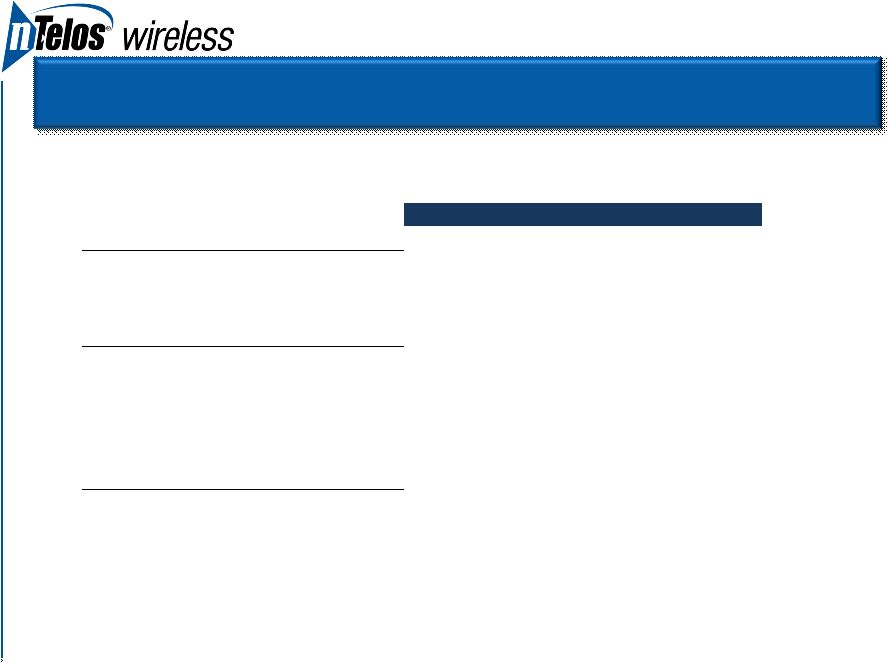
Financial Overview
* As of earnings conference call on 11/8/11.
(in millions)
2010
LTM
Pro Forma Results
Pro Forma Revenue
$407
$419
Pro Forma Adjusted EBITDA
$142
$142
Pro Forma Capitalization (as of 9/30/11)
Cash
$58
Total Debt
$461
Net Debt
$403
Net Debt Leverage
2.8x
Guidance for Fourth Quarter 2011*
Adjusted EBITDA
Between
$33mm -
$35mm
CAPEX
Between
$13mm -
$15mm |
 20
Jim Hyde, CEO, President and Director
Former T-Mobile USA / Western Wireless / VoiceStream Sr. Exec
Former CEO, T-Mobile UK
17 years industry experience
Steb Chandor, EVP, CFO and Treasurer
Former CFO, iPCS Wireless
Former CFO, Metro One
16 years industry experience
Conrad Hunter, EVP, COO
Former COO, iPCS Wireless
Former VP of Midwest Operations, U.S. Cellular Corporation
32 years industry experience
Senior Executives –
Wireless Veterans |
 Leading
“pure-play” regional wireless company
Platform for organic and strategic growth
Unique growth and income investment opportunity
Wholesale revenue at an all time high and growing
NTELOS declared $0.42/share dividend on 11/3/11 payable on 1/12/12
Strong Free Cash Flow characteristics
Attractive strategic asset set
Exclusive network provider to Sprint in region
Unique network footprint in Mid-Atlantic region
Experienced senior management team
Investment Rationale
21 |
 Investor
Presentation November 2011 |