Attached files
| file | filename |
|---|---|
| 8-K - 8-K - TCF FINANCIAL CORP | a11-28234_18k.htm |
Exhibit 99.1
NEWS RELEASE
CONTACT: Jason Korstange
(952) 745-2755
www.tcfbank.com
FOR IMMEDIATE RELEASE

TCF FINANCIAL CORPORATION 200 Lake Street East, Wayzata, MN 55391-1693
TCF Reports 66th Consecutive Quarter of Net Income – Earns $31.7 Million
THIRD QUARTER HIGHLIGHTS
· Diluted earnings per common share of 20 cents
· Net income of $31.7 million
· Net interest margin of 3.96 percent
· Average deposits increased $113.3 million from the second quarter of 2011
· Non-performing assets declined $20.1 million from the second quarter of 2011
· Announced quarterly cash dividend of 5 cents per common share, payable November 30, 2011
|
Earnings Summary |
|
|
|
|
|
|
|
|
|
|
|
|
|
|
|
Table 1 |
|
|
|
|
|
|
|
|
|
|
|
|
|
|
|
|
|
|
|
|
|
($ in thousands, except per-share data) |
|
|
|
|
|
|
Percent Change |
|
|
|
|
|
|
| |||
|
|
|
3Q |
|
2Q |
|
3Q |
|
3Q11 vs |
|
3Q11 vs |
|
YTD |
|
YTD |
|
Percent |
|
|
Net income |
|
$31,717 |
|
$29,837 |
|
$36,893 |
|
6.3% |
|
(14.0)% |
|
$91,240 |
|
$115,839 |
|
(21.2)% |
|
|
Diluted earnings per common share |
|
.20 |
|
.19 |
|
.26 |
|
5.3 |
|
(23.1) |
|
.59 |
|
.84 |
|
(29.8) |
|
|
|
|
|
|
|
|
|
|
|
|
|
|
|
|
|
|
|
|
|
Financial Ratios (1) |
|
|
|
|
|
|
|
|
|
|
|
|
|
|
|
|
|
|
Return on average assets |
|
.69 |
% |
.67 |
% |
.84 |
% |
|
|
|
|
.68 |
% |
.87 |
% |
|
|
|
Return on average common equity |
|
7.00 |
|
6.86 |
|
9.95 |
|
|
|
|
|
7.20 |
|
11.11 |
|
|
|
|
Net interest margin |
|
3.96 |
|
4.02 |
|
4.14 |
|
|
|
|
|
4.01 |
|
4.18 |
|
|
|
|
Net charge-offs as a percentage of average loans and leases |
|
1.48 |
|
1.19 |
|
1.58 |
|
|
|
|
|
1.39 |
|
1.37 |
|
|
|
|
|
|
|
|
|
|
|
|
|
|
|
|
|
|
|
|
|
|
|
(1) Annualized. |
|
|
|
|
|
|
|
|
|
|
|
|
|
|
|
|
|
-more-
WAYZATA, MN, October 20, 2011 – TCF Financial Corporation (“TCF”) (NYSE: TCB) today reported net income for the third quarter of 2011 of $31.7 million, compared with $36.9 million in the third quarter of 2010 and $29.8 million in the second quarter of 2011. Diluted earnings per common share was 20 cents for the third quarter of 2011, compared with 26 cents in the third quarter of 2010 and 19 cents in the second quarter of 2011.
Net income for the first nine months of 2011 was $91.2 million, compared with $115.8 million for the same 2010 period. Diluted earnings per common share for the first nine months of 2011 was 59 cents, compared with 84 cents for the same 2010 period.
TCF declared a quarterly cash dividend of five cents per common share payable on November 30, 2011 to stockholders of record at the close of business on October 28, 2011.
Chairman’s Statement
“TCF’s 66th consecutive quarter of profitability showed an increase in revenue from the second quarter, a decrease in operating expenses and continued improvement in credit metrics as balances of both non-accrual loans and leases and real estate owned decreased in the quarter,” said William A. Cooper, TCF Chairman and Chief Executive Officer. “Our continued hard work on the credit front is delivering results despite little to no help from the economy as unemployment rates remain elevated and job growth is stagnant. Increased liquidity is negatively impacting TCF’s net interest margin as the balance sheet contracted slightly during the quarter. But while these near-term challenges are considerable, the company is taking significant steps to improve its positioning.
“During the quarter, we announced a significant agreement with BRP, one of the world’s premier manufacturers of powersports equipment, which we anticipate will deliver significant loan balances in both the U.S. and Canada to our inventory finance business beginning in 2012. We also announced the signing of a definitive agreement to acquire Gateway One Lending & Finance that will provide additional growth and diversity for our specialty finance business through a new consumer-oriented product – automobile lending. We expect both of these actions will help to grow the loan and lease portfolio, improve its diversification by both geography and asset class and help TCF grow its revenue base going forward.
-more-
“Recently, we began making changes to our checking account lineup including the implementation of the Daily Overdraft Service product in all markets. We believe this product, which eliminates per-item NSF fees at TCF, has the best long-term potential for revenue growth and is straightforward and transparent to our customers. We will continue to evaluate and implement additional revenue-producing and expense reduction strategies throughout the company to mitigate lost revenues resulting from increased legislative, regulatory and compliance burdens.”
|
Total Revenue |
|
|
|
|
|
|
|
|
|
|
|
|
|
Table 2 |
| |||
|
|
|
|
|
|
|
|
|
Percent Change |
|
|
|
|
|
|
| |||
|
($ in thousands) |
|
3Q |
|
2Q |
|
3Q |
|
3Q11 vs |
|
3Q11 vs |
|
YTD |
|
YTD |
|
Percent |
| |
|
Net interest income |
|
$176,064 |
|
$176,150 |
|
$173,755 |
|
N.M. |
|
1.3% |
|
$526,254 |
|
$524,916 |
|
.3 |
% |
|
|
Fees and other revenue: |
|
|
|
|
|
|
|
|
|
|
|
|
|
|
|
|
|
|
|
Fees and service charges |
|
58,452 |
|
56,396 |
|
67,684 |
|
3.6 |
|
(13.6) |
|
168,361 |
|
211,701 |
|
(20.5 |
) |
|
|
Card revenue |
|
27,701 |
|
28,219 |
|
27,779 |
|
(1.8) |
|
(.3) |
|
82,504 |
|
83,442 |
|
(1.1 |
) |
|
|
ATM revenue |
|
7,523 |
|
7,091 |
|
7,985 |
|
6.1 |
|
(5.8) |
|
21,319 |
|
22,851 |
|
(6.7 |
) |
|
|
Total banking fees |
|
93,676 |
|
91,706 |
|
103,448 |
|
2.1 |
|
(9.4) |
|
272,184 |
|
317,994 |
|
(14.4 |
) |
|
|
Leasing and equipment |
|
21,646 |
|
22,279 |
|
24,912 |
|
(2.8) |
|
(13.1) |
|
70,675 |
|
65,792 |
|
7.4 |
|
|
|
Other |
|
786 |
|
384 |
|
1,077 |
|
104.7 |
|
(27.0) |
|
1,864 |
|
4,767 |
|
(60.9 |
) |
|
|
Total fees and other revenue |
|
116,108 |
|
114,369 |
|
129,437 |
|
1.5 |
|
(10.3) |
|
344,723 |
|
388,553 |
|
(11.3 |
) |
|
|
Subtotal |
|
292,172 |
|
290,519 |
|
303,192 |
|
.6 |
|
(3.6) |
|
870,977 |
|
913,469 |
|
(4.7 |
) |
|
|
Gains (losses) on securities |
|
1,648 |
|
(227 |
) |
8,505 |
|
N.M. |
|
(80.6) |
|
1,421 |
|
7,938 |
|
(82.1 |
) |
|
|
Total revenue |
|
$293,820 |
|
$290,292 |
|
$311,697 |
|
1.2 |
|
(5.7) |
|
$872,398 |
|
$921,407 |
|
(5.3 |
) |
|
|
|
|
|
|
|
|
|
|
|
|
|
|
|
|
|
|
|
|
|
|
Net interest margin(1) |
|
3.96 |
% |
4.02 |
% |
4.14 |
% |
|
|
|
|
4.01 |
% |
4.18 |
% |
|
|
|
|
Fees and other revenue as |
|
39.52 |
|
39.40 |
|
41.53 |
|
|
|
|
|
39.51 |
|
42.17 |
|
|
|
|
|
|
|
|
|
|
|
|
|
|
|
|
|
|
|
|
|
|
|
|
|
N.M. = Not meaningful. |
|
|
|
|
|
|
|
|
|
|
|
|
|
|
|
|
|
|
|
(1) Annualized. |
|
|
|
|
|
|
|
|
|
|
|
|
|
|
|
|
|
|
Net Interest Income
· Net interest income for the third quarter of 2011 increased $2.3 million, or 1.3 percent compared with the third quarter of 2010 and was flat with the second quarter of 2011. The increase in net interest income from the third quarter of 2010 was primarily due to reductions in deposit rates, reduced interest expense on long-term borrowings and additional interest earned due to loan growth in inventory finance, partially offset by reduced interest income on consumer real estate loans, as lower yielding variable-rate loans replaced higher yielding fixed-rate loans.
· Net interest margin in the third quarter of 2011 was 3.96 percent compared with 4.14 percent in the third quarter of 2010 and 4.02 percent in the second quarter of 2011. The decrease in net interest margin from
-more-
both periods was primarily due to increased asset liquidity and growth in lower yielding loans and leases as a result of the lower interest rate environment. These changes were partially offset by a lower average cost of deposits and borrowings.
· As a result of higher regulatory liquidity expectations across the industry and lower customer demand for credit, TCF continued to increase its asset liquidity during the third quarter of 2011. Interest-bearing deposits held at the Federal Reserve and unencumbered securities were $1.5 billion at September 30, 2011, an increase of $625 million from the second quarter of 2011 and $1.3 billion from the third quarter of 2010. The increased asset liquidity position, which includes maintaining interest-bearing cash in anticipation of the future redemption of the trust preferred securities, negatively impacted net interest margin for the third quarter of 2011 by 21 basis points compared to the third quarter of 2010 and by 4 basis points from the second quarter of 2011.
Non-interest Income
· Banking fees and service charges in the third quarter of 2011 were $58.5 million, down $9.2 million, or 13.6 percent, from the third quarter of 2010 and up $2.1 million, or 3.6 percent, from the second quarter of 2011. The decrease in banking fees and services charges from the third quarter of 2010 was primarily due to the impact of a full quarter of decreased activity-based fee revenue as a result of a change in overdraft fee regulations in August 2010 and lower monthly maintenance fees as more customers qualified for fee waivers. The increase in banking fees and service charges from the second quarter of 2011 was primarily due to increased transaction activity.
· Card revenues were $27.7 million in the third quarter of 2011, flat with the third quarter of 2010 and down $518 thousand, or 1.8 percent, from the second quarter of 2011. Compared with the third quarter of 2010, a decrease in average interchange rates in the third quarter of 2011 was mostly offset by an increase in the average size and volume of transactions. The decrease in card revenue from the second quarter of 2011 was primarily due to lower sales volumes and lower average interchanges fees per transaction.
· On June 29, 2011, the Federal Reserve issued its final debit card interchange rules, establishing a debit card interchange fee cap. These rules became effective October 1, 2011, and apply to issuers that,
-more-
together with their affiliates, have assets of $10 billion or more. These regulations are estimated to reduce TCF’s card interchange revenue by approximately $15 million in the fourth quarter of 2011. TCF expects to start seeing the results of various mitigation efforts beginning in the first quarter of 2012.
· Leasing and equipment finance revenues were $21.6 million in the third quarter of 2011, down $3.3 million, or 13.1 percent, from the third quarter of 2010 and down $633 thousand, or 2.8 percent, from the second quarter of 2011. Decreases from both the third quarter of 2010 and second quarter of 2011 were attributable to lower levels of customer initiated lease activity.
· Non-interest income related to gains on sales of securities is down $6.9 million from the third quarter of 2011, and down $6.5 million for the nine months ended September 30, 2011, compared with the same 2010 periods.
Loans and Leases
|
Average Loans and Leases |
|
|
|
|
|
|
|
|
|
|
|
|
|
Table 3 |
| ||
|
|
|
|
|
|
|
|
|
Percent Change |
|
|
|
|
|
|
| ||
|
($ in thousands) |
|
3Q |
|
2Q |
|
3Q |
|
3Q11 vs |
|
3Q11 vs |
|
YTD |
|
YTD |
|
Percent |
|
|
Consumer real estate |
|
|
|
|
|
|
|
|
|
|
|
|
|
|
|
|
|
|
First mortgage lien |
|
$ 4,808,881 |
|
$ 4,838,896 |
|
$ 4,935,583 |
|
(.6) % |
|
(2.6) % |
|
$ 4,836,953 |
|
$ 4,937,578 |
|
(2.0) % |
|
|
Junior lien |
|
2,176,940 |
|
2,195,552 |
|
2,297,433 |
|
(.8) |
|
(5.2) |
|
2,203,365 |
|
2,304,335 |
|
(4.4) |
|
|
Total |
|
6,985,821 |
|
7,034,448 |
|
7,233,016 |
|
(.7) |
|
(3.4) |
|
7,040,318 |
|
7,241,913 |
|
(2.8) |
|
|
Consumer other |
|
18,183 |
|
19,463 |
|
25,130 |
|
(6.6) |
|
(27.6) |
|
19,788 |
|
27,687 |
|
(28.5) |
|
|
Total consumer |
|
7,004,004 |
|
7,053,911 |
|
7,258,146 |
|
(.7) |
|
(3.5) |
|
7,060,106 |
|
7,269,600 |
|
(2.9) |
|
|
Commercial |
|
3,564,198 |
|
3,597,644 |
|
3,673,848 |
|
(.9) |
|
(3.0) |
|
3,594,884 |
|
3,699,195 |
|
(2.8) |
|
|
Leasing and |
|
3,066,208 |
|
3,068,550 |
|
3,002,714 |
|
(.1) |
|
2.1 |
|
3,084,613 |
|
3,022,487 |
|
2.1 |
|
|
Inventory finance |
|
826,198 |
|
978,505 |
|
655,485 |
|
(15.6) |
|
26.0 |
|
889,709 |
|
634,182 |
|
40.3 |
|
|
Total |
|
$14,460,608 |
|
$14,698,610 |
|
$14,590,193 |
|
(1.6) |
|
(.9) |
|
$14,629,312 |
|
$14,625,464 |
|
N.M. |
|
|
|
|
|
|
|
|
|
|
|
|
|
|
|
|
|
|
|
|
|
N.M. Not meaningful |
|
|
|
|
|
|
|
|
|
|
|
|
|
|
|
|
|
· Average consumer real estate loan balances decreased $247.2 million, or 3.4 percent, from the third quarter of 2010 and declined $48.6 million from the second quarter of 2011. Decreases reflect a decline in production of new loans along with a more competitive environment for those borrowers who meet TCF’s underwriting criteria.
· Variable-rate consumer real estate loans increased $179.9 million from September 30, 2010 and $13.7 million from June 30, 2011, while fixed-rate consumer real estate loans decreased $427.1 million from September 30, 2010 and $62.3 million from June 30, 2011. Variable-rate loans comprised 34.5 percent of
-more-
total consumer real estate loans at September 30, 2011, up from 31.6 percent at September 30, 2010 and 34.1 percent at June 30, 2011.
· Average commercial loan balances in the third quarter of 2011 decreased $109.7 million, or 3 percent, from the third quarter of 2010 and decreased $33.4 million, or .9 percent, from the second quarter of 2011. The decreases for both periods were primarily due to higher levels of repayments.
· Average leasing and equipment finance loan and lease balances in the third quarter of 2011 increased $63.5 million, or 2.1 percent, from the third quarter of 2010 and were flat with the second quarter of 2011. The increase from the third quarter of 2010 was primarily due to a growth in the middle market segment, partially offset by runoff of portfolios acquired during 2008, 2009 and 2010. Leasing and equipment finance originations of $1 billion during the first nine months of 2011 represent an increase of $119.6 million, or 13.5 percent, compared to the first nine months of 2010.
· Average inventory finance loans were $826.2 million in the third quarter of 2011, an increase of $170.7 million, or 26 percent, from the third quarter of 2010. Average inventory finance loans decreased $152.3 million, or 15.6 percent, from the second quarter of 2011. The increase from the third quarter of 2010 was primarily due to TCF’s entrance into the powersports industry late in the third quarter of 2010. The decrease from the second quarter of 2011 was primarily due to a seasonal decline in receivables in the lawn and garden programs and the transitioning of an electronics and appliance program to a servicing only program, partially offset by growth in powersports and other programs.
-more-
Credit Quality
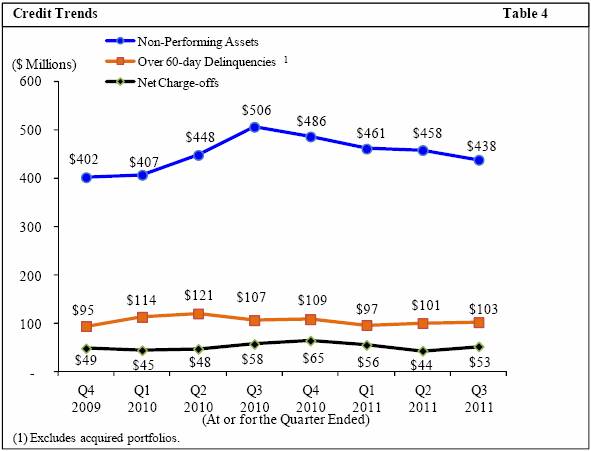
· Overall favorable trends in non-performing assets continue and over 60-day delinquencies and charge-offs remain below peak levels in 2010.
-more-
|
Credit Quality Summary of Performing and Underperforming Loans and Leases |
|
Table 5 | ||||||||||||||||||||
|
($ in thousands) |
|
Performing Loans and Leases |
|
60+ Days |
|
Accruing |
|
Non-accrual |
|
Total Loans |
| |||||||||||
|
September 30, 2011: |
|
Non-classified |
|
Classified(1) |
|
Total |
|
Accruing(2) |
|
TDRs |
|
Loans and Leases |
|
and Leases |
| |||||||
|
Consumer real estate and other |
|
$ |
6,405,059 |
|
$ |
- |
|
$ |
6,405,059 |
|
$ |
71,179 |
|
$ |
378,773 |
|
$ |
148,898 |
|
$ |
7,003,909 |
|
|
Commercial |
|
2,969,048 |
|
304,613 |
|
3,273,661 |
|
1,266 |
|
87,610 |
|
133,260 |
|
3,495,797 |
| |||||||
|
Leasing and equipment finance |
|
2,953,215 |
|
28,574 |
|
2,981,789 |
|
4,709 |
|
860 |
|
24,437 |
|
3,011,795 |
| |||||||
|
Inventory finance |
|
819,727 |
|
7,102 |
|
826,829 |
|
308 |
|
- |
|
1,077 |
|
828,214 |
| |||||||
|
Total loans and leases |
|
$ |
13,147,049 |
|
$ |
340,289 |
|
$ |
13,487,338 |
|
$ |
77,462 |
|
$ |
467,243 |
|
$ |
307,672 |
|
$ |
14,339,715 |
|
|
Percent of total loans and leases |
|
91.7% |
|
2.4% |
|
94.1% |
|
.5% |
|
3.3% |
|
2.1% |
|
100.0% |
| |||||||
|
|
|
|
|
|
|
|
|
|
|
|
|
|
|
|
| |||||||
|
|
|
Performing Loans and Leases |
|
60+ Days |
|
Accruing |
|
Non-accrual |
|
Total Loans |
| |||||||||||
|
June 30, 2011: |
|
Non-classified |
|
Classified(1) |
|
Total |
|
Accruing(2) |
|
TDRs |
|
Loans and Leases |
|
and Leases |
| |||||||
|
Consumer real estate and other |
|
$ |
6,472,696 |
|
$ |
- |
|
$ |
6,472,696 |
|
$ |
67,819 |
|
$ |
364,297 |
|
$ |
150,938 |
|
$ |
7,055,750 |
|
|
Commercial |
|
3,068,726 |
|
353,500 |
|
3,422,226 |
|
899 |
|
50,863 |
|
140,407 |
|
3,614,395 |
| |||||||
|
Leasing and equipment finance |
|
2,987,135 |
|
32,566 |
|
3,019,701 |
|
5,436 |
|
1,059 |
|
29,682 |
|
3,055,878 |
| |||||||
|
Inventory finance |
|
900,630 |
|
4,509 |
|
905,139 |
|
149 |
|
- |
|
634 |
|
905,922 |
| |||||||
|
Total loans and leases |
|
$ |
13,429,187 |
|
$ |
390,575 |
|
$ |
13,819,762 |
|
$ |
74,303 |
|
$ |
416,219 |
|
$ |
321,661 |
|
$ |
14,631,945 |
|
|
Percent of total loans and leases |
|
91.8% |
|
2.7% |
|
94.5% |
|
.5% |
|
2.8% |
|
2.2% |
|
100.0% |
| |||||||
|
|
|
|
|
|
|
|
|
|
|
|
|
|
|
|
| |||||||
|
(1) Excludes classified loans and leases that are 60+ days delinquent and accruing or accruing TDRs. |
|
|
| |||||||||||||||||||
|
(2) Excludes accruing TDRs that are 60+ days delinquent. |
|
|
| |||||||||||||||||||
At September 30, 2011:
· The combined balance of performing classified loans and leases, over 60-day delinquent and accruing loans and leases, accruing trouble debt restructurings (“TDR”) and non-accrual loans and leases decreased $10.1 million from the second quarter of 2011, down for the third consecutive quarter. This was primarily due to an increase in payments received on commercial and leasing and equipment finance non-accrual loans and leases and movement of non-accrual loans to other real estate owned.
· On July 1, 2011, TCF adopted a new accounting standard for determining if a loan modification is a TDR in response to new accounting guidance. The adoption of this standard increased accruing TDRs by $45.5 million and reserves on impaired loans by $2.2 million related to loans that were modified in 2011 but were not TDRs under standards in place at that time. The June 30, 2011 balances of TDRs have been revised from previously reported amounts to conform to the new standard. At September 30, 2011, the over 60-day delinquency rate on accruing consumer real estate TDRs was 6.8 percent, essentially flat with the second quarter of 2011.
· Over 60-day delinquency rate was .75 percent, down from .78 percent at September 30, 2010 and up from .73 percent at June 30, 2011. The decrease from the third quarter of 2010 was primarily due to decreases
-more-
in consumer real estate delinquencies and specialty finance delinquencies. The increase from the second quarter of 2011 was primarily due to an increase in consumer real estate delinquencies, partially offset by lower commercial real estate delinquencies.
· Total non-accrual loans and leases and other real estate owned (non-performing assets) were $438.1 million at September 30, 2011, a decrease of $67.9 million, or 13.4 percent, from September 30, 2010 and a decrease of $20.1 million, or 4.4 percent, from June 30, 2011, the fourth consecutive quarter of declining non-performing assets. Non-accrual loans and leases decreased $62.1 million, or 16.8 percent, from September 30, 2010. This change resulted from a $44.6 million decrease in commercial and leasing and equipment finance non-accrual loans and leases due to fewer additions and increased charge-offs and payments, and a $17.7 million decrease in consumer real estate non-accrual loans, as fewer loans were placed on non-accrual and more loans returned to accrual status, partially offset by a slight increase in inventory finance. TCF continues to see improvements in non-accrual loans and leases as additions are down $105.8 million and loans returning to accrual status were up $27.4 million for the nine months ended September 30, 2011, compared with the prior year period.
· Other real estate owned was $130.4 million at September 30, 2011, a decrease of $6.1 million from June 30, 2011. This decrease was primarily due to a decrease in consumer properties, as sales of consumer real estate properties exceeded additions during the quarter.
-more-
Allowance for Loan and Lease Losses
|
Credit Quality Summary |
|
|
|
|
|
|
|
|
|
|
|
|
|
|
|
Table 6 |
| |||||
|
|
|
|
|
|
|
|
|
Percent Change |
|
|
|
|
|
|
| |||||||
|
($ in thousands) |
|
3Q |
|
2Q |
|
3Q |
|
3Q11 vs |
|
3Q11 vs |
|
YTD |
|
YTD |
|
Percent |
| |||||
|
Allowance for Loan and Lease Losses |
|
|
|
|
|
|
|
|
|
|
|
|
|
|
|
|
| |||||
|
Balance at beginning of period |
|
$ |
255,472 |
|
$ |
255,308 |
|
$ |
251,643 |
|
.1 |
% |
1.5 |
% |
$ |
265,819 |
|
$ |
244,471 |
|
8.7 |
% |
|
Charge-offs |
|
(57,761) |
|
(48,457) |
|
(62,945) |
|
19.2 |
|
(8.2) |
|
(167,323) |
|
(167,150) |
|
.1 |
| |||||
|
Recoveries |
|
4,359 |
|
4,612 |
|
5,135 |
|
(5.5) |
|
(15.1) |
|
14,263 |
|
17,008 |
|
(16.1 |
) | |||||
|
Net charge-offs |
|
(53,402) |
|
(43,845) |
|
(57,810) |
|
21.8 |
|
(7.6) |
|
(153,060) |
|
(150,142) |
|
1.9 |
| |||||
|
Provision for credit losses |
|
52,315 |
|
44,005 |
|
59,287 |
|
18.9 |
|
(11.8) |
|
141,594 |
|
158,791 |
|
(10.8 |
) | |||||
|
Other |
|
(60) |
|
4 |
|
- |
|
N.M. |
|
N.M. |
|
(28) |
|
- |
|
N.M |
. | |||||
|
Balance at end of period |
|
$ |
254,325 |
|
$ |
255,472 |
|
$ |
253,120 |
|
(.4) |
|
.5 |
|
$ |
254,325 |
|
$ |
253,120 |
|
.5 |
|
|
|
|
|
|
|
|
|
|
|
|
|
|
|
|
|
|
|
| |||||
|
Net charge-offs as a percentage of |
|
|
|
|
|
|
|
|
|
|
|
|
|
|
|
|
| |||||
|
average loans and leases(1) |
|
|
|
|
|
|
|
|
|
|
|
|
|
|
|
|
| |||||
|
Consumer real estate and other: |
|
|
|
|
|
|
|
|
|
|
|
|
|
|
|
|
| |||||
|
First mortgage lien |
|
2.29 |
% |
1.78 |
% |
1.63 |
% |
51 |
bps |
66 |
bps |
1.96 |
% |
1.44 |
% |
52 |
bps | |||||
|
Junior lien |
|
2.99 |
|
2.75 |
|
2.50 |
|
24 |
|
49 |
|
2.70 |
|
2.32 |
|
38 |
| |||||
|
Total consumer real estate |
|
2.51 |
|
2.09 |
|
1.91 |
|
42 |
|
60 |
|
2.19 |
|
1.72 |
|
47 |
| |||||
|
Total consumer real estate and other |
|
2.59 |
|
2.12 |
|
2.00 |
|
47 |
|
59 |
|
2.22 |
|
1.78 |
|
44 |
| |||||
|
Commercial |
|
.57 |
|
.30 |
|
1.40 |
|
27 |
|
(83) |
|
.95 |
|
1.07 |
|
(12 |
) | |||||
|
Leasing and equipment finance |
|
.36 |
|
.45 |
|
1.16 |
|
(9) |
|
(80) |
|
.39 |
|
1.01 |
|
(62 |
) | |||||
|
Inventory finance |
|
.13 |
|
.13 |
|
.05 |
|
- |
|
8 |
|
.12 |
|
.12 |
|
- |
| |||||
|
Total |
|
1.48 |
|
1.19 |
|
1.58 |
|
29 |
|
(10) |
|
1.39 |
|
1.37 |
|
2 |
| |||||
|
|
|
|
|
|
|
|
|
|
|
|
|
|
|
|
|
|
| |||||
|
Allowance as a percentage of period end loans and leases |
|
1.77 |
% |
1.75 |
% |
1.70 |
% |
|
|
|
|
1.77 |
% |
1.70 |
% |
|
| |||||
|
Ratio of allowance to net charge-offs(1) |
|
1.2 |
X |
1.5 |
X |
1.1 |
X |
|
|
|
|
1.2 |
X |
1.3 |
X |
|
| |||||
|
|
|
|
|
|
|
|
|
|
|
|
|
|
|
|
|
|
| |||||
|
N.M. = Not meaningful. |
|
|
|
|
|
|
|
|
|
|
|
|
|
|
|
|
| |||||
|
(1) Annualized. |
|
|
|
|
|
|
|
|
|
|
|
|
|
|
|
|
| |||||
At September 30, 2011:
· Allowance for loan and lease losses was $254.3 million, or 1.77 percent of loans and leases, compared with $253.1 million, or 1.70 percent, at September 30, 2010 and $255.5 million, or 1.75 percent, at June 30, 2011.
For the quarter ended September 30, 2011:
· Provision for credit losses was $52.3 million, down from $59.3 million in the third quarter of 2010 and up from $44 million recorded in the second quarter of 2011. The decrease from the third quarter of 2010 was primarily due to decreased net charge-offs in the commercial and leasing and equipment finance portfolios as customer performance improved. The increase from the second quarter of 2011 was primarily due to increased consumer net charge-offs.
· Net loan and lease charge-offs were $53.4 million, or 1.48 percent, annualized, of average loans and leases, down from $57.8 million, or 1.58 percent, annualized, in the third quarter of 2010 and up from $43.8 million, or 1.19 percent, annualized, in the second quarter of 2011. The decrease from the third
-more-
quarter of 2010 was primarily due to decreases in charge-offs in commercial and leasing and equipment finance, partially offset by increases in charge-offs in consumer real estate. The increase from the second quarter of 2011 was primarily due to increases in consumer real estate net charge-offs, partially due to a change in TCF’s consumer real estate charge-off policy, which was modified to require more frequent valuations after loans are moved to non-accrual status until clear title is received. While the initial impact of this policy change accelerated the timing of charge-offs on non-accrual consumer real estate loans by $2.2 million, in the third quarter of 2011, it had no impact on TCF’s provision or net income, since these losses were previously provided for in the allowance for loan and lease losses.
Deposits
|
Average Deposits |
|
|
|
|
|
|
|
|
|
|
|
|
Table 7 | ||||||||||
|
|
|
|
|
|
|
|
|
Percent Change |
|
|
|
|
|
|
| ||||||||
|
($ in thousands) |
|
3Q |
|
2Q |
|
3Q |
|
3Q11 vs |
|
3Q11 vs |
|
YTD |
|
YTD |
|
Percent |
| ||||||
|
|
|
|
|
|
|
|
|
|
|
|
|
|
|
|
|
|
| ||||||
|
Checking |
|
$ |
4,475,567 |
|
$ |
4,570,543 |
|
$ |
4,341,803 |
|
(2.1)% |
|
3.1% |
|
$ |
4,515,916 |
|
$ |
4,425,754 |
|
2.0 |
% |
|
|
Savings |
|
5,812,187 |
|
5,628,249 |
|
5,446,852 |
|
3.3 |
|
6.7 |
|
5,629,620 |
|
5,435,254 |
|
3.6 |
|
| |||||
|
Money market |
|
650,598 |
|
648,862 |
|
654,030 |
|
.3 |
|
(.5) |
|
657,570 |
|
661,035 |
|
(.5 |
) |
| |||||
|
Subtotal |
|
10,938,352 |
|
10,847,654 |
|
10,442,685 |
|
.8 |
|
4.7 |
|
10,803,106 |
|
10,522,043 |
|
2.7 |
|
| |||||
|
Certificates |
|
1,114,934 |
|
1,092,368 |
|
1,006,685 |
|
2.1 |
|
10.8 |
|
1,100,029 |
|
1,058,840 |
|
3.9 |
|
| |||||
|
Total deposits |
|
$ |
12,053,286 |
|
$ |
11,940,022 |
|
$ |
11,449,370 |
|
.9 |
|
5.3 |
|
$ |
11,903,135 |
|
$ |
11,580,883 |
|
2.8 |
|
|
|
|
|
|
|
|
|
|
|
|
|
|
|
|
|
|
|
|
|
| |||||
|
Total new checking |
|
119,616 |
|
120,281 |
|
100,366 |
|
(.6)% |
|
19.2% |
|
337,356 |
|
347,445 |
|
(2.9 |
)% |
| |||||
|
Average interest rate |
|
.39% |
|
.38% |
|
.48% |
|
|
|
|
|
.40% |
|
.55% |
|
|
|
| |||||
|
|
|
|
|
|
|
|
|
|
|
|
|
|
|
|
|
|
|
| |||||
|
(1) Annualized. |
|
|
|
|
|
|
|
|
|
|
|
|
|
|
|
|
|
| |||||
· Total average deposits increased $603.9 million, or 5.3 percent, from the third quarter of 2010 primarily due to various targeted marketing campaigns, as well as increases in checking account production and savings account balances. Average savings balances increased $365.3 million, or 6.7 percent, from the third quarter of 2010. Total new checking accounts increased 19.2 percent from the third quarter of 2010. Total average deposits increased $113.3 million, or .9 percent from the second quarter of 2011, primarily due to increases in average savings account balances, partially offset by decreases in checking account balances.
· The average interest cost of deposits in the third quarter of 2011 was .39 percent, down 9 basis points
-more-
from the third quarter of 2010 and up 1 basis point from the second quarter of 2011. Declines in the average interest cost of deposits from the third quarter of 2010 were primarily due to pricing strategies on certain deposit products, mix changes and lower market interest rates. The slight increase from the second quarter of 2011 was primarily due to deposit mix changes. The weighted average interest rate on deposits was .35 percent at September 30, 2011.
Non-interest Expense
|
Non-interest Expense |
|
|
|
|
|
|
|
|
|
|
|
|
|
|
|
|
|
Table 8 |
| |||
|
|
|
|
|
|
|
|
|
|
|
Percent Change |
|
|
|
|
|
|
|
|
| |||
|
($ in thousands) |
|
|
3Q |
|
2Q |
|
3Q |
|
|
3Q11 vs |
|
3Q11 vs |
|
|
YTD |
|
YTD |
|
|
Percent |
| |
|
Compensation and |
|
|
$ 88,599 |
|
$ 89,997 |
|
$ 90,282 |
|
|
(1.6) % |
|
(1.9) % |
|
|
$268,869 |
|
$265,490 |
|
|
1.3 |
% |
|
|
Occupancy and equipment |
|
|
31,129 |
|
30,783 |
|
32,091 |
|
|
1.1 |
|
(3.0) |
|
|
94,071 |
|
95,583 |
|
|
(1.6 |
) |
|
|
FDIC insurance |
|
|
7,363 |
|
7,542 |
|
5,486 |
|
|
(2.4) |
|
34.2 |
|
|
22,100 |
|
16,186 |
|
|
36.5 |
|
|
|
Deposit account premiums |
|
|
7,045 |
|
6,166 |
|
3,340 |
|
|
14.3 |
|
110.9 |
|
|
16,409 |
|
15,616 |
|
|
5.1 |
|
|
|
Advertising and marketing |
|
|
1,145 |
|
3,479 |
|
3,354 |
|
|
(67.1) |
|
(65.9) |
|
|
7,784 |
|
9,908 |
|
|
(21.4 |
) |
|
|
Other |
|
|
34,708 |
|
37,067 |
|
39,481 |
|
|
(6.4) |
|
(12.1) |
|
|
106,341 |
|
108,944 |
|
|
(2.4 |
) |
|
|
Core operating expenses |
|
|
169,989 |
|
175,034 |
|
174,034 |
|
|
(2.9) |
|
(2.3) |
|
|
515,574 |
|
511,727 |
|
|
.8 |
|
|
|
Foreclosed real estate and repossessed assets, net |
|
|
12,430 |
|
12,617 |
|
9,588 |
|
|
(1.5) |
|
29.6 |
|
|
37,915 |
|
27,604 |
|
|
37.4 |
|
|
|
Operating lease depreciation |
|
|
7,409 |
|
7,859 |
|
8,965 |
|
|
(5.7) |
|
(17.4) |
|
|
23,196 |
|
28,817 |
|
|
(19.5 |
) |
|
|
Other credit costs, net |
|
|
(139 |
) |
496 |
|
(834 |
) |
|
N.M. |
|
83.3 |
|
|
2,905 |
|
4,476 |
|
|
(35.1 |
) |
|
|
Total non-interest expense |
|
|
$189,689 |
|
$196,006 |
|
$191,753 |
|
|
(3.2) |
|
(1.1) |
|
|
$579,590 |
|
$572,624 |
|
|
1.2 |
|
|
|
|
|
|
|
|
|
|
|
|
|
|
|
|
|
|
|
|
|
|
|
|
|
|
|
N.M. = Not meaningful. |
|
|
|
|
|
|
|
|
|
|
|
|
|
|
|
|
|
|
|
|
|
|
· Compensation and employee benefits expense in the third quarter of 2011 decreased $1.7 million, or 1.9 percent, from the third quarter of 2010 and $1.4 million, or 1.6 percent, from the second quarter of 2011. The decrease from the third quarter of 2010 was primarily due to decreases in employee medical costs. The decrease from the second quarter of 2011 was primarily due to lower production related incentives in Retail Banking and decreased employee medical costs, partially offset by increased salary expense primarily due to headcount growth in Specialty Finance.
· FDIC insurance expense increased $1.9 million, or 34.2 percent, from the third quarter of 2010 primarily due to changes in the FDIC insurance rate calculations for banks over $10 billion in total assets, which were implemented on April 1, 2011. TCF expects 2011 FDIC insurance expense to be approximately $7 million higher than 2010.
-more-
· Deposit account premiums increased $3.7 million, or 110.9 percent, from the third quarter of 2010 and increased $879 thousand, or 14.3 percent, from the second quarter of 2011. The increase from the third quarter of 2010 was primarily due to changes in the account premium programs beginning in April 2011, which increased the premiums paid for each qualified account. The increase from the second quarter of 2011 was primarily due to increased production of checking accounts that qualified for premiums.
· Advertising and marketing expense decreased $2.2 million, or 65.9 percent, from the third quarter of 2010 and decreased $2.3 million, or 67.1 percent, from the second quarter of 2011. The decrease from both periods was due to the discontinuation of the debit card rewards program in the third quarter of 2011 as a result of new federal regulation regarding debit card interchange fees.
· Foreclosed real estate and repossessed asset expense increased $2.8 million, or 29.6 percent, from the third quarter of 2010 and was essentially flat with the second quarter of 2011. The increase from the third quarter of 2010 was primarily due to valuation writedowns on commercial real estate properties in Illinois.
Capital and Borrowing Capacity
|
Capital Information |
|
|
|
|
|
Table 9 |
| ||||
|
At period end ($ in thousands, except per-share data) |
|
3Q |
|
|
4Q |
|
| ||||
|
|
|
2011 |
|
|
2010 |
|
| ||||
|
|
|
|
|
|
|
|
|
|
|
|
|
|
Total equity |
|
$ 1,872,083 |
|
|
|
|
$ 1,480,163 |
|
|
|
|
|
Total equity to total assets |
|
9.81 |
% |
|
|
|
8.02 |
% |
|
|
|
|
Book value per common share |
|
$ 11.63 |
|
|
|
|
$ 10.30 |
|
|
|
|
|
Tangible realized common equity to tangible assets(1) |
|
8.75 |
% |
|
|
|
7.37 |
% |
|
|
|
|
|
|
|
|
|
|
|
|
|
|
|
|
|
Risk-based capital |
|
|
|
|
|
|
|
|
|
|
|
|
Tier 1 |
|
$ 1,787,140 |
|
13.15 |
% |
|
$ 1,475,525 |
|
10.59 |
% |
|
|
Total |
|
2,076,447 |
|
15.28 |
|
|
1,808,412 |
|
12.98 |
|
|
|
Excess over stated “10% well-capitalized” requirement |
|
717,769 |
|
5.28 |
|
|
415,502 |
|
2.98 |
|
|
|
|
|
|
|
|
|
|
|
|
|
|
|
|
Tier 1 Leverage Capital |
|
$ 1,787,140 |
|
9.50 |
% |
|
$ 1,475,525 |
|
8.00 |
% |
|
|
|
|
|
|
|
|
|
|
|
|
|
|
|
Tier 1 common capital(2) |
|
$ 1,659,867 |
|
12.22 |
% |
|
$ 1,352,025 |
|
9.71 |
% |
|
|
|
|
|
|
|
|
|
|
|
|
|
|
|
(1) Excludes the impact of goodwill, other intangibles and accumulated other comprehensive income (loss) (see “Reconciliation of GAAP to Non-GAAP Measures” table). |
| ||||||||||
|
(2) Excludes the effect of qualifying trust preferred securities and qualifying non-controlling interest in subsidiaries (see “Reconciliation of GAAP to Non-GAAP Measures” table). |
| ||||||||||
-more-
· Total risk-based capital at September 30, 2011 of $2.1 billion, or 15.28 percent of risk-weighted assets, was $717.8 million in excess of the stated “10 percent well-capitalized” requirement.
· On October 17, 2011, the Board of Directors of TCF declared a regular quarterly cash dividend of five cents per common share payable on November 30, 2011 to stockholders of record at the close of business on October 28, 2011.
· At September 30, 2011, TCF had $1.7 billion in unused, secured borrowing capacity at the FHLB of Des Moines and $518 million in unused, secured borrowing capacity at the Federal Reserve Discount Window.
Website Information
A live webcast of TCF’s conference call to discuss third quarter earnings will be hosted at TCF’s website, http://ir.tcfbank.com, on October 20, 2011 at 10:00 a.m. CT. Additionally, the webcast is available for replay at TCF’s website after the conference call. The website also includes free access to company news releases, TCF’s annual report, quarterly reports, investor presentations and SEC filings.
|
|
|
|
|
|
TCF is a Wayzata, Minnesota-based national bank holding company with $19.1 billion in total assets. TCF has 436 branches in Minnesota, Illinois, Michigan, Colorado, Wisconsin, Indiana, Arizona and South Dakota, providing retail and commercial banking services. TCF also conducts commercial leasing and equipment finance business in all 50 states and commercial inventory finance business in the U.S. and Canada. For more information about TCF, please visit www.tcfbank.com.
|
|
-more-
Forward-Looking Information
This earnings release and other reports issued by the Company, including reports filed with the SEC, may contain “forward-looking” statements that deal with future results, plans or performance. In addition, TCF’s management may make such statements orally to the media, or to securities analysts, investors or others. Forward-looking statements deal with matters that do not relate strictly to historical facts. TCF’s future results may differ materially from historical performance and forward-looking statements about TCF’s expected financial results or other plans and are subject to a number of risks and uncertainties. These include, but are not limited to the following:
Adverse Economic or Business Conditions, Credit and Other Risks. Deterioration in general economic and banking industry conditions, including defaults, anticipated defaults or rating agency downgrades of sovereign debt (including debt of the United States), or continued high rates of or increases in unemployment in TCF’s primary banking markets; adverse economic, business and competitive developments such as shrinking interest margins, deposit outflows, deposit account attrition, or an inability to increase the number of deposit accounts; adverse changes in credit and other risks posed by TCF’s loan, lease, investment, and securities available for sale portfolios, including declines in commercial or residential real estate values or changes in the allowance for loan and lease losses dictated by new market conditions or regulatory requirements; interest rate risks resulting from fluctuations in prevailing interest rates or other factors that result in a mismatch between yields earned on TCF’s interest-earning assets and the rates paid on its deposits and borrowings; and foreign currency exchange risks.
Earnings/Capital Constraints, Liquidity Risks. Limitations on TCF’s ability to pay dividends or to increase dividends in the future because of financial performance deterioration, regulatory restrictions or limitations; increased deposit insurance premiums, special assessments or other costs related to adverse conditions in the banking industry, the economic impact on banks of the Dodd-Frank Act and other regulatory reform legislation; the impact of financial regulatory reform, including the phase out of trust preferred securities in tier 1 capital called for by the Dodd-Frank Act, or additional capital, leverage, liquidity and risk management requirements or changes in the composition of qualifying regulatory capital (including those resulting from U.S. implementation of Basel III requirements); adverse changes in securities markets directly or indirectly affecting TCF’s ability to sell assets or to fund its operations; diminished unsecured borrowing capacity resulting from TCF credit rating downgrades or unfavorable conditions in the credit markets that restrict or limit various funding sources; possible regulatory and other changes to the Federal Home Loan Bank System that may affect TCF’s borrowing capacity; costs associated with new regulatory requirements or interpretive guidance relating to liquidity.
Legislative and Regulatory Requirements. New consumer protection and supervisory actions, including those taken by the Consumer Financial Protection Bureau and limits on Federal preemption of state laws that could be applied to national banks; the imposition of requirements with an adverse impact relating to TCF’s lending, loan collection and other business activities as a result of the Dodd-Frank Act, or other legislative or regulatory developments such as mortgage foreclosure moratorium laws or imposition of underwriting or other limitations that impact the ability to use certain variable-rate products; reduction of interchange revenue from debit card transactions resulting from the so-called Durbin Amendment to the Dodd-Frank Act, which limits debit card interchange fees; impact of legislative, regulatory or other changes affecting customer account charges and fee income; changes to bankruptcy laws which would result in the loss of all or part of TCF’s security interest due to collateral value declines (so-called “cramdown” provisions); deficiencies in TCF’s compliance under the Bank Secrecy Act in past or future periods, which may result in regulatory enforcement action including monetary penalties; increased health care costs resulting from Federal health care reform legislation; adverse regulatory examinations and resulting enforcement actions or other adverse consequences such as increased capital requirements or higher deposit insurance assessments; heightened regulatory practices, requirements or expectations, including, but not limited to, requirements related to the Bank Secrecy Act and anti-money laundering compliance activity.
-more-
Other Risks Relating to Fee Income. Restrictions on charging overdraft fees on point-of-sale and ATM transactions unless customers opt-in, including customer opt-in preferences which may have an adverse impact on TCF’s fee revenue; and uncertainties relating to future retail deposit account changes such as charging a daily negative balance fee in lieu of per item overdraft fees or other significant changes, including limitations on TCF’s ability to predict customer behavior and the impact on TCF’s fee revenues.
Litigation Risks. Results of litigation, including but not limited to class action litigation concerning TCF’s lending or deposit activities including account servicing processes or fees or charges; claims regarding employment practices; business method patent litigation and possible increases in indemnification obligations for certain litigation against Visa U.S.A. (“covered litigation”) and potential reductions in card revenues resulting from covered litigation or other litigation against Visa.
Acquisition of Gateway One Lending & Finance, LLC. Delays in closing the transaction; slower than anticipated growth of the business acquired; difficulties in integrating the acquired business or its systems or retaining key employees; lower than anticipated yields on loans originated; greater than anticipated competition in the acquired business; and higher than expected delinquencies and charge-offs.
Competitive Conditions; Supermarket Branching Risk. Reduced demand for financial services and loan and lease products; adverse developments affecting TCF’s supermarket banking relationships or any of the supermarket chains in which TCF maintains supermarket branches.
Accounting, Audit, Tax and Insurance Matters. Changes in accounting standards or interpretations of existing standards; federal or state monetary, fiscal or tax policies, including adoption of state legislation that would increase state taxes; adverse state or Federal tax assessments or findings in tax audits; lack of or inadequate insurance coverage for claims against TCF.
Technological and Operational Matters. Technological, computer-related or operational difficulties or loss or theft of information and the possibility that deposit account losses (fraudulent checks, etc.) may increase.
Investors should consult TCF’s Annual Report on Form 10-K, Quarterly Reports on Form 10-Q and Current Reports on Form 8-K for additional important information about the Company. TCF assumes no obligation to update forward-looking information contained in this release as a result of new information or future events or developments.
-more-
TCF FINANCIAL CORPORATION AND SUBSIDIARIES
CONSOLIDATED STATEMENTS OF INCOME
(Dollars in thousands, except per-share data)
(Unaudited)
|
|
|
Three Months Ended |
|
|
| |||||||
|
|
|
September 30, |
|
Change |
| |||||||
|
|
|
2011 |
|
2010 |
|
$ |
|
% |
| |||
|
Interest income: |
|
|
|
|
|
|
|
|
| |||
|
Loans and leases |
|
$ |
210,885 |
|
$ |
219,974 |
|
$ |
(9,089) |
|
(4.1) |
% |
|
Securities available for sale |
|
22,561 |
|
19,901 |
|
2,660 |
|
13.4 |
| |||
|
Investments and other |
|
1,997 |
|
1,232 |
|
765 |
|
62.1 |
| |||
|
Total interest income |
|
235,443 |
|
241,107 |
|
(5,664) |
|
(2.3) |
| |||
|
Interest expense: |
|
|
|
|
|
|
|
|
| |||
|
Deposits |
|
11,883 |
|
13,974 |
|
(2,091) |
|
(15.0) |
| |||
|
Borrowings |
|
47,496 |
|
53,378 |
|
(5,882) |
|
(11.0) |
| |||
|
Total interest expense |
|
59,379 |
|
67,352 |
|
(7,973) |
|
(11.8) |
| |||
|
Net interest income |
|
176,064 |
|
173,755 |
|
2,309 |
|
1.3 |
| |||
|
Provision for credit losses |
|
52,315 |
|
59,287 |
|
(6,972) |
|
(11.8) |
| |||
|
Net interest income after provision for |
|
123,749 |
|
114,468 |
|
9,281 |
|
8.1 |
| |||
|
Non-interest income: |
|
|
|
|
|
|
|
|
| |||
|
Fees and service charges |
|
58,452 |
|
67,684 |
|
(9,232) |
|
(13.6) |
| |||
|
Card revenue |
|
27,701 |
|
27,779 |
|
(78) |
|
(.3) |
| |||
|
ATM revenue |
|
7,523 |
|
7,985 |
|
(462) |
|
(5.8) |
| |||
|
Subtotal |
|
93,676 |
|
103,448 |
|
(9,772) |
|
(9.4) |
| |||
|
Leasing and equipment finance |
|
21,646 |
|
24,912 |
|
(3,266) |
|
(13.1) |
| |||
|
Other |
|
786 |
|
1,077 |
|
(291) |
|
(27.0) |
| |||
|
Fees and other revenue |
|
116,108 |
|
129,437 |
|
(13,329) |
|
(10.3) |
| |||
|
Gains on securities |
|
1,648 |
|
8,505 |
|
(6,857) |
|
(80.6) |
| |||
|
Total non-interest income |
|
117,756 |
|
137,942 |
|
(20,186) |
|
(14.6) |
| |||
|
Non-interest expense: |
|
|
|
|
|
|
|
|
| |||
|
Compensation and employee benefits |
|
88,599 |
|
90,282 |
|
(1,683) |
|
(1.9) |
| |||
|
Occupancy and equipment |
|
31,129 |
|
32,091 |
|
(962) |
|
(3.0) |
| |||
|
FDIC insurance |
|
7,363 |
|
5,486 |
|
1,877 |
|
34.2 |
| |||
|
Deposit account premiums |
|
7,045 |
|
3,340 |
|
3,705 |
|
110.9 |
| |||
|
Advertising and marketing |
|
1,145 |
|
3,354 |
|
(2,209) |
|
(65.9) |
| |||
|
Other |
|
34,708 |
|
39,481 |
|
(4,773) |
|
(12.1) |
| |||
|
Subtotal |
|
169,989 |
|
174,034 |
|
(4,045) |
|
(2.3) |
| |||
|
Foreclosed real estate and repossessed assets, net |
|
12,430 |
|
9,588 |
|
2,842 |
|
29.6 |
| |||
|
Operating lease depreciation |
|
7,409 |
|
8,965 |
|
(1,556) |
|
(17.4) |
| |||
|
Other credit costs, net |
|
(139) |
|
(834) |
|
695 |
|
(83.3) |
| |||
|
Total non-interest expense |
|
189,689 |
|
191,753 |
|
(2,064) |
|
(1.1) |
| |||
|
Income before income tax expense |
|
51,816 |
|
60,657 |
|
(8,841) |
|
(14.6) |
| |||
|
Income tax expense |
|
18,856 |
|
22,852 |
|
(3,996) |
|
(17.5) |
| |||
|
Income after income tax expense |
|
32,960 |
|
37,805 |
|
(4,845) |
|
(12.8) |
| |||
|
Income attributable to non-controlling interest |
|
1,243 |
|
912 |
|
331 |
|
36.3 |
| |||
|
Net income available to common stockholders |
|
$ |
31,717 |
|
$ |
36,893 |
|
$ |
(5,176) |
|
(14.0) |
|
|
|
|
|
|
|
|
|
|
|
| |||
|
Net income per common share: |
|
|
|
|
|
|
|
|
| |||
|
Basic |
|
$ |
.20 |
|
$ |
.26 |
|
$ |
(.06) |
|
(23.1) |
|
|
Diluted |
|
.20 |
|
.26 |
|
(.06) |
|
(23.1) |
| |||
|
|
|
|
|
|
|
|
|
|
| |||
|
Dividends declared per common share |
|
$ |
.05 |
|
$ |
.05 |
|
$ |
- |
|
- |
|
|
|
|
|
|
|
|
|
|
|
| |||
|
Average common and common equivalent |
|
|
|
|
|
|
|
|
| |||
|
Basic |
|
157,419 |
|
140,684 |
|
16,735 |
|
11.9 |
| |||
|
Diluted |
|
157,621 |
|
140,922 |
|
16,699 |
|
11.8 |
| |||
-more-
TCF FINANCIAL CORPORATION AND SUBSIDIARIES
CONSOLIDATED STATEMENTS OF INCOME
(Dollars in thousands, except per-share data)
(Unaudited)
|
|
|
Nine Months Ended |
|
|
| |||||||
|
|
|
September 30, |
|
Change |
| |||||||
|
|
|
2011 |
|
2010 |
|
$ |
|
% |
| |||
|
Interest income: |
|
|
|
|
|
|
|
|
| |||
|
Loans and leases |
|
$ |
639,381 |
|
$ |
663,151 |
|
$ |
(23,770) |
|
(3.6) |
% |
|
Securities available for sale |
|
62,629 |
|
62,373 |
|
256 |
|
.4 |
| |||
|
Investments and other |
|
5,634 |
|
3,609 |
|
2,025 |
|
56.1 |
| |||
|
Total interest income |
|
707,644 |
|
729,133 |
|
(21,489) |
|
(2.9) |
| |||
|
Interest expense: |
|
|
|
|
|
|
|
|
| |||
|
Deposits |
|
35,317 |
|
47,859 |
|
(12,542) |
|
(26.2) |
| |||
|
Borrowings |
|
146,073 |
|
156,358 |
|
(10,285) |
|
(6.6) |
| |||
|
Total interest expense |
|
181,390 |
|
204,217 |
|
(22,827) |
|
(11.2) |
| |||
|
Net interest income |
|
526,254 |
|
524,916 |
|
1,338 |
|
.3 |
| |||
|
Provision for credit losses |
|
141,594 |
|
158,791 |
|
(17,197) |
|
(10.8) |
| |||
|
Net interest income after provision for |
|
384,660 |
|
366,125 |
|
18,535 |
|
5.1 |
| |||
|
Non-interest income: |
|
|
|
|
|
|
|
|
| |||
|
Fees and service charges |
|
168,361 |
|
211,701 |
|
(43,340) |
|
(20.5) |
| |||
|
Card revenue |
|
82,504 |
|
83,442 |
|
(938) |
|
(1.1) |
| |||
|
ATM revenue |
|
21,319 |
|
22,851 |
|
(1,532) |
|
(6.7) |
| |||
|
Subtotal |
|
272,184 |
|
317,994 |
|
(45,810) |
|
(14.4) |
| |||
|
Leasing and equipment finance |
|
70,675 |
|
65,792 |
|
4,883 |
|
7.4 |
| |||
|
Other |
|
1,864 |
|
4,767 |
|
(2,903) |
|
(60.9) |
| |||
|
Fees and other revenue |
|
344,723 |
|
388,553 |
|
(43,830) |
|
(11.3) |
| |||
|
Gains on securities |
|
1,421 |
|
7,938 |
|
(6,517) |
|
(82.1) |
| |||
|
Total non-interest income |
|
346,144 |
|
396,491 |
|
(50,347) |
|
(12.7) |
| |||
|
Non-interest expense: |
|
|
|
|
|
|
|
|
| |||
|
Compensation and employee benefits |
|
268,869 |
|
265,490 |
|
3,379 |
|
1.3 |
| |||
|
Occupancy and equipment |
|
94,071 |
|
95,583 |
|
(1,512) |
|
(1.6) |
| |||
|
FDIC insurance |
|
22,100 |
|
16,186 |
|
5,914 |
|
36.5 |
| |||
|
Deposit account premiums |
|
16,409 |
|
15,616 |
|
793 |
|
5.1 |
| |||
|
Advertising and marketing |
|
7,784 |
|
9,908 |
|
(2,124) |
|
(21.4) |
| |||
|
Other |
|
106,341 |
|
108,944 |
|
(2,603) |
|
(2.4) |
| |||
|
Subtotal |
|
515,574 |
|
511,727 |
|
3,847 |
|
.8 |
| |||
|
Foreclosed real estate and repossessed assets, net |
|
37,915 |
|
27,604 |
|
10,311 |
|
37.4 |
| |||
|
Operating lease depreciation |
|
23,196 |
|
28,817 |
|
(5,621) |
|
(19.5) |
| |||
|
Other credit costs, net |
|
2,905 |
|
4,476 |
|
(1,571) |
|
(35.1) |
| |||
|
Total non-interest expense |
|
579,590 |
|
572,624 |
|
6,966 |
|
1.2 |
| |||
|
Income before income tax expense |
|
151,214 |
|
189,992 |
|
(38,778) |
|
(20.4) |
| |||
|
Income tax expense |
|
56,056 |
|
71,754 |
|
(15,698) |
|
(21.9) |
| |||
|
Income after income tax expense |
|
95,158 |
|
118,238 |
|
(23,080) |
|
(19.5) |
| |||
|
Income attributable to non-controlling interest |
|
3,918 |
|
2,399 |
|
1,519 |
|
63.3 |
| |||
|
Net income available to common stockholders |
|
$ |
91,240 |
|
$ |
115,839 |
|
$ |
(24,599) |
|
(21.2) |
|
|
|
|
|
|
|
|
|
|
|
| |||
|
Net income per common share: |
|
|
|
|
|
|
|
|
| |||
|
Basic |
|
$ |
.59 |
|
$ |
.84 |
|
$ |
(.25) |
|
(29.8) |
|
|
Diluted |
|
.59 |
|
.84 |
|
(.25) |
|
(29.8) |
| |||
|
|
|
|
|
|
|
|
|
|
| |||
|
Dividends declared per common share |
|
$ |
.15 |
|
$ |
.15 |
|
$ |
- |
|
- |
|
|
|
|
|
|
|
|
|
|
|
| |||
|
Average common and common equivalent |
|
|
|
|
|
|
|
|
| |||
|
Basic |
|
153,007 |
|
137,824 |
|
15,183 |
|
11.0 |
| |||
|
Diluted |
|
153,302 |
|
138,004 |
|
15,298 |
|
11.1 |
| |||
-more-
TCF FINANCIAL CORPORATION AND SUBSIDIARIES
CONSOLIDATED STATEMENTS OF FINANCIAL CONDITION
(Dollars in thousands, except per-share data)
(Unaudited)
|
|
|
At |
|
At |
|
At |
|
% Change From |
| |||||
|
|
|
September 30, |
|
December 31, |
|
September 30, |
|
December 31, |
|
September 30, |
| |||
|
|
|
2011 |
|
2010 |
|
2010 |
|
2010 |
|
2010 |
| |||
|
ASSETS |
|
|
|
|
|
|
|
|
|
|
| |||
|
|
|
|
|
|
|
|
|
|
|
|
| |||
|
Cash and due from banks |
|
$ |
1,165,736 |
|
$ |
663,901 |
|
$ |
386,671 |
|
75.6 |
% |
N.M. |
% |
|
Investments |
|
162,719 |
|
179,768 |
|
169,877 |
|
(9.5) |
|
(4.2) |
| |||
|
Securities available for sale |
|
2,600,806 |
|
1,931,174 |
|
1,947,462 |
|
34.7 |
|
33.5 |
| |||
|
Loans and leases: |
|
|
|
|
|
|
|
|
|
|
| |||
|
Consumer real estate and other |
|
7,003,909 |
|
7,195,269 |
|
7,280,454 |
|
(2.7) |
|
(3.8) |
| |||
|
Commercial |
|
3,495,797 |
|
3,646,203 |
|
3,663,053 |
|
(4.1) |
|
(4.6) |
| |||
|
Leasing and equipment finance |
|
3,011,795 |
|
3,154,478 |
|
3,157,472 |
|
(4.5) |
|
(4.6) |
| |||
|
Inventory finance |
|
828,214 |
|
792,354 |
|
795,622 |
|
4.5 |
|
4.1 |
| |||
|
Total loans and leases |
|
14,339,715 |
|
14,788,304 |
|
14,896,601 |
|
(3.0) |
|
(3.7) |
| |||
|
Allowance for loan and lease losses |
|
(254,325) |
|
(265,819) |
|
(253,120) |
|
4.3 |
|
(.5) |
| |||
|
Net loans and leases |
|
14,085,390 |
|
14,522,485 |
|
14,643,481 |
|
(3.0) |
|
(3.8) |
| |||
|
Premises and equipment, net |
|
434,333 |
|
443,768 |
|
446,398 |
|
(2.1) |
|
(2.7) |
| |||
|
Goodwill |
|
152,599 |
|
152,599 |
|
152,599 |
|
- |
|
- |
| |||
|
Other assets |
|
490,483 |
|
571,330 |
|
567,120 |
|
(14.2) |
|
(13.5) |
| |||
|
Total assets |
|
$ |
19,092,066 |
|
$ |
18,465,025 |
|
$ |
18,313,608 |
|
3.4 |
|
4.3 |
|
|
|
|
|
|
|
|
|
|
|
|
|
| |||
|
LIABILITIES AND EQUITY |
|
|
|
|
|
|
|
|
|
|
| |||
|
|
|
|
|
|
|
|
|
|
|
|
| |||
|
Deposits: |
|
|
|
|
|
|
|
|
|
|
| |||
|
Checking |
|
$ |
4,633,924 |
|
$ |
4,530,064 |
|
$ |
4,352,506 |
|
2.3 |
|
6.5 |
|
|
Savings |
|
5,870,280 |
|
5,390,802 |
|
5,424,679 |
|
8.9 |
|
8.2 |
| |||
|
Money market |
|
632,467 |
|
635,922 |
|
639,007 |
|
(.5) |
|
(1.0) |
| |||
|
Subtotal |
|
11,136,671 |
|
10,556,788 |
|
10,416,192 |
|
5.5 |
|
6.9 |
| |||
|
Certificates of deposit |
|
1,183,831 |
|
1,028,327 |
|
1,045,327 |
|
15.1 |
|
13.2 |
| |||
|
Total deposits |
|
12,320,502 |
|
11,585,115 |
|
11,461,519 |
|
6.3 |
|
7.5 |
| |||
|
Short-term borrowings |
|
7,204 |
|
126,790 |
|
344,681 |
|
(94.3) |
|
(97.9) |
| |||
|
Long-term borrowings |
|
4,397,750 |
|
4,858,821 |
|
4,581,511 |
|
(9.5) |
|
(4.0) |
| |||
|
Total borrowings |
|
4,404,954 |
|
4,985,611 |
|
4,926,192 |
|
(11.6) |
|
(10.6) |
| |||
|
Accrued expenses and other liabilities |
|
494,527 |
|
414,136 |
|
419,935 |
|
19.4 |
|
17.8 |
| |||
|
Total liabilities |
|
17,219,983 |
|
16,984,862 |
|
16,807,646 |
|
1.4 |
|
2.5 |
| |||
|
Equity: |
|
|
|
|
|
|
|
|
|
|
| |||
|
Preferred stock, par value $.01 per share, |
|
- |
|
- |
|
- |
|
- |
|
- |
| |||
|
Common stock, par value $.01 per share, |
|
1,600 |
|
1,430 |
|
1,427 |
|
11.9 |
|
12.1 |
| |||
|
Additional paid-in capital |
|
708,601 |
|
459,884 |
|
454,139 |
|
54.1 |
|
56.0 |
| |||
|
Retained earnings, subject to certain restrictions |
|
1,133,386 |
|
1,064,978 |
|
1,041,331 |
|
6.4 |
|
8.8 |
| |||
|
Accumulated other comprehensive income (loss) |
|
49,038 |
|
(31,514) |
|
22,458 |
|
N.M. |
|
118.4 |
| |||
|
Treasury stock at cost, 45,504, 51,160 |
|
(32,815) |
|
(23,115) |
|
(23,400) |
|
(42.0) |
|
(40.2) |
| |||
|
Total TCF Financial Corp. stockholders’ equity |
1,859,810 |
|
1,471,663 |
|
1,495,955 |
|
26.4 |
|
24.3 |
| ||||
|
Non-controlling interest in subsidiaries |
|
12,273 |
|
8,500 |
|
10,007 |
|
44.4 |
|
22.6 |
| |||
|
Total equity |
|
1,872,083 |
|
1,480,163 |
|
1,505,962 |
|
26.5 |
|
24.3 |
| |||
|
Total liabilities and equity |
|
$ |
19,092,066 |
|
$ |
18,465,025 |
|
$ |
18,313,608 |
|
3.4 |
|
4.3 |
|
N.M. Not meaningful.
-more-
TCF FINANCIAL CORPORATION AND SUBSIDIARIES
SUMMARY OF CREDIT QUALITY DATA
(Dollars in thousands)
(Unaudited)
|
|
|
At |
|
At |
|
At |
|
At |
|
At |
|
Change from |
| ||||||||||||
|
|
|
Sep. 30, |
|
Jun. 30, |
|
Mar. 31, |
|
Dec. 31, |
|
Sep. 30, |
|
Jun. 30, |
|
Sep. 30, |
| ||||||||||
|
|
|
2011 |
|
2011 |
|
2011 |
|
2010 |
|
2010 |
|
2011 |
|
2010 |
| ||||||||||
|
Delinquency Data - Principal Balances (1) |
|
|
|
|
|
|
|
|
|
|
|
|
|
|
| ||||||||||
|
60 days or more: |
|
|
|
|
|
|
|
|
|
|
|
|
|
|
| ||||||||||
|
Consumer real estate |
|
|
|
|
|
|
|
|
|
|
|
|
|
|
| ||||||||||
|
First mortgage lien |
|
$ |
78,241 |
|
$ |
74,090 |
|
$ |
70,024 |
|
$ |
73,848 |
|
$ |
80,795 |
|
$ |
4,151 |
|
$ |
(2,554) |
| |||
|
Junior lien |
|
18,499 |
|
17,780 |
|
19,528 |
|
20,763 |
|
20,387 |
|
719 |
|
(1,888) |
| ||||||||||
|
Total consumer real estate |
|
96,740 |
|
91,870 |
|
89,552 |
|
94,611 |
|
101,182 |
|
4,870 |
|
(4,442) |
| ||||||||||
|
Consumer other |
|
58 |
|
171 |
|
78 |
|
39 |
|
61 |
|
(113) |
|
(3) |
| ||||||||||
|
Total consumer real estate and other |
|
96,798 |
|
92,041 |
|
89,630 |
|
94,650 |
|
101,243 |
|
4,757 |
|
(4,445) |
| ||||||||||
|
Commercial |
|
3,079 |
|
6,238 |
|
1,864 |
|
9,021 |
|
1,260 |
|
(3,159) |
|
1,819 |
| ||||||||||
|
Leasing and equipment finance |
|
2,840 |
|
2,447 |
|
5,274 |
|
5,054 |
|
4,346 |
|
393 |
|
(1,506) |
| ||||||||||
|
Inventory finance |
|
306 |
|
145 |
|
240 |
|
318 |
|
255 |
|
161 |
|
51 |
| ||||||||||
|
Subtotal |
|
103,023 |
|
100,871 |
|
97,008 |
|
109,043 |
|
107,104 |
|
2,152 |
|
(4,081) |
| ||||||||||
|
Acquired portfolios |
|
1,870 |
|
2,993 |
|
4,399 |
|
6,000 |
|
5,618 |
|
(1,123) |
|
(3,748) |
| ||||||||||
|
Total delinquencies |
|
$ |
104,893 |
|
$ |
103,864 |
|
$ |
101,407 |
|
$ |
115,043 |
|
$ |
112,722 |
|
$ |
1,029 |
|
$ |
(7,829) |
| |||
|
|
|
|
|
|
|
|
|
|
|
|
|
|
|
|
| ||||||||||
|
Delinquency Data - % of Portfolio |
|
|
|
|
|
|
|
|
|
|
|
|
|
|
| ||||||||||
|
60 days or more: |
|
|
|
|
|
|
|
|
|
|
|
|
|
|
| ||||||||||
|
Consumer real estate |
|
|
|
|
|
|
|
|
|
|
|
|
|
|
| ||||||||||
|
First mortgage lien |
|
1.68 |
% |
1.58 |
% |
1.48 |
% |
1.55 |
% |
1.68 |
% |
10 |
bps |
- |
bps | ||||||||||
|
Junior lien |
|
.86 |
|
.82 |
|
.89 |
|
.93 |
|
.90 |
|
4 |
|
(4) |
| ||||||||||
|
Total consumer real estate |
|
1.42 |
|
1.34 |
|
1.30 |
|
1.35 |
|
1.43 |
|
8 |
|
(1) |
| ||||||||||
|
Consumer other |
|
.18 |
|
.46 |
|
.22 |
|
.10 |
|
.14 |
|
(28) |
|
4 |
| ||||||||||
|
Total consumer real estate and other |
|
1.41 |
|
1.33 |
|
1.29 |
|
1.35 |
|
1.42 |
|
8 |
|
(1) |
| ||||||||||
|
Commercial |
|
.09 |
|
.18 |
|
.05 |
|
.26 |
|
.04 |
|
(9) |
|
5 |
| ||||||||||
|
Leasing and equipment finance |
|
.11 |
|
.09 |
|
.20 |
|
.19 |
|
.17 |
|
2 |
|
(6) |
| ||||||||||
|
Inventory finance |
|
.04 |
|
.02 |
|
.03 |
|
.05 |
|
.04 |
|
2 |
|
- |
| ||||||||||
|
Subtotal |
|
.75 |
|
.73 |
|
.69 |
|
.79 |
|
.78 |
|
2 |
|
(3) |
| ||||||||||
|
Acquired portfolios |
|
.51 |
|
.70 |
|
.89 |
|
1.00 |
|
.79 |
|
(19) |
|
(28) |
| ||||||||||
|
Total delinquencies |
|
.75 |
|
.73 |
|
.70 |
|
.80 |
|
.78 |
|
2 |
|
(3) |
| ||||||||||
|
|
|
|
|
|
|
|
|
|
|
|
|
|
|
|
| ||||||||||
|
(1) Excludes non-accrual loans and leases |
|
|
|
|
|
|
|
|
|
|
|
|
|
|
| ||||||||||
|
|
|
|
|
|
|
|
|
|
|
|
|
|
|
|
| ||||||||||
|
|
|
At |
|
At |
|
At |
|
At |
|
At |
|
Change from |
| ||||||||||||
|
|
|
Sep. 30, |
|
Jun. 30, |
|
Mar. 31, |
|
Dec. 31, |
|
Sep. 30, |
|
Jun. 30, |
|
Sep. 30, |
| ||||||||||
|
|
|
2011 |
|
2011 |
|
2011 |
|
2010 |
|
2010 |
|
2011 |
|
2010 |
| ||||||||||
|
Non-Accrual Loans and Leases |
|
|
|
|
|
|
|
|
|
|
|
|
|
|
| ||||||||||
|
Non-accrual loans and leases: |
|
|
|
|
|
|
|
|
|
|
|
|
|
|
| ||||||||||
|
Consumer real estate |
|
|
|
|
|
|
|
|
|
|
|
|
|
|
| ||||||||||
|
First mortgage lien |
|
$ |
130,671 |
|
$ |
129,837 |
|
$ |
133,865 |
|
$ |
140,871 |
|
$ |
140,315 |
|
$ |
834 |
|
$ |
(9,644) |
| |||
|
Junior lien |
|
18,223 |
|
21,069 |
|
21,325 |
|
26,626 |
|
26,225 |
|
(2,846) |
|
(8,002) |
| ||||||||||
|
Total consumer real estate |
|
148,894 |
|
150,906 |
|
155,190 |
|
167,497 |
|
166,540 |
|
(2,012) |
|
(17,646) |
| ||||||||||
|
Consumer other |
|
4 |
|
32 |
|
43 |
|
50 |
|
57 |
|
(28) |
|
(53) |
| ||||||||||
|
Total consumer real estate and other |
|
148,898 |
|
150,938 |
|
155,233 |
|
167,547 |
|
166,597 |
|
(2,040) |
|
(17,699) |
| ||||||||||
|
Commercial |
|
133,260 |
|
140,407 |
|
127,745 |
|
142,248 |
|
161,889 |
|
(7,147) |
|
(28,629) |
| ||||||||||
|
Leasing and equipment finance |
|
24,437 |
|
29,682 |
|
34,634 |
|
34,407 |
|
40,455 |
|
(5,245) |
|
(16,018) |
| ||||||||||
|
Inventory finance |
|
1,077 |
|
634 |
|
1,437 |
|
1,055 |
|
871 |
|
443 |
|
206 |
| ||||||||||
|
Total non-accrual loans and leases |
|
$ |
307,672 |
|
$ |
321,661 |
|
$ |
319,049 |
|
$ |
345,257 |
|
$ |
369,812 |
|
$ |
(13,989) |
|
$ |
(62,140) |
| |||
|
|
|
|
|
|
|
|
|
|
|
|
|
|
|
|
| ||||||||||
|
Non-accrual loans and leases - rollforward |
|
|
|
|
|
|
|
|
|
|
|
|
|
|
| ||||||||||
|
Balance, beginning of period |
|
$ |
321,661 |
|
$ |
319,049 |
|
$ |
345,257 |
|
$ |
369,812 |
|
$ |
330,182 |
|
$ |
2,612 |
|
$ |
(8,521) |
| |||
|
Additions |
|
80,014 |
|
86,996 |
|
80,596 |
|
92,180 |
|
143,929 |
|
(6,982) |
|
(63,915) |
| ||||||||||
|
Charge-offs |
|
(29,338) |
|
(22,401) |
|
(37,417) |
|
(43,092) |
|
(36,371) |
|
(6,937) |
|
7,033 |
| ||||||||||
|
Transfers to other assets |
|
(21,654) |
|
(27,078) |
|
(33,541) |
|
(41,659) |
|
(39,072) |
|
5,424 |
|
17,418 |
| ||||||||||
|
Return to accrual status |
|
(20,272) |
|
(21,985) |
|
(24,634) |
|
(17,989) |
|
(15,785) |
|
1,713 |
|
(4,487) |
| ||||||||||
|
Payments received |
|
(23,843) |
|
(14,383) |
|
(12,881) |
|
(15,036) |
|
(15,653) |
|
(9,460) |
|
(8,190) |
| ||||||||||
|
Other, net |
|
1,104 |
|
1,463 |
|
1,669 |
|
1,041 |
|
2,582 |
|
(359) |
|
(1,478) |
| ||||||||||
|
Balance, end of period |
|
$ |
307,672 |
|
$ |
321,661 |
|
$ |
319,049 |
|
$ |
345,257 |
|
$ |
369,812 |
|
$ |
(13,989) |
|
$ |
(62,140) |
| |||
|
|
|
|
|
|
|
|
|
|
|
|
|
|
|
|
| ||||||||||
|
Charge-offs and allowance recorded on |
|
|
|
|
|
|
|
|
|
|
|
|
| ||||||||||||
|
Consumer real estate |
|
29.3 |
% |
26.6 |
% |
24.5 |
% |
22.0 |
% |
20.7 |
% |
270 |
bps |
860 |
bps | ||||||||||
|
Commercial |
|
34.3 |
|
37.9 |
|
40.5 |
|
43.1 |
|
28.1 |
|
(360) |
|
620 |
| ||||||||||
|
Leasing and equipment finance |
|
22.1 |
|
20.5 |
|
23.6 |
|
24.3 |
|
28.6 |
|
160 |
|
(650) |
| ||||||||||
|
Inventory finance |
|
5.7 |
|
11.8 |
|
7.1 |
|
17.5 |
|
19.5 |
|
(610) |
|
(1,380) |
| ||||||||||
|
Total |
|
31.0 |
|
31.4 |
|
31.4 |
|
31.6 |
|
24.7 |
|
(40) |
|
630 |
| ||||||||||
-more-
TCF FINANCIAL CORPORATION AND SUBSIDIARIES
SUMMARY OF CREDIT QUALITY DATA, CONTINUED
(Dollars in thousands)
(Unaudited)
|
|
|
At |
|
At |
|
At |
|
At |
|
At |
|
Change from |
| ||||||||||||
|
|
|
Sep. 30, |
|
Jun. 30, |
|
Mar. 31, |
|
Dec. 31, |
|
Sep. 30, |
|
Jun. 30, |
|
Sep. 30, |
| ||||||||||
|
|
|
2011 |
|
2011 |
|
2011 |
|
2010 |
|
2010 |
|
2011 |
|
2010 |
| ||||||||||
|
Other Real Estate Owned |
|
|
|
|
|
|
|
|
|
|
|
|
|
|
| ||||||||||
|
Other real estate owned (1): |
|
|
|
|
|
|
|
|
|
|
|
|
|
|
| ||||||||||
|
Consumer real estate |
|
$ |
88,206 |
|
$ |
94,311 |
|
$ |
97,976 |
|
$ |
90,115 |
|
$ |
88,303 |
|
$ |
(6,105) |
|
$ |
(97) |
| |||
|
Commercial real estate |
|
42,207 |
|
42,188 |
|
44,178 |
|
50,950 |
|
47,841 |
|
19 |
|
(5,634) |
| ||||||||||
|
Total other real estate owned |
|
$ |
130,413 |
|
$ |
136,499 |
|
$ |
142,154 |
|
$ |
141,065 |
|
$ |
136,144 |
|
$ |
(6,086) |
|
$ |
(5,731)) |
| |||
|
|
|
|
|
|
|
|
|
|
|
|
|
|
|
|
| ||||||||||
|
Other real estate owned - rollforward |
|
|
|
|
|
|
|
|
|
|
|
|
|
|
| ||||||||||
|
Balance, beginning of period |
|
$ |
136,499 |
|
$ |
142,154 |
|
$ |
141,065 |
|
$ |
136,144 |
|
$ |
117,931 |
|
$ |
(5,655) |
|
$ |
18,568 |
| |||
|
Transferred in |
|
24,939 |
|
27,649 |
|
35,480 |
|
44,513 |
|
41,121 |
|
(2,710) |
|
(16,182) |
| ||||||||||
|
Sales |
|
(26,095) |
|
(28,759) |
|
(31,328) |
|
(34,666) |
|
(18,674) |
|
2,664 |
|
(7,421) |
| ||||||||||
|
Writedowns |
|
(6,337) |
|
(6,741) |
|
(6,266) |
|
(6,220) |
|
(3,394) |
|
404 |
|
(2,943) |
| ||||||||||
|
Other, net |
|
1,407 |
|
2,196 |
|
3,203 |
|
1,294 |
|
(840) |
|
(789) |
|
2,247 |
| ||||||||||
|
Balance, end of period |
|
$ |
130,413 |
|
$ |
136,499 |
|
$ |
142,154 |
|
$ |
141,065 |
|
$ |
136,144 |
|
$ |
(6,086) |
|
$ |
(5,731) |
| |||
|
|
|
|
|
|
|
|
|
|
|
|
|
|
|
|
| ||||||||||
|
Charge-offs and writedowns recorded on other real estate owned as a percentage of contractual loan balance prior to non-performing status |
|
|
|
|
|
|
|
|
|
|
|
|
|
|
| ||||||||||
|
Consumer |
|
35.1 |
% |
33.1 |
% |
32.2 |
% |
33.0 |
% |
30.9 |
% |
200 |
bps |
420 |
bps | ||||||||||
|
Commercial |
|
42.7 |
|
33.2 |
|
24.5 |
|
26.6 |
|
30.9 |
|
950 |
|
1,180 |
| ||||||||||
|
Total |
|
37.8 |
|
33.1 |
|
30.0 |
|
30.8 |
|
30.9 |
|
470 |
|
690 |
| ||||||||||
|
|
|
|
|
|
|
|
|
|
|
|
|
|
|
|
| ||||||||||
|
Ending number of properties owned |
|
|
|
|
|
|
|
|
|
|
|
|
|
|
| ||||||||||
|
Consumer real estate |
|
456 |
|
488 |
|
493 |
|
520 |
|
480 |
|
(32) |
|
(24) |
| ||||||||||
|
Commercial real estate |
|
33 |
|
26 |
|
26 |
|
28 |
|
32 |
|
7 |
|
1 |
| ||||||||||
|
Total |
|
489 |
|
514 |
|
519 |
|
548 |
|
512 |
|
(25) |
|
(23) |
| ||||||||||
(1) Includes properties owned and foreclosed properties subject to redemption.
-more-
TCF FINANCIAL CORPORATION AND SUBSIDIARIES
SUMMARY OF CREDIT QUALITY DATA, CONTINUED
(Dollars in thousands)
(Unaudited)
Allowance for Loan and Lease Losses
|
|
|
At September 30, 2011 |
|
At June 30, 2011 |
|
At September 30, 2010 |
|
Change from |
| ||||||||
|
|
|
|
|
|
|
|
|
|
|
|
|
|
|
Jun. 30, |
|
Sep. 30, |
|
|
|
|
Balance |
|
% of Portfolio |
|
Balance |
|
% of Portfolio |
|
Balance |
|
% of Portfolio |
|
2011 |
|
2010 |
|
|
Consumer real estate |
|
$ 177,430 |
|
2.55 |
% |
$ 175,716 |
|
2.50 |
% |
$ 169,743 |
|
2.35 |
% |
5 |
bps |
20 |
bps |
|
Consumer other |
|
1,219 |
|
3.68 |
|
1,421 |
|
3.79 |
|
2,069 |
|
4.74 |
|
(11) |
|
(106) |
|
|
Total consumer real estate and other |
|
178,649 |
|
2.55 |
|
177,137 |
|
2.51 |
|
171,812 |
|
2.36 |
|
4 |
|
19 |
|
|
Commercial |
|
49,499 |
|
1.42 |
|
50,783 |
|
1.41 |
|
49,584 |
|
1.35 |
|
1 |
|
7 |
|
|
Leasing and equipment finance |
|
23,300 |
|
.77 |
|
24,611 |
|
.81 |
|
28,974 |
|
.92 |
|
(4) |
|
(15) |
|
|
Inventory finance |
|
2,877 |
|
.35 |
|
2,941 |
|
.32 |
|
2,750 |
|
.35 |
|
3 |
|
- |
|
|
Total |
|
$ 254,325 |
|
1.77 |
|
$ 255,472 |
|
1.75 |
|
$ 253,120 |
|
1.70 |
|
2 |
|
7 |
|
Net Charge-Offs (Recoveries)
|
|
|
|
|
|
|
|
|
|
|
|
|
Change from |
| |||||||||
|
|
|
Quarter Ended |
|
Quarter Ended |
| |||||||||||||||||
|
|
|
Sep. 30, |
|
Jun. 30, |
|
Mar. 31, |
|
Dec. 31, |
|
Sep. 30, |
|
Jun. 30, |
|
Sep. 30, |
| |||||||
|
|
|
2011 |
|
2011 |
|
2011 |
|
2010 |
|
2010 |
|
2011 |
|
2010 |
| |||||||
|
Consumer real estate |
|
|
|
|
|
|
|
|
|
|
|
|
|
|
| |||||||
|
First mortgage lien |
|
$ |
27,590 |
|
$ |
21,593 |
|
$ |
21,950 |
|
$ |
23,206 |
|
$ |
20,119 |
|
$ |
5,997 |
|
$ |
7,471 |
|
|
Junior lien |
|
16,247 |
|
15,078 |
|
13,353 |
|
13,450 |
|
14,374 |
|
1,169 |
|
1,873 |
| |||||||
|
Total consumer real estate |
|
43,837 |
|
36,671 |
|
35,303 |
|
36,656 |
|
34,493 |
|
7,166 |
|
9,344 |
| |||||||
|
Consumer other |
|
1,480 |
|
684 |
|
(266) |
|
1,316 |
|
1,737 |
|
796 |
|
(257) |
| |||||||
|
Total consumer real estate and other |
|
45,317 |
|
37,355 |
|
35,037 |
|
37,972 |
|
36,230 |
|
7,962 |
|
9,087 |
| |||||||
|
Commercial |
|
5,040 |
|
2,684 |
|
17,778 |
|
18,596 |
|
12,826 |
|
2,356 |
|
(7,786) |
| |||||||
|
Leasing and equipment finance |
|
2,783 |
|
3,478 |
|
2,789 |
|
7,814 |
|
8,674 |
|
(695) |
|
(5,891) |
| |||||||
|
Inventory finance |
|
262 |
|
328 |
|
208 |
|
565 |
|
80 |
|
(66) |
|
182 |
| |||||||
|
Total |
|
$ |
53,402 |
|
$ |
43,845 |
|
$ |
55,812 |
|
$ |
64,947 |
|
$ |
57,810 |
|
$ |
9,557 |
|
$ |
(4,408) |
|
|
|
|
|
|
|
|
|
|
|
|
|
|
|
|
|
| |||||||
|
Net Charge-Offs as a Percentage of Average Loans and Leases |
|
|
|
|
|
|
|
|
| |||||||||||||
|
|
|
|
|
|
|
|
|
|
|
|
|
|
|
|
| |||||||
|
|
|
|
|
|
|
|
|
|
|
|
|
Change from |
| |||||||||
|
|
|
Quarter Ended (1) |
|
Quarter Ended |
| |||||||||||||||||
|
|
|
Sep. 30, |
|
Jun. 30, |
|
Mar. 31, |
|
Dec. 31, |
|
Sep. 30, |
|
Jun. 30, |
|
Sep. 30, |
| |||||||
|
|
|
2011 |
|
2011 |
|
2011 |
|
2010 |
|
2010 |
|
2011 |
|
2010 |
| |||||||
|
Consumer real estate |
|
|
|
|
|
|
|
|
|
|
|
|
|
|
| |||||||
|
First mortgage lien |
|
2.29 |
% |
1.78 |
% |
1.81 |
% |
1.88 |
% |
1.63 |
% |
51 |
bps |
66 |
bps | |||||||
|
Junior lien |
|
2.99 |
|
2.75 |
|
2.39 |
|
2.37 |
|
2.50 |
|
24 |
|
49 |
| |||||||
|
Total consumer real estate |
|
2.51 |
|
2.09 |
|
1.99 |
|
2.04 |
|
1.91 |
|
42 |
|
60 |
| |||||||
|
Total consumer real estate and other |
|
2.59 |
|
2.12 |
|
1.97 |
|
2.10 |
|
2.00 |
|
47 |
|
59 |
| |||||||
|
Commercial |
|
.57 |
|
.30 |
|
1.96 |
|
2.04 |
|
1.40 |
|
27 |
|
(83) |
| |||||||
|
Leasing and equipment finance |
|
.36 |
|
.45 |
|
.36 |
|
.99 |
|
1.16 |
|
(9) |
|
(80) |
| |||||||
|
Inventory finance |
|
.13 |
|
.13 |
|
.10 |
|
.28 |
|
.05 |
|
- |
|
8 |
| |||||||
|
Total |
|
1.48 |
|
1.19 |
|
1.51 |
|
1.75 |
|
1.58 |
|
29 |
|
(10) |
| |||||||
|
|
|
|
|
|
|
|
|
|
|
|
|
|
|
|
| |||||||
|
(1) Annualized. |
|
|
|
|
|
|
|
|
|
|
|
|
|
|
| |||||||
-more-
TCF FINANCIAL CORPORATION AND SUBSIDIARIES
CONSOLIDATED AVERAGE BALANCE SHEETS, YIELDS AND RATES
(Dollars in thousands)
(Unaudited)
|
|
|
Three Months Ended September 30, |
| ||||||||||||||
|
|
|
2011 |
|
2010 |
| ||||||||||||
|
|
|
Average |
|
|
|
Yields and |
|
Average |
|
|
|
Yields and |
| ||||
|
|
|
Balance |
|
Interest |
|
Rates (1) |
|
Balance |
|
Interest |
|
Rates (1) |
| ||||
|
ASSETS: |
|
|
|
|
|
|
|
|
|
|
|
|
| ||||
|
Investments and other |
|
$ |
958,996 |
|
$ |
1,997 |
|
.83 % |
|
$ |
309,027 |
|
$ |
1,232 |
|
1.59 % |
|
|
U.S. Government sponsored entities: |
|
|
|
|
|
|
|
|
|
|
|
|
| ||||
|
Mortgage-backed securities, fixed-rate |
|
2,339,862 |
|
22,556 |
|
3.86 |
|
1,796,348 |
|
19,873 |
|
4.43 |
| ||||
|
U.S. Treasury securities |
|
10,761 |
|
1 |
|
.04 |
|
69,705 |
|
23 |
|
.13 |
| ||||
|
Other securities |
|
340 |
|
4 |
|
4.68 |
|
452 |
|
5 |
|
4.40 |
| ||||
|
Total securities available for sale(2) |
|
2,350,963 |
|
22,561 |
|
3.84 |
|
1,866,505 |
|
19,901 |
|
4.26 |
| ||||
|
Loans and leases: |
|
|
|
|
|
|
|
|
|
|
|
|
| ||||
|
Consumer real estate: |
|
|
|
|
|
|
|
|
|
|
|
|
| ||||
|
Fixed-rate |
|
4,592,855 |
|
70,087 |
|
6.06 |
|
5,019,925 |
|
77,934 |
|
6.16 |
| ||||
|
Variable-rate |
|
2,392,966 |
|
30,845 |
|
5.11 |
|
2,213,091 |
|
29,893 |
|
5.36 |
| ||||
|
Consumer - other |
|
18,183 |
|
387 |
|
8.44 |
|
25,130 |
|
565 |
|
8.92 |
| ||||
|
Total consumer real estate and other |
|
7,004,004 |
|
101,319 |
|
5.74 |
|
7,258,146 |
|
108,392 |
|
5.93 |
| ||||
|
Commercial: |
|
|
|
|
|
|
|
|
|
|
|
|
| ||||
|
Fixed- and adjustable-rate |
|
2,853,117 |
|
41,150 |
|
5.72 |
|
2,955,954 |
|
43,862 |
|
5.89 |
| ||||
|
Variable-rate |
|
711,081 |
|
7,759 |
|
4.33 |
|
717,894 |
|
7,541 |
|
4.17 |
| ||||
|
Total commercial |
|
3,564,198 |
|
48,909 |
|
5.44 |
|
3,673,848 |
|
51,403 |
|
5.55 |
| ||||
|
Leasing and equipment finance |
|
3,066,208 |
|
46,072 |
|
6.01 |
|
3,002,714 |
|
48,103 |
|
6.41 |
| ||||
|
Inventory finance |
|
826,198 |
|
15,151 |
|
7.28 |
|
655,485 |
|
12,514 |
|
7.57 |
| ||||
|
Total loans and leases |
|
14,460,608 |
|
211,451 |
|
5.81 |
|
14,590,193 |
|
220,412 |
|
6.01 |
| ||||
|
Total interest-earning assets |
|
17,770,567 |
|
236,009 |
|
5.28 |
|
16,765,725 |
|
241,545 |
|
5.73 |
| ||||
|
Other assets |
|
1,222,700 |
|
|
|
|
|
1,268,697 |
|
|
|
|
| ||||
|
Total assets |
|
$ |
18,993,267 |
|
|
|
|
|
$ |
18,034,422 |
|
|
|
|
| ||
|
|
|
|
|
|
|
|
|
|
|
|
|
|
| ||||
|
LIABILITIES AND EQUITY: |
|
|
|
|
|
|
|
|
|
|
|
|
| ||||
|
Non-interest bearing deposits: |
|
|
|
|
|
|
|
|
|
|
|
|
| ||||
|
Retail |
|
$ |
1,396,857 |
|
|
|
|
|
$ |
1,408,984 |
|
|
|
|
| ||
|
Small business |
|
704,272 |
|
|
|
|
|
659,165 |
|
|
|
|
| ||||
|
Commercial and custodial |
|
294,253 |
|
|
|
|
|
279,475 |
|
|
|
|
| ||||
|
Total non-interest bearing deposits |
|
2,395,382 |
|
|
|
|
|
2,347,624 |
|
|
|
|
| ||||
|
Interest-bearing deposits: |
|
|
|
|
|
|
|
|
|
|
|
|
| ||||
|
Checking |
|
2,103,184 |
|
1,057 |
|
.20 |
|
2,014,550 |
|
1,454 |
|
.29 |
| ||||
|
Savings |
|
5,789,188 |
|
7,912 |
|
.54 |
|
5,426,481 |
|
9,095 |
|
.66 |
| ||||
|
Money market |
|
650,598 |
|
692 |
|
.42 |
|
654,030 |
|
1,074 |
|
.65 |
| ||||
|
Subtotal |
|
8,542,970 |
|
9,661 |
|
.45 |
|
8,095,061 |
|
11,623 |
|
.57 |
| ||||
|
Certificates of deposit |
|
1,114,934 |
|
2,222 |
|
.79 |
|
1,006,685 |
|
2,351 |
|
.93 |
| ||||
|
Total interest-bearing deposits |
|
9,657,904 |
|
11,883 |
|
.49 |
|
9,101,746 |
|
13,974 |
|
.61 |
| ||||
|
Total deposits |
|
12,053,286 |
|
11,883 |
|
.39 |
|
11,449,370 |
|
13,974 |
|
.48 |
| ||||
|
Borrowings: |
|
|
|
|
|
|
|
|
|
|
|
|
| ||||
|
Short-term borrowings |
|
43,073 |
|
31 |
|
.29 |
|
40,646 |
|
84 |
|
.82 |
| ||||
|
Long-term borrowings |
|
4,403,724 |
|
47,465 |
|
4.28 |
|
4,587,964 |
|
53,294 |
|
4.61 |
| ||||
|
Total borrowings |
|
4,446,797 |
|
47,496 |
|
4.24 |
|
4,628,610 |
|
53,378 |
|
4.58 |
| ||||
|
Total interest-bearing liabilities |
|
14,104,701 |
|
59,379 |
|
1.67 |
|
13,730,356 |
|
67,352 |
|
1.95 |
| ||||
|
Total deposits and borrowings |
|
16,500,083 |
|
59,379 |
|
1.43 |
|
16,077,980 |
|
67,352 |
|
1.66 |
| ||||
|
Other liabilities |
|
672,944 |
|
|
|
|
|
463,492 |
|
|
|
|
| ||||
|
Total liabilities |
|
17,173,027 |
|
|
|
|
|
16,541,472 |
|
|
|
|
| ||||
|
Total TCF Financial Corp. stockholders’ equity |
|
1,813,384 |
|
|
|
|
|
1,483,565 |
|
|
|
|
| ||||
|
Non-controlling interest in subsidiaries |
|
6,856 |
|
|
|
|
|
9,385 |
|
|
|
|
| ||||
|
Total equity |
|
1,820,240 |
|
|
|
|
|
1,492,950 |
|
|
|
|
| ||||
|
Total liabilities and equity |
|
$ |
18,993,267 |
|
|
|
|
|
$ |
18,034,422 |
|
|
|
|
| ||
|
Net interest income and margin |
|
|
|
$ |
176,630 |
|
3.96 % |
|
|
|
$ |
174,193 |
|
4.14 % |
| ||
(1) Annualized.
(2) Average balances and yields of securities available for sale are based upon the historical amortized cost and excludes equity securities.
-more-
TCF FINANCIAL CORPORATION AND SUBSIDIARIES
CONSOLIDATED AVERAGE BALANCE SHEETS, YIELDS AND RATES
(Dollars in thousands)
(Unaudited)
|
|
|
Nine Months Ended September 30, |
| ||||||||||||||
|
|
|
2011 |
|
2010 |
| ||||||||||||
|
|
|
Average |
|
|
|
Yields and |
|
Average |
|
|
|
Yields and |
| ||||
|
|
|
Balance |
|
Interest |
|
Rates (1) |
|
Balance |
|
Interest |
|
Rates (1) |
| ||||
|
ASSETS: |
|
|
|
|
|
|
|
|
|
|
|
|
| ||||
|
Investments and other |
|
$ |
744,934 |
|
$ |
5,634 |
|
1.01 % |
|
$ |
314,003 |
|
$ |
3,609 |
|
1.53 % |
|
|
U.S. Government sponsored entities: |
|
|
|
|
|
|
|
|
|
|
|
|
| ||||
|
Mortgage-backed securities, fixed-rate |
|
2,136,516 |
|
62,581 |
|
3.91 |
|
1,846,895 |
|
62,327 |
|
4.50 |
| ||||
|
U.S. Treasury securities |
|
64,414 |
|
34 |
|
.07 |
|
28,212 |
|
30 |
|
.14 |
| ||||
|
Other securities |
|
360 |
|
14 |
|
5.20 |
|
462 |
|
16 |
|
4.63 |
| ||||
|
Total securities available for sale(2) |
|
2,201,290 |
|
62,629 |
|
3.79 |
|
1,875,569 |
|
62,373 |
|
4.43 |
| ||||
|
Loans and leases: |
|
|
|
|
|
|
|
|
|
|
|
|
| ||||
|
Consumer real estate: |
|
|
|
|
|
|
|
|
|
|
|
|
| ||||
|
Fixed-rate |
|
4,660,371 |
|
212,508 |
|
6.10 |
|
5,152,532 |
|
238,612 |
|
6.19 |
| ||||
|
Variable-rate |
|
2,379,947 |
|
91,691 |
|
5.15 |
|
2,089,381 |
|
85,701 |
|
5.48 |
| ||||
|
Consumer - other |
|
19,788 |
|
1,300 |
|
8.78 |
|
27,687 |
|
1,766 |
|
8.53 |
| ||||
|
Total consumer real estate and other |
|
7,060,106 |
|
305,499 |
|
5.78 |
|
7,269,600 |
|
326,079 |
|
6.00 |
| ||||
|
Commercial: |
|
|
|
|
|
|
|
|
|
|
|
|
| ||||
|
Fixed- and adjustable-rate |
|
2,880,986 |
|
124,634 |
|
5.78 |
|
2,959,921 |
|
132,162 |
|
5.97 |
| ||||
|
Variable-rate |
|
713,898 |
|
23,173 |
|
4.34 |
|
739,274 |
|
23,231 |
|
4.20 |
| ||||
|
Total commercial |
|
3,594,884 |
|
147,807 |
|
5.50 |
|
3,699,195 |
|
155,393 |
|
5.62 |
| ||||
|
Leasing and equipment finance |
|
3,084,613 |
|
139,813 |
|
6.04 |
|
3,022,487 |
|
147,358 |
|
6.50 |
| ||||
|
Inventory finance |
|
889,709 |
|
47,816 |
|
7.19 |
|
634,182 |
|
35,327 |
|
7.45 |
| ||||
|
Total loans and leases |
|
14,629,312 |
|
640,935 |
|
5.85 |
|
14,625,464 |
|
664,157 |
|
6.07 |
| ||||
|
Total interest-earning assets |
|
17,575,536 |
|
709,198 |
|
5.39 |
|
16,815,036 |
|
730,139 |
|
5.80 |
| ||||
|
Other assets |
|
1,176,606 |
|
|
|
|
|
1,235,115 |
|
|
|
|
| ||||
|
Total assets |
|
$ |
18,752,142 |
|
|
|
|
|
$ |
18,050,151 |
|
|
|
|
| ||
|
|
|
|
|
|
|
|
|
|
|
|
|
|
| ||||
|
LIABILITIES AND EQUITY: |
|
|
|
|
|
|
|
|
|
|
|
|
| ||||
|
Non-interest bearing deposits: |
|
|
|
|
|
|
|
|
|
|
|
|
| ||||
|
Retail |
|
$ |
1,443,033 |
|
|
|
|
|
$ |
1,450,749 |
|
|
|
|
| ||
|
Small business |
|
685,435 |
|
|
|
|
|
629,530 |
|
|
|
|
| ||||
|
Commercial and custodial |
|
288,202 |
|
|
|
|
|
282,569 |
|
|
|
|
| ||||
|
Total non-interest bearing deposits |
|
2,416,670 |
|
|
|
|
|
2,362,848 |
|
|
|
|
| ||||
|
Interest-bearing deposits: |
|
|
|
|
|
|
|
|
|
|
|
|
| ||||
|
Checking |
|
2,120,083 |
|
3,633 |
|
.23 |
|
2,081,403 |
|
4,991 |
|
.32 |
| ||||
|
Savings |
|
5,608,783 |
|
22,688 |
|
.54 |
|
5,416,757 |
|
31,431 |
|
.78 |
| ||||
|
Money market |
|
657,570 |
|
2,331 |
|
.47 |
|
661,035 |
|
3,489 |
|
.71 |
| ||||
|
Subtotal |
|
8,386,436 |
|
28,652 |
|
.46 |
|
8,159,195 |
|
39,911 |
|
.65 |
| ||||
|
Certificates of deposit |
|
1,100,029 |
|
6,665 |
|
.81 |
|
1,058,840 |
|
7,948 |
|
1.00 |
| ||||
|
Total interest-bearing deposits |
|
9,486,465 |
|
35,317 |
|
.50 |
|
9,218,035 |
|
47,859 |
|
.69 |
| ||||
|
Total deposits |
|
11,903,135 |
|
35,317 |
|
.40 |
|
11,580,883 |
|
47,859 |
|
.55 |
| ||||
|
Borrowings: |
|
|
|
|
|
|
|
|
|
|
|
|
| ||||
|
Short-term borrowings |
|
53,619 |
|
144 |
|
.36 |
|
87,642 |
|
265 |
|
.40 |
| ||||
|
Long-term borrowings |
|
4,538,823 |
|
145,929 |
|
4.30 |
|
4,524,832 |
|
156,093 |
|
4.61 |
| ||||
|
Total borrowings |
|
4,592,442 |
|
146,073 |
|
4.25 |
|
4,612,474 |
|
156,358 |
|
4.53 |
| ||||
|
Total interest-bearing liabilities |
|
14,078,907 |
|
181,390 |
|
1.72 |
|
13,830,509 |
|
204,217 |
|
1.97 |
| ||||
|
Total deposits and borrowings |
|
16,495,577 |
|
181,390 |
|
1.47 |
|
16,193,357 |
|
204,217 |
|
1.69 |
| ||||
|
Other liabilities |
|
558,119 |
|
|
|
|
|
456,796 |
|
|
|
|
| ||||
|
Total liabilities |
|
17,053,696 |
|
|
|
|
|
16,650,153 |
|
|
|
|
| ||||
|
Total TCF Financial Corp. stockholders’ equity |
|
1,689,695 |
|
|
|
|
|
1,390,462 |
|
|
|
|
| ||||
|
Non-controlling interest in subsidiaries |
|
8,751 |
|
|
|
|
|
9,536 |
|
|
|
|
| ||||
|
Total equity |
|
1,698,446 |
|
|
|
|
|
1,399,998 |
|
|
|
|
| ||||
|
Total liabilities and equity |
|
$ |
18,752,142 |
|
|
|
|
|
$ |
18,050,151 |
|
|
|
|
| ||
|
Net interest income and margin |
|
|
|
$ |
527,808 |
|
4.01 % |
|
|
|
$ |
525,922 |
|
4.18 % |
| ||
(1) Annualized.
(2) Average balances and yields of securities available for sale are based upon the historical amortized cost and excludes equity securities.
-more-
TCF FINANCIAL CORPORATION AND SUBSIDIARIES
CONSOLIDATED QUARTERLY STATEMENTS OF INCOME AND FINANCIAL RATIOS
(Dollars in thousands, except per-share data)
(Unaudited)
|
|
|
At or For the Three Months Ended |
| |||||||||||||
|
|
|
Sep. 30, |
|
Jun. 30, |
|
Mar. 31, |
|
Dec. 31, |
|
Sep. 30, |
| |||||
|
|
|
2011 |
|
2011 |
|
2011 |
|
2010 |
|
2010 |
| |||||
|
Interest income: |
|
|
|
|
|
|
|
|
|
|
| |||||
|
Loans and leases |
|
$ |
210,885 |
|
$ |
213,823 |
|
$ |
214,673 |
|
$ |
220,772 |
|
$ |
219,974 |
|
|
Securities available for sale |
|
22,561 |
|
20,639 |
|
19,429 |
|
18,072 |
|
19,901 |
| |||||
|
Investments and other |
|
1,997 |
|
1,836 |
|
1,801 |
|
1,900 |
|
1,232 |
| |||||
|
Total interest income |
|
235,443 |
|
236,298 |
|
235,903 |
|
240,744 |
|
241,107 |
| |||||
|
Interest expense: |
|
|
|
|
|
|
|
|
|
|
| |||||
|
Deposits |
|
11,883 |
|
11,430 |
|
12,004 |
|
13,370 |
|
13,974 |
| |||||
|
Borrowings |
|
47,496 |
|
48,718 |
|
49,859 |
|
53,088 |
|
53,378 |
| |||||
|
Total interest expense |
|
59,379 |
|
60,148 |
|
61,863 |
|
66,458 |
|
67,352 |
| |||||
|
Net interest income |
|
176,064 |
|
176,150 |
|
174,040 |
|
174,286 |
|
173,755 |
| |||||
|
Provision for credit losses |
|
52,315 |
|
44,005 |
|
45,274 |
|
77,646 |
|
59,287 |
| |||||
|
Net interest income after provision for |
|
123,749 |
|
132,145 |
|
128,766 |
|
96,640 |
|
114,468 |
| |||||
|
Non-interest income: |
|
|
|
|
|
|
|
|
|
|
| |||||
|
Fees and service charges |
|
58,452 |
|
56,396 |
|
53,513 |
|
61,480 |
|
67,684 |
| |||||
|
Card revenue |
|
27,701 |
|
28,219 |
|
26,584 |
|
27,625 |
|
27,779 |
| |||||
|
ATM revenue |
|
7,523 |
|
7,091 |
|
6,705 |
|
6,985 |
|
7,985 |
| |||||
|
Subtotal |
|
93,676 |
|
91,706 |
|
86,802 |
|
96,090 |
|
103,448 |
| |||||
|
Leasing and equipment finance |
|
21,646 |
|
22,279 |
|
26,750 |
|
23,402 |
|
24,912 |
| |||||
|
Other |
|
786 |
|
384 |
|
694 |
|
817 |
|
1,077 |
| |||||
|
Fees and other revenue |
|
116,108 |
|
114,369 |
|
114,246 |
|
120,309 |
|
129,437 |
| |||||
|
Gains (losses) on securities |
|
1,648 |
|
(227) |
|
- |
|
21,185 |
|
8,505 |
| |||||
|
Total non-interest income |
|
117,756 |
|
114,142 |
|
114,246 |
|
141,494 |
|
137,942 |
| |||||
|
Non-interest expense: |
|
|
|
|
|
|
|
|
|
|
| |||||
|
Compensation and employee benefits |
|
88,599 |
|
89,997 |
|
90,273 |
|
87,371 |
|
90,282 |
| |||||
|
Occupancy and equipment |
|
31,129 |
|
30,783 |
|
32,159 |
|
30,968 |
|
32,091 |
| |||||
|
FDIC insurance |
|
7,363 |
|
7,542 |
|
7,195 |
|
7,398 |
|
5,486 |
| |||||
|
Deposit account premiums |
|
7,045 |
|
6,166 |
|
3,198 |
|
1,688 |
|
3,340 |
| |||||
|
Advertising and marketing |
|
1,145 |
|
3,479 |
|
3,160 |
|
3,154 |
|
3,354 |
| |||||
|
Other |
|
34,708 |
|
37,067 |
|
34,566 |
|
37,309 |
|
39,481 |
| |||||
|
Subtotal |
|
169,989 |
|
175,034 |
|
170,551 |
|
167,888 |
|
174,034 |
| |||||
|
Foreclosed real estate and repossessed assets, net |
|
12,430 |
|
12,617 |
|
12,868 |
|
12,781 |
|
9,588 |
| |||||
|
Operating lease depreciation |
|
7,409 |
|
7,859 |
|
7,928 |
|
8,289 |
|
8,965 |
| |||||
|
Other credit costs, net |
|
(139) |
|
496 |
|
2,548 |
|
1,542 |
|
(834) |
| |||||
|
Total non-interest expense |
|
189,689 |
|
196,006 |
|
193,895 |
|
190,500 |
|
191,753 |
| |||||
|
Income before income tax expense |
|
51,816 |
|
50,281 |
|
49,117 |
|
47,634 |
|
60,657 |
| |||||
|
Income tax expense |
|
18,856 |
|
18,758 |
|
18,442 |
|
16,011 |
|
22,852 |
| |||||
|
Income after income tax expense |
|
32,960 |
|
31,523 |
|
30,675 |
|
31,623 |
|
37,805 |
| |||||
|
Income attributable to non-controlling interest |
|
1,243 |
|
1,686 |
|
989 |
|
898 |
|
912 |
| |||||
|
Net income available to common stockholders |
|
$ |
31,717 |
|
$ |
29,837 |
|
$ |
29,686 |
|
$ |
30,725 |
|
$ |
36,893 |
|
|
|
|
|
|
|
|
|
|
|
|
|
| |||||
|
Net income per common share: |
|
|
|
|
|
|
|
|
|
|
| |||||
|
Basic |
|
$ |
.20 |
|
$ |
.19 |
|
$ |
.20 |
|
$ |
.22 |
|
$ |
.26 |
|
|
Diluted |
|
.20 |
|
.19 |
|
.20 |
|
.22 |
|
.26 |
| |||||
|
|
|
|
|
|
|
|
|
|
|
|
| |||||
|
Dividends declared per common share |
|
$ |
.05 |
|
$ |
.05 |
|
$ |
.05 |
|
$ |
.05 |
|
$ |
.05 |
|
|
|
|
|
|
|
|
|
|
|
|
|
| |||||
|
Financial Ratios: (1) |
|
|
|
|
|
|
|
|
|
|
| |||||
|
|
|
|
|
|
|
|
|
|
|
|
| |||||
|
Return on average assets |
|
.69 |
% |
.67 |
% |
.66 |
% |
.68 |
% |
.84 |
% | |||||
|
|
|
|
|
|
|
|
|
|
|
|
| |||||
|
Return on average common equity |
|
7.00 |
|
6.86 |
|
7.84 |
|
8.25 |
|
9.95 |
| |||||
|
|
|
|
|
|
|
|
|
|
|
|
| |||||
|
Net interest margin |
|
3.96 |
|
4.02 |
|
4.06 |
|
4.05 |
|
4.14 |
| |||||
(1) Annualized.
-more-
TCF FINANCIAL CORPORATION AND SUBSIDIARIES
CONSOLIDATED QUARTERLY AVERAGE BALANCE SHEETS
(In thousands)
(Unaudited)
|
|
|
Sep. 30, |
|
Jun. 30, |
|
Mar. 31, |
|
Dec. 31, |
|
Sep. 30, |
| |||||
|
|
|
2011 |
|
2011 |
|
2011 |
|
2010 |
|
2010 |
| |||||
|
ASSETS |
|
|
|
|
|
|
|
|
|
|
| |||||
|
Cash and due from banks |
|
$ |
1,078,521 |
|
$ |
802,812 |
|
$ |
677,695 |
|
$ |
506,244 |
|
$ |
420,674 |
|
|
Investments |
|
162,717 |
|
166,039 |
|
172,309 |
|
176,795 |
|
162,034 |
| |||||
|
U.S. Government sponsored entities: |
|
|
|
|
|
|
|
|
|
|
| |||||
|
Mortgage-backed securities |
|
2,357,865 |
|
2,153,016 |
|
1,979,648 |
|
1,907,958 |
|
1,767,410 |
| |||||
|
U.S. Treasury securities |
|
10,761 |
|
135,613 |
|
47,269 |
|
199,330 |
|
69,705 |
| |||||
|
Other securities |
|
2,132 |
|
2,360 |
|
2,578 |
|
2,945 |
|
3,473 |
| |||||
|
Total securities available for sale |
|
2,370,758 |
|
2,290,989 |
|
2,029,495 |
|
2,110,233 |
|
1,840,588 |
| |||||
|
Loans and leases: |
|
|
|
|
|
|
|
|
|
|
| |||||
|
Consumer real estate: |
|
|
|
|
|
|
|
|
|
|
| |||||
|
Fixed-rate |
|
4,592,855 |
|
4,655,198 |
|
4,734,618 |
|
4,874,633 |
|
5,019,925 |
| |||||
|
Variable-rate |
|
2,392,966 |
|
2,379,250 |
|
2,367,341 |
|
2,322,623 |
|
2,213,091 |
| |||||
|
Consumer - other |
|
18,183 |
|
19,463 |
|
21,757 |
|
23,283 |
|
25,130 |
| |||||
|
Total consumer real estate and other |
|
7,004,004 |
|
7,053,911 |
|
7,123,716 |
|
7,220,539 |
|
7,258,146 |
| |||||
|
Commercial: |
|
|
|
|
|
|
|
|
|
|
| |||||
|
Fixed- and adjustable-rate |
|
2,853,117 |
|
2,877,903 |
|
2,912,593 |
|
2,947,137 |
|
2,955,954 |
| |||||
|
Variable-rate |
|
711,081 |
|
719,741 |
|
710,870 |
|
703,769 |
|
717,894 |
| |||||
|
Total commercial |
|
3,564,198 |
|
3,597,644 |
|
3,623,463 |
|
3,650,906 |
|
3,673,848 |
| |||||
|
Leasing and equipment finance |
|
3,066,208 |
|
3,068,550 |
|
3,119,669 |
|
3,155,472 |
|
3,002,714 |
| |||||
|
Inventory finance |
|
826,198 |
|
978,505 |
|
872,785 |
|
803,157 |
|
655,485 |
| |||||
|
Total loans and leases |
|
14,460,608 |
|
14,698,610 |
|
14,739,633 |
|
14,830,074 |
|
14,590,193 |
| |||||
|
Allowance for loan and lease losses |
|
(253,547) |
|
(255,441) |
|
(263,014) |
|
(251,904) |
|
(251,603) |
| |||||
|
Net loans and leases |
|
14,207,061 |
|
14,443,169 |
|
14,476,619 |
|
14,578,170 |
|
14,338,590 |
| |||||
|
Premises and equipment, net |
|
439,288 |
|
442,529 |
|
445,093 |
|
446,527 |
|
447,364 |
| |||||
|
Goodwill |
|
152,599 |
|
152,599 |
|
152,599 |
|
152,599 |
|
152,599 |
| |||||
|
Other assets |
|
582,323 |
|
498,214 |
|
527,217 |
|
638,987 |
|
672,573 |
| |||||
|
Total assets |
|
$ |
18,993,267 |
|
$ |
18,796,351 |
|
$ |
18,481,027 |
|
$ |
18,609,555 |
|
$ |
18,034,422 |
|
|
|
|
|
|
|
|
|
|
|
|
|
| |||||
|
LIABILITIES AND EQUITY |
|
|
|
|
|
|
|
|
|
|
| |||||
|
Non-interest-bearing deposits: |
|
|
|
|
|
|
|
|
|
|
| |||||
|
Retail |
|
$ |
1,396,857 |
|
$ |
1,475,191 |
|
$ |
1,457,723 |
|
$ |
1,366,190 |
|
$ |
1,408,984 |
|
|
Small business |
|
704,272 |
|
683,323 |
|
668,316 |
|
676,670 |
|
659,165 |
| |||||
|
Commercial and custodial |
|
294,253 |
|
278,808 |
|
291,513 |
|
291,295 |
|
279,475 |
| |||||
|
Total non-interest bearing deposits |
|
2,395,382 |
|
2,437,322 |
|
2,417,552 |
|
2,334,155 |
|
2,347,624 |
| |||||
|
Interest-bearing deposits: |
|
|
|
|
|
|
|
|
|
|
| |||||
|
Checking |
|
2,103,184 |
|
2,152,646 |
|
2,104,433 |
|
2,044,060 |
|
2,014,550 |
| |||||
|
Savings |
|
5,789,188 |
|
5,608,824 |
|
5,424,327 |
|
5,392,650 |
|
5,426,481 |
| |||||
|
Money market |
|
650,598 |
|
648,862 |
|
673,503 |
|
643,801 |
|
654,030 |
| |||||
|
Subtotal |
|
8,542,970 |
|
8,410,332 |
|
8,202,263 |
|
8,080,511 |
|
8,095,061 |
| |||||
|
Certificates of deposit |
|
1,114,934 |
|
1,092,368 |
|
1,092,537 |
|
1,040,348 |
|
1,006,685 |
| |||||
|
Total interest-bearing deposits |
|
9,657,904 |
|
9,502,700 |
|
9,294,800 |
|
9,120,859 |
|
9,101,746 |
| |||||
|
Total deposits |
|
12,053,286 |
|
11,940,022 |
|
11,712,352 |
|
11,455,014 |
|
11,449,370 |
| |||||
|
Borrowings: |
|
|
|
|
|
|
|
|
|
|
| |||||
|
Short-term borrowings |
|
43,073 |
|
35,227 |
|
83,038 |
|
235,219 |
|
40,646 |
| |||||
|
Long-term borrowings |
|
4,403,724 |
|
4,513,301 |
|
4,702,729 |
|
4,746,823 |
|
4,587,964 |
| |||||
|
Total borrowings |
|
4,446,797 |
|
4,548,528 |
|
4,785,767 |
|
4,982,042 |
|
4,628,610 |
| |||||
|
Accrued expenses and other liabilities |
|
672,944 |
|
556,641 |
|
460,434 |
|
674,827 |
|
463,492 |
| |||||
|
Total liabilities |
|
17,173,027 |
|
17,045,191 |
|
16,958,553 |
|
17,111,883 |
|
16,541,472 |
| |||||
|
Equity: |
|
|
|
|
|
|
|
|
|
|
| |||||
|
Preferred stock |
|
- |
|
- |
|
- |
|
- |
|
- |
| |||||
|
Common stock |
|
1,598 |
|
1,594 |
|
1,463 |
|
1,428 |
|
1,426 |
| |||||
|
Additional paid-in capital |
|
705,366 |
|
698,683 |
|
503,852 |
|
456,760 |
|
451,570 |
| |||||
|
Retained earnings, subject to certain restrictions |
|
1,119,702 |
|
1,096,044 |
|
1,073,924 |
|
1,052,092 |
|
1,025,631 |
| |||||
|
Accumulated other comprehensive income (loss) |
|
19,726 |
|
(23,742) |
|
(41,699) |
|
3,089 |
|
28,861 |
| |||||
|
Treasury stock at cost and other |
|
(33,008) |
|
(33,036) |
|
(22,961) |
|
(23,027) |
|
(23,923) |
| |||||
|
Total TCF Financial Corp. stockholders equity |
|
1,813,384 |
|
1,739,543 |
|
1,514,579 |
|
1,490,342 |
|
1,483,565 |
| |||||
|
Non-controlling interest in subsidiaries |
|
6,856 |
|
11,617 |
|
7,895 |
|
7,330 |
|
9,385 |
| |||||
|
Total equity |
|
1,820,240 |
|
1,751,160 |
|
1,522,474 |
|
1,497,672 |
|
1,492,950 |
| |||||
|
Total liabilities and equity |
|
$ |
18,993,267 |
|
$ |
18,796,351 |
|
$ |
18,481,027 |
|
$ |
18,609,555 |
|
$ |
18,034,422 |
|
-more-
TCF FINANCIAL CORPORATION AND SUBSIDIARIES
CONSOLIDATED QUARTERLY YIELDS AND RATES (1)
(Unaudited)
|
|
|
Sep. 30, |
|
Jun. 30, |
|
Mar. 31, |
|
Dec. 31, |
|
Sep. 30, |
|
|
|
|
2011 |
|
2011 |
|
2011 |
|
2010 |
|
2010 |
|
|
|
|
|
|
|
|
|
|
|
|
|
|
|
ASSETS |
|
|
|
|
|
|
|
|
|
|
|
|
|
|
|
|
|
|
|
|
|
|
|
|
|
Investments and other |
|
.83 |
% |
1.06 |
% |
1.26 |
% |
1.86 |
% |
1.59 |
% |
|
U.S. Government sponsored entities: |
|
|
|
|
|
|
|
|
|
|
|
|
Mortgage-backed securities |
|
3.86 |
|
3.92 |
|
3.96 |
|
4.16 |
|
4.43 |
|
|
U.S. Treasury securities |
|
.04 |
|
.06 |
|
.11 |
|
.13 |
|
.13 |
|
|
Other securities |
|
4.68 |
|
5.68 |
|
5.21 |
|
3.69 |
|
4.40 |
|
|
Total securities available for sale (2) |
|
3.84 |
|
3.69 |
|
3.87 |
|
3.75 |
|
4.26 |
|
|
Loans and leases: |
|
|
|
|
|
|
|
|
|
|
|
|
Consumer real estate: |
|
|
|
|
|
|
|
|
|
|
|
|
Fixed-rate |
|
6.06 |
|
6.08 |
|
6.15 |
|
6.10 |
|
6.16 |
|
|
Variable-rate |
|
5.11 |
|
5.15 |
|
5.19 |
|
5.25 |
|
5.36 |
|
|
Consumer - other |
|
8.44 |
|
9.01 |
|
8.87 |
|
9.15 |
|
8.92 |
|
|
Total consumer real estate and other |
|
5.74 |
|
5.78 |
|
5.84 |
|
5.84 |
|
5.93 |
|
|
Commercial: |
|
|
|
|
|
|
|
|
|
|
|
|
Fixed- and adjustable-rate |
|
5.72 |
|
5.78 |
|
5.85 |
|
5.90 |
|
5.89 |
|
|
Variable-rate |
|
4.33 |
|
4.32 |
|
4.37 |
|
4.16 |
|
4.17 |
|
|
Total commercial |
|
5.44 |
|
5.49 |
|
5.56 |
|
5.57 |
|
5.55 |
|
|
Leasing and equipment finance |
|
6.01 |
|
6.02 |
|
6.10 |
|
6.24 |
|
6.41 |
|
|
Inventory finance |
|
7.28 |
|
7.11 |
|
7.12 |
|
7.19 |
|
7.57 |
|
|
Total loans and leases |
|
5.81 |
|
5.85 |
|
5.90 |
|
5.93 |
|
6.01 |
|
|
|
|
|
|
|
|
|
|
|
|
|
|
|
Total interest-earning assets |
|
5.28 |
|
5.38 |
|
5.51 |
|
5.59 |
|
5.73 |
|
|
|
|
|
|
|
|
|
|
|
|
|
|
|
LIABILITIES |
|
|
|
|
|
|
|
|
|
|
|
|
|
|
|
|
|
|
|
|
|
|
|
|
|
Interest-bearing deposits: |
|
|
|
|
|
|
|
|
|
|
|
|
Checking |
|
.20 |
|
.23 |
|
.26 |
|
.29 |
|
.29 |
|
|
Savings |
|
.54 |
|
.52 |
|
.56 |
|
.63 |
|
.66 |
|
|
Money market |
|
.42 |
|
.45 |
|
.55 |
|
.64 |
|
.65 |
|
|
Subtotal |
|
.45 |
|
.44 |
|
.48 |
|
.55 |
|
.57 |
|
|
Certificates of deposit |
|
.79 |
|
.81 |
|
.83 |
|
.86 |
|
.93 |
|
|
Total interest-bearing deposits |
|
.49 |
|
.48 |
|
.52 |
|
.58 |
|
.61 |
|
|
Total deposits |
|
.39 |
|
.38 |
|
.42 |
|
.46 |
|
.48 |
|
|
Borrowings: |
|
|
|
|
|
|
|
|
|
|
|
|
Short-term borrowings |
|
.29 |
|
.24 |
|
.45 |
|
.35 |
|
.82 |
|
|
Long-term borrowings |
|
4.28 |
|
4.33 |
|
4.28 |
|
4.42 |
|
4.61 |
|
|
Total borrowings |
|
4.24 |
|
4.29 |
|
4.22 |
|
4.23 |
|
4.58 |
|
|
|
|
|
|
|
|
|
|
|
|
|
|
|
Total interest-bearing liabilities |
|
1.67 |
|
1.72 |
|
1.78 |
|
1.87 |
|
1.95 |
|
|
|
|
|
|
|
|
|
|
|
|
|
|
|
Net interest margin |
|
3.96 |
% |
4.02 |
% |
4.06 |
% |
4.05 |
% |
4.14 |
% |
(1) Annualized.
(2) Average yields of securities available for sale are based upon the historical amortized cost and excludes equity securities.
-more-
TCF FINANCIAL CORPORATION AND SUBSIDIARIES
RECONCILIATION OF GAAP TO NON-GAAP MEASURES (1)
(Dollars in thousands)
(Unaudited)
|
|
|
At Sep. 30, |
|
At Dec. 31, |
| ||
|
|
|
2011 |
|
2010 |
| ||
|
Computation of total equity to total assets: |
|
|
|
|
| ||
|
Total equity |
|
$ |
1,872,083 |
|
$ |
1,480,163 |
|
|
Total assets |
|
$ |
19,092,066 |
|
$ |
18,465,025 |
|
|
Total equity to total assets |
|
9.81 |
% |
8.02 |
% | ||
|
|
|
|
|
|
| ||
|
Computation of tangible realized common equity to tangible assets: |
|
|
|
|
| ||
|
Total equity |
|
$ |
1,872,083 |
|
$ |
1,480,163 |
|
|
Less: Non-controlling interest in subsidiaries |
|
12,273 |
|
8,500 |
| ||
|
Total TCF Financial Corp. stockholders’ equity |
|
1,859,810 |
|
1,471,663 |
| ||
|
Less: |
|
|
|
|
| ||
|
Goodwill |
|
152,599 |
|
152,599 |
| ||
|
Other intangibles |
|
1,103 |
|
1,232 |
| ||
|
Accumulated other comprehensive income |
|
49,038 |
|
- |
| ||
|
Add: |
|
|
|
|
| ||
|
Accumulated other comprehensive loss |
|
- |
|
31,514 |
| ||
|
Tangible realized common equity |
|
$ |
1,657,070 |
|
$ |
1,349,346 |
|
|
|
|
|
|
|
| ||
|
Total assets |
|
$ |
19,092,066 |
|
$ |
18,465,025 |
|
|
Less: |
|
|
|
|
| ||
|
Goodwill |
|
152,599 |
|
152,599 |
| ||
|
Other intangibles |
|
1,103 |
|
1,232 |
| ||
|
Tangible assets |
|
$ |
18,938,364 |
|
$ |
18,311,194 |
|
|
|
|
|
|
|
| ||
|
Tangible realized common equity to tangible assets |
|
8.75 |
% |
7.37 |
% | ||
|
|
|
|
|
|
| ||
|
|
|
At Sep. 30, |
|
At Dec. 31, |
| ||
|
|
|
2011 |
|
2010 |
| ||
|
Computation of tier 1 risk-based capital ratio: |
|
|
|
|
| ||
|
Total tier 1 capital |
|
$ |
1,787,140 |
|
$ |
1,475,525 |
|
|
Total risk-weighted assets |
|
$ |
13,586,781 |
|
$ |
13,929,097 |
|
|
Total tier 1 risk-based capital ratio |
|
13.15 |
% |
10.59 |
% | ||
|
|
|
|
|
|
| ||
|
Computation of tier 1 common capital ratio: |
|
|
|
|
| ||
|
Total tier 1 capital |
|
$ |
1,787,140 |
|
$ |
1,475,525 |
|
|
Less: |
|
|
|
|
| ||
|
Qualifying trust preferred securities |
|
115,000 |
|
115,000 |
| ||
|
Qualifying non-controlling interest in subsidiaries |
|
12,273 |
|
8,500 |
| ||
|
Total tier 1 common capital |
|
$ |
1,659,867 |
|
$ |
1,352,025 |
|
|
|
|
|
|
|
| ||
|
Total tier 1 common capital ratio |
|
12.22 |
% |
9.71 |
% | ||
(1) In contrast to GAAP-basis and regulatory capital-basis measures, tangible realized common equity excludes the effect of goodwill, other intangibles and accumulated other comprehensive income (loss) and the total tier 1 common capital ratio excludes the effect of qualifying trust preferred securities and qualifying non-controlling interest in subsidiaries. Management reviews these ratios as ongoing measures and has included this information because of current interest in the industry. The methodology for calculating these ratios may vary between companies.
###