Attached files
| file | filename |
|---|---|
| 8-K - FORM 8-K - NTELOS HOLDINGS CORP. | d235607d8k.htm |
 Investor Presentations
September 2011
Exhibit 99.1 |
 1
Today’s
presenters |
 2
Distribution
Capital
Markets
NTELOS Holdings to complete 1 for 2 reverse split immediately before separation
Distribution of 1.0 share of Lumos Networks Corp. for every 1.0 share of NTELOS
Holdings, post reverse split
Result of approximately 21mm shares outstanding at each company
$315mm cash dividend to NTELOS Holdings at separation; NTELOS Holdings pays
down debt of $283mm
Pro forma post-separation leverage (06/30/11 PF LTM EBITDA)
NTELOS
Holdings:
3.3x;
$45mm
opening
cash
Lumos
Networks:
3.5x;
$20mm
opening
cash
Public Listing
NTELOS
Holdings:
NTLS
(Nasdaq)
Lumos
Networks:
LMOS
(Nasdaq)
Dividend payout
Combined dividend expected to be in line with current dividend
Declaration of distribution to occur promptly following receipt of satisfactory
private letter ruling from the IRS (and subject to final board approval)
Closing is currently expected to occur mid to late October
All other conditions to declaration of distribution have been satisfied at this time
Transaction summary
Transaction
Status |
 Investor Presentation
September 2011 |
 4
Use of Non-GAAP Financial Measures
Special Note Regarding Forward-Looking Statements
Included in this presentation are certain non-GAAP financial measures that are not
determined in accordance with US generally accepted accounting principles. These
financial performance measures are not indicative of cash provided or used by operating activities and
exclude the effects of certain operating, capital and financing costs and may differ from
comparable information provided by other companies, and they should not be considered
in isolation, as an alternative to, or more meaningful than measures of financial
performance determined in accordance with US generally accepted accounting principles.
These financial performance measures are commonly used in the industry and are
presented because Lumos Networks Corp. believes they provide relevant and useful information to
investors. The Company utilizes these financial performance measures to assess its
ability to meet future capital expenditure and working capital requirements, to incur
indebtedness if necessary, and to fund continued growth. Lumos Networks Corp. uses these financial
performance measures to evaluate the performance of its business, for budget planning purposes
and as factors in its employee compensation programs.
Any statements contained in this presentation that are not statements of historical fact,
including statements about our beliefs and expectations, are forward-looking
statements and should be evaluated as such. The words “anticipates,” “believes,” “expects,” “intends,”
“plans,” “estimates,” “targets,” “projects,”
“should,” “may,” “will” and similar words and expressions are intended to identify forward-
looking statements. Such forward-looking statements reflect, among other things, our
current expectations, plans and strategies, and anticipated financial results, all of
which are subject to known and unknown risks, uncertainties and factors that may cause our actual
results to differ materially from those expressed or implied by these forward-looking
statements. Many of these risks are beyond our ability to control or predict. Because
of these risks, uncertainties and assumptions, you should not place undue reliance on these forward-
looking statements. Furthermore, forward-looking statements speak only as of the date they
are made. We do not undertake any obligation to update or review any
forward-looking information, whether as a result of new information, future events or otherwise.
Important factors with respect to any such forward-looking statements, including certain
risks and uncertainties that could cause actual results to differ from those contained
in the forward-looking statements, include, but are not limited to: rapid development and intense
competition in the telecommunications industry; our ability to successfully integrate the
operations of the FiberNet business; the failure to realize synergies and cost savings
from the acquisition of the FiberNet business or delay in realization thereof; adverse economic
conditions; operating and financial restrictions imposed by our senior credit facility; our
cash and capital requirements; declining prices for our services; the potential to
experience a high rate of customer turnover; federal and state regulatory fees, requirements and
developments; our reliance on certain suppliers and vendors; failure to complete the business
separation of the wireless and wireline operations in an orderly fashion as currently
structured; and other unforeseen difficulties that may occur. These risks and uncertainties
are not intended to represent a complete list of all risks and uncertainties inherent in our
business, and should be read in conjunction with the more detailed cautionary
statements and risk factors included in our SEC filings, including our Form 10 filings and Annual Reports filed
on Forms 10-K.
|
 5
Investment themes
Unique assets provide operating leverage and competitive advantage,
positioning Lumos Networks as region’s provider of choice
Established platform for growth
Attractive combination of growth and income |
 Unique assets
provide operating leverage and competitive advantage, positioning Lumos
Networks as region’s provider of choice |
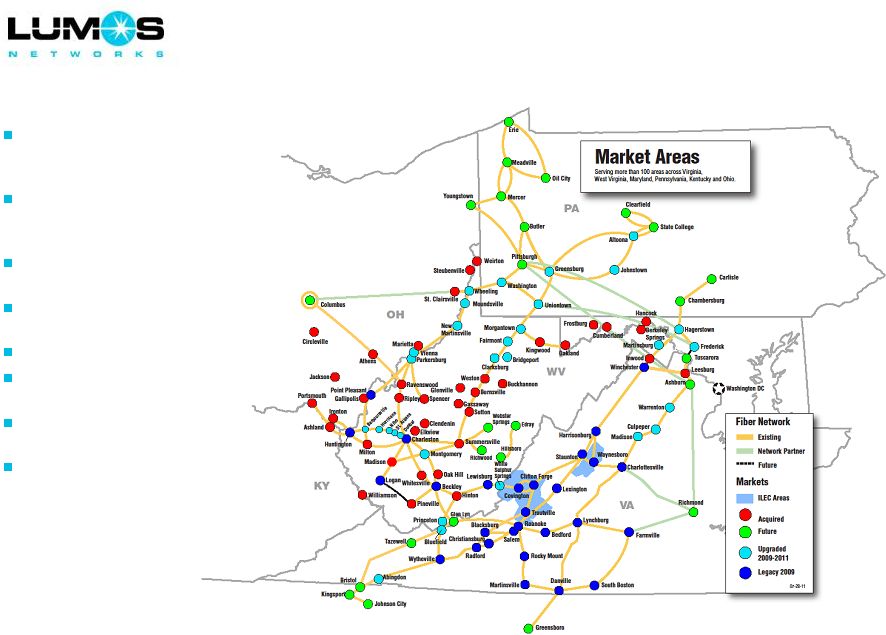 7
Advanced, dense regional fiber network
Provides service to more than
100 markets in Mid-Atlantic
region
Network footprint includes
approximately 185,000
businesses
Supports IP based and
Ethernet applications
Over 50,000 current customer
relationships
5,800 fiber route miles
State-of-the-art Cisco IP
network
RLEC with 98% 6MB+
broadband coverage
Video and fiber passes
approximately one-third of
the RLEC base
Provider of Choice |
 8
57
57
57
63
71
91
109
0
20
40
60
80
100
120
Q4-09
Q1-10
Q2-10
Q3-10
Q4-10
Q1-11
Q2-11
Fiber-Fed Cell Sites
76
86
89
91
143
144
146
0
30
60
90
120
150
Q4-09
Q1-10
Q2-10
Q3-10
Q4-10
Q1-11
Q2-11
Co-locations
2,511
4,746
4,786
4,940
4,941
5,767
5,788
0
2,000
4,000
6,000
8,000
Q4-09
Q1-10
Q2-10
Q3-10
Q4-10
Q1-11
Q2-11
Fiber Route Miles
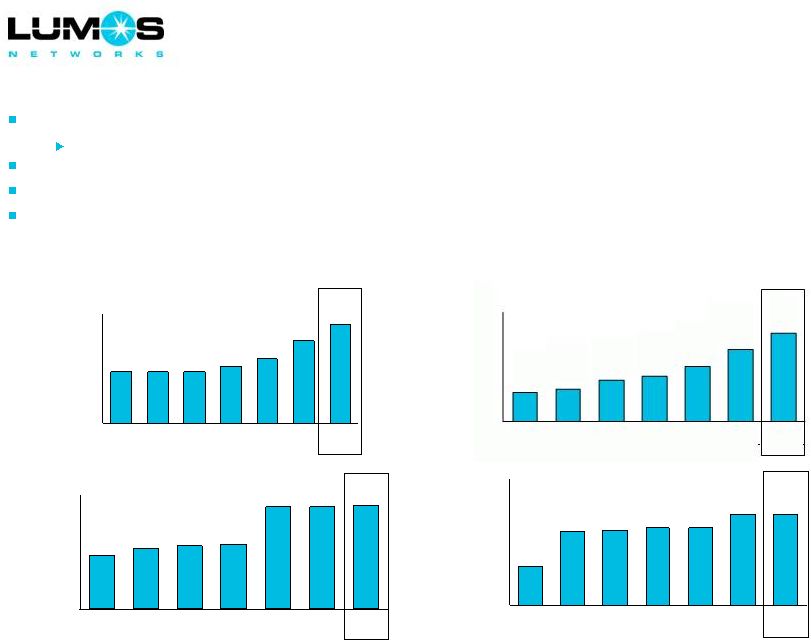
Network positioned for the future
$263 million invested into network in previous 18 months
$ 74 million in capital expenditures; $189 million in acquisitions (network expansion)
Connections to major data centers support exploding Cloud computing demand
Capacity to support significant market opportunity for on-net retail and wholesale
customer expansion Extensive rural fiber network footprint creates competitive
advantages in the market 1
On-Net Buildings excludes FiberNet.
Provider of Choice
633
647
687
705
752
830
903
500
600
700
800
900
1000
Q4
-09
Q1
-10
Q2
-10
Q3
-10
Q4
-10
Q1
-11
Q2
-11
On-Net Buildings
1 |
 9
Brand positioning highlights our innovative services and commitment to provide support from
well- trained, dedicated employees
Experienced direct sales and sales engineering teams in-market
Exceptional customer service
93% of calls answered within 10 seconds
91% first-call resolution
Net Promoter scores in top tier across all industries
Strong long-term customer relationships
90% of key vertical account revenues in 2007 are still billing in 2011
75% of revenues in all customer accounts with monthly recurring revenues of $1,000 or greater
in 2007 are
still
billing
in
2011
–
0.6%
monthly
churn
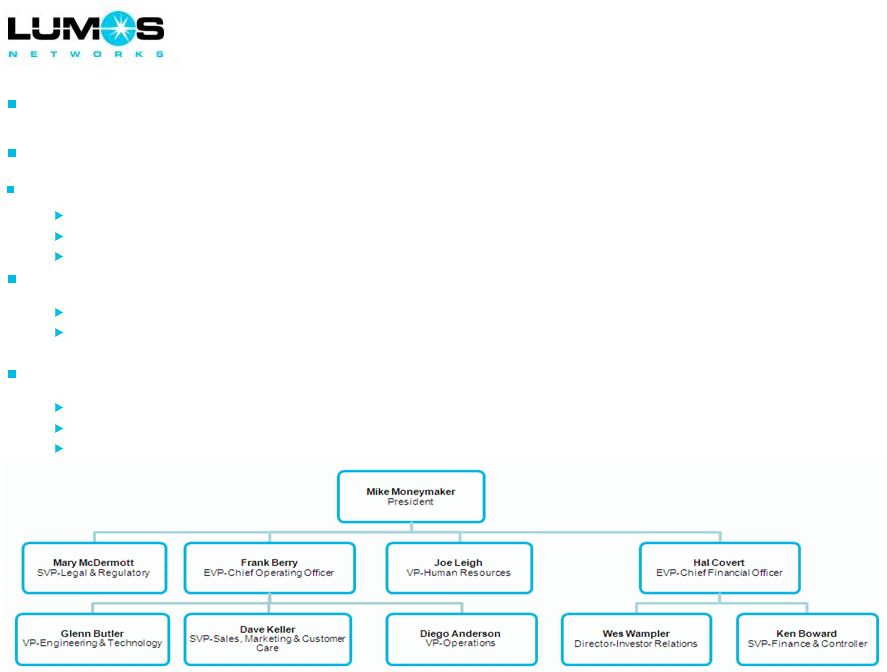
Experienced management team
Each member of operating management has 10 or more years of experience with wireline
business Key contributors to development of Competitive segment and transition to data
strategy Led execution and integration of recent acquisitions
“Our technology comes with people”
Provider of Choice |
 Established
platform for growth |
 11
Leverage regional scale
Sell advanced data services to recently-entered Pennsylvania and West Virginia
markets Increase on-net buildings and expand reach in existing markets
Leverage sophisticated sales and sales engineering teams
Up-sell existing enterprise customers to capture growing data demand
Sell advanced services, including managed services and hosting
On-network profile facilitates growth of bandwidth and new applications with minimal
incremental investment
Aggressively pursue fiber-to-the-cell opportunities
Strong
early-stage
wireless
carrier
demand
in
footprint
Positioned for regional 4G deployment expected in 2012 and beyond
Expand footprint through organic edge-out and accretive acquisitions
Strategies for growth and revenue opportunities
Platform for Growth
~23
~185
Businesses (000)
109
~2,000
Wireless Cell Sites
Lumos Networks
Market Opportunity
Opportunities offer attractive returns as revenue density enhances capital
efficiency and on-network sales drive margin growth |
 12
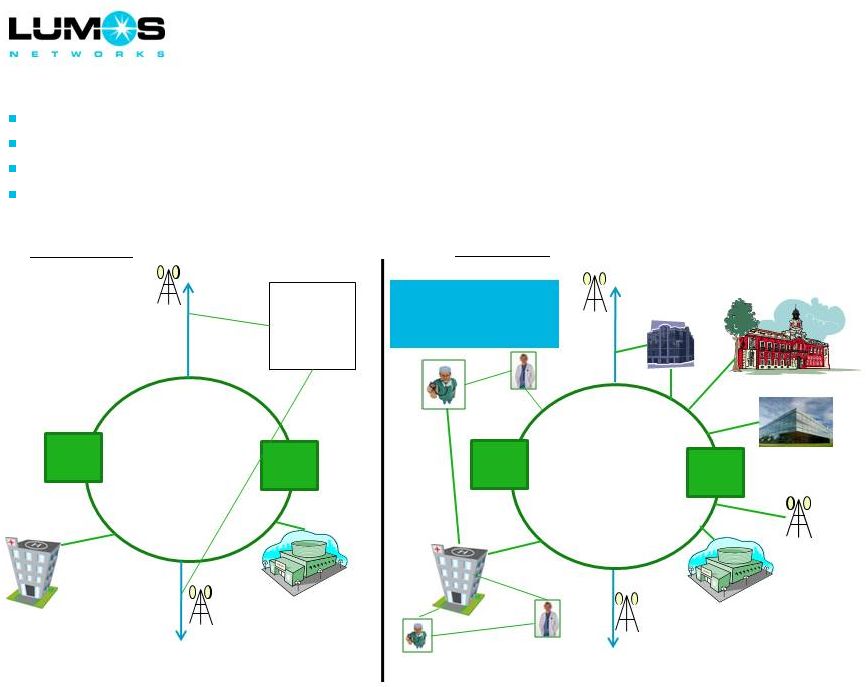
Up-sell existing enterprise customers
•
2
locations
-
Leased
facilities
and
fiber
•
Primarily Voice Service
•
Monthly Recurring Revenue (MRR) = $2K
•
37 locations -
Primarily On-net locations
•
Voice Service + Metro Ethernet Network
•
Increased MRR to $65K
•
Capital investment = $1.0M
•
Payback ~ 18 months
Enterprise Case Study B
Healthcare Customer
Yesterday
Today
Today
Enterprise Case Study A
Education Customer
Yesterday
•
Data circuits
•
Monthly Recurring Revenue (MRR) = $11K
Platform for Growth
Advanced Ethernet products meet key vertical customers’ growing broadband needs
Dense fiber network in under-served markets differentiates Lumos Networks as the provider
of choice On-network existing customer up-sell drives incrementally higher
margins •
Data circuits, Internet bandwidth, IP voice
and connection to major data center
•
Increased MRR to $29K
•
Capital investment = $100K
•
Payback ~ 7 months |
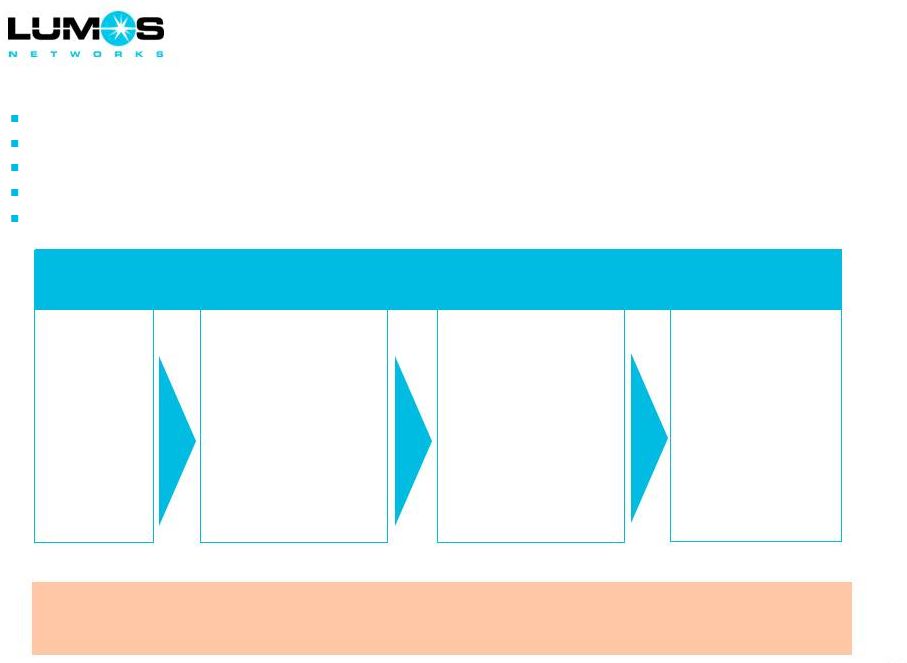
 Early-Stage
Enterprise Ready Market Mid-Stage Enterprise Ready Market
Natural market evolution provides opportunity
Early-stage markets generate sufficient revenues to meet initial capital ROI requirements
As markets mature, incremental customers, remote locations and additional rings are
added Approximately 75% of addressable in-market businesses are
early-stage Drives
free
cash
flow
growth
from
operating
leverage
and
capital
efficiency
13
Platform for Growth
Colo
A
Colo
B
Long haul
Fiber
Colo
B
Colo
A
Additional customer
Additional customer
sites + New
sites + New
customers
customers |
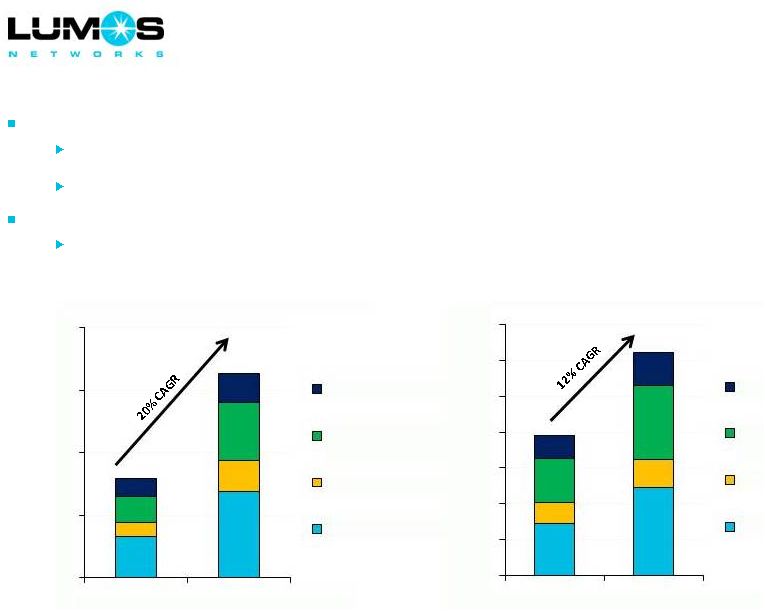 Impressive
enterprise growth trends in key verticals Up-sell existing enterprise
customers Monthly recurring revenue (MRR) in key verticals has grown 20% annually
(CAGR) from 2007 to 2011 and is 45% of large account revenue
Average MRR per customer is growing
Market evolution provides opportunity for new enterprise customers
Number
of
“Large
Customer”
accounts
in
key
verticals
has
grown
12%
annually
(CAGR)
from
2007
to
2011
14
Note: Organic
growth,
excluding
recent
acquisitions.
“Large
Customers”
are
defined
as
customers
with
$1,000
or
greater
MRR.
($mm)
Platform for Growth
0.0
0.5
1.0
1.5
2.0
2007
2011
Monthly Recurring
Revenue
Regional Banking
Local/Regional
Government
Education
Healthcare
0
50
100
150
200
250
300
350
2007
2011
Large Customer Accounts
Regional Banking
Local/Regional
Government
Education
Healthcare |
 Fiber to the
cell site: A high growth wholesale opportunity Illustrative Wireless Cell Site Economics
Average
Capital
Investment
$80K/site
One Carrier
Annual EBITDA:
$15K to $18K
Payback:
5 years
Two Carriers
Annual EBITDA:
$30K to $36K
Payback:
2 to 3 years
Contracts of 5 to 10 years and multiple carriers per site drive
long-term profitable revenue streams
15
Three to Five
Carriers
Annual EBITDA:
$45K to $90K
Payback:
1 to 2 years
Platform for Growth
Approximately 2,000 sites within three miles of existing network
First customer provides a five-year payback and funds the site
Average of more than two carriers per site
Second and successive customers drive cash flow and margin
Long-term growth in bandwidth demand and additional carriers continue to enhance
returns |
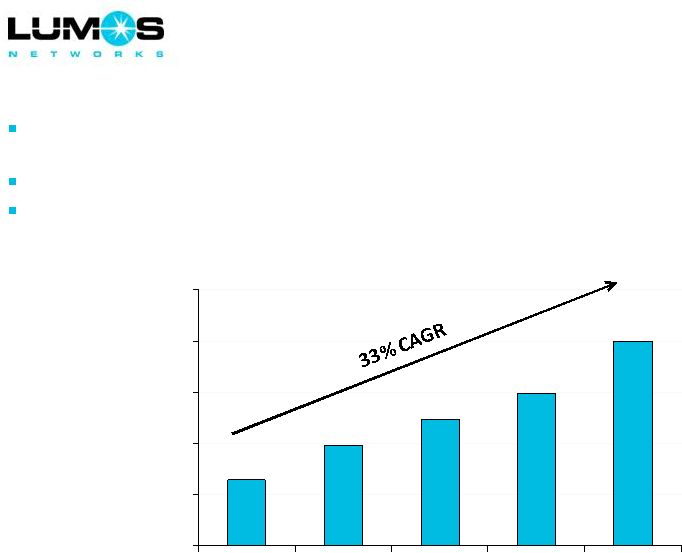 Wholesale
growth: Strong and accelerating with 4G Monthly
Recurring
Revenue
(MRR)
from
Top
6
wireless
carriers
has
grown
33%
annually
(CAGR)
from
2007 to 2011
Early-stage:
Significant
increases
in
demand
will
be
driven
by
future
4G
deployment
4G deployment in Lumos Networks region commenced in the second half of 2011 and is expected
through 2014
16
($mm)
Platform for Growth
0.0
0.5
2007
2008
2009
2010
2011
1.0
1.5
2.0
2.5
Top
6
Wireless
Carriers
–
MRR |
 Attractive
combination of growth and income |
 Pro forma
capitalization: Strong balance sheet 18
Pro forma as of
June 30, 2011
($mm)
Cash and cash equivalents
$20.5
Restricted cash
8.1
$28.5
Revolver ($60mm total)
$30.0
Term Loan A
110.0
Term Loan B
200.0
340.0
Capital leases
2.3
Total Debt
$342.3
PF Total Debt / LTM Adjusted EBITDA
3.5x
PF Net Debt / LTM Adjusted EBITDA
3.2x
Growth and Income
Available capital to support growth initiatives |
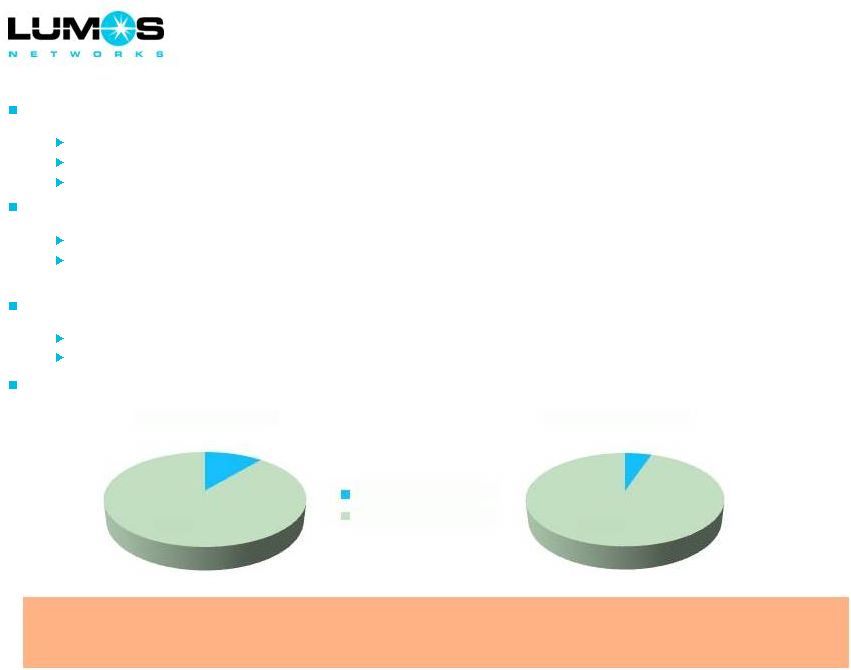
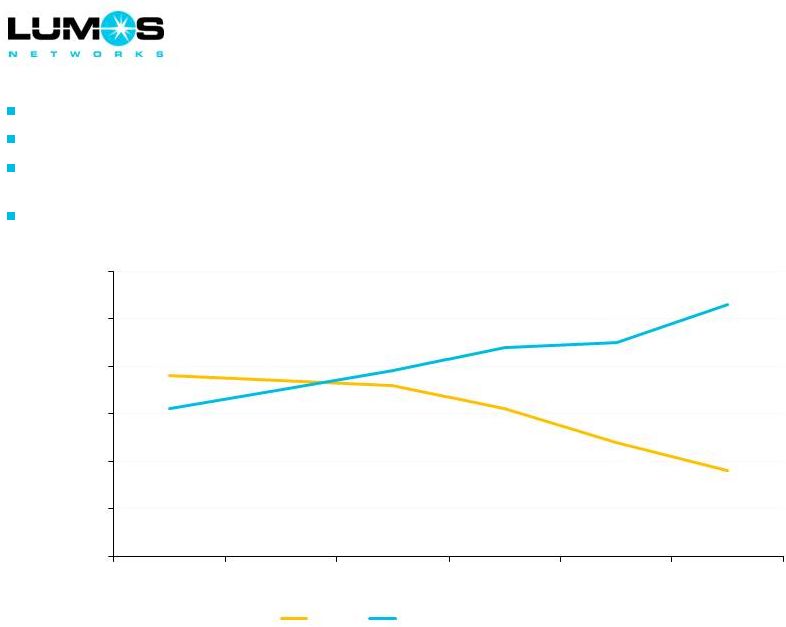 Competitive
segment revenue composition: Transition to data Competitive
segment now accounts for 74% of company revenues Strong data growth offsetting voice
declines Wholesale and enterprise data revenues are up 15% year over year; now about 45%
of segment revenues
Significance of voice revenues declining; now only about one-third of segment
revenues 19
($mm)
Note: 2010 revenue is Pro Forma for FiberNet.
Growth and Income
$15.9
$16.5
$17.3
$15.8
$15.7
$15.6
$15.1
$14.4
$13.8
$15.1
$15.5
$16.4
12
13
14
15
16
17
18
Q1-10
Q2-10
Q3-10
Q4-10
Q1-11
Q2-11
Voice
Wholesale / Enterprise Data |
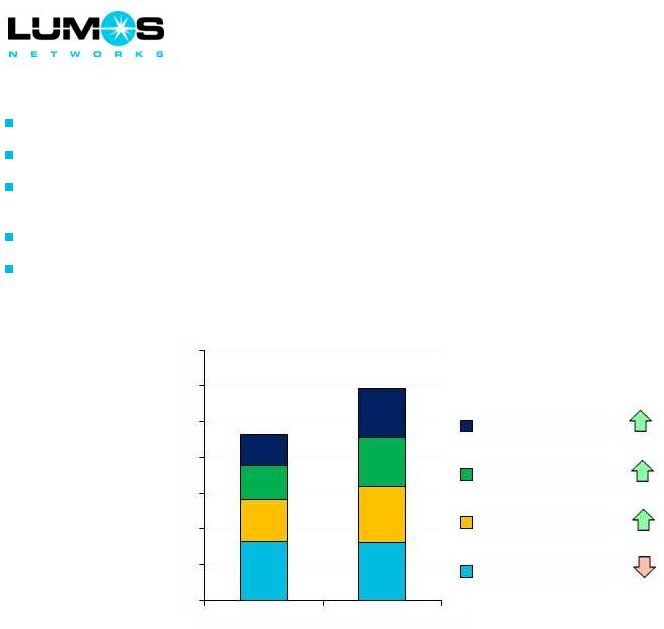 20
Addressable market significantly increased
Recent network investments made to generate increasing returns in 2012 and beyond
Metro Ethernet products have been launched into 24 new markets in 2011; 7 more planned
by year-end, totaling an increase of 79% for the year
Metro fiber ring reach in 18 markets; planned to be 29 by year-end
As markets mature, revenues grow with increased penetration and data demand
Early stages of revenue growth potential from recent acquisitions
2%
35%
45%
52%
Growth and Income
($ mm)
0.0
10.0
20.0
30.0
40.0
50.0
60.0
70.0
2007
2010
Competitive Revenues
-
Virginia
Enterprise Data
Voice
SMB Data
Wholesale |
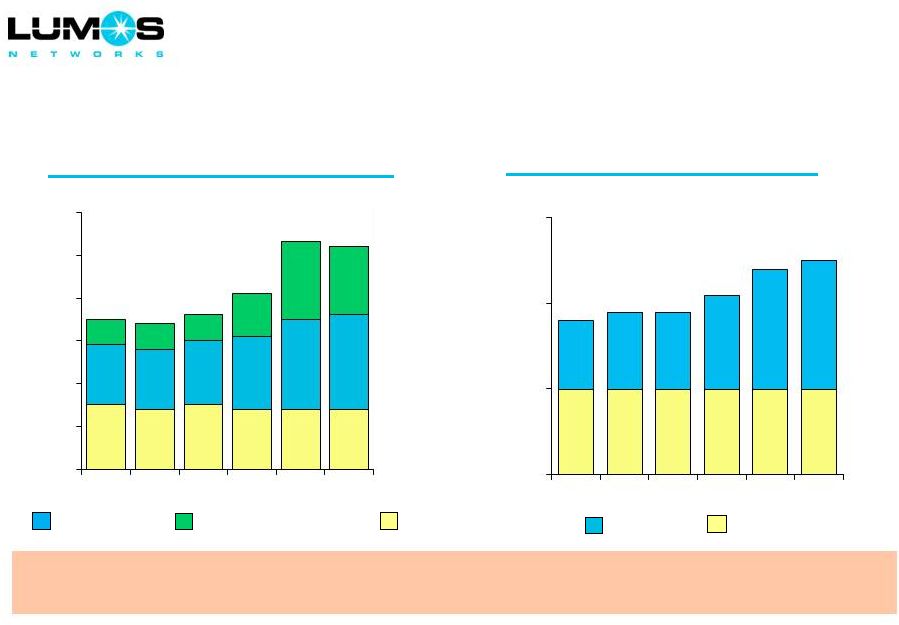 21
Adjusted EBITDA
(1)
Revenue
(1)
Operating strategy and acquisitions successfully shifting business mix
Competitive
RLEC
Competitive Data
RLEC
($ mm)
($ mm)
Growth and Income
Competitive Voice & Other
(1) Reported results; not pro forma for acquisitions
$10
$10
$10
$10
$10
$10
$8
$9
$9
$11
$14
$15
$18
$19
$19
$21
$24
$25
$0
$10
$20
$30
1Q'10
2Q'10
3Q'10
4Q'10
1Q'11
2Q'11
$15
$14
$15
$14
$14
$14
$14
$14
$15
$17
$21
$22
$6
$6
$6
$10
$18
$16
$35
$34
$36
$41
$53
$52
$0
$10
$20
$30
$40
$50
$60
1Q'10
2Q'10
3Q'10
4Q'10
1Q'11
2Q'11
Data focus drives growth in the Competitive segment
RLEC provides high-margin and attractive cash flows |
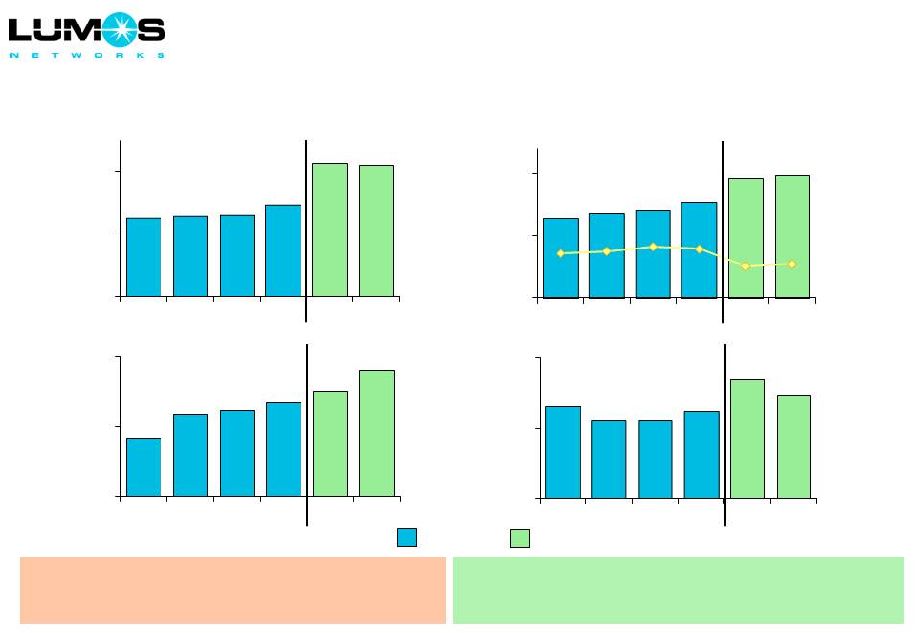 22
Strong margins and recurring free cash flow
($ in millions)
(1)
Pro forma 2010 includes FiberNet results from January 1, 2010. LTM pro forma for the
twelve months ended June 30, 2011, reflects results of FiberNet from July 1, 2010.
(2)
2009 and FiberNet on December 1, 2010.
(3)
LTM includes approximately $5 million of one-time capital expenditures related to the
integration of FiberNet. Free Cash Flow
(2)
Total Revenue
Adj. EBITDA/Margin %
Capital Expenditures
Historical
Pro forma for FiberNet
Pro forma
(1)
Pro forma
(1)
Pro forma
(1)(3)
Pro forma
(1)(3)
Growth and Income
$126
$129
$131
$146
$213
$211
$0
$100
$200
2007
2008
2009
2010
2010
LTM
$64
$68
$70
$77
$96
$98
51%
52%
54%
53%
45%
46%
$0
$50
$100
2007
2008
2009
2010
2010
LTM
$25
$35
$37
$40
$45
$54
$0
$30
$60
2007
2008
2009
2010
2010
LTM
$39
$33
$33
$37
$51
$44
$0
$30
$60
2007
2008
2009
2010
2010
LTM
LTM reflects post acquisition network capital investments to
support market expansion and service offerings
Recurring cash flow stream to support dividend:
Unique among Competitive providers
Expected annualized dividend of $12 million ($0.56 per share)
Throughout this presentation, Free Cash Flow is defined as consolidated adjusted EBITDA less
CAPEX, exclusive of assets acquired from Allegheny Energy, Inc. on December 31, |
 23
Investment themes
Unique assets provide operating leverage and competitive advantage,
positioning Lumos Networks as region’s provider of choice
Established platform for growth
Attractive combination of growth and income |
 Appendix
confidential and proprietary |
 25
Adjusted EBITDA Reconciliation
($ in millions)
3/31/10
6/30/10
9/30/10
12/31/10
3/31/11
6/30/11
Operating Income
$10
$10
$11
$10
$12
$14
Depreciation and Amortization
7
9
7
9
11
11
Equity Based Compensation
1
-
1
-
1
Voluntary Early Retirement and Workforce Reduction Plans
-
-
-
2
-
-
Adjusted EBITDA
$18
$19
$19
$21
$24
$25
Three Months Ended
-
2006
2007
2008
2009
2010
Operating Income
$36
$36
$39
$41
$41
Depreciation and Amortization
26
27
27
29
31
Equity Based Compensation
2
1
1
-
2
Voluntary Early Retirement and Workforce Reduction Plans
-
-
1
-
3
Adjusted EBITDA
$64
$64
$68
$70
$77
Year Ended |
 Growing
Profitably Investor Presentation
September, 2011 |
 Use of
Non-GAAP Financial Measures Special Note Regarding Forward-Looking
Statements 2
Any statements contained in this presentation that are not statements of historical fact,
including statements about our beliefs and expectations, are forward-looking statements and should be
evaluated as such. The words “anticipates,” “believes,”
“expects,” “intends,” “plans,” “estimates,” “targets,” “projects,” “should,” “may,” “will” and similar words and expressions are intended to
identify forward-looking statements. Such forward-looking statements reflect, among
other things, our current expectations, plans and strategies, and anticipated financial results, all of which are
subject to known and unknown risks, uncertainties and factors that may cause our actual
results to differ materially from those expressed or implied by these forward-looking statements. Many of
these risks are beyond our ability to control or predict. Because of these risks,
uncertainties and assumptions, you should not place undue reliance on these forward-looking statements. Furthermore,
forward-looking statements speak only as of the date they are made. We do not undertake
any obligation to update or review any forward-looking information, whether as a result of new
information, future events or otherwise. Important factors with respect to any such
forward-looking statements, including certain risks and uncertainties that could cause actual results to differ from
those contained in the forward-looking statements, include, but are not limited to: rapid
development and intense competition in the telecommunications industry; adverse economic conditions;
operating and financial restrictions imposed by our senior credit facility; our cash and
capital requirements; declining prices for our services; the potential to experience a high rate of customer
turnover; our dependence on our affiliation with Sprint Nextel (“Sprint”); a
potential increase in our roaming rates and wireless handset subsidy costs; the potential for Sprint to build networks in our
markets; federal and state regulatory fees, requirements and developments; loss of our cell
sites; the rates of penetration in the wireless telecommunications industry; our reliance on certain
suppliers and vendors; failure to complete the business separation of the wireless and
wireline operations in an orderly fashion as currently structured and other unforeseen difficulties that may occur.
These risks and uncertainties are not intended to represent a complete list of all risks and
uncertainties inherent in our business, and should be read in conjunction with the more detailed cautionary
statements and risk factors included in our SEC filings, including our Annual Reports filed on
Forms 10-K. Included in this presentation are certain non-GAAP financial
measures that are not determined in accordance with US generally accepted accounting principles. These financial performance measures
are not indicative of cash provided or used by operating activities and exclude the effects of
certain operating, capital and financing costs and may differ from comparable information provided by
other companies, and they should not be considered in isolation, as an alternative to, or more
meaningful than measures of financial performance determined in accordance with US generally
accepted accounting principles. These financial performance measures are commonly used
in the industry and are presented because NTELOS believes they provide relevant and useful information
to investors. NTELOS utilizes these financial performance measures to assess its ability
to meet future capital expenditure and working capital requirements, to incur indebtedness if necessary, and to
fund continued growth. NTELOS also uses these financial performance measures to evaluate
the performance of its business, for budget planning purposes and as factors in its
employee compensation programs. Presentation of Financial and
Other Important Information |
 Company
Executives 3
Jim Hyde, CEO, President and Director
Former T-Mobile USA / Western Wireless / VoiceStream Sr. Exec
Former CEO, T-Mobile UK
17 years industry experience
Steb Chandor, EVP, CFO and Treasurer
Former CFO, iPCS Wireless
Former CFO, Metro One
16 years industry experience
Conrad Hunter, EVP, COO
Former COO, iPCS Wireless
Former VP of Midwest Operations, U.S. Cellular Corporation
32 years industry experience |
 Leading
“pure-play” regional wireless company
Platform for organic and strategic growth
Unique growth and income investment opportunity
Wholesale revenue at an all time high and growing
NTELOS intends to pay $0.42/share initial dividend post separation
Strong Free Cash Flow characteristics
27%
FCF margin
Attractive strategic asset set
Exclusive network provider to Sprint in region
Unique network footprint in Mid-Atlantic region
Experienced senior management team
4
(1) Adjusted for proposed one for two reverse stock split
(2) Results as of YE 2010
(3) Throughout presentation, Free Cash Flow is defined as Adjusted EBITDA less Capital
Expenditures (2)
(1)
(3)
Investment Rationale |
 Growing.
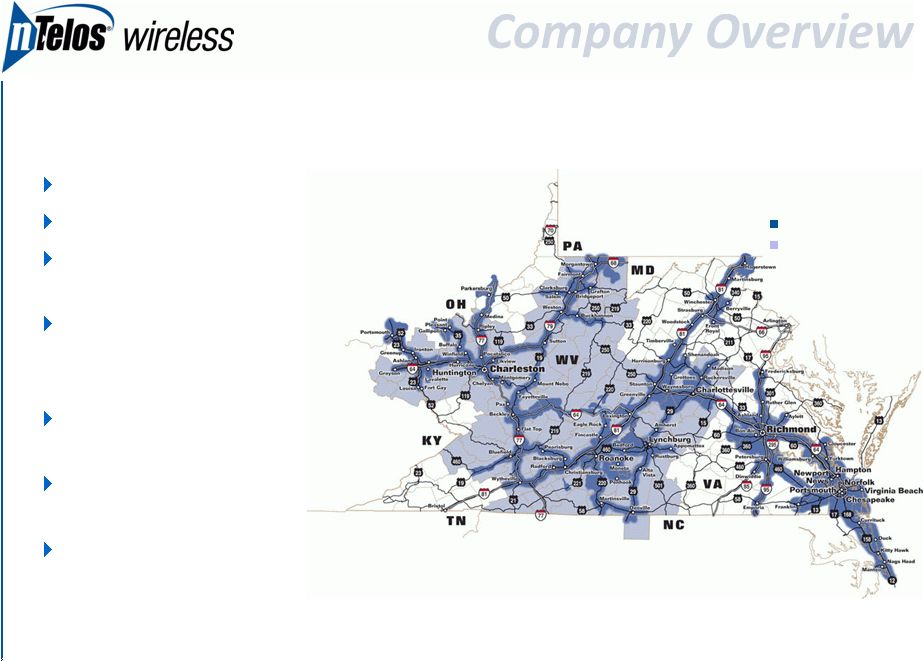
Profitable. Stable. Strategic. 8.0M licensed POPs
5.9M covered POPs
425K retail (post and
prepaid) subscribers
Exclusive network provider
to Sprint over more than
50% of NTELOS footprint
Wholesale revenues of $120
million LTM and growing
$144M EBITDA and $104M
FCF LTM
36% Adjusted EBITDA
margin
5
Note: Results as of 6/30/11
NTELOS Covered Network
Sprint Wholesale Markets
Strategic Network Assets |
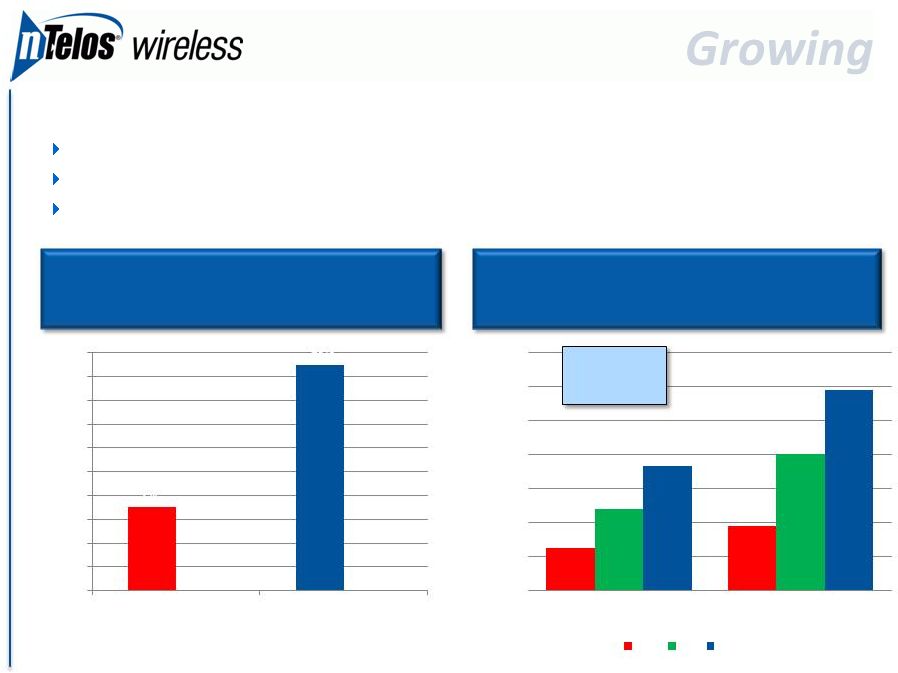
 Growing
Sprint wholesale revenue up 32% YOY
Data ARPU up 34% YOY
Profitable
5 years of minimum 35% EBITDA margin
21% 5 year FCF margin
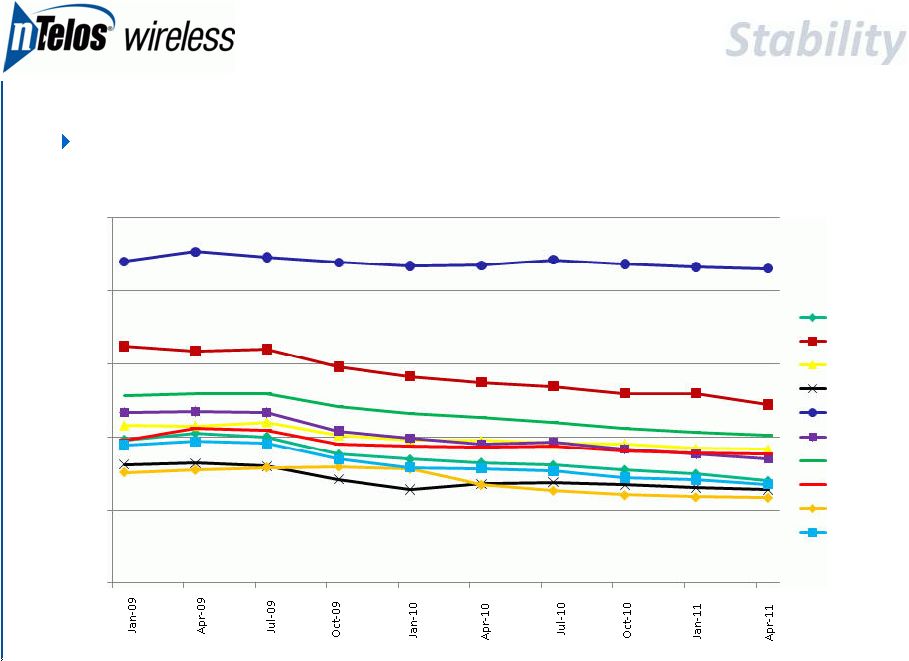
Stable
Diverse revenue stream from postpaid, prepaid and wholesale customers
Market share stabilizing while other regional competitors shed customers
Strategic
Exclusive relationship with Sprint through July 2015
Unique network footprint in Mid-Atlantic region
6
Growing. Profitable. Stable. Strategic.
Note: Results as of 6/30/11 |
 7
NTELOS Wireless Strategy
Mission
We
Inspire
Loyalty
Highest in revenue
and subscriber
market share growth
of all carriers in our
markets
through 2016
Value
Unlimited nationwide
plans always less
expensive than AT&T and
Verizon
Verizon
Wireless
Simplicity
Cutting through the
complexity with simple,
customer friendly
products and plans
Service
Creating “raving fans”,
leveraging local retail and
customer service
presence
Strategic
Strategic
Differentiators
Differentiators
Vision
Vision |
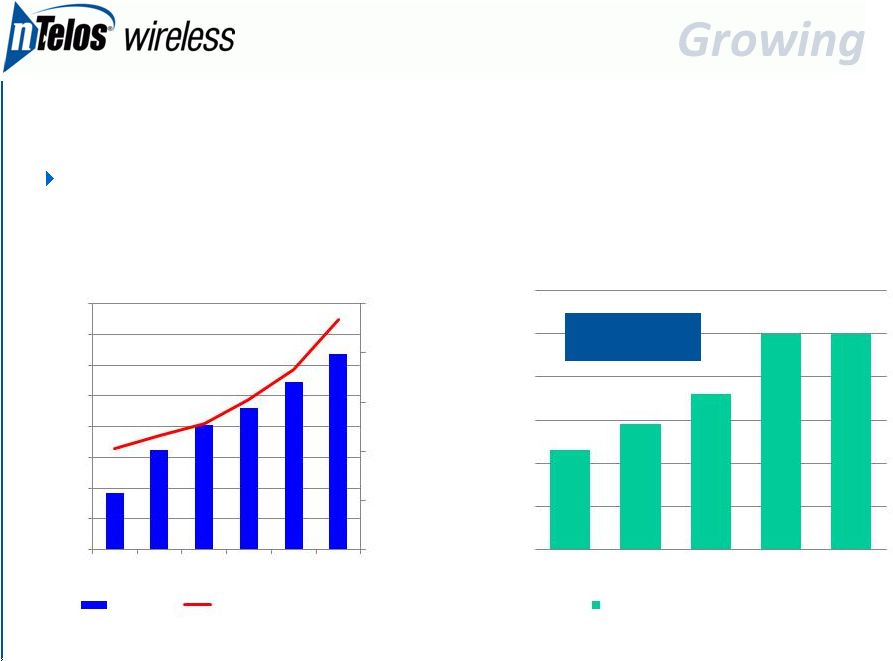
 Platform for
Organic Growth – Distribution Strategy
YOY Postpaid Sales up 19% at
Remodeled Retail Locations
Indirect Sales Up 62% YOY
(1)
35% of retail locations are remodeled
(2)
Results compare Q210 vs. Q211
Redefined distribution strategy in 2010
System wide redesign = higher sell-through rates on postpaid
Indirect channel expansion = increased sales productivity
Gross adds per
indirect door
up 21% YOY
(2)
2,497
3,805
4,823
8,024
7,320
11,829
-
2,000
4,000
6,000
8,000
10,000
12,000
14,000
Q210
Q211
Post
Pre
Total
7%
19%
0%
2%
4%
6%
8%
10%
12%
14%
16%
18%
20%
Existing
Remodeled
(1)
8 |
 9
Increased smartphone penetration drives ARPU and lowers churn
Platform for Organic Growth –
Smartphone Explosion
Smartphone ARPU on
average $18 greater than
non-smartphone
$11.84
$13.23
$14.06
$14.61
$15.45
$16.36
10.3%
11.6%
12.8%
15.3%
18.3%
23.4%
0.0%
5.0%
10.0%
15.0%
20.0%
25.0%
$10
$11
$12
$13
$14
$15
$16
$17
$18
1Q10
2Q10
3Q10
4Q10
1Q11
2Q11
Postpaid Data ARPU and Device Penetration of
Postpaid Base
Data ARPU
Smartphone Penetration of Base
23%
29%
36%
50%
50%
0%
10%
20%
30%
40%
50%
60%
NTELOS
T-Mobile
Verizon
Sprint
AT&T
Smartphones as a % of Postpaid Base
Smartphone as a % of Postpaid Base |
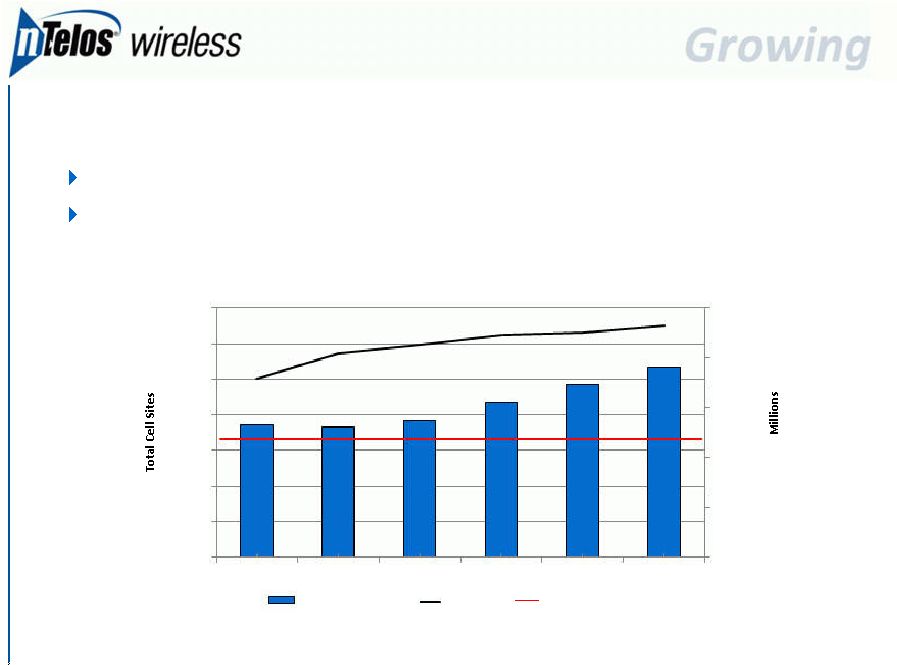 10
Platform for Organic Growth –
Wholesale Revenues
Network investments driving wholesale revenue growth
Sprint wholesale revenue up 32% YOY
*
Reflects Sprint Minimum
1,350
1,200
1,300
1,150
1,250
1,050
1,100
1,000
1Q10
3Q10
4Q10
2Q10
1Q11
2Q11
Cell Site Expansion
$40
$30
$35
$25
$20
$15
1,326
Cell Sites
Whole Sale Revenue
$28
$28
$31
$29
$32
$34
1,299
1,287
1,251
1,315
1,313
* Excluding support from the contracted minimums in the prior year, revenues from Sprint
wholesale were up 32% in second quarter 2011, from $24.5 million of calculated revenue underlying the
minimums for second quarter 2010. |
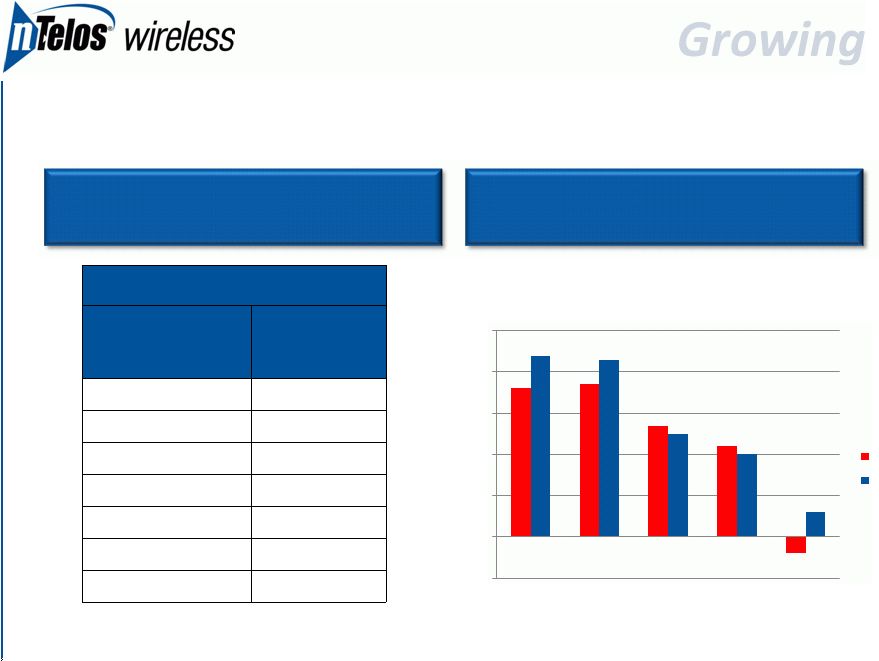 11
Unaided Brand Awareness
Cell Phone
Provider
Q2 vs. Q1
% Change
T-Mobile
42%
NTELOS
38%
Sprint
11%
Verizon
6%
AT&T
(4%)
U.S. Cellular
(15%)
Alltel
(29%)
Leading Indicators Support Strategy and Execution
* Based on Internal Brand Awareness and Image Tracking Survey (Charleston, Roanoke,
Richmond, Hampton Roads) 40%
30%
-10%
50%
0%
10%
20%
22%
20%
6%
27%
25%
44%
37%
43%
36%
2Q11
1Q11
-4%
NTELOS
U.S. Cellular
Verizon
AT&T
Sprint
Net Promoter
Scores
Brand Awareness up 38% QOQ
Leading NPS scores in largest
markets |
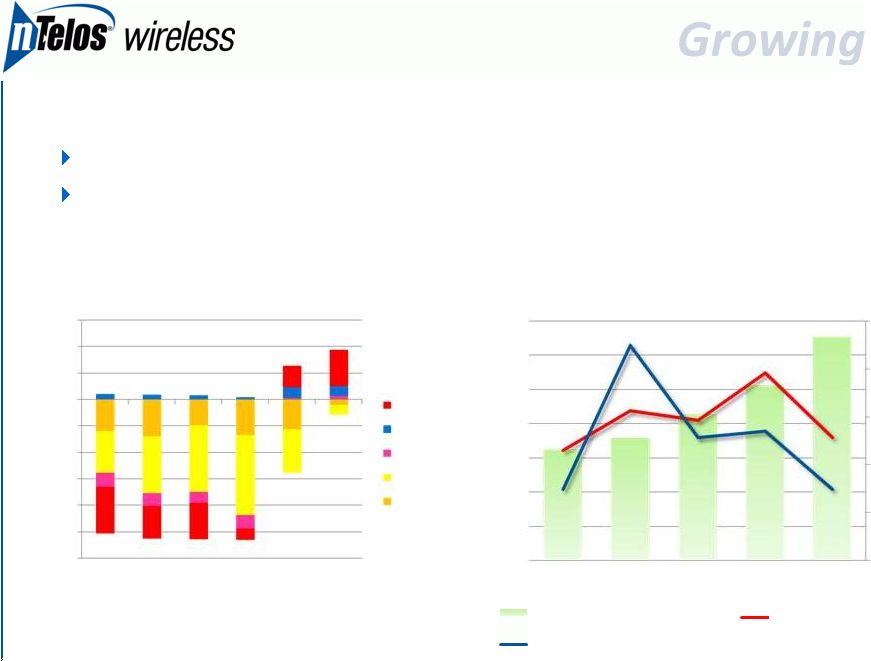 Leading
Indicators Support Strategy and Execution Subscriber ports now net positive for first
time since July 2007 Smartphone customers have better churn characteristics
Wireless Number Porting
Postpay Voluntary Churn (%)
1,500
1,000
500
0
(500)
(1,000)
(1,500)
(2,000)
(2,500)
(3,000)
12
Q210
Q310
Q410
Q111
Q211
Q311
Verizon
USCC
T-Mobile
Sprint
AT&T
1.50
1.40
1.30
1.20
1.10
1.00
0.90
0.80
Q210
Q310
Q410
Q111
Q211
25%
20%
15%
10%
5%
0%
Smartphones as a % of Base
Smartphone Postpay Voluntary
Total Postpay Voluntary |
 13
Leading Indicators Support Strategy and Execution
Market Share erosion stabilizing
Subscriber Market Share
25.0%
20.0%
15.0%
10.0%
5.0%
0.0%
Market A
Market B
Market C
Market D
Market F
Market G
Market H
Market I
Market J
Market K |
 14
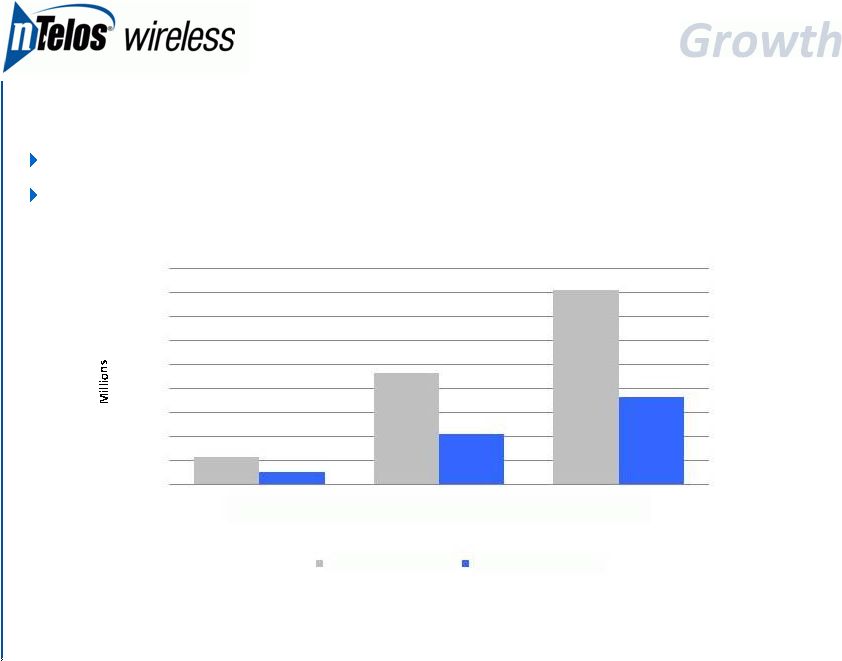
Moderate increases in penetration provide substantial retail revenue and EBITDA growth
1% increase in market share = 58k incremental subs
“Size of the Prize”
* Assumes current subscriber base mix at higher penetration and applies operating financial
metrics to illustrate subscriber base * Assumes 45% incremental EBITDA
margin * Current NTELOS combined share in all markets is 7.3%
$24
$93
$163
$11
$42
$73
-
$20
$40
$80
$100
$120
$140
$160
$180
8.0%
10.0%
12.0%
Penetration of Covered POPs
Revenue and EBITDA Impact of Increased Penetration
Annual Revenue Impact
Annual EBITDA Impact
$
$60 |
 15
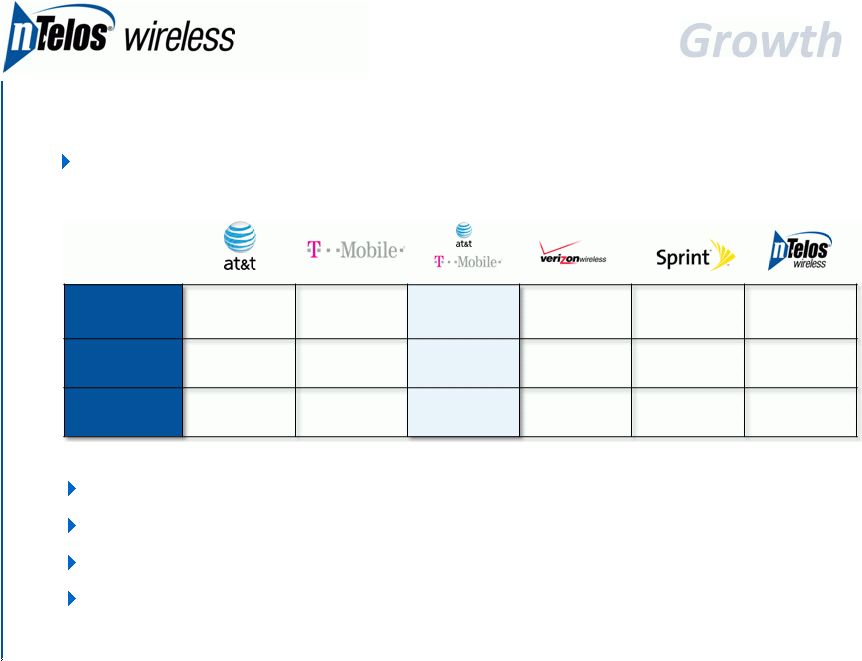
Growth opportunities exist if Big 4 become Big 3
Platform for Strategic Growth
90MHz
60MHz
150MHz
112MHz
44MHz
20MHz
Subs
Subs
1.3M
.5M
1.8M
2.1M
1.1M
.1M
Share
Share
24%
9%
33%
38%
20%
6%
Will evaluate AT&T/T-Mobile divestiture scenarios
Opportunistic in M&A activities
Attractive balance sheet / capital structure
Access to incremental capital
Spectrum
Spectrum
(Hampton, VA)
(Hampton, VA) |
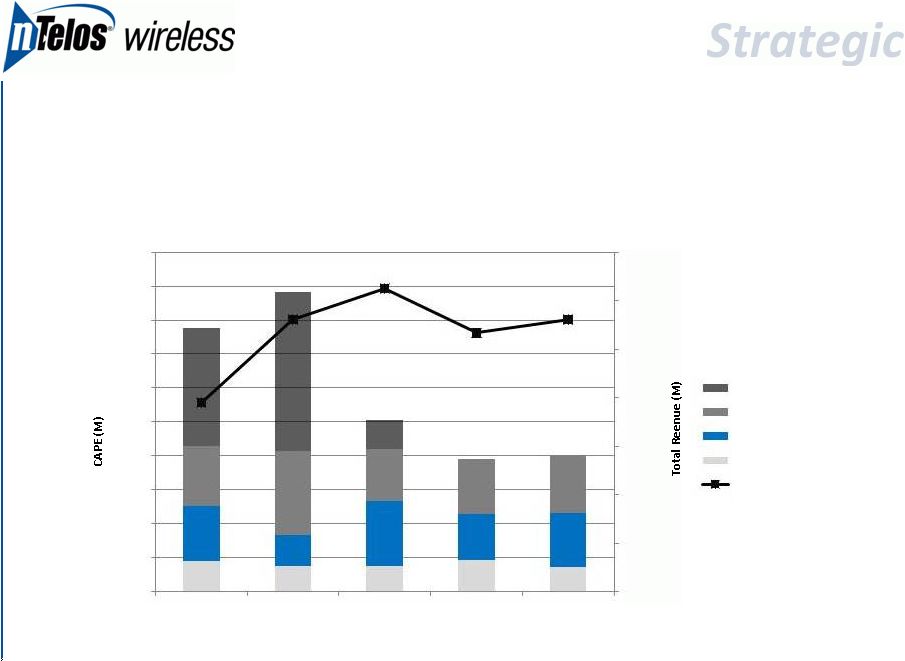 16
Investment in EVDO driving strong retail and wholesale data
revenue growth
9
8
8
9
7
16
9
19
14
16
18
25
15
16
17
378
412
425
407
412
$300
$320
$340
$360
$380
$400
$420
$440
$40
$50
$60
$70
$80
$90
$100
2007
2008
2009
2010
LTM
CAPEX Summary vs. Total Revenue 2007-2010
EVDO
Growth
Capacity
Maintenance
Total Revenue
78
88
51
39
40
35
47
9
$0
$10
$20
$30 |
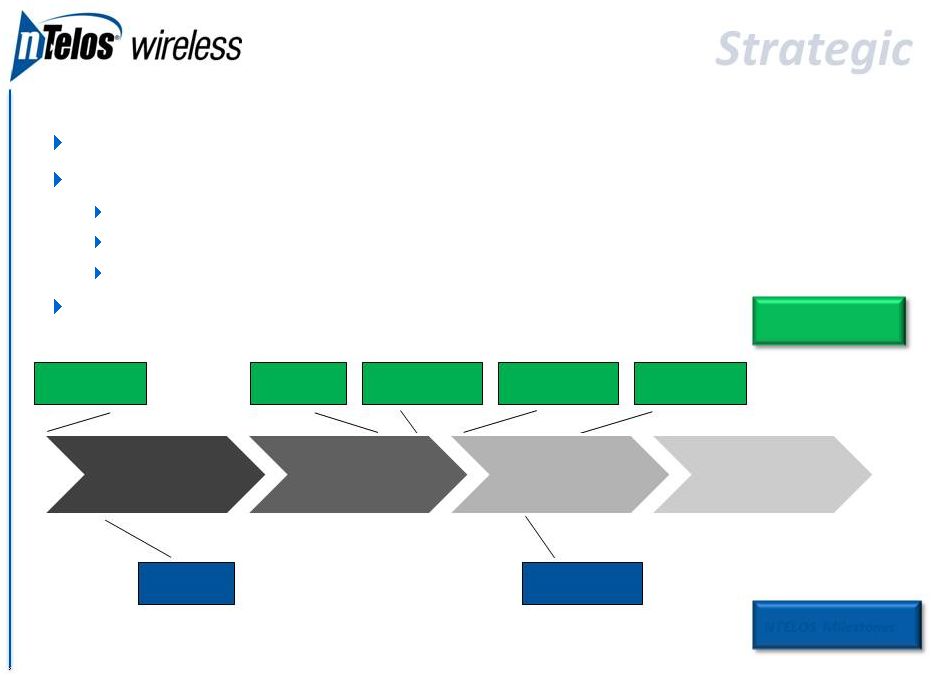 Fast follower
with LTE Well positioned with Sprint for technology upgrade
LightSquared
Clearwire
Stand alone
LTE field trials completed
Industry Milestones
NTELOS Milestones
VZ launch in 30
cities
First LTE Device
Introduced
4G Roadmap
17
EVDO Build
Completion
Metro PCS
initial Launch
AT&T launch in 10
cities
Sprint WiMAX in
Baltimore
LTE Field Trials
Completed
2011
2012
2010
2009 |
 Financial
Summary |
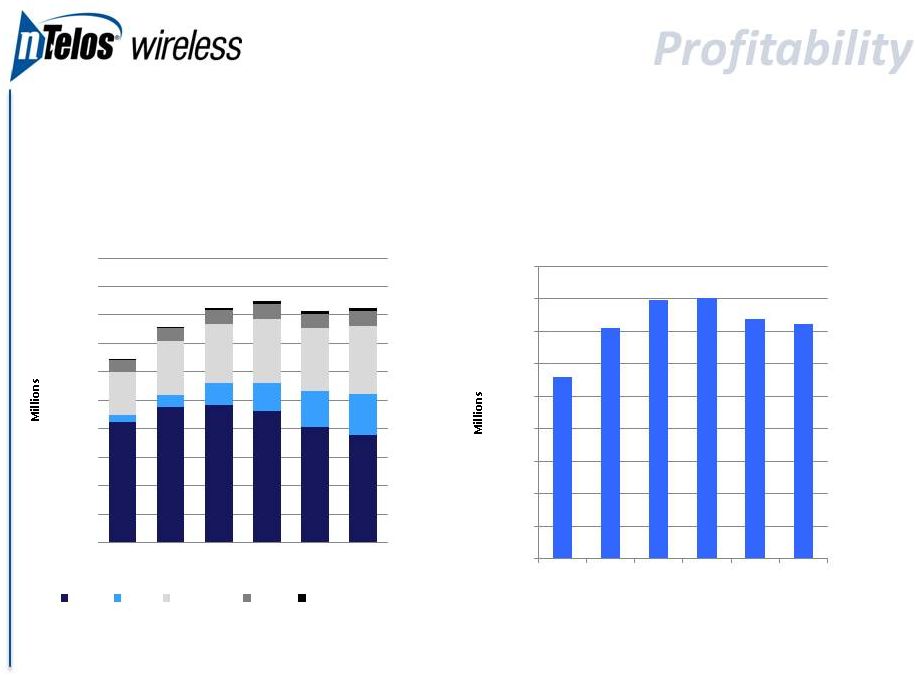 19
Solid Revenue and EBITDA Growth
212
238
242
232
203
189
11
22
38
49
63
72
77
95
104
113
110
120
21
22
25
26
25
25
1
1
4
5
5
6
$-
$50
$100
$150
$200
$250
$300
$350
$400
$450
$500
2006
2007
2008
2009
2010
LTM
Revenue
Voice
Data
Wholesale
Other
Roaming
323
378
412
425
407
412
112
142
159
160
147
144
$-
$20
$40
$60
$80
$100
$120
$140
$160
$180
2006
2007
2008
2009
2010
LTM
EBITDA |
 Financial
Overview – Capitalization
Pro Forma as of
June 30, 2011
Cash & Cash Equivalents
$44.3
Restricted Investments
1.1
Total Cash
$45.4
Revolver ($35mm total)
$ -
Term Loan B
460.2
Total Funded Debt
460.2
Capital Leases
1.0
Total Debt
$461.2
PF Total Debt/LTM Adjusted EBITDA
3.3x
PF Net Debt/LTM Adjusted EBITDA
3.0x
20
(1)
(1) Reflects impact of cash dividend upon spin-off of Lumos Networks and restructured debt
repayment Available Capital to Support Growth Initiatives |
 Financial
Overview 21
(1)
Reflects impact of cash dividend upon spin-off of Lumos Networks and restructured debt
repayment (2)
Expected annualized dividend of $1.68 per share to be paid by wireless
(3)
Wireless Revenue and Expenses before Intercompany eliminations
(1)
(1)
(3)
(mm, except Operating Data)
Consolidated
Wireless Only
2Q11
LTM
2Q11
LTM
Revenue ($)
154.5
585.9
104.4
412.1
Adjusted EBITDA ($)
60.1
230.6
35.9
144.2
Margin %
38.9%
39.4%
34.4%
35.0%
CAPEX ($)
34.5
103.7
13.3
40.3
% of Revenue
22.3%
17.7%
12.7%
9.8%
Op FCF ($)
25.7
126.9
22.7
103.9
Margin %
16.6%
21.7%
21.7%
25.2%
Total Debt ($)
746.5
746.5
461.2
461.2
Total Dividend Payout ($)
11.8
47.0
8.8
35.3
(2)
(1)
(1)
(3)
(2) |
 Leading
“pure-play” regional wireless company
Platform for organic and strategic growth
Unique growth and income investment opportunity
Wholesale revenue at an all time high and growing
NTELOS intends to pay $0.42/share initial dividend post separation
Strong Free Cash Flow characteristics
27%
FCF margin
Attractive strategic asset set
Exclusive network provider to Sprint in region
Unique network footprint in Mid-Atlantic region
Experienced senior management team
22
(1) Adjusted for proposed one for two reverse stock split
(2) Results as of YE 2010
(3) Throughout presentation, Free Cash Flow is defined as Adjusted EBITDA less Capital
Expenditures (2)
(1)
(3)
Investment Rationale |
 Growing
Profitably Investor Presentation
September, 2011 |