Attached files
| file | filename |
|---|---|
| 8-K - FORM 8-K - CAPSTEAD MORTGAGE CORP | d235265d8k.htm |
 CAPSTEAD
Information as of June 30, 2011
Investor Presentation
Exhibit 99.1 |
 Safe
Harbor Statement - Private Securities Litigation Reform Act of 1995
Cautionary Statement Concerning Forward-looking Statements
This
document
contains
“forward-looking
statements”
within
the
meaning
of
the
Private
Securities
Litigation
Reform
Act
of
1995.
Forward-looking
statements
include,
without
limitation,
any
statement
that
may
predict,
forecast,
indicate
or
imply
future
results,
performance
or
achievements,
and
may
contain
the
words
“believe,”
“anticipate,”
“expect,”
“estimate,”
“intend,”
“project,”
“will
be,”
“will
likely
continue,”
“will
likely
result,”
or
words
or
phrases
of
similar
meaning.
Forward-looking
statements
are
based
largely
on
the
expectations
of
management
and
are
subject
to
a
number
of
risks
and
uncertainties
including,
but
not
limited
to,
the
following:
In
addition
to
the
above
considerations,
actual
results
and
liquidity
are
affected
by
other
risks
and
uncertainties
which
could
cause
actual
results
to
be
significantly
different
from
those
expressed
or
implied
by
any
forward-looking
statements
included
herein.
It
is
not
possible
to
identify
all
of
the
risks,
uncertainties
and
other
factors
that
may
affect
future
results.
In
light
of
these
risks
and
uncertainties,
the
forward-looking
events
and
circumstances
discussed
herein
may
not
occur
and
actual
results
could
differ
materially
from
those
anticipated
or
implied
in
the
forward-looking
statements.
Forward-looking
statements
speak
only
as
of
the
date
the
statement
is
made
and
the
Company
undertakes
no
obligation
to
update
or
revise
any
forward-looking
statements,
whether
as
a
result
of
new
information,
future
events
or
otherwise.
Accordingly,
readers
of
this
document
are
cautioned
not
to
place
undue
reliance
on
any
forward-looking
statements
included
herein.
–
changes in general economic conditions;
–
fluctuations in interest rates and levels of mortgage
prepayments;
–
the effectiveness of risk management strategies;
–
the impact of differing levels of leverage employed;
–
liquidity of secondary markets and credit markets;
–
the availability of financing at reasonable levels and terms to
support investing on a leveraged basis;
–
the
availability
of
new
investment
capital;
–
the availability of suitable qualifying investments from both
an investment return and regulatory perspective;
–
changes in legislation or regulation affecting Fannie Mae
and Freddie Mac (the “GSEs”) and similar federal
government agencies and related guarantees;
–
deterioration in credit quality and ratings of existing or future
issuances of GSE or Ginnie Mae Securities; and
–
increases in costs and other general competitive factors.
2 |
 Company Summary
Proven Strategy
Experienced
Management Team
Aligned with
Stockholders
Overview of Capstead Mortgage Corporation
•
Founded in 1985, Capstead is the oldest publicly-traded Agency mortgage
REIT. •
At June 30, 2011, we had a total investment portfolio of $11.42 billion, supported
by long-term investment capital of $1.30 billion levered 8.05
times.* •
Our three-year compound annual total return of 24.6% exceeds that of most of
our peers.** •
We invest exclusively in residential adjustable-rate mortgage (ARM) securities
issued and guaranteed
by
Fannie
Mae,
Freddie
Mac
or
Ginnie
Mae.
Agency-guaranteed
mortgage
securities
are considered to have little, if any, credit risk.
•
Our focus on short-duration ARM securities augmented with interest rate swap
agreements differentiates
us
from
our
peers
because
ARM
securities
reset
to
more
current
interest
rates
within
a
relatively
short
period
of
time.
This
allows
for
the
recovery
of
financing
spreads
diminished
during
periods
of
rising
interest
rates
and
smaller
fluctuations
in
portfolio
values
from
changes
in
interest
rates
compared
to
fixed-rate
mortgage
securities.
With
this
strategy,
Capstead
is
recognized as the most defensively-positioned Agency mortgage REIT.
•
Our prudently leveraged portfolio provides financial flexibility
to manage changing market
conditions.
•
Our executive officers have over 80 years of combined mortgage finance industry
experience, including 75 years at Capstead.
•
We are self-managed with low operating costs and rely heavily on
performance-based compensation.
This
structure
greatly
enhances
the
alignment
of
management
interests
with those of our stockholders.
3
* Long-term
investment
capital
includes
stockholders’
equity
and
unsecured
borrowings,
net
of
investments
in
related
unconsolidated
affiliates.
** Compound annual growth rate is based on cumulative total returns assuming
an investment in Capstead was made June 30, 2008 and dividends were reinvested. |
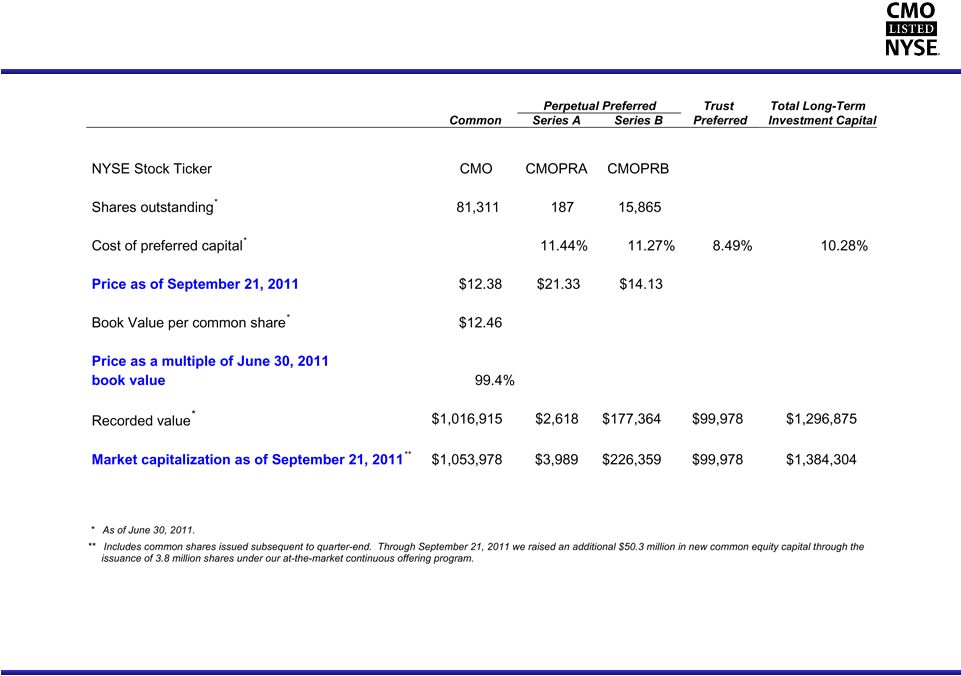 Market
Snapshot (dollars in thousands, except per share amounts)
4 |
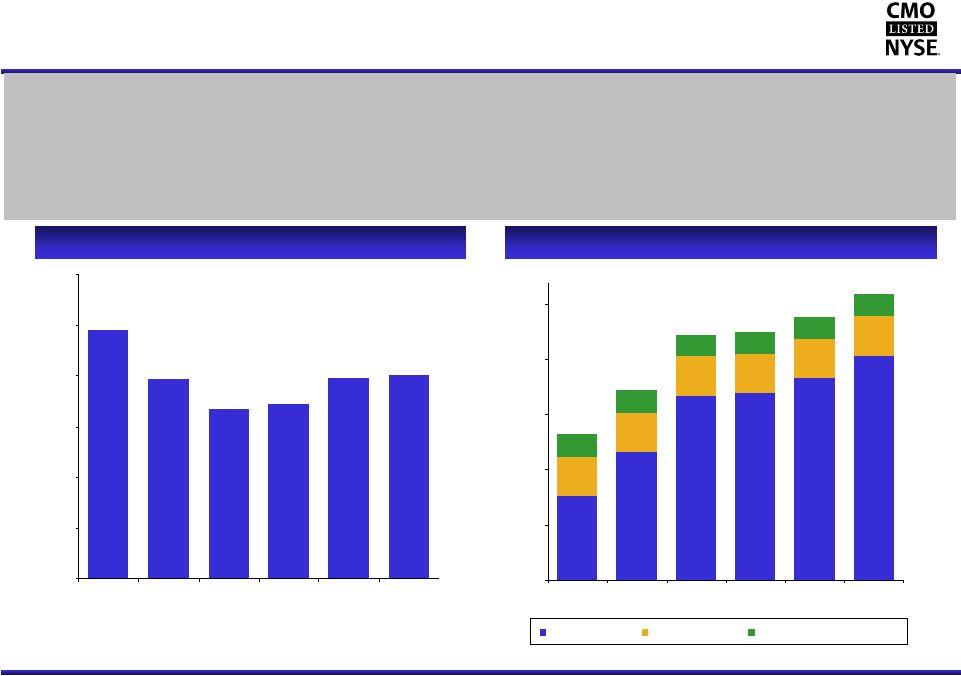 Capstead’s Prudent Use of Leverage
5
**
Borrowings under repurchase arrangements divided by long-term investment
capital. During the second quarter of 2011 we maintained our portfolio
leverage at approximately eight to one. In our view, borrowing at
current levels represents an appropriate and prudent use of leverage for an agency-
guaranteed ARM securities portfolio in today’s market conditions.
Through September 21, 2011 we raised $193 million in new common equity
capital this year using our at-the- market
continuous
offering
program.
In
June
we
also
began
issuing
a
limited
amount
of
Series
B
preferred
shares
under
this
program,
raising
an
additional
$3
million
in
perpetual
preferred
equity
capital
during
this
period.
($ in millions)
Portfolio Leverage*
Long-Term Investment Capital
$661
$860
$1,114
$1,127
$1,194
$1,297
58%
67%
75%
75%
77%
78%
27%
21%
16%
16%
15%
14%
8%
9%
9%
12%
15%
8%
$
$250
$500
$750
$1,000
$1,250
12/31/07
12/31/08
12/31/09
12/31/10
3/31/11
6/30/11
Common Stock
Preferred Stock
Trust Prefered Securities, net
9.84x
7.85x
6.67x
6.91x
7.91x
8.05x
0.0x
2.0x
4.0x
6.0x
8.0x
10.0x
12.0x
12/31/07
12/31/08
12/31/09
12/31/10
3/31/11
6/30/11
$100
$180
$1,017
Common Stock
Preferred Stock
Trust Preferred Securities, net |
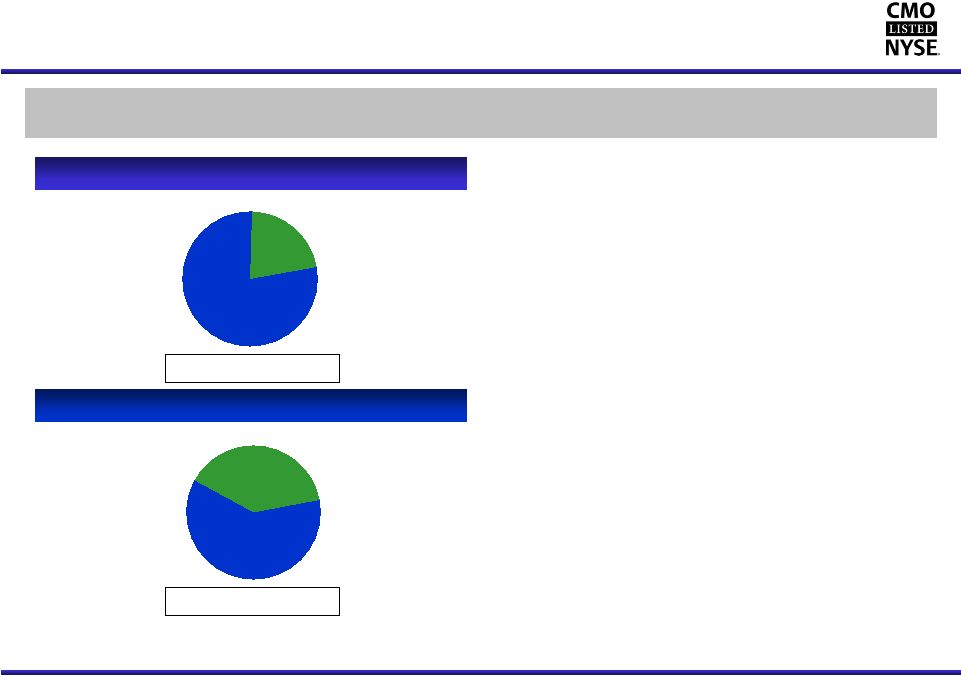 39%
61%
22%
78%
Capstead’s Proven Short-Duration Investment Strategy
6
As of June 30, 2011
As of June 30, 2011
Low
risk
agency-guaranteed
residential
ARM
securities
financed
primarily
with
30-90
day
“repo”
borrowings,
augmented with two-year interest rate swap agreements for hedging
purposes. Residential ARM Securities Portfolio
Repurchase Arrangements & Similar Borrowings
Total: $10.44 billion
* Based on fair market value as of the indicated balance sheet
date. Total: $11.42
billion*
•
Most of our securities are backed by well-seasoned
mortgage loans with coupon interest rates that reset at
least annually or begin doing so after an initial fixed-rate
period of five years or less.
•
We have long-term relationships with numerous lending
counterparties. As of June 30, 2011, we had borrowings
outstanding with 24
counterparties.
•
Third quarter borrowing rates remain at favorable levels
relative to average repo borrowing rates of 0.24% at June
30, 2011 (0.56% including related interest rate swaps).
•
At June 30, 2011 we held $4.1 billion notional amount of
currently-paying
two-year
interest rate swaps requiring
fixed rate payments averaging 1.02% with average
maturities of 12 months. An additional $800
million
notional amount of two-year swaps were held at quarter-
end that require fixed rate payments averaging 0.82%
beginning in August through November 2011.
•
The duration of our investment portfolio and related ‘repo’
borrowings was approximately 10¼
months and 7 months,
respectively, at June 30, 2011. This resulted in a net
duration gap of approximately 3¼
months. Duration is a
measure of market price sensitivity to interest rate
movements.
Longer-to-Reset
ARMs
$2.49 Billion
Current-Reset
ARMs
$8.93
Billion
Borrowings Hedged with
Currently-Paying
Interest Rate Swaps
$4.10
Billion
Unhedged
Borrowings
$6.34
Billion |
 Capstead’s Stockholder Friendly Structure
7
Six months ended
June 30, 2011
Compensation-related expenses:
Fixed:
Salaries and related deferred compensation match,
payroll taxes, insurance and other benefits
__0.31%
Variable:
Incentive Compensation
**
0.45
Dividend Equivalent Rights
0.08
70% of compensation-related
Performance Stock Awards
0.13
expenses were performance-based
Related deferred compensation match and payroll taxes
0.05
1.02
Other platform expenses
0.34
1.36%
*
Expressed as a percentage of average long-term investment capital (LTIC).
**
Incentive compensation is based on a 10% participation in returns on LTIC in excess
of benchmark returns (greater of 10-year Treasury plus 2.0% or 10%) ,
capped at 50 basis points of LTIC and subject to Compensation Committee
discretion. •
Self-managed with low operating costs.
•
Our
board
of
directors
requires
management
to
hold
a
significant
amount
of
CMO
stock
based
on
a
multiple of each executive’s base salary. Currently over 1.4% of
outstanding shares are held by executive management and the board of
directors. •
Pay structure is variable through compensation elements that focus on “pay for
performance.” •
Management is incented to grow the Company by issuing common equity capital when it
is accretive to book
value
and
earnings,
rather
than
to
increase
compensation
or
external
management
fees.
•
Bottom line: management prospers when stockholders prosper.
* |
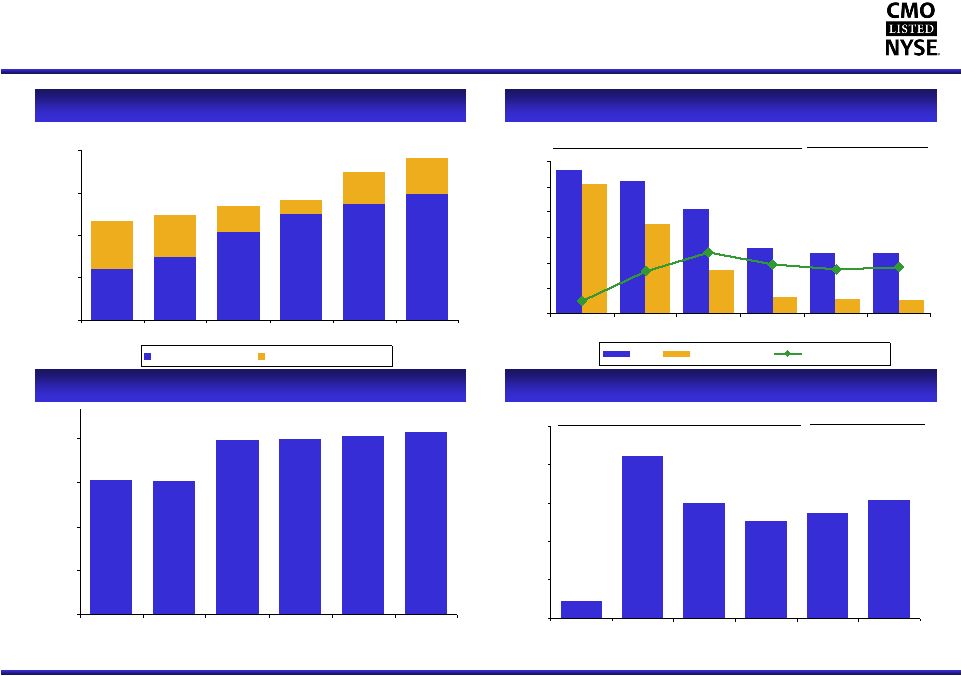 2.38%
5.64%
5.22%
4.13%
2.60%
2.36%
0.55%
0.66%
0.59%
1.73%
5.12%
3.53%
1.83%
1.77%
1.94%
2.40%
1.69%
0.52%
0.00%
1.00%
2.00%
3.00%
4.00%
5.00%
6.00%
12/31/07
12/31/08
12/31/09
12/31/10
3/31/11
6/30/11
Yield
Borrowing Rate
Financing Spread
$7.04
$8.07
$8.52
$10.43
$11.42
78%
51%
60%
77%
88%
79%
22%
49%
40%
23%
12%
21%
$7.44
$0.00
$3.00
$6.00
$9.00
$12.00
12/31/07
12/31/08
12/31/09
12/31/10
3/31/11
6/30/11
Current-Reset ARMs
Longer-to-Reset ARMs
Capstead’s Historical Financial Overview
8
* See page 16 for discussion of use of financing spread on mortgage assets, a
non-GAAP financial measure. ** Defined as annualized net income
available to common stockholders divided by average common equity capital.
($ in billions)
Residential ARM Securities Portfolio
Financing Spread on Mortgage Assets*
Book Value Per Common Share
Annualized Return on Average Common Equity**
$9.25
$9.14
$11.99
$12.02
$12.15
$12.46
$0.00
$3.00
$6.00
$9.00
$12.00
12/31/07
12/31/08
12/31/09
12/31/10
3/31/11
6/30/11
2.3%
21.0%
14.9%
12.7%
13.7%
15.4%
0.0%
5.0%
10.0%
15.0%
20.0%
25.0%
12/31/07
12/31/08
12/31/09
12/31/10
3/31/11
6/30/11
Yield
Borrowing Rate
Financing Spread
Current-Reset ARMs
Longer-to-Reset ARMs
Year ended
Quarter ended
Year ended
Quarter ended |
 Capstead’s Second Quarter 2011 Highlights
•
Our earnings increased to $42.5 million or $0.48 per diluted common share.
•
Our financing spread on mortgage assets* increased 6 basis points to average 1.83%,
reflecting the positive effects of higher yielding acquisitions and declines
in related borrowing rates which more than offset lower ARM loan coupon
interest rate resets and marginally higher mortgage prepayments. •
Our book value increased $0.31 to $12.46 per common share.
•
We raised $83 million in new common equity capital using our at-the-market
continuous offering program contributing $0.08 to the increase in book value
per common share. •
Our investment portfolio increased 10% or $996 million to $11.42
billion and our portfolio leverage increased
modestly to 8.05 times our long-term investment capital.
•
Comments from our July 27, 2011 earnings press release:
“Market conditions remain favorable for investing in agency-guaranteed
residential ARM securities on a leveraged basis, with attractive
risk-adjusted returns achievable in today’s stable financing environment. After having largely completed the re-
leveraging of our investment capital by the end of the first quarter, we increased
our portfolio leverage only modestly during the second quarter from 7.91 to
8.05 times our long-term investment capital while raising an additional $83 million in new common
equity capital under our continuous offering program. Additionally, we raised
a modest amount of new perpetual preferred equity capital under this program
this quarter. “Mortgage prepayments remained at favorable levels
during the second quarter for our portfolio of primarily well-seasoned
ARM securities. Additionally, our borrowing rates have never been lower,
benefiting our results for the quarter. Looking forward, we anticipate
that prepayment rates on newer origination securities may trend higher in the third quarter as a result of the recent
decline in mortgage interest rates, while prepays on more seasoned securities
should continue to be suppressed by low housing prices and credit problems
being experienced by many of these borrowers. Recognizing that most of our portfolio is composed of
current-reset ARM securities and the likelihood the current interest rate
environment will persist for some time, we anticipate portfolio yields will
continue trending lower in 2011 as coupon interest rates on the mortgage loans underlying these securities
reset to lower rates. If this proves to be correct, we would also expect
borrowing rates to remain low and our overall hedging costs to improve
providing some offset to declining portfolio yields. “We
remain
confident
in
and
focused
on
our
investment
strategy
of
managing
a
conservatively
leveraged
portfolio
of
agency-
guaranteed residential ARM securities that can produce attractive risk-adjusted
returns over the long term while reducing, but not eliminating, sensitivity
to changes in interest rates.” 9
* See page 16 for discussion of use of financing spread on mortgage assets, a
non-GAAP financial measure. |
 Recent Regulatory Initiatives
10
•
Potential adjustments to the Administration’s Home Affordable Refinancing
Program (HARP) may lead to higher, but still limited, participation levels
in this program with a likely focus on higher-coupon mortgages.
•
GSE
reform
efforts
appear
stalled
until
after
the
2012
elections
with
changes
expected
to
take
years to implement.
•
Recently announced SEC review of exclusions for mortgage REITs from regulation
under the Investment Company Act of 1940 (40 Act):
–
Concept Release; Request for Comments (Release No. IC-29778) solicits views
about the application of the 40 Act to mortgage REITs and similar companies,
including “suggestions on the steps the Commission should take to provide
greater
clarity,
consistency
or
regulatory
certainty”
with
respect
to
past
exclusionary
rulemaking
under
Section
3(c)5(C).
The release’s 60-day comment period runs through November 7, 2011 and
represents a potential precursor to new rule- making
by
the
SEC
that
could
limit
the
ability
of
mortgage
REITs
to
be
excluded
from
regulation
under
the
40
Act.
–
We believe that the process of codifying the Commission’s rulemaking over the
last 50 years into clear and comprehensive guidelines could potentially
solidify and expand the REIT industry’s critical role in facilitating capital formation for residential
housing. However, should the SEC pursue rulemaking that would require
mortgage REITs to register as investment companies
under
the
40
Act,
our
use
of
leverage
would
be
sharply
curtailed
absent
congressional
intervention.
–
We are participating in the SEC comment process and we encourage
our stockholders to do so as well. To register a
comment,
please
use
the
SEC’s
Internet
comment
form
at
http://www.sec.gov/rules/concept/shtml
or
send
an
e-mail
to
rule-comments@sec.gov, or simply contact your elected representatives in Congress. |
 Appendix
CAPSTEAD
11 |
 Comparative Balance Sheets
(dollars in thousands, except per share amounts)
12
June 30,
December 31,
December 31,
December 31,
December 31,
2011
2010
2009
2008
2007
(unaudited)
Assets
Mortgage securities and similar investments
11,424,161
$
8,515,691
$
8,091,103
$
7,499,530
$
7,108,719
$
Cash collateral receivable from interest rate swap counterparties
33,327
35,289
30,485
53,676
1,800
Interest rate swap agreements at fair value
9,356
9,597
1,758
-
-
Cash and cash equivalents
258,377
359,590
409,623
96,839
6,653
Receivables and other assets
91,404
76,078
92,817
76,200
88,637
Investments in unconsolidated affiliates
3,117
3,117
3,117
3,117
3,117
11,819,742
$
8,999,362
$
8,628,903
$
7,729,362
$
7,208,926
$
Liabilities
Repurchase arrangements and similar borrowings
10,437,387
$
7,792,743
$
7,435,256
$
6,751,500
$
6,500,362
$
Cash collateral payable to interest rate swap counterparties
600
9,024
-
-
-
Interest rate swap agreements at fair value
19,962
16,337
9,218
46,679
2,384
Unsecured borrowings
103,095
103,095
103,095
103,095
103,095
Common stock dividend payable
39,132
27,401
37,432
22,728
9,786
Accounts payable and accrued expenses
22,669
23,337
29,961
44,910
32,382
10,622,845
7,971,937
7,614,962
6,968,912
6,648,009
Stockholders' Equity
Perpetual preferred stock
179,982
179,323
179,333
179,460
179,533
Common stock
816,550
674,202
661,724
618,369
344,423
Accumulated other comprehensive income (loss)
200,365
173,900
172,884
(37,379)
36,961
1,196,897
1,027,425
1,013,941
760,450
560,917
11,819,742
$
8,999,362
$
8,628,903
$
7,729,362
$
7,208,926
$
liquidation preferences for the Series A and B preferred stock)
$12.46
$12.02
$11.99
$9.14
$9.25
unsecured borrowings, net of investments in related
unconsolidated affiliates)
$1,296,875
$1,127,403
$1,113,919
$860,428
$660,895
divided by long-term investment capital)
8.05:1
6.91:1
6.67:1
7.85:1
9.84:1
Book
value
per
common
share
(calculated
assuming
(stockholders’
equity
and
Portfolio
leverage
(borrowings
under
repurchase
arrangements
Long-term investment capital |
 Comparative Quarterly Income Statements
(dollars in thousands, except per share amounts) (unaudited)
13
June 2011
March 2011
Dec. 2010
Sept. 2010
June 2010
Interest income:
Mortgage securities and similar investments
63,136
$
53,141
$
50,902
$
40,614
$
47,634
$
Other
58
113
140
111
135
63,194
53,254
51,042
40,725
47,769
Interest expense:
Repurchase arrangements and similar borrowings
(13,706)
(12,322)
(11,892)
(11,096)
(11,146)
Unsecured borrowings
(2,187)
(2,187)
(2,187)
(2,186)
(2,187)
Other
(1)
(4)
(2)
-
-
(15,894)
(14,513)
(14,081)
(13,282)
(13,333)
47,300
38,741
36,961
27,443
34,436
Other revenue (expense):
Miscellaneous other revenue (expense)
(599)
(218)
(174)
(427)
(98)
Incentive compensation
(1,487)
(1,233)
(1,327)
(983)
(1,330)
Salaries and benefits
(1,672)
(1,700)
(1,566)
(1,425)
(1,463)
Other general and administrative expense
(1,066)
(963)
(932)
(999)
(1,851)
(4,824)
(4,114)
(3,999)
(3,834)
(4,742)
Income before equity in earnings of unconsolidated affiliates
42,476
34,627
32,962
23,609
29,694
Equity in earnings of unconsolidated affiliates
65
65
65
64
65
Net income
42,541
$
34,692
$
33,027
$
23,673
$
29,759
$
Net income per diluted common share
$0.48
$0.41
$0.40
$0.27
$0.35
Average long-term investment capital
1,253,747
$
1,158,254
$
1,123,699
$
1,110,084
$
1,124,036
$
Average balance of mortgage assets
10,601,719
8,993,926
8,110,095
7,313,810
7,460,379
Investment premium amortization
15,519
12,832
11,098
17,689
15,342
Portfolio runoff *
Average financing spread on mortgage assets**
1.91
37.9
1.83
17.1%
1.77
19.9%
1.89
19.4%
1.56
35.6% * Represents total runoff
(scheduled payments and prepayments). The constant prepayment rate, or CPR, represents only prepayments and will typically be 150 to 250
basis points lower than total runoff during any given period.
** See page 16 for discussion of use of financing spread on mortgage
assets, a non-GAAP financial measure. |
 Yield
/ Cost Analysis (dollars in thousands, unaudited)
14
*
See
page
16
for
discussion
of
use
of
financing
spread
on
mortgage
assets,
a
non-GAAP
financial
measure.
Basis
Yield/Cost
Runoff
Basis
Yield/Cost
Runoff
Agency-guaranteed securities:
Fannie Mae/Freddie Mac:
Fixed-rate
4,549
6.49%
26.5%
4,890
6.68%
8.9%
ARMs
9,479,889
2.36
17.4
8,293,715
2.34
20.5
Ginnie Mae ARMs
1,104,040
2.54
13.4
681,375
2.59
11.8
10,588,478
2.38
17.1
8,979,980
2.36
19.9
Unsecuritized residential mortgage loans:
Fixed-rate
3,375
6.50
5.1
3,433
5.89
6.7
ARMs
6,482
3.98
26.1
7,036
3.36
21.2
9,857
4.84
20.8
10,469
4.19
17.2
3,384
7.88
10.2
3,477
7.65
3.3
10,601,719
2.38
17.1
8,993,926
2.36
19.9
Other interest-earning assets
196,281
0.12
235,864
0.19
10,798,000
2.34
9,229,790
2.31
30-day to 90-day interest rates, as adjusted
for hedging results
9,798,257
0.55
8,304,926
0.59
Structured financings
3,384
7.88
3,477
7.65
9,801,641
0.55
8,308,403
0.59
Other interest-paying liabilites
3,482
0.10
10,344
0.16
Unsecured borrowings
103,095
8.49
103,095
8.49
9,908,218
0.64
8,421,842
0.69
Capital employed/Total financing spread
889,782
1.70
807,948
1.62
Financing spread on mortgage assets*
1.83
1.77
Secured borrowings based on:
Collateral for structured financings
Second Quarter 2011 Average
First Quarter 2011 Average
$
$
$
$ |
 *
Fully
indexed
net
weighted
average
coupon,
or
WAC,
represents
the
coupon
upon
one
or
more
resets
using
interest
rates
indices
as
of
June
30,
2011
and
the
applicable
net
margin.
NOTE:
Excludes
$10
million
of
fixed-rate
investments.
Residential ARM Portfolio Statistics
As of June 30, 2011 (dollars in thousands, unaudited)
15
Fully
Indexed
Average
Months
Principal
Cost Basis
Fair Market
Net
Net
Net
to
Balance
Premiums
($)
%
Value
WAC
WAC*
Margins
Roll
Current-reset ARMs:
Fannie Mae Agency Securities
$
5,843,979
$133,510
$
5,977,489
102.28
$6,104,732
2.66%
2.22%
1.70%
5.1
Freddie Mac Agency Securities
2,175,107
61,457
2,236,564
102.83
2,288,763
3.61
2.36
1.84
7.9
Ginnie Mae Agency Securities
510,872
7,934
518,806
101.55
526,876
2.69
1.71
1.52
5.3
Residential Mortgage Loans
6,118
23
6,141
100.38
6,233
3.49
2.34
2.05
5.5
8,536,076
202,924
8,739,000
102.38
8,926,604
2.90
2.23
1.73
5.8
Longer-to-reset ARMs:
Fannie Mae Agency Securities
1,175,797
39,122
1,
214,919
103.33
1,227,428
3.49
2.49
1.76
45.2
Freddie Mac Agency Securities
510,356
17,51
6
527,872
103.43
533,241
3.74
2.58
1.87
46.4
Ginnie Mae Agency Securities
695,386
25,015
720,401
103.60
725,82
1
3.58
1.72
1.51
40.5
2,381,539
81,653
2,463,192
103.43
2,486,490
3.57
2.29
1.71
44.1
102.
61
3.05
2.24
1.72
14.2
$10,917,15
$284,577
$11,202,192
$11,413,094 |
 Use of
Financing Spread on Mortgage Assets, a Non-GAAP Financial Measure
Second Quarter 2011 (dollars in thousands, unaudited)
16
Financing Spread on
Mortgage Assets,
Total Financing Spread,
a
Non-GAAP
a
GAAP Measure
Financial
Measure
(a)
Interest
Income
(Expense)
Yield/Cost
Difference
Interest
Income
(Expense)
Yield/Cost
Corresponding
First Quarter
2011
Yield/Cost
Interest income:
Mortgage assets
$
63,136
2.38%
$
–
$
63,136
2.38%
2.36%
Other interest-earning assets
(b)
58
0.12
(58)
–
–
–
63,194
2.34
(58)
63,136
2.38
2.36
Interest expense:
Secured borrowings (borrowings under
repurchase arrangements)
(13,706)
0.55
–
(13,706)
0.55
0.59
Unsecured borrowings
(c)
(2,187)
8.49
2,187
–
–
–
Other interest-paying liabilities
(d)
(1)
0.1
0
1
–
–
–
(15,894)
0.64
2,188
(13,706)
0.55
0.59
Net interest margin/financing spread
$
47,300
1.70
$
2,130
$
49,430
1.83
1.77
(b)
Other interest-earning assets consist of overnight investments and cash collateral receivable
from interest rate swap counterparties. (c)
Unsecured borrowings consist of junior subordinated notes with original terms of 30 years issued in
2005 and 2006 by Capstead to statutory trusts formed to issue $3.1 million of the trusts’
common securities to Capstead and to privately place $100.0 million of preferred securities to unrelated third party investors. Capstead
reflects its investment in the trusts as unconsolidated affiliates and considers the unsecured
borrowings, net of these affiliates, a component of its long-term investment
capital. (d)
Other
interest-paying liabilities consist of cash collateral payable to interest rate swap counterparties.
(a)
Net interest
margin
on
mortgage
assets
and
Financing
spread
on
mortgage
assets
are
non-GAAP
financial
measures
(based
solely
on
interest
income
and
yields
on
the
Company’s
portfolio
of
mortgage
securities,
net
of
borrowings
under
repurchase
agreements).
These
measures
are
similar
to
the
all-inclusive
GAAP
measures,
Total
net
interest
margin
and
Total
financing
spread
(based
on
all
interest-earning
assets
and
all
interest-paying
liabilities). |
 Experienced Management Team
17
Over 80 years of combined mortgage finance industry experience, including 75 years
at Capstead. Andrew
F.
Jacobs
–
President
and
Chief
Executive
Officer,
Director
–
Has served as president and chief executive officer since 2003 and has held various
executive positions at Capstead since 1988 –
Certified Public Accountant (“CPA”), member of the Board of Governors of
the National Association of Real Estate Investment Trusts
(“NAREIT”), chairman of NAREIT’s Council of Mortgage REITs, member
of the executive committee of the Chancellors Council of the University of
Texas System, the Executive Council of the Real Estate Finance and Investment Center at the University of Texas
at Austin, the American Institute of Certified Public Accountants
(“AICPA”), and the Financial Executive International (“FEI”)
Phillip
A.
Reinsch
–
Executive
Vice
President
and
Chief
Financial
Officer,
Secretary
–
Has
held
various
financial
accounting
and
reporting
positions
at
Capstead
since
1993
–
Formerly employed by Ernst & Young LLP as an audit senior manager focusing on
mortgage banking and asset securitization –
CPA, Member AICPA, FEI
Robert
A.
Spears
–
Executive
Vice
President,
Director
of
Residential
Mortgage
Investments
–
Has served in asset and liability management positions at Capstead since 1994
–
Formerly Vice President of secondary marketing with NationsBanc Mortgage
Corporation Michael
W.
Brown
–
Senior
Vice
President,
Asset
and
Liability
Management,
Treasurer
–
Has served in asset and liability management positions at Capstead since 1994
–
MBA, Southern Methodist University, Dallas, Texas |