Attached files
| file | filename |
|---|---|
| 8-K - ARROW ELECTRONICS, INC. 8-K - ARROW ELECTRONICS INC | a6807239.htm |
| EX-99.1 - EXHIBIT 99.1 - ARROW ELECTRONICS INC | a6807239ex991.htm |
Exhibit 99.2
Second-Quarter 2011 CFO Commentary
As reflected in our earnings release, there are a number of items that impact the comparability of our results with those in the trailing quarter and the second quarter of last year. Any discussion of our results will exclude these items to give you a better sense of our operating results. As always, the operating information we provide to you should be used as a complement to GAAP numbers. For a complete reconciliation between our GAAP and Non-GAAP results, please refer to our earnings release or the earnings reconciliation found at the end of this document.
Second-Quarter Summary
On a pro forma basis revenues grew 8% and gross and operating margins increased 30 and 40 basis points year over year, respectively. EPS of $1.36 represents the highest level in Arrow’s history. Our returns reflect our ability to create shareholder value:
| ● |
Return on invested capital of 13.6% is within our long-term target range
|
| ● |
Return on working capital of 31.9% remains ahead of our long-term target
|
We have demonstrated our ability to deliver excellent growth over the past 2 years and to create lasting shareholder value through accelerating growth in EPS, generating returns on invested capital well in excess of our weighted average cost of capital, and being cash flow positive.
In the second quarter, sales in our ECS business once again exhibited superb year-over-year growth, increasing 23% with strength in both the Americas and Europe. Sales were ahead of normal seasonality with very strong double-digit sequential increases in all product lines. We expect healthy demand to continue in the third quarter with sales in line with the midpoint of normal sequential seasonality.
In global components, sales growth was very strong again this quarter, driven by terrific year-over-year increases across a wide number of product sets and vertical markets in our core components businesses around the globe. On a sequential basis, sales were in line with normal seasonality, though slightly below our expectations for another quarter of above seasonal growth. This was due to a modest oversupply of inventory in the supply chain as well as uncertainty surrounding the global macroeconomic outlook. Due to these factors, we believe third quarter sales will be in line with the low end of normal sequential seasonality.
1
Consolidated Overview – Second Quarter
P&L Highlights –
($ in millions, except per share data, may reflect rounding)
|
2Q11
|
Y/Y Change
|
Y/Y Change
Pro forma
|
Q/Q
Change
|
|||||
|
Sales
|
$5,540
|
+20%
|
+8%
|
+6%
|
||||
|
Gross Profit Margin
|
13.9%
|
+110bps
|
+30bps
|
+10bps
|
||||
|
Operating Exp/Sales
|
9.3%
|
+80bps
|
-20bps
|
Flat
|
||||
|
Operating Income
|
$253.6
|
+30%
|
+17%
|
+8%
|
||||
|
Operating Margin
|
4.6%
|
+40bps
|
+40bps
|
+10bps
|
||||
|
Net Income
|
$159.8
|
+32%
|
+17%
|
+9%
|
||||
|
Diluted EPS
|
$1.36
|
+35%
|
+20%
|
+10%
|
|
●
|
Second quarter sales of $5.5 billion increased 20% year over year
|
|
m
|
Increased 6% on a sequential basis
|
|
■
|
Pro forma for acquisitions, sales were up 8% year over year and 4% sequentially
|
|
■
|
Pro forma for acquisitions and excluding FX, sales were up 3% year over year and were up 2% sequentially
|
|
●
|
Consolidated gross profit margin was 13.9%
|
|
m
|
Increased 110 basis points year over year and was up 10 basis points sequentially, driven by strength in global components margin
|
|
m
|
Pro forma for acquisitions, gross profit margin increased 30 basis points year over year
|
|
●
|
Operating expenses as a percentage of sales was 9.3%
|
|
m
|
Increased 80 basis points year over year and were flat sequentially
|
|
m
|
On an absolute dollar basis, operating expenses increased year over year as acquisitions added $88 million this quarter, a weakening dollar added another $19 million due to translation, and $15 million was for investments and variable costs relating to increased sales
|
|
m
|
Pro forma for acquisitions and excluding FX, operating expenses were up 2% year over year and would be 8.4%
|
|
●
|
Operating income was $253.6 million
|
|
m
|
Increased 30% year over year and 8% sequentially
|
|
m
|
Operating income growth once again outpaced sales growth, increasing 1.5x faster than sales on a year-over-year basis
|
|
m
|
Pro forma for acquisitions, operating income increased 17% year over year, or 2x pro forma sales growth
|
|
●
|
Operating income as a percentage of sales was 4.6%
|
|
m
|
Increased 40 basis points year over year, driven entirely by our legacy businesses, and was up 10 basis points sequentially
|
|
m
|
Pro forma for acquisitions, operating income as a percentage of sales increased 40 basis points year over year
|
|
●
|
Effective tax rate for the quarter was 30.0%
|
|
●
|
Net income was $159.8 million
|
|
m
|
Increased 32% compared with last year and 9% sequentially
|
|
m
|
Pro forma for acquisitions, net income increased 17% year over year
|
|
●
|
Earnings per share were $1.38 and $1.36 on a basic and diluted basis, respectively
|
|
m
|
Diluted EPS increased 35% year over year and 10% sequentially
|
|
m
|
Pro forma for acquisitions, EPS increased 20% year over year
|
|
■
|
Highest quarterly EPS in Arrow history
|
2
Global Components
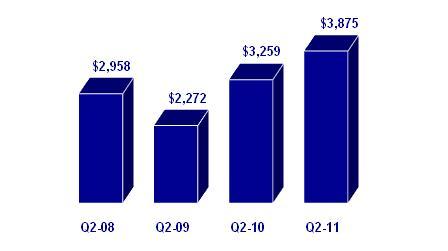
Sales ($ in millions)
|
●
|
Sales increased 19% year over year and were flat sequentially
|
|
m
|
Sales in line with normal seasonality on a sequential basis
|
|
m
|
Pro forma for acquisitions and excluding FX, sales increased 1% year over year and declined 4% sequentially
|
|
●
|
Gross margin increased 90 basis points year over year due primarily to the impact of recently acquired businesses
|
|
m
|
Sequentially, gross margin increased 50 basis points
|
|
m
|
Gross margin in our core customer base of small and medium size customers increased 10 basis points year over year and 20 basis points sequentially
|
|
●
|
Lead times are near normal historical levels
|
|
m
|
No meaningful changes in cancellation rates
|
|
●
|
Our quarterly survey of approximately 300 customers in North America shows that the outlook for purchase requirements heading into the third quarter remained positive, although is down from the prior quarter and prior year
|
|
●
|
Operating profit increased 23% year over year
|
|
m
|
Operating profit in our legacy business increased 15% year over year and grew nearly 2x faster than sales
|
|
m
|
Operating margin increased 20 basis points year over year to 5.8%
|
|
■
|
This marks the highest Q2 level since 2006
|
3
Americas Components
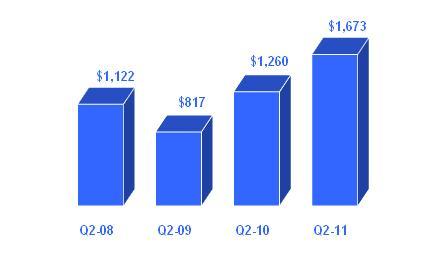
Sales ($ in millions)
|
●
|
Sales increased 33% year over year and increased 5% sequentially
|
|
m
|
Record-level revenue
|
|
m
|
Pro forma for acquisitions, sales increased 2% year over year and were in line with normal seasonality on a sequential basis
|
|
●
|
The medical vertical market continued to exhibit strong growth, up 10% year over year
|
|
●
|
Operating income grew 30% year over year
|
|
m
|
Operating margin decreased 20 basis points year over year due to acquisitions
|
|
m
|
Pro forma for acquisitions, operating margin increased 70 basis points year over year
|
|
●
|
Return on working capital increased 280 basis points year over year
|
4
Europe Components
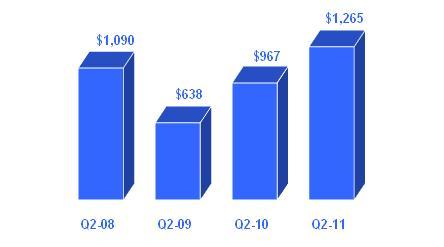
Sales ($ in millions)
|
●
|
Sales increased 31% year over year and declined 5% sequentially
|
|
m
|
Excluding the impact of foreign exchange, sales were up 14% year over year and down 9% quarter over quarter
|
|
m
|
Sequentially, sales growth was below normal seasonality due primarily to a softer market, particularly Southern Europe
|
|
●
|
Central Europe continues to see solid growth, while emerging markets are also strong
|
|
●
|
Vertical market performance continues to be strong
|
|
m
|
Automotive increased 18% year over year, lighting was up 15%, and medical increased 10%
|
|
●
|
Operating income grew 26% year over year
|
|
m
|
Operating margin declined 20 basis points year over year due to mix
|
|
●
|
Return on working capital declined 830 basis points year over year primarily driven by higher inventory levels due to a buildup in customer inventories
|
5
Asia Pacific Components
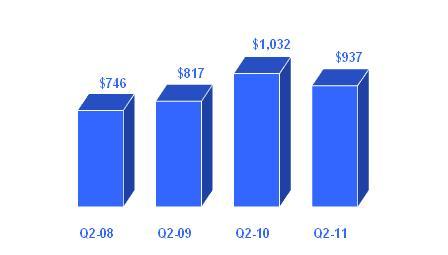
Sales ($ in millions)
|
●
|
Sales declined 9% year over year and 2% sequentially
|
|
m
|
Below normal seasonality on a sequential basis as mobile-handset components business continues to be weak
|
|
●
|
Growth in our core business remains solid, increasing 7% year over year, with good performance in greater China
|
|
m
|
Sequentially, the core business increased 1%
|
|
●
|
Vertical market growth led by transportation and lighting, which increased 40% and 6% year over year, respectively
|
|
●
|
PEMCO sales increased almost 10% year over year
|
|
●
|
Operating profit declined 5% year over year primarily due to lower sales at Ultra Source
|
|
m
|
Operating margin increased 20 basis points year over year
|
|
m
|
Operating profit in the core business was up 9% year over year and increased faster than sales
|
|
●
|
Return on working capital declined 440 basis points year over year due to lower operating income at Ultra Source and increased inventory in our core business due to a slowdown in demand in the month of June
|
6
Global Enterprise Computing Solutions
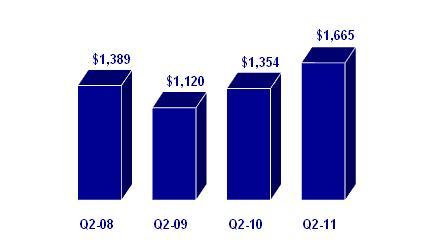
Sales ($ in millions)
|
●
|
Sales increased 23% year over year and increased 25% sequentially
|
|
m
|
Record second quarter revenue
|
|
m
|
Pro forma and excluding FX, sales increased 7% year over year and 20% sequentially
|
|
●
|
Sales growth above normal seasonality on a sequential basis
|
|
m
|
Terrific sequential growth in all product lines, with proprietary servers +48%
|
|
m
|
Extremely strong double-digit year-over-year growth in all product lines led by services (+50%), industry-standard servers (+35%), and software (+29%)
|
|
m
|
Exceptional growth in faster growing products with security up 25% year over year, virtualization up 45%, and networking up 51%
|
|
●
|
Gross margin increased 200 basis points year over year driven by the addition of acquisitions and changes in product mix
|
|
m
|
Pro forma for acquisitions, gross profit increased 20 basis points year over year
|
|
m
|
Gross margin declined 50 basis points sequentially, driven by geographic and product mix
|
|
●
|
Operating income grew 48% year over year and increased 2x faster than sales
|
|
m
|
Operating margin increased 60 basis points year over year to 3.8%
|
|
●
|
Return on working capital continues to excel
|
7
ECS America
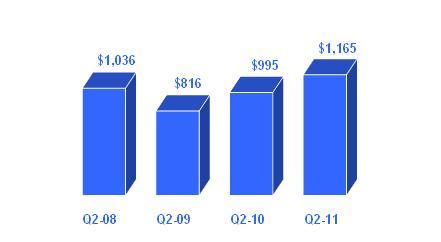
Sales ($ in millions)
|
●
|
Sales increased 17% year over year and 32% sequentially
|
|
m
|
Pro forma for acquisitions, sales increased 8% year over year and 28% sequentially
|
|
●
|
Sales growth well ahead of normal seasonality on a sequential basis
|
|
m
|
Strong double-digit year-over-year growth led by industry-standard servers (+30%), software (+19%), and services (+18%)
|
|
●
|
Gross profit increased 260 basis points year over year and declined 60 basis points sequentially
|
|
m
|
Year over year increase driven by strength in our core North American value-added distribution business, changes in product mix, and the addition of Shared Technologies
|
|
●
|
A combination of top-line growth and improved gross profit resulted in operating income growth of 47% year over year
|
|
m
|
Operating income grew almost 3x faster than sales year over year
|
|
m
|
Operating margin expanded 90 basis points year over year
|
8
ECS Europe
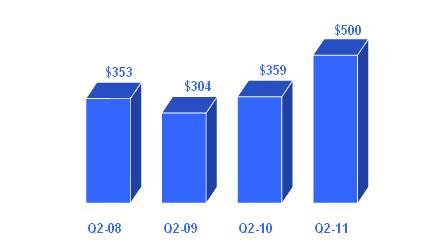
Sales ($ in millions)
|
●
|
Sales increased 39% year over year and 10% sequentially
|
|
m
|
Pro forma and excluding FX, sales increased 7% year over year and 5% sequentially
|
|
●
|
Sales growth in line with normal seasonality on a sequential basis
|
|
m
|
Double-digit growth in all regions with the exception of the UK, which experienced weaker market conditions
|
|
m
|
Impressive double-digit year-over-year growth in all product categories led by proprietary servers (+134%), industry-standard servers (+56%) and software (+43%)
|
|
●
|
Gross profit declined 20 basis points year over year and 10 basis points sequentially due to product mix and to a lesser extent regional mix
|
|
m
|
Pro forma for acquisitions, gross profit declined 10 basis points year over year
|
|
●
|
Operating profit increased 81% year over year and grew 2x faster than sales
|
|
m
|
Operating margin improved 50 basis points year over year
|
|
●
|
Return on working capital approaching 40%
|
Cash Flow and Balance Sheet Highlights
|
●
|
Working Capital
|
We continue to effectively manage all levers of our working capital and working capital to sales of $.14 remains at the low end of our long-term target range. Return on working capital of 31.9% is the second highest second-quarter level in the past five years, and remains above our long-term target.
9
|
●
|
Return on Invested Capital
|
Return on invested capital of 13.6% is considerably ahead of our weighted average cost of capital and is within our long-term targets. This is a key driver in creating lasting shareholder value.
|
●
|
Cash Flow from Operations
|
We generated $35 million in cash from operations in the second quarter even as we continued to support growth initiatives on both sides of the business. On a trailing twelve month basis, we generated $290 million in cash from operations, during a period where we were investing in the business.
|
●
|
Share Buyback
|
We completed our previously announced $50 million buyback authorization during the second quarter bringing the total amount returned to shareholders to $250 million over the past two years. The average price of the repurchases was $31.31. Our board just approved an incremental $100 million repurchase authorization as we believe this is an effective method of returning capital to investors.
|
●
|
Debt and Liquidity
|
Our balance sheet and capital structure remain strong with conservative debt levels, and a net debt to EBITDA ratio of approximately 1.4x. Our financial position remains extremely strong, and we have $1.4 billion in committed liquidity facilities in addition to our cash of more than $500 million. Thus we now have the flexibility to take advantage of opportunities in the marketplace.
Third-Quarter 2011 Guidance
| ● | Consolidated Sales | $5.15Bn to $5.55Bn | |
| m Global Components | $3.76Bn to $3.96Bn | ||
| m Global ECS | $1.39Bn to $1.59Bn | ||
| ● | Diluted EPS | $1.17 to $1.29 |
In the third quarter, we would expect global ECS sales to be in line with the midpoint of normal seasonality. Sales in our core global components business are expected to be in line with the low end of normal seasonality, reflecting an oversupply of inventory in the supply chain at the end of the second quarter and weaker global macroeconomic conditions.
10
Arrow Electronics Revenue Seasonality*
Core Global Components**
|
GLOBAL
|
GLOBAL
|
|||||||||||
|
NAC
|
EUR ex FX
|
A/P
|
COMPONENTS
|
COMP ex FX
|
||||||||
|
Q1
|
Flat to +2%
|
+13%
|
Flat to -13%
|
+2% to +4%
|
+3% to +5%
|
|||||||
|
Q2
|
Flat to -3%
|
-2% to -7%
|
+3% to +14%
|
+1% to -1%
|
Flat to -1%
|
|||||||
|
Q3
|
Flat to -2%
|
Flat to -10%
|
+15% to +20%
|
+2% to +3%
|
Flat to +2%
|
|||||||
|
Q4
|
Flat to -7%
|
-4% to +1%
|
-4% to -5%
|
-2% to -5%
|
-3% to -8%
|
|||||||
Global ECS
|
GLOBAL
|
GLOBAL
|
|||||||||
|
NA
|
EUR ex FX
|
ECS*
|
ECS ex FX
|
|||||||
|
Q1
|
-25% to -35%
|
-16% to -28%
|
-30% to -35%
|
-25% to -35%
|
||||||
|
Q2
|
+20% to +22%
|
+7% to +11%
|
+15% to +20%
|
+17% to +18%
|
||||||
|
Q3
|
-1% to -9%
|
-8% to -12%
|
-5% to -15%
|
-8% to -12%
|
||||||
|
Q4
|
+29% to +35%
|
+31% to +69%
|
+35% to +45%
|
+30% to +43%
|
||||||
Consolidated
|
TOTAL
|
|||
|
ARROW, Ex FX
|
|||
|
Q1
|
-6% to -11%
|
||
|
Q2
|
+5% to +6%
|
||
|
Q3
|
-1% to +1%
|
||
|
Q4
|
+5% to +12%
|
||
* Revenue seasonality based on historical sequential sales growth for 2007-2008; does not include 2009-2010
**Core global components, excluding acquisitions
11
Risk Factors
The discussion of the company’s business and operations should be read together with the risk factors contained in Item 1A of its 2010 Annual Report on Form 10-K, filed with the Securities and Exchange Commission, which describe various risks and uncertainties to which the company is or may become subject. If any of the described events occur, the company’s business, results of operations, financial condition, liquidity, or access to the capital markets could be materially adversely affected. In addition to the risk factors contained in Item 1A in the 2010 Annual Report for Form 10-K, we have added the following risk factor:
The recent earthquake and tsunami, and other collateral events, in Japan may negatively impact our supply of products or cause shortages of some components, which could have a material adverse effect on the company’s business.
As a result of the effects of the earthquake and tsunami that recently occurred in Japan, including the resultant nuclear crisis, certain of the company’s vendors may be unable to deliver sufficient quantities of components or deliver them in a timely manner. Further, depending on the length of these disruptions, we may need to locate alternate suppliers to fulfill our customers’ needs. While it is too early to predict what impact this crisis will have, it could have a material adverse affect on the company’s business.
Certain Non-GAAP Financial Information
In addition to disclosing results that are determined in accordance with Generally Accepted Accounting Principles ("GAAP"), the company provides certain non-GAAP financial information relating to operating income, net income attributable to shareholders and net income per basic and diluted share, each as adjusted for certain charges, credits and losses that the company believes impact the comparability of its results of operations. These charges, credits and losses arise out of the company's efficiency enhancement initiatives, acquisitions, prepayment of debt, and settlement of certain legal matters. A reconciliation of the company's non-GAAP financial information to GAAP is set forth in the table below.
The company believes that such non-GAAP financial information is useful to investors to assist in assessing and understanding the company's operating performance and underlying trends in the company's business because management considers the charges, credits and losses referred to above to be outside the company's core operating results. This non-GAAP financial information is among the primary indicators management uses as a basis for evaluating the company's financial and operating performance. In addition, the company's Board of Directors may use this non-GAAP financial information in evaluating management performance and setting management compensation.
12
The presentation of this additional non-GAAP financial information is not meant to be considered in isolation or as a substitute for, or alternative to, operating income, net income attributable to shareholders and net income per basic and diluted share determined in accordance with GAAP. Analysis of results and outlook on a non-GAAP basis should be used as a complement to, and in conjunction with, data presented in accordance with GAAP.
Earnings Reconciliation
($ in thousands, except per share data)
| Q2 2011 | Q1 2011 | Q2 2010 | ||||||||||
|
Operating income, as Reported
|
$ | 248,330 | $ | 219,168 | $ | 189,191 | ||||||
|
Restructuring, integration, and other charges
|
5,221 | 9,607 | 5,649 | |||||||||
|
Settlement of legal matter
|
-- | 5,875 | -- | |||||||||
|
Operating income, as Adjusted
|
$ | 253,551 | $ | 234,650 | $ | 194,840 | ||||||
|
Net income attributable to shareholders, as Reported
|
$ | 156,197 | $ | 136,309 | $ | 116,193 | ||||||
|
Restructuring, integration, and other charges
|
3,584 | 7,199 | 4,095 | |||||||||
|
Settlement of legal matter
|
-- | 3,609 | -- | |||||||||
|
Gain on bargain purchase
|
-- | (1,078 | ) | -- | ||||||||
|
Loss on prepayment of debt
|
-- | -- | 964 | |||||||||
|
Net income attributable to shareholders, as Adjusted
|
$ | 159,781 | $ | 146,039 | $ | 121,252 | ||||||
|
Diluted EPS, as Reported
|
$ | 1.33 | $ | 1.16 | $ | .96 | ||||||
|
Restructuring, integration, and other charges
|
.03 | .06 | .03 | |||||||||
|
Settlement of legal matter
|
-- | .03 | -- | |||||||||
|
Gain on bargain purchase
|
-- | (.01 | ) | -- | ||||||||
|
Loss on prepayment of debt
|
-- | -- | .01 | |||||||||
|
Diluted EPS, as Adjusted
|
$ | 1.36 | $ | 1.24 | $ | 1.01 | ||||||
The sum of the components for net income per share, as Adjusted, may not agree to totals, as presented, due to rounding.
13
Earnings Reconciliation
References to restructuring and other charges refer to the following incremental charges taken in the periods indicated:
Q2-11 Restructuring, Integration, and Other Charges: During the second quarter of 2011, the company recorded restructuring, integration, and other charges of $5.2 million ($3.6 million net of related taxes or $.03 per share on both a basic and diluted basis) primarily related to initiatives taken by the company to improve operating efficiencies.
Q1-11 Restructuring, Integration, and Other Charges: During the first quarter of 2011, the company recorded restructuring, integration, and other charges of $9.6 million ($7.2 million net of related taxes or $.06 per share on both a basic and diluted basis) primarily related to initiatives taken by the company to improve operating efficiencies.
Q1-11 Settlement of Legal Matter: During the first quarter of 2011, the company recorded a charge of $5.9 million ($3.6 million net of related taxes or $.03 per share on both a basic and diluted basis) in connection with the settlement of a legal matter in 2011.
Q1-11 Gain on Bargain Purchase: During the first quarter of 2011, the company recognized a gain on bargain purchase of $1.8 million ($1.1 million net of related taxes or $.01 per share on both a basic and diluted basis) related to the acquisition of Nu Horizons Electronics in 2011.
Q2-10 Restructuring, Integration, and Other Charges: During the second quarter of 2010, the company recorded restructuring, integration, and other charges of $5.6 million ($4.1 million net of related taxes or $.03 per share on both a basic and diluted basis) primarily related to initiatives taken by the company to improve operating efficiencies.
Q2-10 Loss on Prepayment of Debt: During the second quarter of 2010, the company recorded a loss on prepayment of debt of $1.6 million ($1.0 million net of related taxes or $.01 per share on both a basic and diluted basis).
14