Attached files
| file | filename |
|---|---|
| 8-K - FORM 8-K - CYS Investments, Inc. | d8k.htm |
 Deutsche Bank Global Financial Services Investor Conference
June 8, 2011
Investment Outlook
June, 2011
Exhibit 99.1 |
 1
Forward Looking Statements
This presentation contains forward-looking statements, within the meaning of
Section 27A of the Securities Act of 1933, as amended, and Section 21E of
the Securities Exchange Act of 1934, as amended, that are based on
management’s beliefs and assumptions, current expectations, estimates
and projections. Such statements, including information relating to the Company’s
expectations
for
future
distributions
and
market
conditions,
are
not
considered
historical
facts
and
are
considered
forward-looking
information
under
the
federal
securities
laws.
This
information
may
contain
words
such
as
“believes,”
“plans,”
“expects,”
“intends,”
“estimates”
or similar expressions.
This information is not a guarantee of the Company’s future performance and is
subject to risks, uncertainties and other important factors that could cause
the Company’s actual performance or achievements to differ materially from those expressed
or implied by this forward-looking information and include, without limitation,
changes in the Company’s distribution policy, changes in the
Company’s ability to pay distributions, changes in the market value and yield of our assets, changes in interest
rates and the yield curve, net interest margin, return on equity, availability and
terms of financing and hedging and various other risks
and
uncertainties
related
to
our
business
and
the
economy,
some
of
which
are
described
in
our
filings
with
the
SEC.
Given
these uncertainties, you should not rely on forward-looking information.
The Company undertakes no obligations to update any forward-looking
information, whether as a result of new information, future events or otherwise. |
 2
CYS: Overview
Focus on Cost
Efficiency
Target Assets
Agency Residential Mortgage Backed Securities
A Real Estate Investment Trust formed in January 2006
Ample Financing
Sources
Currently financing lines with 32
lenders
Swap agreements with 16 counterparties
Dividend Policy
Company
intends
to
distribute
all
or
substantially
all
of
its
REIT
taxable
income
Scaled Management Fee: 1.0% to 1.5%
No Incentive Fee
Objective
Senior Management
Kevin Grant, CEO, President, Chairman
Frances Spark, CFO
Pay dividends and achieve capital appreciation throughout changing interest rate
and credit cycles
Be the most efficient Agency REIT in the market |
 3
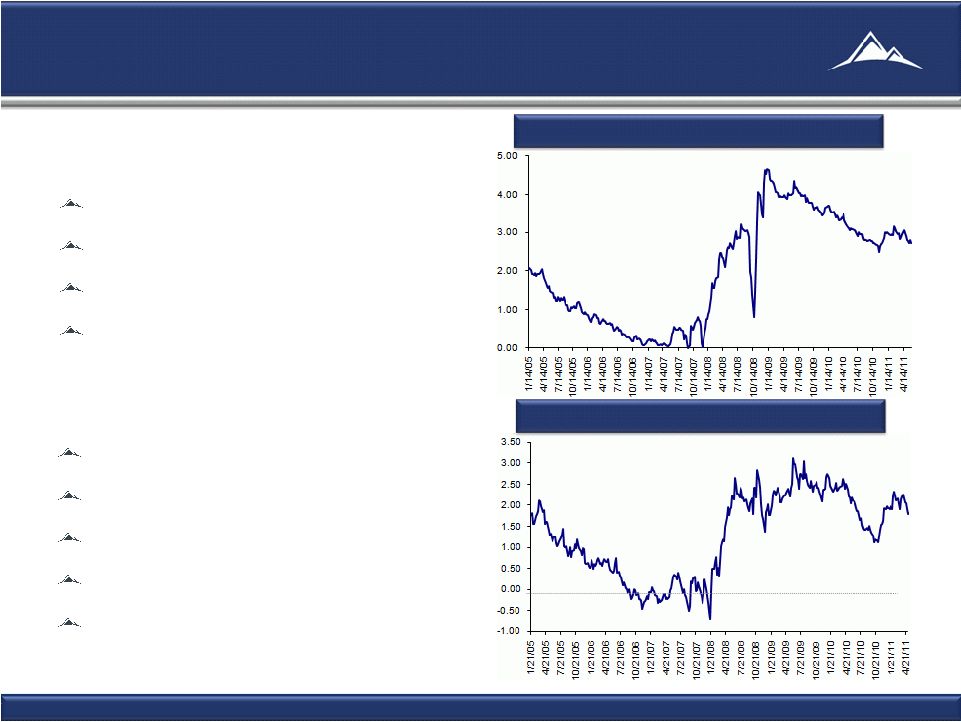
Attractive Environment Likely to Persist
Steep Curve
Creates significant positive carry
Very Low Cost of financing
Significant ROE
Hedge flexibility very important
Fed still fighting deflation
June 3, 2011
Source: Bloomberg.
(1) As of June 3, 2011
Mortgage Yields Currently Attractive
Par-Priced
7/1
hybrid
rates
now
2.65%
(1)
30
Year
fixed
rates
now
3.97%
(1)
15
Year
fixed
rates
now
3.24%
(1)
Hedging rates historically low
June 3, 2011
5/1
Hybrid
Net
Interest
Margin:
1/05
–
6/11
5
Year
Swap
vs.
1
Month
LIBOR:
1/05
–
6/11 |
 4
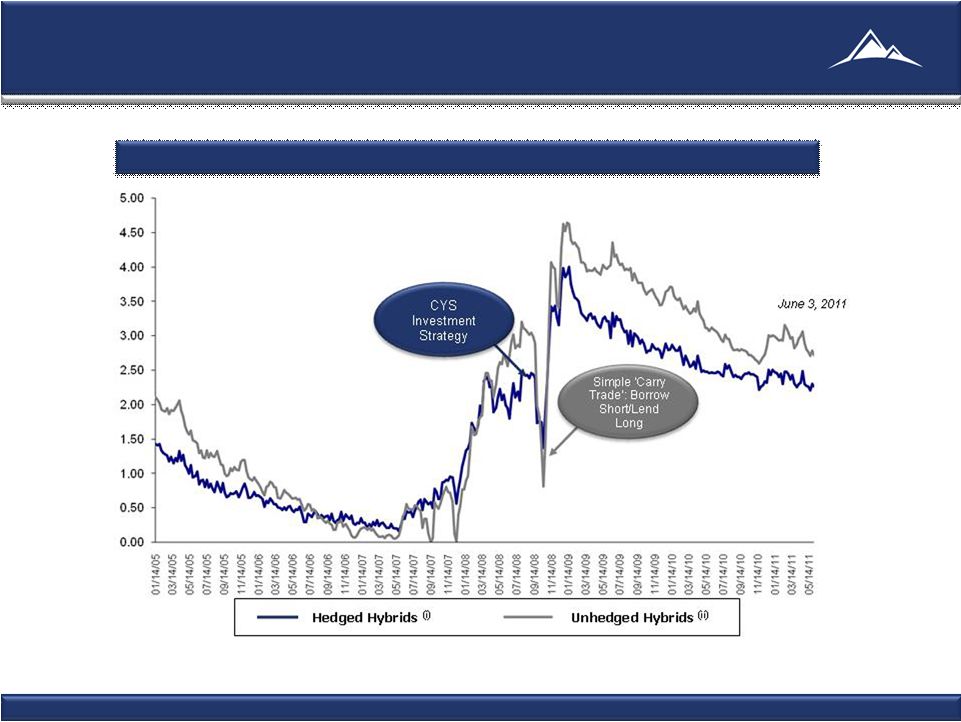
Wide Spreads Create Good Environment
Source: Bloomberg.
Note:
Spreads
calculated
as:
(i)
5/1
Hybrids
Index
–
50/50
3-Year
Swaps/LIBOR,
and
(ii)
5/1
Hybrids
Index
–
1-Month
LIBOR
Index.
5/1
Hybrids
Hedged
with
Swaps:
1/05
–
6/11 |
 5
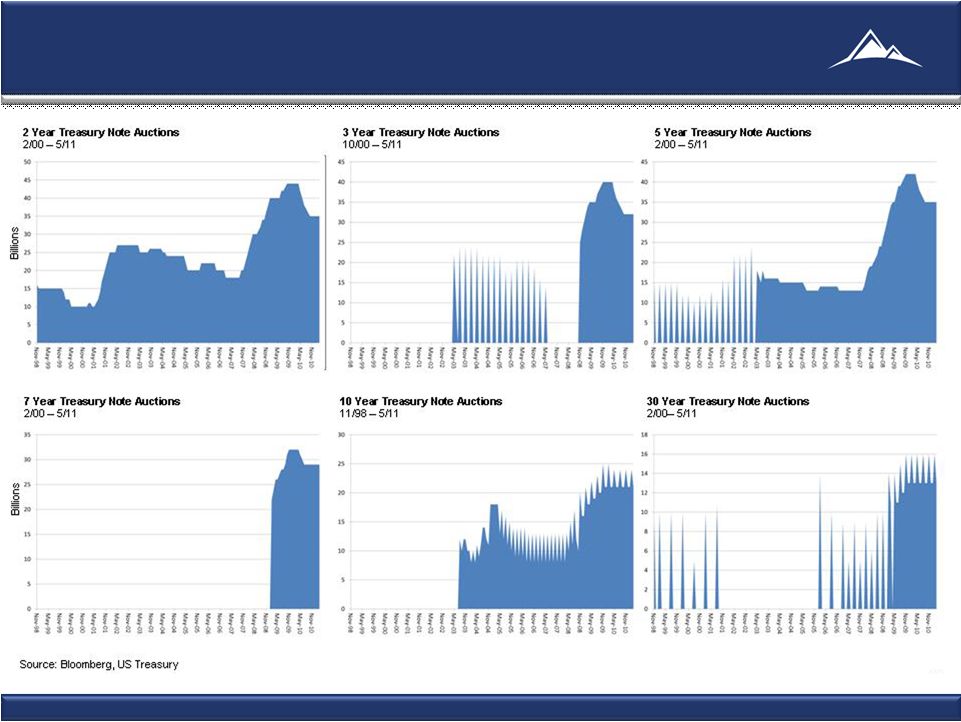
Treasury Auction Volume |
 6
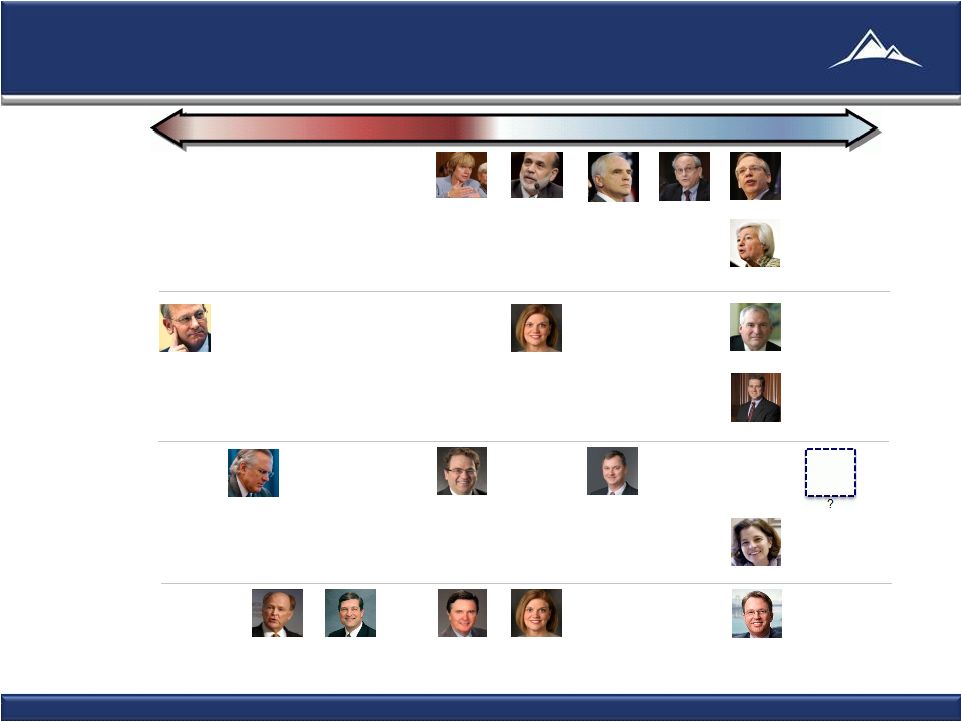
Fed Board has Become More Dovish
Hoenig
Bullard
Plosser
Fisher
Lacker
Duke
Tarullo
Dudley
Pianalto
Kohn
Kocherlakota
Lockhart
Evans
Pianalto
Yellen
Rosengren
Raskin
Bernanke
Governors
2010 Voters
2011 Voters
2012 Voters
Williams
Obama
Nominee
Sources: Macroeconomic Advisers, LLC, Bank of America Merrill Lynch,
Bloomberg, Wall Street Journal, Indiana University, Marketwatch, Thomson Reuters, Federal Reserve Bank of Atlanta, Federal Reserve Bank
of
Chicago,
Federal
Reserve
Bank
of
Cleveland,
Maryland
Consumer
Rights
Coalition,
Boston
Globe,
Businessweek,
Newsweek,
Washington
Post,
CNBC.
Hawkish
Dovish
Neutral |
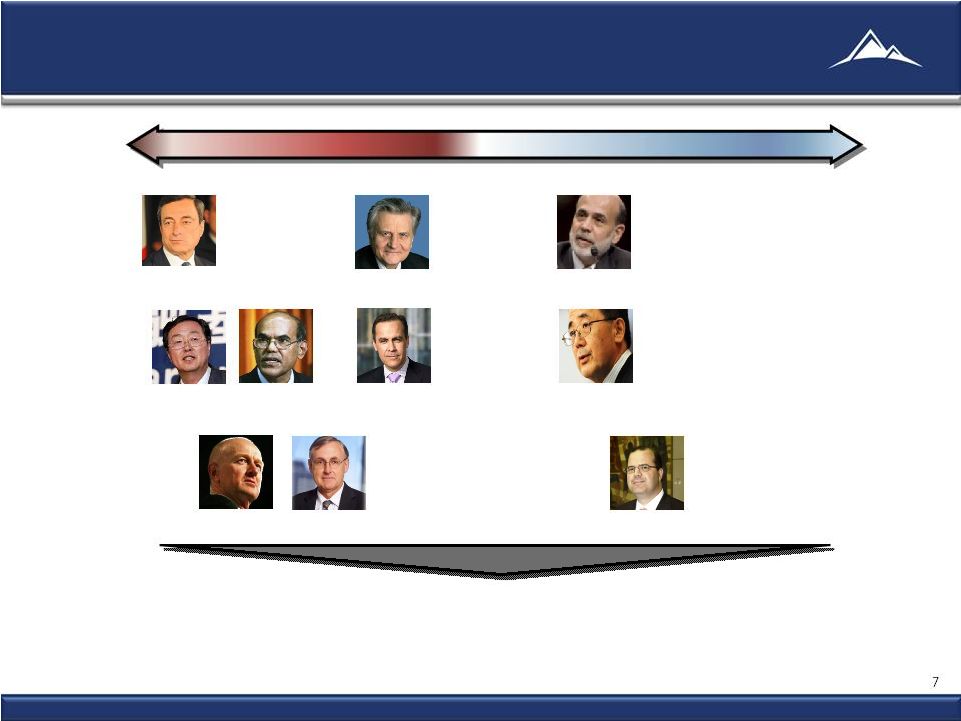 Other
Central Banks are Waging the Inflation War Hawkish
Dovish
Neutral
Xiaochuan
China
Bernanke
USA
Shirakawa
Japan
Trichet
EU (Outgoing)
Canada
Carney
Australia
Stevens
New Zealand
Bollard
Draghi
EU (Incoming)
Tombini
Brazil
Subbarao
India
(Outgoing)
Consequences: US Rates Likely To Be Lower For Longer
|
 8
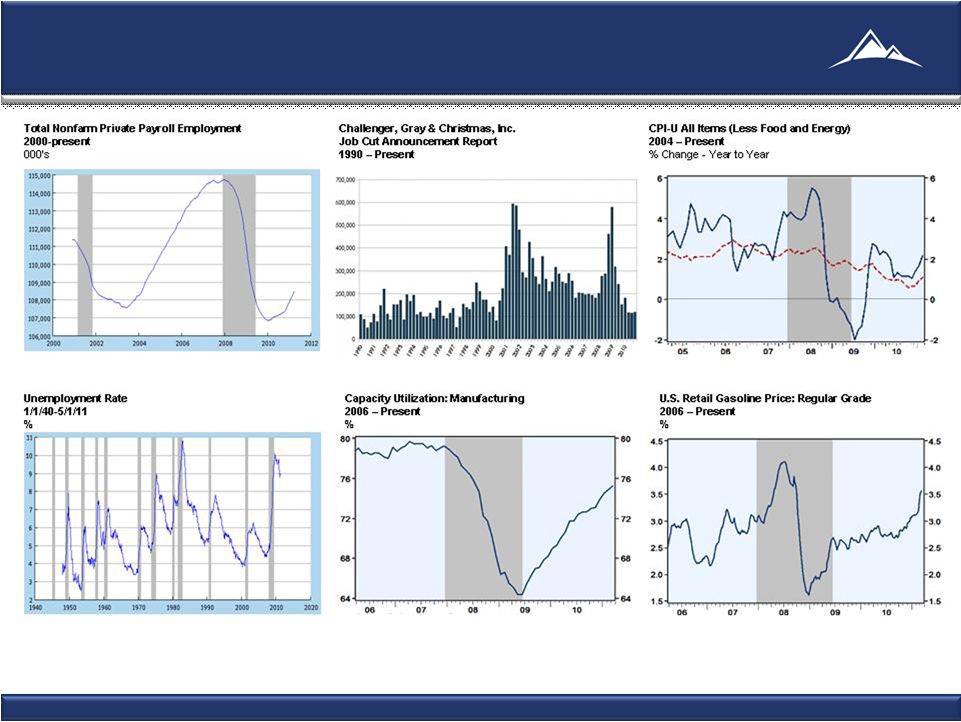
Source: S&P, Fiserv, and Macromarkets LLC / Haver Analytics, BLS, Challenger,
Gray & Christmas Economic Recovery Below Normal Pace
|
 9
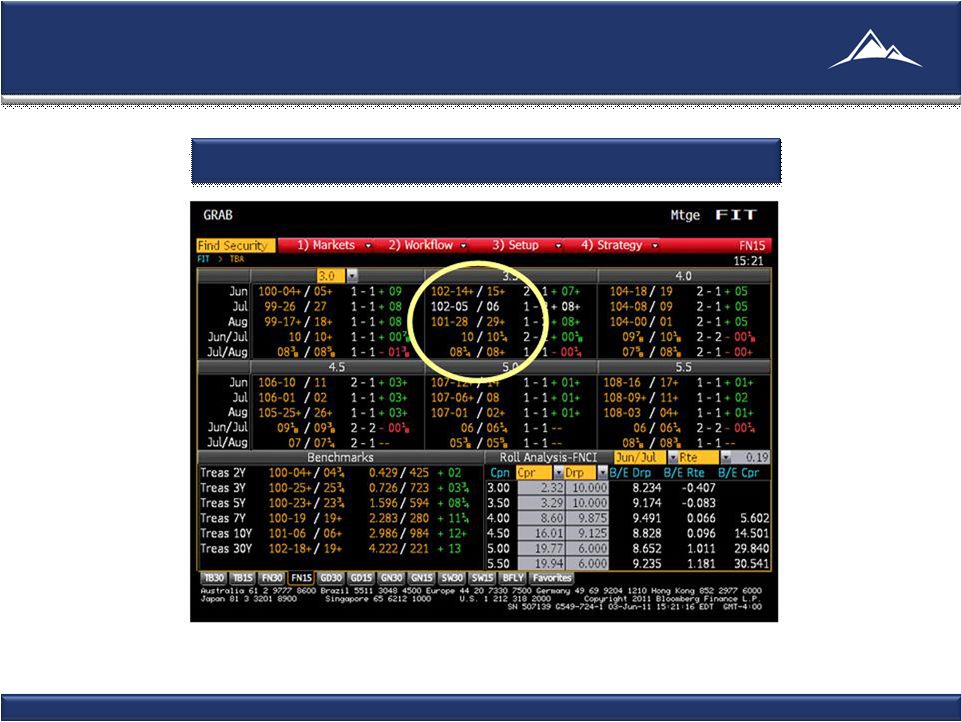
1
9/32
represents
a
discount
to
the
purchase
price
of
the
security
of
approximately
$0.30
per
month
from
trade
date
to
settlement
date.
Source: Bloomberg 6/3/11
Economics of Forward Purchase
Example:
15
yr.
3
½%
drop
=
10/32
pt.
per
month¹ |
 10
10
Portfolio Composition and Results
1
As of 3/31/11
2
CYS
paid
quarterly
dividends
of
$0.35
per
share
of
common
stock
on
October
21,
2009,
$0.55
per
share
of
common
stock
on
January
27,
2010
and
April
28,
2010,
and
$0.60
per
share
of
common
stock
on
July
28,
2010,
October
20,
2010,
December
29,
2010,
and
April
20,
2011.
On
June
6,
2011,
CYS
declared
a
dividend
of
$0.60
per
share
of
common
stock
for
the
second
quarter
of
2011.
The
dividend
will
be
paid
on
July
27,
2011
to
stockholders
of
record
on
June
22,
2011.
$0.00
$0.10
$0.20
$0.30
$0.40
$0.50
$0.60
$0.70
Oct-09
Jan-10
Oct-10
Dec-10
Apr-11
Jul-11
Apr-10
Jul-10
$0.35
$0.55
$0.55
$0.60
$0.60
$0.60
$0.60
$0.60
CYS
Dividends:
10/09
–
7/11
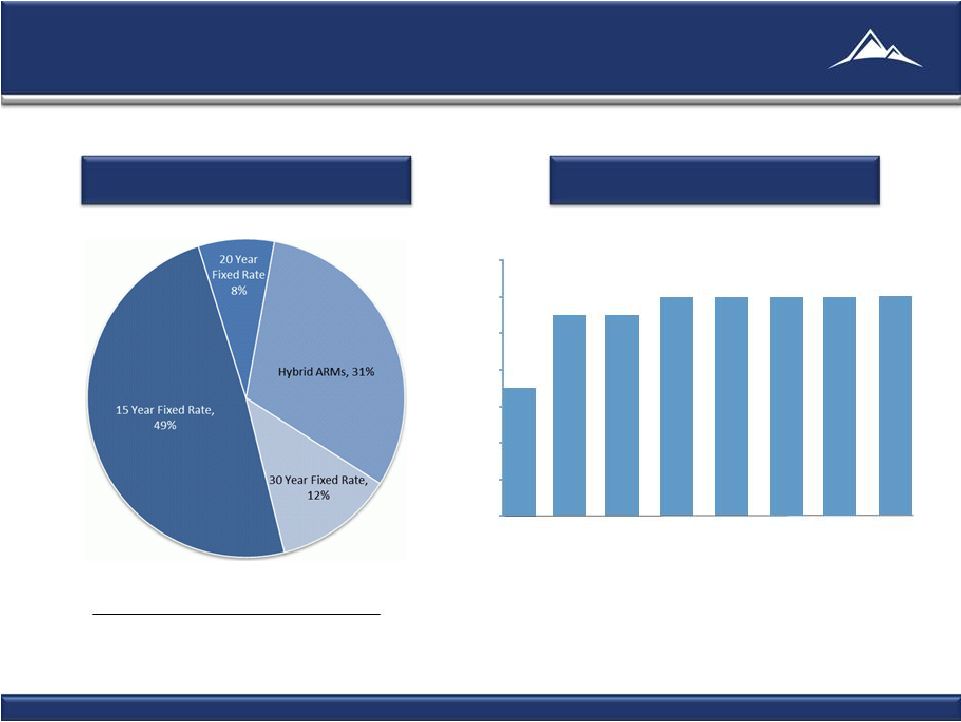
2
CYS
Agency
RMBS
Portfolio
1
Total Agency RMBS: $8.5 million |
 11
Portfolio Characteristics
Par Value
Fair Value
Weighted Average
Asset Type
(in thousands)
Cost/Par
Fair
Value/Par
MTR
(1)
Coupon
CPR
(2)
15-Year Fixed Rate
$4,033,535
$4,123,587
$102.21
$102.23
N/A
3.88%
11.0%
20-Year Fixed Rate
635,489
643,471
102.36
101.26
N/A
4.14%
3.9%
30-Year Fixed Rate
993,473
1,048,091
104.36
105.50
N/A
5.20%
33.2%
Hybrid ARMs
2,609,512
2,674,050
102.24
102.47
62.9
3.37%
14.40%
Total/Weighted Average
$8,272,009
$8,489,199
$102.49
$102.63
62.9
(3)
3.90%
11.4%
CYS Portfolio Characteristics*
(1)
“Months
to
Reset”
is
the
number
of
months
remaining
before
the
fixed
rate
on
a
hybrid
ARM
becomes
a
variable
rate.
At
the
end
of
the
fixed
period,
the
variable
rate
will be determined by the margin and the pre-specified caps of the ARM.
(2)
CPR is a method of expressing the prepayment rate for a mortgage pool that assumes
that a constant fraction of the remaining principal is prepaid each month or
year. Specifically, the constant prepayment rate is an annualized version of the
prior three month prepayment rate. Securities with no prepayment history are excluded
from this calculation.
(3)
Weighted average months to reset of our Hybrid ARM portfolio.
* As of 3/31/11 |
 12
History of Transparent and
Consistent Financial Reporting
CYS uses Financial Reporting for Investment Companies
CYS financial reporting -
Best in Class
Schedule of investments
NAVs have reflected mark-to-market accounting since inception
No OCI account on balance sheet
Realized and unrealized losses taken through income statement
Losses expensed in period incurred |
  13
Historical Financials
3/31/2011
12/31/2010
Income Statement Data (in 000's)
Investment Income – Interest Income
$40,980
$25,025
Total expenses
7,522
5,306
Net Investment Income
33,458
19,719
Net gain (loss) from investments
19,820
(66,125)
Net gain (loss) from swap and cap contracts
(1,181)
29,138
Net Income (Loss)
$52,097
($17,268)
Net Income (Loss) Per Common Share (diluted)
$0.74
($0.38)
Distributions per Common Share
$0.60
$0.60
Non-GAAP Measure (in 000's)
Core Earnings (1)
$21,599
$12,396
Non-GAAP Reconciliation (in 000's)
NET INCOME
$52,097
(17,268)
Net (gain) loss from investments
(19,820)
$66,125
Net (gain) loss on termination of swap contracts
-
$13,427
Net unrealized (appreciation) depreciation on swap and cap contracts
($10,678)
($49,888)
Core Earnings
$21,599
$12,396
Key Portfolio Statistics*
Average Yield on Agency RMBS (2)
3.27%
3.23%
Average Cost of Funds & Hedge (3)
1.44%
1.49%
Interest Rate Spread Net of Hedge (4)
1.83%
1.74%
Operating Expanse Ratio (5)
2.11%
2.28%
Leverage Ratio (at period end) (6)
8.1:1
8.3:1
Balance Sheet Data (in 000's)
3/31/2011
12/31/2010
Cash and Cash Equivalents
$6,001
$1,510
Total Assets
$8,787,632
$6,389,267
Repurchase Agreements
$5,364,030
$3,443,843
Net assets
$969,266
$690,339
Net assets per common share
$11.74
$11.59
Quarter Ended
As of
(1) Core Earnings is defined as net income (loss) excluding net realized gain (loss) on
investments, net unrealized appreciation (depreciation) on investments, net realized gain (loss) on termination of swap contracts and unrealized appreciation (depreciation) on swap and cap contracts.
(2) Our average yield on Agency RMBS for the period was calculated by dividing our interest
income from Agency RMBS by our average Agency RMBS. (3) Average cost of funds and hedge
for the period was calculated by dividing our total interest expense, including our net swap and cap interest income (expense), by our average repurchase agreements.
(4) Interest rate spread net of hedge for the period was calculated by subtracting our average
cost of funds and hedge from our average yield on Agency RMBS (5) Operating
expense ratio is calculated by dividing operating expenses by average net assets (6)
Leverage ratio was calculated by dividing total liabilities by net assets * All
percentages are annualized. |
 14
Financial Highlights
Steep yield curve and attractive spreads in target assets
Tailwinds likely to continue
Investment Company accounting provides transparency |
 Deutsche Bank Global Financial Services Investor Conference
June 8, 2011
Investment Outlook
June, 2011 |