Attached files
| file | filename |
|---|---|
| EX-10.2 - EX-10.2 - Calamos Asset Management, Inc. /DE/ | c64553exv10w2.htm |
| EX-31.2 - EX-31.2 - Calamos Asset Management, Inc. /DE/ | c64553exv31w2.htm |
| EX-32.1 - EX-32.1 - Calamos Asset Management, Inc. /DE/ | c64553exv32w1.htm |
| EX-31.1 - EX-31.1 - Calamos Asset Management, Inc. /DE/ | c64553exv31w1.htm |
| EX-32.2 - EX-32.2 - Calamos Asset Management, Inc. /DE/ | c64553exv32w2.htm |
Table of Contents
UNITED STATES
SECURITIES AND EXCHANGE COMMISSION
SECURITIES AND EXCHANGE COMMISSION
Washington, D.C. 20549
FORM 10-Q
| þ | QUARTERLY REPORT PURSUANT TO SECTION 13 OR 15(d) OF THE SECURITIES EXCHANGE ACT OF 1934 |
FOR THE QUARTERLY PERIOD ENDED: March 31, 2011
or
| o | TRANSITION REPORT PURSUANT TO SECTION 13 OR 15(d) OF THE SECURITIES EXCHANGE ACT OF 1934. |
Commission File Number: 000-51003
CALAMOS ASSET MANAGEMENT, INC.
(Exact Name of Registrant as Specified in its Charter)
| Delaware (State or Other Jurisdiction of Incorporation or Organization) |
32-0122554 (I.R.S. Employer Identification No.) |
|
| 2020 Calamos Court, Naperville, Illinois (Address of Principal Executive Offices) |
60563 (Zip Code) |
(630) 245-7200
(Registrant’s telephone number, including area code)
(Registrant’s telephone number, including area code)
Indicate by check mark whether the registrant (1) has filed all reports required to be filed by
Section 13 or 15(d) of the Securities Exchange Act of 1934 during the preceding 12 months (or for
such shorter period that the registrant was required to file such reports) and (2) has been subject
to such filing requirements for the past 90 days. þ Yes o No
Indicate by check mark whether the registrant has submitted electronically and posted on its
corporate Web site, if any, every Interactive Data File required to be submitted and posted
pursuant to Rule 405 of Regulation S-T (§232.405 of this chapter) during the preceding 12 months
(or for such shorter period that the registrant was required to submit and post such files). o Yes o No
Indicate by check mark whether the registrant is a large accelerated filer, an accelerated filer, a
non-accelerated filer, or a smaller reporting company. See the definitions of “large accelerated
filer,” “accelerated filer” and “smaller reporting company” in Rule 12b-2 of the Exchange Act.
| Large accelerated filer o | Accelerated filer þ | Non-accelerated filer o (Do not check if a smaller reporting company) | Smaller reporting company o |
Indicate by check mark whether the registrant is a shell company (as defined in Rule 12b-2 of
the Exchange Act). o Yes þ No
At
April 30, 2011, the company had 20,124,701 shares of Class A common stock and 100 shares of
Class B common stock outstanding.
TABLE OF CONTENTS
Table of Contents
PART I — FINANCIAL INFORMATION
Item 1. Financial Statements
CALAMOS ASSET MANAGEMENT, INC.
CONSOLIDATED STATEMENTS OF FINANCIAL CONDITION
(in thousands, except share data)
CONSOLIDATED STATEMENTS OF FINANCIAL CONDITION
(in thousands, except share data)
| March 31, | December 31, | |||||||
| 2011 | 2010 | |||||||
| (unaudited) | ||||||||
| ASSETS |
||||||||
Current assets: |
||||||||
Cash and cash equivalents |
$ | 78,540 | $ | 82,870 | ||||
Receivables: |
||||||||
Affiliates and affiliated funds |
21,316 | 19,320 | ||||||
Customers |
11,195 | 10,351 | ||||||
Investment securities |
349,151 | 314,215 | ||||||
Derivative assets |
1,952 | 4,026 | ||||||
Partnership investments, net |
22,678 | 41,678 | ||||||
Prepaid expenses |
4,504 | 3,087 | ||||||
Deferred tax assets, net |
9,410 | 8,757 | ||||||
Other current assets |
2,023 | 1,481 | ||||||
Total current assets |
500,769 | 485,785 | ||||||
Non-current assets: |
||||||||
Deferred tax assets, net |
63,598 | 66,960 | ||||||
Deferred sales commissions |
8,017 | 8,515 | ||||||
Property and equipment, net of accumulated depreciation ($48,661 at
March 31, 2011 and $47,512 at December 31, 2010) |
25,921 | 26,745 | ||||||
Other non-current assets |
1,174 | 1,241 | ||||||
Total non-current assets |
98,710 | 103,461 | ||||||
Total assets |
$ | 599,479 | $ | 589,246 | ||||
| LIABILITIES AND STOCKHOLDERS’ EQUITY |
||||||||
LIABILITIES |
||||||||
Current liabilities: |
||||||||
Distribution fees payable |
$ | 17,011 | $ | 16,560 | ||||
Accrued compensation and benefits |
8,769 | 21,411 | ||||||
Current portion of long-term debt |
32,885 | 32,885 | ||||||
Loans payable |
6,875 | — | ||||||
Interest payable |
1,972 | 3,026 | ||||||
Derivative liabilities |
571 | 5,918 | ||||||
Accrued expenses and other current liabilities |
5,348 | 3,906 | ||||||
Total current liabilities |
73,431 | 83,706 | ||||||
Long-term liabilities: |
||||||||
Long-term debt |
92,115 | 92,115 | ||||||
Deferred rent |
9,465 | 9,456 | ||||||
Other long-term liabilities |
428 | 577 | ||||||
Total long-term liabilities |
102,008 | 102,148 | ||||||
Total liabilities |
175,439 | 185,854 | ||||||
STOCKHOLDERS’ EQUITY |
||||||||
Class A
Common Stock, $0.01 par value; authorized 600,000,000 shares; 24,124,701
shares issued and 20,124,701 shares outstanding at March 31, 2011; 23,942,317
shares issued and 19,942,317 shares outstanding at December 31, 2010 |
241 | 239 | ||||||
Class B Common Stock, $0.01 par value; authorized 1,000 shares; 100 shares issued
and outstanding at March 31, 2011 and December 31, 2010 |
0 | 0 | ||||||
Additional paid-in capital |
212,914 | 212,256 | ||||||
Retained earnings |
62,590 | 59,895 | ||||||
Accumulated other comprehensive income |
7,796 | 5,841 | ||||||
Treasury stock at cost; 4,000,000 shares at March 31, 2011 and December 31, 2010 |
(95,215 | ) | (95,215 | ) | ||||
Calamos Asset Management, Inc. stockholders’ equity |
188,326 | 183,016 | ||||||
Non-controlling interest in Calamos Holdings LLC (Calamos Interests) |
235,714 | 218,679 | ||||||
Non-controlling interest in partnership investments |
— | 1,697 | ||||||
Total non-controlling interest |
235,714 | 220,376 | ||||||
Total stockholders’ equity |
424,040 | 403,392 | ||||||
Total liabilities and stockholders’ equity |
$ | 599,479 | $ | 589,246 | ||||
See accompanying notes to consolidated financial statements.
2
Table of Contents
CALAMOS ASSET MANAGEMENT, INC.
CONSOLIDATED STATEMENTS OF OPERATIONS
Three Months Ended March 31, 2011 and 2010
(in thousands, except share data)
(unaudited)
CONSOLIDATED STATEMENTS OF OPERATIONS
Three Months Ended March 31, 2011 and 2010
(in thousands, except share data)
(unaudited)
| 2011 | 2010 | |||||||
REVENUES |
||||||||
Investment management fees |
$ | 67,608 | $ | 58,570 | ||||
Distribution and underwriting fees |
22,112 | 21,835 | ||||||
Other |
828 | 725 | ||||||
Total revenues |
90,548 | 81,130 | ||||||
EXPENSES |
||||||||
Employee compensation and benefits |
20,632 | 20,132 | ||||||
Distribution expenses |
18,233 | 16,790 | ||||||
Amortization of deferred sales commissions |
1,748 | 2,566 | ||||||
Marketing and sales promotion |
3,439 | 2,732 | ||||||
General and administrative |
9,181 | 8,392 | ||||||
Total operating expenses |
53,233 | 50,612 | ||||||
Operating income |
37,315 | 30,518 | ||||||
NON-OPERATING INCOME |
||||||||
Net interest expense |
(1,895 | ) | (1,844 | ) | ||||
Investment and other income (loss) |
(1,627 | ) | 8,753 | |||||
Total non-operating income (loss) |
(3,522 | ) | 6,909 | |||||
Income before income tax provision |
33,793 | 37,427 | ||||||
Income tax provision |
2,907 | 3,222 | ||||||
Net income |
30,886 | 34,205 | ||||||
Net income attributable to non-controlling interest in Calamos Holdings LLC
(Calamos Interests) |
(26,249 | ) | (29,387 | ) | ||||
Net income attributable to non-controlling interest in partnership investments |
(5 | ) | (7 | ) | ||||
Net income attributable to Calamos Asset Management, Inc. |
$ | 4,632 | $ | 4,811 | ||||
Earnings per share: |
||||||||
Basic |
$ | 0.23 | $ | 0.24 | ||||
Diluted |
$ | 0.23 | $ | 0.24 | ||||
Weighted average shares outstanding: |
||||||||
Basic |
20,035,394 | 19,820,744 | ||||||
Diluted |
20,478,456 | 20,122,940 | ||||||
Cash dividends per share |
$ | 0.095 | $ | 0.075 | ||||
See accompanying notes to consolidated financial statements.
3
Table of Contents
CALAMOS ASSET MANAGEMENT, INC.
CONSOLIDATED STATEMENT OF CHANGES IN STOCKHOLDERS’ EQUITY
Three Months Ended March 31, 2011
(in thousands)
(unaudited)
CONSOLIDATED STATEMENT OF CHANGES IN STOCKHOLDERS’ EQUITY
Three Months Ended March 31, 2011
(in thousands)
(unaudited)
| Non- | ||||||||||||||||||||||||||||||||
| controlling | ||||||||||||||||||||||||||||||||
| interest in | ||||||||||||||||||||||||||||||||
| CALAMOS ASSET MANAGEMENT, INC. STOCKHOLDERS | Calamos | Non- | ||||||||||||||||||||||||||||||
| Accumulated | Holdings | controlling | ||||||||||||||||||||||||||||||
| Additional | Other | LLC | interest in | |||||||||||||||||||||||||||||
| Common | Paid-in | Retained | Comprehensive | Treasury | (Calamos | partnership | ||||||||||||||||||||||||||
| Stock | Capital | Earnings | Income | Stock | Interests) | investments | Total | |||||||||||||||||||||||||
Balance at Dec. 31, 2010 |
$ | 239 | $ | 212,256 | $ | 59,895 | $ | 5,841 | $ | (95,215 | ) | $ | 218,679 | $ | 1,697 | $ | 403,392 | |||||||||||||||
Net income |
— | — | 4,632 | — | — | 26,249 | 5 | 30,886 | ||||||||||||||||||||||||
Changes in unrealized
gains on available-for-
sale securities, net of
income taxes |
— | — | — | 2,112 | — | 12,148 | — | 14,260 | ||||||||||||||||||||||||
Reclassification adjustment for
realized gains on available-for-sale
securities included in income, net of
income taxes |
— | — | — | (228 | ) | — | (1,301 | ) | — | (1,529 | ) | |||||||||||||||||||||
Total comprehensive
income |
43,617 | |||||||||||||||||||||||||||||||
Issuance of common stock (182,384 Class
A common shares) |
2 | (2 | ) | — | — | — | — | — | — | |||||||||||||||||||||||
Cumulative impact of changes in
ownership of Calamos Holdings LLC |
— | 250 | (3 | ) | 71 | — | (1,344 | ) | — | (1,026 | ) | |||||||||||||||||||||
Compensation expense recognized under
stock incentive plans |
— | 410 | — | — | — | 1,470 | — | 1,880 | ||||||||||||||||||||||||
Dividend equivalent accrued under stock
incentive plans |
— | — | (22 | ) | — | — | (77 | ) | — | (99 | ) | |||||||||||||||||||||
Liquidation of Calamos Market Neutral
Opportunities Fund LP |
— | — | — | — | — | — | (1,702 | ) | (1,702 | ) | ||||||||||||||||||||||
Distribution to non-controlling interests |
— | — | — | — | — | (20,110 | ) | — | (20,110 | ) | ||||||||||||||||||||||
Dividends declared |
— | — | (1,912 | ) | — | — | — | — | (1,912 | ) | ||||||||||||||||||||||
Balance at March 31, 2011 |
$ | 241 | $ | 212,914 | $ | 62,590 | $ | 7,796 | $ | (95,215 | ) | $ | 235,714 | $ | — | $ | 424,040 | |||||||||||||||
See accompanying notes to consolidated financial statements.
4
Table of Contents
CALAMOS ASSET MANAGEMENT, INC.
CONSOLIDATED STATEMENTS OF CASH FLOWS
Three Months Ended March 31, 2011 and 2010
(in thousands)
(unaudited)
CONSOLIDATED STATEMENTS OF CASH FLOWS
Three Months Ended March 31, 2011 and 2010
(in thousands)
(unaudited)
| 2011 | 2010 | |||||||
Cash and cash equivalents at beginning of period |
$ | 82,870 | $ | 145,431 | ||||
Cash flows from operating activities: |
||||||||
Net income |
30,886 | 34,205 | ||||||
Adjustments to reconcile net income to net cash provided by
operating activities: |
||||||||
Amortization of deferred sales commissions |
1,748 | 2,566 | ||||||
Other depreciation and amortization |
1,480 | 2,457 | ||||||
Deferred rent |
9 | 33 | ||||||
Change in unrealized appreciation on CFS securities,
derivative assets, derivative liabilities and partnership
investments, net |
(3,274 | ) | (601 | ) | ||||
Net realized (gain) loss on sale of investment
securities, derivative assets and derivative liabilities |
5,769 | (7,104 | ) | |||||
Deferred taxes |
1,565 | 1,995 | ||||||
Stock based compensation |
1,880 | 2,381 | ||||||
Employee taxes paid on vesting under stock incentive plans |
(1,031 | ) | (1,017 | ) | ||||
Increase in assets: |
||||||||
Receivables: |
||||||||
Affiliates and affiliated funds, net |
(1,996 | ) | (1,245 | ) | ||||
Customers |
(844 | ) | (583 | ) | ||||
Deferred sales commissions |
(1,250 | ) | (1,802 | ) | ||||
Other assets |
(1,922 | ) | (687 | ) | ||||
Increase (decrease) in liabilities: |
||||||||
Distribution fees payable |
451 | 858 | ||||||
Accrued compensation and benefits |
(12,642 | ) | (9,140 | ) | ||||
Accrued expenses and other liabilities |
137 | (1,433 | ) | |||||
Net cash provided by operating activities |
20,966 | 20,883 | ||||||
Cash flows used in investing activities: |
||||||||
Net additions to property and equipment |
(626 | ) | (261 | ) | ||||
Purchase of investment securities |
(30,823 | ) | (119,657 | ) | ||||
Proceeds from sale of investment securities |
12,106 | 93,855 | ||||||
Net purchases of derivatives |
(9,381 | ) | (4,097 | ) | ||||
Net changes in partnership investments |
18,571 | (95 | ) | |||||
Net cash used in investing activities |
(10,153 | ) | (30,255 | ) | ||||
Cash flows used in financing activities: |
||||||||
Net proceeds from margin loans |
6,875 | — | ||||||
Deferred tax benefit on vesting under stock incentive plans |
4 | 57 | ||||||
Distributions paid to non-controlling interests |
(20,110 | ) | (19,633 | ) | ||||
Cash dividends paid to common stockholders |
(1,912 | ) | (1,481 | ) | ||||
Net cash used in financing activities |
(15,143 | ) | (21,057 | ) | ||||
Net decrease in cash |
(4,330 | ) | (30,429 | ) | ||||
Cash and cash equivalents at end of period |
$ | 78,540 | $ | 115,002 | ||||
Supplemental disclosure of cash flow information: |
||||||||
Cash paid for: |
||||||||
Income taxes, net |
$ | 1,266 | $ | 1,050 | ||||
Interest |
$ | 2,977 | $ | 2,977 | ||||
See accompanying notes to consolidated financial statements.
5
Table of Contents
CALAMOS ASSET MANAGEMENT, INC.
NOTES TO CONSOLIDATED FINANCIAL STATEMENTS
(unaudited)
NOTES TO CONSOLIDATED FINANCIAL STATEMENTS
(unaudited)
(1) Organization and Description of Business
Calamos Asset Management, Inc. (CAM) is a holding company and as of March 31, 2011 owned 21.9% of
Calamos Holdings LLC (Holdings), an intermediate holding company. CAM, together with Holdings
and Holdings’ subsidiaries (the Company), operates the investment advisory and distribution services
businesses reported within these consolidated financial statements. CAM operates and controls all
of the business and affairs of Holdings and, as a result of this control, consolidates the
financial results of Holdings with its own financial results. The remaining 78.1% ownership
interest in Holdings is held by Calamos Family Partners, Inc. (CFP) and John P. Calamos, Sr.
(collectively Calamos Interests), which interest in accordance with applicable rules, is reflected
and referred to within these consolidated financial statements as “non-controlling interests in
Calamos Holdings LLC”. As shown in the diagram below, CFP also owns all of CAM’s outstanding Class
B common stock, which represents 97.5% of the combined voting power of all classes of CAM’s voting
stock. The graphic below illustrates our organizational and ownership structure as of March 31,
2011:
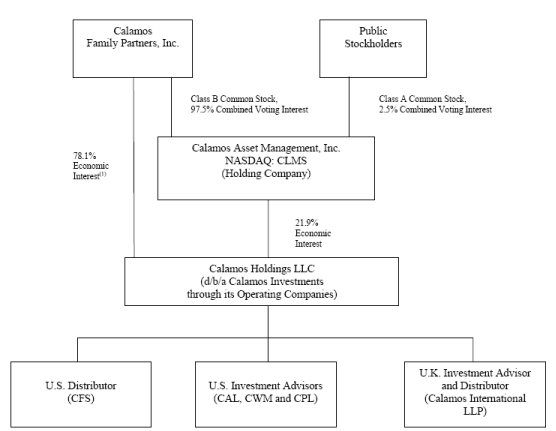
| (1) | Represents combined economic interest of Calamos Family Partners, Inc. and John P. Calamos, Sr. who is also a member of Calamos Holdings LLC. |
6
Table of Contents
CALAMOS ASSET MANAGEMENT, INC.
NOTES TO CONSOLIDATED FINANCIAL STATEMENTS
(unaudited)
NOTES TO CONSOLIDATED FINANCIAL STATEMENTS
(unaudited)
The Company primarily provides investment advisory services to individuals and institutional
investors through a series of investment products that include open-end mutual funds, closed-end
funds, separate accounts, offshore funds and partnerships. Collectively, we transact business under
the group trade name Calamos Investments. The subsidiaries through which the Company provides these
services include: Calamos Advisors LLC (CAL), a Delaware limited liability company and registered
investment advisor; Calamos Financial Services LLC (CFS), a Delaware limited liability company and
registered broker-dealer; Calamos Partners LLC (CPL), a Delaware limited liability company and
registered investment advisor; and Calamos Wealth Management LLC, a Delaware limited liability
company and registered investment advisor; and Calamos International LLP, a United Kingdom limited
liability partnership, registered investment advisor with the Financial Services Authority and a
distributor of the Offshore Funds and Company products globally.
(2) Basis of Presentation
The consolidated financial statements as of March 31, 2011 and for the three months ended March 31,
2011 and 2010 have not been audited by the Company’s independent registered public accounting firm.
In the opinion of management, these statements contain all adjustments, including those of a normal
recurring nature, necessary for fair presentation of the financial condition and results of
operations. The results for the interim periods presented are not necessarily indicative of the
results to be obtained for a full fiscal year. Certain amounts for the prior year have been
reclassified to conform to the current year’s presentation. This Form 10-Q filing should be read in
conjunction with the Company’s Annual Report on Form 10-K for the year ended December 31, 2010.
The Calamos Interests combined 78.1% and 78.3% interest in Holdings at March 31, 2011 and 2010,
respectively, is represented as non-controlling interest in Calamos Holdings LLC in the Company’s
financial statements. Non-controlling interest in Calamos Holdings LLC is derived by multiplying
the historical equity of Holdings by the Calamos Interests’ aggregate ownership percentage for the
periods presented. Issuances and repurchases of CAM’s common stock may result in changes to CAM’s
ownership percentage and to the non-controlling interests’ ownership percentage of Holdings. The
Company’s corresponding changes to stockholders’ equity are reflected in the consolidated statement
of changes in stockholders’ equity. Income is allocated to non-controlling interests based on the
average ownership interest during the period in which the income is earned.
CPL, a subsidiary of Holdings, was the general partner of Calamos Market Neutral Opportunities Fund
LP (the Partnership) a private investment partnership that was primarily comprised of highly liquid
marketable securities. During the first quarter of 2011 the Partnership was liquidated. Prior to
its liquidation, substantially all the activities of the Partnership were conducted on behalf of
the Company and its related parties; therefore, the Company consolidated the financial results of
the Partnership into its results.
For the periods presented prior to the liquidation of the Partnership, the assets and liabilities
of the Partnership are presented on a net basis as partnership investments in the consolidated
statements of financial condition, the net income is included in investment and other income in the
consolidated statements of operations, and the change in partnership investments is included in the
net changes in partnership investments in the consolidated statements of cash flows.
The Partnership is presented on a net basis in order to provide more clarity to the financial
position and results of the core operations of the Company. The underlying assets and liabilities
that are being consolidated are described in Note 5. The non-controlling interests of the
Partnership are presented as non-controlling interests in partnership investments in the respective
financial statements.
Management of the Company has made a number of estimates and assumptions relating to the reporting
of assets, liabilities, revenues and expenses and the disclosure of contingent assets and
liabilities to prepare these consolidated financial statements in conformity with accounting
principles generally accepted in the United States of America. Actual results could differ from
these estimates.
7
Table of Contents
CALAMOS ASSET MANAGEMENT, INC.
NOTES TO CONSOLIDATED FINANCIAL STATEMENTS
(unaudited)
NOTES TO CONSOLIDATED FINANCIAL STATEMENTS
(unaudited)
(3) Investment Securities
The following table provides a summary of investment securities owned as of March 31, 2011 and
December 31, 2010. As a registered broker-dealer, Calamos Financial Services LLC is required to
carry all investment securities it owns (CFS Securities) at fair value and record all changes in
fair value in current earnings. As such, unrealized gains and losses on CFS Securities, as well as
realized gains and losses on all investment securities, are included in investment and other income
(loss) in the consolidated statements of operations.
| March 31, 2011 | ||||||||||||||||
| Unrealized | Unrealized | |||||||||||||||
| (in thousands) | Cost | Gains | Losses | Fair Value | ||||||||||||
Available-for-sale securities: |
||||||||||||||||
Mutual Funds |
||||||||||||||||
Equity |
$ | 154,996 | $ | 42,843 | $ | (1 | ) | $ | 197,838 | |||||||
Fixed income |
84,460 | 475 | (110 | ) | 84,825 | |||||||||||
Low-volatility equity |
45,185 | 15,261 | — | 60,446 | ||||||||||||
Other |
1,602 | 75 | (202 | ) | 1,475 | |||||||||||
Total available-for-sale securities |
$ | 286,243 | $ | 58,654 | $ | (313 | ) | $ | 344,584 | |||||||
CFS securities: |
||||||||||||||||
Mutual Funds |
||||||||||||||||
Equity |
$ | 3,004 | $ | 1,426 | $ | — | $ | 4,430 | ||||||||
Common Stock |
56 | 81 | — | 137 | ||||||||||||
Total CFS securities |
$ | 3,060 | $ | 1,507 | $ | — | $ | 4,567 | ||||||||
Total investment securities |
$ | 349,151 | ||||||||||||||
8
Table of Contents
CALAMOS ASSET MANAGEMENT, INC.
NOTES TO CONSOLIDATED FINANCIAL STATEMENTS
(unaudited)
NOTES TO CONSOLIDATED FINANCIAL STATEMENTS
(unaudited)
| December 31, 2010 | ||||||||||||||||
| Unrealized | Unrealized | |||||||||||||||
| (in thousands) | Cost | Gains | Losses | Fair Value | ||||||||||||
Available-for-sale securities: |
||||||||||||||||
Mutual Funds |
||||||||||||||||
Equity |
$ | 129,280 | $ | 32,483 | $ | (3 | ) | $ | 161,760 | |||||||
Fixed income |
89,712 | 18 | (425 | ) | 89,305 | |||||||||||
Low-volatility equity |
45,219 | 12,580 | (1 | ) | 57,798 | |||||||||||
Other |
1,579 | 51 | (242 | ) | 1,388 | |||||||||||
Total available-for-sale securities |
$ | 265,790 | $ | 45,132 | $ | (671 | ) | $ | 310,251 | |||||||
CFS securities: |
||||||||||||||||
Mutual Funds |
||||||||||||||||
Equity |
$ | 3,004 | $ | 834 | $ | — | $ | 3,838 | ||||||||
Common Stock |
56 | 70 | — | 126 | ||||||||||||
Total CFS securities |
$ | 3,060 | $ | 904 | $ | — | $ | 3,964 | ||||||||
Total investment securities |
$ | 314,215 | ||||||||||||||
Of the $349.0 million and $314.1 million investments in mutual funds at March 31, 2011 and December
31, 2010, respectively, $304.8 million and $270.9 million were invested in affiliated mutual funds.
The aggregate fair value of available-for-sale investment securities that were in an unrealized
loss position at March 31, 2011 and December 31, 2010 was $30.7 million and $83.1 million,
respectively. The cumulative losses on securities that had been in a continuous loss position for
12 months or longer were immaterial as of the end of each reporting period.
At March 31, 2011 and December 31, 2010, the Company believes that the unrealized losses attributed
to its mutual fund investments are only temporary in nature, as these losses are a result of
short-term declines in the net asset value of the funds. Additionally, unrealized losses exist for
only a small portion of the overall available-for-sale investment securities. Further, the Company
has the intent and ability to hold these securities for a period of time sufficient to allow for
recovery of the market value.
The table below summarizes information on available-for-sale securities as well as unrealized gains
(losses) on CFS Securities for the three months ended March 31, 2011 and 2010.
| Three Months Ended March 31, | ||||||||
| (in thousands) | 2011 | 2010 | ||||||
Available-for-sale securities: |
||||||||
Proceeds from sale |
$ | 12,106 | $ | 93,855 | ||||
Gross realized gains on sales |
1,737 | 10,229 | ||||||
Unrealized gains |
15,544 | 5,308 | ||||||
Net gains reclassified out of
accumulated other comprehensive
income to earnings |
1,665 | 8,638 | ||||||
CFS securities: |
||||||||
Unrealized gains |
603 | 581 | ||||||
9
Table of Contents
CALAMOS ASSET MANAGEMENT, INC.
NOTES TO CONSOLIDATED FINANCIAL STATEMENTS
(unaudited)
NOTES TO CONSOLIDATED FINANCIAL STATEMENTS
(unaudited)
(4) Derivative Assets and Liabilities
In order to reduce the volatility in fair value of the Calamos corporate investment portfolio, the
Company uses exchange traded equity option contracts as an economic hedge against price changes in
its investment securities portfolio. The Company’s investment securities, totaling $349.2 million
at March 31, 2011, consists primarily of positions in several Calamos equity, fixed income and
low-volatility equity mutual funds. The equity price risk in the investment portfolio is hedged
using exchange-traded put and call option contracts on several major equity market indices that
correlate most closely with the change in value of the portfolio being hedged. The use of both
purchased put and sold call options is part of a single strategy to minimize downside risk in the
hedged portfolio, while participating in a portion of the upside of a market rally. The Company may
adjust its hedge position in response to movement and volatility in prices and changes in the
composition of the hedged portfolio, but generally is not actively buying and selling contracts.
The fair value of purchased puts and sold call contracts are reported in derivative assets and
derivative liabilities, respectively, in the consolidated statements of financial condition. Net
gains and losses on these contracts are reported in investment and other income in the consolidated
statements of operations with net losses of $6.1 million and $3.8 million for the three months
ended March 31, 2011 and 2010, respectively. The Company is using these derivatives for risk
management purposes but has not designated the contracts as hedges for accounting purposes.
(5) Partnership Investments
Presented below are the underlying assets and liabilities of the partnerships that the Company
reports on a net basis and the investments accounted for under the equity method. These investments
are presented as partnership investments, net in its consolidated statements of financial condition
as of March 31, 2011 and December 31, 2010.
| March 31, | December 31, | |||||||
| (in thousands) | 2011 | 2010 | ||||||
Calamos Market Neutral Opportunities Fund LP: |
||||||||
Deposits with broker |
$ | — | $ | 11,128 | ||||
Securities owned |
— | 16,365 | ||||||
Securities sold but not yet purchased |
— | (7,175 | ) | |||||
Accrued expenses and other current liabilities |
— | (62 | ) | |||||
Other current assets |
— | 69 | ||||||
Calamos Market Neutral Opportunities Fund LP, net |
— | 20,325 | ||||||
Investment in other partnerships |
22,678 | 21,353 | ||||||
Partnership investments, net |
$ | 22,678 | $ | 41,678 | ||||
During the first quarter of 2011, the Company liquidated the Partnership for total proceeds of
$18.6 million and realized capital gains of $1.4 million, net of non-controlling interests. At
December 31, 2010, the Company had a net interest of $18.6 million (91.6%) in the Partnership. At
December 31, 2010, the non-controlling interests of the Partnership totaled $1.7 million (8.4%) and
are presented in the consolidated statements of financial condition as non-controlling interest in
partnership investments.
As of March 31, 2011 and December 31, 2010, the Company held a non-controlling interest in certain
other partnership investments and accounted for these investments using the equity method. These
investments are presented collectively as investments in other partnerships in the table above.
10
Table of Contents
CALAMOS ASSET MANAGEMENT, INC.
NOTES TO CONSOLIDATED FINANCIAL STATEMENTS
(unaudited)
NOTES TO CONSOLIDATED FINANCIAL STATEMENTS
(unaudited)
(6) Fair Value Measurements
The Company utilizes a three-tier fair value hierarchy which prioritizes the inputs used in
measuring fair value as follows: Level 1 — observable inputs such as quoted prices in active
markets; Level 2 — inputs, other than the quoted prices in active markets, that are observable
either directly or indirectly (including quoted prices of similar securities, interest rates,
credit risk, etc.); and Level 3 — unobservable inputs in which there is little or no market data,
and require the reporting entity to develop its own assumptions. For each period presented, the
Company did not have any positions in Level 3 securities and did not have any transfers between the
levels.
Investments are presented in the consolidated financial statements at fair value in accordance with
accounting principles generally accepted in the United States of America. Investments in mutual
funds are stated at fair value based on end of day published net asset values of shares owned by
the Company. Investments in securities traded on a national securities exchange are stated at the
last reported sales price on the day of valuation. Other securities, including derivatives, traded
in the over-the-counter market and listed securities for which no sale was reported on that date
are stated at the last quoted bid price. However, short sales positions and call options written
are reported at the last quoted asked price. Convertible bonds and other securities for which
quotations are not readily available are valued at fair value based on observable inputs such as
market prices for similar instruments as validated by third party pricing agencies and the
Company’s prime broker.
The following tables provide the hierarchy of inputs used to derive the fair value of the Company’s
investment securities, derivative assets and liabilities, securities and derivatives owned and
securities sold but not yet purchased by the Partnership and derivative liabilities of the
Partnership as of March 31, 2011 and December 31, 2010, respectively. Foreign currency contracts
are presented on a net basis where the right of offset exists, and no impact of these positions
exists for either period presented.
| Fair Value Measurements Using | ||||||||||||
| Quoted Prices | ||||||||||||
| in Active | Significant | |||||||||||
| Markets for | Other | |||||||||||
| Identical Assets | Observable | |||||||||||
| (in thousands) | March 31, | and Liabilities | Inputs | |||||||||
| Description | 2011 | (Level 1) | (Level 2) | |||||||||
Cash and cash equivalents |
||||||||||||
Money market funds |
$ | 33,982 | $ | 33,982 | $ | — | ||||||
Investment securities (Note 3) |
||||||||||||
Mutual Funds |
||||||||||||
Equity |
202,268 | 202,268 | — | |||||||||
Fixed income |
84,825 | 84,825 | — | |||||||||
Low-volatility equity |
60,446 | 60,446 | — | |||||||||
Other |
1,475 | 1,475 | — | |||||||||
Total mutual funds |
349,014 | 349,014 | — | |||||||||
Common stock |
137 | 137 | — | |||||||||
| 349,151 | 349,151 | — | ||||||||||
Derivative assets (Note 4) |
||||||||||||
Exchange-traded put option contracts |
1,952 | 1,952 | — | |||||||||
Derivative liabilities (Note 4) |
||||||||||||
Exchange-traded call option contracts |
(571 | ) | (571 | ) | — | |||||||
Total |
$ | 384,514 | $ | 384,514 | $ | — | ||||||
11
Table of Contents
CALAMOS ASSET MANAGEMENT, INC.
NOTES TO CONSOLIDATED FINANCIAL STATEMENTS
(unaudited)
NOTES TO CONSOLIDATED FINANCIAL STATEMENTS
(unaudited)
| Fair Value Measurements Using | ||||||||||||
| Quoted Prices | ||||||||||||
| in Active | Significant | |||||||||||
| Markets for | Other | |||||||||||
| Identical Assets | Observable | |||||||||||
| (in thousands) | December 31, | and Liabilities | Inputs | |||||||||
| Description | 2010 | (Level 1) | (Level 2) | |||||||||
Cash and cash equivalents |
||||||||||||
Money market funds |
$ | 35,392 | $ | 35,392 | $ | — | ||||||
Investment securities (Note 3) |
||||||||||||
Mutual Funds |
||||||||||||
Equity |
165,598 | 165,598 | — | |||||||||
Fixed income |
89,305 | 89,305 | — | |||||||||
Low-volatility equity |
57,798 | 57,798 | — | |||||||||
Other |
1,388 | 1,388 | — | |||||||||
Total mutual funds |
314,089 | 314,089 | — | |||||||||
Common stock |
126 | 126 | — | |||||||||
| 314,215 | 314,215 | — | ||||||||||
Derivative assets (Note 4) |
||||||||||||
Exchange-traded put option contracts |
4,026 | 4,026 | — | |||||||||
Derivative liabilities (Note 4) |
||||||||||||
Exchange-traded call option contracts |
(5,918 | ) | (5,918 | ) | — | |||||||
Securities and derivatives owned by the
Partnership (Note 5) |
||||||||||||
Convertible bonds |
16,140 | — | 16,140 | |||||||||
Purchased options |
145 | 145 | — | |||||||||
Common stocks |
80 | 80 | — | |||||||||
| 16,365 | 225 | 16,140 | ||||||||||
Securities sold but not yet purchased
of the Partnership (Note 5) |
||||||||||||
Common stocks |
(7,165 | ) | (7,165 | ) | — | |||||||
Exchange-traded call option contracts |
(10 | ) | (10 | ) | — | |||||||
| (7,175 | ) | (7,175 | ) | — | ||||||||
Total |
$ | 356,905 | $ | 340,765 | $ | 16,140 | ||||||
(7) Fair Value of Financial Instruments
The fair value of long-term debt, which has a carrying value of $125 million, was approximately
$139.3 million at March 31, 2011. Fair value estimates are calculated using discounted cash flows
based on the Company’s incremental borrowing rates for the debt and market prices for similar bonds
at the measurement date. This method of assessing fair value may differ from the actual amount
realized.
12
Table of Contents
CALAMOS ASSET MANAGEMENT, INC.
NOTES TO CONSOLIDATED FINANCIAL STATEMENTS
(unaudited)
NOTES TO CONSOLIDATED FINANCIAL STATEMENTS
(unaudited)
The carrying value of all other financial instruments approximates fair value due to the short
maturities of these financial instruments.
(8) Loans Payable
The Company utilizes margin loans for the settlement of call options, as well as an additional
source of liquidity. The interest rate charged on the margin loans at March 31, 2011 was 2.5% per
annum. These loans are due on demand. At March 31, 2011, the margin loans amounted to $6.9
million and are collateralized by a portion of the Company’s investment securities. The Company
can borrow up to 70% of its marginable securities on deposit with its brokerage firm.
(9) Stock Based Compensation
Under the Company’s incentive compensation plan, certain employees of the Company receive stock
based compensation comprised of stock options and restricted stock units (RSUs). Historically, RSUs
have been settled with newly issued shares so that no cash was used by the Company to settle
awards; however, the Company may also use treasury shares or issue new shares upon the exercise of
stock options and upon conversion of RSUs. The Company’s Annual Report on Form 10-K for the year
ended December 31, 2010 provides details of this plan and its provisions.
During the three months ended March 31, 2011, there were no stock options or RSUs granted. There
were forfeitures of 43,621 stock options and 33,859 RSUs during the quarter.
During the three months ended March 31, 2011, 242,631 RSUs vested with 60,247 units withheld for
taxes and 182,384 RSUs converted into an equal number of shares of CAM’s Class A common stock. The
total intrinsic value and the fair value of the converted shares was $3.1 million. The total tax
benefit realized in connection with the vesting of the RSUs during the three months ended March 31,
2011 was $353,000, as the Company receives tax benefits based upon the portion of Holdings’ income
that it recognizes.
During the three months ended March 31, 2011, compensation expense recorded in connection with the
RSUs and stock options was $1.9 million of which $410,000, after giving effect to the
non-controlling interests, was credited as additional paid-in capital. During the three months
ended March 31, 2010, expense recorded in connection with the RSUs and stock options was $2.4
million of which $515,000, after giving effect to the non-controlling interests, was credited as
additional paid-in capital. The amount of deferred tax asset created was approximately $152,000 and
$191,000 during the three months ended March 31, 2011 and 2010, respectively. At March 31, 2011,
approximately $15.6 million of total unrecognized compensation expense related to unvested stock
option and RSU awards is expected to be recognized over a weighted-average period of 3.2 years.
(10) Non-operating Income (Loss)
Non-operating income (loss) was comprised of the following components for the three months ended
March 31, 2011 and 2010:
| Three Months Ended | ||||||||
| March 31, | ||||||||
| (in thousands) | 2011 | 2010 | ||||||
Interest income |
$ | 69 | $ | 106 | ||||
Interest expense |
(1,964 | ) | (1,950 | ) | ||||
Net interest expense |
(1,895 | ) | (1,844 | ) | ||||
Investment income (loss) |
(1,664 | ) | 8,602 | |||||
Miscellaneous other income |
37 | 151 | ||||||
Investment and other income (loss) |
(1,627 | ) | 8,753 | |||||
Non-operating income (loss) |
(3,522 | ) | 6,909 | |||||
13
Table of Contents
CALAMOS ASSET MANAGEMENT, INC.
NOTES TO CONSOLIDATED FINANCIAL STATEMENTS
(unaudited)
NOTES TO CONSOLIDATED FINANCIAL STATEMENTS
(unaudited)
(11) Income Taxes
Holdings is subject to certain income-based state taxes; therefore, income taxes reflect not only
the portion attributed to CAM stockholders but also a portion of income taxes attributable to
non-controlling interests. CAM’s effective income tax rate for the three months ended March 31,
2011 and March 31, 2010 was approximately 37.3% and 37.6%, respectively.
| Three Months Ended | ||||||||
| March 31, | ||||||||
| (in thousands) | 2011 | 2010 | ||||||
Income tax provision |
$ | 2,907 | $ | 3,222 | ||||
Income tax provision attributable to
non-controlling interest in Calamos Holdings
LLC |
(153 | ) | (321 | ) | ||||
Income tax provision attributable
to CAM |
2,754 | 2,901 | ||||||
Net income attributable to CAM |
4,632 | 4,811 | ||||||
Income before taxes attributable to CAM |
$ | 7,386 | $ | 7,712 | ||||
CAM’s effective income tax rate |
37.3 | % | 37.6 | % | ||||
(12) Earnings Per Share
The following table reflects the calculation of basic and diluted earnings per share:
| Three Months Ended | ||||||||
| March 31, | ||||||||
| (in thousands, except per share data) | 2011 | 2010 | ||||||
Earnings per share — basic |
||||||||
Earnings available to common shareholders |
$ | 4,632 | $ | 4,811 | ||||
Weighted average shares outstanding |
20,035 | 19,821 | ||||||
Earnings per share — basic |
$ | 0.23 | $ | 0.24 | ||||
Earnings per share — diluted |
||||||||
Earnings available to common shareholders |
$ | 4,632 | $ | 4,811 | ||||
Weighted average shares outstanding |
20,035 | 19,821 | ||||||
Dilutive impact of restricted stock units |
443 | 302 | ||||||
Weighted average diluted shares outstanding |
20,478 | 20,123 | ||||||
Earnings per share — diluted |
$ | 0.23 | $ | 0.24 | ||||
Diluted shares outstanding are calculated (a) assuming the Calamos Interests exchanged all of their
ownership interest in Holdings and their CAM Class B common stock for shares of CAM’s Class A
common stock (collectively, the Exchange) and (b) including the effect of outstanding dilutive
equity incentive compensation awards.
The Company uses the treasury stock method to reflect the dilutive effect of unvested RSUs and
unexercised stock options on diluted earnings per share. Under the treasury stock method, if the
average market price of common stock increases above the option’s exercise price, the proceeds that
would be assumed to be realized from the exercise of the option would be used to acquire
outstanding shares of common stock. However, the awards may be anti-dilutive even when the market
price of the underlying stock exceeds the option’s exercise price. This result is possible because
compensation cost attributed to future services and not yet recognized is included as a component
of the assumed proceeds upon exercise. The dilutive effect of such options and RSUs would increase
the weighted average number of shares used in the calculation of diluted earnings per share.
Effective March 1, 2009, the Company amended its certificate of incorporation requiring that the
Exchange be based on a fair value approach (details of the amendment are set forth in the Company’s
Schedule 14C filed with the Securities and
14
Table of Contents
CALAMOS ASSET MANAGEMENT, INC.
NOTES TO CONSOLIDATED FINANCIAL STATEMENTS
(unaudited)
NOTES TO CONSOLIDATED FINANCIAL STATEMENTS
(unaudited)
Exchange Commission on January 12, 2009). The amendment results in the same or fewer shares of
Class A common stock being issued at the time of the Exchange. The effects of the Exchange are
anti-dilutive and are therefore excluded from the calculation of diluted earnings per share for the
three months ended March 31, 2011 and 2010.
The shares issued upon Exchange as presented below are estimated solely on the formula as described
in the Schedule 14C that does not necessarily reflect all inputs used in a fair valuation. It is
critical to note that this formula does not incorporate certain economic factors and as such, in
the event of an actual Exchange, the majority of the Company’s independent directors may determine
the fair market value of CAM’s net assets and its ownership in Holdings. For example, discounts
and\or premiums for control and marketability as well as a different discount rate for future cash
flows may be applied. Therefore, the directors’ valuation may result in the actual number of
shares being materially different from the shares presented below. Further, based upon currently
available
information, we believe it is extremely remote that any Exchange would transpire without a fair
market valuation of CAM’s net assets.
The following table shows the number of shares which were excluded from the computation of diluted
earnings per share as they were anti-dilutive:
| Three Months Ended | ||||||||
| March 31, | ||||||||
| 2011 | 2010 | |||||||
Exchange of Calamos Interests’ ownership
interest in Holdings for shares of Class A
common stock |
51,451,838 | 52,506,228 | ||||||
Restricted stock units |
— | 44,083 | ||||||
Stock options |
2,368,245 | 2,452,653 | ||||||
Total |
53,820,083 | 55,002,964 | ||||||
The maximum number of shares of Class A common stock that could be issued to the Calamos Interests’
upon exchange is 71,931,522 at March 31, 2011.
15
Table of Contents
Item 2. Management’s Discussion and Analysis of Financial Condition and Results of
Operations
We are a firm of 318 full-time associates that provides investment advisory services to
institutions and individuals, managing $38.0 billion in assets at March 31, 2011. Our operating
results fluctuate primarily due to changes in the total value and composition of our assets under
management. The value and composition of our assets under management are, and will continue to be,
influenced by a variety of factors, including purchases and redemptions of shares of mutual funds
and net inflows into and withdrawals from separate accounts that we manage, fluctuations in the
financial markets around the world that result in appreciation or depreciation of assets under
management and the number and types of our investment strategies and products.
We market our investment strategies to our clients through a variety of products designed to suit
their investment needs. We currently categorize the portfolios that we manage within four
investment product types captured in our investment companies and separate accounts. The following
table lists our assets under management by product at March 31, 2011 and 2010.
| March 31, | ||||||||
| (in millions) | 2011 | 2010 | ||||||
Investment Companies |
||||||||
Open-end mutual funds |
$ | 23,575 | $ | 19,959 | ||||
Closed-end funds |
5,506 | 5,081 | ||||||
Total investment companies |
29,081 | 25,040 | ||||||
Separate Accounts |
||||||||
Institutional accounts |
6,179 | 5,047 | ||||||
Managed accounts |
2,701 | 2,876 | ||||||
Total separate accounts |
8,880 | 7,923 | ||||||
Total Assets Under Management |
$ | 37,961 | $ | 32,963 | ||||
Our revenues are substantially comprised of investment management fees earned under contracts with
the investment companies and separate accounts that we manage. Our revenues are also comprised of
distribution and underwriting fees, including asset-based distributions and/or service fees
received pursuant to Rule 12b-1 plans. Investment management fees and distribution and underwriting
fees may fluctuate based on a number of factors, including the total value and composition of our
assets under management, market appreciation or depreciation and the level of net inflows and
outflows, which represent the sum of new client investments, additional funding from existing
clients, withdrawals of assets from and termination of client accounts, and purchases and
redemptions of mutual fund shares. The mix of assets under management among our investment products
also has an impact on our revenues as our fee schedules vary by product.
Our largest operating expenses are typically related to employee compensation and benefits expense,
which includes salaries, incentive compensation and related benefits costs, the distribution of
mutual funds, including Rule 12b-1 payments, marketing and sales promotion expenses and the
amortization of deferred sales commissions for open-end mutual funds. Operating expenses may
fluctuate due to a number of factors, including changes in distribution expense as a result of
fluctuations in mutual fund net sales and market appreciation or depreciation, variations in
staffing and compensation, and marketing-related expenses that include supplemental distribution
payments.
16
Table of Contents
Operating Results
Three Months Ended March 31, 2011 Compared to Three Months Ended March 31, 2010
Assets Under Management
Assets under management increased by $5.0 billion, or 15%, to $38.0 billion at March 31, 2011 from
$33.0 billion at March 31, 2010. Our assets under management consisted of 77% investment companies
and 23% separate accounts at March 31, 2011 and 76% investment companies and 24% separate accounts
at March 31, 2010.
| Three Months Ended March 31, | Change | |||||||||||||||
| ( in millions) | 2011 | 2010 | Amount | Percent | ||||||||||||
Total Investment Companies |
||||||||||||||||
Beginning assets under management |
$ | 27,352 | $ | 24,480 | $ | 2,872 | 12 | % | ||||||||
Net purchases (redemptions) |
346 | (32 | ) | 378 | * | |||||||||||
Market appreciation |
1,383 | 592 | 791 | 134 | ||||||||||||
Ending assets under management |
29,081 | 25,040 | 4,041 | 16 | ||||||||||||
Average assets under management |
28,367 | 24,347 | 4,020 | 17 | ||||||||||||
Institutional |
||||||||||||||||
Beginning assets under management |
5,559 | 4,619 | 940 | 20 | % | |||||||||||
Net inflows |
254 | 259 | (5 | ) | 2 | |||||||||||
Market appreciation |
366 | 169 | 197 | 117 | ||||||||||||
Ending assets under management |
6,179 | 5,047 | 1,132 | 22 | ||||||||||||
Average assets under management |
5,815 | 4,722 | 1,093 | 23 | ||||||||||||
Managed Accounts |
||||||||||||||||
Beginning assets under management |
2,503 | 3,615 | (1,112 | ) | 31 | % | ||||||||||
Net inflows (outflows) |
18 | (774 | ) | 792 | * | |||||||||||
Market appreciation |
180 | 35 | 145 | 414 | ||||||||||||
Ending assets under management |
2,701 | 2,876 | (175 | ) | 6 | |||||||||||
Average assets under management |
2,598 | 3,279 | (681 | ) | 21 | |||||||||||
Total Assets Under Management |
||||||||||||||||
Beginning assets under management |
35,414 | 32,714 | 2,700 | 8 | % | |||||||||||
Net inflows (outflows) |
618 | (547 | ) | 1,165 | * | |||||||||||
Market appreciation |
1,929 | 796 | 1,133 | 142 | ||||||||||||
Ending assets under management |
37,961 | 32,963 | 4,998 | 15 | ||||||||||||
Average assets under management |
$ | 36,780 | $ | 32,348 | $ | 4,432 | 14 | |||||||||
| * | Not meaningful. |
During the first quarter of 2011, net purchases in the investment companies that we manage
were $346 million and represent a favorable change of $378 million from net redemptions of $32
million in the first quarter of 2010. The improvement in net flows was primarily due to increased
net purchases within our low-volatility equity and global mutual funds, as well as a significant
decrease in net redemptions from our Growth Fund. During the most recent quarter, we generated
positive net purchases in twelve of our mutual funds, including all five of our Dublin-based UCITS,
which collectively added $115 million during the quarter. This improvement in net purchases was
tempered by net redemptions in our Convertible Fund and a significant reduction in net purchases
into our Market Neutral Income Fund as both funds were closed to new investors in January 2011.
Assets under management within our investment companies were positively impacted by market
appreciation of $1.4 billion during the three months ended March 31, 2011 compared to market
appreciation of $592 million during the three months ended March 31, 2010.
During the first quarter of 2011, net inflows of $272 million increased assets under management
within our separate accounts, which are comprised of institutional and managed accounts. Net
outflows were $515 million for the comparable prior-year period. The current quarter improvement
is mostly due to positive net inflows into our managed accounts of $18 million for the first
quarter 2011 compared to the $774 million of outflows in the first quarter of 2010 that stemmed
from our decision to increase the account minimums for our convertible-based strategies on
separately-managed account platforms. Our institutional strategies continue to garner strong
interest with $254 million of net inflows for the quarter,
17
Table of Contents
especially abroad where we won our first large investment mandate in Asia. Market appreciation
increased these assets under management by $546 million during the current quarter.
Financial Overview
| Three Months Ended March 31, | Change | |||||||||||||||
| (in thousands, except margin) | 2011 | 2010 | Amount | Percent | ||||||||||||
Operating income |
$ | 37,315 | $ | 30,518 | $ | 6,797 | 22 | % | ||||||||
Operating margin |
41.2 | % | 37.6 | % | 3.6 | % | 10 | % | ||||||||
Net income attributable to Calamos
Asset Management, Inc. |
$ | 4,632 | $ | 4,811 | $ | (179 | ) | (4 | )% | |||||||
Operating results were strong during the first quarter. Operating income of $37.3 million increased
by $6.8 million, or 22% from the prior year. Operating margin for the current quarter increased to
41.2% from 37.6% from the first quarter 2010. Despite these strong operating results, net income
decreased slightly because non-operating activities resulted in current period losses of $3.5
million compared with gains of $6.9 million last year. For the three months ended March 31, 2011
non-operating losses reflect decreases in security valuations on derivatives used as an economic
hedge to price changes in our corporate investment portfolio. Unlike the changes in the security
prices for the investment securities being hedged, price changes in the derivatives impact current
period earnings.
In order to gather assets under management, we engage in distribution and underwriting activities,
principally with respect to our family of open-end mutual funds. When analyzing our business, we
consider the result of these distribution activities as a net amount of revenue as they are
typically a result of a single open-end mutual fund share purchase. Hence, the result of presenting
this information in accordance with generally accepted accounting principles is a reduction to our
overall operating margin, as the margin on distribution activities is generally lower than the
margins on the remainder of our business. The following table summarizes the net distribution fee
margin for the three months ended March 31, 2011 and 2010:
| Three Months Ended March 31, | ||||||||
| (in thousands) | 2011 | 2010 | ||||||
Distribution and underwriting fees |
$ | 22,112 | $ | 21,835 | ||||
Distribution expenses |
(18,233 | ) | (16,790 | ) | ||||
Amortization of deferred sales commissions |
(1,748 | ) | (2,566 | ) | ||||
Net distribution fees |
$ | 2,131 | $ | 2,479 | ||||
Net distribution fee margin |
10 | % | 11 | % | ||||
Net distribution fee margin varies by share class because each share class has different
distribution and underwriting activities, which are described in our 2010 Annual Report on Form
10-K. Distribution fee revenues and expenses vary with our average assets under management while
deferred sales commissions are typically amortized on a straight-line basis with adjustments made
upon redemption of existing assets. As a result, in periods of declining assets under management,
our distribution margin will be more severely impacted by amortization expense.
18
Table of Contents
Revenues
Total revenues increased by $9.4 million, or 12%, to $90.5 million for the three months ended March
31, 2011 from $81.1 million for the comparable prior-year period. The increase was primarily due to
higher investment management fees and distribution and underwriting fees.
| Three Months Ended March 31, | Change | |||||||||||||||
| (in thousands) | 2011 | 2010 | Amount | Percent | ||||||||||||
Investment management fees |
$ | 67,608 | $ | 58,570 | $ | 9,038 | 15 | % | ||||||||
Distribution and underwriting fees |
22,112 | 21,835 | 277 | 1 | ||||||||||||
Other |
828 | 725 | 103 | 14 | ||||||||||||
Total revenues |
$ | 90,548 | $ | 81,130 | $ | 9,418 | 12 | % | ||||||||
Investment management fees increased 15% in the first quarter of 2011 primarily due to a $4.4
billion, or 14%, increase in average assets under management across all products for the first
quarter of 2011 versus 2010. Investment management fees from open-end mutual funds increased to
$43.4 million for the recent quarter from $36.5 million for the prior-year period, driven by a $3.6
billion increase in open-end mutual fund average assets under management. Investment management
fees from our closed-end funds increased to $12.1 million for the first quarter of 2011 from $11.0
million last year, due to a $449 million increase in closed-end fund average assets under
management. Investment management fees from our separately managed accounts increased to $12.1
million for the first quarter of 2011 from $11.1 million in the prior year again due to a $412
million increase in average assets under management. Investment management fee rate that we earned
as a percentage of average assets under management was approximately 0.75% for the quarter of 2011
compared to 0.73% for the first quarter of 2010.
Distribution and underwriting fees were little changed for the three months ended March 31, 2011.
Distribution and underwriting fees are comprised of asset-based distribution fees received from our
family of mutual funds, front-end sales charges on sales of Class A mutual fund shares and
contingent deferred sales charges received on certain redemptions from Class B and Class C mutual
fund shares. The increase of $277,000 from the prior quarter represents an increase in asset-based
distribution fees, offset by a decrease in contingent deferred sales charges that we earned from
Class B shares redemptions. The fee rate earned on contingent deferred sales charges decreases with
the average age of the Class B share asset and expires after 6 years. Given that Class B shares
are closed to new investors, the average age of the Class B shares will continue to increase over
time and will reduce future rates we receive from contingent deferred sales charges. Consistent
with a trend that began in 2010, the percentage of Class I shares continues to increase. Because
we do not earn distribution fees from Class I share assets under management, changes in asset-based
distribution fees are not expected to be as sensitive to changes in the level of average mutual
fund assets under management.
Operating Expenses
Operating expenses increased by $2.6 million to $53.2 million for the three months ended March 31,
2011 from $50.6 million in the prior-year period reflecting increased employee compensation and
asset-related expenses, and reduced amortization of deferred sales commissions.
| Three Months Ended March 31, | Change | |||||||||||||||
| (in thousands) | 2011 | 2010 | Amount | Percent | ||||||||||||
Employee compensation and benefits |
$ | 20,632 | $ | 20,132 | $ | 500 | 2 | % | ||||||||
Distribution expenses |
18,233 | 16,790 | 1,443 | 9 | ||||||||||||
Amortization of deferred sales
commissions |
1,748 | 2,566 | (818 | ) | (32 | ) | ||||||||||
Marketing and sales promotion |
3,439 | 2,732 | 707 | 26 | ||||||||||||
General and administrative |
9,181 | 8,392 | 789 | 9 | ||||||||||||
Total operating expenses |
$ | 53,233 | $ | 50,612 | $ | 2,621 | 5 | % | ||||||||
Employee compensation and benefits expenses increased by $500,000 to $20.6 million for first
quarter 2011 when compared to the same period a year ago. Performance-related incentive compensation
accruals, which are based on our
19
Table of Contents
operating results, relative investment performance and the growth in our assets under management,
among others, were the cause to the increase in expenses.
Distribution expenses increased by $1.4 million, or 9%, for the first quarter of 2011 when compared
to the prior-year period. Increases in asset-based Rule 12b-1 expenses and in the age of Class C
mutual fund share assets are the cause for the change in the period. As discussed previously, there
are no distribution revenues or expenses associated with Class I mutual fund shares. Because the
percentage of Class I shares has been increasing during the comparable periods, the increase in
distribution expenses trails the increase in average mutual fund assets under management. We
expect this trend to continue.
Amortization of deferred sales commissions decreased to $1.7 million for the three months ended
March 31, 2011 when compared to the first quarter of 2010, mainly due to discontinuing Class B
share mutual fund sales during 2009. We expect amortization expense associated with Class B shares
deferred sales commissions to continue to decrease until these assets fully convert to Class A
shares eight years after the purchase date.
Marketing and sales promotion increased by $707,000 to $3.4 million for the three months ended
March 31, 2011 when compared to the same period a year ago. Two items contributed to the increased
spending are supplemental distribution payments to intermediaries, which are positively correlated
with the levels mutual fund assets that we manage, and selective advertising campaigns used to
build awareness about our growth and low-volatility equity strategies.
For the three months ending March 31, 2011, general and administrative expenses were up 9% to $9.2
million due to professional services expenses related to outsourcing our middle- and back-office
operations functions and to various legal proceedings. As this outsourcing initiative nears
completion in 2011, we expect professional services to vary based upon the level of assets under
management and the number of portfolios that we manage. Depreciation expenses associated with
occupying our facilities dropped by nearly $1.0 million from the prior year period as new purchases
associated with the construction and occupancy of our headquarters have been fully depreciated.
Non-operating Activities, Net of Non-controlling Interest in Partnership Investments
The following table summarizes our non-operating activities, net of non-controlling interest in
partnership investments for the three months ended March 31, 2011 and 2010:
| Three Months Ended March 31, | ||||||||||||
| (in thousands) | 2011 | 2010 | Change | |||||||||
Interest income |
$ | 69 | $ | 106 | $ | (37 | ) | |||||
Interest expense |
(1,964 | ) | (1,950 | ) | (14 | ) | ||||||
Net interest expense |
(1,895 | ) | (1,844 | ) | (51 | ) | ||||||
Investment income (loss) |
(1,664 | ) | 8,602 | (10,266 | ) | |||||||
Miscellaneous other income |
37 | 151 | (114 | ) | ||||||||
Investment and other income (loss) |
(1,627 | ) | 8,753 | (10,380 | ) | |||||||
Non-operating income |
(3,522 | ) | 6,909 | (10,431 | ) | |||||||
Net income attributable to non-controlling
interest in partnership investments |
(5 | ) | (7 | ) | 2 | |||||||
Non-operating income (loss), net of non-
controlling interest in partnerships |
$ | (3,527 | ) | $ | 6,902 | $ | (10,429 | ) | ||||
Non-operating activities decreased income by $3.5 million for the three months ended March 31, 2011
and increased income by $6.9 million for the prior-year quarter. Interest expense increased
slightly in the current quarter as we used proceeds from a margin loan as a short-term source of
liquidity. Investment income (loss) decreased significantly for the period ending March 31, 2011.
The investment loss of $1.7 million for the three months ended March 31, 2011 was most
significantly impacted by $6.1 million in net losses on equity option contracts that serve to hedge
our corporate investment portfolio. For the three months ended March 31, 2010, investment income
was mostly comprised of $10.2 million in realized gains from the sale of securities from our
corporate investment portfolio.
The following table provides a summary of the total returns generated on our corporate investment
portfolio by combining investment income, which is a component of our non-operating income, with
the changes in fair value of certain
20
Table of Contents
investment securities that are recorded in accumulated other comprehensive income, which is a
component of stockholders’ equity, for the three months ended March 31, 2011:
| Three Months Ended March 31, 2011 | ||||||||||||
| Change in | ||||||||||||
| Accumulated | ||||||||||||
| Other | ||||||||||||
| Non-Operating | Comprehensive | |||||||||||
| (in thousands) | Income | Income | Total | |||||||||
Mutual funds and common stock |
$ | 3,160 | $ | 13,879 | $ | 17,039 | ||||||
Partnership investments |
1,284 | — | 1,284 | |||||||||
Equity option contracts |
(6,108 | ) | — | (6,108 | ) | |||||||
Investment income |
(1,664 | ) | 13,879 | 12,215 | ||||||||
Non-controlling interest in
partnership investments |
(5 | ) | (5 | ) | ||||||||
Investment portfolio results |
$ | (1,669 | ) | $ | 12,210 | |||||||
Less: Non-controlling interest in
Calamos Holdings LLC |
(10,776 | ) | ||||||||||
Deferred income taxes |
(1,148 | ) | ||||||||||
Change in accumulated other
comprehensive income |
$ | 1,955 | ||||||||||
Our investment portfolio returned $12.2 million, or 3.4%, in the first quarter of 2011. These
results primarily reflect net realized and unrealized gains from securities that we own, offset by
losses on equity option contracts used to hedge market value fluctuations in the corporate
investment portfolio.
Income Taxes
Holdings is subject to certain income-based state taxes; therefore, income taxes reflect not only
the portion attributed to us but also income taxes attributable to non-controlling interests. Our
effective income tax rate for the three month period ended March 31, 2011 was approximately 37.3%
compared to 37.6% a year ago.
Net Income
Net income attributable to Calamos Asset Management, Inc. was $4.6 million for the three months
ended March 31, 2011, compared to $4.8 million for the same period in the prior year.
The Calamos Interests has reserved the right to exchange their interest in Calamos Holdings LLC for
newly issued Class A common shares. At the time of exchange, the Calamos Interests would be
granted Class A common shares with a value equal to the fair value of their ownership in Calamos
Holdings LLC received by us. The method for determining the number of shares the Calamos Interests
receive upon exchange is described in Section 3 (c) (ii) of Article IV of the Second Amended and
Restated Certificate of Incorporation of Calamos Asset Management, Inc. Based upon the number of
outstanding shares of Class A common stock at March 31, 2011, and excluding the value of assets we
own other than our 21.86% interest in Calamos Holdings LLC, such exchange would result in the
Calamos Interests receiving 78.14% of our then outstanding Class A common stock.
Following a complete exchange of the Calamos Interests’ 78.14% ownership interest in Calamos
Holdings LLC for newly issued Class A common stock, net income attributable to non-controlling
interests in Calamos Holdings LLC would no longer be presented as a separate line item within our
consolidated statement of operations because we would then own 100% of Calamos Holdings LLC.
Liquidity and Capital Resources
We manage our liquidity position to ensure adequate resources are available to fund ongoing
operations of the business, to provide seed money for new funds and to invest in other corporate
strategic initiatives. Our principal sources of liquidity
21
Table of Contents
are cash flows from operating activities and our corporate investment portfolio, which is comprised
of cash and cash equivalents, investment securities, derivatives and partnership investments.
Investment securities are principally comprised of products that we manage.
Our working capital requirements historically have been met through cash generated by operations.
We believe cash generated from operations will be sufficient over the foreseeable future to meet
our working capital requirements with respect to the foregoing activities and to support future
growth. The following table summarizes our principal sources of liquidity as of March 31, 2011 and
December 31, 2010:
| Increase | ||||||||||||
| (in thousands) | March 31, 2011 | December 31, 2010 | (Decrease) | |||||||||
Cash and cash equivalents |
$ | 78,540 | $ | 82,870 | $ | (4,330 | ) | |||||
Investment securities |
349,151 | 314,215 | 34,936 | |||||||||
Derivatives, net |
1,381 | (1,892 | ) | 3,273 | ||||||||
Partnership investments, net of non-controlling
interests |
22,678 | 39,981 | (17,303 | ) | ||||||||
Total corporate investment portfolio |
$ | 451,750 | $ | 435,174 | $ | 16,576 | ||||||
Calamos Holdings LLC is the borrower of our $125 million in long-term debt. The following is a
summary of our covenant compliance as of March 31, 2011 with the defined terms and covenants having
the same meanings set forth under our amended note purchase agreements:
| Results as of | ||||
| Covenant | March 31, 2011 | |||
EBITDA/interest expense — not less than 3.0
|
19.05 | |||
Debt/EBITDA — not more than 3.0
|
0.89 | |||
Investment coverage ratio — not less than 1.175
|
3.03 | |||
Net worth — not less than $160 million
|
$302 million | |||
The following tables summarize key statements of financial condition data relating to our liquidity
and capital resources:
| March 31, | December 31, | |||||||
| (in thousands) | 2011 | 2010 | ||||||
Statements of financial condition data: |
||||||||
Cash and cash equivalents |
$ | 78,540 | $ | 82,870 | ||||
Receivables |
32,511 | 29,671 | ||||||
Investment securities and derivatives, net |
350,532 | 312,323 | ||||||
Partnership investments, net |
22,678 | 39,981 | ||||||
Deferred tax assets, net |
73,008 | 75,717 | ||||||
Deferred sales commissions |
8,017 | 8,515 | ||||||
Long-term debt, including current portion |
125,000 | 125,000 | ||||||
Loan payable |
6,875 | — | ||||||
Cash flows for the three months ended March 31, 2011 and 2010 are shown below:
| March 31, | ||||||||
| (in thousands) | 2011 | 2010 | ||||||
Cash flow data: |
||||||||
Net cash provided by operating activities |
$ | 20,966 | $ | 20,883 | ||||
Net cash used in investing
activities |
(10,153 | ) | (30,255 | ) | ||||
Net cash used in financing activities |
(15,143 | ) | (21,057 | ) | ||||
Net cash provided by operating activities totaled $21.0 million for the three months ended March
31, 2011. These net cash flows are primarily attributable to investment management and distribution
and underwriting fees generated by core business activities, partially offset by staff,
distribution, and other operating expenses. The first quarter reflects a use of
22
Table of Contents
operating cash flows for our annual performance related incentive payments, which are accrued
throughout the year but typically paid in February.
Investing activities for the three months ended March 31, 2011 used cash totaling $10.2 million.
The net cash used in investing activities primarily represents seed capital investments in recently
introduced Company-managed mutual funds of $18.7 million coupled with net purchases of derivatives
of $9.4 million. These flows were partially offset by cash flows of $18.6 million provided by the
liquidation of the Calamos Market Neutral Opportunities Fund LP.
Net cash used in financing activities totaled $15.1 million for the first three months of 2011,
largely representing pro rata distributions from Calamos Holdings LLC paid to non-controlling
interests and common shareholders in the amount of $20.1 million and $5.7 million, respectively,
offset by $6.9 million in proceeds from a short-term margin loan. Distributions from Calamos
Holdings LLC to Calamos Asset Management, Inc. are not reflected in the net cash flows used in
financing activities; however these distributions increased the cash available exclusively to the
common shareholders. We expect cash flows from financing activities to change with tax
distributions based on the levels of income that we generate and with our regular quarterly
dividend that rose to 9.5 cents per share in the most recent quarter from 7.5 cents per share in
2010.
Recently Issued Accounting Pronouncements
We have reviewed all newly issued accounting pronouncements that are applicable to our business and
to the preparation of our consolidated financial statements, including those not yet required to be
adopted. We do not believe any such pronouncements will have a material effect on the Company’s
financial position or results of operations. All relevant accounting standards updates have been
adopted and are reflected in the financial statements contained herein.
Critical Accounting Policies
Our significant accounting policies are summarized in note 2 of the Notes to the Consolidated
Financial Statements included in our Annual Report on Form 10-K for the year ended December 31,
2010. A discussion of critical accounting policies is included in Management’s Discussion and
Analysis of Financial Condition and Results of Operations in our Annual Report on Form 10-K for the
year ended December 31, 2010. There were no significant changes in our significant accounting
policies or critical accounting policies during the three months ended March 31, 2011.
Other Information
Calamos Asset Management, Inc. (CAM) is comprised of two groups of assets: a) CAM’s 21.9% ownership
interest in Calamos Holdings LLC and b) assets other than its interest in Calamos Holdings LLC
(Other Assets), principally comprised of cash and deferred tax assets with a combined book value of
$122.4 million. Because CAM controls the operations of Calamos Holdings LLC, CAM presents the
entire operations of Calamos Holdings LLC with its own in the consolidated financial statements.
The Calamos Interests’ 78.1% ownership in Calamos Holdings LLC is presented as non-controlling
interest in the consolidated financial statements. Prior to March 1, 2009, in addition to the
approximately 20 million outstanding Class A common shares, we added 77 million shares to reflect
Calamos Interests in Calamos Holdings LLC. The resulting share count provided a
reasonable proxy for the number of shares used in determining the market capitalization of the
fully consolidated company.
Effective March 1, 2009, CAM de-unitized its ownership structure and as a result, Calamos
Interests’ ownership in Calamos Holdings LLC is no longer reflected in the diluted share count
presented in CAM’s financial statements. Therefore, the determination of the market capitalization
of the fully consolidated business cannot be easily determined by the product of share price and
weighted average number of shares. There is a divergence within the financial community on how to
calculate CAM’s market capitalization with some basing it solely on the outstanding share count of
CAM’s Class A common stock and others grossing-up CAM’s outstanding Class A shares by its 21.9%
ownership in Calamos Holdings LLC. The following illustration and accompanying table highlight the
uniqueness of CAM’s ownership structure in determining the fully consolidated market
capitalization. This illustration is based on the closing price of CAM’s Class A common stock of
$16.59 on March 31, 2011.
As previously stated, in addition to the approximate 21.9% ownership in Calamos Holdings LLC, CAM
owns certain Other Assets. These assets include cash equivalents and current income tax
receivables with a book value of $49.4 million, which approximates fair value, as well as net
deferred tax assets with a book value of $73.0 million. The most significant deferred tax asset
relates to an election made under section 754 of the Internal Revenue Code following CAM’s
23
Table of Contents
initial public offering that expires in 2019, which allows CAM to reduce future income tax payments
by approximately $8.0 million annually. The net present value of the net deferred tax assets would
be approximately $45.7 million if a hypothetical 12% discount rate were applied over the remaining
life of the assets. Using this assumption, Other Assets would collectively have a discounted
present value of approximately $95.1 million, or $4.72 per share. Assuming CAM’s stock price fully
reflects the Other Assets’ discounted present value of $4.72 per share, it can be inferred that
CAM’s remaining stock price of $11.87 ($16.59 — $4.72) would be attributable to CAM’s 21.9%
ownership interest in Calamos Holdings LLC.
With these assumptions, the market capitalization associated with CAM’s ownership in Calamos
Holdings LLC can be estimated by multiplying CAM’s share price attributable to Calamos Holdings LLC
($11.87) by the number of CAM’s Class A common shares outstanding (20.1 million) to yield an
estimated market capitalization of $238.9 million as of March 31, 2011. This result, however, must
be divided by CAM’s 21.9% ownership of Calamos Holdings LLC to determine the total implied market
capitalization of Calamos Holdings LLC of $1.1 billion. Adding the discounted present value of
CAM’s Other Assets ($95.1 million) to the market capitalization of Calamos Holdings LLC indicates
that the fully consolidated market capitalization of CAM would be approximately $1.2 billion as of
March 31, 2011.
The above example assumes that CAM’s stock price reflects the entire discounted present value of
the Other Assets. If, however, no value were ascribed to the Other Assets, the fully consolidated
market capitalization of CAM would be estimated at $1.5 billion as presented in the following
table.
The following calculation summarizes CAM’s fully consolidated market capitalization both including
and excluding the discounted present value of assets owned exclusively by CAM:
| No Recognition of CAM’s | Full Recognition of CAM’s | |||||||||||||||
| Other Assets | Other Assets | |||||||||||||||
| Ownership in | Ownership in | |||||||||||||||
| Calamos | Other | Calamos | Other | |||||||||||||
| ( in thousands, except share data) | Holdings LLC | Assets | Holdings LLC | Assets | ||||||||||||
Divide: |
||||||||||||||||
Discounted value of CAM’s Other Assets |
— | $ | 95,056 | |||||||||||||
Class A shares outstanding at March 31, 2011 |
20,124,701 | 20,124,701 | ||||||||||||||
Discounted value per share of CAM’s
Other Assets |
— | $ | 4.72 | |||||||||||||
Multiply: |
||||||||||||||||
Share price attributed to assets |
$ | 16.59 | — | $ | 11.87 | $ | 4.72 | |||||||||
Class A shares outstanding at March 31, 2011 |
20,124,701 | 20,124,701 | 20,124,701 | 20,124,701 | ||||||||||||
Market capitalization of outstanding shares |
$ | 333,869 | — | $ | 238,880 | $ | 95,056 | |||||||||
Divide by: |
||||||||||||||||
CAM’s percentage ownership |
21.9 | % | 100 | % | 21.9 | % | 100 | % | ||||||||
Market capitalization associated with CAM’s assets |
$ | 1,524,516 | — | $ | 1,090,776 | $ | 95,056 | |||||||||
Fully consolidated market capitalization |
$1,524,516 | $1,185,832 | ||||||||||||||
24
Table of Contents
Similarly, our Board of Directors may be required to determine the fair values of CAM’s
assets. This requirement would be necessitated should the Calamos Interests choose to exchange
their ownership interest in Calamos Holdings LLC for shares of CAM’s Class A common stock (the
Exchange). Effective March 1, 2009, the Exchange provisions as set forth in CAM’s Schedule 14C
filed with the Securities and Exchange Commission on January 12, 2009 require that the Exchange be
based on a fair value approach. Assuming that our Board of Directors used the market price of
CAM’s Class A share common stock as the basis for determining fair value, the following table
presents a likely range of the number of CAM shares of Class A common stock that the Calamos
Interests would have received upon Exchange at March 31, 2011:
| No Recognition of CAM’s | Full Recognition of CAM’s | |||||||
| (in thousands, except share data) | Other Assets | Other Assets | ||||||
Market capitalization associated with
CAM’s investment in Calamos Holdings
(see table above) |
$ | 1,524,516 | $ | 1,090,776 | ||||
Multiply by: |
||||||||
Calamos Interests ownership in Calamos
Holdings LLC(1) |
78.1 | % | 78.1 | % | ||||
Calamos Interests’ value
exchanged for Class A common
stock |
$ | 1,193,344 | 853,586 | |||||
Divide by: |
||||||||
Share price of CAM Class A common stock |
$ | 16.59 | $ | 16.59 | ||||
Shares issued to the Calamos
Interests upon Exchange |
71,931,522 | 51,451,838 | ||||||
| (1) | The ownership percentage presented in the table has been approximated for presentation purposes yet the values presented are derived from the precise ownership percentage. |
Forward-Looking Information
From time to time, information or statements provided by us or on our behalf, including those
within this Quarterly Report on Form 10-Q, may contain certain forward-looking statements relating
to future events and financial performance, strategies, expectations and competitive environment,
and regulations. These forward-looking statements may include, without limitation: statements
regarding proposed new products; results of operations or liquidity; projections, predictions,
expectations, estimates or forecasts of our business; financial and operating results and future
economic performance; market capitalization; management’s goals and objectives; and other similar
expressions concerning matters that are not historical facts.
Words such as “anticipate,” “assume,” “believe,” “continue,” “could,” “estimate,” “expect,”
“future,” “intend,” “may,” “opportunity,” “potential,” “predict,” “seek,” “should,” “trend,”
“will,” “would,” and similar expressions, as well as statements in future tense, identify
forward-looking statements.
Forward-looking statements should not be read as a guarantee of future performance or results, and
will not necessarily be accurate indications of the times at, or by, which such performance or
results will be achieved. Forward-looking statements are based on information available at the time
those statements are made and/or management’s good faith belief as of that time with respect to
future events, and are subject to risks and uncertainties that could cause actual performance or
results to differ materially from those expressed in or suggested by the forward-looking
statements.
Important factors that could cause such differences include, but are not limited to: changes in
applicable laws or regulations; downward fee pressures and increased industry competition; risks
inherent to the investment management business; the loss of revenues due to contract terminations
and redemptions; unsatisfactory service levels by third party vendors; the inability to maintain
compliance with financial covenants; the performance of our investment portfolio; our ownership and
organizational structure; general and prolonged declines in the prices of securities; realization
of deferred income tax assets; significant changes in market conditions and the economy that
require a modification to our business plan; catastrophic or unpredictable events; the loss of key
executives; the unavailability, consolidation and elimination of third-party retail distribution
channels; increased costs of and timing of payments related to distribution; failure to recruit and
retain qualified personnel; a loss of assets, and thus revenues; fluctuation in the level of our
expenses; fluctuation in
25
Table of Contents
foreign currency exchange rates with respect to our global operations and business; changes in
accounting estimates; poor performance of our largest funds; damage to our reputation; and the
extent and timing of any share repurchases.
Further, the value and composition of our assets under management are, and will continue to be,
influenced by a variety of factors including, among other things: purchases and redemptions of
shares of the open-end mutual funds and other investment products; fluctuation in both the
underlying value and liquidity of the financial markets around the world that result in
appreciation or depreciation of assets under management; mutual fund capital gain distributions;
our ability to access capital markets; our introduction of new investment strategies, products and
programs; our ability to educate our clients about our investment philosophy and provide them with
best-in-class service; the relative investment performance of our products as compared to competing
offerings and market indices; competitive conditions in the mutual fund, asset management and
broader financial services sectors; investor sentiment and confidence; our decision to open or
close products and strategies; and our ability to execute on our strategic plan to expand the
business. Item 1A of the Company’s Annual Report on Form 10-K for the year ended December 31, 2010
discusses some of these and other important factors in detail under the caption “Risk Factors.”
Forward-looking statements speak only as of the date the statements are made. Readers should not
place undue reliance on any forward-looking statements. We assume no obligation to update
forward-looking statements to reflect actual results, changes in assumptions or changes in other
factors affecting forward-looking information, except to the extent required by applicable
securities laws.
Item 3. Quantitative and Qualitative Disclosures About Market Risk
An analysis of our market risk was included in our Annual Report on Form 10-K for the year ended
December 31, 2010. There were no material changes to the Company’s market risk during the three
months ended March 31, 2011.
Item 4. Controls and Procedures
Our management, including our principal executive and principal financial officers, has evaluated
the effectiveness of our disclosure controls and procedures (as defined in Rule 13a-15(e) under the
Securities Exchange Act of 1934) as of March 31, 2011, and has concluded that such disclosure
controls and procedures are effective to ensure that information required to be disclosed by us in
the reports that we file or submit under the Securities Exchange Act of 1934 is recorded,
processed, summarized and reported within the time periods specified in the SEC’s rules and forms.
There were no changes in the Company’s internal control over financial reporting that occurred
during our first quarter that have materially affected, or are reasonably likely to materially
affect, the Company’s internal control over financial reporting.
26
Table of Contents
PART II — OTHER INFORMATION
Item 1. Legal Proceedings
As previously reported, the Company and Calamos Advisors LLC, an indirect subsidiary, were named as
defendants in a class action complaint filed on July 15, 2010 (Christopher Brown et al. v John P.
Calamos, Sr. et al., No. 10-CV-04422 (N.D. Ill.)) by a putative common shareholder of the Calamos
Convertible Opportunities and Income Fund (CHI). This action was voluntarily dismissed by plaintiff
in the U.S. District Court and re-filed in the Circuit Court of Cook County, Illinois on September
13, 2010 (Christopher Brown et al. v John P. Calamos, Sr. et al., Civil Action No. 10CH39590).
Other defendants include CHI, current and former trustees of CHI, John P. Calamos, Sr., Weston W.
Marsh, John E. Neal, William R. Rybak, Stephen B. Timbers, David D. Tripple, Joe F. Hanauer, and
unspecified defendants John and Jane Does 1-100. The plaintiff alleges that the Company and Calamos
Advisors aided and abetted the individual defendants’ alleged breaches of fiduciary duty and were
unjustly enriched in connection with the redemption of auction rate preferred securities of CHI. As
to the Company and Calamos Advisors, the plaintiff is seeking: (i) declaratory judgments that the
Company and Calamos Advisors aided and abetted the individual defendants’ alleged breaches of
fiduciary duty and were unjustly enriched; (ii) an injunction against the Company and Calamos
Advisors serving as advisor or otherwise earning fees for services to CHI; (iii) an unspecified
amount of monetary relief plus interest; (iv) an award of attorney’s fees and expenses; and (v)
such other and further relief, including punitive damages, as may be available to the plaintiff and
the class that plaintiff seeks to represent. On October 13, 2010, the defendants removed this
action from the Circuit Court of Cook County, Illinois to the U.S. District Court for the Northern
District of Illinois (Christopher Brown et al. v John P. Calamos, Sr. et al., No. 10-CV-06558 (N.D.
Ill.)) and also moved to dismiss the complaint. On November 5, 2010, plaintiff moved to remand the
case to the Circuit Court of Cook County. On March 14, 2011, the district court denied plaintiff’s
motion to remand and dismissed the case. Plaintiff has appealed that ruling to the United States
Court of Appeals for the Seventh Circuit, where the case is now pending.
The Company and Calamos Advisors LLC were named as defendants in a class action complaint filed on
September 14, 2010 (Russell Bourrienne et al. v John P. Calamos, Sr. et al., No. 10-CV-5833 (N.D.
Ill.)) by a putative common shareholder of the Calamos Convertible Opportunities and Income Fund
(CHI). This action was voluntarily dismissed by plaintiff in the U.S. District Court and re-filed
in Circuit Court of Cook County, Illinois on October 18, 2010 (Russell Bourrienne et al. v John P.
Calamos, Sr. et al., No. 10CH45119 ). Other defendants include current and former trustees of CHI,
John P. Calamos, Sr., Weston W. Marsh, John E. Neal, William R. Rybak, Stephen B. Timbers, David D.
Tripple, Joe F. Hanauer and unspecified defendants John and Jane Does 1-100. The plaintiff alleges
that the Company and Calamos Advisors aided and abetted the individual defendants’ alleged breaches
of fiduciary duty and were unjustly enriched in connection with the redemption of auction rate
preferred securities of CHI. As to the Company and Calamos Advisors, the plaintiff is seeking: (i)
declaratory judgments that the Company and Calamos Advisors aided and abetted the individual
defendants’ alleged breaches of fiduciary duty and were unjustly enriched; (ii) an injunction
against serving as advisor or otherwise earning fees for services to CHI; (iii) an unspecified
amount of monetary relief plus interest; (iv) an award of attorney’s fees and expenses; and (v)
such other and further relief, including punitive damages, as may be available to the plaintiff and
the class that plaintiff seeks to represent. On November 12, 2010, the defendants removed this
action from the Circuit Court of Cook County, Illinois to the U.S. District Court for the Northern
District of Illinois (Russell Bourrienne et al. v John P. Calamos, Sr. et al., No. 10-CV-07295
(N.D. Ill.)). Defendants have also moved to dismiss the complaint. The case is currently awaiting
decision of that motion.
The Company and Calamos Advisors LLC were named as defendants in a class action complaint filed on
August 13, 2010 (Rutgers Casualty Insurance Company et al. v John P. Calamos, Sr. et al., No.
10-CV- 5106 (N.D. Ill.)) by a putative common shareholder of the Calamos Convertible and High
Income Fund (CHY). This action was voluntarily dismissed by plaintiff in the U.S. District Court
and re-filed in Circuit Court of Cook County, Illinois on December 22, 2010 (Rutgers Casualty
Insurance Company et al. v John P. Calamos, Sr. et al., No. 10CH53998). Other defendants include
CHY, current and former trustees of CHY, John P. Calamos, Sr., Nick P. Calamos, Weston W. Marsh,
John E. Neal, William R. Rybak, Stephen B. Timbers, David D. Tripple, Joe F. Hanauer and
unspecified defendants John and Jane Does 1-100. The plaintiff alleges that the Company and Calamos
Advisors aided and abetted the individual defendants’ alleged breaches of fiduciary duty and were
unjustly enriched in connection with the redemption of auction rate preferred securities of CHY. As
to the Company and Calamos Advisors, the plaintiff is seeking: (i) declaratory judgments that the
Company and Calamos Advisors aided and abetted the individual defendants’ alleged breaches of
fiduciary duty and were unjustly enriched; (ii) an injunction against serving as advisor or
otherwise earning fees for services to CHY; (iii) an unspecified amount of monetary relief plus
interest; (iv) an award of attorney’s fees and expenses; and (v) such other and further relief,
including punitive damages, as may be available to the plaintiff and the class that plaintiff seeks
to represent. On January 21, 2011,
27
Table of Contents
the defendants removed this action from the Circuit Court of Cook County, Illinois to the U.S.
District Court for the Northern District of Illinois (Rutgers Casualty Insurance Company et al. v
John P. Calamos, Sr. et al., No. 11-CV-00462 (N.D. Ill.)). Defendants have also moved to dismiss
the complaint, and plaintiff has moved to remand the case to the Circuit Court of Cook County.
The Company and Calamos Advisors believe that these lawsuits are without merit and intend to defend
themselves vigorously against these allegations.
In the normal course of business, we may be party to various legal proceedings from time to time.
Currently, there are no other legal proceedings that management believes would have a materially
adverse effect on our consolidated financial position or results of operations.
Item 5. Other Information
On May 10,
2011, the Company appointed Nimish S. Bhatt, 47, to the additional role of Interim Chief
Financial Officer. As Interim Chief Financial Officer, Mr. Bhatt will also serve as the Company’s
principal financial officer and principal accounting officer. Mr. Bhatt has been our Senior Vice
President and Director of Operations since 2004 and he oversees the operations, accounting and
administration of our investment products. Mr. Bhatt has a bachelor’s degree in advanced
accounting and auditing, a law degree in taxation from India’s Gujarat University and an MBA from
The Ohio State University. Mr. Bhatt is a member of the Investment Company Institute’s
Accounting/Treasurer’s Committee and serves as a Vice Chairman of the Board of Directors of
National Investment Company Service Association.
28
Table of Contents
Item 6. Exhibits
| 3(i) | Second Amended and Restated Certificate of Incorporation of the Registrant (incorporated by reference to Exhibit 3.1 to the Registrant’s Annual Report on Form 10-K filed with the Securities and Exchange Commission on March 13, 2009). | ||
| 3(ii) | Second Amended and Restated By-Laws of the Registrant (incorporated by reference to Exhibit 3.2 to the Registrant’s Annual Report on Form 10-K filed with the Securities and Exchange Commission on March 13, 2009). | ||
| 4.1 | Stockholders’ Agreement among John P. Calamos, Sr., Nick P. Calamos and John P. Calamos, Jr., certain trusts controlled by them, Calamos Family Partners, Inc. and the Registrant (incorporated by reference to Exhibit 4.1 to the Registrant’s Quarterly Report on Form 10-Q filed with the Securities and Exchange Commission on December 3, 2004). | ||
| 4.2 | Registration Rights Agreement between Calamos Family Partners, Inc., John P. Calamos, Sr. and the Registrant (incorporated by reference to Exhibit 4.2 to the Registrant’s Quarterly Report on Form 10-Q filed with the Securities and Exchange Commission on December 3, 2004). | ||
| 10.1 | Calamos Asset Management, Inc. Incentive Compensation Plan, as amended effective May 22, 2009 (incorporated by reference to Exhibit 10.1 to the Registrant’s Current Report on Form 8-K filed with the Securities and Exchange Commission on May 27, 2009). | ||
| 10.2 | Transition Agreement dated March 1, 2011 between Calamos Advisors LLC and Cristina Wasiak. | ||
| 31.1 | Certification pursuant to Rules 13a-14(a) and 15d-14(a) of the Exchange Act. | ||
| 31.2 | Certification pursuant to Rules 13a-14(a) and 15d-14(a) of the Exchange Act. | ||
| 32.1 | Certification pursuant to 18 U.S.C. Section 1350, as adopted pursuant to Section 906 of the Sarbanes-Oxley Act of 2002. | ||
| 32.2 | Certification pursuant to 18 U.S.C. Section 1350, as adopted pursuant to Section 906 of the Sarbanes-Oxley Act of 2002. |
29
Table of Contents
SIGNATURES
Pursuant to the requirements of the Securities Exchange Act of 1934, the registrant has duly caused
this report to be signed on its behalf by the undersigned thereunto duly authorized.
| CALAMOS ASSET MANAGEMENT, INC. (Registrant) |
||||
| Date: May 10, 2011 | By: | /s/ Nimish S. Bhatt | ||
| SVP, Interim Chief Financial
Officer and Director of Operations |
||||
30